experimental verification of evasive manoeuvre assist
TRANSCRIPT
Experimental Verification of Evasive Manoeuvre Assist Controllerfor Collision Mitigation with Oncoming Vehicles
Downloaded from: https://research.chalmers.se, 2022-02-09 10:23 UTC
Citation for the original published paper (version of record):Arikere, A., Yang, D., Klomp, M. (2018)Experimental Verification of Evasive Manoeuvre Assist Controller for Collision Mitigation withOncoming VehiclesProceedings of the 14th International Symposium on Advanced Vehicle Control (AVEC’ 18), Beijing,
N.B. When citing this work, cite the original published paper.
research.chalmers.se offers the possibility of retrieving research publications produced at Chalmers University of Technology.It covers all kind of research output: articles, dissertations, conference papers, reports etc. since 2004.research.chalmers.se is administrated and maintained by Chalmers Library
(article starts on next page)
AVEC ’18
Experimental Verification of Evasive Manoeuvre AssistController for Collision Mitigation with Oncoming Vehicles
Adithya Arikere*+, Derong Yang#, Matthijs Klomp+#*American Axle & Manufacturing, +Chalmers University of Technology, #Volvo Car Corporation
E-mail: [email protected]
An evasive manoeuvre assist controller to mitigate the risk of collision with oncoming vehicles whileperforming evasive manoeuvres has previously been formulated and tested in simulation. In this work,a real-time application of this controller is implemented and used in experiments with a Volvo XC90hybrid test vehicle. For comparison, manoeuvres are also carried out without the controller but withthe driver adopting different speed control strategies. Analysis of the results show that the controllercan consistently mitigate collision risk with the oncoming vehicle and while driver control of speedcan perform better, it is far less robust and is heavily dependant on the driver skill and performance.
Topics/Advanced Driver Assistant Systems, Driver Behaviors and Assistance
1. INTRODUCTION
One of the most common accident types in the worldis the rear-end collision [1]. While many of these canbe avoided or mitigated with emergency braking, othersneed evasive steering [2]. However, development anddeployment of steering based driver assist systems aremade challenging due to the fact that when performingevasive steering, the vehicle path changes significantly andhence threats along the new potential evasive trajectoriesneed to detected and taken into account as well.
One such major threat that needs to be considered isoncoming vehicles in the adjacent lane. Due to the chal-lenges in detecting the same, particularly before the evasivemanoeuvre, when there may not be a clear line of sight tothe oncoming vehicle, only a few such assistance systemshave been announced by any major OEMs till date [3, 4].In [5] however, an alternative control strategy is proposedthat reduces the collision risk with the oncoming vehicleafter or partway through the evasive manoeuvre when aclear line of sight can be established to the oncomingvehicle and detection of the same becomes easier.
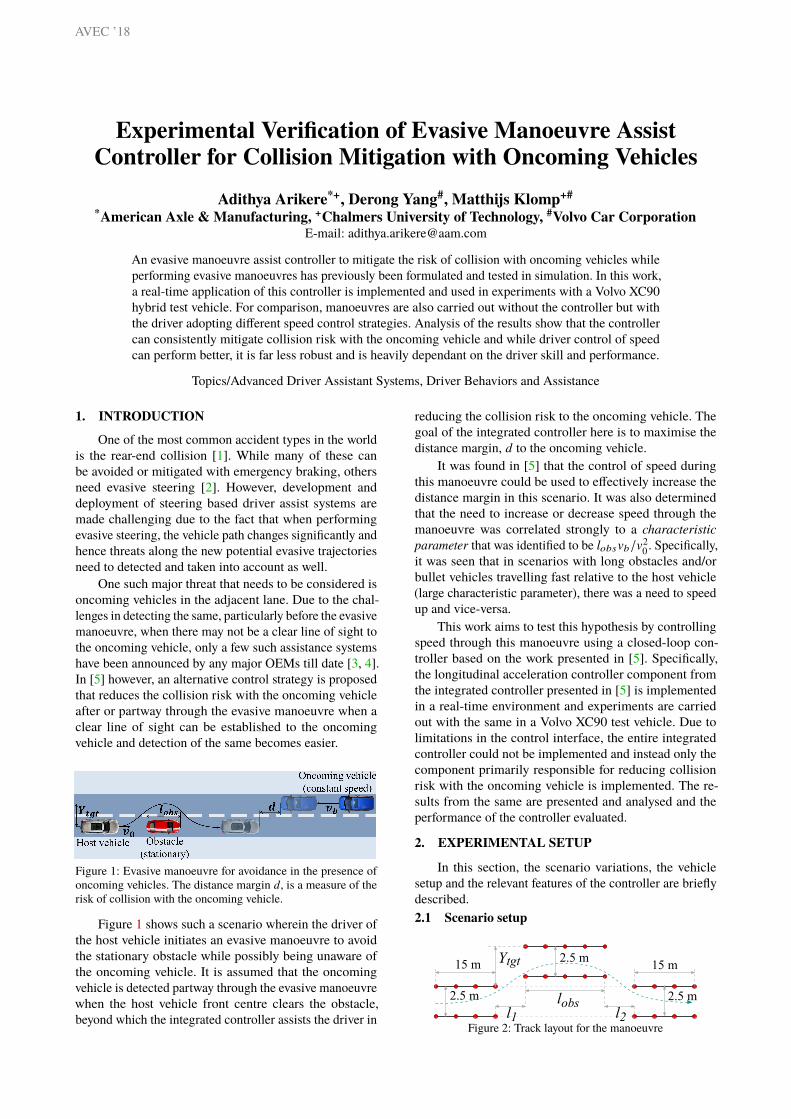
Figure 1: Evasive manoeuvre for avoidance in the presence ofoncoming vehicles. The distance margin d, is a measure of therisk of collision with the oncoming vehicle.
Figure 1 shows such a scenario wherein the driver ofthe host vehicle initiates an evasive manoeuvre to avoidthe stationary obstacle while possibly being unaware ofthe oncoming vehicle. It is assumed that the oncomingvehicle is detected partway through the evasive manoeuvrewhen the host vehicle front centre clears the obstacle,beyond which the integrated controller assists the driver in
reducing the collision risk to the oncoming vehicle. Thegoal of the integrated controller here is to maximise thedistance margin, d to the oncoming vehicle.
It was found in [5] that the control of speed duringthis manoeuvre could be used to effectively increase thedistance margin in this scenario. It was also determinedthat the need to increase or decrease speed through themanoeuvre was correlated strongly to a characteristicparameter that was identified to be lobsvb/v2
0 . Specifically,it was seen that in scenarios with long obstacles and/orbullet vehicles travelling fast relative to the host vehicle(large characteristic parameter), there was a need to speedup and vice-versa.
This work aims to test this hypothesis by controllingspeed through this manoeuvre using a closed-loop con-troller based on the work presented in [5]. Specifically,the longitudinal acceleration controller component fromthe integrated controller presented in [5] is implementedin a real-time environment and experiments are carriedout with the same in a Volvo XC90 test vehicle. Due tolimitations in the control interface, the entire integratedcontroller could not be implemented and instead only thecomponent primarily responsible for reducing collisionrisk with the oncoming vehicle is implemented. The re-sults from the same are presented and analysed and theperformance of the controller evaluated.
2. EXPERIMENTAL SETUP
In this section, the scenario variations, the vehiclesetup and the relevant features of the controller are brieflydescribed.2.1 Scenario setup
��� �
���� ��� �
��� ������� �
�� ��� �
Figure 2: Track layout for the manoeuvre
AVEC ’18
Table 1: Scenario variations considered for evaluation. Obstaclelength (lobs) was 20 m and lateral displacement (Ytgt ) was 3 mfor all cases.Parameter Scn. A Scn. B UnitHost initial velocity (v0) 55 65 km/hBullet vehicle velocity (vb) 90 110 km/h1st lane change distance (l1) 12 16 m2nd lane change distance (l2) [12,14,16] 16 m
Two major variations of the scenario are consideredfor evaluation, the specifications of which are listed intable 1 and the track layout for the same is shown in fig. 5.Three cases of the first scenario variant called A-12, A-14and A-16 are also considered wherein the second lanechange distance (specified by the number following the‘A’) is varied to emulate the effect of a bullet vehicle that isnear or far away. All the scenario variations are expectedto be benefited from speeding up or maintaining speed.Scenarios where slowing down can be expected to be ofbenefit are not considered for evaluation due to limitationsin the control interface (see section 2.2 more details).No actual oncoming vehicle is used in the experiments,but its presence is assumed and its effect simulated inpost-processing.
Apart from the controller assisted manoeuvres, twoother driver-only manoeuvres were considered for com-parison: a “throttle off” manoeuvre where the driver liftsoff the accelerator pedal as soon as the first lane change isinitiated and a “Accelerate” manoeuvre where the driveraccelerates through the manoeuvre. For the “Accelerate”case, the driver was instructed to accelerate to the extentthe driver felt comfortable and confident that they couldsuccessfully complete the manoeuvre without knockingover any cones.
Two drivers were used in the tests with different levelsof test track experience with respect to performing highdynamic manoeuvres. Driver 1 performed the tests forscenarios A-12, A-14 and B whereas driver 2 performedtests for scenario A-16.2.2 Vehicle setup and actuators
The test vehicle used is a Volvo XC90 with a hybriddrivetrain that has a 320 hp gasoline engine driving thefront axle and a 80 hp electric motor driving the rear axle.The electric motor is powered by a 9.2 kWh battery packallowing for approximately 30 km of electric range undernominal conditions. The electric range was seen to be alimiting factor for testing duration particularly since thevehicle did not have a drive mode that enabled the batteryto be charged with the IC engine during regular driving.Consequently, to ensure the electric drive was available tobe used with the controller, for each scenario, the “Ctrl.Rr” case was run first, followed by “Acc” and then finally“Thr. off”.
Due to limitations in the interface that was used toapply torques, the following restrictions are observed forthe control authority: (1) no access to the brake system,(2) only positive torques could be requested from thedrivetrain and (3) torque could be requested from only oneactuator (engine or motor) at a time. Additionally, duringpreliminary testing, it was seen that safety features in the
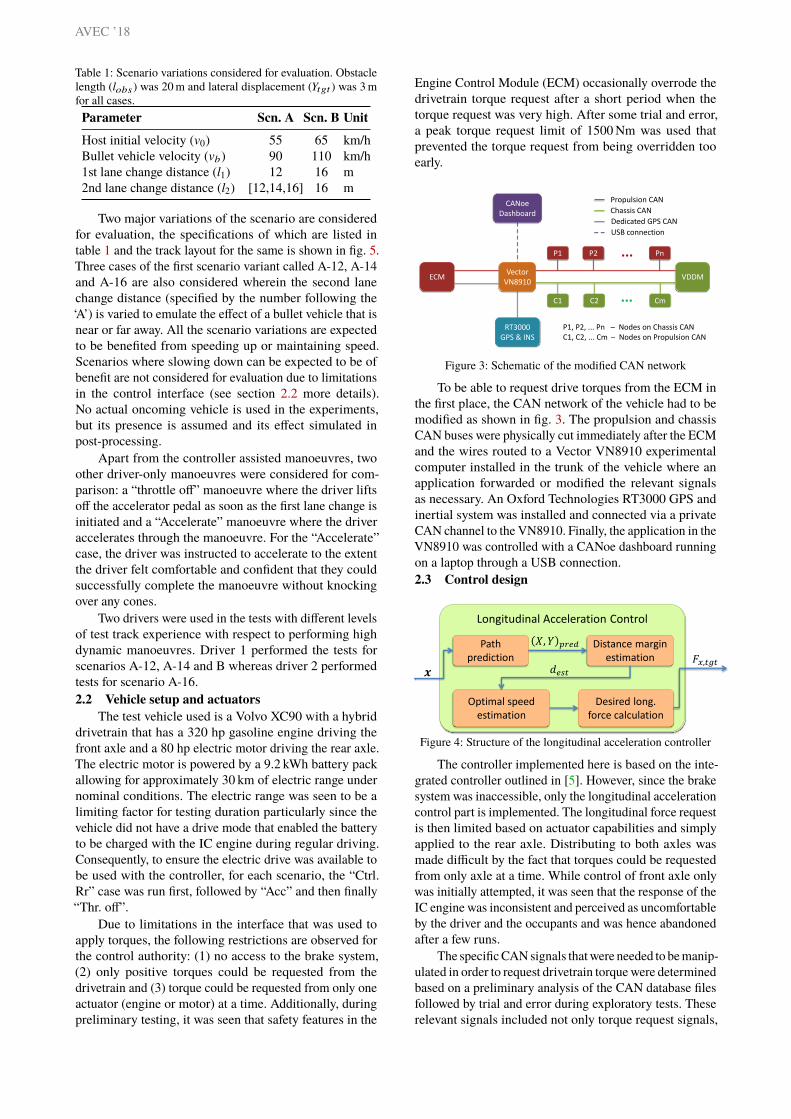
Engine Control Module (ECM) occasionally overrode thedrivetrain torque request after a short period when thetorque request was very high. After some trial and error,a peak torque request limit of 1500 Nm was used thatprevented the torque request from being overridden tooearly.
ECM VDDM Vector
VN8910
P1 Pn P2
C1 Cm C2
...
...
RT3000 GPS & INS
CANoe Dashboard
Propulsion CAN
Chassis CAN
Dedicated GPS CAN
USB connection
P1, P2, ... Pn – Nodes on Chassis CAN C1, C2, ... Cm – Nodes on Propulsion CAN
Figure 3: Schematic of the modified CAN network
To be able to request drive torques from the ECM inthe first place, the CAN network of the vehicle had to bemodified as shown in fig. 3. The propulsion and chassisCAN buses were physically cut immediately after the ECMand the wires routed to a Vector VN8910 experimentalcomputer installed in the trunk of the vehicle where anapplication forwarded or modified the relevant signalsas necessary. An Oxford Technologies RT3000 GPS andinertial system was installed and connected via a privateCAN channel to the VN8910. Finally, the application in theVN8910 was controlled with a CANoe dashboard runningon a laptop through a USB connection.2.3 Control design
Longitudinal Acceleration Control
Path prediction
Distance margin estimation
Optimal speed estimation
Desired long. force calculation
𝒙 𝐹𝑥,𝑡𝑔𝑡
𝑋, 𝑌 𝑝𝑟𝑒𝑑
𝑑𝑒𝑠𝑡
Figure 4: Structure of the longitudinal acceleration controller
The controller implemented here is based on the inte-grated controller outlined in [5]. However, since the brakesystem was inaccessible, only the longitudinal accelerationcontrol part is implemented. The longitudinal force requestis then limited based on actuator capabilities and simplyapplied to the rear axle. Distributing to both axles wasmade difficult by the fact that torques could be requestedfrom only axle at a time. While control of front axle onlywas initially attempted, it was seen that the response of theIC engine was inconsistent and perceived as uncomfortableby the driver and the occupants and was hence abandonedafter a few runs.
The specific CAN signals that were needed to be manip-ulated in order to request drivetrain torque were determinedbased on a preliminary analysis of the CAN database filesfollowed by trial and error during exploratory tests. Theserelevant signals included not only torque request signals,
AVEC ’18
165 170 175 180 185 190 195 200 205 210 215 220 225 2300
3
X [m]
Y[m
]
170 180 190 200 210 220 230
40
50
60
X [m]
v x[k
m/h
]
170 180 190 200 210 220 230−200
0
200
X [m]
δ[°
]
170 180 190 200 210 220 230
0
2
·103
X [m]
T act,F
[Nm
]
170 180 190 200 210 220 230
0
1
·103
X [m]
T act,R
[Nm
]
170 180 190 200 210 220 230−2
0246
·103
X [m]
T req
[Nm
]
Thr. off
Accelerat
eCtrl.
FrCtrl.
Rr−10
0
10
d[m
]
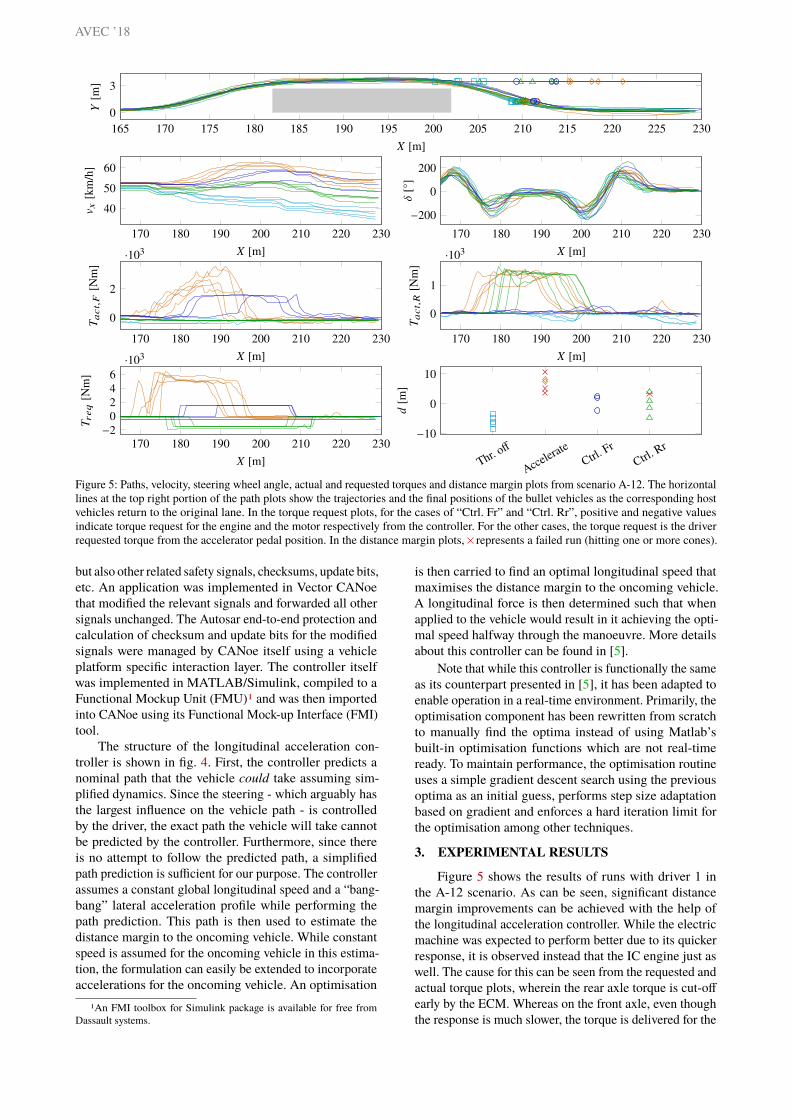
Figure 5: Paths, velocity, steering wheel angle, actual and requested torques and distance margin plots from scenario A-12. The horizontallines at the top right portion of the path plots show the trajectories and the final positions of the bullet vehicles as the corresponding hostvehicles return to the original lane. In the torque request plots, for the cases of “Ctrl. Fr” and “Ctrl. Rr”, positive and negative valuesindicate torque request for the engine and the motor respectively from the controller. For the other cases, the torque request is the driverrequested torque from the accelerator pedal position. In the distance margin plots, represents a failed run (hitting one or more cones).
but also other related safety signals, checksums, update bits,etc. An application was implemented in Vector CANoethat modified the relevant signals and forwarded all othersignals unchanged. The Autosar end-to-end protection andcalculation of checksum and update bits for the modifiedsignals were managed by CANoe itself using a vehicleplatform specific interaction layer. The controller itselfwas implemented in MATLAB/Simulink, compiled to aFunctional Mockup Unit (FMU)1 and was then importedinto CANoe using its Functional Mock-up Interface (FMI)tool.
The structure of the longitudinal acceleration con-troller is shown in fig. 4. First, the controller predicts anominal path that the vehicle could take assuming sim-plified dynamics. Since the steering - which arguably hasthe largest influence on the vehicle path - is controlledby the driver, the exact path the vehicle will take cannotbe predicted by the controller. Furthermore, since thereis no attempt to follow the predicted path, a simplifiedpath prediction is sufficient for our purpose. The controllerassumes a constant global longitudinal speed and a “bang-bang” lateral acceleration profile while performing thepath prediction. This path is then used to estimate thedistance margin to the oncoming vehicle. While constantspeed is assumed for the oncoming vehicle in this estima-tion, the formulation can easily be extended to incorporateaccelerations for the oncoming vehicle. An optimisation
1An FMI toolbox for Simulink package is available for free fromDassault systems.
is then carried to find an optimal longitudinal speed thatmaximises the distance margin to the oncoming vehicle.A longitudinal force is then determined such that whenapplied to the vehicle would result in it achieving the opti-mal speed halfway through the manoeuvre. More detailsabout this controller can be found in [5].
Note that while this controller is functionally the sameas its counterpart presented in [5], it has been adapted toenable operation in a real-time environment. Primarily, theoptimisation component has been rewritten from scratchto manually find the optima instead of using Matlab’sbuilt-in optimisation functions which are not real-timeready. To maintain performance, the optimisation routineuses a simple gradient descent search using the previousoptima as an initial guess, performs step size adaptationbased on gradient and enforces a hard iteration limit forthe optimisation among other techniques.
3. EXPERIMENTAL RESULTS
Figure 5 shows the results of runs with driver 1 inthe A-12 scenario. As can be seen, significant distancemargin improvements can be achieved with the help ofthe longitudinal acceleration controller. While the electricmachine was expected to perform better due to its quickerresponse, it is observed instead that the IC engine just aswell. The cause for this can be seen from the requested andactual torque plots, wherein the rear axle torque is cut-offearly by the ECM. Whereas on the front axle, even thoughthe response is much slower, the torque is delivered for the
AVEC ’18
165 170 175 180 185 190 195 200 205 210 215 220 225 2300
3
X [m]
Y[m
]
170 180 190 200 210 220 23040
50
60
X [m]
v x[km/h]
170 180 190 200 210 220 230
−200
0
200
X [m]
δ[°]
170 180 190 200 210 220 230
0
2
·103
X [m]
Tact,F[N
m]
170 180 190 200 210 220 230
0
0.5
1
1.5·103
X [m]
Tact,R[N
m]
170 180 190 200 210 220 230−2
0
2
4
·103
X [m]
Treq[N
m]
Thr. o
ff
Accel
erate
Ctrl.
Rr
−5
0
5
10
d[m
]
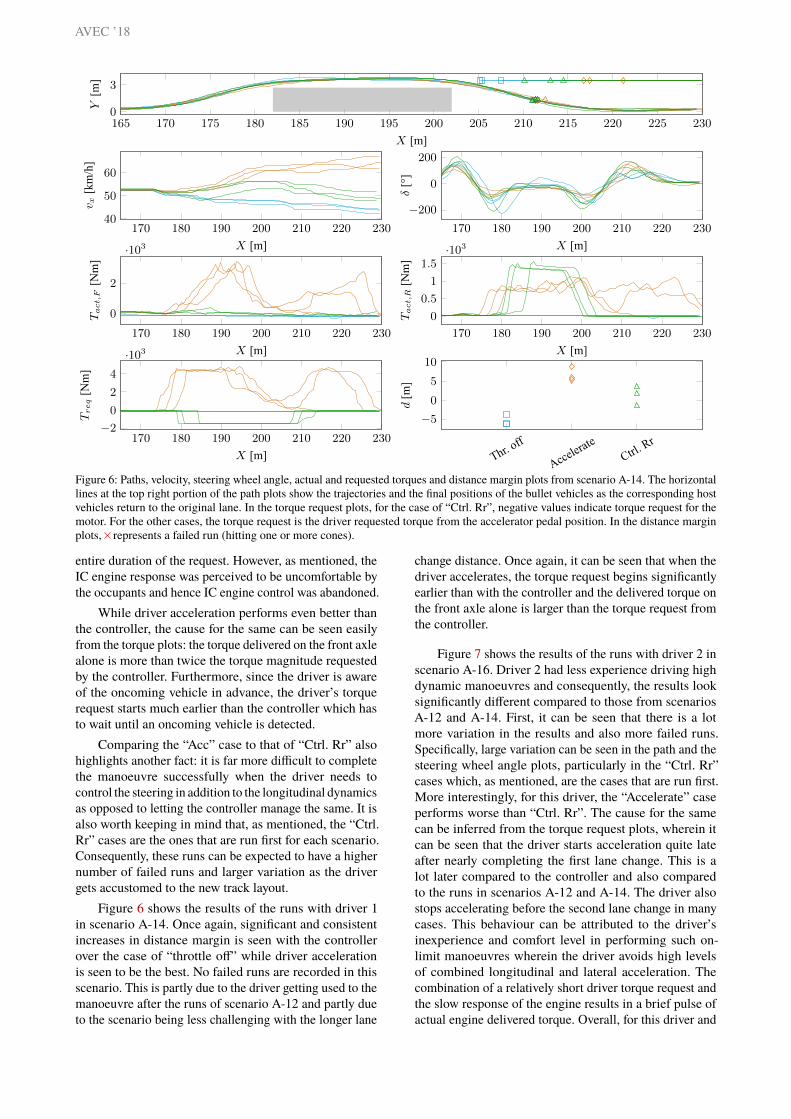
Figure 6: Paths, velocity, steering wheel angle, actual and requested torques and distance margin plots from scenario A-14. The horizontallines at the top right portion of the path plots show the trajectories and the final positions of the bullet vehicles as the corresponding hostvehicles return to the original lane. In the torque request plots, for the case of “Ctrl. Rr”, negative values indicate torque request for themotor. For the other cases, the torque request is the driver requested torque from the accelerator pedal position. In the distance marginplots, represents a failed run (hitting one or more cones).
entire duration of the request. However, as mentioned, theIC engine response was perceived to be uncomfortable bythe occupants and hence IC engine control was abandoned.
While driver acceleration performs even better thanthe controller, the cause for the same can be seen easilyfrom the torque plots: the torque delivered on the front axlealone is more than twice the torque magnitude requestedby the controller. Furthermore, since the driver is awareof the oncoming vehicle in advance, the driver’s torquerequest starts much earlier than the controller which hasto wait until an oncoming vehicle is detected.
Comparing the “Acc” case to that of “Ctrl. Rr” alsohighlights another fact: it is far more difficult to completethe manoeuvre successfully when the driver needs tocontrol the steering in addition to the longitudinal dynamicsas opposed to letting the controller manage the same. It isalso worth keeping in mind that, as mentioned, the “Ctrl.Rr” cases are the ones that are run first for each scenario.Consequently, these runs can be expected to have a highernumber of failed runs and larger variation as the drivergets accustomed to the new track layout.
Figure 6 shows the results of the runs with driver 1in scenario A-14. Once again, significant and consistentincreases in distance margin is seen with the controllerover the case of “throttle off” while driver accelerationis seen to be the best. No failed runs are recorded in thisscenario. This is partly due to the driver getting used to themanoeuvre after the runs of scenario A-12 and partly dueto the scenario being less challenging with the longer lane
change distance. Once again, it can be seen that when thedriver accelerates, the torque request begins significantlyearlier than with the controller and the delivered torque onthe front axle alone is larger than the torque request fromthe controller.
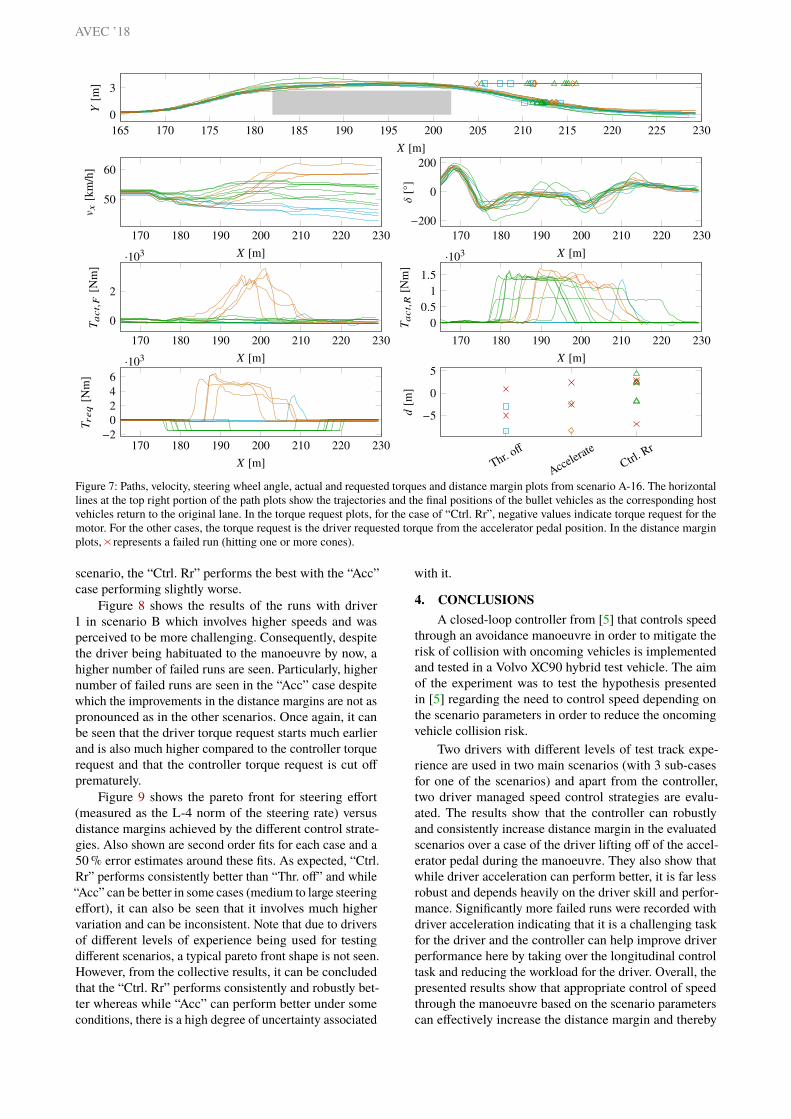
Figure 7 shows the results of the runs with driver 2 inscenario A-16. Driver 2 had less experience driving highdynamic manoeuvres and consequently, the results looksignificantly different compared to those from scenariosA-12 and A-14. First, it can be seen that there is a lotmore variation in the results and also more failed runs.Specifically, large variation can be seen in the path and thesteering wheel angle plots, particularly in the “Ctrl. Rr”cases which, as mentioned, are the cases that are run first.More interestingly, for this driver, the “Accelerate” caseperforms worse than “Ctrl. Rr”. The cause for the samecan be inferred from the torque request plots, wherein itcan be seen that the driver starts acceleration quite lateafter nearly completing the first lane change. This is alot later compared to the controller and also comparedto the runs in scenarios A-12 and A-14. The driver alsostops accelerating before the second lane change in manycases. This behaviour can be attributed to the driver’sinexperience and comfort level in performing such on-limit manoeuvres wherein the driver avoids high levelsof combined longitudinal and lateral acceleration. Thecombination of a relatively short driver torque request andthe slow response of the engine results in a brief pulse ofactual engine delivered torque. Overall, for this driver and
AVEC ’18
165 170 175 180 185 190 195 200 205 210 215 220 225 2300
3
X [m]
Y[m
]
170 180 190 200 210 220 230
50
60
X [m]
v x[k
m/h
]
170 180 190 200 210 220 230−200
0
200
X [m]
δ[°
]
170 180 190 200 210 220 2300
2
·103
X [m]
T act,F
[Nm
]
170 180 190 200 210 220 2300
0.51
1.5·103
X [m]
T act,R
[Nm
]
170 180 190 200 210 220 230−2
0246
·103
X [m]
T req
[Nm
]
Thr. off
Accelerat
eCtrl.
Rr
−5
0
5
d[m
]
Figure 7: Paths, velocity, steering wheel angle, actual and requested torques and distance margin plots from scenario A-16. The horizontallines at the top right portion of the path plots show the trajectories and the final positions of the bullet vehicles as the corresponding hostvehicles return to the original lane. In the torque request plots, for the case of “Ctrl. Rr”, negative values indicate torque request for themotor. For the other cases, the torque request is the driver requested torque from the accelerator pedal position. In the distance marginplots, represents a failed run (hitting one or more cones).
scenario, the “Ctrl. Rr” performs the best with the “Acc”case performing slightly worse.
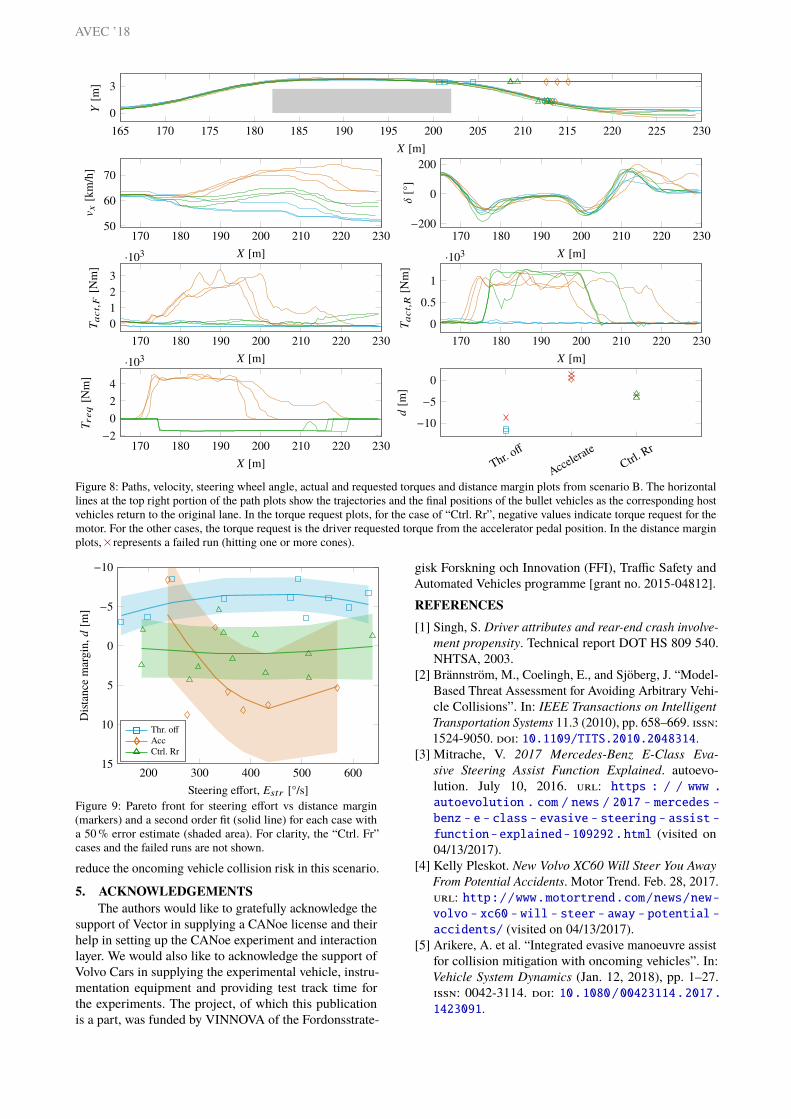
Figure 8 shows the results of the runs with driver1 in scenario B which involves higher speeds and wasperceived to be more challenging. Consequently, despitethe driver being habituated to the manoeuvre by now, ahigher number of failed runs are seen. Particularly, highernumber of failed runs are seen in the “Acc” case despitewhich the improvements in the distance margins are not aspronounced as in the other scenarios. Once again, it canbe seen that the driver torque request starts much earlierand is also much higher compared to the controller torquerequest and that the controller torque request is cut offprematurely.
Figure 9 shows the pareto front for steering effort(measured as the L-4 norm of the steering rate) versusdistance margins achieved by the different control strate-gies. Also shown are second order fits for each case and a50 % error estimates around these fits. As expected, “Ctrl.Rr” performs consistently better than “Thr. off” and while“Acc” can be better in some cases (medium to large steeringeffort), it can also be seen that it involves much highervariation and can be inconsistent. Note that due to driversof different levels of experience being used for testingdifferent scenarios, a typical pareto front shape is not seen.However, from the collective results, it can be concludedthat the “Ctrl. Rr” performs consistently and robustly bet-ter whereas while “Acc” can perform better under someconditions, there is a high degree of uncertainty associated
with it.
4. CONCLUSIONSA closed-loop controller from [5] that controls speed
through an avoidance manoeuvre in order to mitigate therisk of collision with oncoming vehicles is implementedand tested in a Volvo XC90 hybrid test vehicle. The aimof the experiment was to test the hypothesis presentedin [5] regarding the need to control speed depending onthe scenario parameters in order to reduce the oncomingvehicle collision risk.
Two drivers with different levels of test track expe-rience are used in two main scenarios (with 3 sub-casesfor one of the scenarios) and apart from the controller,two driver managed speed control strategies are evalu-ated. The results show that the controller can robustlyand consistently increase distance margin in the evaluatedscenarios over a case of the driver lifting off of the accel-erator pedal during the manoeuvre. They also show thatwhile driver acceleration can perform better, it is far lessrobust and depends heavily on the driver skill and perfor-mance. Significantly more failed runs were recorded withdriver acceleration indicating that it is a challenging taskfor the driver and the controller can help improve driverperformance here by taking over the longitudinal controltask and reducing the workload for the driver. Overall, thepresented results show that appropriate control of speedthrough the manoeuvre based on the scenario parameterscan effectively increase the distance margin and thereby
AVEC ’18
165 170 175 180 185 190 195 200 205 210 215 220 225 2300
3
X [m]
Y[m
]
170 180 190 200 210 220 23050
60
70
X [m]
v x[k
m/h
]
170 180 190 200 210 220 230−200
0
200
X [m]
δ[°
]
170 180 190 200 210 220 2300123
·103
X [m]
T act,F
[Nm
]
170 180 190 200 210 220 2300
0.5
1
·103
X [m]
T act,R
[Nm
]
170 180 190 200 210 220 230−2
024
·103
X [m]
T req
[Nm
]
Thr. off
Accelerat
eCtrl.
Rr
−10
−5
0d
[m]
Figure 8: Paths, velocity, steering wheel angle, actual and requested torques and distance margin plots from scenario B. The horizontallines at the top right portion of the path plots show the trajectories and the final positions of the bullet vehicles as the corresponding hostvehicles return to the original lane. In the torque request plots, for the case of “Ctrl. Rr”, negative values indicate torque request for themotor. For the other cases, the torque request is the driver requested torque from the accelerator pedal position. In the distance marginplots, represents a failed run (hitting one or more cones).
200 300 400 500 600
−10
−5
0
5
10
15
Steering effort, Estr [°/s]
Dist
ance
mar
gin,
d[m
]
Thr. offAccCtrl. Rr
Figure 9: Pareto front for steering effort vs distance margin(markers) and a second order fit (solid line) for each case witha 50 % error estimate (shaded area). For clarity, the “Ctrl. Fr”cases and the failed runs are not shown.
reduce the oncoming vehicle collision risk in this scenario.
5. ACKNOWLEDGEMENTSThe authors would like to gratefully acknowledge the
support of Vector in supplying a CANoe license and theirhelp in setting up the CANoe experiment and interactionlayer. We would also like to acknowledge the support ofVolvo Cars in supplying the experimental vehicle, instru-mentation equipment and providing test track time forthe experiments. The project, of which this publicationis a part, was funded by VINNOVA of the Fordonsstrate-
gisk Forskning och Innovation (FFI), Traffic Safety andAutomated Vehicles programme [grant no. 2015-04812].
REFERENCES[1] Singh, S. Driver attributes and rear-end crash involve-
ment propensity. Technical report DOT HS 809 540.NHTSA, 2003.
[2] Brännström, M., Coelingh, E., and Sjöberg, J. “Model-Based Threat Assessment for Avoiding Arbitrary Vehi-cle Collisions”. In: IEEE Transactions on IntelligentTransportation Systems 11.3 (2010), pp. 658–669. issn:1524-9050. doi: 10.1109/TITS.2010.2048314.
[3] Mitrache, V. 2017 Mercedes-Benz E-Class Eva-sive Steering Assist Function Explained. autoevo-lution. July 10, 2016. url: https : / / www .autoevolution . com / news / 2017 - mercedes -benz - e - class - evasive - steering - assist -function-explained-109292.html (visited on04/13/2017).
[4] Kelly Pleskot. New Volvo XC60 Will Steer You AwayFrom Potential Accidents. Motor Trend. Feb. 28, 2017.url: http://www.motortrend.com/news/new-volvo - xc60 - will - steer - away - potential -accidents/ (visited on 04/13/2017).
[5] Arikere, A. et al. “Integrated evasive manoeuvre assistfor collision mitigation with oncoming vehicles”. In:Vehicle System Dynamics (Jan. 12, 2018), pp. 1–27.issn: 0042-3114. doi: 10.1080/00423114.2017.1423091.