experimental investigation into the operating ... · experimental investigation into the operating...
TRANSCRIPT
EXPERIMENTAL INVESTIGATION INTO THE
OPERATING CHARACTERISTICS OF THREE
PHASE INDUCTION MOTORS
A REPORT SUBMITTED TO THE SCHOOL OF ENGINEERING AND INFORMATION
TECHNOLOGY IN PARTIAL FULFILLMENT OF THE REQUIREMENTS FOR THE DEGREE OF
BACHELOR OF ENGINEERING
CHARLIE FOOTE
November 2014
P a g e 1 | 56
Abstract
Induction motors are used in a significant portion of industrial electric drive applications
due to their reliability, relatively low cost and low maintenance required. The Squirrel Cage
and Wound Rotor type machines are common examples of an induction machine.
One of the important features of an induction motor is its torque speed characteristic. The
correct application, motor protection, speed control and efficiency of a machine can
depend on correctly identifying this characteristic.
The project objective involved the design of experiments to obtain the torque speed
characteristics for both the squirrel cage and wound rotor type induction motors available
in the engineering laboratory. A further aim of the project involved the design and
execution of suitable experiments with the Lab-Volt equipment to experimentally
determine the electrical parameters of the machines. Determining the electrical
parameters involves conducting standard tests such as the DC, No-Load and Locked Rotor
test.
Once these parameters are known the characteristic curve can be modeled by simulation
software and a comparison can be made with the experimental curves. Further work
included using 3 measured points within the stable operating region to extrapolate the
maximum torque and speed for each machine. An investigation into the effect of increasing
the rotor resistance in the wound rotor induction motor (WRIM) was also carried out.
Determining the torque speed characteristic experimentally was achieved relatively easily
in the stable operating region with the use of an electrodynamometer as a loading device.
Torque measurements are read directly from the scale on the faceplate of the
electrodynamometer whilst simultaneously measuring the rotational speed with an optical
tachometer.
Determining the T-S characteristics in the unstable region of operation included coupling
the machine being tested to a DC generator. The torque speed characteristic of a DC
machine is linear up until the armature windings are saturated. Measurements of the
power output (P=V*I) of the armature windings and the rotational speed are taken and the
induced torque can then be calculated.
Matlab was used in the implementation of this project as a simulation tool. Three
simulations programs were written including: a program to plot the torque speed curve
derived from the equivalent circuit, a program to conduct a sensitivity analysis of the
measured parameters and thirdly, a program to determine the electrical parameters and
max torque and speed using just three measured points on the curve.
This project investigation of the torque speed curve was completed and provided an insight
into the torque speed characteristics of the Lab-Volt machines. It provides a basis for
further experimentation and comparison with other methods available for determining the
machine characteristics.

P a g e 2 | 56
Acknowledgements
I would like to thank my thesis supervisor
Dr Sujeewa Hettiwatte
for his guidance and encouragement whilst completing this project.
For their assistance in the project, acknowledgements are given to the following people:
Mr John Boulton
Technical Officer, Murdoch Engineering
&
Mr Jeff Laava
Technical Officer, Murdoch Engineering
Finally I would like to thank my family for their continuous support throughout my studies.
P a g e 3 | 56
Contents Abstract ............................................................................................................................. 1
Acknowledgements .................................................................................................................. 2
List of Figures ........................................................................................................................... 5
List of Tables ............................................................................................................................ 5
Terminology and Acronyms ..................................................................................................... 6
1. Introduction ......................................................................................................... 7
1.1. Report Structure .................................................................................................. 8
1.2. Project Objectives ................................................................................................ 8
1.3. Revisions to the Project Objectives ..................................................................... 9
1.4. Literature Review .............................................................................................. 10
2. Three Phase Induction Motor Construction ...................................................... 13
2.1. Induced Torque Developed in an Induction Motor ........................................... 14
3. Methodology ..................................................................................................... 16
3.1. Experimental Determination of T-S Curve ........................................................ 16
3.1.1. The Electrodynamometer as a Loading Device ................................................. 17
3.1.2. The DC Machine as a Loading Device ................................................................ 18
3.1.3. Torque in a Separately Excited Generator ........................................................ 19
3.2. Motor Electrical Parameters and Equivalent Circuit ......................................... 20
3.2.1 The DC Test ........................................................................................................ 22
3.2.2. The No-Load Test ............................................................................................... 22
3.2.3. The Locked Rotor Test ....................................................................................... 22
3.3. The Equivalent Circuit of an Induction Motor ................................................... 24
3.4. Variable Speed Drive - VSD ................................................................................ 25
3.5. PM 6000 Power Analyser .................................................................................. 26
3.6. Sensitivity Analysis ............................................................................................ 27
3.7. Effect of Increasing Rotor Resistance in the WRIM ........................................... 27
3.8. Interpolation of Torque Speed Curve Using 3 Measured Points ....................... 28
4. Results Section .................................................................................................. 30
4.1. Experimental Results – Electrodynamometer and DC Generator ..................... 30
4.2. Results - Equivalent Circuit Parameters ............................................................ 33
4.3. SCIM Results ...................................................................................................... 35
4.4. WRIM Results .................................................................................................... 38
4.5. Interpolation Results ......................................................................................... 41
4.6. Sensitivity Analysis ............................................................................................ 42

P a g e 4 | 56
5. Conclusion ......................................................................................................... 47
References ...........................................................................................................................49
Appendices............................................................................................................................. 51
Appendix 1 –Matlab Code for Determining Torque-Speed Curve ..................................... 51
Appendix 2 - Matlab Code for Comparison of Locked Rotor Tests .................................... 52
Appendix 3 – Electrical Parameters Calculation Method .................................................. 54
Appendix 4 – Matlab code for interpolation results .......................................................... 56
P a g e 5 | 56
List of Figures Figure 1: Lab-Volt electrodynamometer (left) connected to induction machine via timing
belt ......................................................................................................................................... 17
Figure 2: Equivalent circuit of a separately excited DC motor/generator. ............................ 19
Figure 3: Simplified equivalent per phase circuit, rotor referred to stator/primary side. .... 21
Figure 4: Variable Speed Drive Used in Project ..................................................................... 26
Figure 5: Voltech PM6000 Universal Power Analyser ........................................................... 27
Figure 6: WRIM Dynamometer vs. DC generator Torque Measurements ............................ 32
Figure 7: SCIM Dynamometer vs. DC generator Torque Measurements .............................. 32
Figure 8: SCIM Characteristic Curve with 5.526 Hz Locked Rotor Test .................................. 36
Figure 9: SCIM - Characteristic using 50Hz Locked Rotor Test .............................................. 36
Figure 10: SCIM comparison of Characteristic (50Hz & 5.526Hz Locked Rotor Test) ............ 37
Figure 11: SCIM Starting, Breakdown and Full Load Torque ................................................. 37
Figure 12: WRIM comparison of T-s Characteristic (50Hz & 8.3Hz Locked Rotor Test) ........ 39
Figure 13: WRIM Equivalent Circuit Full Load Torque ........................................................... 41
Figure 14: Sensitivity Analysis SCIM using the parameters from 50Hz Locked Rotor Test .... 43
Figure 15: Sensitivity Analysis SCIM using the parameters from 5.625Hz Locked Rotor Test
............................................................................................................................................... 44
Figure 16: Sensitivity Analysis WRIM using the parameters from 50Hz Locked Rotor Test .. 45
Figure 17: Sensitivity Analysis WRIM using the parameters from 8.2920 Hz Locked Rotor
Test ......................................................................................................................................... 46
List of Tables Table 1: Lab-Volt Induction Machine Model 8221 and 8231 Ratings .................................... 15
Table 2: Lab-Volt Electrodynamometer Model 8911 Specifications ..................................... 18
Table 3: Lab-Volt DC Generator Ratings ................................................................................ 18
Table 4: Torque Measurement Results Using Dynamometer - SCIM & WRIM...................... 31
Table 5: Measurements and calculated torque using DC generator ..................................... 31
Table 6: SCIM - No-Load test results ...................................................................................... 35
Table 7: SCIM - DC test results ............................................................................................... 35
Table 8: SCIM Equivalent Circuit Parameters ........................................................................ 35
Table 9: SCIM Starting and Breakdown Torque ..................................................................... 38
Table 10: WRIM - DC Test Results .......................................................................................... 38
Table 11: WRIM - No-Load Test Results ................................................................................. 39
Table 12: WRIM Equivalent Circuit Parameters ..................................................................... 39
Table 13: WRIM Starting and Breakdown Torque ................................................................. 40
Table 14: WRIM Comparison of calculated Tmax & speed with equivalent circuit results ..... 42
Table 15: SCIM Comparison of calculated Tmax & speed with equivalent circuit results ....... 42
P a g e 6 | 56
Terminology and Acronyms
AC – Refers to Alternating Current
DC –Refers to Direct Current
IEEE – Institute of Electrical and Electronics Engineers
Machine – used interchangeably with the word motor
NEMA – National Electrical Manufacturers Association
Peak torque – Maximum torque that a machine is capable of
Pull-up torque – Minimum torque developed in the region from zero speed to breakdown
torque speed
PWM – Pulse Width Modulated
SCIM – Squirrel Cage Induction Motor
Starting torque – Shaft torque developed with motor at zero speed
THD – Total Harmonic Distortion
T-S – Torque Speed
VSD – Variable Speed Drive
WRIM – Wound Rotor Induction Motor
P a g e 7 | 56
1. Introduction
A significant portion of industrial electric drive applications use induction motors due to
their reliability, relatively low cost and the minimal maintenance required. According to
National Electrical Manufacturers Association (NEMA), the combined market for motors
and generators in the US domestic market alone is worth $5 billion [1]. The Squirrel Cage
and Wound Rotor type machines are the particular machines of interest to this project.
The variables of interest in an induction motor are the shaft torque and speed. Therefore,
one of the important features of an induction motor is its torque-speed (T-S) characteristic.
Correctly identifying the characteristic is necessary for the correct selection and application
of the motor, for motor protection purposes, speed control and obtaining maximum
efficiency.
The project aims included:
The design and implementation of experiments to determine the T-S curve for the
Lab-Volt 3 phase wound rotor and squirrel cage induction motors available in the
engineering laboratory.
Determining the electrical parameters for the motor’s equivalent circuit and
comparison between the experimentally obtained and theoretical curves.
Further investigation into the effect of increasing the rotor resistance in the wound rotor
induction motor (WRIM) was also carried out along with a Matlab simulation to find the T-S
characteristics using just three arbitrary points of measured data from the stable operating
region of the machines.
The shape of the T-S and current speed curves is dependent upon the voltage and
frequency of the power supply and is specific to a particular motor. The Torque-Speed
characteristic curve shows the torque for all speeds of the motor, from zero to synchronous
speed. The points of interest on the curve include the maximum or breakdown torque, pull-
up torque and the locked rotor torque.
The characteristic curves can be determined once the equivalent circuit parameters are
determined. The locked rotor, DC and no load test are common tests used to determine
the (per phase) equivalent circuit parameters and methods are specified in the IEEE
standard 112-2004 [2].
P a g e 8 | 56
Increasing the rotor resistance has the effect of changing the torque-speed curve for the
motor and is particularly useful for controlling the starting characteristics and/or speed of
the motor.
The induction machines, electrodynamometer and DC generator used for this project are
designed for student laboratory projects and are part of the Lab-Volt 0.2 kW
Electromechanical Training System (EMS series). The system has been designed to operate
similar to industrial equipment [3].
1.1. Report Structure
This report comprises of five chapters with the structure set out as follows:
Chapter 1: The report begins by introducing the thesis and defining the project objectives
in chapter 1. Project objectives and revisions are found in sections 1.2 and 1.3 respectively.
A literature review of relevant material to the project is included in section 1.4
Chapter 2: Chapter 2 outlines basic construction, principles and theory for polyphase
induction motors as well as the ratings for the Lab-Volt machines.
Chapter 3: The methodology used for the project to determine the results and theory
behind the methods is outlined in sections 3.1 to 3.9.
Chapter 4: Results are given in Chapter 4 for the test work completed during the project.
The results are split up into 4 sections: experimental results in section 4.1, equivalent
circuit parameters in section 4.2, interpolation from 3 points on the T-s curve in section 4.3
and a sensitivity analysis in section 4.4.
Chapter 5: Chapter 5 contains the conclusion including a summary of the work performed
and results obtained. Further work possible within the project area is also proposed in this
chapter.
1.2. Project Objectives
The objectives of the project revolved around experimentally determining the torque
speed curve for the Lab-Volt SCIM and WRIM using equipment available in the engineering
laboratory. The key objectives included:
1. The design and execution of suitable experiments to determine the torque speed
curve.
P a g e 9 | 56
2. Generate theoretical plots by suitably estimating the induction motors electrical
parameters for comparison with the experimental results.
3. Explore the effect that increasing the rotor resistance has on the WRIM torque
speed curve.
1.3. Revisions to the Project Objectives
One of the original aims of the project was to obtain torque measurements within the
“unstable” operating region of the induction motors. That is, the region of the torque
speed curve between the pull-up and peak/breakdown torque of the machine. When the
machine is operating at speeds within the unstable region a constant source of torque is
required and therefore using the electrodynamometer is not a suitable method to obtain
these measurements.
The torque speed curve of a DC motor/generator is linear and it was initially proposed that
a DC generator be used to load the machine within the unstable region. At steady state
speed, the shaft torque provided by the motor would equal the torque required to drive
the generator (assuming the coupling system losses are negligible).
In this way the DC machine provides a constant braking force or torque to the prime
mover. Obtaining measurements of the DC generators output power and speed or
armature Voltage and Current and the shaft speed would allow the calculation of the
torque required to drive the generator.
The shaft torque of the DC machine is found by:
Ʈ = P/ω = (Var*Iar)/ω Equation 1
Where: Ʈ = shaft torque, P = output power, Var and Iar are the DC machine’s armature
voltage and current. ω = the speed of the rotor in radians/s. Losses in the DC machine are
neglected.
It was found that the Lab-Volt DC machine was not suitable for producing the load required
as it quickly exceeded its rated armature current. To load the motor into the unstable
region would have required currents > 4 times the rated current for the machine which
could result in damage to the machine windings.
After consultation with the project supervisor it was decided that testing with currents
approximately equal to 150 % of the rated values was acceptable. This however resulted in
P a g e 10 | 56
the induction machines only being loaded to their rated full load speeds (1395rpm and
1315rpm for the SCIM and WRIM respectively [4]).
This is perhaps not so surprising as the Lab-Volt DC generator has been designed to be
driven by the WRIM and SCIM being tested and correct design would match the prime
movers rated full load speed to the generators full load speed.
1.4. Literature Review
The study of three phase induction motors and the fundamental theories and equations
behind their basic operation are well established and can be found in any electric
machinery textbook such as: Chapman [5], Hubert [6] or Fitzgerald, Kingsly and Umans [7].
A common method for evaluating the motor involves conducting three tests on the motor
to determine its electrical parameters. The parameters of interest are the stator and rotor
resistance and reactance (R1, X1, R2 and X2 respectively) and the motors magnetising
reactance Xm.
Once the parameters are known the motor can be modelled using the equivalent circuit
with circuit elements referred back to the stator. Derivation of the circuit and an
explanation of the three common tests employed (No-Load, Locked Rotor and the DC test)
can be found in chapter 3.
It is of note that Fitzgerald, Kingsly and Umans [7] (p.333) state that for motors with ratings
of less than 25Hp the locked rotor test can be conducted with full frequency. That is that
the effects of frequency on the rotor whilst conducting the locked rotor test can often be
neglected. This is in contrast to IEEE std 112 [2] which makes no distinction for motor size.
In this project the Locked rotor test on the WRIM and SCIM was first conducted using full
frequency and then at reduced frequency in accordance with [2] and a comparison made
(see results section). Whether the effect of frequency can be ignored for the locked rotor
test in both machines is also found in Chapter 4.
The National Electrical Manufacturers Association (NEMA) is a USA based organisation
which publishes a standard to assist in the proper “selection and classifying of induction
motors”, NEMA MG 1 [8] . Classification of motors according to their torque speed
characteristic and design classes are designated as: A, B, C and D. Note that these are
P a g e 11 | 56
typical design classes and individual machines will have their own specific characteristic
curves.
Australian Standard AS1359 [9] also designates standard machine classes. The letter
designation is as follows: N, NY, H and HY and are roughly equivalent to NEMA design
classes A, B, C and D.
IEEE standard 112 [2] gives a very detailed standard test procedure for carrying out and
reporting the performance and characteristics of polyphase machines. It applies to both
induction motors and generators and gives instructions for conducting the tests that are
generally accepted as standard for determining the machine parameters.
The three standard tests are the: DC test, Locked Rotor test and No-Load test. The DC test
is used to find the machines per-phase stator resistance (or R1), the Locked Rotor test for
determining the rotor resistance and total leakage reactance (X1) and the No-Load test for
finding the frictional I2R and the friction, windage and core losses.
Many other methods exist, including the NEMA MG 1 [8] and IEC 34-2 to name a few. The
NEMA MG 1 is the principle standard used in North American countries and follows
method B of IEEE std 112 with stray load loss treatment. This standard assists with the
proper selection and application of motors and has practical information concerning
classification/construction/performance/safety/testing and manufacture of both AC and
DC motors/generators.
IEEE standard 112 references NEMA MG1 for typical routine tests (IEEE standard 112, part
3.1). Section II part 12 is useful to the thesis as it contains practical information on:
definitions of key terms, expected values (min/max) for key parameters like the
breakdown/pull-up torque.
Comparison between some of the different methods can be found in “Proper selection of
induction motor tests” [11] and “Induction motor efficiency test methods” [12]. Test
methods using results obtained by conducting tests on a doubly fed induction machine are
shown in the paper “Comparison test methods for characterisation of doubly fed induction
machines” [13].
One of the standard tests across most of the standards listed above involves locking the
rotor and applying either rated or reduced voltage/frequency to the stator. Other methods
do exist which do not require the rotor to be locked such as that proposed by Skaar [14].
P a g e 12 | 56
Salimin, Kadir, Mohd, Baki and Ismail [15] outline a test and simulation to determine
machine parameters on WRIM similar to the proposed thesis method. It compares the
motor parameters found from the No-Load, DC and Locked Rotor tests with parameters
found using Matlab/Simulink simulation. Star connected, WRIM are tested and simulated.
Another relevant paper to the thesis is “Virtual laboratory platform for enhancing
undergraduate level induction motor course using Matlab-simulink” [16] as it details the
basic theory of induction motors and includes information on the three tests (DC, No-Load
and Locked Rotor) used to determine the equivalent circuit parameters. An explanation is
given for the Matlab/SImulink model for both the SCIM and WRIM including results and
some description of model function and blocks used. The project used Matlab code for
simulations as the use of Simulink gave no additional benefit.
Likewise, the paper by Ayasun, Nwankpa [17] describe the tests (no-load, DC and blocked
rotor) used to determine motor parameters and simulation with Matlab/Simulink. It also
gives a procedure for the no-load test and Simulink implementation for all 3 tests.
Due to its widespread use, detailed methods and general acceptance, the test procedures
outlined in IEEE std 112 [2] will be followed to determine the electrical parameters for both
motors.
Reference [18] “Parameter estimation of squirrel-cage induction motors without torque
measurements” discusses the problems of using 2 of the parameter calculation methods
outlined in the IEEE Standard 112. It proposes a simple method for determining squirrel
cage induction motor parameters using a double cage model and without torque
measurements. Reference [19] “Comparison of standards for determining efficiency of
three phase induction motors” discusses and compares the different methods outlined in
standards like IEEE 112 and IEC 34-2. There is also a discussion on losses and relevant
equations to the project.
The project intends to use a DC motor coupled to the AC induction machines for the
purposes of introducing a torque/load. The torque that is induced on the AC machine must
be known and therefore the torque speed characteristic of the DC motor must be
determined before the lab can be carried out. The paper “Characteristics measurement of
direct-drive brushless DC motors without using dynamometers” [20], proposes a testing
procedure for estimating the torque-speed characteristics of a DC motor.
P a g e 13 | 56
2. Three Phase Induction Motor Construction
Three phase induction motors consist of two main parts, the stator and the rotor. The
motor housing contains the stator windings which, in its simplest form, consists of three
electrical windings spaced 120 degrees apart around the inside of the housing.
The rotor is located at the centre of the motor and is surrounded by the stator windings. It
is supported by bearings and the direction of rotation depends on the direction of the
rotating magnetic field produced by the stator windings. The machines of interest to this
project are the squirrel cage and wound rotor type induction motor.
The squirrel cage refers to the construction of the rotor which consists of a laminated iron
core with parallel conducting bars slotted into it in a longitudinal direction. The conducting
bars are evenly spaced around the rotor and are welded/connected at each end to a
circular ring to form the “cage”.
The design of wound rotor machines includes copper windings placed in the rotor in such a
way that they cut the flux lines created by the stator’s magnetic field. One end of the
windings is star connected whilst the other end is terminated outside the machine via the
use of slip rings and brushes. This enables the connection of an external resistance or
circuit to the rotor windings.
The option to connect external resistance to the rotor circuit gives the user the ability to
control the motor starting characteristics and the speed of the motor. Peak torque
generated by the machine can be generated during starting conditions with the addition of
enough external resistance. Other circuits exist such as the Slip Power Recovery system
which feed power from the rotor windings back to the stator.
Squirrel cage motors are the most common type due to their simplicity, lower maintenance
requirements and cost. The wound rotor requires more maintenance due to the slip rings
and brushes and is therefore more expensive.
P a g e 14 | 56
2.1. Induced Torque Developed in an Induction Motor
When a three phase voltage is applied to the stator windings the current flowing through
them magnetises the windings and sets up a rotating magnetic field. The current in each
winding is of equal magnitude but with a phase difference of 120 degrees. Likewise, the
corresponding magnetic fields have a phase difference of 120 degrees.
The magnetic fields rotate in a direction dependent on the order of the windings
connection to the source. Changing the direction of the machines rotation merely requires
interchanging any two of the three phases.
The rotating magnetic field in the stator rotates at synchronous speed which depends on
the number of poles and the frequency of the applied voltage. Calculation of the
synchronous speed (nsync ) is shown in equation 2 below.
𝑛𝑠𝑦𝑛𝑐 = 𝜔 = 120 ∗ 𝑓 / 𝑛 Equation 2
Where ω is the rotational speed of the rotating magnetic field in rpm, f is the rated
frequency and n is the number of poles particular to the machine. Note that the
synchronous speed is the same for all motors regardless of size and can be found if the
number of poles and rated frequency is known.
The rotor windings/bars cut through the magnetic field which induces a voltage which in
turn causes a current to flow. Equation 3 shows the induced voltage (Eind) for the velocity of
the bar (v) and the length of the conductor located within the magnetic field (l). Note that
the velocity of the bar is relative to the magnetic field, therefore, the greater the relative
velocity, the greater the induced voltage.
Einduced = (v*B)*l Equation 3
The interaction between the rotor and stator magnetic fields causes a turning force and
torque in the motor. The relative motion between the rotor and stator fields is called the
slip (s) and can be found using equation 4 if the rotor speed (nm) and synchronous speed
(nsync) are known.
s = [( nsync - nm ) / nsync] * 100% Equation 4
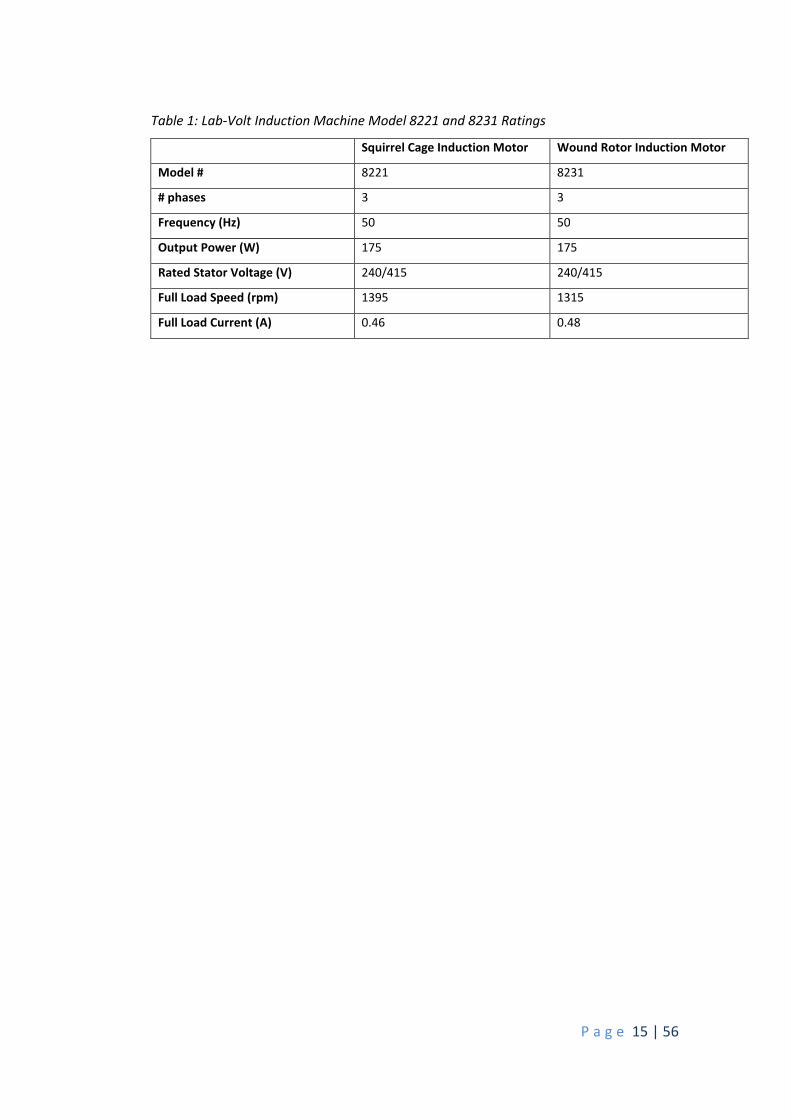
The motors used for this project are both Lab-Volt standard equipment and the ratings are
found in the reference [4] and Table 1 below.
P a g e 15 | 56
Table 1: Lab-Volt Induction Machine Model 8221 and 8231 Ratings
Squirrel Cage Induction Motor Wound Rotor Induction Motor
Model # 8221 8231
# phases 3 3
Frequency (Hz) 50 50
Output Power (W) 175 175
Rated Stator Voltage (V) 240/415 240/415
Full Load Speed (rpm) 1395 1315
Full Load Current (A) 0.46 0.48
P a g e 16 | 56
3. Methodology
This chapter seeks to outline some of the theory and reasoning behind the chosen test
methods. The equipment was limited to the Lab-Volt machinery available in the
engineering laboratory and forms part of the experimental station outlined in the Lab-Volt
Electromechanical 0.2 kW Training System [3].
Particular attention is paid to the Locked Rotor test as it proved to be the most challenging
to conduct with the equipment available.
3.1. Experimental Determination of T-S Curve
To determine the T-S curve experimentally the induction motor is coupled to a loading
device such as a dynamometer or DC generator. The Lab-Volt standard equipment available
includes both machines (DC generator/motor and dynamometer part # 8211 and # 8911
respectively). Machine ratings are found in Table 2 and Table 3 below.
Perhaps the easiest and most reliable method for determining the torque produced by a
motor is by directly measuring the torque produced for a given speed. The measurements
are taken whilst the motor is under normal operating conditions (supplied with rated
voltage and frequency) and the speed and torque produced by the machine can be varied
by increasing the load (increasing the load increases the torque required by the motor).
The first proposed method of loading the machine is to directly couple the motor to a
dynamometer. A second method is to couple the motor to a DC generator. The Lab-Volt
dynamometer and DC machine are easily connected to the induction machine via a toothed
rubber belt and tensioning pulleys.
The Lab-Volt DC machine can be utilised as a DC motor or generator and the field and
armature windings are terminated on the face plate for ease of wiring allowing connection
as a series, shunt, compound or separately excited generator.
Whilst the Lab-Volt Electromechanical system has a meter designed to cover the full range
of power measurements for the system [3], a power analyser was used for all electrical
measurements as it provided the measurement accuracy to the standard required in [2].
P a g e 17 | 56
Likewise, the system has an opening in the faceplate of each machine for the use of a
mechanical tachometer. For the project an optical tachometer was chosen as experience
showed that it gave greater accuracy and more stable readings.
3.1.1. The Electrodynamometer as a Loading Device
The Lab-Volt Electrodynamometer can easily be coupled to either of the induction
machines with the use of the timing belt and tensioning rollers. The electrodynamometer
itself consists of a squirrel cage rotor mounted inside of a DC-excited stator winding.
The Lab-Volt Electrodynamometer’s stator housing can rotate as it is mounted via bearings
on the machines frame. Applying a voltage to the stator field generates a magnetic field in
the stator and causes eddy currents to be produced in the rotor. The eddy currents oppose
the rotation of the driven rotor and a mechanical loading is produced. Increasing applied
voltage increases the field strength and eddy currents which in turn increases the
loading/braking force.
A helical spring connects the electrodynamometer housing to the frame and opposes the
braking force produced by the electrodynamometer. A scale is attached to the front of the
dynamometer allowing direct measurement of the applied torque. It is assumed that the
pulley system is efficient and any friction/rotational losses are negligible.
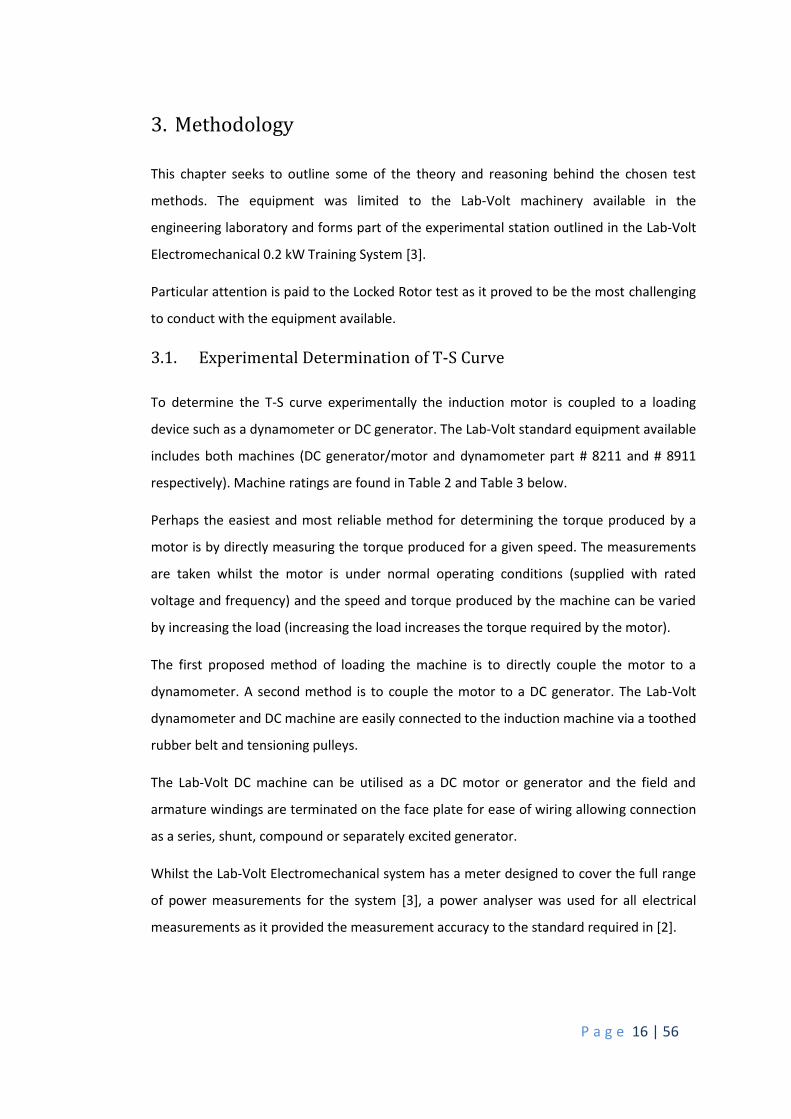
The electrodynamometer ratings are taken from the Lab-Volt data sheet [21] and are
shown in Table 2 below. Note that the maximum rated torque that the machine can
provide is 3 Nm. To ensure consistency of readings the direction of rotation was
maintained between successive experiments. The test rig (with faceplates lowered) is
shown in Figure 1 below.
Figure 1: Lab-Volt electrodynamometer (left) connected to induction machine via timing belt
P a g e 18 | 56
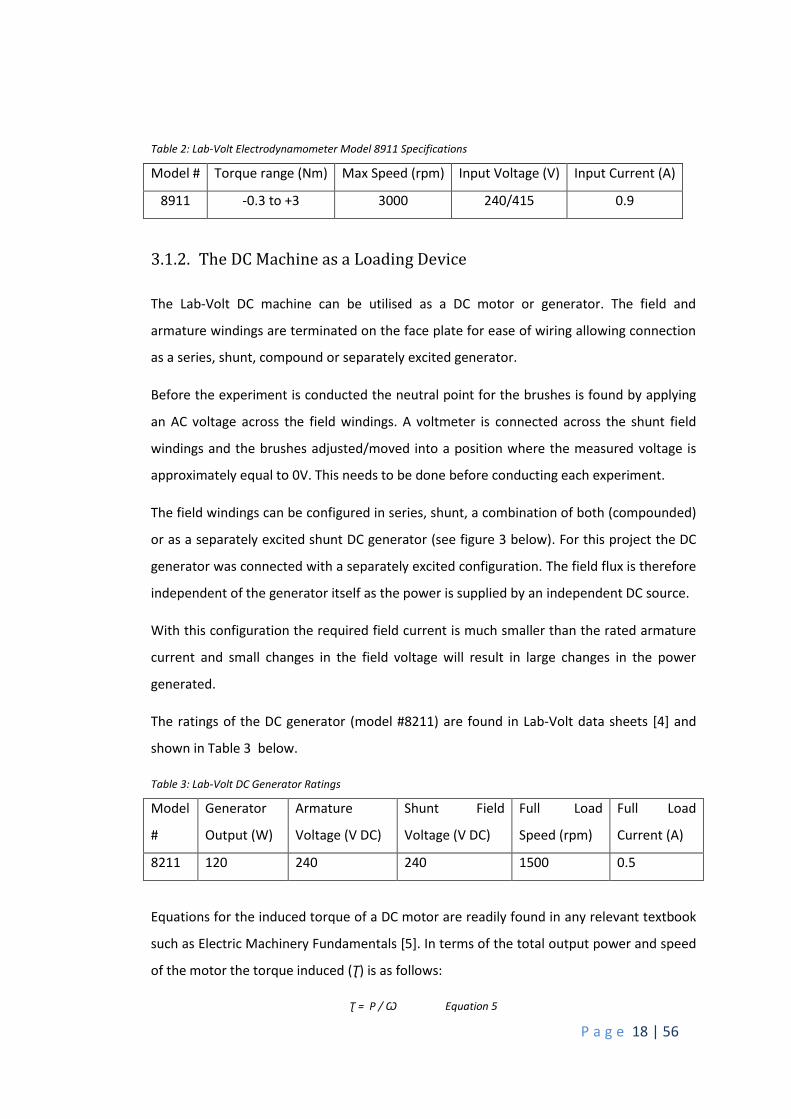
Table 2: Lab-Volt Electrodynamometer Model 8911 Specifications
Model # Torque range (Nm) Max Speed (rpm) Input Voltage (V) Input Current (A)
8911 -0.3 to +3 3000 240/415 0.9
3.1.2. The DC Machine as a Loading Device
The Lab-Volt DC machine can be utilised as a DC motor or generator. The field and
armature windings are terminated on the face plate for ease of wiring allowing connection
as a series, shunt, compound or separately excited generator.
Before the experiment is conducted the neutral point for the brushes is found by applying
an AC voltage across the field windings. A voltmeter is connected across the shunt field
windings and the brushes adjusted/moved into a position where the measured voltage is
approximately equal to 0V. This needs to be done before conducting each experiment.
The field windings can be configured in series, shunt, a combination of both (compounded)
or as a separately excited shunt DC generator (see figure 3 below). For this project the DC
generator was connected with a separately excited configuration. The field flux is therefore
independent of the generator itself as the power is supplied by an independent DC source.
With this configuration the required field current is much smaller than the rated armature
current and small changes in the field voltage will result in large changes in the power
generated.
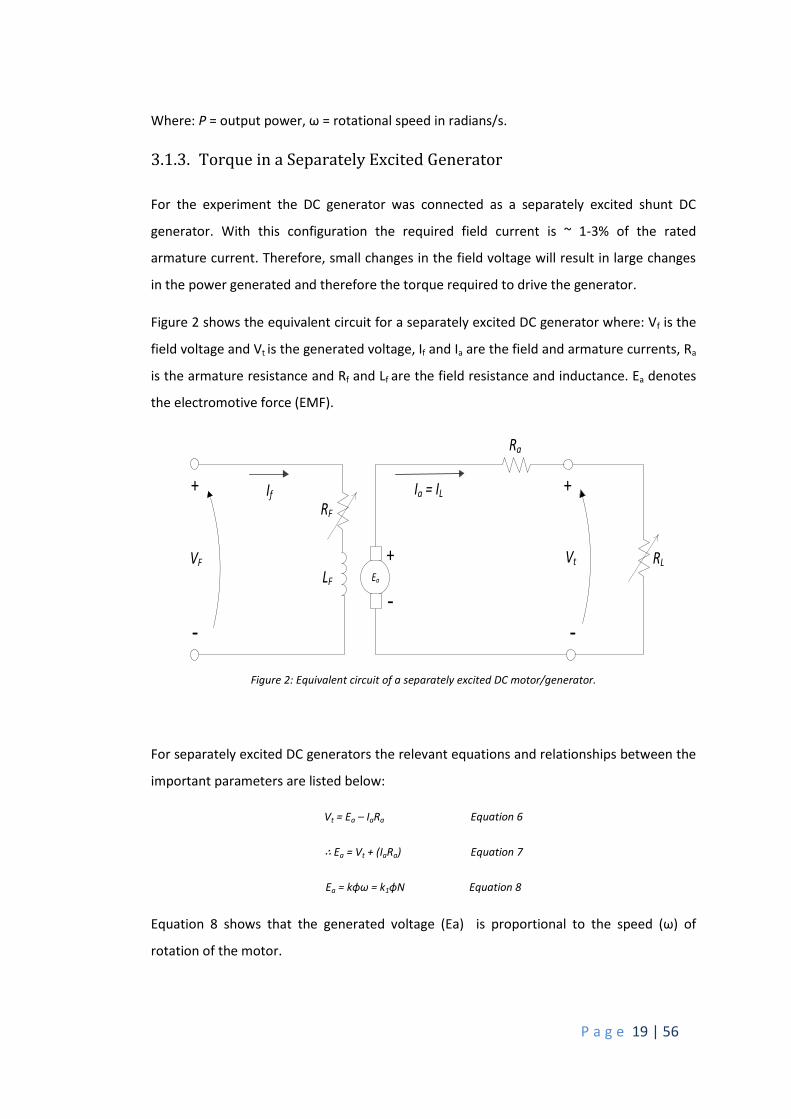
The ratings of the DC generator (model #8211) are found in Lab-Volt data sheets [4] and
shown in Table 3 below.
Table 3: Lab-Volt DC Generator Ratings
Model
#
Generator
Output (W)
Armature
Voltage (V DC)
Shunt Field
Voltage (V DC)
Full Load
Speed (rpm)
Full Load
Current (A)
8211 120 240 240 1500 0.5
Equations for the induced torque of a DC motor are readily found in any relevant textbook
such as Electric Machinery Fundamentals [5]. In terms of the total output power and speed
of the motor the torque induced (Ʈ) is as follows:
Ʈ = P / Ѡ Equation 5
P a g e 19 | 56
Where: P = output power, ω = rotational speed in radians/s.
3.1.3. Torque in a Separately Excited Generator
For the experiment the DC generator was connected as a separately excited shunt DC
generator. With this configuration the required field current is ~ 1-3% of the rated
armature current. Therefore, small changes in the field voltage will result in large changes
in the power generated and therefore the torque required to drive the generator.
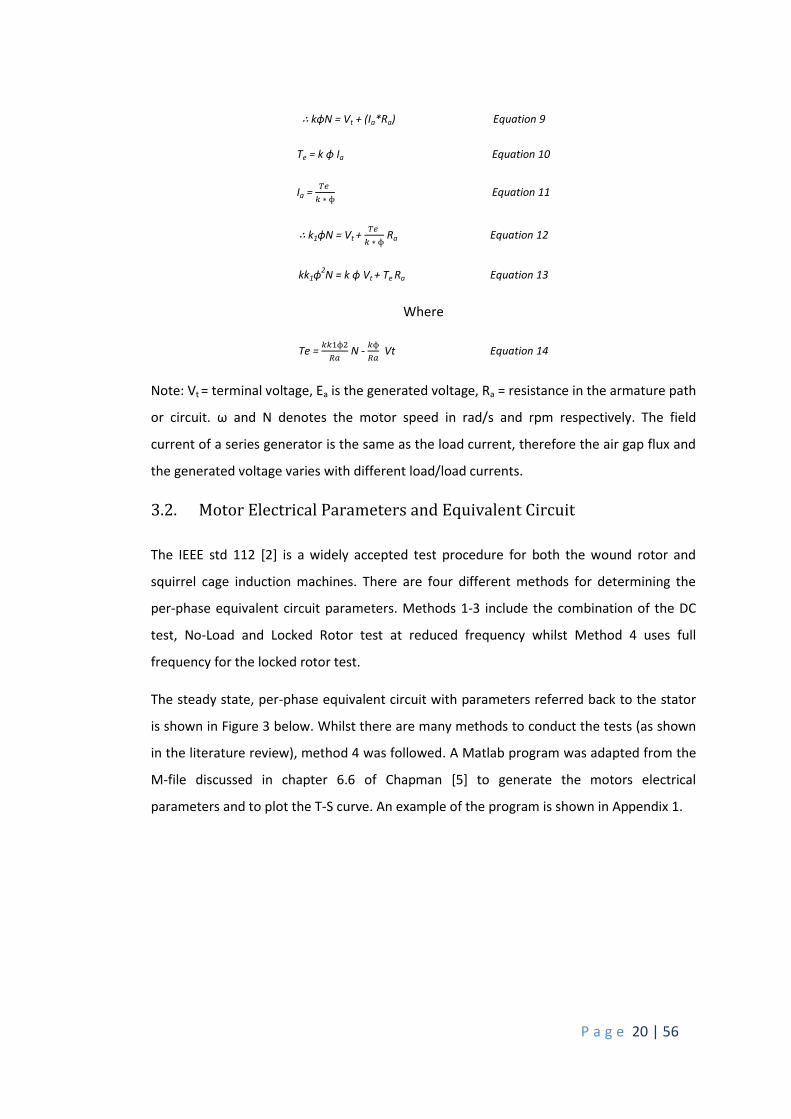
Figure 2 shows the equivalent circuit for a separately excited DC generator where: Vf is the
field voltage and Vt is the generated voltage, If and Ia are the field and armature currents, Ra
is the armature resistance and Rf and Lf are the field resistance and inductance. Ea denotes
the electromotive force (EMF).
+
-
Ra
+
Vt
-
VF
Ia = IL
RF
Ea
+
-
RL
LF
If
Figure 2: Equivalent circuit of a separately excited DC motor/generator.
For separately excited DC generators the relevant equations and relationships between the
important parameters are listed below:
Vt = Ea – IaRa Equation 6
∴ Ea = Vt + (IaRa) Equation 7
Ea = kɸω = k1ɸN Equation 8
Equation 8 shows that the generated voltage (Ea) is proportional to the speed (ω) of
rotation of the motor.
P a g e 20 | 56
∴ kɸN = Vt + (Ia*Ra) Equation 9
Te = k ɸ Ia Equation 10
Ia = 𝑇𝑒
𝑘 ∗ ɸ Equation 11
∴ k1ɸN = Vt + 𝑇𝑒
𝑘 ∗ ɸ Ra Equation 12
kk1ɸ2N = k ɸ Vt + Te Ra Equation 13
Where
Te = 𝑘𝑘1ɸ2
𝑅𝑎 N -
𝑘ɸ
𝑅𝑎 Vt Equation 14
Note: Vt = terminal voltage, Ea is the generated voltage, Ra = resistance in the armature path
or circuit. ω and N denotes the motor speed in rad/s and rpm respectively. The field
current of a series generator is the same as the load current, therefore the air gap flux and
the generated voltage varies with different load/load currents.
3.2. Motor Electrical Parameters and Equivalent Circuit
The IEEE std 112 [2] is a widely accepted test procedure for both the wound rotor and
squirrel cage induction machines. There are four different methods for determining the
per-phase equivalent circuit parameters. Methods 1-3 include the combination of the DC
test, No-Load and Locked Rotor test at reduced frequency whilst Method 4 uses full
frequency for the locked rotor test.
The steady state, per-phase equivalent circuit with parameters referred back to the stator
is shown in Figure 3 below. Whilst there are many methods to conduct the tests (as shown
in the literature review), method 4 was followed. A Matlab program was adapted from the
M-file discussed in chapter 6.6 of Chapman [5] to generate the motors electrical
parameters and to plot the T-S curve. An example of the program is shown in Appendix 1.

P a g e 21 | 56
R2
R1 X1
Z1 Rfe XM
Ife IM
R2 (1-s)/s
Z2V1 V2
X2
I1 I2
Figure 3: Simplified equivalent per phase circuit, rotor referred to stator/primary side.
The relevant parameters in figure 4 are as follows:
V1 is phase voltage, in V
V2 is rotor phase voltage referred to the stator, in V
I1 is line or stator current, in A
I2 is rotor current referred to stator, in A
Im is magnetizing current, in A
Ife is core loss current, in A
m is number of phases
R1 is stator resistance, in ohms
R2 is rotor resistance referred to stator, in ohms
Rfe is core loss resistance, in ohms
X1 is stator leakage reactance, in ohms
X2 is rotor leakage reactance referred to stator, in ohms
XM is magnetizing reactance, in ohms
P a g e 22 | 56
3.2.1 The DC Test
Determining the winding resistance is often the first test performed according to 3.2.2 of
IEEE 112 [2]. The significance of the test is for accurately determining the I2R losses in the
stator windings.
The DC test is used to determine the resistance of the per-phase stator windings (R1). A DC
voltage (adjusted to give approximately the full load current to the windings) is applied to
each of the stator winding terminals via the Lab-Volt variable supply. Resistance is a
function of temperature, therefore it is critical that the current is at the rated value and
time has to be factored in to allow the windings to warm up to normal operating
temperature.
Readings are taken of the DC voltage (VDC) and DC current (IDC) using the PM6000 power
analyser. The resistance can then be calculated using Ohms Law.
3.2.2. The No-Load Test
The No-Load test results are used to find the magnetising reactance and no-load losses
associated with the motor. Power consumed by an induction motor under no-load
conditions is equal to the sum of the I2R losses in the stator and friction, windage and core
losses.
The test is conducted at rated frequency and voltage and readings of the applied voltage,
current and input power were taken. The applied frequency and the THD (%) were
simultaneously recorded using the power analyser.
3.2.3. The Locked Rotor Test
The locked rotor test gives information on the leakage impedances and the starting torque.
For this test the rotor is completely stopped from moving by mechanical means and the
voltage manipulated so that the current applied to the windings is equal to the rated
current.
The method proposed by IEEE std 112 requires the locked rotor test to be performed at a
frequency that is <25% of the rated frequency and with the voltage adjusted to give rated
current. Method 4 (5.9.1 of the IEEE std 112) can be employed for the locked rotor test.
The test is conducted with reduced voltage and at rated current and frequency and
P a g e 23 | 56
readings of the voltage, current and power input as per 5.9.2.1 of IEEE std 112 are taken for
all three phases.
Applying rated voltage and frequency with the rotor locked will give results for a slip which
is at unity and the torque under normal (direct on line) starting conditions can be found.
The torque-speed characteristic curve for normal operating conditions requires test
conditions to simulate the normal operating current and slip.
To determine the torque under normal operating conditions the voltage is reduced so that
the current is at the rated current for the motor and the frequency is reduced. The idea is
to conduct the test at close to normal operating conditions (with rated current and with a
slip that is close to the slip found at normal operating conditions or ~3%).
The rotor leakage reactance is related to the frequency and therefore to simulate low slip
conditions the frequency applied to the stator windings is reduced. To obtain results for
normal operating conditions IEEE std 112 recommends that the frequency is reduced with a
maximum of 25% of the rated frequency.
For motors with ratings up to 25 HP the effect of frequency is small enough that it can be
ignored and the test conducted at rated frequency [7]. The Lab-Volt motors being tested
have a rating of 175W or 0.23hp and therefore it would be reasonable to assume that the
tests can be conducted at the rated frequency. Note that the leakage reactance will still be
significantly affected by saturation and therefore the test for the normal operating
characteristic must be conducted with a reduced voltage to give approximately the rated
current.
In order to conduct the test the motor is connected to a variable voltage and frequency
supply and the applied voltage is quickly adjusted to supply approximately rated current to
the motor terminals. The input power, voltage and current per phase are measured.
To determine the impedance of the wound rotor machine the voltage is increased until
approximately rated current is applied to the machine terminals. The rotor is then rotated
slowly and the minimum/maximum current value is recorded for a complete revolution.
The average current is calculated and when conducting the test the rotor is locked in the
position where the average value of current is obtained. For the SCIM the impedance of the
motor (unlike the WRIM) is relatively the same for all positions and therefore the rotor
position can be ignored.
P a g e 24 | 56
Method 4 (5.9.1 of [2]) can be employed for the locked rotor test. The test is conducted
with reduced voltage and at the motor’s rated current and frequency. Readings of the
voltage, current and power input as per 5.9.2.1 of IEEE std 112 [2] are taken for all three
phases.
Determining the average current position for the rotor proved problematic in practice as
the variations in current readings were in the same order as the variation due to the
temperature rise in the windings. Once the correct position was identified both frequency
tests were conducted.
For the SCIM the rotor is symmetrical in construction and the impedance of the motor
(unlike the WRIM) is relatively the same for all positions and therefore the rotor position
can be ignored.
3.3. The Equivalent Circuit of an Induction Motor
Once the electrical circuit parameters have been found the model can be used to
determine the important characteristics such as the starting torque, peak/breakdown
torque, pull-up torque and a motors response to loading.
Single phase, lumped parameter models are commonly used to model induction machines,
however distributed models do exist. The accepted (per phase) equivalent model of an AC
induction motor includes the stator and rotor windings and is shown in Figure 3. All rotor
parameters are referred back to the stator.
Motor electrical parameters are sometimes provided from the manufacturer or can be
found by doing standard tests on the motor. As previously discussed the three tests that
are commonly used to determine the parameters are the DC, No-Load and Locked Rotor
test.
IEEE standard 112 [2] details the tests and provides internationally recognized test methods
that can be used for reproducible results. The IEEE standard can be separated into two test
categories:
1. Direct measurement method including test Method A (brake), test method B
(dynamometer), test method C (back to back equivalent motors).
2. Losses included. Method E with loss segregation and F or F1 – equivalent circuit
where tests under load are not made.
P a g e 25 | 56
Note that NEMA MG1 follows method B of IEEE std 112 with stray load loss treatment.
Using the IEEE 112 method to determine the equivalent circuit parameters is advantageous
because (once the equivalent circuit has been determined) the performance and machine’s
torque can be determined for any speed of the motor.
By conducting the locked rotor test at reduced frequency using a VSD supply and with the
rated (50Hz) Lab-Volt supply, an evaluation into whether the frequency has any effect on
the locked rotor test can be determined.
The motor’s induced torque is given by the following equation:
𝜏 =3∗𝑉𝑡ℎ
2 ∗𝑅2𝑠
𝜔𝑠𝑦𝑛𝑐∗((𝑅𝑡ℎ+𝑅2𝑠
)2
+(𝑋𝑡ℎ+𝑋2)2) Equation 15
The meaning of the parameters found in Equation 15 are as follows:
τ = the induced torque
Vth = Thevenin voltage = Vphase*(Xm/sqrt(R12+(X1+Xm)2))
Rth = Thevenin Resistance of equivalent circuit
Xth = Thevenin Reactance of equivalent circuit
ωsync = synchronous speed
s = slip of the machine
X2 = Rotor Reactance
3.4. Variable Speed Drive - VSD
In order to conduct the locked rotor test with a reduced frequency an SEW Eurodrive,
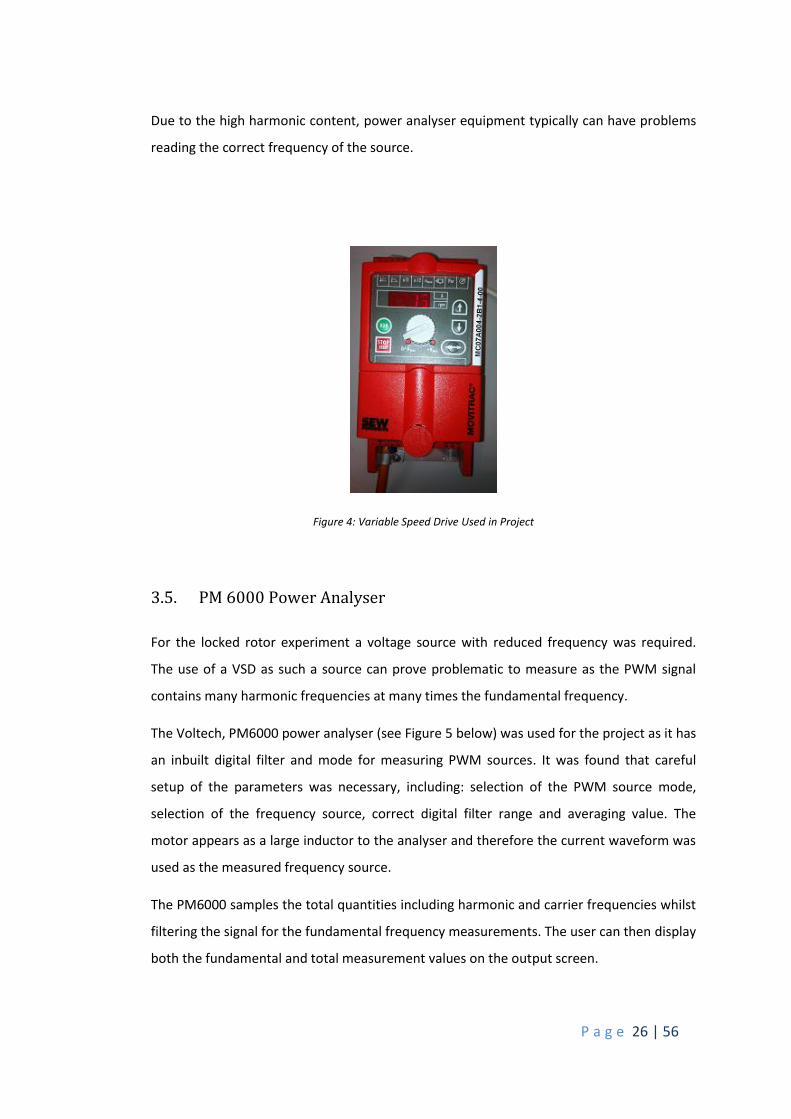
Movitrac 07, VSD was employed (shown in figure 4). The VSD is programmable for the
motor size, rated voltage, speed and frequency and has an inbuilt program to vary the
frequency and voltage proportionally in order to adjust the rpm of the motor.
The VSD takes a single phase input and outputs a three phase, pulse width modulated
signal at the required frequency and voltage. By nature PWM sources output many high
frequency waveforms at many times the fundamental frequency. These harmonics do not
contribute to useful work done by the motor but do add to the I2R (and therefore heating)
losses within the motor.
P a g e 26 | 56
Due to the high harmonic content, power analyser equipment typically can have problems
reading the correct frequency of the source.
Figure 4: Variable Speed Drive Used in Project
3.5. PM 6000 Power Analyser
For the locked rotor experiment a voltage source with reduced frequency was required.
The use of a VSD as such a source can prove problematic to measure as the PWM signal
contains many harmonic frequencies at many times the fundamental frequency.
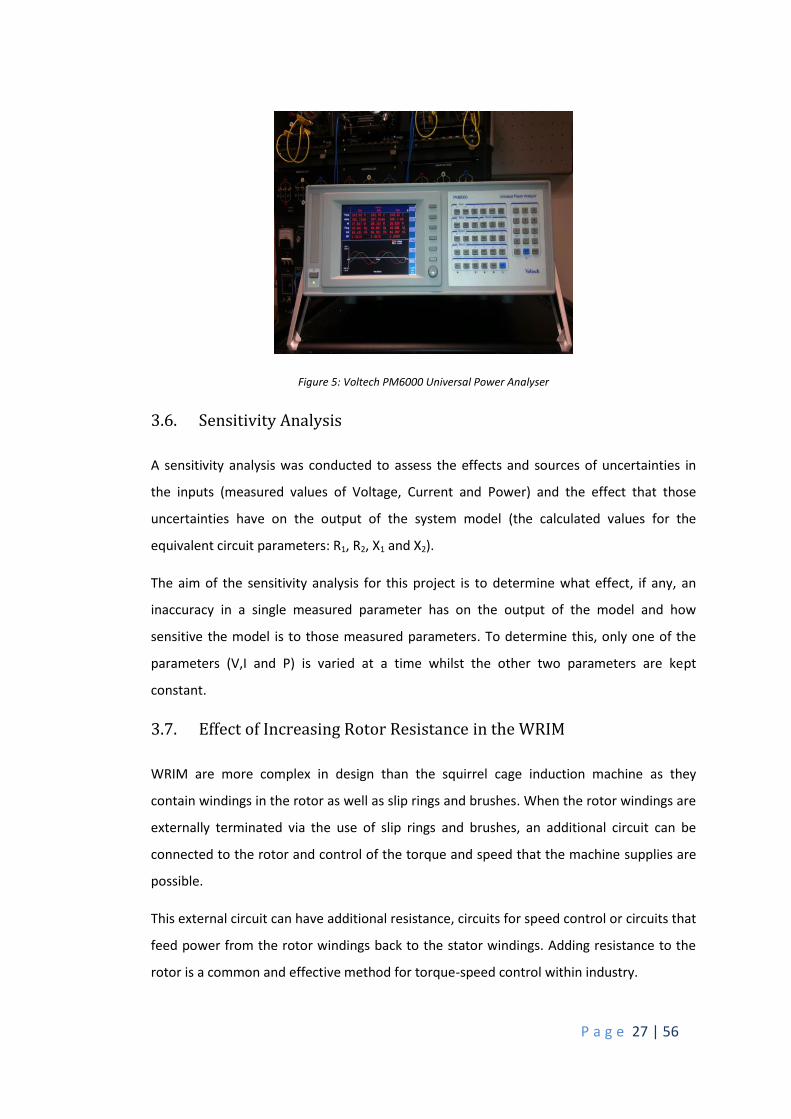
The Voltech, PM6000 power analyser (see Figure 5 below) was used for the project as it has
an inbuilt digital filter and mode for measuring PWM sources. It was found that careful
setup of the parameters was necessary, including: selection of the PWM source mode,
selection of the frequency source, correct digital filter range and averaging value. The
motor appears as a large inductor to the analyser and therefore the current waveform was
used as the measured frequency source.
The PM6000 samples the total quantities including harmonic and carrier frequencies whilst
filtering the signal for the fundamental frequency measurements. The user can then display
both the fundamental and total measurement values on the output screen.
P a g e 27 | 56
Figure 5: Voltech PM6000 Universal Power Analyser
3.6. Sensitivity Analysis
A sensitivity analysis was conducted to assess the effects and sources of uncertainties in
the inputs (measured values of Voltage, Current and Power) and the effect that those
uncertainties have on the output of the system model (the calculated values for the
equivalent circuit parameters: R1, R2, X1 and X2).
The aim of the sensitivity analysis for this project is to determine what effect, if any, an
inaccuracy in a single measured parameter has on the output of the model and how
sensitive the model is to those measured parameters. To determine this, only one of the
parameters (V,I and P) is varied at a time whilst the other two parameters are kept
constant.
3.7. Effect of Increasing Rotor Resistance in the WRIM
WRIM are more complex in design than the squirrel cage induction machine as they
contain windings in the rotor as well as slip rings and brushes. When the rotor windings are
externally terminated via the use of slip rings and brushes, an additional circuit can be
connected to the rotor and control of the torque and speed that the machine supplies are
possible.
This external circuit can have additional resistance, circuits for speed control or circuits that
feed power from the rotor windings back to the stator windings. Adding resistance to the
rotor is a common and effective method for torque-speed control within industry.
P a g e 28 | 56
The torque speed curve is altered so that the maximum torque is available at reduced
speeds and sufficient resistance added to the rotor windings can increase the starting
torque of the machine to a value that equals the breakdown torque available for the
machine. Once the machine is started the external resistance can then be removed so that
the motor runs with maximum efficiency.
External resistance is particularly useful for applications where high starting torques are
required. For instance when starting fans, grinding mills or situations where the motor
must start under full load. The resistance can then be switched out (rotor windings short
circuited) so that the motor runs at full speed and with greater efficiency or even varied in
order to control the acceleration and/or speed.
The rotor windings on the Lab-Volt WRIM are configured with one end of the windings
short circuited to form a star configuration. The other end of the rotor windings are
terminated on the face plate of the motor via means of brushes and slip rings on the rotor.
In this experiment a 3 phase Lab-Volt rheostat was connected to the slip rings of the rotor
in order to determine the effect of increasing the rotor resistance. The resistance of the
rotor was varied and readings of the stator current, voltage, power, and THD were taken.
3.8. Interpolation of Torque Speed Curve Using 3 Measured Points
Calculation of the equivalent circuit elements and thereby the torque-speed curve using
three measured points on the torque speed curve was an objective of the project. Davey
[22] proposes one method in the paper “Predicting Induction Motor Parameters” which
uses the peak torque, frequency at peak torque and induced stator voltage at peak torque
to numerically predict the equivalent circuit. These values can be found using a boundary
element method explained in the article “Rotating Field Analysis Using Boundary Element
Methods” [23].
Once the equivalent circuit parameters have been found, the torque-speed characteristic
can be determined for any value of slip. The approach seeks to define the motor based
upon the coefficient of coupling between the rotor and stator (k2), the stator inductance
(Ls) and the frequency at peak voltage.

P a g e 29 | 56
The equivalent circuit parameters can then be defined in terms of the stator-rotor coupling
coefficient and the torque in terms of the applied voltage (Vs). Nelatury [24] expanded
upon this work by generalizing the three parameters at peak torque into any 3 arbitrary
points on the torque-speed curve (excluding the point equal to synchronous speed).
P a g e 30 | 56
4. Results Section
Experimental results of the test work and simulations are detailed in this chapter using
tables and figures where appropriate.
4.1. Experimental Results – Electrodynamometer and DC Generator
The Lab-Volt Electrodynamometer was coupled to the SCIM and WRIM via a ribbed belt
and the loading on the prime movers was increased by gradually increasing the field
current of the dynamometer. Readings of the torque were taken using the measurement
display on the faceplate of the dynamometer from near synchronous speed to the
minimum speed possible before the motor stalled out.
The electrodynamometer was not able to take measurements beyond the stable (normal
operating) region of the curve as a constant torque device is required. Attempts were made
to measure the starting torque with the electrodynamometer, however stalling either
machine was not possible.
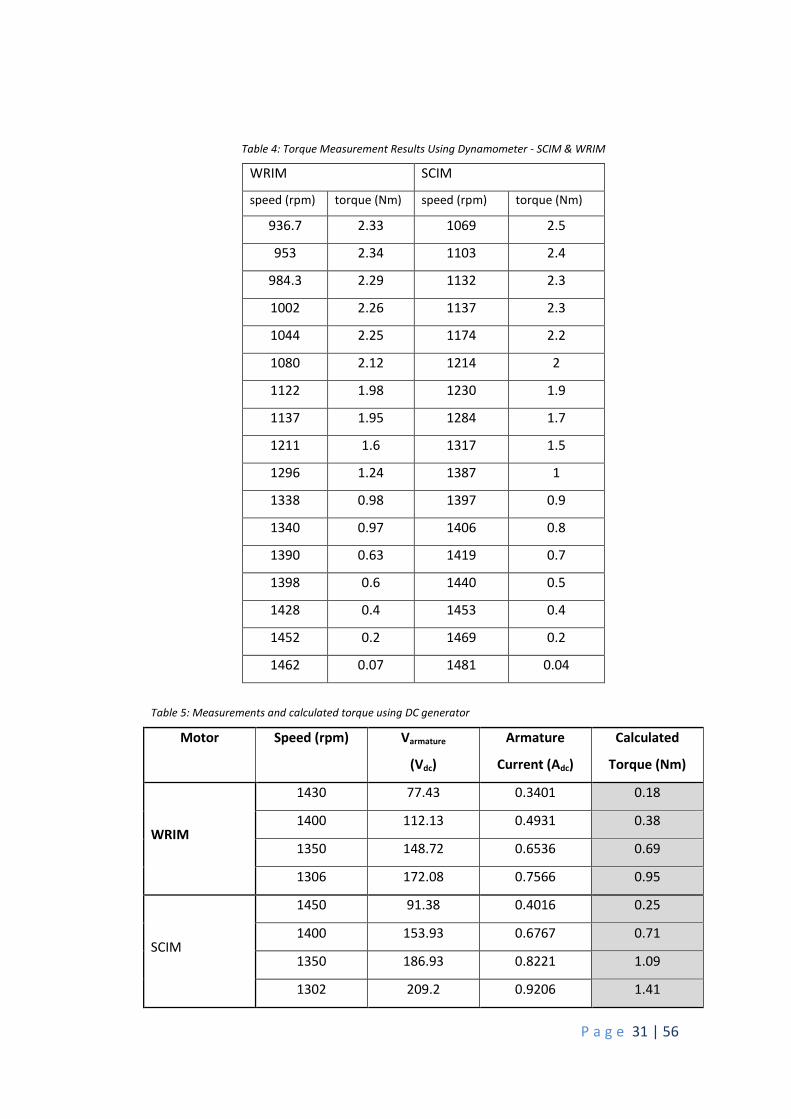
The results obtained with the dynamometer for both the WRIM and SCIM are found in
Table 4 below and graphically compared with the results from the DC generator test in
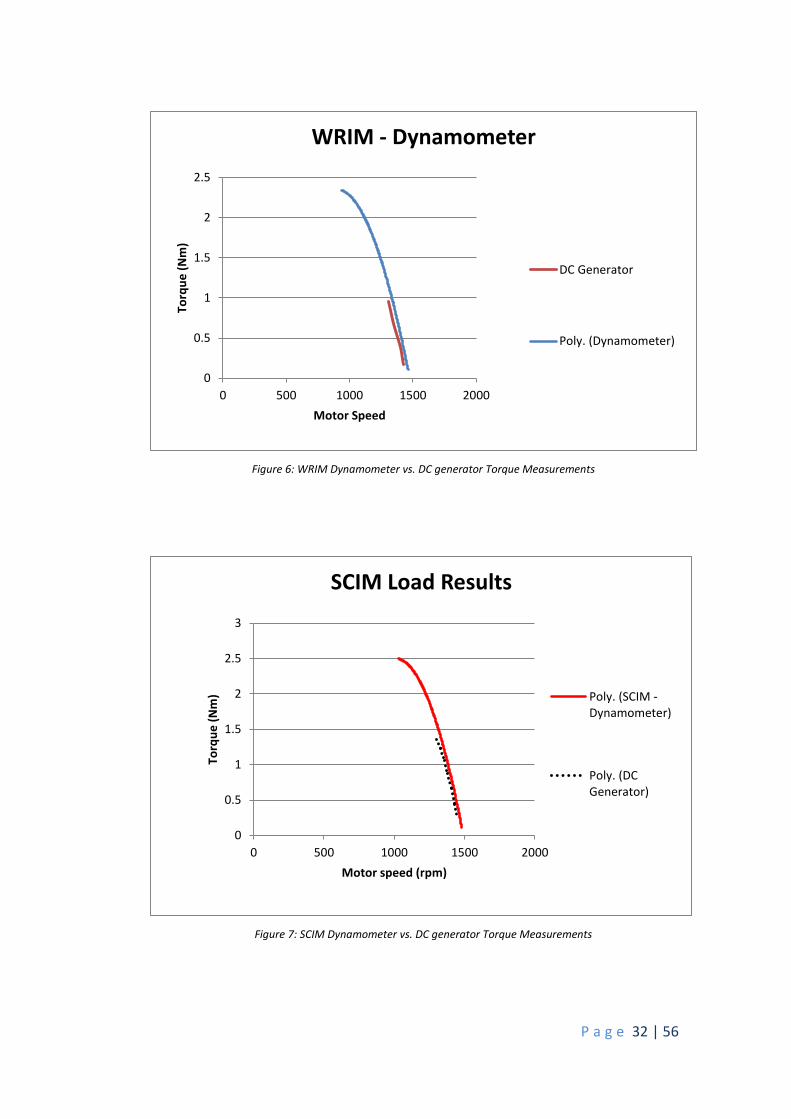
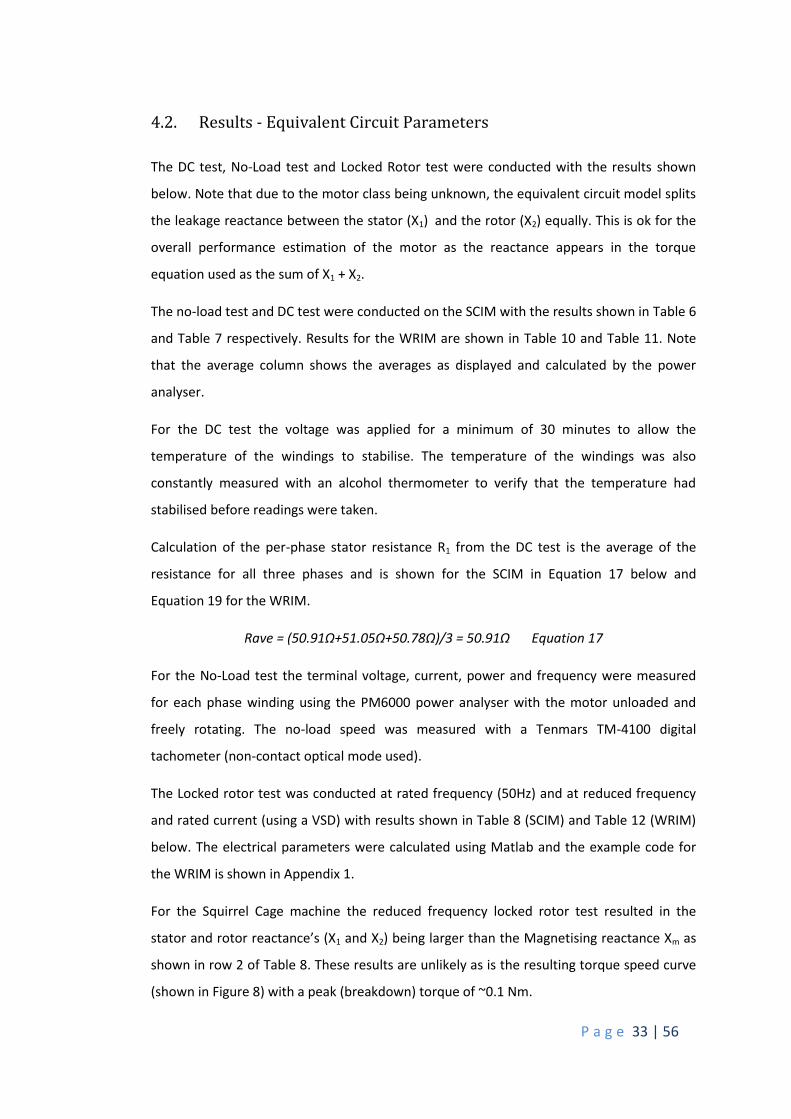
Figure 6 and Figure 7 below.
The DC generator was coupled with both induction motors and the speed, armature
voltage and armature current were measured using an optical tachometer and the power
analyser respectively. The torque can be determined using the following equation:
Ʈ = P /ω Equation 16
Where: Ʈ=torque induced (Nm) and ω = speed and is in rad/s. P = power (W) = V*I
The results of the measurements are shown in Table 4 and Table 5 below and graphically
compared with the Electrodynamometer in Figure 6 and Figure 7.
P a g e 31 | 56
Table 4: Torque Measurement Results Using Dynamometer - SCIM & WRIM
WRIM SCIM
speed (rpm) torque (Nm) speed (rpm) torque (Nm)
936.7 2.33 1069 2.5
953 2.34 1103 2.4
984.3 2.29 1132 2.3
1002 2.26 1137 2.3
1044 2.25 1174 2.2
1080 2.12 1214 2
1122 1.98 1230 1.9
1137 1.95 1284 1.7
1211 1.6 1317 1.5
1296 1.24 1387 1
1338 0.98 1397 0.9
1340 0.97 1406 0.8
1390 0.63 1419 0.7
1398 0.6 1440 0.5
1428 0.4 1453 0.4
1452 0.2 1469 0.2
1462 0.07 1481 0.04
Table 5: Measurements and calculated torque using DC generator
Motor Speed (rpm) Varmature
(Vdc)
Armature
Current (Adc)
Calculated
Torque (Nm)
WRIM
1430 77.43 0.3401 0.18
1400 112.13 0.4931 0.38
1350 148.72 0.6536 0.69
1306 172.08 0.7566 0.95
SCIM
1450 91.38 0.4016 0.25
1400 153.93 0.6767 0.71
1350 186.93 0.8221 1.09
1302 209.2 0.9206 1.41
P a g e 32 | 56
Figure 6: WRIM Dynamometer vs. DC generator Torque Measurements
Figure 7: SCIM Dynamometer vs. DC generator Torque Measurements
0
0.5
1
1.5
2
2.5
0 500 1000 1500 2000
Torq
ue
(N
m)
Motor Speed
WRIM - Dynamometer
DC Generator
Poly. (Dynamometer)
0
0.5
1
1.5
2
2.5
3
0 500 1000 1500 2000
Torq
ue
(N
m)
Motor speed (rpm)
SCIM Load Results
Poly. (SCIM -Dynamometer)
Poly. (DCGenerator)
P a g e 33 | 56
4.2. Results - Equivalent Circuit Parameters
The DC test, No-Load test and Locked Rotor test were conducted with the results shown
below. Note that due to the motor class being unknown, the equivalent circuit model splits
the leakage reactance between the stator (X1) and the rotor (X2) equally. This is ok for the
overall performance estimation of the motor as the reactance appears in the torque
equation used as the sum of X1 + X2.
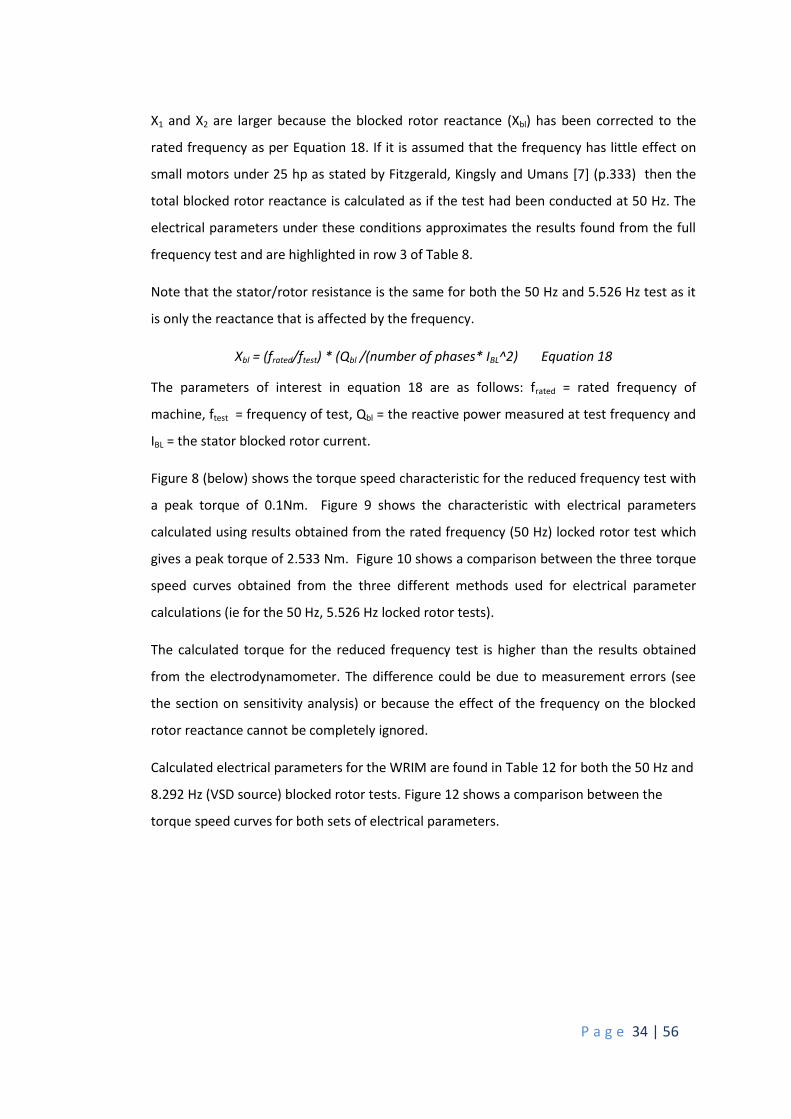
The no-load test and DC test were conducted on the SCIM with the results shown in Table 6
and Table 7 respectively. Results for the WRIM are shown in Table 10 and Table 11. Note
that the average column shows the averages as displayed and calculated by the power
analyser.
For the DC test the voltage was applied for a minimum of 30 minutes to allow the
temperature of the windings to stabilise. The temperature of the windings was also
constantly measured with an alcohol thermometer to verify that the temperature had
stabilised before readings were taken.
Calculation of the per-phase stator resistance R1 from the DC test is the average of the
resistance for all three phases and is shown for the SCIM in Equation 17 below and
Equation 19 for the WRIM.
Rave = (50.91Ω+51.05Ω+50.78Ω)/3 = 50.91Ω Equation 17
For the No-Load test the terminal voltage, current, power and frequency were measured
for each phase winding using the PM6000 power analyser with the motor unloaded and
freely rotating. The no-load speed was measured with a Tenmars TM-4100 digital
tachometer (non-contact optical mode used).
The Locked rotor test was conducted at rated frequency (50Hz) and at reduced frequency
and rated current (using a VSD) with results shown in Table 8 (SCIM) and Table 12 (WRIM)
below. The electrical parameters were calculated using Matlab and the example code for
the WRIM is shown in Appendix 1.
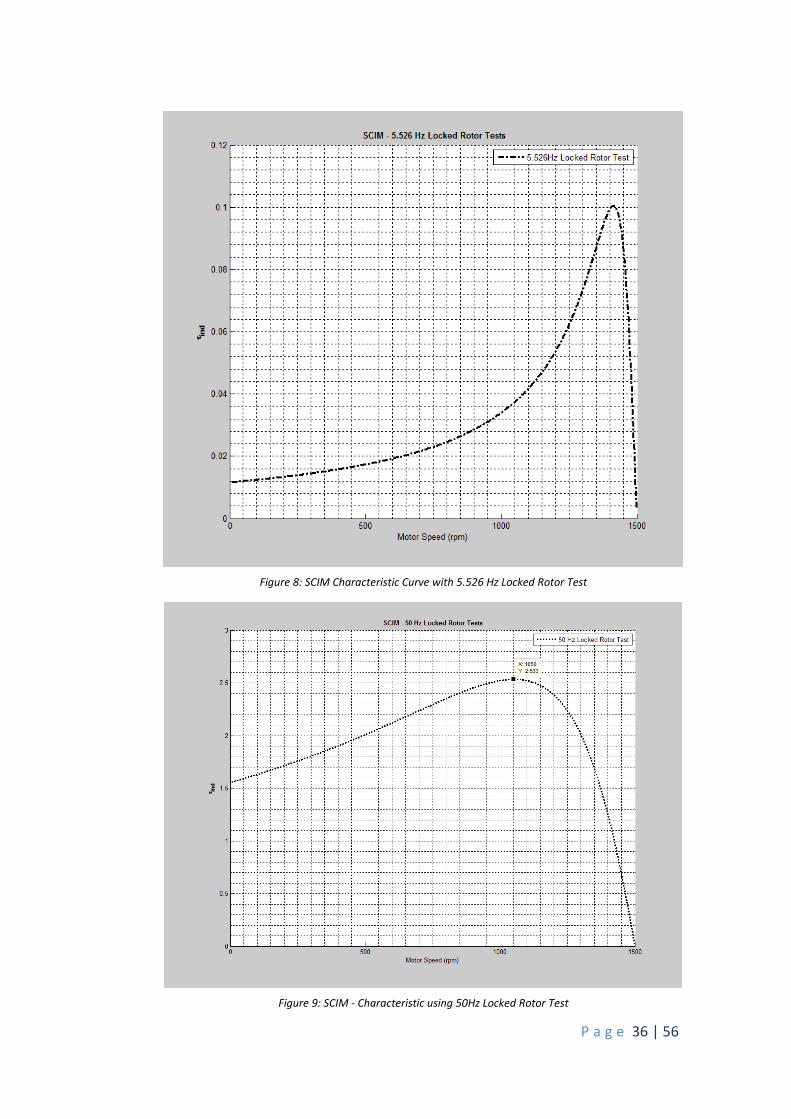
For the Squirrel Cage machine the reduced frequency locked rotor test resulted in the
stator and rotor reactance’s (X1 and X2) being larger than the Magnetising reactance Xm as
shown in row 2 of Table 8. These results are unlikely as is the resulting torque speed curve
(shown in Figure 8) with a peak (breakdown) torque of ~0.1 Nm.
P a g e 34 | 56
X1 and X2 are larger because the blocked rotor reactance (Xbl) has been corrected to the
rated frequency as per Equation 18. If it is assumed that the frequency has little effect on
small motors under 25 hp as stated by Fitzgerald, Kingsly and Umans [7] (p.333) then the
total blocked rotor reactance is calculated as if the test had been conducted at 50 Hz. The
electrical parameters under these conditions approximates the results found from the full
frequency test and are highlighted in row 3 of Table 8.
Note that the stator/rotor resistance is the same for both the 50 Hz and 5.526 Hz test as it
is only the reactance that is affected by the frequency.
Xbl = (frated/ftest) * (Qbl /(number of phases* IBL^2) Equation 18
The parameters of interest in equation 18 are as follows: frated = rated frequency of
machine, ftest = frequency of test, Qbl = the reactive power measured at test frequency and
IBL = the stator blocked rotor current.
Figure 8 (below) shows the torque speed characteristic for the reduced frequency test with
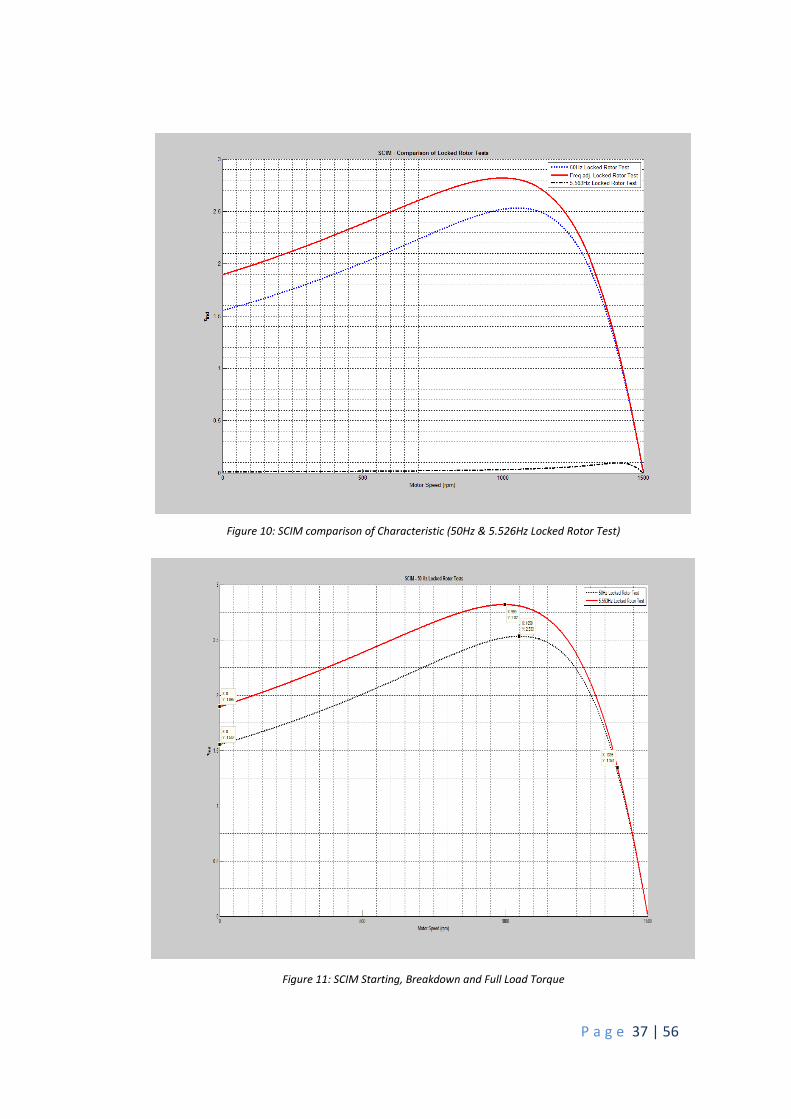
a peak torque of 0.1Nm. Figure 9 shows the characteristic with electrical parameters
calculated using results obtained from the rated frequency (50 Hz) locked rotor test which
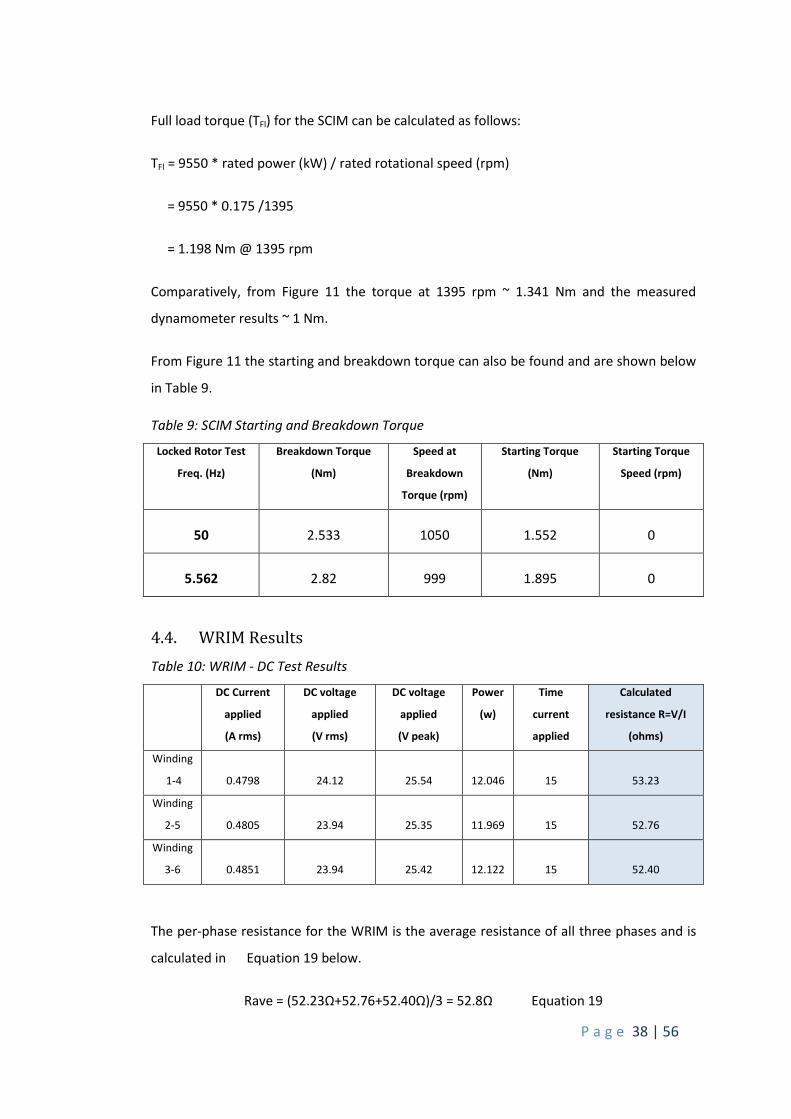
gives a peak torque of 2.533 Nm. Figure 10 shows a comparison between the three torque
speed curves obtained from the three different methods used for electrical parameter
calculations (ie for the 50 Hz, 5.526 Hz locked rotor tests).
The calculated torque for the reduced frequency test is higher than the results obtained
from the electrodynamometer. The difference could be due to measurement errors (see
the section on sensitivity analysis) or because the effect of the frequency on the blocked
rotor reactance cannot be completely ignored.
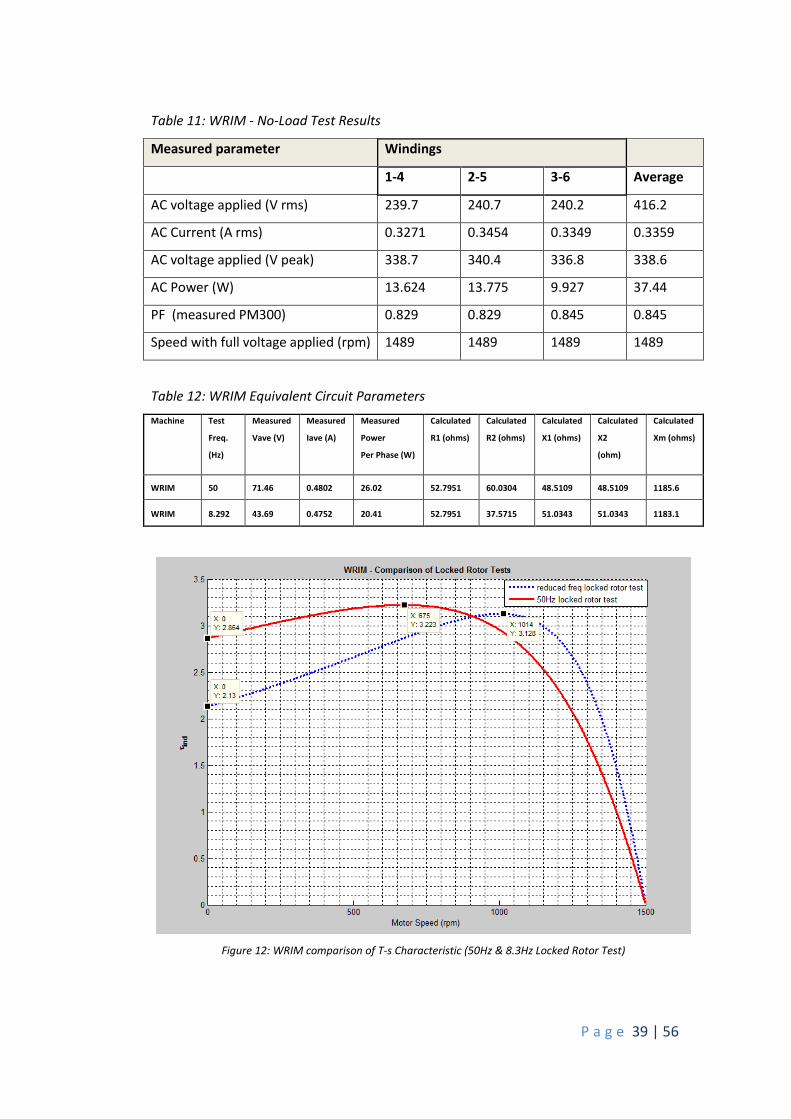
Calculated electrical parameters for the WRIM are found in Table 12 for both the 50 Hz and
8.292 Hz (VSD source) blocked rotor tests. Figure 12 shows a comparison between the
torque speed curves for both sets of electrical parameters.
P a g e 35 | 56
4.3. SCIM Results
Table 6: SCIM - No-Load test results
Measured parameter
Winding # Average
1 2 3
AC voltage applied (V rms) 239.7 240.5 240.1 416.1 (Vll)
AC Current (A rms) 0.2789 0.2974 0.2875 0.2878
AC Power (W) 10.618 10.66 7.032 28.16
Freq. (Hz) 49.99 49.99 49.99 49.99
Speed with full voltage applied (rpm) 1497 1497 1497 1497
Table 7: SCIM - DC test results
Stator Winding DC voltage
applied
(Vrms)
DC Current
(Arms)
Power
(W)
Time current
applied
(min.)
Calculated resistance
R=V/I (ohms)
Winding
1-4 23.51 0.4618 10.61 30 50.91
Winding
2-5 23.55 0.4613 10.654 30 51.05
Winding
3-6 23.37 0.4602 10.505 30 50.78
Table 8: SCIM Equivalent Circuit Parameters
Machine Test
Freq. (Hz)
Measured
Vave (V)
Measured
Iave (A)
Measured
Power
Per Phase (W)
Calculated
R1 (ohms)
Calculated
R2 (ohms)
Calculated
X1 (ohms)
Calculated
X2
(ohm)
Calculated
Xm (ohms)
SCIM 50 74.7 0.4563 19.23 50.9145 41.4443 67.5836 67.5836 759.4
SCIM 5.526 68.76 0.4618 19.67 50.9145 41.3188 525.3154 525.3154 301.7025
SCIM 5.562@50 68.76 0.4618 19.67 50.9145 41.3188 58.4392 58.4392 1382.9
P a g e 36 | 56
Figure 8: SCIM Characteristic Curve with 5.526 Hz Locked Rotor Test
Figure 9: SCIM - Characteristic using 50Hz Locked Rotor Test
P a g e 37 | 56
Figure 10: SCIM comparison of Characteristic (50Hz & 5.526Hz Locked Rotor Test)
Figure 11: SCIM Starting, Breakdown and Full Load Torque
P a g e 38 | 56
Full load torque (TFl) for the SCIM can be calculated as follows:
TFl = 9550 * rated power (kW) / rated rotational speed (rpm)
= 9550 * 0.175 /1395
= 1.198 Nm @ 1395 rpm
Comparatively, from Figure 11 the torque at 1395 rpm ~ 1.341 Nm and the measured
dynamometer results ~ 1 Nm.
From Figure 11 the starting and breakdown torque can also be found and are shown below
in Table 9.
Table 9: SCIM Starting and Breakdown Torque
Locked Rotor Test
Freq. (Hz)
Breakdown Torque
(Nm)
Speed at
Breakdown
Torque (rpm)
Starting Torque
(Nm)
Starting Torque
Speed (rpm)
50 2.533 1050 1.552 0
5.562 2.82 999 1.895 0
4.4. WRIM Results
Table 10: WRIM - DC Test Results
DC Current
applied
(A rms)
DC voltage
applied
(V rms)
DC voltage
applied
(V peak)
Power
(w)
Time
current
applied
Calculated
resistance R=V/I
(ohms)
Winding
1-4 0.4798 24.12 25.54 12.046 15 53.23
Winding
2-5 0.4805 23.94 25.35 11.969 15 52.76
Winding
3-6 0.4851 23.94 25.42 12.122 15 52.40
The per-phase resistance for the WRIM is the average resistance of all three phases and is
calculated in Equation 19 below.
Rave = (52.23Ω+52.76+52.40Ω)/3 = 52.8Ω Equation 19
P a g e 39 | 56
Table 11: WRIM - No-Load Test Results
Measured parameter Windings
1-4 2-5 3-6 Average
AC voltage applied (V rms) 239.7 240.7 240.2 416.2
AC Current (A rms) 0.3271 0.3454 0.3349 0.3359
AC voltage applied (V peak) 338.7 340.4 336.8 338.6
AC Power (W) 13.624 13.775 9.927 37.44
PF (measured PM300) 0.829 0.829 0.845 0.845
Speed with full voltage applied (rpm) 1489 1489 1489 1489
Table 12: WRIM Equivalent Circuit Parameters
Machine Test
Freq.
(Hz)
Measured
Vave (V)
Measured
Iave (A)
Measured
Power
Per Phase (W)
Calculated
R1 (ohms)
Calculated
R2 (ohms)
Calculated
X1 (ohms)
Calculated
X2
(ohm)
Calculated
Xm (ohms)
WRIM 50 71.46 0.4802 26.02 52.7951 60.0304 48.5109 48.5109 1185.6
WRIM 8.292 43.69 0.4752 20.41 52.7951 37.5715 51.0343 51.0343 1183.1
Figure 12: WRIM comparison of T-s Characteristic (50Hz & 8.3Hz Locked Rotor Test)
P a g e 40 | 56
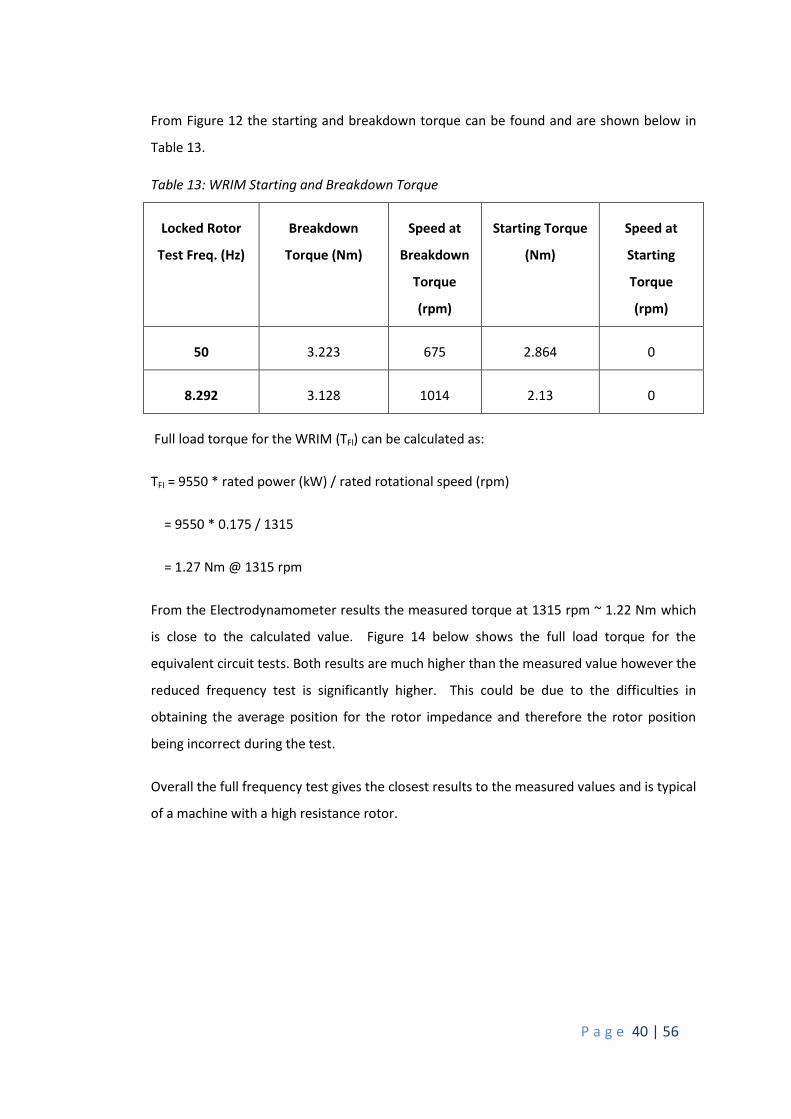
From Figure 12 the starting and breakdown torque can be found and are shown below in
Table 13.
Table 13: WRIM Starting and Breakdown Torque
Locked Rotor
Test Freq. (Hz)
Breakdown
Torque (Nm)
Speed at
Breakdown
Torque
(rpm)
Starting Torque
(Nm)
Speed at
Starting
Torque
(rpm)
50 3.223 675 2.864 0
8.292 3.128 1014 2.13 0
Full load torque for the WRIM (TFl) can be calculated as:
TFl = 9550 * rated power (kW) / rated rotational speed (rpm)
= 9550 * 0.175 / 1315
= 1.27 Nm @ 1315 rpm
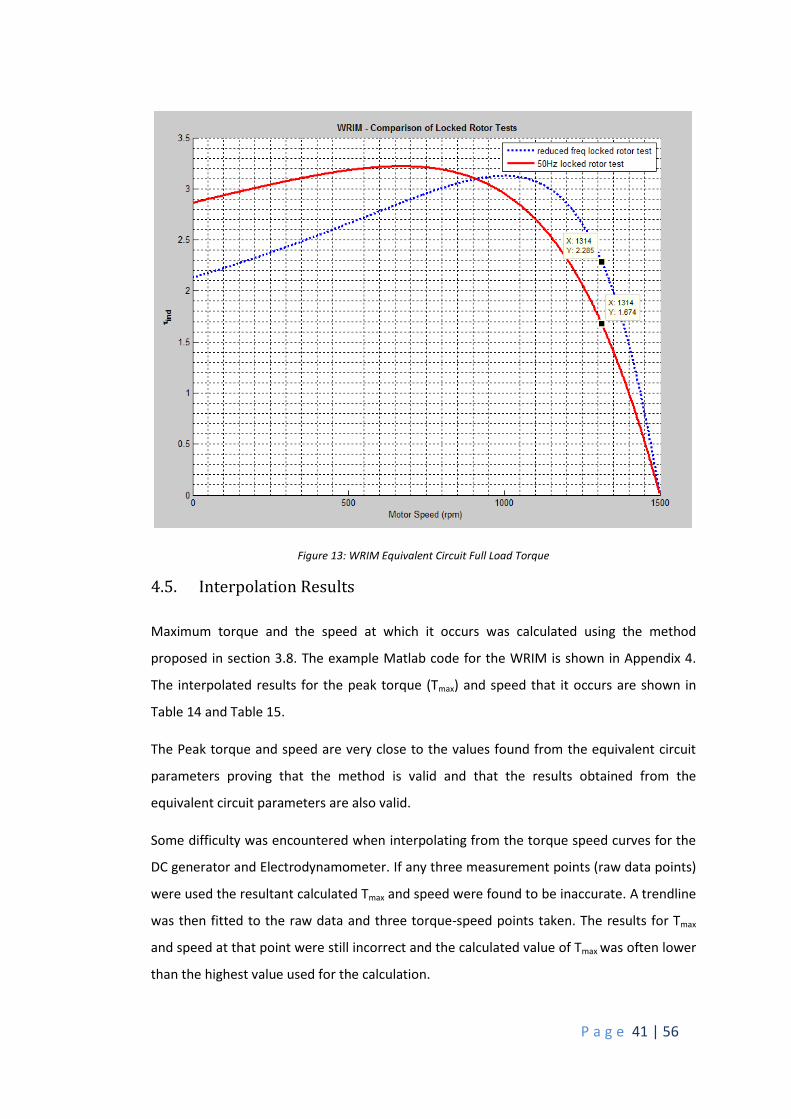
From the Electrodynamometer results the measured torque at 1315 rpm ~ 1.22 Nm which
is close to the calculated value. Figure 14 below shows the full load torque for the
equivalent circuit tests. Both results are much higher than the measured value however the
reduced frequency test is significantly higher. This could be due to the difficulties in
obtaining the average position for the rotor impedance and therefore the rotor position
being incorrect during the test.
Overall the full frequency test gives the closest results to the measured values and is typical
of a machine with a high resistance rotor.
P a g e 41 | 56
Figure 13: WRIM Equivalent Circuit Full Load Torque
4.5. Interpolation Results
Maximum torque and the speed at which it occurs was calculated using the method
proposed in section 3.8. The example Matlab code for the WRIM is shown in Appendix 4.
The interpolated results for the peak torque (Tmax) and speed that it occurs are shown in
Table 14 and Table 15.
The Peak torque and speed are very close to the values found from the equivalent circuit
parameters proving that the method is valid and that the results obtained from the
equivalent circuit parameters are also valid.
Some difficulty was encountered when interpolating from the torque speed curves for the
DC generator and Electrodynamometer. If any three measurement points (raw data points)
were used the resultant calculated Tmax and speed were found to be inaccurate. A trendline
was then fitted to the raw data and three torque-speed points taken. The results for Tmax
and speed at that point were still incorrect and the calculated value of Tmax was often lower
than the highest value used for the calculation.
P a g e 42 | 56
For example, Point 1 corresponded to 1135rpm and 2Nm for the WRIM
electrodynamometer. The calculated result gave Tmax at 1.6055 Nm and 1359.6 rpm. Whilst
this is on the torque speed curve the initial point (point 1) is obviously higher than the
calculated Tmax. This indicates that the method is very sensitive to inaccuracy in the
measured points and further investigation is needed.
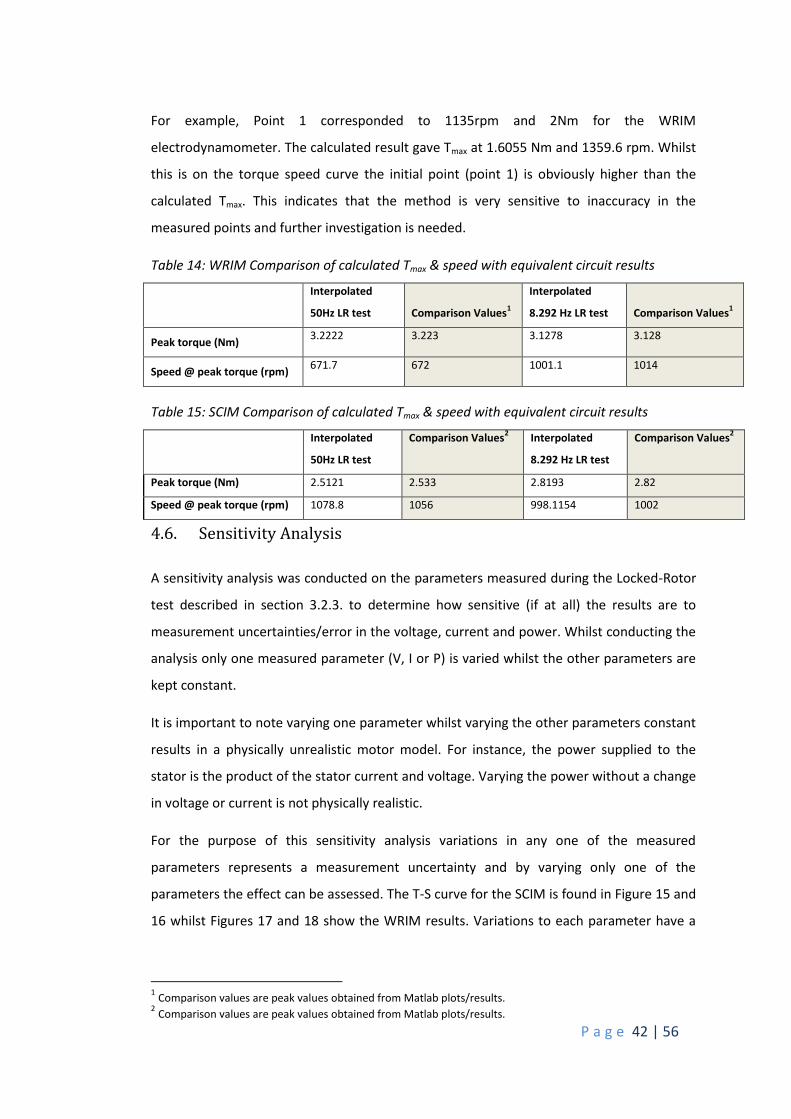
Table 14: WRIM Comparison of calculated Tmax & speed with equivalent circuit results
Interpolated
50Hz LR test Comparison Values1
Interpolated
8.292 Hz LR test Comparison Values1
Peak torque (Nm) 3.2222 3.223 3.1278 3.128
Speed @ peak torque (rpm) 671.7 672 1001.1 1014
Table 15: SCIM Comparison of calculated Tmax & speed with equivalent circuit results
Interpolated
50Hz LR test
Comparison Values2 Interpolated
8.292 Hz LR test
Comparison Values2
Peak torque (Nm) 2.5121 2.533 2.8193 2.82
Speed @ peak torque (rpm) 1078.8 1056 998.1154 1002
4.6. Sensitivity Analysis
A sensitivity analysis was conducted on the parameters measured during the Locked-Rotor
test described in section 3.2.3. to determine how sensitive (if at all) the results are to
measurement uncertainties/error in the voltage, current and power. Whilst conducting the
analysis only one measured parameter (V, I or P) is varied whilst the other parameters are
kept constant.
It is important to note varying one parameter whilst varying the other parameters constant
results in a physically unrealistic motor model. For instance, the power supplied to the
stator is the product of the stator current and voltage. Varying the power without a change
in voltage or current is not physically realistic.
For the purpose of this sensitivity analysis variations in any one of the measured
parameters represents a measurement uncertainty and by varying only one of the
parameters the effect can be assessed. The T-S curve for the SCIM is found in Figure 15 and
16 whilst Figures 17 and 18 show the WRIM results. Variations to each parameter have a
1 Comparison values are peak values obtained from Matlab plots/results.
2 Comparison values are peak values obtained from Matlab plots/results.
P a g e 43 | 56
maximum of + or - 10%, however for the WRIM fed with the VSD source it was found that
variations of just 1 to 1.5% had significant effect on the T-S curve.
For the WRIM reduced frequency (VSD source) locked rotor test, the torque speed curve
was generated without taking into consideration the effect of the frequency on the locked
rotor reactance. This gives a T-S curve with a breakdown torque much closer to the
experimentally measured value, however it can be seen that slight variations in any of the
measured parameters can give a large variation in the T-S curve breakdown torque, speed
that it occurs, locked rotor torque and even the shape of the curve.
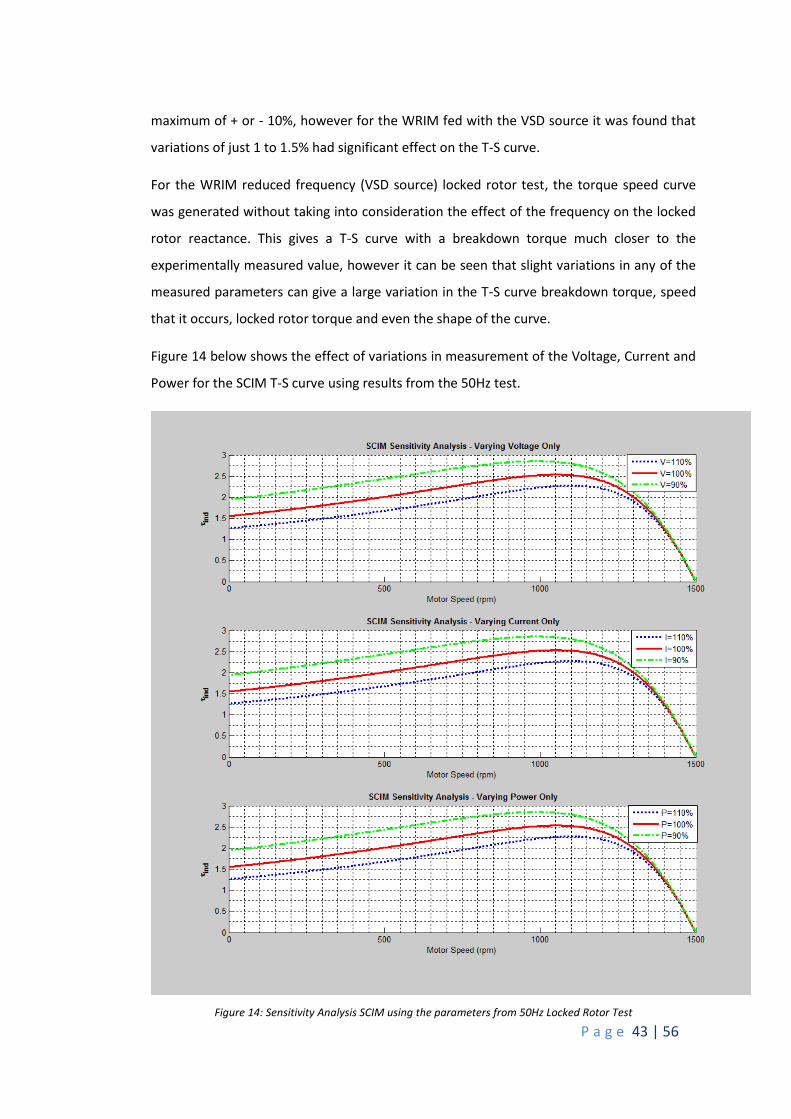
Figure 14 below shows the effect of variations in measurement of the Voltage, Current and
Power for the SCIM T-S curve using results from the 50Hz test.
Figure 14: Sensitivity Analysis SCIM using the parameters from 50Hz Locked Rotor Test
P a g e 44 | 56
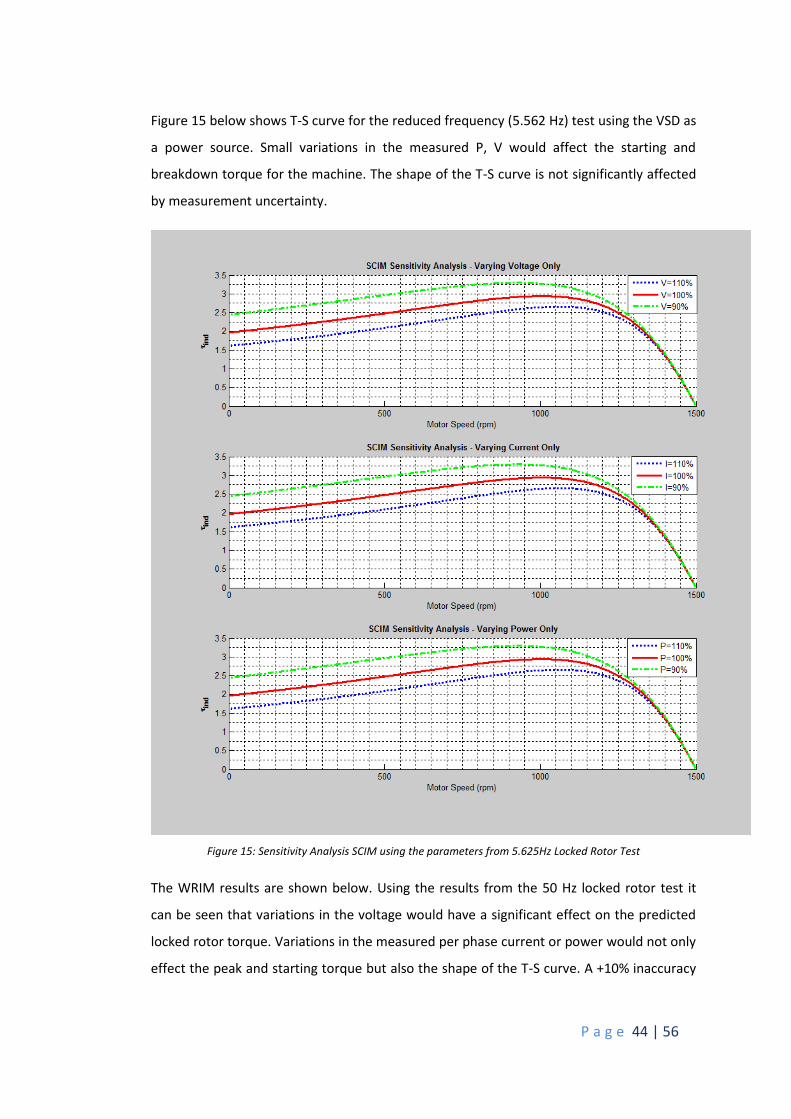
Figure 15 below shows T-S curve for the reduced frequency (5.562 Hz) test using the VSD as
a power source. Small variations in the measured P, V would affect the starting and
breakdown torque for the machine. The shape of the T-S curve is not significantly affected
by measurement uncertainty.
Figure 15: Sensitivity Analysis SCIM using the parameters from 5.625Hz Locked Rotor Test
The WRIM results are shown below. Using the results from the 50 Hz locked rotor test it
can be seen that variations in the voltage would have a significant effect on the predicted
locked rotor torque. Variations in the measured per phase current or power would not only
effect the peak and starting torque but also the shape of the T-S curve. A +10% inaccuracy
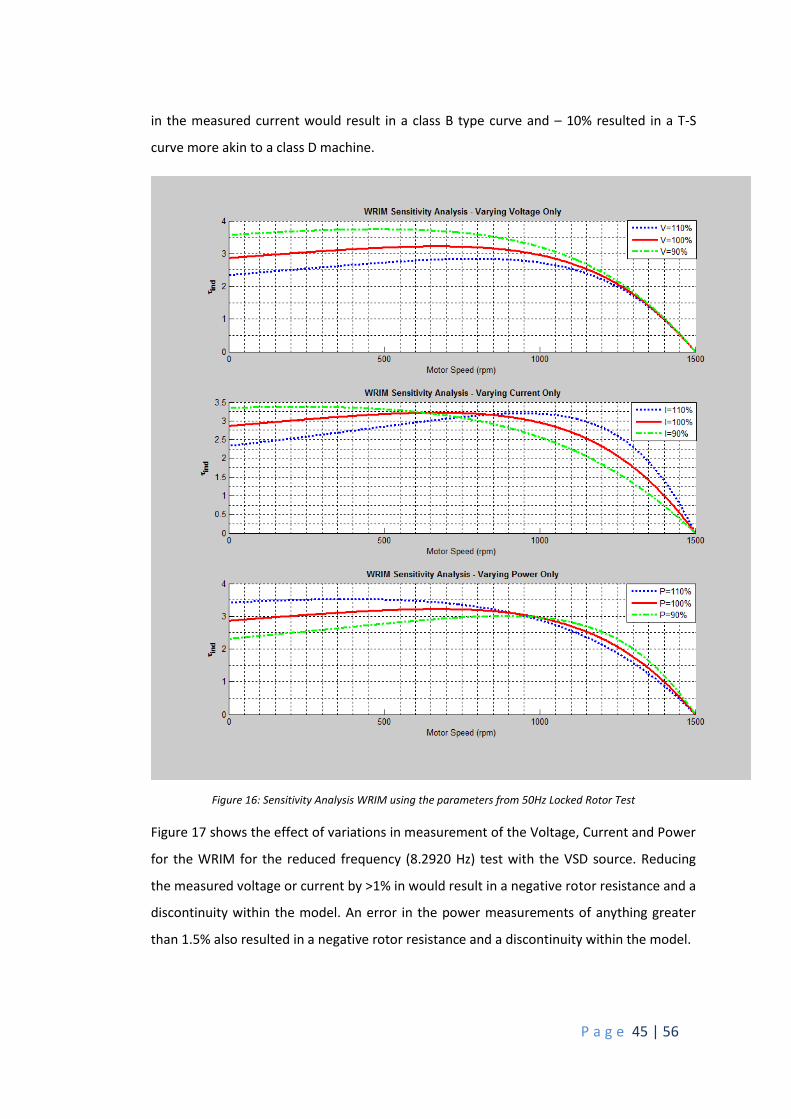
P a g e 45 | 56
in the measured current would result in a class B type curve and – 10% resulted in a T-S
curve more akin to a class D machine.
Figure 16: Sensitivity Analysis WRIM using the parameters from 50Hz Locked Rotor Test
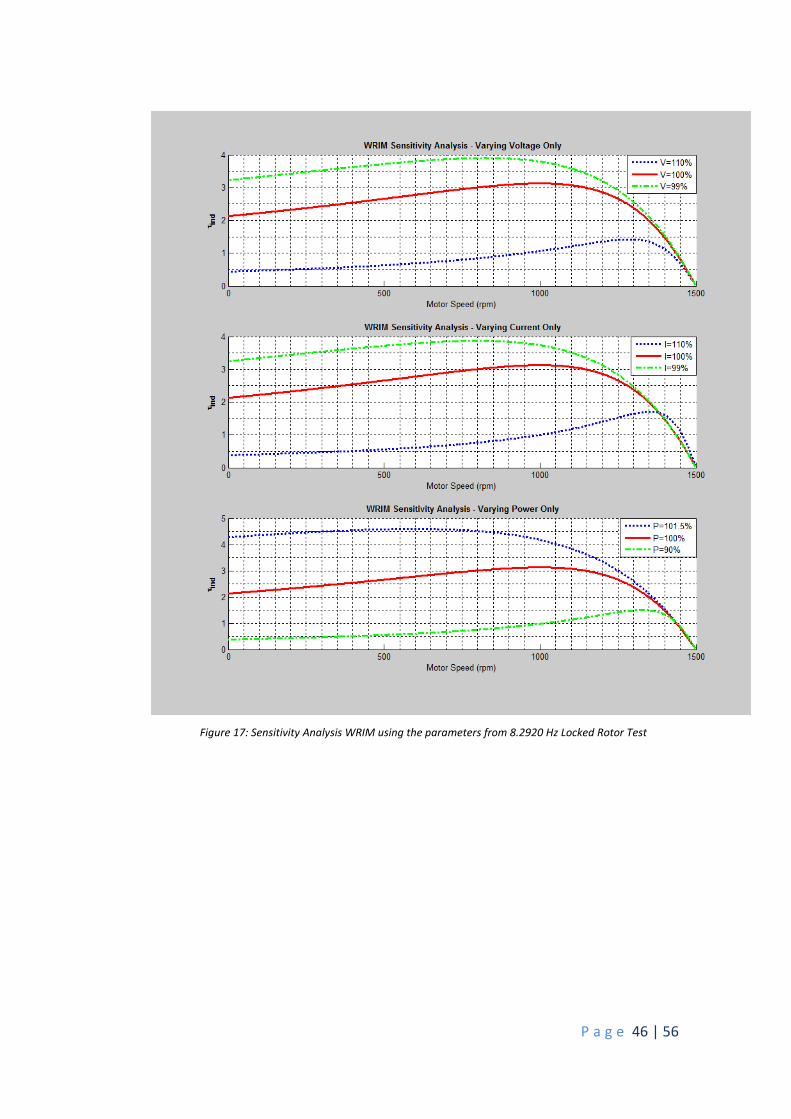
Figure 17 shows the effect of variations in measurement of the Voltage, Current and Power
for the WRIM for the reduced frequency (8.2920 Hz) test with the VSD source. Reducing
the measured voltage or current by >1% in would result in a negative rotor resistance and a
discontinuity within the model. An error in the power measurements of anything greater
than 1.5% also resulted in a negative rotor resistance and a discontinuity within the model.
P a g e 46 | 56
Figure 17: Sensitivity Analysis WRIM using the parameters from 8.2920 Hz Locked Rotor Test
P a g e 47 | 56
5. Conclusion
The project set out to investigate the torque speed characteristics for the squirrel cage and
wound rotor type induction machines available in the engineering laboratory. Three
methods were employed including directly loading the machines and measuring the
torque, loading the machine with a DC generator and the design and carrying out of
experiments to determine the machines electrical parameters.
Comparison between the experimental results and the theoretical plots that were obtained
by estimating the electrical parameters was then possible. For the WRIM a further
investigation into the effect of varying rotor resistance on the torque speed curve was also
carried out.
It was found that the SCIM had a NEMA class B type T-S characteristic with a breakdown
torque of 2.533 Nm @ ~1050 rpm and starting torque of 1.552 Nm. The WRIM was found
to have a NEMA class D type T-S curve indicating a high rotor resistance. The breakdown
torque was found to be 3.223 Nm @ 675 rpm with a starting torque of 2.864 Nm.
The SCIM and WRIM full load torque (calculated from the rated values) was found to be
1.198 Nm at 1395 rpm and 1.27 Nm at 1315 rpm respectively. The experimentally obtained
results were comparable with the SCIM value of 1.341 Nm and WRIM giving 1.22 Nm at
1315 rpm.
Difficulties were encountered when trying to obtain experimental results within the
unstable region of the T-S curve for both motors. Initially it was proposed that the Lab-Volt
DC generator be used, however the load current required was greater than four times the
rated current and therefore it proved unsuitable for the task. The electrodynamometer
proved adequate for loading the machine within the normal operating region of the
machine (between the breakdown torque and no load speed).
A power analyser was used for measurements including the tests to determine the
electrical parameters. Three tests are commonly employed, including the DC, No-Load and
Locked Rotor tests. The Locked Rotor test proved challenging to conduct as measuring a
PWM source requires specialist equipment. A VSD was used to provide a reduced
frequency/ voltage source to the machines during the Locked Rotor test and the correct
setup of the power analyser parameters proved tricky.
P a g e 48 | 56
A sensitivity analysis of the effect of measurement uncertainties in the locked rotor test
parameters (P, V and I) was conducted. For the SCIM, small variations in measured P, V or I
will affect the value of the breakdown and locked rotor torque but not the shape of the T-S
curve. For the WRIM it was found that small variations in the measured parameters could
significantly affect the value of the breakdown and locked rotor torque and also change the
shape of the torque speed curve.
Accurately measuring the locked rotor test parameters may be more difficult for the WRIM
due to the greater inductance seen by the VSD. It is possible that the VSD has internal
programming that measures the back EMF of the motor and adjusts the applied
voltage/frequency accordingly. Further investigation into the effect that an induction
machines back EMF on the VSD’s operation could be investigated in future thesis projects.
It was possible to find the torque-speed curves for both machines using the electrical
parameters obtained from the three standard tests. The most accurate method appears to
be conducting the locked rotor test at rated frequency as the effect of frequency on such a
small machine appears to be negligible and results were comparable to those obtained
within the experiments.
Further work using the Lab-Volt equipment could include using two DC generators
connected in series via a single ribbed belt. The Lab-Volt experimental station would allow
three machines to be placed in a row. Modification of the belt tensioners would be
required along with the sourcing of the correct belt. Sourcing a larger DC generator could
also be an option and a test rig could be made to couple the two machines in series.
Further investigation using the “interpolation using three arbitrary points method” on the
torque speed curve could include using points obtained in the unstable region. Direct
measurements of the torque-speed curve obtained within the unstable region could then
be checked by comparison with results obtained within the stable region.
Finally, other equipment to reduce the issues associated with measuring the parameters
when using a VSD power source a power filter could be investigated. The use of a power
filter between the VSD and power analyser could remove the harmonics inherently present
in any PWM source. Power filters are relatively inexpensive and readily available for
induction machines.
P a g e 49 | 56
References [1] NEMA. (2014, 20/10/14). Motor and Generator [Webpage]. Available:
http://www.nema.org/Products/Pages/Motor-and-Generator.aspx#stats.
[2] IEEE, "IEEE Standard Test Procedure for Polyphase Induction Motors and
Generators," IEEE Std 112-2004 (Revision of IEEE Std 112-1996), pp. 0_1-79, 2004.
[3] Lab-Volt. (2013, 01.08.14). Lab-Volt ELECTROMECHANICAL 0.2 kW TRAINING
SYSTEM, MODEL8001.Available: https://www.labvolt.com/downloads/dsa8001.pdf
[4] Lab-Volt. (2013 01/08/14). BASIC MOTORS/GENERATORS MODELS 8211, 8221,
8231, AND 8241. Available: https://www.labvolt.com/downloads/dsa8211.pdf
[5] S. J. Chapman, Electric Machinery Fundamentals, Fifth Edition. Singapore: McGraw
Hill, 1991.
[6] C. I. Hubert, Electric Machines, 2nd ed. New Jersey: Prentice Hall, 2002.
[7] C. Kingsly. Jr, S. D. Umans and A. E. Fitzgerald, Electric Machinery, 6th ed. NY:
McGraw HIll, 2003.
[8] N. N. E. M. Ascociation, "ANSI/NEMA MG 1-2011," in Standards, ed: American
National Standards Institute, Inc., 2012, p. 644.
[9] S. Australia, "AS1359 Rotating electrical machines - General requirements," vol.
AS1359, ed. Sydney: Standards Australia International Ltd, 2000, p. 26.
[10] EC&M, "These graphs show typical torque-speed curves for Design A, B, C, and D
motors.," ed. EC&M 2014.
[11] W. R. Finley, M. M. Hodowanec, K. S. Hussain, and J. Larabee, "Proper selection of
induction motor tests," in Pulp and Paper Industry Technical Conference, 2003.
Conference Record of the 2003 Annual, 2003, pp. 9-20.
[12] P. G. Cummings, W. D. Bowers, and W. J. Martiny, "Induction Motor Efficiency Test
Methods," Industry Applications, IEEE Transactions on, vol. IA-17, pp. 253-272,
1981.
[13] D. P. Cashman, J. G. Hayes, M. G. Egan, S. Djurovic, and A. C. Smith, "Comparison of
Test Methods for Characterization of Doubly Fed Induction Machines," Industry
Applications, IEEE Transactions on, vol. 46, pp. 1936-1949, 2010.
[14] D. L. Skaar, "Circumventing the blocked rotor test when evaluating model elements
of three phase induction motors," Energy Conversion, IEEE Transactions on, vol. 9,
pp. 397-403, 1994.
[15] R. H. Salimin, S. H. Binti Abd Kadir, S. R. Mohd, S. Baki, and F. Ismail, "Parameter
identification of three-phase induction motor using MATLAB-simulink," in Power
Engineering and Optimization Conference (PEOCO), 2013 IEEE 7th International,
2013, pp. 647-651.
P a g e 50 | 56
[16] A. Syal, K. Gaurav, and T. Moger, "Virtual laboratory platform for enhancing
undergraduate level induction motor course using MATLAB/Simulink," in
Engineering Education: Innovative Practices and Future Trends (AICERA), 2012 IEEE
International Conference on, 2012, pp. 1-6.
[17] S. Ayasun and C. O. Nwankpa, "Induction motor tests using MATLAB/Simulink and
their integration into undergraduate electric machinery courses," Education, IEEE
Transactions on, vol. 48, pp. 37-46, 2005.
[18] J. Pedra and L. Sainz, "Parameter estimation of squirrel-cage induction motors
without torque measurements," Electric Power Applications, IEE Proceedings -, vol.
153, pp. 263-270, 2006.
[19] B. Renier, K. Hameyer, and R. Belmans, "Comparison of standards for determining
efficiency of three phase induction motors," Energy Conversion, IEEE Transactions
on, vol. 14, pp. 512-517, 1999.
[20] C. Y. Wu, M. C. Tasi, and S. H. Mao, "Characteristics measurement of direct-drive
brushless DC motors without using dynamometers," in Electrical Machines and
Systems, 2009. ICEMS 2009. International Conference on, 2009, pp. 1-6.
[21] Lab-Volt. (2013, 01/08/2014). MECHANICAL LOADS MODELS 8911 AND 8913.
Available: https://www.labvolt.com/downloads/dsa8911.pdf
[22] K. Davey, "Predicting induction motor circuit parameters," Magnetics, IEEE
Transactions on, vol. 38, pp. 1774-1779, 2002.
[23] K. Davey, "Rotating field analysis using boundary element methods," Magnetics,
IEEE Transactions on, vol. 35, pp. 1402-1405, 1999.
[24] S. R. Nelatury, "Uniqueness of torque-speed characteristics of an induction motor,"
Magnetics, IEEE Transactions on, vol. 40, pp. 3431-3433, 2004.
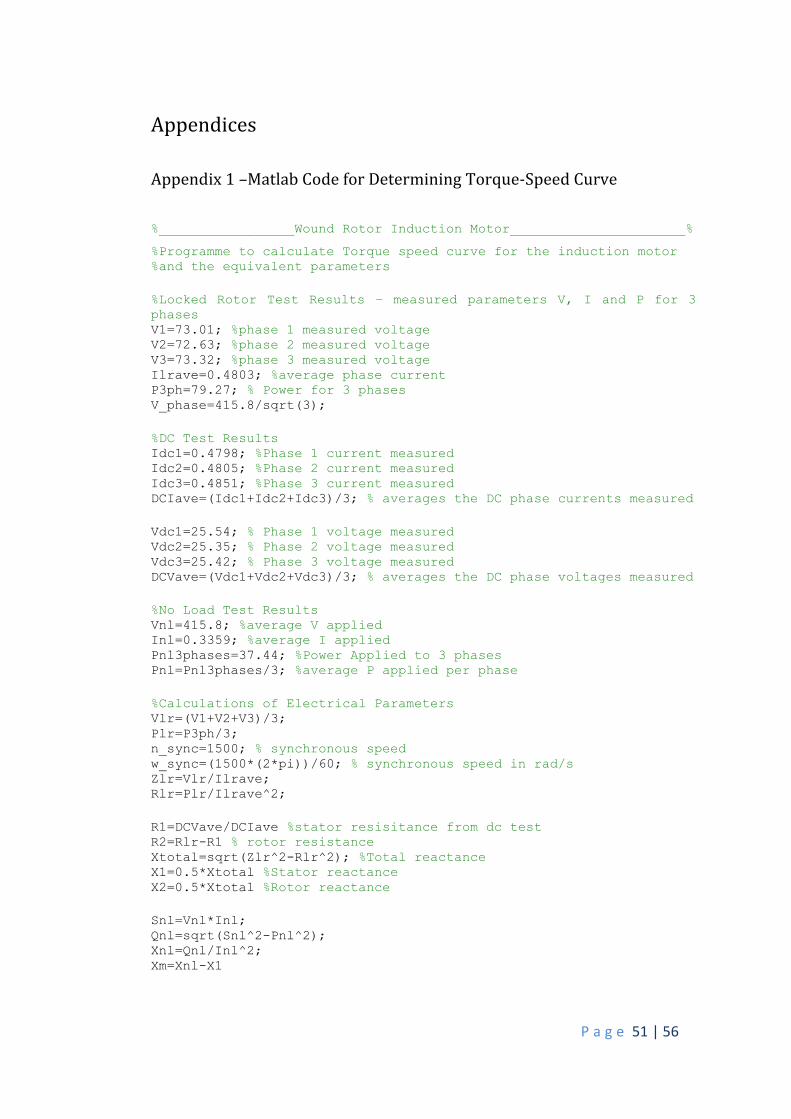
P a g e 51 | 56
Appendices
Appendix 1 –Matlab Code for Determining Torque-Speed Curve
%_________________Wound Rotor Induction Motor______________________%
%Programme to calculate Torque speed curve for the induction motor %and the equivalent parameters
%Locked Rotor Test Results – measured parameters V, I and P for 3
phases V1=73.01; %phase 1 measured voltage V2=72.63; %phase 2 measured voltage V3=73.32; %phase 3 measured voltage Ilrave=0.4803; %average phase current P3ph=79.27; % Power for 3 phases V_phase=415.8/sqrt(3);
%DC Test Results Idc1=0.4798; %Phase 1 current measured Idc2=0.4805; %Phase 2 current measured Idc3=0.4851; %Phase 3 current measured DCIave=(Idc1+Idc2+Idc3)/3; % averages the DC phase currents measured
Vdc1=25.54; % Phase 1 voltage measured Vdc2=25.35; % Phase 2 voltage measured Vdc3=25.42; % Phase 3 voltage measured DCVave=(Vdc1+Vdc2+Vdc3)/3; % averages the DC phase voltages measured
%No Load Test Results Vnl=415.8; %average V applied Inl=0.3359; %average I applied Pnl3phases=37.44; %Power Applied to 3 phases Pnl=Pnl3phases/3; %average P applied per phase
%Calculations of Electrical Parameters Vlr=(V1+V2+V3)/3; Plr=P3ph/3; n_sync=1500; % synchronous speed w_sync=(1500*(2*pi))/60; % synchronous speed in rad/s Zlr=Vlr/Ilrave; Rlr=Plr/Ilrave^2;
R1=DCVave/DCIave %stator resisitance from dc test R2=Rlr-R1 % rotor resistance Xtotal=sqrt(Zlr^2-Rlr^2); %Total reactance X1=0.5*Xtotal %Stator reactance X2=0.5*Xtotal %Rotor reactance
Snl=Vnl*Inl; Qnl=sqrt(Snl^2-Pnl^2); Xnl=Qnl/Inl^2; Xm=Xnl-X1
P a g e 52 | 56
%Thevenin Voltage and Current of Equivalent Circuit V_th=V_phase*(Xm/sqrt(R1^2+(X1+Xm)^2)); Z_th=((j*Xm)*(R1+j*X1))/(R1+j*(X1+Xm)); R_th=real(Z_th); X_th=imag(Z_th);
%Calculate motor speed for slips from 0-1 (unity) s=(0:0.1:50)/50; %slip s(1)=0.001; nm=(1-s)*n_sync; %mechanical speed
%Calculated torque speed curve for slips from 0-1 for ii=1:501 t_ind1(ii)=(3*V_th^2*R2/s(ii))/(w_sync*((R_th+R2/s(ii))^2+(X_th+X2)^
2)); end
%plot with title and axis labels plot(nm,t_ind1,'b-','Linewidth',2.0) %plots torque speed curve xlabel('\bf\itn_m'' rpm'); %axis label ylabel('\bf\tau_ind'); %axis label title('\bfInduction motor torque speed characteristic - WRIM')
%title
grid minor %plot with minor grid lines
% End of m file
Appendix 2 - Matlab Code for Comparison of Locked Rotor Tests
%%%%%%%%%%%%% Squirrel Cage Induction Motor %%%%%%%%%%%%%%
%Programme to calculate Torque speed curve for the SCIM from the
%equivalent parameters determined from standard tests. 50Hz and
%reduced frequency tests included
clc clear variables clear all % %freq = 50Hz Vave(1)=74.7; Ilrave(1)=0.4563; Pph(1)=19.23; freq(1)=50;
%freq=5Hz Vave(2)=68.7623; Ilrave(2)=0.46184; Pph(2)=19.673; freq(2)=50
%freq=5Hz
P a g e 53 | 56
Vave(3)=68.7623; Ilrave(3)=0.46184; Pph(3)=19.673; freq(3)=5.5623
%Programme to calculate Torque speed curve for the SCIM from the
equivalent
for m=1:3
%machine ratings V_phase=415/sqrt(3);
%DC test Idc1=0.4618; Idc2=.4613; Idc3=0.4602; DCIave=(Idc1+Idc2+Idc3)/3; Vdc1=23.51;
Vdc2=23.55; Vdc3=23.37; DCVave=(Vdc1+Vdc2+Vdc3)/3;
%No Load Test Vnl=240.24; Inl=0.2878; Pnl3phases=28.16; Pnl=Pnl3phases/3;
%calculations of parameters Vlr(m)=Vave(m); Plr(m)=Pph(m); n_sync=1500; w_sync=(1500*(2*pi))/60; Zlr=Vlr(m)/Ilrave(m); Rlr=Plr(m)/Ilrave(m).^2;
R1=DCVave/DCIave %from dc test R2=Rlr-R1 Xtotal=(50/freq(m))*sqrt(Zlr^2-Rlr^2) X1=0.5*Xtotal X2=0.5*Xtotal
Snl=Vnl*Inl; Qnl=sqrt(Snl^2-Pnl^2); Xnl=Qnl/Inl^2; Xm=Xnl-X1
%Thevenin voltage and current of equivalent circuit V_th=V_phase*(Xm/sqrt(R1^2+(X1+Xm)^2)); Z_th=((j*Xm)*(R1+j*X1))/(R1+j*(X1+Xm)); R_th=real(Z_th); X_th=imag(Z_th);
P a g e 54 | 56
%Calculate motor speed for slips from0-1 (unity) s=(0:0.1:50)/50; % slip s(1)=0.001; nm=(1-s)*n_sync; % mechanical speed
%Calculated torque for slips from 0-1 for ii=1:501 t_ind1(ii)=(3*V_th^2*R2/s(ii))/(w_sync*((R_th+R2/s(ii))^2+(X_th+X2)^
2)); end
hold on if m==1 plot(nm,t_ind1,':b','Linewidth',2.5); end if m==2 plot(nm,t_ind1,'-r','Linewidth',2.5); end if m==3 plot(nm,t_ind1,'-.k','Linewidth',2.5); end
%Varying Current by +-10% for ii=1:501 t_ind2(ii)=(3*V_th^2*R2/s(ii))/(w_sync*((R_th+R2/s(ii))^2+(X_th+X2)^
2)); end
xlabel('Motor Speed (rpm)'); ylabel('\bf\tau_ind'); title('\bf SCIM - Comparison of Locked Rotor Tests') legend('50Hz Locked Rotor Test','Freq adj. Locked Rotor
Test','5.563Hz Locked Rotor Test'); grid minor end
hold off
%%%%%%%%%%%%%%%%_________End of Code_____________%%%%%%%%%%%%%%
Appendix 3 – Electrical Parameters Calculation Method
Calculation Method 1 – Full Frequency Locked Rotor Test
Stator Resistance - DC test
Dc test to determine the average stator resistance pre phase:
RDC = (50.91 Ω + 51.05 Ω + 50.78 Ω) / 3 = 50.913 Ω per phase
Blocked Rotor Test
VLine,ave =( 75.16 V + 74.79 V + 74.45 V )/( 3)= 74.7 V
∴VLine,ave=74.7 V*√3=129.56 V
ILine, ave = 0.4563 A
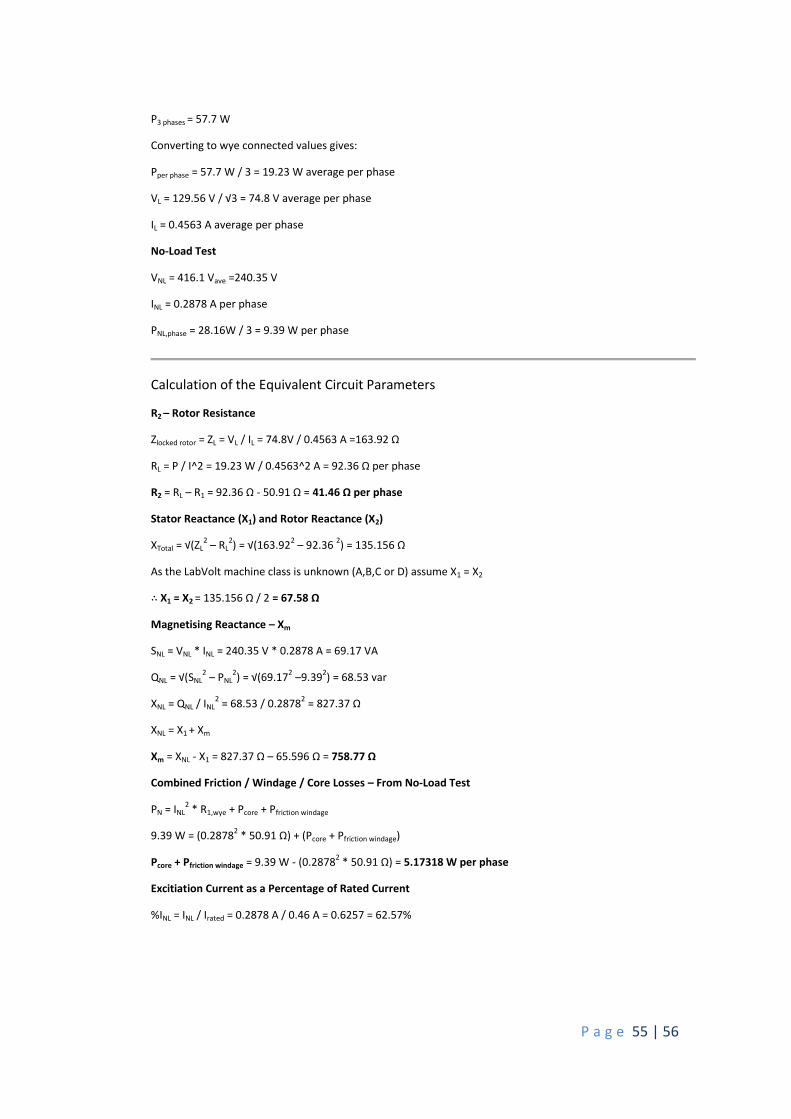
P a g e 55 | 56
P3 phases = 57.7 W
Converting to wye connected values gives:
Pper phase = 57.7 W / 3 = 19.23 W average per phase
VL = 129.56 V / √3 = 74.8 V average per phase
IL = 0.4563 A average per phase
No-Load Test
VNL = 416.1 Vave =240.35 V
INL = 0.2878 A per phase
PNL,phase = 28.16W / 3 = 9.39 W per phase
Calculation of the Equivalent Circuit Parameters
R2 – Rotor Resistance
Zlocked rotor = ZL = VL / IL = 74.8V / 0.4563 A =163.92 Ω
RL = P / I^2 = 19.23 W / 0.4563^2 A = 92.36 Ω per phase
R2 = RL – R1 = 92.36 Ω - 50.91 Ω = 41.46 Ω per phase
Stator Reactance (X1) and Rotor Reactance (X2)
XTotal = √(ZL2 – RL
2) = √(163.92
2 – 92.36
2) = 135.156 Ω
As the LabVolt machine class is unknown (A,B,C or D) assume X1 = X2
∴ X1 = X2 = 135.156 Ω / 2 = 67.58 Ω
Magnetising Reactance – Xm
SNL = VNL * INL = 240.35 V * 0.2878 A = 69.17 VA
QNL = √(SNL2 – PNL
2) = √(69.17
2 –9.39
2) = 68.53 var
XNL = QNL / INL2 = 68.53 / 0.2878
2 = 827.37 Ω
XNL = X1 + Xm
Xm = XNL - X1 = 827.37 Ω – 65.596 Ω = 758.77 Ω
Combined Friction / Windage / Core Losses – From No-Load Test
PN = INL2 * R1,wye + Pcore + Pfriction windage
9.39 W = (0.28782 * 50.91 Ω) + (Pcore + Pfriction windage)
Pcore + Pfriction windage = 9.39 W - (0.28782 * 50.91 Ω) = 5.17318 W per phase
Excitiation Current as a Percentage of Rated Current
%INL = INL / Irated = 0.2878 A / 0.46 A = 0.6257 = 62.57%
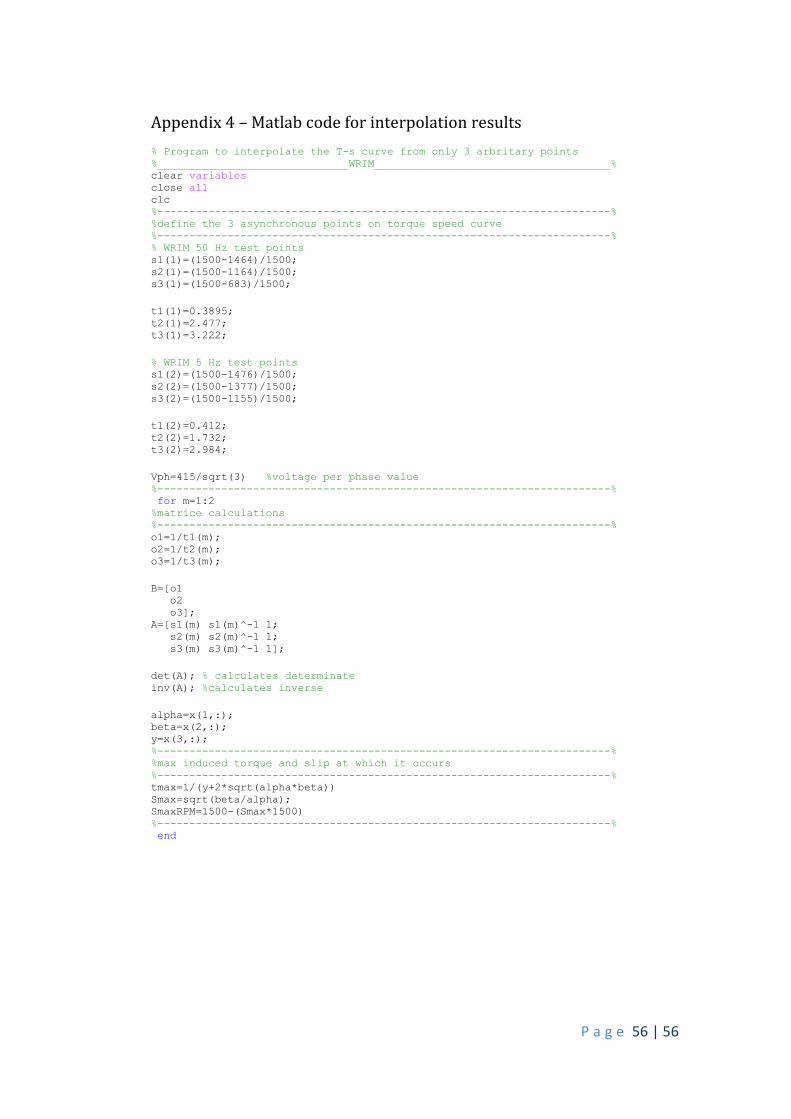
P a g e 56 | 56
Appendix 4 – Matlab code for interpolation results
% Program to interpolate the T-s curve from only 3 arbritary points %______________________________WRIM_____________________________________% clear variables close all clc %-----------------------------------------------------------------------% %define the 3 asynchronous points on torque speed curve %-----------------------------------------------------------------------% % WRIM 50 Hz test points s1(1)=(1500-1464)/1500; s2(1)=(1500-1164)/1500; s3(1)=(1500-683)/1500;
t1(1)=0.3895; t2(1)=2.477; t3(1)=3.222;
% WRIM 5 Hz test points s1(2)=(1500-1476)/1500; s2(2)=(1500-1377)/1500; s3(2)=(1500-1155)/1500;
t1(2)=0.412; t2(2)=1.732; t3(2)=2.984;
Vph=415/sqrt(3) %voltage per phase value %-----------------------------------------------------------------------% for m=1:2 %matrice calculations %-----------------------------------------------------------------------% o1=1/t1(m); o2=1/t2(m); o3=1/t3(m);
B=[o1 o2 o3]; A=[s1(m) s1(m)^-1 1; s2(m) s2(m)^-1 1; s3(m) s3(m)^-1 1];
det(A); % calculates determinate inv(A); %calculates inverse
alpha=x(1,:); beta=x(2,:); y=x(3,:); %-----------------------------------------------------------------------% %max induced torque and slip at which it occurs %-----------------------------------------------------------------------% tmax=1/(y+2*sqrt(alpha*beta)) Smax=sqrt(beta/alpha); SmaxRPM=1500-(Smax*1500) %-----------------------------------------------------------------------% end