experiment 5: enzyme kinetics - summary of contents · in this lab, enzyme kinetics ... ice water...
TRANSCRIPT

1
Experiment 5: Enzyme Kinetics
Written by Kimberly Tierney Performed: October 2nd, 9th, & 16th, 2013 Due: October 23, 2013 Laboratory Class: Wednesdays, 1:40 – 4:30 pm
Purpose:
To examine the rates of enzymatic reactions and effects of varying applied conditions.
Introduction:
In this lab, enzyme kinetics are examined utilizing various experimental techniques, including measurements of absorbance and temperature, to determine the effects on reaction rate dependent on enzyme and substrate concentration, temperature, and substrate specificity, as well as calculate the concentration of enzymes and substrates, Vo, Vmax, KM and reaction rate. Enzyme kinetics is the study of catalytic reactions, or reaction rate, which occurs in the presence of enzymes under varying conditions, specificities, and mechanisms such as the proximity effect, orientation effect, catalytic effect and energy effect; the studies are conducted under assorted circumstances, such as temperature, pH, and component concentrations in correlation to reaction rates. For example, enzyme concentration directly relates to reaction rates whereby an increase in enzyme concentration will also increase the rate of the reaction in a linear relationship. (as seen in the above graph on the left). However, substrate concentration does not increase the reaction rate continuously if enzyme concentration is constant, but rather reaches a maximum reaction rate or velocity known as Vmax when the enzyme active sites are saturated with substrate and therefore can no longer bind to anymore substrate. The KM is the substrate concentration constant at half the Vmax value, in other words it is half of the maximum reaction rate which may aid in determination of enzyme-substrate binding capabilities. The substrate concentration can be displayed as two differing graphs; the center graph located above, and as the Lineweaver Burk plot, also known as the double-reciprocal plot. The Lineweaver Burk plot denotes KM and Vmax as intercept values in the form of reciprocals. The Vmax value is the point at which the plotted line intercepts the y-axis labeled 1/Vo interpreted as 1/Vmax. The KM value is determined at the point in which the plotted line intercepts with the x-axis labeled 1/[substrate], interpreted as -1/KM. The KM and Vmax values of obtained from the Lineweaver Burk plot may be used to determine reaction rate by use of Michaelis-Menton equation as follows:
2
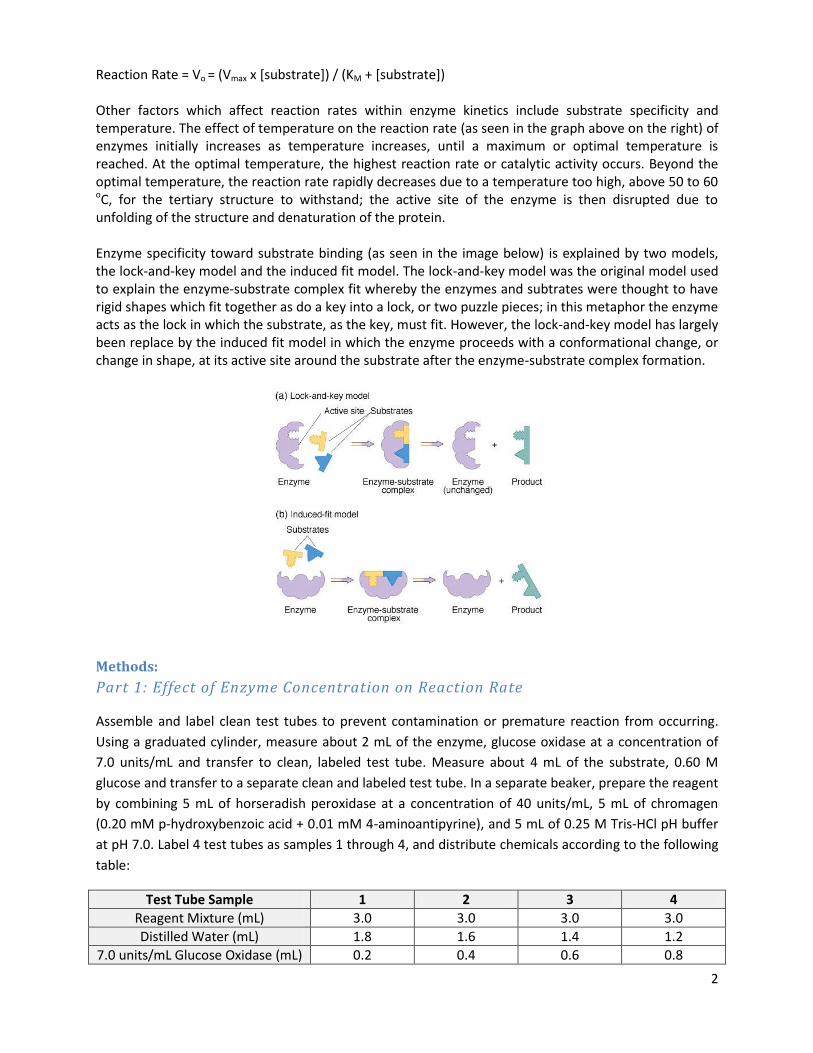
Reaction Rate = Vo = (Vmax x [substrate]) / (KM + [substrate]) Other factors which affect reaction rates within enzyme kinetics include substrate specificity and temperature. The effect of temperature on the reaction rate (as seen in the graph above on the right) of enzymes initially increases as temperature increases, until a maximum or optimal temperature is reached. At the optimal temperature, the highest reaction rate or catalytic activity occurs. Beyond the optimal temperature, the reaction rate rapidly decreases due to a temperature too high, above 50 to 60 oC, for the tertiary structure to withstand; the active site of the enzyme is then disrupted due to unfolding of the structure and denaturation of the protein. Enzyme specificity toward substrate binding (as seen in the image below) is explained by two models, the lock-and-key model and the induced fit model. The lock-and-key model was the original model used to explain the enzyme-substrate complex fit whereby the enzymes and subtrates were thought to have rigid shapes which fit together as do a key into a lock, or two puzzle pieces; in this metaphor the enzyme acts as the lock in which the substrate, as the key, must fit. However, the lock-and-key model has largely been replace by the induced fit model in which the enzyme proceeds with a conformational change, or change in shape, at its active site around the substrate after the enzyme-substrate complex formation.
Methods:
Part 1: Effect of Enzyme Concentration on Reaction Rate
Assemble and label clean test tubes to prevent contamination or premature reaction from occurring.
Using a graduated cylinder, measure about 2 mL of the enzyme, glucose oxidase at a concentration of
7.0 units/mL and transfer to clean, labeled test tube. Measure about 4 mL of the substrate, 0.60 M
glucose and transfer to a separate clean and labeled test tube. In a separate beaker, prepare the reagent
by combining 5 mL of horseradish peroxidase at a concentration of 40 units/mL, 5 mL of chromagen
(0.20 mM p-hydroxybenzoic acid + 0.01 mM 4-aminoantipyrine), and 5 mL of 0.25 M Tris-HCl pH buffer
at pH 7.0. Label 4 test tubes as samples 1 through 4, and distribute chemicals according to the following
table:
Test Tube Sample 1 2 3 4
Reagent Mixture (mL) 3.0 3.0 3.0 3.0
Distilled Water (mL) 1.8 1.6 1.4 1.2
7.0 units/mL Glucose Oxidase (mL) 0.2 0.4 0.6 0.8

3
Using a Vernier unit, place a sample of the reagent (in table above) into a vial within the colorimeter
light source and tar to zero. Return the sample from the vial to the test tube. Add 1 mL of 0.60 M
glucose to the test tube to initiate the reaction and immediately transfer to the vial within the light
source to record absorbance values. Absorbance values are recorded for all 4 test tube samples at 468
nm (blue spectrum) per sample at 30 second intervals for seven minutes or until achieving an
absorbance value of 1.4.
Part 2: Effect of Substrate Concentration on Reaction Rate
Assemble and label clean test tubes to prevent contamination or premature reaction from occurring.
Using a graduated cylinder, measure about 4 mL of the enzyme, glucose oxidase at a concentration of
6.5 units/mL and transfer to clean, labeled test tube. Measure about 2 mL each of the substrates, 0.60
M glucose and 0.06 M glucose, and transfer to separate clean and labeled test tubes. In a separate
beaker, prepare the reagent by combining 10 mL of horseradish peroxidase at a concentration of 40
units/mL, 10 mL of chromagen (0.20 mM p-hydroxybenzoic acid + 0.01 mM 4-aminoantipyrine), and 10
mL of 0.25 Tris-HCl pH buffer at pH 7.0. Label 6 test tubes as samples 1 through 6, and distribute
chemicals according to the following table:
Test Tube Sample 1 2 3 4 5 6
Reagent Mixture (mL) 3.0 3.0 3.0 3.0 3.0 3.0
Distilled Water (mL) 1.4 1.9 2.15 1.4 1.9 2.15
6.5 units/mL Glucose Oxidase (mL)
0.6 0.6 0.6 0.6 0.6 0.6
Using a Vernier unit, place a sample of the mixture in table above into a vial within the colorimeter light
source and tar to zero. Return the sample from the vial to the test tube. Add the quantity of substrate in
the following table to the respective test tube sample to initiate the reaction:
Test Tube Sample 1 2 3 4 5 6
0.60 M Glucose 1.0 0.50 0.25 - - -
0.06 M Glucose - - - 1.0 0.50 0.25
Upon addition of the glucose substrate, the mixture is immediately transferred to the vial within the
light source to record absorbance values. Absorbance values are recorded for all 6 test tube samples at
468 nm (blue spectrum) per sample at 30 second intervals for five minutes.
Part 3A: Substrate Specificity
Assemble and label 12 clean test tubes to prevent contamination or premature reaction from occurring.
The following chemical are added to each of six test tubes and are utilized to tar the Vernier unit prior to
addition of sugar:
Reagent Mixture (mL) 3.0 1 mL 0.25 M Tris-HCl pH buffer
1 mL Horseradish Peroxidase, 40 units/mL
1 mL Chromagen
Distilled Water (mL) 1.4
Glucose Oxidase (mL) 0.6

4
The remaining six test tubes contain the following sugars:
Test Tube
1 2 3 4 5 6
Sugar (1 mL)
Alpha – D – Glucose
Beta – D – Glucose
Mixture of Alpha – Beta – D
– Glucose (0.06 M Glucose)
Lactose (Galactose +
Glucose)
Dextrose (Glucose + Glucose)
Galactose (Mono-
saccharide)
*If sugars are in dry form, reconstituted as 0.11g dry sugar dissolved in 10 mL water, then 1 mL
is used from the reconstituted solution.
To perform absorbance readings, the Vernier unit is tarred with the test tube that does not contain the
sugar or substrate, but contains the reagent and enzyme (glucose oxidase). Individually, a sugar is added
to the enzyme containing solution to initiate the reaction and immediately transferred to a vial within
the colorimeter light source. Absorbance values of all 6 catalytic reactions are recorded at 30 second
intervals for a total of 3 minutes.
Part 3B: Temperature Effects
Assemble and label 8 clean test tubes to prevent contamination or premature reaction from occurring. 1
mL each of 0.06 M glucose is four labeled test tubes. The following chemicals are added to each of the
remaining four test tubes and are utilized to tar the Vernier unit prior to addition of 0.06 M glucose
solution:
Reagent Mixture (mL) 3.0 1 mL 0.25 M Tris-HCl pH buffer
1 mL Horseradish Peroxidase, 40 units/mL
1 mL Chromagen
Distilled Water (mL) 1.4
Glucose Oxidase (mL) 0.6
The test tubes are arranged in pairs as one test tube containing the 0.06 M glucose substrate and 1 test
tube containing the solution in the above table. The four sets are applied to four different temperatures
within beakers containing water in the following arrangements:
Variations Temperature (oC) Method of Temperature Adjustments
Ice water ~0 Beaker filled with ice and water
Room Temperature ~25 Beaker filled with tap water from sink
Warm Water ~50 Beaker filled with water, heated by Bunsen burner
Hot Water ~75 Beaker filled with water, heated by Bunsen burner
One set of two test tubes are placed within the water of the beakers and applied to one of the four
temperature variations. Temperatures of the water are monitored with a thermometer until desired
temperature is reached. When the desired temperature is reached, the Vernier unit is tarred to zero
utilizing the test tube that does not contain 0.06 M glucose. The solution used to tar the unit is then
returned to its test tube, the 1 mL of 0.06 M glucose (applied to the same temperature variation) is

5
added to initiate the reaction and immediately transferred back to the vial within the colorimeter light
source to read and record absorbance values. Absorbance values are recorded for the four reactions of
temperature effect in 20 second increments for a total of 2 minutes.
Results & Calculations:
Part 1:
TABLE 1:
Effect of Enzyme Concentration on Reaction Rate; Absorbance vs. Time
With [7.0 units/ mL glucose oxidase]
Time (Min)
Abs of Sample 1 Abs of Sample 2 Abs of Sample 3 Abs of Sample 4
0.2 mL glucose oxidase
0.4 mL glucose oxidase
0.6 mL glucose oxidase
0.8 mL glucose oxidase
0 0 0 0 0
0.5 0.118 0.370 0.110 0.45
1.0 0.354 0.502 0.682 0.881
1.5 0.607 0.850 1.041 1.971
2.0 0.799 1.072 1.229 1.331
2.5 0.949 1.212 1.311 1.369
3.0 1.063 1.301 1.350 1.380
3.5 1.152 1.357 1.369 1.389
*Per professor, to correct trendline of graph 2, include only values reached until 3.5 minutes.
GRAPH 1:

6
Calculations of unit of enzymes in reactions:
Sample 1 with 0.2 mL glucose oxidase: (0.2 mL glucose oxidase) x (7.0 units/mL enzyme concentration) = 1.4 unit of enzyme
Sample 2 with 0.4 mL glucose oxidase: (0.4 mL glucose oxidase) x (7.0 units/mL enzyme concentration) = 2.8 units of enzyme
Sample 3 with 0.6 mL glucose oxidase: (0.6 mL glucose oxidase) x (7.0 units/mL enzyme concentration) = 4.2 units of enzyme
Sample 4 with 0.8 mL glucose oxidase: (0.8 mL glucose oxidase) x (7.0 units/mL enzyme concentration) = 5.6 units of enzyme
TABLE 2:
Effect of Enzyme Concentration on Reaction Rate
Sample [Enzyme] (units)
Reaction Rate (μmol/min)
Slope of trendlines (m)
1 1.4 0.3516
2 2.8 0.3930
3 4.2 0.4520
4 5.6 0.3618
GRAPH 2:

7
Part 2:
TABLE 3:
Effect of Substrate Concentration on Reaction Rate; Absorbance vs. Time
With [6.5 units/mL glucose oxidase]
Time (Min) Abs of Sample 1
Abs of Sample 2
Abs of Sample 3
Abs of Sample 4
Abs of Sample 5
Abs of Sample 6
1.0 mL 0.6 M glucose
0.5 mL 0.6 M glucose
0.25 mL 0.6 M glucose
1.0 mL 0.06 M glucose
0.5 mL 0.06 M glucose
0.25 mL 0.06 M glucose
[0.100 M glucose]
[0.050 M glucose]
[0.025 M glucose]
[0.010 M glucose]
[0.005 M glucose]
[0.0025 M glucose]
0 0 0 0 0 0 0
0.5 0.474 0.462 0.400 0.234 0.154 0.061
1.0 0.832 0.813 0.754 0.514 0.365 0.150
1.5 1.032 1.036 0.988 0.759 0.571 0.244
2.0 1.140 1.163 1.124 0.928 0.752 0.340
2.5 1.205 1.216 1.215 1.073 0.889 0.428
3.0 1.243 1.266 1.267 1.155 1.013 0.518
3.5 1.269 1.288 1.294 1.218 1.108 0.597
4.0 1.293 1.305 1.313 1.260 1.176 0.673
4.5 1.312 1.313 1.333 1.295 1.221 0.752
5.0 1.338 1.323 1.347 1.328 1.264 0.818
GRAPH 3:
*0.1 M glucose values (plots) overshadowed due to very similar values to 0.05 M glucose.

8
GRAPH 4:
Trendlines:
*0.1 M glucose values (plots) overshadowed due to very similar values to 0.05 M glucose.
TABLE 4:
Sample [Substrate] Slope of y=mx+b
1/[Substrate] 1/Slope
[Glucose] Vo 1/[Glucose] 1/Vo
1 0.1 0.2182 10 4.5830
2 0.05 0.2200 20 4.5455
3 0.025 0.2345 40 4.2644
4 0.01 0.2594 100 3.8551
5 0.005 0.2610 200 3.8314
6 0.0025 0.1692 400 5.9101

9
GRAPH 5:
Calculations of Vmax & KM:
Y-intercept = 4.091
Vmax = 1/(4.091) = 0.24444
X-intercept = -1278
KM = -1/(-1278) = 0.00078247
Calculations of Vmax & KM via linear equation; y = mx + b:
Trendline: y = 0.0032x + 4.091
Vmax = y-intercept = 4.091
y = (0.0032)(0) + 4.091 = 4.091
KM = x – intercept = -1278.438
0 = 0.0032x + 4.091
x = (-4.091) / 0.0032 = -1278.438

10
Part 3A:
TABLE 5:
Substrate Specificity
Time (Min)
Alpha – D - Glucose
Beta – D – Glucose
Mixture of Alpha – Beta – D –
Glucose (0.06 M Glucose)
Lactose (Galactose + Glucose)
Dextrose (Glucose + Glucose)
Galactose (Mono-
saccharide)
0 0 0 0 0 0 0
0.5 0.329 0.720 0.540 0.040 0.325 0.007
1.0 0.503 0.994 0.862 0.045 0.590 0.015
1.5 0.685 1.161 1.088 0.045 0.824 0.025
2.0 0.851 1.281 1.228 0.050 1.008 0.030
2.5 0.994 1.345 1.322 0.056 1.148 0.040
3.0 1.116 1.381 1.378 0.060 1.252 0.049
GRAPH 6:

11
Part 3B:
TABLE 6:
Temperature Effect
Time (Sec)
Ice Water (~ 0 oC)
Room Temperature (~ 25 oC)
Warm Water (~ 50 oC)
Hot Water (~ 75 oC)
0 0 0 0 0
20 0.231 0.529 0.573 0.011
40 0.320 0.754 0.871 0.013
60 0.482 0.933 1.047 0.016
80 0.665 1.057 1.137 0.018
100 0.816 1.153 1.183 0.021
120 0.971 1.230 1.209 0.023
GRAPH 7:
TABLE 7:
Reaction Rate (μmol/min) Temperature (oC) Variation
0.0079 0 Ice Water
0.0094 25 Room Temperature
0.0091 50 Warm Water
0.0002 75 Hot Water

12
GRAPH 8:
Discussion:
Part 1:
Enzymes act as catalysts in biochemical reactions by decreasing activation energy in formation of the enzyme-substrate complex to produce a product which releases the enzyme to be recycled, or reused within another reaction. With this function in mind, increasing the concentration, or quantitative amount per volume, of available enzymatic molecules as glucose oxidase should display an increase in reaction rates as a greater number of reactions occurring per unit of time due to an increased availability of enzymes to which constant concentration of substrate reactants, as glucose, may bind to produce product in completion of reactions. Therefore the relation between increasing enzyme concentration should display as a linear increase of reaction rate. In analysis of the results displayed in table 1 of samples of varying enzyme concentrations of glucose oxidase and reflected within graph 1 as comparison of sample reaction rates as absorbance at 468 nm per minute, data may be interpreted to define greater increase per enzyme concentration in terms of the slope displayed on the trendline of each sample concentration as 'm' in the equation y=mx + b. Results of collected data illustrate and support the anticipation of a direct linear increase by greater slope values as enzyme concentrations increased from 0.2 mL to 0.6 mL of glucose oxidase. However, the slope value defined by sample data of 0.8 mL glucose oxidase deviated from anticipated results where the reaction rate of 0.3618 was lower than at a concentration of 0.6 mL glucose oxidase illustrating a slope trend of 0.4252. This result deviation is shown to be insignificant when analyzed in graph 2 as a broader interpretation of reaction rate as defined as slope trend versus concentration of enzyme units which concludes by inclusion of all data collected per sample that increasing enzyme concentration expressly increases reaction rate (Vo) as product per minute, as anticipated.
Part 2:
The effect incurred by reaction rate as applied in terms of increasing substrate concentration as glucose interpreted by measure of absorbance at 468 nm per minute while maintaining constant enzyme concentration of glucose oxidase is anticipated to demonstrate an initial increase in reaction rate as an

13
increasing and positive slope until slowing in approach of Vmax due to the saturation of available binding sites of glucose oxidase and an inhibition in further binding of the substrate glucose reactant. This anticipated outcome is supported by the results displayed in graph 4 as analysis of the effect of substrate concentration on reaction rate denotes that initially increasing concentrations of glucose increases the slope value of the line, however the trendline equation displays similar slope values irrelevant of substrate concentration; this may be interpreted to indicate that increasing the substrate concentration does not increase the reaction rate continuously, and is dependent upon the constant concentration of available enzyme concentration, thus Vmax is displayed by a cessation in increasing slope and focused approach towards a single absorbance value as a maximum reaction rate or velocity. However, at a substrate concentration of 0.0025 M glucose, the reaction rate as interpretation of consistent slope increase may indicate an equivocal availability of enzyme binding sites to substrate molecules present as denoted by a lack of curve within the line and increasing linear relationship between substrate concentrations as dependent on enzyme concentration relative to reaction rate. The interpretation of reaction rate (Vo) in graph 4 as related to Vmax and Km may be confirmed utilizing the Lineweaver Burk plot which displays the maximum velocity as the y-intercept and half the reaction rate in terms of Km as the x-intercept which is calculated as the point of maximum velocity times substrate concentration, as divided by an increasing substrate concentration as Km plus substrate concentration to determine the reaction rate. The Lineweaver Burk plot would be well suited for comparison against a differing substrate molecule's binding ability to the glucose oxidase enzyme as values of Km to determine which molecule would better bind to the enzyme.
Part 3A:
Graph 6 tests for substrate specificity in application of the lock and key model whereby greater slope values, as indicative of greater reaction rate, demonstrate a preferable specificity; the greater the reaction rate as defined by slope of trendlines, the better specificity as relating to the binding of the substrates tested with the active site of a constant enzyme of glucose oxidase. Results imply that beta-D-glucose with a reaction rate value of 0.4057 and a mixture of alpha-beta-D-glucose with a reaction rate of 0.4331 display the greatest binding capacities and therefore are the most specific substrates tested with the enzyme glucose oxidase; beta-D-glucose being slightly more specific than the mixture of alpha-beta-D-glucose; due to similar composition of substrate components, as beta-D-glucose in included in the mixture, results are sensible in similarity. Inversely, lactose and galactose display the lowest affinity for reacting with glucose oxidase as denoted by resulting values of very low slopes and a line close to the x-axis. Since lactose is comprised of galactose and glucose, similar results were anticipated and confirmed within graph 6. In conclusion, order of increasing substrate specificity to glucose oxidase were found to be lactose, galactose (both with low affinity for binding), alpha-D-glucose, dextrose, mixture of alpha-beta-D-glucose, and beta-D-glucose (with the last listed four substrates displaying high substrate specificity and affinity for active site binding. Dextrose, which is a disaccharide comprised of two glucose molecules, is the same substrate utilized in all other parts of the experiment. Although, the reaction rate is not the fastest with a moderate slope value in comparison to the remaining 3 possible substrates of the sugars tested, dextrose is in fact a definitive and effective substrate of the enzyme glucose oxidase, utilized in all parts of experiment 5.
Part 3B:
Enzymatic reactions can only occur within a determined range of temperature due to the dependence of functional protein upon maintenance of tertiary structure to allow for active site binding with
14
substrates. Temperature ranges are specific to individual enzyme and substrate molecules, meaning oxidase may function in a hypothetical range of 10-60 degrees Celsius whereas kinase may function within a hypothetical range of 40-80 degrees Celsius. Within the range, temperature effects enzymatic reactions as an increase in reaction rate until reaching a peak or maximal temperature at which enzymes can function as well as the highest velocity or optimal rate of reaction known as optimum temperature. Increasing the temperature beyond the optimal temperature peak displays a rapid decrease in reaction as respective to the denaturation of the enzyme by unfolding tertiary structure and destruction of the active binding sites. Graph 7 illustrates the effects produced in application of varying temperatures during enzymatic reactions, higher slope values of trendlines are indicative of increased reaction rates, lower slope values remaining close to the x-axis are indicative of inability to react under applied temperatures. Interpretations of experimental results reveal that glucose oxidase reacts best when reaction occurs at approximately 50 degrees Celsius, followed by a similarly high reaction rates occurring in approximately 25 degrees Celsius, and considerably slowing at a temperature of 0 degrees Celsius. The reaction rate defined as a slope value of 0.0002 at a temperature of approximately 75 degrees Celsius is insignificant, meaning that reactions cannot occur at the high temperature and likely an indicator of enzyme denaturation. These interpretations are not irrevocably supported by graph 8 by which an optimal reaction rate temperature of approximately 40 degrees Celsius can be interpreted by assuming that the "peak" of the bell curve indicated the optimal temperature. The optimum temperature should display between the range of 50-75 degrees based on previously collected evidence that glucose oxidase can function well at temperatures of 50 degrees Celsius but cannot function or react at a temperature of 75 degrees Celsius. However, the curve does denote a drastic fall in reaction rate as respective to enzyme denaturation preceding 75 degrees Celsius and an increased reaction rate as temperatures are initially increased preceding the optimum temperature.
Discussion Questions:
1. The reactions are linear per measure of time for all samples because an increase in enzyme concentration, as we had by increasing enzyme concentrations, also increases the reaction rate measured in time intervals. However, there did exist some errors in absorbance readings which produced non-liner graphs which were corrected by limiting recorded values to an appropriate interval of time as per the professor. Also, experiments are performed with margins of error, they will not always achieve perfect outcomes but produce data which can be interpreted.
2. Increasing enzyme concentration directly increases the reaction rate by allowing for greater number of active sites in which the substrates may bind to perform reactions.
3. Increasing the substrate concentration initially increases the reaction rate until a point of Vmax, or the maximum catalytic activity which can occur if the enzyme concentration remains constant. This occurs because the active binding sites of the enzymes are saturated, or already bound in an enzyme-substrate complex, and cannot bind to any further substrates to produce reactions; this point is known as Vmax. Half the reaction rate of the Vmax expresses the KM, or substrate constant denoting half the catalytic activity of the saturated maximum reaction rate.
4. The effect of increasing temperature on the glucose oxidase reaction is that initially the reaction rate increases as the temperature increases until reaching a point of optimal temperature at which the highest reaction rate or catalytic activity occurs. Beyond this point, the temperature is too high for the enzyme protein structure to withstand, the active site is disrupted and thereby denying the binding of the substrate, therefore rapidly decreasing the reaction rate due to denaturation of the enzyme.
5. Different enzymes have different temperature ranges with different optimal temperatures because each protein structure is different and made of different components, the simplest

15
components being the amino acid “building blocks” of protein. Therefore, the shape is dependent upon the structure of each individual amino acid which have individual characteristics, such as ability to withstand and function within varying temperature and pH ranges; these individual amino acid characteristics determine the characteristics of different enzymes.
6. A. Alpha-D-glucose, dextrose, mixture of alpha-beta-D-glucose, and beta-D-glucose substrates display high substrate specificity and affinity for the active binding site of glucose oxidase as stated in the discussion previously. B. Beta-D-glucose has a higher affinity and substrate specificity with a faster reaction rate as per slope value for enzyme-substrate complex binding to glucose oxidase than alpha-D-glucose displays as respective to slope demonstrating reaction rate in which binding occurs, and alluding that the structure and position oxygen in the sugar molecule affect substrate specificity. However, both variations may act as effective substrates with glucose oxidase. C. Alpha-D-glucose and beta-D-glucose compare to the glucose solution as a mixture of alpha-beta-D-glucose (also known as the 0.06 M glucose solution used in other parts of experiment 5 in carrying concentrations) by displaying a reaction rate close to that of beta-D-glucose, which displays the highest substrate affinity as compared to the moderate substrate affinity or specificity of alpha-D-glucose. Interpretations and results of the reaction rate of 0.06 M glucose (alpha-beta-D-glucose) falling between the linear slopes of alpha-D-glucose and beta-D-glucose are as would be expected from a mixture of the two solutions. D. The effect usage of other sugars in comparison to glucose in order of increasing substrate specificity to glucose oxidase were found to be lactose, galactose (both with low affinity for binding), alpha-D-glucose, dextrose, mixture of alpha-beta-D-glucose, and beta-D-glucose (with the last listed four substrates displaying high substrate specificity and affinity for active site binding.) Further analysis is provided within part 3A discussion.
Sources: Ballantine, D., Castellion, M., Hoeger, C., McMurry, J., & Peterson, V. (2010). Enzymes and Vitamins. (6th
Ed.), Fundamentals of General, Organic, and Biological Chemistry (pp. 592-627). New York, NY: Prentice Hall.
Binyaminov, O., & Saffran, W. (2013). Experiment 5: Enzyme Kinetics. (2nd Ed.), Laboratory Manual:
Introduction to Biochemistry (pp. 54-83). (undefined): (undefined). McLachlan, G. (2013, September). Chapter 19 – Enzymes and Vitamins. CHEM 1033: Biochemistry.
Lecture conducted from CUNY Queens College, Flushing, NY.
Images: Enzyme concentration graph: http://www.rsc.org/Education/Teachers/Resources/cfb/images/07C.jpg Substrate concentration graph: http://www.chem.wisc.edu/deptfiles/genchem/netorial/modules/biomolecules/modules/enzymes/lkml
vmax.gif Enzyme reaction rate and temperature graph: http://www.bbc.co.uk/bitesize/standard/biology/images/temperature_graph.gif Enzyme specificity models:

16
http://leavingbio.net/ENZYMES_files/image006.jpg