experiences from a transportation security sensor … · experiences from a transportation security...
TRANSCRIPT
Experiences from a Transportation SecuritySensor Network Field Trial
Daniel T. Fokum, Victor S. Frost, Daniel DePardo,Martin Kuehnhausen, Angela N. Oguna,
Leon S. Searl, Edward Komp, Matthew Zeets,Daniel D. Deavours, Joseph B. Evans,
and Gary J. Minden
ITTC-FY2009-TR-41420-11
June 2009
Copyright © 2009:The University of Kansas2335 Irving Hill Road, Lawrence, KS 66045-7559All rights reserved.
Project Sponsor:Oak Ridge National Laboratory
Award Number 4000043403
Technical Report
The University of Kansas
2
CONTENTS
I Introduction 4
II System Architecture 6
II-A Trade Data Exchange . . . . . . . . . . . . . . . . . . . . . . . . . . . . . . .. . . 7
II-B Virtual Network Operations Center . . . . . . . . . . . . . . . . .. . . . . . . . . . 8
II-C Mobile Rail Network . . . . . . . . . . . . . . . . . . . . . . . . . . . . . .. . . . 9
II-C1 Mobile Rail Network Hardware . . . . . . . . . . . . . . . . . . . . .. 9
II-C2 Mobile Rail Network Software . . . . . . . . . . . . . . . . . . . . . .. 11
III Experiments 12
III-A Road Test with Trucks . . . . . . . . . . . . . . . . . . . . . . . . . . . .. . . . . 12
III-B Short-haul Rail Trial . . . . . . . . . . . . . . . . . . . . . . . . . . . .. . . . . . 14
IV Postprocessing of Experimental Data 15
V Results 17
V-A VNOC to MRN to VNOC Interaction . . . . . . . . . . . . . . . . . . . . . .. . . 18
V-B Elapsed Time from Alert Generation to AlarmReporting Service . . . . . . . . . . 19
V-C End-to-end Time from Event Occurrence to Decision Maker Notification . . . . . . 21
V-D TDE to VNOC to TDE Interaction . . . . . . . . . . . . . . . . . . . . . . . . .. . 23
V-E VNOC to TDE to VNOC Interaction . . . . . . . . . . . . . . . . . . . . . . .. . 25
V-F Summary of Time Statistics . . . . . . . . . . . . . . . . . . . . . . . . . . .. . . 26
V-G Messages by Schema Element . . . . . . . . . . . . . . . . . . . . . . . . . . .. . 26
V-H Message Sizes . . . . . . . . . . . . . . . . . . . . . . . . . . . . . . . . . . . . .. 27
V-I Intercommand and Interalarm Times . . . . . . . . . . . . . . . . . .. . . . . . . . 29
V-J HSDPA Signal Strength . . . . . . . . . . . . . . . . . . . . . . . . . . . . . . . .. 29
VI Impact on System Modeling 30
VII Refinements Based on Preliminary Results 32
VIII Conclusion 33
Acknowledgments 33
3
References 33
L IST OF FIGURES
1 Transportation Security Sensor Network (TSSN) Architecture . .. . . . . . . . . . . . . . . 7
2 Virtual Network Operations Center Architecture . . . . . . . .. . . . . . . . . . . . . . . . 8
3 TSSN Collector Node Hardware Configuration . . . . . . . . . . . . . . . . .. . . . . . . . 9
4 Container Seal . . . . . . . . . . . . . . . . . . . . . . . . . . . . . . . . . . . . . .. . . . . 11
5 Mobile Rail Network Collector Node Architecture . . . . . . . .. . . . . . . . . . . . . . . 11
6 Partial Map of Road Test with Event Annotations . . . . . . . . . . .. . . . . . . . . . . . 13
7 Short-haul Rail Trial Configuration . . . . . . . . . . . . . . . . . . . . .. . . . . . . . . . . 14
8 Partial Screen Shot of e-mail Message Sent During Trial . . . . . .. . . . . . . . . . . . . . 15
9 LogParser Framework Showing Message Couples and Transmit/receive Pairs . . . . . . . . . 16
10 Request/response and Network Times from VNOC→ MRN → VNOC . . . . . . . . . . . 19
11 Processing Times at MRN . . . . . . . . . . . . . . . . . . . . . . . . . . . . . .. . . . . . 19
12 Sequence Diagram with Messages Involved in Decision MakerNotification . . . . . . . . . 20
13 Elapsed Time from Alert Generation to VNOC AlarmReportingService . . . . . . . . . . . 21
14 Elapsed Time from Event Occurrence to Alert Generation . . . .. . . . . . . . . . . . . . . 22
15 Time Taken to Deliver SMS Messages for All Carriers . . . . . . .. . . . . . . . . . . . . . 23
16 Request/response and Network Times from TDE→ VNOC → TDE . . . . . . . . . . . . . 24
17 Processing Times at VNOC . . . . . . . . . . . . . . . . . . . . . . . . . . . . .. . . . . . . 24
18 Request/response and Network Times from VNOC→ TDE → VNOC . . . . . . . . . . . . 25
19 Processing Times at TDE . . . . . . . . . . . . . . . . . . . . . . . . . . . . . . .. . . . . . 25
20 Component Interactions in the TSSN . . . . . . . . . . . . . . . . . . . . . .. . . . . . . . 27
21 Intercommand and Interalarm Times at MRN . . . . . . . . . . . . . .. . . . . . . . . . . . 29
22 HSDPA Signal Strength versus Time . . . . . . . . . . . . . . . . . . . . . . .. . . . . . . . 30
23 HSDPA Signal Strength and Geographical Location . . . . . . . . . . .. . . . . . . . . . . 31
L IST OF TABLES
I Summary of Time Taken to Deliver SMS Messages . . . . . . . . . . . . . .. . . . . . . . 23
II Summary of Time Statistics . . . . . . . . . . . . . . . . . . . . . . . . . . . .. . . . . . . 26
III Number of Messages Generated by Schema Element . . . . . . . . . .. . . . . . . . . . . . 28
IV Summary of Message Size Statistics . . . . . . . . . . . . . . . . . . . . . .. . . . . . . . . 28

4
Abstract
Cargo shipments are subject to hijack, theft, or tampering.Furthermore, cargo shipments are at
risk of being used to transport contraband, potentially resulting in huge fines to shippers. We seek to
mitigate these risks through development of a Transportation Security Sensor Network (TSSN) based on
open software systems and Service Oriented Architecture (SOA) principles. The TSSN is composed
of three geographically distributed components: the Mobile Rail Network (MRN), Virtual Network
Operations Center (VNOC), and the Trade Data Exchange (TDE). Using commercial off-the-shelf (COTS)
sensors, the TSSN is able to detect events and report those relevant to appropriate decision makers. Two
experiments have been conducted to assess the TSSN’s suitability for monitoring rail-borne cargo. Log
files were collected from these experiments and postprocessed. In this paper we present empirical results
on the interaction between various components of the TSSN. These results show that the TSSN can be
used to monitor rail-borne cargo. We also discuss some of theresearch issues that must be addressed
before the TSSN can be deployed.
Index Terms
Service oriented architecture, Mobile Rail Network, TradeData Exchange, Virtual Network Opera-
tions Center
I. I NTRODUCTION
In 2006 the FBI estimated that cargo theft cost the US economy between 15 and 30 billion dollars per
year [1]. Cargo theft affects originators, shippers, and receivers as follows: originators need a reliable
supply chain in order to stay afloat, but cargo thefts adversely affect the reliability of the supply chain
(A receiver’s ability to receive goods in a timely manner affects the originator.). Shippers, on the other
hand, hold liability and insurance costs for shipments thus, they would like to maintain low costs due to
cargo theft. Finally, receivers are impacted by out-of-stock and scheduling issues due to cargo theft. Most
non-bulk cargo travels in shipping containers. Container transport is characterized by complex interactions
between shipping companies, industries, and liability regimes [2]. Stakeholders (originators, shippers, and
receivers) are looking for a higher degree of visibility, accountability, efficiency, and security in complex
container transport chains. Deficiencies in the container transport chain expose the system to attacks
such as the Trojan horse (the commandeering of a legitimate trading identity to ship an illegitimate or
dangerous consignment), hijack, or the theft of goods. Insufficiencies in these areas can be overcome by
creating secure trade lanes (or trusted corridors), especially at intermodal points, for example, at rail/truck
transitions. Research and development is underway to realize the vision of trusted corridors.
5
The work described here focuses on: advanced communications, networking, and information technol-
ogy applied to creating trusted corridors. The objective of the research is to provide the basis needed
to improve the efficiency and security of trade lanes by combining real-time tracking and associated
sensor information with shipment information. One crucialresearch question that must be answered in
order to attain this objective is how to create technologiesthat will allow continuous monitoring of
containers by leveraging communications networks, sensors as well as trade and logistics data within an
environment composed of multiple enterprises, owners, andoperators of the infrastructure. The resulting
technologies must be open and easy to use, enabling small andmedium sized enterprises (SMEs) to
obtain the associated economic and security benefits.
To achieve improved efficiency and security of trade lanes, wehave developed a Transportation Security
Sensor Network (TSSN), based on Service Oriented Architecture (SOA) [3] principles, for monitoring
the integrity of rail-borne cargo shipments. The TSSN is composed of a Trade Data Exchange (TDE) [4],
Virtual Network Operations Center (VNOC), and Mobile Rail Network (MRN). The functions of each
of these components are discussed in greater detail in Section II. The TSSN detects events and reports
those important to decision makers using commodity networks. For the TSSN to be deployed we need
to understand the timeliness of the system; however, we do not know a priori how the TSSN would
perform due to the unknown execution time of SOA-based programs ([5] and [6]), unpredictable packet
latency on commodity networks, and the slow and potentiallyunreliable nature of SMS (Short Message
Service) [7] for alarm notification. Thus, we have carried out two experiments to characterize the TSSN
system, particularly the end-to-end time between event occurrence and decision maker notification using
SMS. The data collected from these experiments will be used in models to investigate system trade-offs
and the design of communications systems and networks for monitoring rail-borne cargo.
In this paper we present a high-level description of our cargo monitoring system and experimental
results documenting the interactions between various components of the TSSN. These results indicate
that decision makers can be notified of events on the train in a timely manner using the TSSN. The rest of
this paper is laid out as follows: In Section II we present a description of the TSSN system architecture
including the components. Section II also discusses the hardware configuration used in the MRN. In
Section III we discuss two experiments conducted to assess the suitability of the TSSN system for cargo
monitoring. Section IV discusses the framework used to postprocess the log files from our experiments.
Section V presents empirical results showing the interaction between various components of the TSSN.
In Section VI we discuss how the empirical results can be used in a model to determine optimal or
near-optimal sensor placement. Section VII discusses some refinements to the TSSN architecture based

6
on preliminary results. Finally, we provide concluding remarks in Section VIII.
II. SYSTEM ARCHITECTURE
To achieve the objectives presented in Section I we have builta system called the Transportation
Security Sensor Network (TSSN). The SOA and web services used in the TSSNenable the integration
of different systems from multiple participating partners. Moreover, the use of SOA and web services
enable data to be entered once and used many times. Using commercial off-the-shelf (COTS) sensors,
the TSSN is able to detect events and report those relevant to shippers and other decision makers as
alarms. Furthermore, the TSSN supports multiple methods for notifying decision makers of alarms.
The TSSN uses open source implementations of Web service specification standards such as Apache
Axis2 [8] and OpenUDDI [9]. Axis2 is an implementation of theSimple Object Access Protocol (SOAP)
[8], where SOAP is used in Web services to exchange structuredinformation between a service provider
and a requester [10]. Universal Description Discovery Integration (UDDI), on the other hand, provides
a service directory and allows a “standard-based approach to locate and invoke a service, and manage
metadata relating to that service [10].” Support for multiple owners and users is done through use of
WS-Authorization, WS-Trust, and WS-Federation. Our current TSSN prototype uses sensors and readers
from Hi-G-Tek [11]. Moreover, the TSSN supports terrestrial communication technologies such as HSDPA
(High-Speed Downlink Packet Access) [12] and satellite communication technologies such as Iridium
[13]. The use of HSDPA and Iridium allows decision makers to be notified of alarms through SMS
(Short Message Service) and/or e-mail messages. There are costand performance benefits to using both
HSDPA and Iridium, including the following: it is cheaper andfaster to send messages over an HSDPA
link versus an Iridium link; on the other hand, a satellite link is needed as an access technology in those
parts of the countryside where an HSDPA connection is unavailable.
Since the TSSN system is currently a prototype, there is a need to gather log files that will allow for
system debugging as well as to capture metrics that can be used to evaluate system performance. Logging
is currently done at the MRN, VNOC, and TDE using Apache log4j [14]. Log4j enables “logging at
runtime without modifying the application binary [14].”
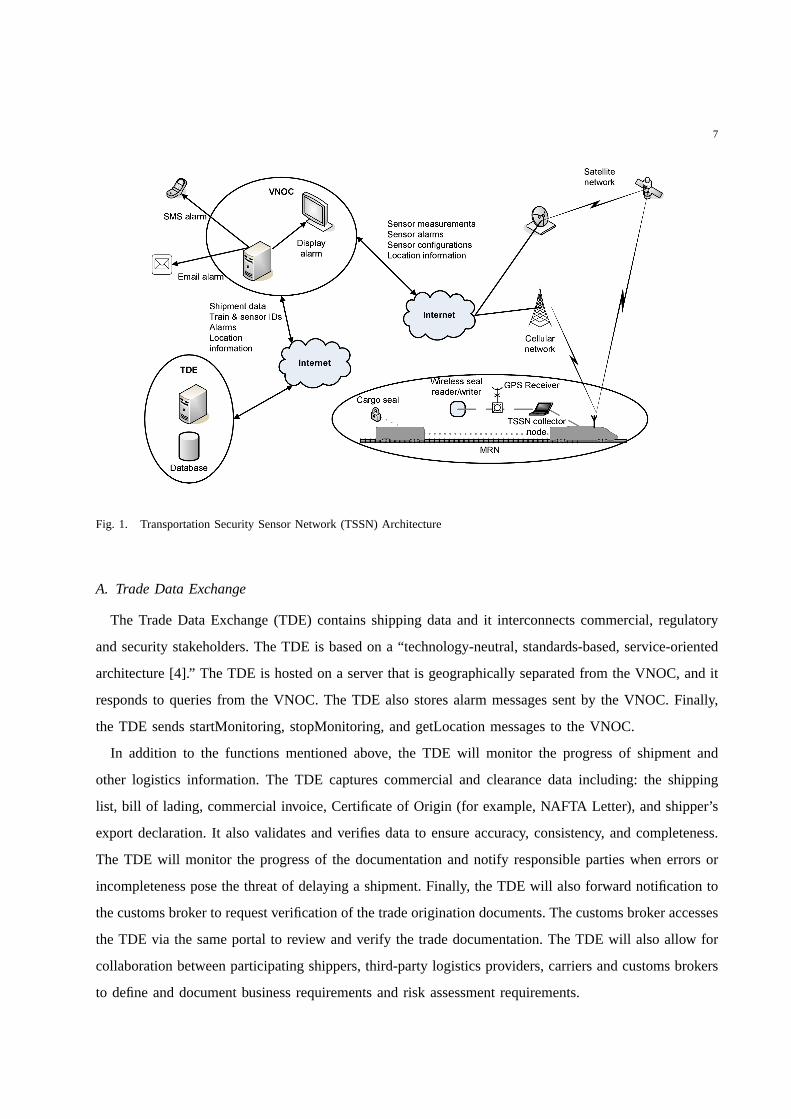
The TSSN system is composed of three major geographically distributed components: the Trade Data
Exchange (TDE), Virtual Network Operations Center (VNOC), andthe Mobile Rail Network (MRN), as
shown in Fig. 1. Each of these components is presented in greater detail in the following subsections.
7
Fig. 1. Transportation Security Sensor Network (TSSN) Architecture
A. Trade Data Exchange
The Trade Data Exchange (TDE) contains shipping data and it interconnects commercial, regulatory
and security stakeholders. The TDE is based on a “technology-neutral, standards-based, service-oriented
architecture [4].” The TDE is hosted on a server that is geographically separated from the VNOC, and it
responds to queries from the VNOC. The TDE also stores alarm messages sent by the VNOC. Finally,
the TDE sends startMonitoring, stopMonitoring, and getLocation messages to the VNOC.
In addition to the functions mentioned above, the TDE will monitor the progress of shipment and
other logistics information. The TDE captures commercial andclearance data including: the shipping
list, bill of lading, commercial invoice, Certificate of Origin (for example, NAFTA Letter), and shipper’s
export declaration. It also validates and verifies data to ensure accuracy, consistency, and completeness.
The TDE will monitor the progress of the documentation and notify responsible parties when errors or
incompleteness pose the threat of delaying a shipment. Finally, the TDE will also forward notification to
the customs broker to request verification of the trade origination documents. The customs broker accesses
the TDE via the same portal to review and verify the trade documentation. The TDE will also allow for
collaboration between participating shippers, third-party logistics providers, carriers and customs brokers
to define and document business requirements and risk assessment requirements.
8
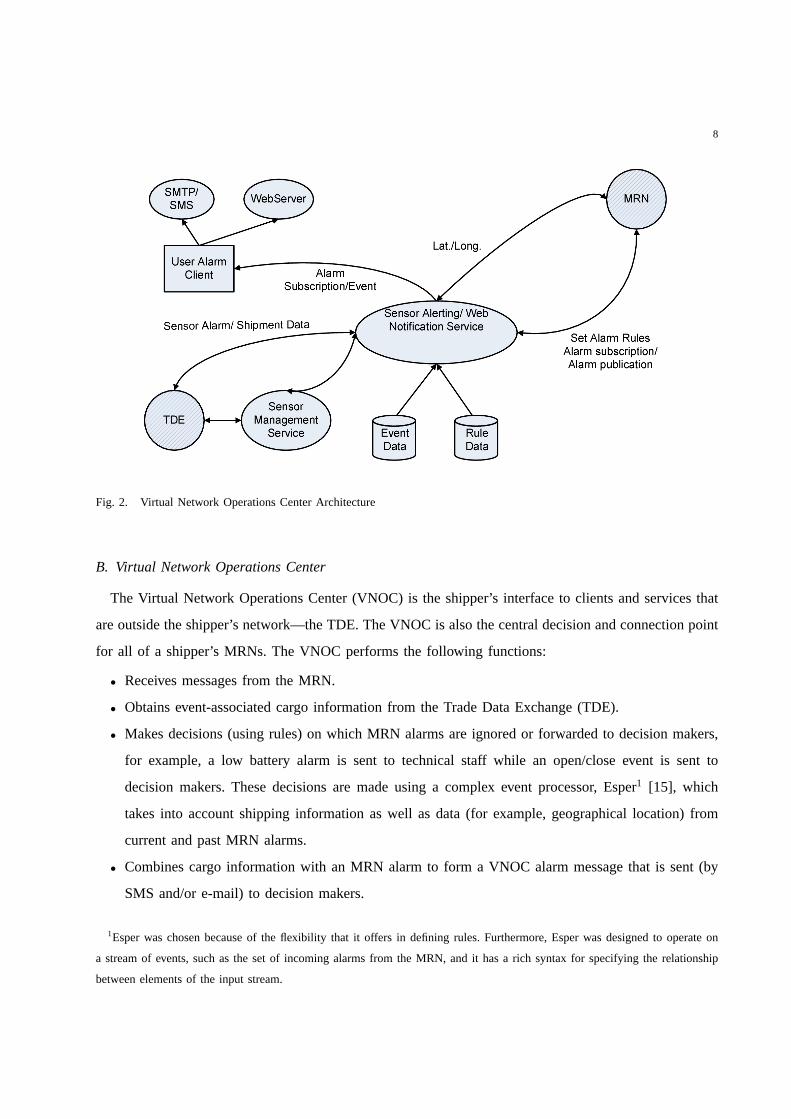
Fig. 2. Virtual Network Operations Center Architecture
B. Virtual Network Operations Center
The Virtual Network Operations Center (VNOC) is the shipper’s interface to clients and services that
are outside the shipper’s network—the TDE. The VNOC is also the central decision and connection point
for all of a shipper’s MRNs. The VNOC performs the following functions:
• Receives messages from the MRN.
• Obtains event-associated cargo information from the TradeData Exchange (TDE).
• Makes decisions (using rules) on which MRN alarms are ignored or forwarded to decision makers,
for example, a low battery alarm is sent to technical staff while an open/close event is sent to
decision makers. These decisions are made using a complex event processor, Esper1 [15], which
takes into account shipping information as well as data (forexample, geographical location) from
current and past MRN alarms.
• Combines cargo information with an MRN alarm to form a VNOC alarm message that is sent (by
SMS and/or e-mail) to decision makers.
1Esper was chosen because of the flexibility that it offers in defining rules. Furthermore, Esper was designed to operate on
a stream of events, such as the set of incoming alarms from the MRN, andit has a rich syntax for specifying the relationship
between elements of the input stream.
9
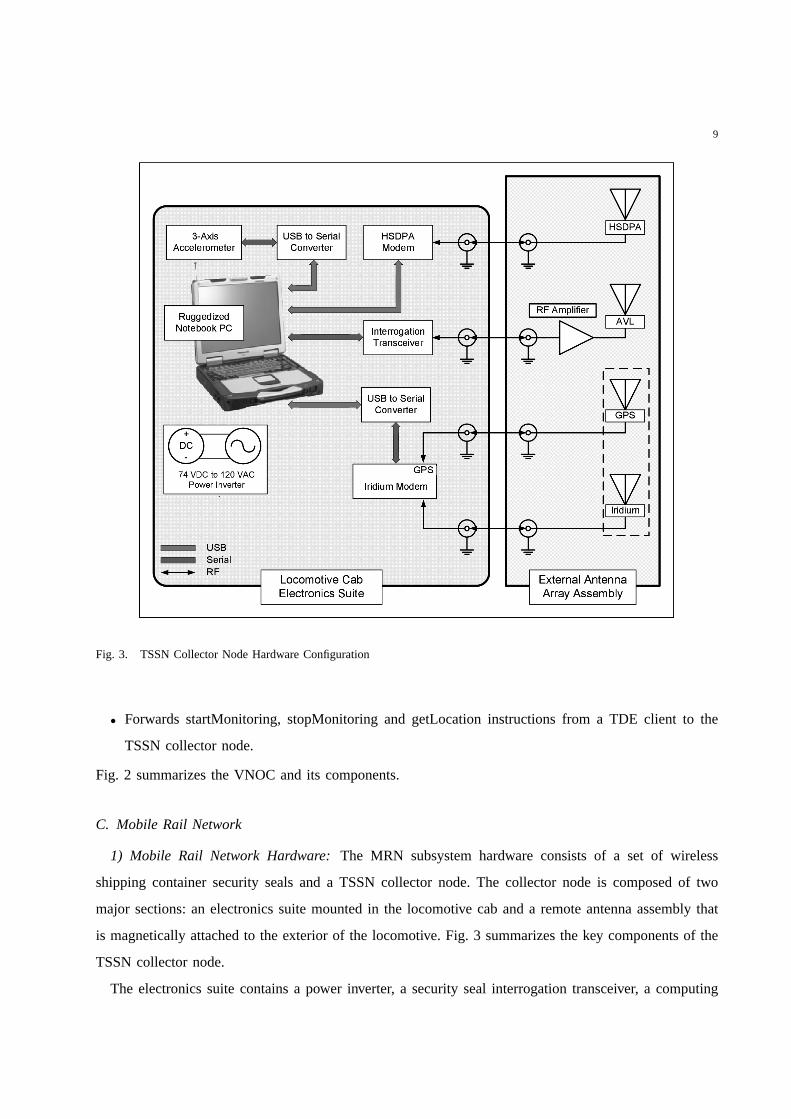
Fig. 3. TSSN Collector Node Hardware Configuration
• Forwards startMonitoring, stopMonitoring and getLocationinstructions from a TDE client to the
TSSN collector node.
Fig. 2 summarizes the VNOC and its components.
C. Mobile Rail Network
1) Mobile Rail Network Hardware:The MRN subsystem hardware consists of a set of wireless
shipping container security seals and a TSSN collector node. Thecollector node is composed of two
major sections: an electronics suite mounted in the locomotive cab and a remote antenna assembly that
is magnetically attached to the exterior of the locomotive.Fig. 3 summarizes the key components of the
TSSN collector node.
The electronics suite contains a power inverter, a security seal interrogation transceiver, a computing
10
platform, wireless data modems, a three-axis accelerometer, and a GPS receiver. The antenna assembly
consists of three communications antennas, a GPS receiver antenna, and a bidirectional RF amplifier. A
bundle of four 5.5 m (≈ 18 ft.) lengths of low insertion loss RF coaxial cable connect electronics suite
devices to corresponding antennas.
Powering the TSSN collector node using the available 74 V dc locomotive power posed a challenge.
The devices that comprise the node require four different dc input voltage levels, which ideally would be
provided through the use of typical dc-to-dc conversion techniques, but in the interest of quickly deploying
a proof of concept system, a 74 V dc to 120 V ac conversion was selected. Inverting the available dc
power to 120 V ac allows plug-and-play use of the ac power converters provided with individual devices.
A modified sine wave power inverter mounted in the electronicssuite enclosure supplies 250 W of ac
power capacity to the collector node.
The TSSN is designed to monitor and report security seal events including seal opened, seal closed,
tampered seal, seal armed, and low battery warnings. Processing and storage of these events is tasked
to a ruggedized notebook computer, which also serves as a portal to wireless communications resources.
The three-axis accelerometer mounted in the electronics suite is monitored by the notebook computer,
which logs movement data.
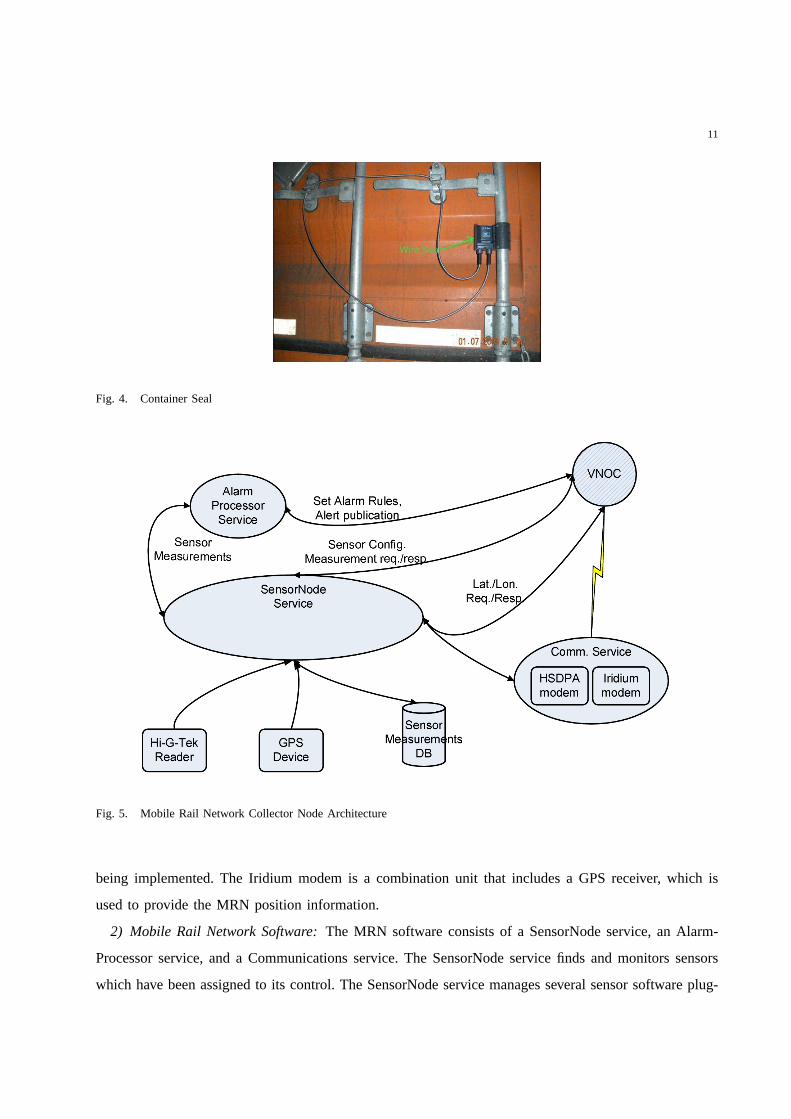
Container physical security is monitored using a system that was originally designed for tanker truck
security [11]. The interrogation transceiver communicateswith active and battery-powered wireless data
seals over a wireless network using a 916.5 MHz signal. The interrogation transceiver communicates
with the notebook computer via a serial data connection. The container seals use a secondary 125 kHz
channel for communications with handheld programming equipment. The container seals are equipped
with flexible wire lanyards that are threaded through container keeper bar lock hasps. Fig. 4 shows a
container seal with a flexible wire lanyard.
Initial tests of the security seal and reader system revealed read ranges that were not adequate for
the needs of this project. A bidirectional RF amplifier added between the interrogation transceiver and
the antenna dramatically improved system performance, resulting in typical seal read ranges of several
freight car lengths during field tests. It is understood that even with this improvement in read ranges we
will not be able to monitor an entire train with our current technology choice. Different seal and/or mesh
networking technologies would be needed for monitoring theentire length of typical cargo trains.
Communication between the MRN and the VNOC is accomplished using a HSDPA cellular data
modem. An Iridium satellite modem is also available and is intended for use in remote locations that
lack cellular network coverage. System communications using the Iridium modem are in the process of
11
Fig. 4. Container Seal
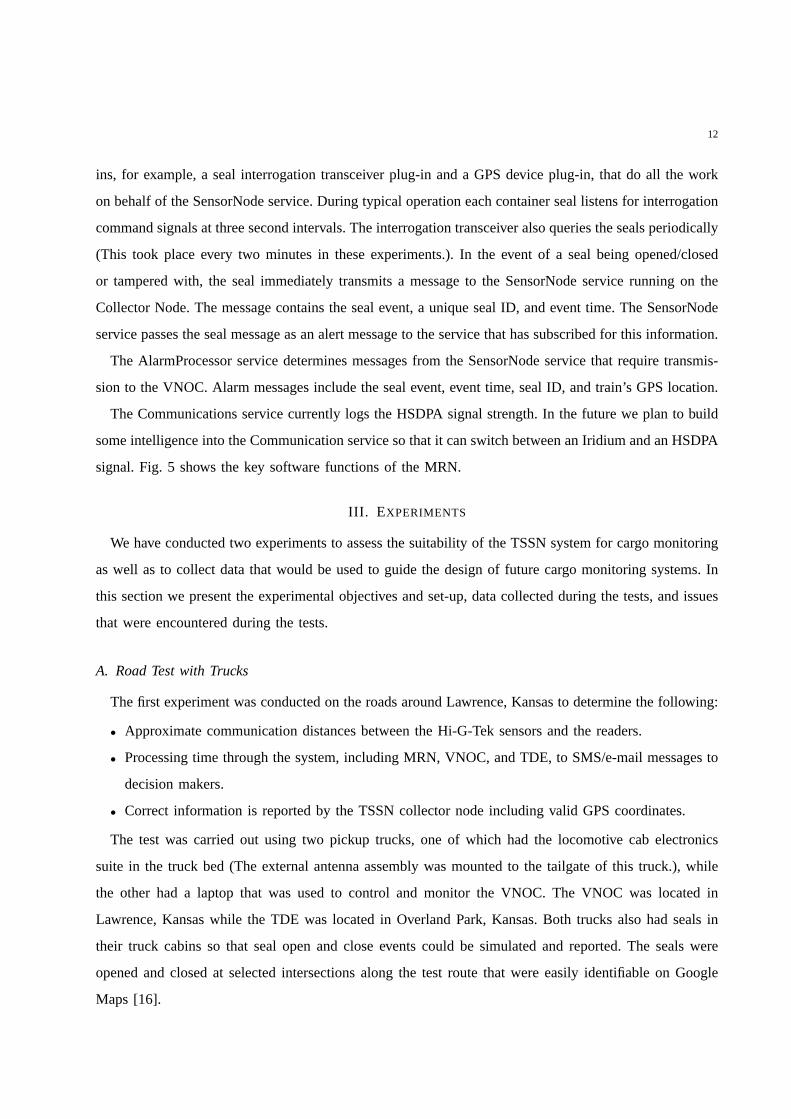
Fig. 5. Mobile Rail Network Collector Node Architecture
being implemented. The Iridium modem is a combination unit that includes a GPS receiver, which is
used to provide the MRN position information.
2) Mobile Rail Network Software:The MRN software consists of a SensorNode service, an Alarm-
Processor service, and a Communications service. The SensorNode service finds and monitors sensors
which have been assigned to its control. The SensorNode service manages several sensor software plug-
12
ins, for example, a seal interrogation transceiver plug-inand a GPS device plug-in, that do all the work
on behalf of the SensorNode service. During typical operation each container seal listens for interrogation
command signals at three second intervals. The interrogation transceiver also queries the seals periodically
(This took place every two minutes in these experiments.). Inthe event of a seal being opened/closed
or tampered with, the seal immediately transmits a message to the SensorNode service running on the
Collector Node. The message contains the seal event, a uniqueseal ID, and event time. The SensorNode
service passes the seal message as an alert message to the service that has subscribed for this information.
The AlarmProcessor service determines messages from the SensorNode service that require transmis-
sion to the VNOC. Alarm messages include the seal event, event time, seal ID, and train’s GPS location.
The Communications service currently logs the HSDPA signal strength. In the future we plan to build
some intelligence into the Communication service so that itcan switch between an Iridium and an HSDPA
signal. Fig. 5 shows the key software functions of the MRN.
III. E XPERIMENTS
We have conducted two experiments to assess the suitabilityof the TSSN system for cargo monitoring
as well as to collect data that would be used to guide the design of future cargo monitoring systems. In
this section we present the experimental objectives and set-up, data collected during the tests, and issues
that were encountered during the tests.
A. Road Test with Trucks
The first experiment was conducted on the roads around Lawrence,Kansas to determine the following:
• Approximate communication distances between the Hi-G-Teksensors and the readers.
• Processing time through the system, including MRN, VNOC, andTDE, to SMS/e-mail messages to
decision makers.
• Correct information is reported by the TSSN collector node including valid GPS coordinates.
The test was carried out using two pickup trucks, one of which had the locomotive cab electronics
suite in the truck bed (The external antenna assembly was mounted to the tailgate of this truck.), while
the other had a laptop that was used to control and monitor theVNOC. The VNOC was located in
Lawrence, Kansas while the TDE was located in Overland Park, Kansas. Both trucks also had seals in
their truck cabins so that seal open and close events could besimulated and reported. The seals were
opened and closed at selected intersections along the test route that were easily identifiable on Google
Maps [16].
13
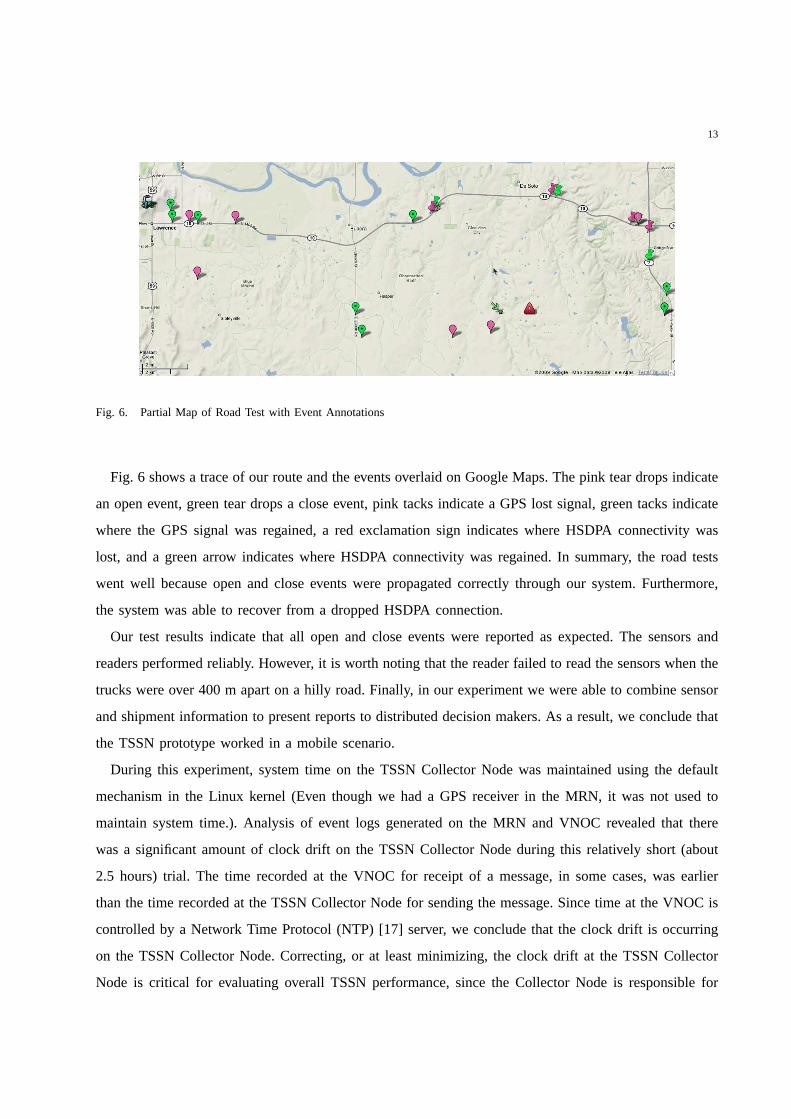
Fig. 6. Partial Map of Road Test with Event Annotations
Fig. 6 shows a trace of our route and the events overlaid on Google Maps. The pink tear drops indicate
an open event, green tear drops a close event, pink tacks indicate a GPS lost signal, green tacks indicate
where the GPS signal was regained, a red exclamation sign indicates where HSDPA connectivity was
lost, and a green arrow indicates where HSDPA connectivity was regained. In summary, the road tests
went well because open and close events were propagated correctly through our system. Furthermore,
the system was able to recover from a dropped HSDPA connection.
Our test results indicate that all open and close events werereported as expected. The sensors and
readers performed reliably. However, it is worth noting that the reader failed to read the sensors when the
trucks were over 400 m apart on a hilly road. Finally, in our experiment we were able to combine sensor
and shipment information to present reports to distributeddecision makers. As a result, we conclude that
the TSSN prototype worked in a mobile scenario.
During this experiment, system time on the TSSN Collector Node was maintained using the default
mechanism in the Linux kernel (Even though we had a GPS receiver in the MRN, it was not used to
maintain system time.). Analysis of event logs generated onthe MRN and VNOC revealed that there
was a significant amount of clock drift on the TSSN Collector Node during this relatively short (about
2.5 hours) trial. The time recorded at the VNOC for receipt of amessage, in some cases, was earlier
than the time recorded at the TSSN Collector Node for sending themessage. Since time at the VNOC is
controlled by a Network Time Protocol (NTP) [17] server, we conclude that the clock drift is occurring
on the TSSN Collector Node. Correcting, or at least minimizing,the clock drift at the TSSN Collector
Node is critical for evaluating overall TSSN performance, since the Collector Node is responsible for
14
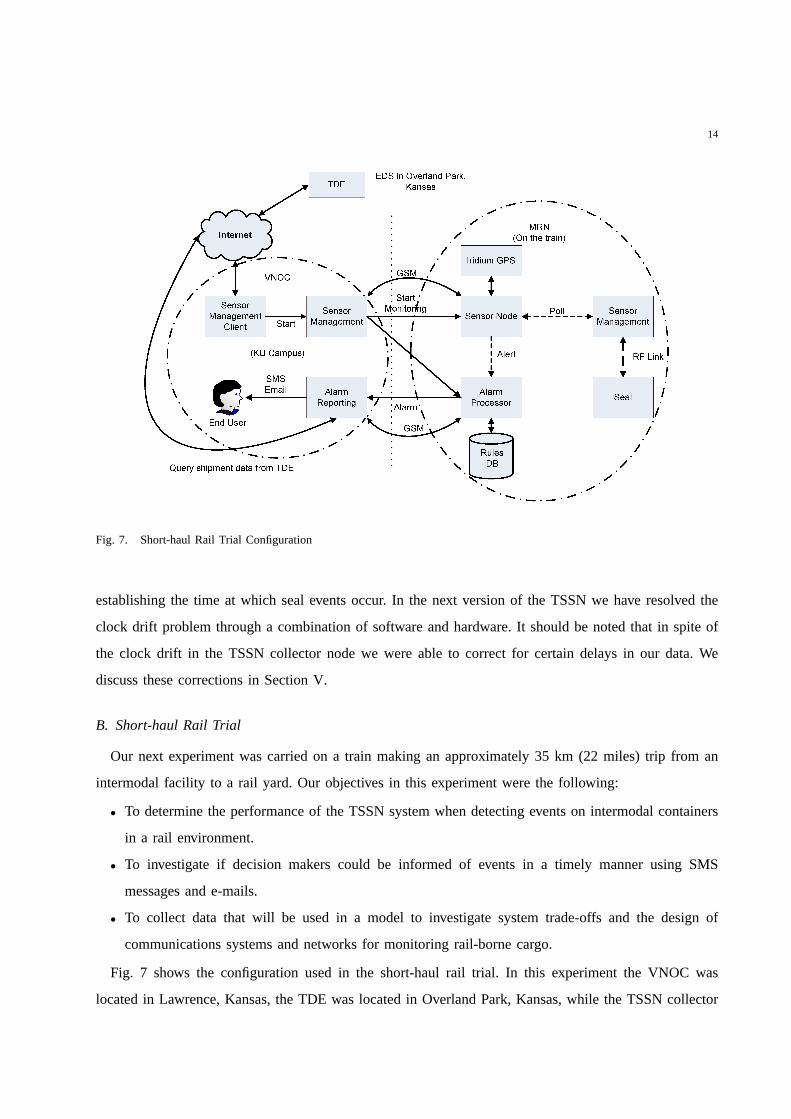
Fig. 7. Short-haul Rail Trial Configuration
establishing the time at which seal events occur. In the nextversion of the TSSN we have resolved the
clock drift problem through a combination of software and hardware. It should be noted that in spite of
the clock drift in the TSSN collector node we were able to correctfor certain delays in our data. We
discuss these corrections in Section V.
B. Short-haul Rail Trial
Our next experiment was carried on a train making an approximately 35 km (22 miles) trip from an
intermodal facility to a rail yard. Our objectives in this experiment were the following:
• To determine the performance of the TSSN system when detecting events on intermodal containers
in a rail environment.
• To investigate if decision makers could be informed of events in a timely manner using SMS
messages and e-mails.
• To collect data that will be used in a model to investigate system trade-offs and the design of
communications systems and networks for monitoring rail-borne cargo.
Fig. 7 shows the configuration used in the short-haul rail trial. In this experiment the VNOC was
located in Lawrence, Kansas, the TDE was located in Overland Park, Kansas, while the TSSN collector
15
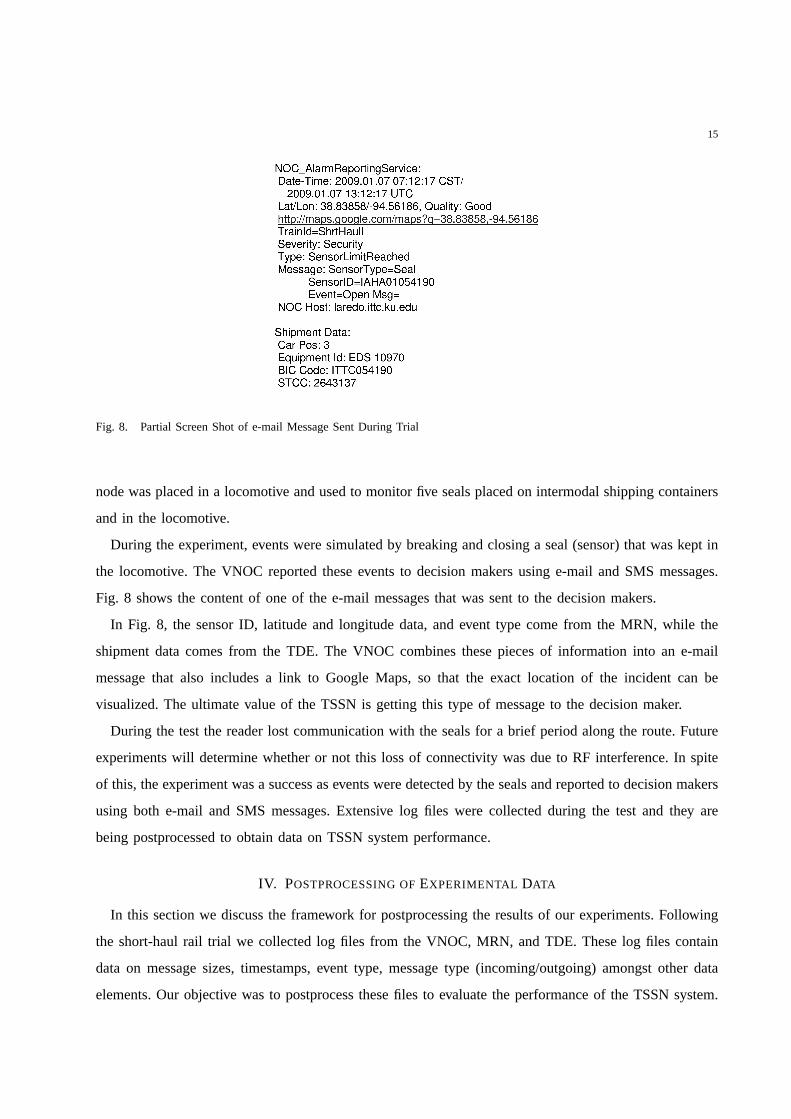
Fig. 8. Partial Screen Shot of e-mail Message Sent During Trial
node was placed in a locomotive and used to monitor five seals placed on intermodal shipping containers
and in the locomotive.
During the experiment, events were simulated by breaking and closing a seal (sensor) that was kept in
the locomotive. The VNOC reported these events to decision makers using e-mail and SMS messages.
Fig. 8 shows the content of one of the e-mail messages that was sent to the decision makers.
In Fig. 8, the sensor ID, latitude and longitude data, and event type come from the MRN, while the
shipment data comes from the TDE. The VNOC combines these piecesof information into an e-mail
message that also includes a link to Google Maps, so that the exact location of the incident can be
visualized. The ultimate value of the TSSN is getting this type ofmessage to the decision maker.
During the test the reader lost communication with the sealsfor a brief period along the route. Future
experiments will determine whether or not this loss of connectivity was due to RF interference. In spite
of this, the experiment was a success as events were detectedby the seals and reported to decision makers
using both e-mail and SMS messages. Extensive log files were collected during the test and they are
being postprocessed to obtain data on TSSN system performance.
IV. POSTPROCESSING OFEXPERIMENTAL DATA
In this section we discuss the framework for postprocessingthe results of our experiments. Following
the short-haul rail trial we collected log files from the VNOC,MRN, and TDE. These log files contain
data on message sizes, timestamps, event type, message type(incoming/outgoing) amongst other data
elements. Our objective was to postprocess these files to evaluate the performance of the TSSN system.

16
Fig. 9. LogParser Framework Showing Message Couples and Transmit/receive Pairs
Postprocessing of log files from geographically distributed computers was accomplished using a Java
library (LogParser) that was developed in-house. First, the library read in all available information in
each log file including time, message size, from and to addresses, as well as the original SOAP message.
Information from all (MRN, VNOC, and TDE) of the log files in an experiment was combined into a
single collection of log entries. We expect that every message transmitted in the TSSN should result in
at least two log entries—a transmit log entry (at the originating entity) and a received log entry (at the
receiving entity). The LogParser library identified log entries as:
• Transmit/receive pairs, that is, the outgoing and incominglog entries with the same SOAP WS-
Addressing (The SOAP WS-Addressing specification “provides transport-neutral mechanisms to
address Web services and messages [18].”), and
• Couples, that is, SOAP request/response message pairs.
Fig. 9 shows the relationship between log entry couples and transmit/receive pairs. Suppose the TDE
sends a message to the VNOC requesting the current MRN location. The circled “1” and “2” in Fig. 9
denote the log entries representing message transmission from the TDE and receipt of this same message
at the VNOC. Couples are a bit more involved; much of the communication between client/server is
based on a request/response model. As a result, there are tworelated messages which contain additional
information to establish their relationship:
17
1) REQUEST: from client to server asking for something; and
2) RESPONSE: from server back to the client with the response.
Log entry couples are marked by the records for the outgoing request and response messages. Conse-
quently, the circled “3” and “5” in Fig. 9 constitute the log entry couple for the VNOC forwarding the
location request message to the MRN and the MRN’s origination of a response respectively. Using the
receive pairs for records “3” and “5”, we can also identify entries “4” and “6.”
With this framework, programs were written against the log entry collection to extract the number of
messages sent by each service, request/response time for messages, processing time at either the MRN,
VNOC, or TDE, the time that messages were carried by the network, and message sizes. Additional
information, for example, latitude, longitude, sensor IDs, and event timestamps, could be extracted from
the SOAP message using XPath expressions. XML Path language (XPath) allows for addressing “parts
of an XML document [19].” XPath also provides “basic facilities for manipulation of strings, numbers
and booleans [19].”
V. RESULTS
In this section we discuss the results of the TSSN system evaluation based on the short-haul rail trial.
One objective of our experiments was to determine whether decision makers could be notified of events
in a timely manner. Due to significant clock drift in the TSSN collector node, we can only present an
estimate of the time taken for an event report to travel from the MRN to the VNOC. However, exact
time values can be computed for other TSSN component interactions.
In addition, we present time statistics on interactions between the TSSN component subsystems. These
statistics hint at how the aggregate time from event detection to decision maker notification is distributed
among the various services and communication links in the TSSN.With this information we will be able
to guide system refinements to further reduce the overall time. In our analysis we present results on the
following:
• Service request processing time.This is the time between when a service receives a request and
when a response message is composed. Using Fig. 9, this time can be computed as the time difference
between log entries “5” and “4.”
• Request/response time.This is the time taken to get a response from a remote service, including
the processing time. Using Fig. 9, this time can be computed asthe time difference between log
entries “6” and “3.”
18
• Network time. This is the time taken to get a response from a remote service, excluding the
processing time. This can be computed by subtracting the service request processing time from the
request/response time.
Our time analysis in this section will examine request/response messages going from the VNOC to the
MRN back to the VNOC, from the TDE to the VNOC back to the TDE, and from the VNOC to the
TDE back to the VNOC.
A second objective for the short-haul rail trial was to confirmthat messages were being passed correctly
between the different components of the TSSN. As a result, we provide a summary of the messages
exchanged between different parts of the TSSN system.
The last objective of the short-haul rail trial was to collectdata that will be used in a model [20] to
design systems for monitoring rail-borne cargo and determine trade-offs. Message sizes and interevent
times are two components of this model. As a result, we present a table summarizing the message size2
statistics between different components of the TSSN. We also present histograms summarizing message
intercommand and interalarm times at the MRN. Both of these times are needed, in conjunction with
message sizes, to compute the cost of reporting messages (Both the alarms and commands were simulated
in our experiment; deployed systems will show different statistics for intercommand and interalarm times.).
Finally, this section also presents results showing how HSDPAsignal strength varied with time during
the short-haul test. The HSDPA signal strength results may be used to help determine when to switch
between HSDPA and Iridium.
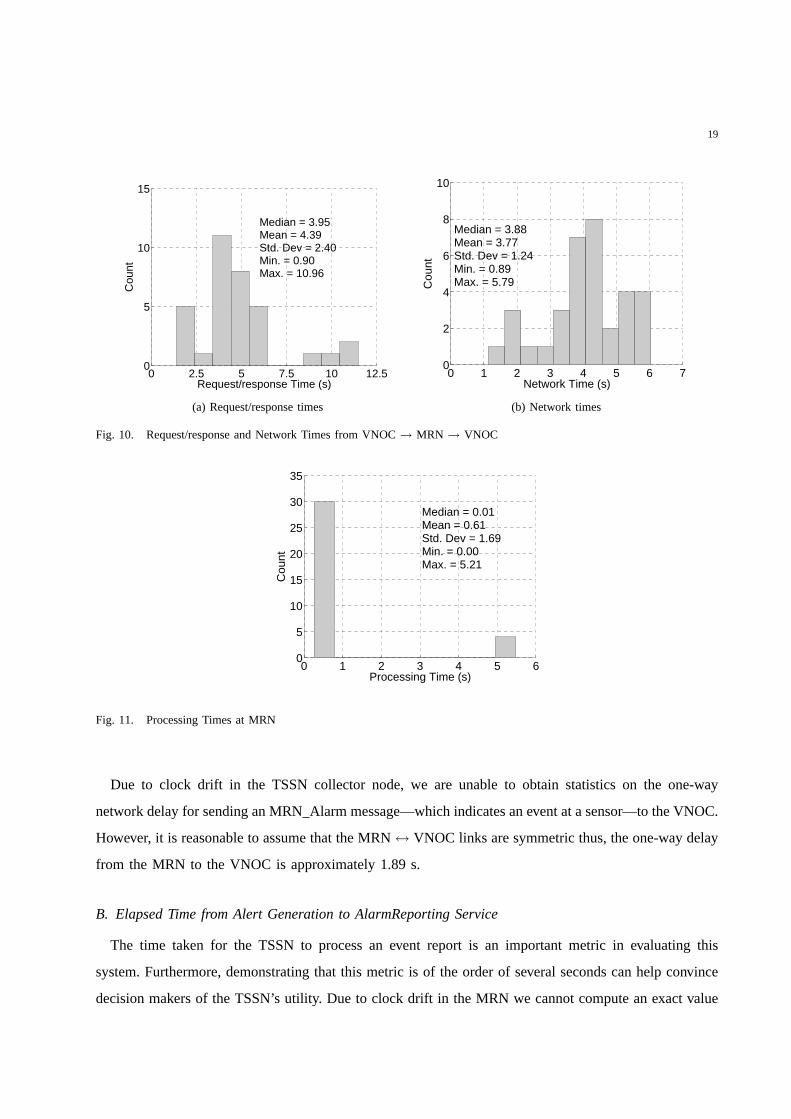
A. VNOC to MRN to VNOC Interaction
The statistics on VNOC to MRN to VNOC interaction allow us to draw conclusions on the time taken
to complete one component of processing startMonitoring, stopMonitoring, and getLocation messages. In
addition, these statistics allow us to gain insight into theone-way network delay from the TSSN collector
node to the VNOC—a delay that is one component of sending an event report from the MRN to the
VNOC. Fig. 10a is a histogram showing the request/response time for messages going from the VNOC to
the MRN and back to the VNOC. Using Figs. 10b and 11 we cannot conclude that the request/response
time is dominated by the processing time. In this instance the request/response time appears almost
equally split between the processing and network times. Note that in Fig. 11 our minimum is0 within
the resolution of the experiment.
2It should be noted that message sizes can be computeda priori; however, the distribution of these messages cannot be
determined beforehand.
19
0 2.5 5 7.5 10 12.50
5
10
15
Median = 3.95 Mean = 4.39 Std. Dev = 2.40Min. = 0.90 Max. = 10.96
Request/response Time (s)
Cou
nt
(a) Request/response times
0 1 2 3 4 5 6 70
2
4
6
8
10
Median = 3.88 Mean = 3.77 Std. Dev = 1.24Min. = 0.89 Max. = 5.79
Network Time (s)
Cou
nt
(b) Network times
Fig. 10. Request/response and Network Times from VNOC→ MRN → VNOC
0 1 2 3 4 5 60
5
10
15
20
25
30
35
Median = 0.01 Mean = 0.61 Std. Dev = 1.69Min. = 0.00 Max. = 5.21
Processing Time (s)
Cou
nt
Fig. 11. Processing Times at MRN
Due to clock drift in the TSSN collector node, we are unable to obtain statistics on the one-way
network delay for sending an MRNAlarm message—which indicates an event at a sensor—to the VNOC.
However, it is reasonable to assume that the MRN↔ VNOC links are symmetric thus, the one-way delay
from the MRN to the VNOC is approximately 1.89 s.
B. Elapsed Time from Alert Generation to AlarmReporting Service
The time taken for the TSSN to process an event report is an important metric in evaluating this
system. Furthermore, demonstrating that this metric is of the order of several seconds can help convince
decision makers of the TSSN’s utility. Due to clock drift in the MRN we cannot compute an exact value
20
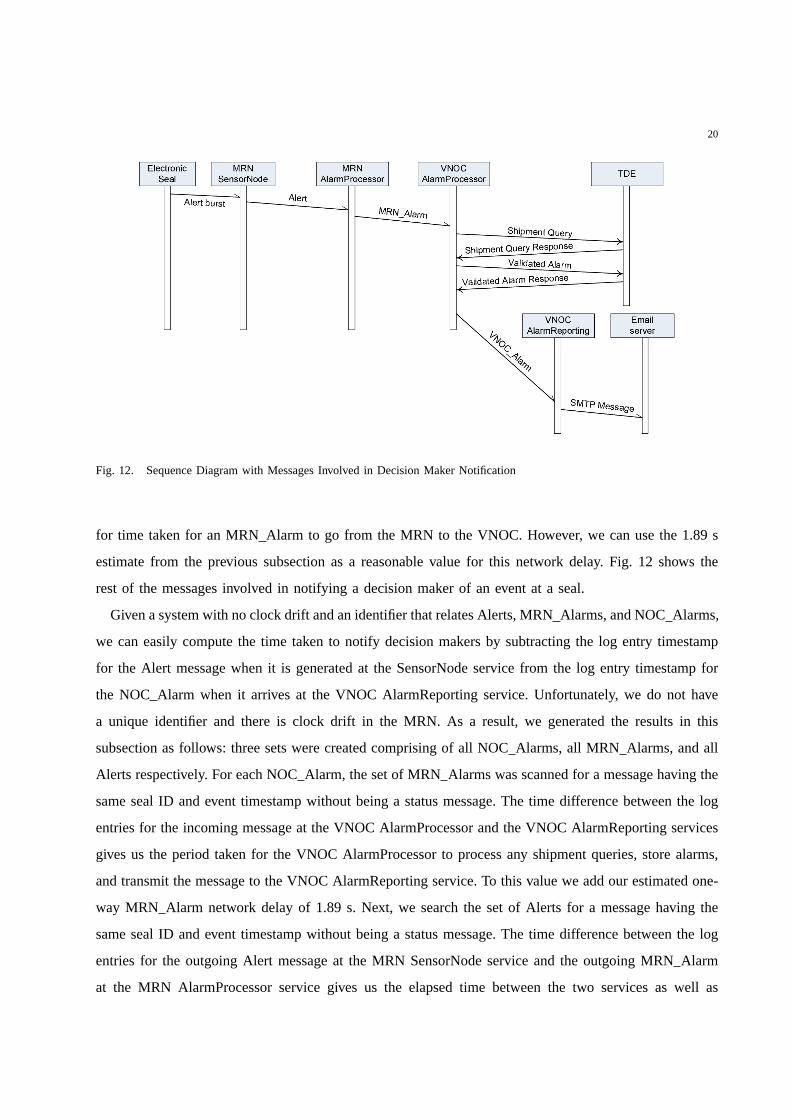
Fig. 12. Sequence Diagram with Messages Involved in Decision Maker Notification
for time taken for an MRNAlarm to go from the MRN to the VNOC. However, we can use the 1.89 s
estimate from the previous subsection as a reasonable valuefor this network delay. Fig. 12 shows the
rest of the messages involved in notifying a decision maker of an event at a seal.
Given a system with no clock drift and an identifier that relates Alerts, MRN Alarms, and NOCAlarms,
we can easily compute the time taken to notify decision makers by subtracting the log entry timestamp
for the Alert message when it is generated at the SensorNode service from the log entry timestamp for
the NOC Alarm when it arrives at the VNOC AlarmReporting service. Unfortunately, we do not have
a unique identifier and there is clock drift in the MRN. As a result, we generated the results in this
subsection as follows: three sets were created comprising of all NOC Alarms, all MRN Alarms, and all
Alerts respectively. For each NOCAlarm, the set of MRNAlarms was scanned for a message having the
same seal ID and event timestamp without being a status message. The time difference between the log
entries for the incoming message at the VNOC AlarmProcessor and the VNOC AlarmReporting services
gives us the period taken for the VNOC AlarmProcessor to process any shipment queries, store alarms,
and transmit the message to the VNOC AlarmReporting service. To this value we add our estimated one-
way MRN Alarm network delay of 1.89 s. Next, we search the set of Alerts for a message having the
same seal ID and event timestamp without being a status message. The time difference between the log
entries for the outgoing Alert message at the MRN SensorNode service and the outgoing MRNAlarm
at the MRN AlarmProcessor service gives us the elapsed time between the two services as well as
21
2 3 4 5 60
20
40
60
80
100
Median = 1.97 Mean = 2.08 Std. Dev = 0.32Min. = 1.92 Max. = 4.91
Elapsed Time (s)
Cou
nt
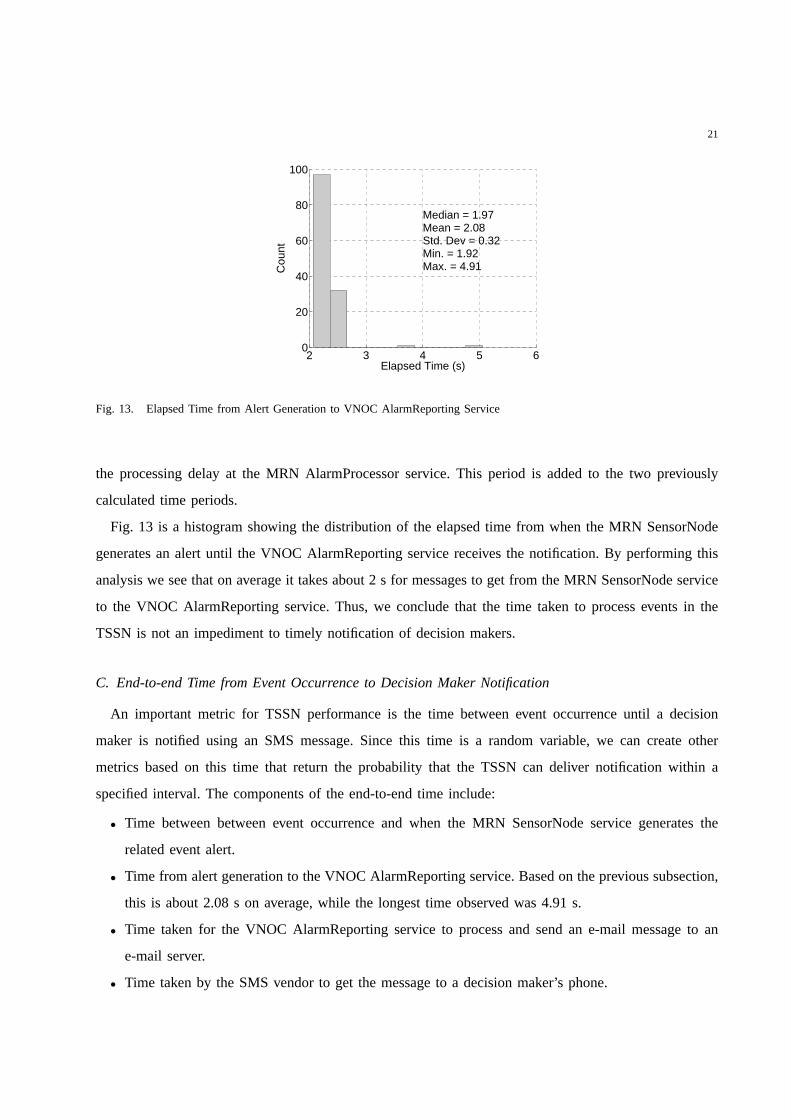
Fig. 13. Elapsed Time from Alert Generation to VNOC AlarmReporting Service
the processing delay at the MRN AlarmProcessor service. This period is added to the two previously
calculated time periods.
Fig. 13 is a histogram showing the distribution of the elapsedtime from when the MRN SensorNode
generates an alert until the VNOC AlarmReporting service receives the notification. By performing this
analysis we see that on average it takes about 2 s for messagesto get from the MRN SensorNode service
to the VNOC AlarmReporting service. Thus, we conclude that the time taken to process events in the
TSSN is not an impediment to timely notification of decision makers.
C. End-to-end Time from Event Occurrence to Decision Maker Notification
An important metric for TSSN performance is the time between event occurrence until a decision
maker is notified using an SMS message. Since this time is a randomvariable, we can create other
metrics based on this time that return the probability that the TSSN can deliver notification within a
specified interval. The components of the end-to-end time include:
• Time between between event occurrence and when the MRN SensorNode service generates the
related event alert.
• Time from alert generation to the VNOC AlarmReporting service. Based on the previous subsection,
this is about 2.08 s on average, while the longest time observed was 4.91 s.
• Time taken for the VNOC AlarmReporting service to process and send an e-mail message to an
e-mail server.
• Time taken by the SMS vendor to get the message to a decision maker’s phone.
22
0 2 4 6 8 100
5
10
15
20
25
Median = 2.1 Mean = 2.7 Std. Dev = 1.9Min. = 0.8 Max. = 8.8
Event Detection Time (s)
Cou
nt
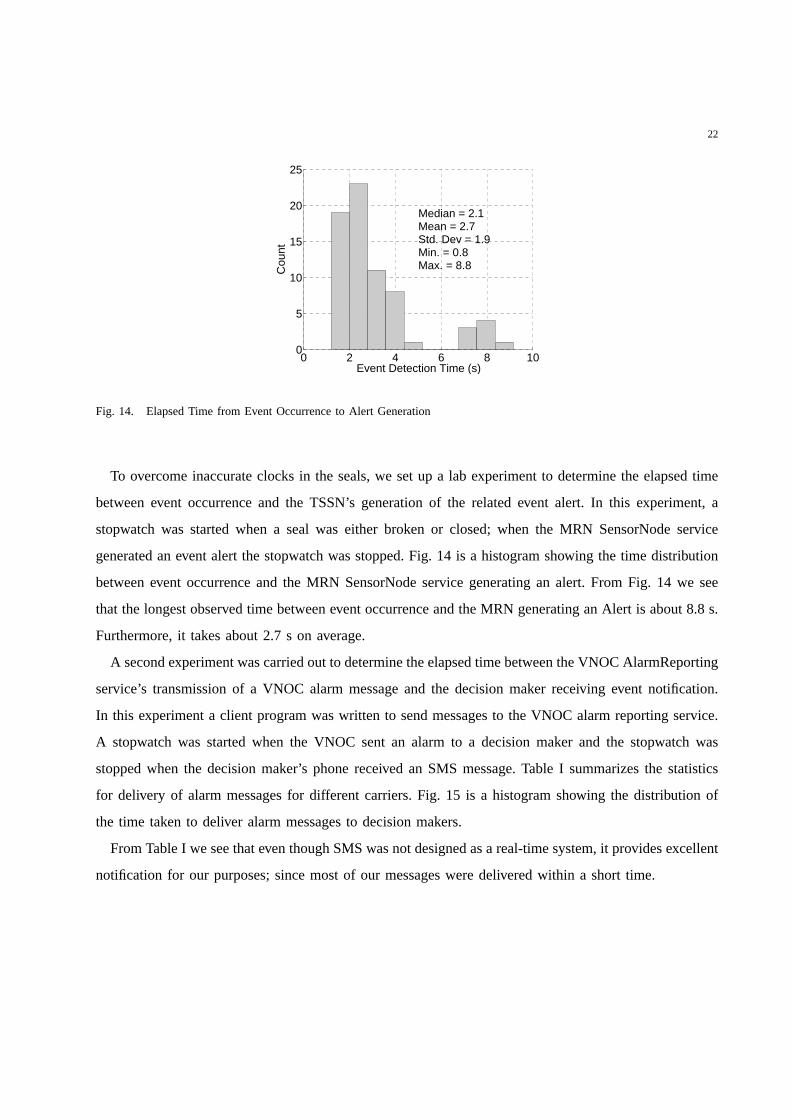
Fig. 14. Elapsed Time from Event Occurrence to Alert Generation
To overcome inaccurate clocks in the seals, we set up a lab experiment to determine the elapsed time
between event occurrence and the TSSN’s generation of the related event alert. In this experiment, a
stopwatch was started when a seal was either broken or closed; when the MRN SensorNode service
generated an event alert the stopwatch was stopped. Fig. 14 isa histogram showing the time distribution
between event occurrence and the MRN SensorNode service generating an alert. From Fig. 14 we see
that the longest observed time between event occurrence andthe MRN generating an Alert is about 8.8 s.
Furthermore, it takes about 2.7 s on average.
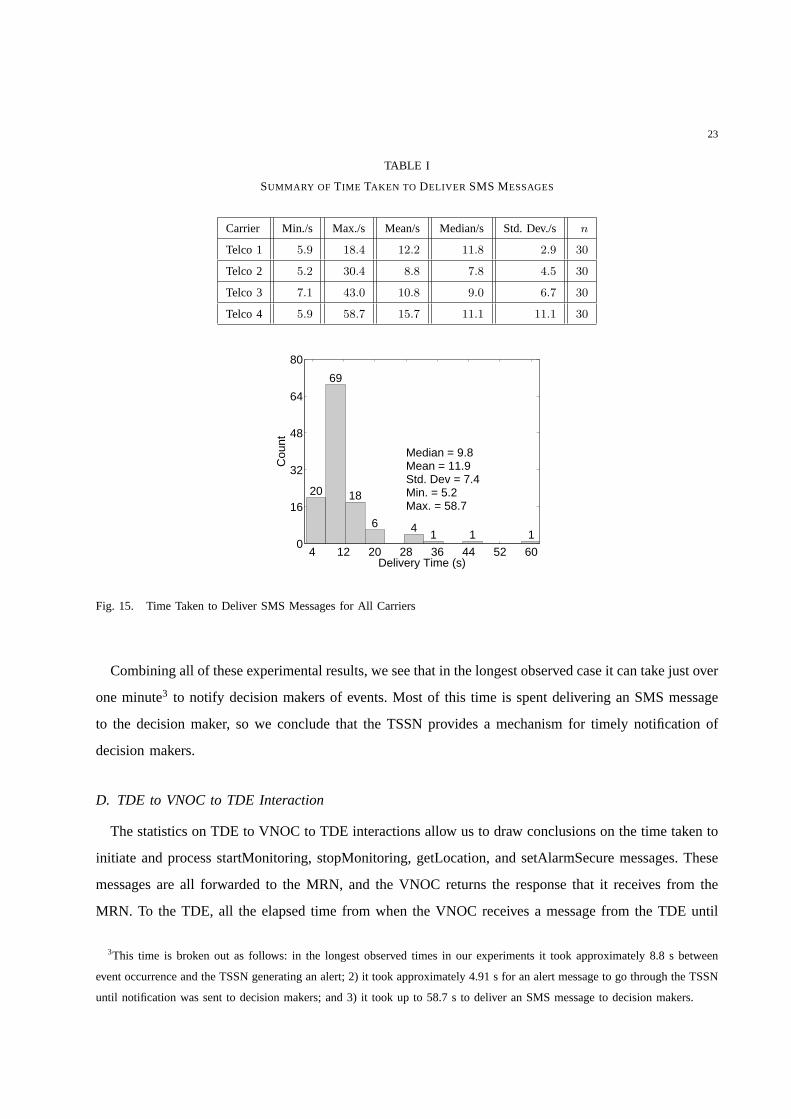
A second experiment was carried out to determine the elapsedtime between the VNOC AlarmReporting
service’s transmission of a VNOC alarm message and the decision maker receiving event notification.
In this experiment a client program was written to send messages to the VNOC alarm reporting service.
A stopwatch was started when the VNOC sent an alarm to a decision maker and the stopwatch was
stopped when the decision maker’s phone received an SMS message. Table I summarizes the statistics
for delivery of alarm messages for different carriers. Fig. 15 is a histogram showing the distribution of
the time taken to deliver alarm messages to decision makers.
From Table I we see that even though SMS was not designed as a real-time system, it provides excellent
notification for our purposes; since most of our messages weredelivered within a short time.
23
TABLE I
SUMMARY OF TIME TAKEN TO DELIVER SMS MESSAGES
Carrier Min./s Max./s Mean/s Median/s Std. Dev./s n
Telco 1 5.9 18.4 12.2 11.8 2.9 30
Telco 2 5.2 30.4 8.8 7.8 4.5 30
Telco 3 7.1 43.0 10.8 9.0 6.7 30
Telco 4 5.9 58.7 15.7 11.1 11.1 30
4 12 20 28 36 44 52 600
16
32
48
64
80
Delivery Time (s)
Cou
nt
Median = 9.8 Mean = 11.9 Std. Dev = 7.4Min. = 5.2 Max. = 58.7
20
69
18
6 41 1 1
Fig. 15. Time Taken to Deliver SMS Messages for All Carriers
Combining all of these experimental results, we see that in the longest observed case it can take just over
one minute3 to notify decision makers of events. Most of this time is spent delivering an SMS message
to the decision maker, so we conclude that the TSSN provides a mechanism for timely notification of
decision makers.
D. TDE to VNOC to TDE Interaction
The statistics on TDE to VNOC to TDE interactions allow us to drawconclusions on the time taken to
initiate and process startMonitoring, stopMonitoring, getLocation, and setAlarmSecure messages. These
messages are all forwarded to the MRN, and the VNOC returns the response that it receives from the
MRN. To the TDE, all the elapsed time from when the VNOC receivesa message from the TDE until
3This time is broken out as follows: in the longest observed times in our experiments it took approximately 8.8 s between
event occurrence and the TSSN generating an alert; 2) it took approximately 4.91 s for an alert message to go through the TSSN
until notification was sent to decision makers; and 3) it took up to 58.7 s to deliver an SMS message to decision makers.
24
0 2.5 5 7.5 10 12.50
2
4
6
8
10
12
Median = 3.94 Mean = 4.29 Std. Dev = 2.51Min. = 0.34 Max. = 11.03
Request/response Time (s)
Cou
nt
(a) Request/response times
0 1 2 3 4 50
10
20
30
40
Median = 0.04 Mean = 0.14 Std. Dev = 0.64Min. = 0.00 Max. = 4.00
Network Time (s)
Cou
nt
(b) Network times
Fig. 16. Request/response and Network Times from TDE→ VNOC → TDE
0 2.5 5 7.5 10 12.50
2
4
6
8
10
12
14
Median = 3.85 Mean = 4.15 Std. Dev = 2.45Min. = 0.29 Max. = 10.98
Processing Time (s)
Cou
nt
Fig. 17. Processing Times at VNOC
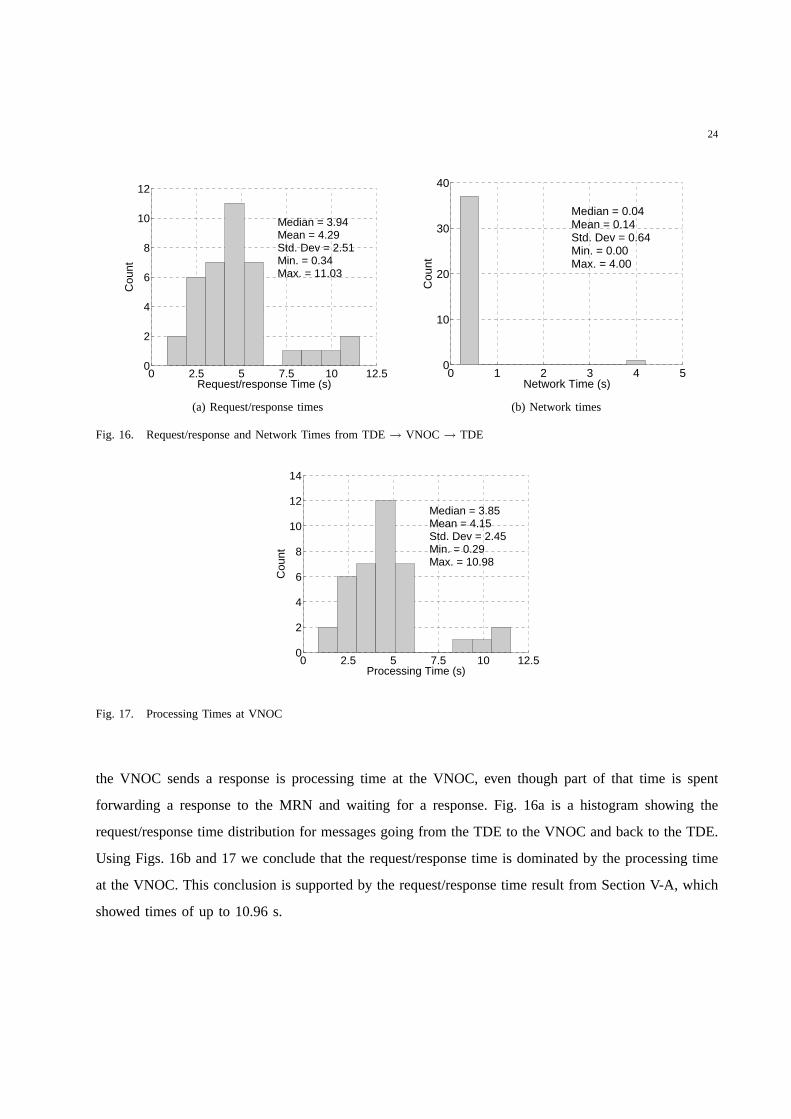
the VNOC sends a response is processing time at the VNOC, eventhough part of that time is spent
forwarding a response to the MRN and waiting for a response. Fig. 16a is a histogram showing the
request/response time distribution for messages going from the TDE to the VNOC and back to the TDE.
Using Figs. 16b and 17 we conclude that the request/response time is dominated by the processing time
at the VNOC. This conclusion is supported by the request/response time result from Section V-A, which
showed times of up to 10.96 s.
25
0 0.1 0.2 0.3 0.4 0.50
5
10
15
20
25
30
35Median = 0.07 Mean = 0.12 Std. Dev = 0.11Min. = 0.02 Max. = 0.41
Request/response Time (s)
Cou
nt
(a) Request/response times
0 0.025 0.05 0.075 0.10
5
10
15
20
25
30
35
Median = 0.07 Mean = 0.05 Std. Dev = 0.02Min. = 0.01 Max. = 0.08
Network Time (s)
Cou
nt
(b) Network times
Fig. 18. Request/response and Network Times from VNOC→ TDE → VNOC
0 0.1 0.2 0.3 0.4 0.50
10
20
30
40
50
60
70Median = 0.01 Mean = 0.07 Std. Dev = 0.10Min. = 0.01 Max. = 0.38
Processing Time (s)
Cou
nt
Fig. 19. Processing Times at TDE
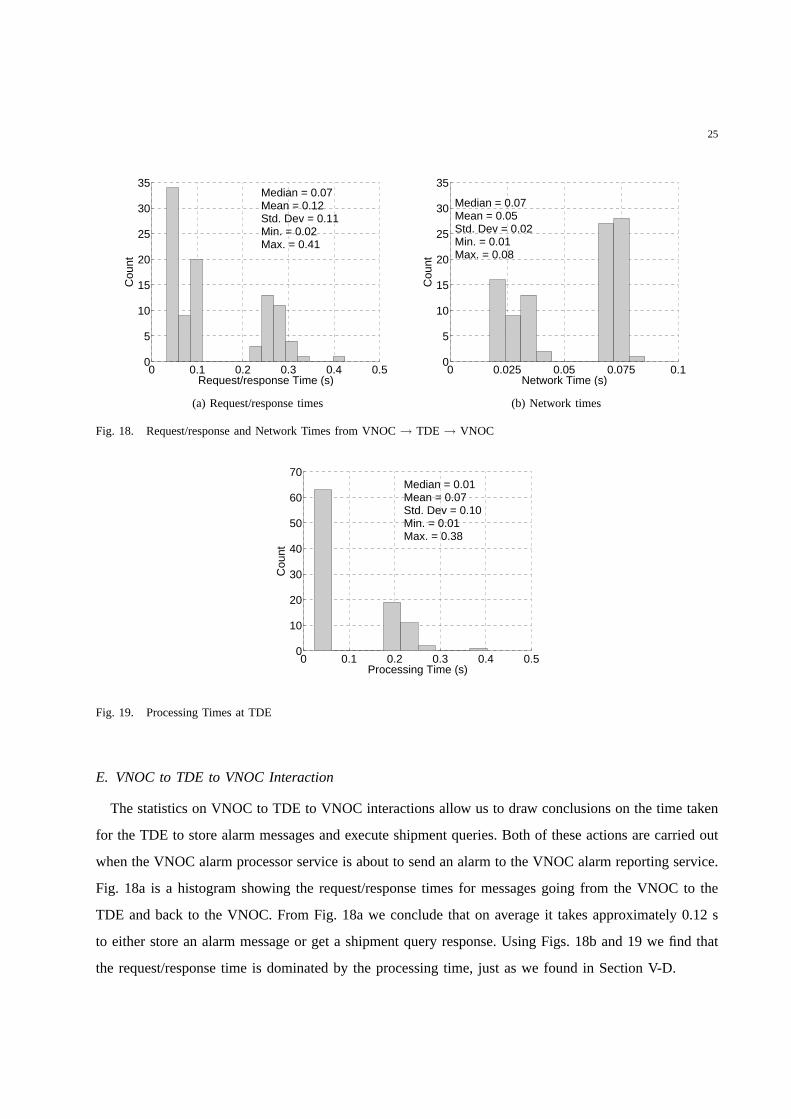
E. VNOC to TDE to VNOC Interaction
The statistics on VNOC to TDE to VNOC interactions allow us to draw conclusions on the time taken
for the TDE to store alarm messages and execute shipment queries. Both of these actions are carried out
when the VNOC alarm processor service is about to send an alarm to the VNOC alarm reporting service.
Fig. 18a is a histogram showing the request/response times for messages going from the VNOC to the
TDE and back to the VNOC. From Fig. 18a we conclude that on averageit takes approximately 0.12 s
to either store an alarm message or get a shipment query response. Using Figs. 18b and 19 we find that
the request/response time is dominated by the processing time, just as we found in Section V-D.
26
TABLE II
SUMMARY OF TIME STATISTICS
Description Min./s Max./s Mean/s Median/s Std. Dev./s
Request/response times from VNOC→ MRN → VNOC 0.90 10.96 4.39 3.95 2.40
Network times from VNOC→ MRN → VNOC 0.89 5.79 3.77 3.88 1.24
Processing times from VNOC→ MRN → VNOC 0.00 5.21 0.61 0.01 1.69
Event occurrence to alert generation 0.81 8.75 2.70 2.13 1.86
Alert generation to VNOC AlarmReporting Service 1.92 4.91 2.08 1.97 0.32
Request/response times from TDE→ VNOC → TDE 0.34 11.03 4.29 3.94 2.51
Network times from TDE→ VNOC → TDE 0.00 4.00 0.14 0.04 0.64
Processing times from TDE→ VNOC → TDE 0.29 10.98 4.15 3.85 2.45
Request/response times from VNOC→ TDE → VNOC 0.02 0.41 0.12 0.07 0.11
Network times from VNOC→ TDE → VNOC 0.01 0.08 0.05 0.07 0.02
Processing times from VNOC→ TDE → VNOC 0.01 0.38 0.07 0.01 0.10
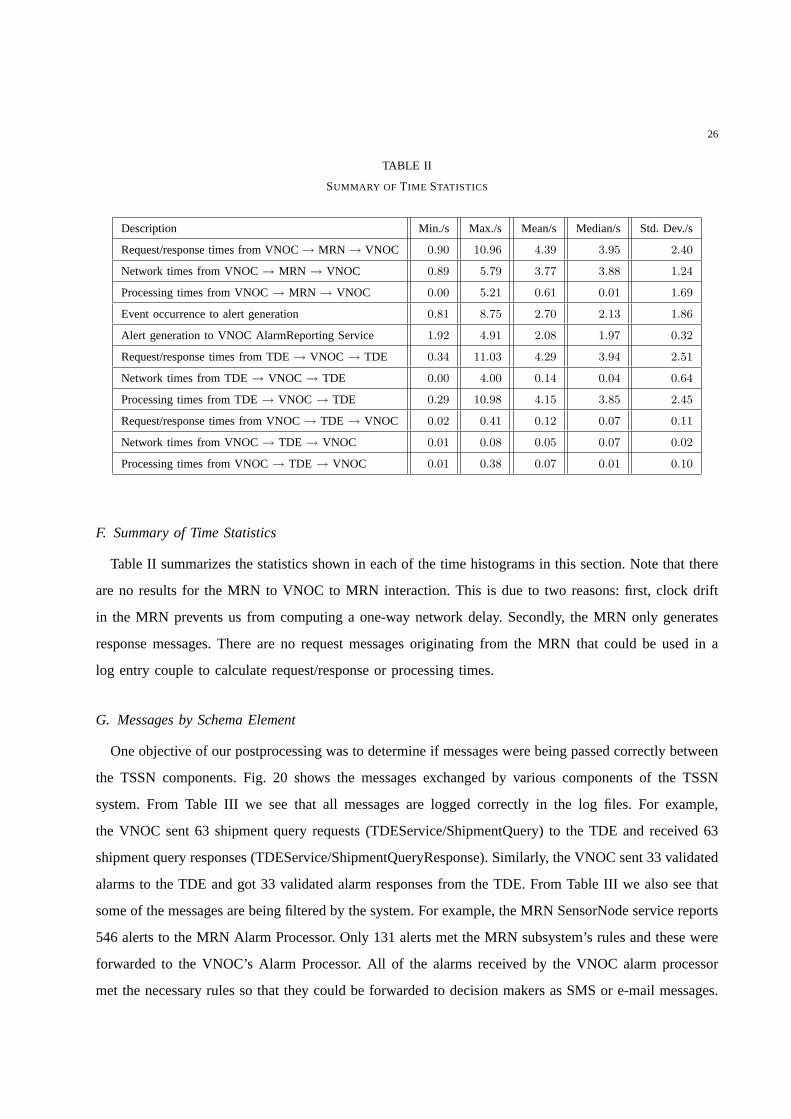
F. Summary of Time Statistics
Table II summarizes the statistics shown in each of the time histograms in this section. Note that there
are no results for the MRN to VNOC to MRN interaction. This is due to two reasons: first, clock drift
in the MRN prevents us from computing a one-way network delay. Secondly, the MRN only generates
response messages. There are no request messages originating from the MRN that could be used in a
log entry couple to calculate request/response or processing times.
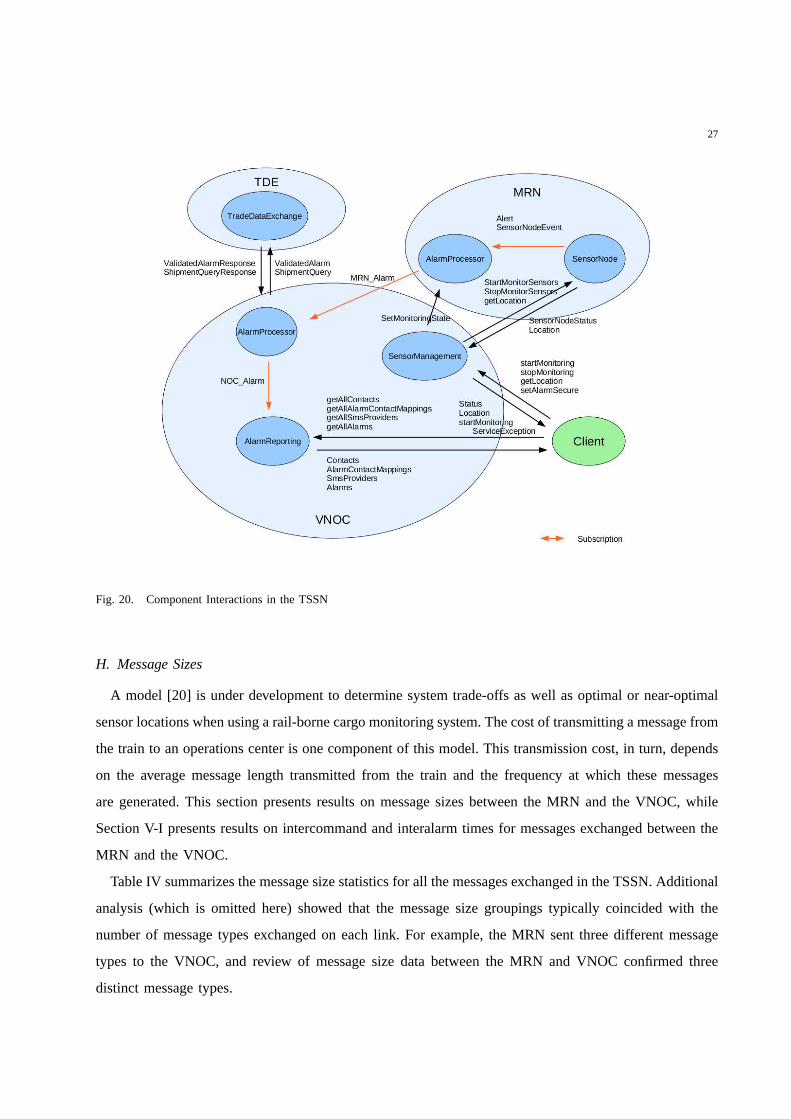
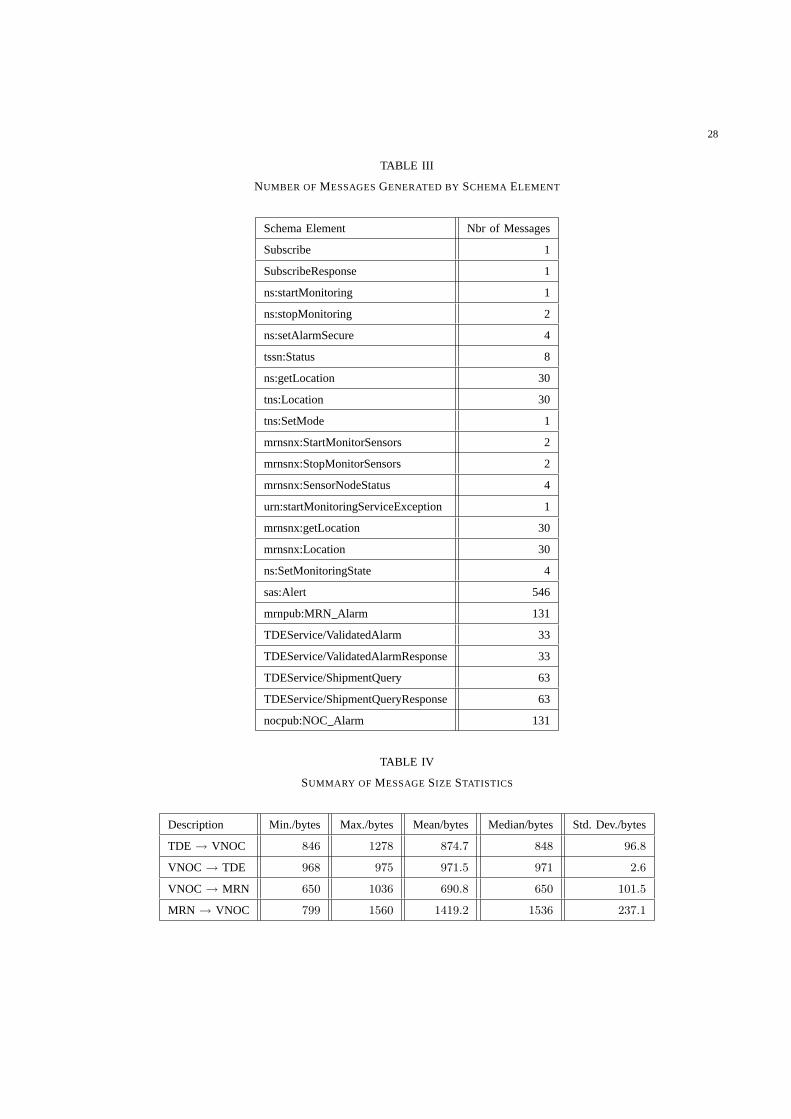
G. Messages by Schema Element
One objective of our postprocessing was to determine if messages were being passed correctly between
the TSSN components. Fig. 20 shows the messages exchanged by various components of the TSSN
system. From Table III we see that all messages are logged correctly in the log files. For example,
the VNOC sent 63 shipment query requests (TDEService/ShipmentQuery) to the TDE and received 63
shipment query responses (TDEService/ShipmentQueryResponse). Similarly, the VNOC sent 33 validated
alarms to the TDE and got 33 validated alarm responses from theTDE. From Table III we also see that
some of the messages are being filtered by the system. For example, the MRN SensorNode service reports
546 alerts to the MRN Alarm Processor. Only 131 alerts met the MRN subsystem’s rules and these were
forwarded to the VNOC’s Alarm Processor. All of the alarms received by the VNOC alarm processor
met the necessary rules so that they could be forwarded to decision makers as SMS or e-mail messages.
27
Fig. 20. Component Interactions in the TSSN
H. Message Sizes
A model [20] is under development to determine system trade-offs as well as optimal or near-optimal
sensor locations when using a rail-borne cargo monitoring system. The cost of transmitting a message from
the train to an operations center is one component of this model. This transmission cost, in turn, depends
on the average message length transmitted from the train andthe frequency at which these messages
are generated. This section presents results on message sizes between the MRN and the VNOC, while
Section V-I presents results on intercommand and interalarmtimes for messages exchanged between the
MRN and the VNOC.
Table IV summarizes the message size statistics for all the messages exchanged in the TSSN. Additional
analysis (which is omitted here) showed that the message size groupings typically coincided with the
number of message types exchanged on each link. For example,the MRN sent three different message
types to the VNOC, and review of message size data between theMRN and VNOC confirmed three
distinct message types.
28
TABLE III
NUMBER OF MESSAGESGENERATED BY SCHEMA ELEMENT
Schema Element Nbr of Messages
Subscribe 1
SubscribeResponse 1
ns:startMonitoring 1
ns:stopMonitoring 2
ns:setAlarmSecure 4
tssn:Status 8
ns:getLocation 30
tns:Location 30
tns:SetMode 1
mrnsnx:StartMonitorSensors 2
mrnsnx:StopMonitorSensors 2
mrnsnx:SensorNodeStatus 4
urn:startMonitoringServiceException 1
mrnsnx:getLocation 30
mrnsnx:Location 30
ns:SetMonitoringState 4
sas:Alert 546
mrnpub:MRN Alarm 131
TDEService/ValidatedAlarm 33
TDEService/ValidatedAlarmResponse 33
TDEService/ShipmentQuery 63
TDEService/ShipmentQueryResponse 63
nocpub:NOCAlarm 131
TABLE IV
SUMMARY OF MESSAGESIZE STATISTICS
Description Min./bytes Max./bytes Mean/bytes Median/bytes Std. Dev./bytes
TDE → VNOC 846 1278 874.7 848 96.8
VNOC → TDE 968 975 971.5 971 2.6
VNOC → MRN 650 1036 690.8 650 101.5
MRN → VNOC 799 1560 1419.2 1536 237.1
29
0 1000 2000 3000 4000 50000
5
10
15
20
Median = 555.13 Mean = 517.53 Std. Dev = 662.83Min. = 23.86 Max. = 3965.67
Intercommand Time (s)
Cou
nt
(a) Intercommand
0 500 1000 1500 2000 25000
25
50
75
100
125
150
Median = 9.70 Mean = 131.37 Std. Dev = 342.12Min. = 1.08 Max. = 2363.20
Interalarm Time (s)
Cou
nt
(b) Interalarm
Fig. 21. Intercommand and Interalarm Times at MRN
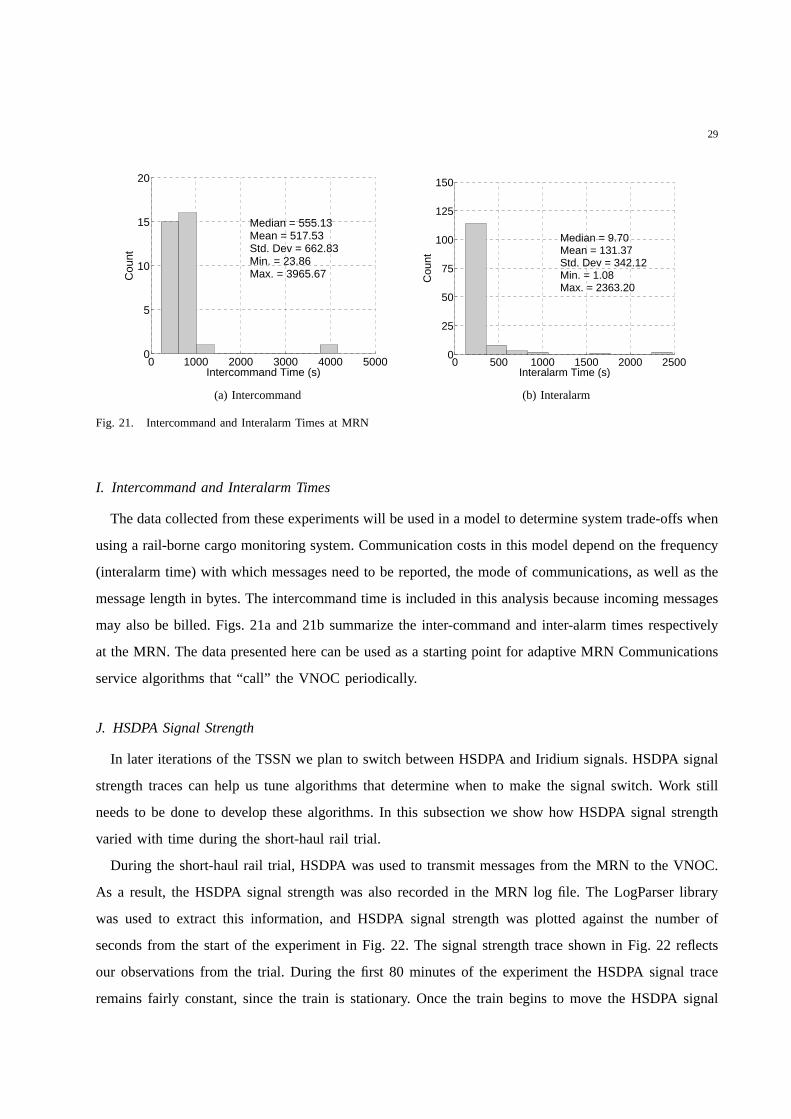
I. Intercommand and Interalarm Times
The data collected from these experiments will be used in a model to determine system trade-offs when
using a rail-borne cargo monitoring system. Communicationcosts in this model depend on the frequency
(interalarm time) with which messages need to be reported, the mode of communications, as well as the
message length in bytes. The intercommand time is included inthis analysis because incoming messages
may also be billed. Figs. 21a and 21b summarize the inter-command and inter-alarm times respectively
at the MRN. The data presented here can be used as a starting point for adaptive MRN Communications
service algorithms that “call” the VNOC periodically.
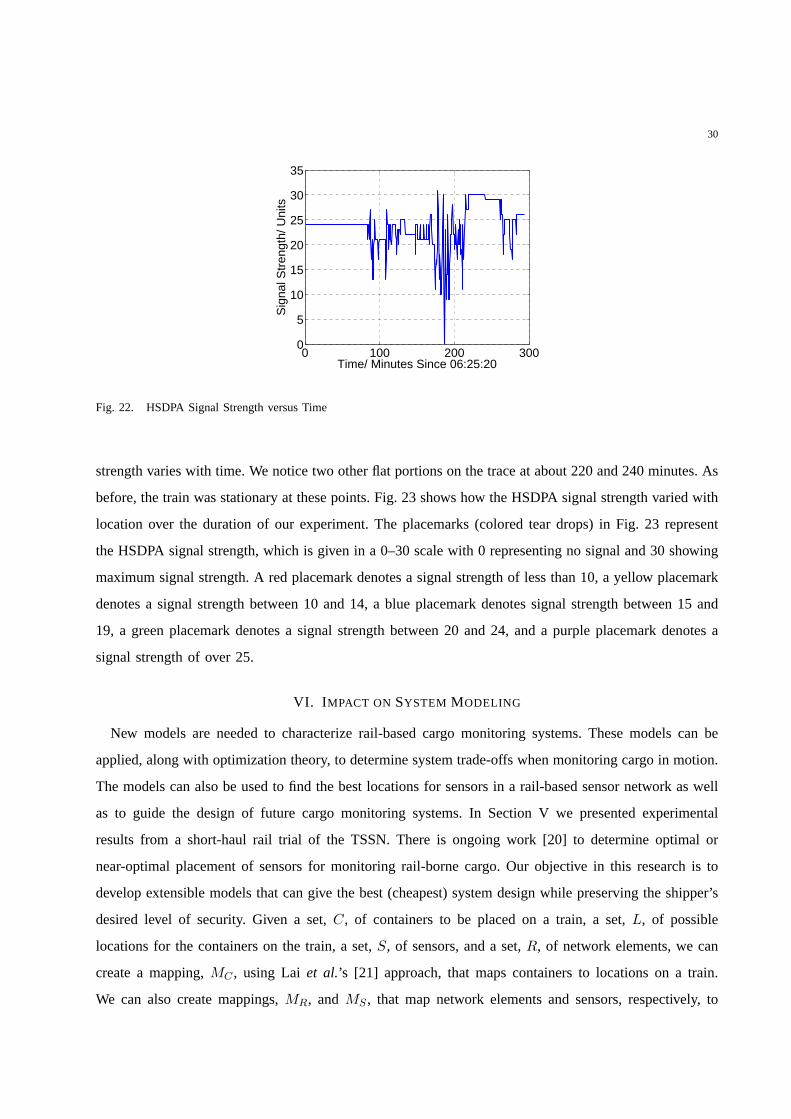
J. HSDPA Signal Strength
In later iterations of the TSSN we plan to switch between HSDPA andIridium signals. HSDPA signal
strength traces can help us tune algorithms that determine when to make the signal switch. Work still
needs to be done to develop these algorithms. In this subsection we show how HSDPA signal strength
varied with time during the short-haul rail trial.
During the short-haul rail trial, HSDPA was used to transmit messages from the MRN to the VNOC.
As a result, the HSDPA signal strength was also recorded in theMRN log file. The LogParser library
was used to extract this information, and HSDPA signal strength was plotted against the number of
seconds from the start of the experiment in Fig. 22. The signal strength trace shown in Fig. 22 reflects
our observations from the trial. During the first 80 minutes ofthe experiment the HSDPA signal trace
remains fairly constant, since the train is stationary. Once the train begins to move the HSDPA signal
30
0 100 200 3000
5
10
15
20
25
30
35
Time/ Minutes Since 06:25:20
Sig
nal S
tren
gth/
Uni
ts
Fig. 22. HSDPA Signal Strength versus Time
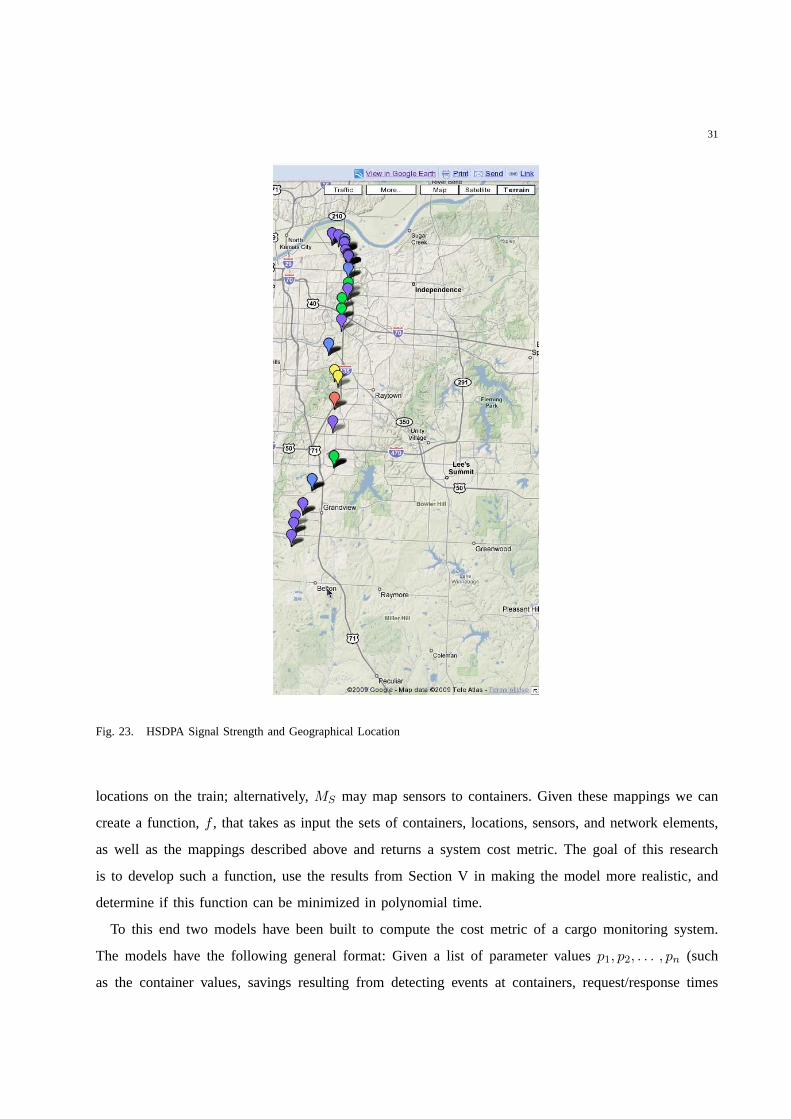
strength varies with time. We notice two other flat portions onthe trace at about 220 and 240 minutes. As
before, the train was stationary at these points. Fig. 23 shows how the HSDPA signal strength varied with
location over the duration of our experiment. The placemarks(colored tear drops) in Fig. 23 represent
the HSDPA signal strength, which is given in a 0–30 scale with 0representing no signal and 30 showing
maximum signal strength. A red placemark denotes a signal strength of less than 10, a yellow placemark
denotes a signal strength between 10 and 14, a blue placemarkdenotes signal strength between 15 and
19, a green placemark denotes a signal strength between 20 and 24, and a purple placemark denotes a
signal strength of over 25.
VI. I MPACT ON SYSTEM MODELING
New models are needed to characterize rail-based cargo monitoring systems. These models can be
applied, along with optimization theory, to determine system trade-offs when monitoring cargo in motion.
The models can also be used to find the best locations for sensorsin a rail-based sensor network as well
as to guide the design of future cargo monitoring systems. InSection V we presented experimental
results from a short-haul rail trial of the TSSN. There is ongoingwork [20] to determine optimal or
near-optimal placement of sensors for monitoring rail-borne cargo. Our objective in this research is to
develop extensible models that can give the best (cheapest)system design while preserving the shipper’s
desired level of security. Given a set,C, of containers to be placed on a train, a set,L, of possible
locations for the containers on the train, a set,S, of sensors, and a set,R, of network elements, we can
create a mapping,MC , using Lai et al.’s [21] approach, that maps containers to locations on a train.
We can also create mappings,MR, and MS , that map network elements and sensors, respectively, to
31
Fig. 23. HSDPA Signal Strength and Geographical Location
locations on the train; alternatively,MS may map sensors to containers. Given these mappings we can
create a function,f , that takes as input the sets of containers, locations, sensors, and network elements,
as well as the mappings described above and returns a system cost metric. The goal of this research
is to develop such a function, use the results from Section V inmaking the model more realistic, and
determine if this function can be minimized in polynomial time.
To this end two models have been built to compute the cost metric of a cargo monitoring system.
The models have the following general format: Given a list of parameter valuesp1, p2, . . . , pn (such
as the container values, savings resulting from detecting events at containers, request/response times
32
from VNOC → MRN → VNOC, and message sizes on the VNOC↔ MRN link), we define variables
x1, x2, . . . , xn (such as a variable that indicates if a sensor is placed on a certain container). We also
define a functionfo(x̄; p̄) that depends on the parameters and variables to return the system cost. (One
of the components offo includes the cost of transmitting event reports from the MRNto the VNOC.)
Our goal in this research is to minimize this objective function subject to the constraints4 specified by
the system designer. These models will be used to determine system trade-offs, such as a rail-mounted
or trackside deployment of network elements.
VII. R EFINEMENTSBASED ON PRELIMINARY RESULTS
In preparation for additional rail trials, a GPS receiver change has been implemented and other MRN
hardware system upgrades have been planned. To avoid conflicts between GPS receiver operation and
Iridium modem use, a high performance GPS receiver has been installed on the External Antenna
Assembly to replace the Iridium modem GPS functionality. The time drift issue mentioned in Section III-A
will be resolved by using the high performance GPS receiver toget high quality local time. Pulse per
second (PPS) output from the GPS receiver will be used as an input to the NTP server running on the
TSSN collector node.
In addition to a new GPS receiver, proposed enhancements to the MRN hardware prototype include
moving communications devices from the Electronics Suite to the External Antenna Assembly. The current
hardware configuration suffers from the insertion loss of thelong RF cable connections. Collector node
interconnections between the locomotive cab and the external assembly would change from an RF signal
connection to a DC power and data bus connection for each device. Moving the wireless modems and
interrogation transceiver as close as possible to the corresponding antennas is expected to provide very
significant performance improvements.
Postprocessing of the log files also indicated that a unique identifier—perhaps composed of a timestamp
and counter—is needed in the Alert, MRNAlarm, and NOCAlarm messages to trace an Alert message
through the TSSN. This identifier can also be used in the future to locate MRN Alarm messages that
need to be retransmitted to the VNOC following a loss of connectivity. Finally, the identifier can be used
to mark previously processed messages so that the VNOC does not process the same message more than
once.
4Some of these constraints specify valid placements for sensors and associated communications infrastructure. The constraints
might also require that events at certain containers be detected with a certain probability and reported within a given time interval
with specified probability.
33
Prior to deploying the TSSN system, further research is needed toaddress issues including:
• Communications infrastructure for whole train monitoring.
• Backhaul communications, including choosing when to switch between HSDPA and Iridium con-
nections.
• Development and use of a model to seek trade-offs when monitoring rail-borne cargo.
The desired result of our research is a standards-based open environment for cargo monitoring with low
entry barriers to enable broader access by stakeholders while showing a path to commercialization.
VIII. C ONCLUSION
In this paper we have presented results from preliminary fieldtrials of the TSSN (Transportation
Security Sensor Network). Within the TSSN framework we have successfully combined sensor and
shipment information to provide event notification to distributed decision makers. This paper has shown
results documenting the interactions between the different components of the TSSN. Based on our
experiments and evaluations we believe that the TSSN is viable for monitoring rail-borne cargo. These
beliefs are based on the following: first, we have successfully demonstrated that alert messages can be
sent from a moving train to geographically distributed decision makers using either SMS or e-mail.
Second, based on the experiments reported here, we are able todetect events and notify decision makers
in just over one minute. Thus, we conclude that the TSSN provides amechanism for timely notification
of decision makers.
ACKNOWLEDGMENTS
The authors would like to thank Ann Francis and Daniel Deavoursfor reading and commenting on
previous versions of this paper. We would also like to acknowledge the support of EDS, an HP company,
one of our partners on this project. Finally, we like to thank Larry Sackman of EDS, an HP company,
for assisting with the short-haul rail trial.
REFERENCES
[1] Federal Bureau of Investigation. (2006, July 21) Cargo Theft’sHigh Cost. Headline. Federal Bureau of Investigation.
[Online]. Available: http://www.fbi.gov/page2/july06/cargotheft072106.htm
[2] European Conference of Ministers of Transport,Container Transport Security Across Modes. Paris, France: Organisation
for Economic Co-operation and Development, 2005.
[3] OASIS. (2006, Oct 12) Reference Model for Service Oriented Architecture 1.0. OASIS Standard. [Online]. Available:
http://docs.oasis-open.org/soa-rm/v1.0/soa-rm.pdf
34
[4] KC SmartPort. (2008, Nov 10) Trade Data Exchange—Nothing short of a logistics revolution. Digital magazine. [Online].
Available: http://www.joc-digital.com/joc/20081110/?pg=29
[5] J. Martin et al., “Web services: Promises and compromises,”Queue, vol. 1, no. 1, pp. 48–58, Mar 2003.
[6] H. Saiedian and S. Mulkey, “Performance evaluation of eventing web services in real-time applications,”Communications
Magazine, IEEE, vol. 46, no. 3, pp. 106–111, Mar 2008.
[7] J. Brown et al., “SMS: The Short Message Service,”Computer, vol. 40, no. 12, pp. 106–110, Dec. 2007.
[8] The Apache Software Foundation. (2008, Aug 24) Apache Axis2.Project documentation. The Apache Software
Foundation. [Online]. Available: http://ws.apache.org/axis2/
[9] OpenUDDI. (2008, Mar 7) Open UDDI. Project webpage. [Online]. Available: http://openuddi.sourceforge.net/
[10] D. Griffin and D. Pesch, “A Survey on Web Services in Telecommunications,”Communications Magazine, IEEE, vol. 45,
no. 7, pp. 28–35, July 2007.
[11] Hi-G-Tek. (2009, Mar 17) Hi-G-Tek—Company. Corporate website. Hi-G-Tek. [Online]. Available: http://www.higtek.com/
[12] D. Mulvey, “HSPA,” Communications Engineer, vol. 5, no. 1, pp. 38–41, February-March 2007.
[13] C. E. Fossaet al., “An overview of the IRIDIUM (R) low Earth orbit (LEO) satellite system,”in Proc. IEEE 1998 National
Aerospace and Electronics Conference, (NAECON 1998), Dayton, OH, USA, Jul 1998, pp. 152–159.
[14] The Apache Software Foundation. (2007, Sep 1) Apache log4j. Project documentation. The Apache Software Foundation.
[Online]. Available: http://logging.apache.org/log4j/
[15] EsperTech. (2009, Feb 11) Esper – Complex Event Processing. Project documentation. EsperTech. [Online]. Available:
http://esper.codehaus.org/
[16] Google. (2009, May 6) Google Maps. Web mapping service. [Online]. Available: http://maps.google.com
[17] D. L. Mills, “Internet Time Synchronization: the Network Time Protocol,” Communications, IEEE Transactions on, vol. 39,
no. 10, pp. 1482–1493, Oct 1991.
[18] D. Box et al. (2004, Aug 10) Web Services Addressing (WS-Addressing). Member submission. W3C. [Online]. Available:
http://www.w3.org/Submission/ws-addressing/
[19] J. Clark and S. DeRose. (1999, Nov 16) XML Path Language (XPath). W3C Recommendation. W3C. [Online]. Available:
http://www.w3.org/TR/xpath
[20] D. T. Fokum, “Optimal Communications Systems and Network Designfor Cargo Monitoring,” To appear in Proc. Tenth
Workshop Mobile Computing Systems and Applications (HOTMOBILE 2009). Santa Cruz, CA: ACM Press, Feb 2009.
[21] Y.-C. Lai et al., “Optimizing the Aerodynamic Efficiency of Intermodal Freight Trains,” Transportation Research Part E:
Logistics and Transportation Review, vol. 44, no. 5, pp. 820–834, Sep 2008.