exhibit 300 by13 cbp - facilities management & … · tactical infrastructure (ti) by...
TRANSCRIPT

Exhibit 300 BY13 (Form) / CBP - Facilities Management & Engineering (FM&E) Tactical Infrastructure (Item) / Feb 29, 2012 (Data as of)
Primavera Portfolio Management
300A - OVERVIEW
Section A: Overview
1. Name of this Investment:
CBP - Facilities Management & Engineering (FM&E) Tactical Infrastructure
2. Unique Investment Identifier (UII):
N024-000005109
Section B: Investment Detail
Provide a brief summary of the investment, including a brief description of the related benefit to the mission delivery and management support areas, and the primary beneficiary(ies) of the investment. Include an explanation of any dependencies between this investment and other investments. [LIMIT: 2500 char]
1. To help the Border Patrol gain and maintain effective control of the land between the official ports of entry (POEs), the BPFTI PMO provides Border Patrol with long-term planning, construction, and maintenance capabilities. These components vary - from tactical infrastructure (roads, fencing, lights, electrical components, and drainage structures) but the primary goal remains the same: to provide material solutions, Tactical Infrastructure that support Border Patrol in achieving its primary homeland security mission.
How does this investment close in part or in whole any identified performance gap in support of the mission delivery and management support areas? Include an assessment of the program impact if this investment isn't fully funded. [LIMIT: 2500 char]
2. CBP has performance gaps of persistence impedance, access, and visibility along our Nation’s borders. The Tactical Infrastructure Program (TIP) helps to close these gaps by: · Constructing new tactical infrastructure, as per Border Patrol’s (BP) operational needs · Establishing and managing comprehensive maintenance and repair activities to support fielded pedestrian and vehicle fencing; roads; lighting; low water crossings; bridges; drainage and grate systems; marine ramps; vegetation/debris removal; and other similar efforts TIP initiatives allow CBP to provide persistent impedance, access, and visibility, by making illicit cross-border activities, such as the funneling of illegal immigrants, terrorists, and terrorist weapons into our Nation, more difficult and time-consuming. These activities contribute to higher crime rates in areas along the Southwest border and hinder the agency’s ability to effectively protect United States citizens. If the TIP is not fully funded, then the agency would be unable to fully support the mission. Being fully funded is required to properly operate and maintain TIP initiatives; thus, simple tasks, such as repairing broken fencing and/or filling dangerous potholes, would become impossible to accomplish. Without a full appropriation of funding, these initiatives would not receive a necessary amount of maintenance and would be rendered ineffective. Therefore, the users of tactical infrastructure would not be able to efficiently protect our Nation’s border, which would result in the need for more manpower and would become a greater burden to taxpayers.
3. For this investment’s technical features, please identify where any specific technical solutions are required by legislation, in response to audit findings, or to meet requirements from other sources. Where “Yes” is indicated, provide a brief description of the technical features required, and any citations regarding specific mandates for these requirements.
Yes/No Description [LIMIT: 1000 char]

Legislative Mandate Yes DHS Appropriations Acts (FY2003-2007)- P.L. 109-295- BORDER SECURITY FENCING, INFRASTRUCTURE, AND TECHNOLOGY: Provides for expenses for customs and border protection fencing, infrastructure, and technology, to establish a security barrier along the border of the United States of fencing and vehicle barriers, where practicable, and other forms of tactical infrastructure and technology.
Audit Finding Resolution No
Published Agency Strategic Plan Yes Secure our Nation’s borders to protect
America from the entry of dangerous people and goods and prevent unlawful trade and travel.
Other Requirements No
Accomplishments
Provide a list of this investment's accomplishments in the prior year (PY), including projects or useful components/project segments completed, new functionality added, or operational efficiency achieved. [LIMIT: 1000 char]
4. The Tactical Infrastructure Program (TIP) achieved significant accomplishments in PY 2011. The TIP maintained Customs and Border Protection’s current tactical infrastructure (TI) and accomplished the following goals: The TIP operated and maintained the following: -Physical infrastructure: roads; vehicle and pedestrian fences; port of entry barriers; lights; bridges; and towers for technology and surveillance The TIP constructed the following with prior years no-year funds: -0.55 miles of fencing and retaining wall in Brownsville, TX -0.62 miles of fence in Eagle Pass, TX -4.75 miles of road in an area commonly known as 19-Canyon -0.50 miles of pedestrian fence to close several gaps within the Ysleta-Fabens Station Area of Responsibility (AOR) -2.80 miles of primary fence replacement, construction roads, and wash gates adjacent to city of Nogales
Provide a list of planned accomplishments for current year (CY) and budget year (BY). [LIMIT: 2500 char]
5. The Tactical Infrastructure Program (TIP) has an aggressive list of planned accomplishments for CY 2012 and BY 2013. The TIP will continue to maintain Customs and Border Protection’s (CBP) current tactical infrastructure (TI) by accomplishing the following goals: Current Year Goals The TIP will operate and maintain the following: -Physical infrastructure: roads; vehicle and pedestrian fences; port of entry barriers; lights; bridges; and towers for technology and surveillance The TIP will construct the following with prior years no-year money: -0.54 miles of fence along the border in Brownsville, TX. -0.86 miles of 2 lane patrol road near the Rio Grande River on land owned by the City of Laredo -0.75 miles of All-Weather Road (AWR) in an area commonly known as 19-Canyon -0.65 miles of primary fence within the El Paso Station Area of Responsibility (AOR) -2.00 miles of road and fence stabilization in Nogales, Arizona -1.04 miles of roadway and a low-water crossing along the international boundary in proximity to the primary fence segments in Nogales, Arizona -6.1 miles of fence replacement at Douglas Port of Entry (POE) Budget Year Goals

The TIP will: -Continue to sustain the CBP’s tactical infrastructure -Construct Six to eight miles of AWR and low-water crossings and additional north-south access roads with prior years no-year money -Track tactical infrastructure condition, utilization, and operational costs to increase the efficiency and cost effectiveness of the investment -Highlight funding deficiencies that hinder the execution the investment’s mission
6. Provide brief descriptions of out year (BY+1, BY+2, BY+3, BY+4 and beyond as necessary) budget requests for this investment. Briefly describe planned projects and/or useful components proposed, Your justification should address new functionality, systems integration, technology refreshes, efficeiencies obtained, and any other enhancements to existing assets/systems performance or agency operations.
Fiscal Year Description [LIMIT: 500 char]
BY+1 Continue to sustain the Customs and Border Protection’s tactical infrastructure (TI); Track TI condition, utilization, and operational costs to increase the efficiency and cost effectiveness of the Tactical Infrastructure Program (TIP); Highlight funding deficiencies that hinder the execution the investment’s mission; construct new TI and modify existing TI as funding becomes available
BY+2 Continue to sustain the Customs and Border Protection’s tactical infrastructure (TI); Track TI condition, utilization, and operational costs to increase the efficiency and cost effectiveness of the Tactical Infrastructure Program (TIP); Highlight funding deficiencies that hinder the execution the investment’s mission; construct new TI and modify existing TI as funding becomes available
BY+3 Continue to sustain the Customs and Border Protection’s tactical infrastructure (TI); Track TI condition, utilization, and operational costs to increase the efficiency and cost effectiveness of the Tactical Infrastructure Program (TIP); Highlight funding deficiencies that hinder the execution the investment’s mission; construct new TI and modify existing TI as funding becomes available
BY+4 and beyond Continue to sustain the Customs and Border Protection’s tactical infrastructure (TI); Track TI condition, utilization, and operational costs to increase the efficiency and cost effectiveness of the Tactical Infrastructure Program (TIP); Highlight funding deficiencies that hinder the execution the investment’s mission; construct new TI and modify existing TI as funding becomes available
Program Management
Provide the date of the Charter establishing the required Integrated Program Team (IPT) for this investment. An IPT must always include, but is not limited to: a qualified fully-dedicated IT program manager, a contract specialist, an information technology specialist, a security specialist and a business process owner before OMB will approve this program investment budget. IT Program Manager, Business Process Owner and Contract Specialist must be Government Employees.
7. Aug 15, 2011
8. Provide the following 5 required IPT members. IT Program Manager, Business Process Owner and Contract Specialist must be Government employees.
IPT Contact Information
Name Phone Number Extension Email
[LIMIT: 250 char] [10 digits, 0-9 only] [Optional: 6 digits, 0-9 only]
[LIMIT: one email only]
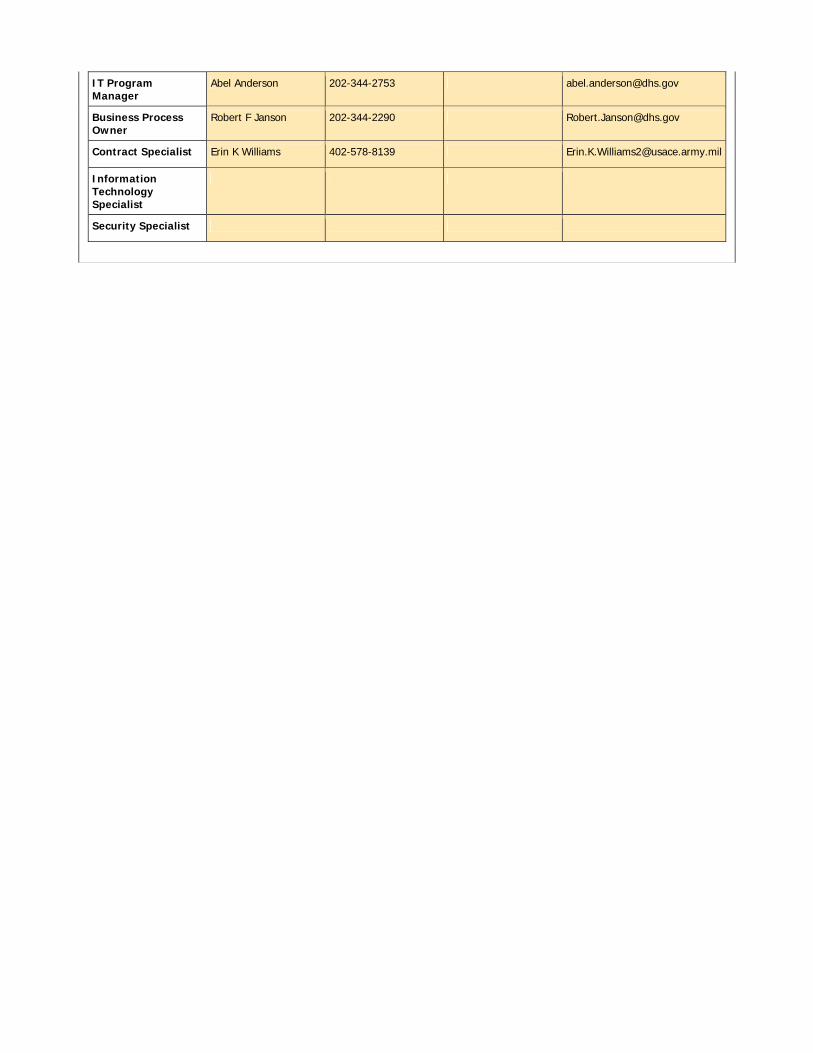
IT Program Manager
Abel Anderson 202-344-2753 [email protected]
Business Process Owner
Robert F Janson 202-344-2290 [email protected]
Contract Specialist Erin K Williams 402-578-8139 [email protected]
Information Technology Specialist
Security Specialist

300A - SUMMARY OF FUNDING
Section C: Summary of Funding (Budget Authority for Capital Assets) (In Millions)
1. Provide the funding summary for this investment by completing the following table. Include funding authority from all sources in millions, and round to three decimal places. Federal personnel costs should be included only in the rows designated “DME Govt. FTE Costs” and “Operations Govt. FTE Costs” and should be excluded where indicated for DME Costs and Operations Costs. Cost levels should be consistent with funding levels in Exhibit 53. For multi-agency investments, this table should include all funding (both managing and partner agency contributions).
For years beyond BY+1, please provide your best estimates for planning purposes, understanding that estimates for out-year spending will be less certain than estimates for BY+1 or closer.
For lines in the table that ask for changes in your current submission compared to your most recent previous submission, please use the President’s Budget as your previous submission. When making comparisons, please ensure that you compare same-year-to-same-year (e.g., 2011 v. 2011).
Significant changes from the previous submission should be reflected in a the Investment level Alternatives Analysis and is subject to OMB request as discussed in section 300.5.
PY-1 & Earlier
PY CY BY BY+1 BY+2 BY+3 BY+4 & Beyond
Total
2010 2011 2012 2013 2014 2015 2016 2017 +
Planning Costs:
30.725 8.530 3.000 3.502 3.607 3.715 3.827 3.942 60.848
DME (Excluding Planning) Costs:
2,363.800 66.000 0.000 0.000 0.000 0.000 0.000 0.000 2,429.800
DME Govt. FTEs:
5.400 0.606 1.248 1.393 1.434 1.478 1.521 1.567 14.647
SUBTOTAL DME:
2,399.925 75.136 4.248 4.895 5.041 5.193 5.348 5.509 2,505.295
O&M-Excluding Govt FTE Costs:
152.500 75.000 62.000 49.000 68.000 70.000 72.000 74.000 622.500
O&M Govt. FTEs:
0.388 1.010 1.248 1.928 1.986 2.046 2.107 2.170 12.883
SUBTOTAL O&M Costs:
152.888 76.010 63.248 50.928 69.986 72.046 74.107 76.170 635.383
TOTAL COST:
2,552.813 151.146 67.496 55.823 75.027 77.239 79.455 81.679 3,140.678
Total Govt. FTE Costs:
5.788 1.616 2.496 3.321 3.420 3.524 3.628 3.737 27.530
# of FTEs rep by Costs:
23.00 16.00 24.00 31.00 31.00 31.00 31.00 31.00 218.00
Total from prior yr final Pres. Budget ($)*
126.531 71.824

Total chg from prior yr final Pres. Budget ($)
24.615 -4.328
Total chg from prior yr final Pres. Budget (%)
19.454 -6.026
* Source of funding is based on the Exh 53 June 3rd submission and Exhibit 300 February 28th submission.
2. While some investments are consistent with a defined life cycle model (i.e., an initial period of development followed by a period of primarily operational spending and an identifiable end point), others represent a collection of ongoing activities and operations with no known terminal point. In the following table, identify whether or not this investment uses a defined life cycle model (as defined in OMB Circular A-131) and provide appropriate investment cost information below.
Is this investment consistent with a life cycle model defined in OMB Circular A-131(i.e., an initial period of development followed by a period of primarily operational spending and an identifiable end point):
2.a. No
Describe why the investment is not consistent with life cycle model management defined in OMB Circular A-131, and explain how you adapted your alternatives analysis for this investment? (Where an agency uses a cost model other than the lifecycle cost model, defined by OMB Circular A-131, responses from 2c to 2h below should reflect the alternative concept.) [LIMIT: 1000 char] (Required if 2.a. is N):
2.b. The Tactical Infrastructure Program (TIP) investment is not consistent with life cycle model management because there is no definitive end date to the investment. The TIP builds and maintains tactical infrastructure (TI) for the Office of Border Patrol (OBP), which will be done in perpetuity so long as funding is available and the mission is strategically necessary. The Analysis of Alternatives (AA) is conducted on a project level, which is consistent with life cycle model management because each project has a definitive start and end date. Each TIP project conducts a Site AA to determine the best site for the proposed facility. The AA methodology ensures that OBP maximizes its resources and minimizes taxpayer burden by allowing project managers to select the most cost-effective sites for projects.
Provide information on what cost model this investment is using and how costs are captured for what years [LIMIT: 1000 char] (Required if 2.a. is N):
2.c. The Tactical Infrastructure Program (TIP) accrues costs from individual tactical infrastructure (TI) projects as they are obligated. TIP projects utilize firm fixed price contracts, which realize costs when certain production benchmarks are met. The project costs are rolled up to the programmatic level in the year they obligated.
What year did this investment start (use year—i.e., PY-1=2010) (Required if 2.a. is Y):
2.d.
What year will this investment end (use year—i.e., BY+5=2018) (Required if 2.a. is Y):
2.e.
Estimated Total DME cost (including planning) for the investment life cycle or other cost model (excluding FTE):
2.f. 2,490.648
Estimated Total O&M cost the investment life cycle or other cost model (excluding FTE):
2.g. 622.500
Estimated total Govt. FTE Cost for the investment life cycle or other cost model:
2.h. 27.530
If the funding levels have changed from the FY 2012 President’s Budget request for PY or CY, briefly explain those changes [LIMIT: 500 char]:
3a. Funding levels have not changed from the FY 2012 President's Budget request.

300A - ACQUISITION/CONTRACT STRATEGY
Section D: Acquisition/Contract Strategy 1. Complete or update the table to display all prime contracts (or task orders) awarded or open solicitations for this investment (sub-award details is not required). Contracts and/or task orders that have “Ended” should not be included in the table. Contracts in open solicitation should provide estimated data for all fields (for “Total Contract Value” the estimated base contract costs and all anticipated option years). Data definitions can be found at www.usaspending.gov/learn#a2.
For specifics, please see notes 1 and 2 below the table.
# Active? Contract Status
Contracting Agency ID
Procurement Instrument Identifier
[LIMIT: 250 char]
IAA Contract/Exemption?
Indefinite Delivery Vehicle (IDV) PIID
(required if part of an IDV)
IDV Agency
ID
Solicitation ID
1 Active Awarded 2100 W912BV-08-D-2025 CQ01
No NO 7014 TUCHZ-11-R-0001
2 Active Awarded 2100 W912BV-07-D-2024 DY01
No NO 7014 NOGFR-11-R-0001
3 Active Pre-award
Post-solicitation
2100 Mod#4 to W912BV-08-D-203
No NO 7014 RGV8A-08-R-0002
4 Active Awarded 2100 W912PP-11-0060
No NO 7014 Sole Source to 8a
5 Active Awarded 2100 W912BV-07-D-2040, DZ02
No NO 7014 DELUN-10-R-0001
6 Active Awarded 2100 W912BV-08-D-2032, DZ02
No NO 7014 RGV8A-08-R-0002
7 Active Awarded 2100 W912BV-08-D-2011, DZ04
No NO 7014 RGVUR-10-R-0001
8 Active Awarded 2100 W912BV-08-D-2012, DZ06
No NO 7014 RGVUR-10-R-0002
9 Active Awarded 2100 W912BV-08-D-2026, CQ02
No NO 7014
# Alternate Financing
EVM Required
Ultimate Contract
Value ($M)
Type of Contract/Task
Order (Pricing)
Is the contract a
Performance Based
Service Acquisition
(PBSA)?
Effective date
Actual or expected End
Date of Contract/Task
Order
Extent Competed
Short description of
services or product to be
acquired
Contractor Name
1 NA No 3.200 Firm Fixed Price No Apr 12,
2011 May 8, 2012 Not
Competed NGL D-5a rd stabilization - W912BV-08-D-2025 CQ01
Army Corps of Engineers
2 NA No 11.020 Firm Fixed Price No Feb 28,
2011 Jul 1, 2011 Full and
Open Competition
NGL fence repl - W912BV-07-D-2024 DY01
Army Corps of Engineers
3 NA No 0.140 Firm Fixed Price No Jun 23,
2011 Dec 11, 2011 Not
Competed RGV O-17 move fence/west rail - W912BV-08-D-2032 DZ02
Army Corps of Engineers
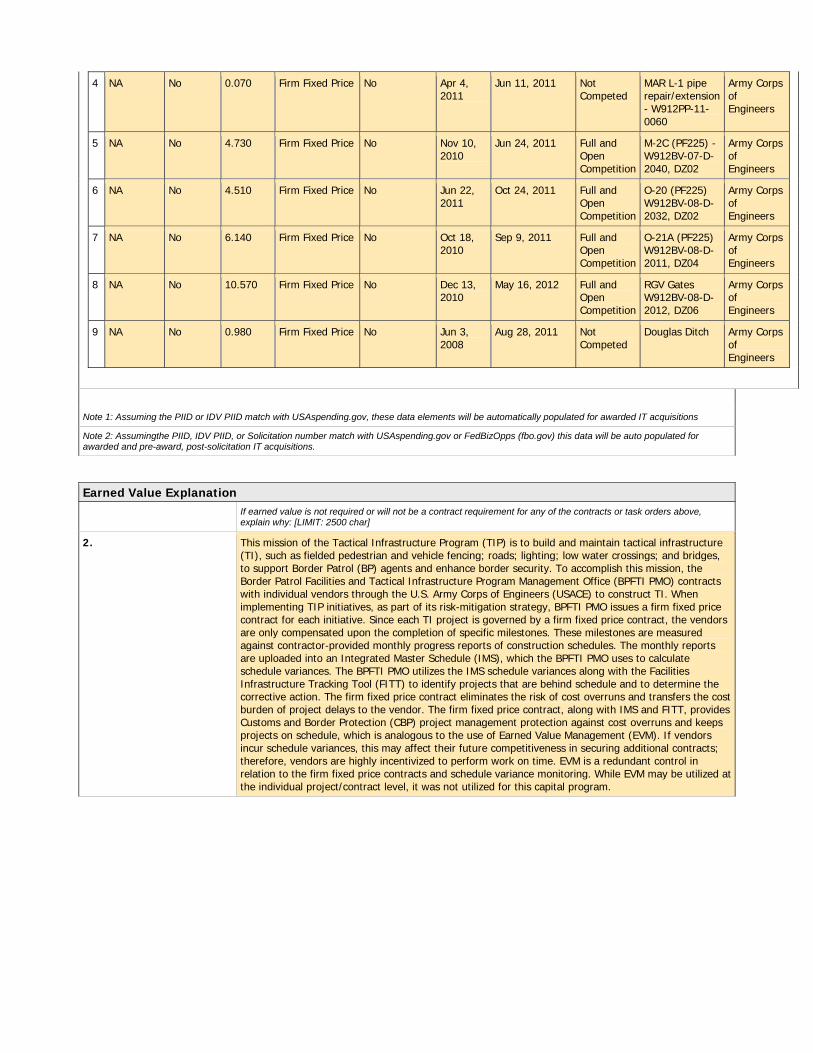
4 NA No 0.070 Firm Fixed Price No Apr 4,
2011 Jun 11, 2011 Not
Competed MAR L-1 pipe repair/extension - W912PP-11-0060
Army Corps of Engineers
5 NA No 4.730 Firm Fixed Price No Nov 10,
2010 Jun 24, 2011 Full and
Open Competition
M-2C (PF225) - W912BV-07-D-2040, DZ02
Army Corps of Engineers
6 NA No 4.510 Firm Fixed Price No Jun 22,
2011 Oct 24, 2011 Full and
Open Competition
O-20 (PF225) W912BV-08-D-2032, DZ02
Army Corps of Engineers
7 NA No 6.140 Firm Fixed Price No Oct 18,
2010 Sep 9, 2011 Full and
Open Competition
O-21A (PF225) W912BV-08-D-2011, DZ04
Army Corps of Engineers
8 NA No 10.570 Firm Fixed Price No Dec 13,
2010 May 16, 2012 Full and
Open Competition
RGV Gates W912BV-08-D-2012, DZ06
Army Corps of Engineers
9 NA No 0.980 Firm Fixed Price No Jun 3,
2008 Aug 28, 2011 Not
Competed Douglas Ditch Army Corps
of Engineers
Note 1: Assuming the PIID or IDV PIID match with USAspending.gov, these data elements will be automatically populated for awarded IT acquisitions
Note 2: Assumingthe PIID, IDV PIID, or Solicitation number match with USAspending.gov or FedBizOpps (fbo.gov) this data will be auto populated for awarded and pre-award, post-solicitation IT acquisitions.
Earned Value Explanation
If earned value is not required or will not be a contract requirement for any of the contracts or task orders above, explain why: [LIMIT: 2500 char]
2. This mission of the Tactical Infrastructure Program (TIP) is to build and maintain tactical infrastructure (TI), such as fielded pedestrian and vehicle fencing; roads; lighting; low water crossings; and bridges, to support Border Patrol (BP) agents and enhance border security. To accomplish this mission, the Border Patrol Facilities and Tactical Infrastructure Program Management Office (BPFTI PMO) contracts with individual vendors through the U.S. Army Corps of Engineers (USACE) to construct TI. When implementing TIP initiatives, as part of its risk-mitigation strategy, BPFTI PMO issues a firm fixed price contract for each initiative. Since each TI project is governed by a firm fixed price contract, the vendors are only compensated upon the completion of specific milestones. These milestones are measured against contractor-provided monthly progress reports of construction schedules. The monthly reports are uploaded into an Integrated Master Schedule (IMS), which the BPFTI PMO uses to calculate schedule variances. The BPFTI PMO utilizes the IMS schedule variances along with the Facilities Infrastructure Tracking Tool (FITT) to identify projects that are behind schedule and to determine the corrective action. The firm fixed price contract eliminates the risk of cost overruns and transfers the cost burden of project delays to the vendor. The firm fixed price contract, along with IMS and FITT, provides Customs and Border Protection (CBP) project management protection against cost overruns and keeps projects on schedule, which is analogous to the use of Earned Value Management (EVM). If vendors incur schedule variances, this may affect their future competitiveness in securing additional contracts; therefore, vendors are highly incentivized to perform work on time. EVM is a redundant control in relation to the firm fixed price contracts and schedule variance monitoring. While EVM may be utilized at the individual project/contract level, it was not utilized for this capital program.
300B - PROJECT
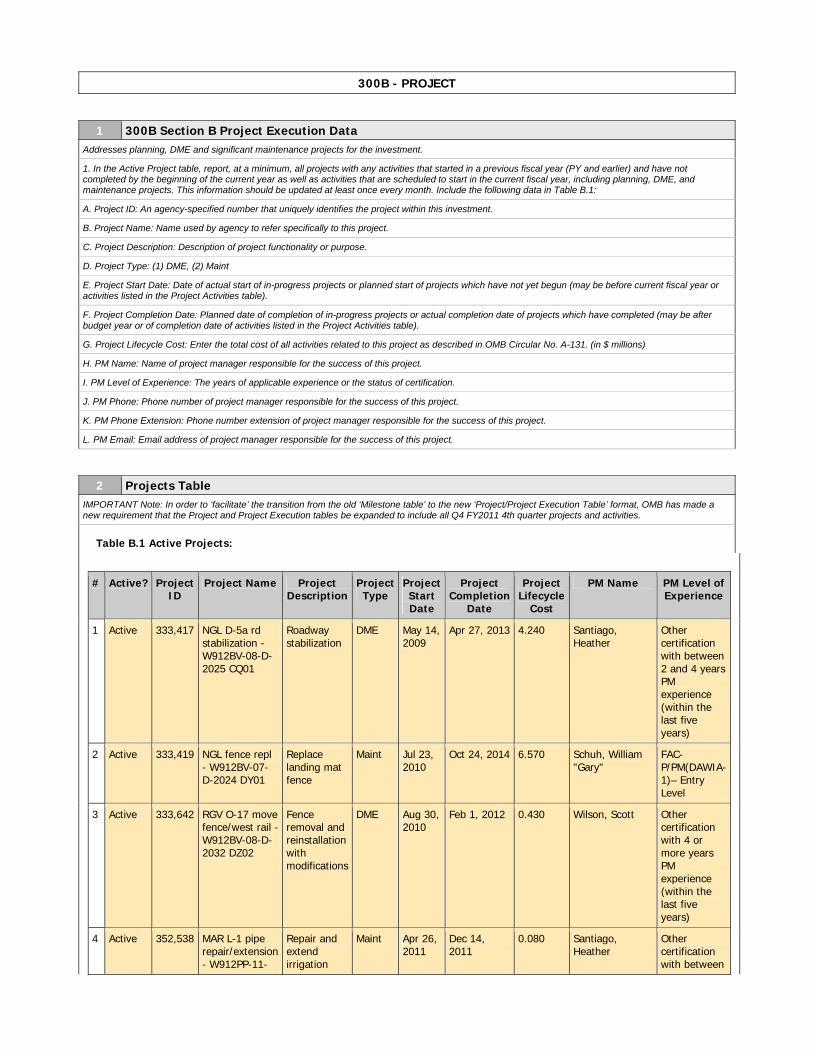
1 300B Section B Project Execution Data Addresses planning, DME and significant maintenance projects for the investment.
1. In the Active Project table, report, at a minimum, all projects with any activities that started in a previous fiscal year (PY and earlier) and have not completed by the beginning of the current year as well as activities that are scheduled to start in the current fiscal year, including planning, DME, and maintenance projects. This information should be updated at least once every month. Include the following data in Table B.1:
A. Project ID: An agency-specified number that uniquely identifies the project within this investment.
B. Project Name: Name used by agency to refer specifically to this project.
C. Project Description: Description of project functionality or purpose.
D. Project Type: (1) DME, (2) Maint
E. Project Start Date: Date of actual start of in-progress projects or planned start of projects which have not yet begun (may be before current fiscal year or activities listed in the Project Activities table).
F. Project Completion Date: Planned date of completion of in-progress projects or actual completion date of projects which have completed (may be after budget year or of completion date of activities listed in the Project Activities table).
G. Project Lifecycle Cost: Enter the total cost of all activities related to this project as described in OMB Circular No. A-131. (in $ millions)
H. PM Name: Name of project manager responsible for the success of this project.
I. PM Level of Experience: The years of applicable experience or the status of certification.
J. PM Phone: Phone number of project manager responsible for the success of this project.
K. PM Phone Extension: Phone number extension of project manager responsible for the success of this project.
L. PM Email: Email address of project manager responsible for the success of this project.
2 Projects Table IMPORTANT Note: In order to ‘facilitate’ the transition from the old ‘Milestone table’ to the new ‘Project/Project Execution Table’ format, OMB has made a new requirement that the Project and Project Execution tables be expanded to include all Q4 FY2011 4th quarter projects and activities.
Table B.1 Active Projects:
# Active? Project
ID Project Name Project
DescriptionProject
Type Project Start Date
Project Completion
Date
Project Lifecycle
Cost
PM Name PM Level of Experience
1 Active 333,417 NGL D-5a rd stabilization - W912BV-08-D-2025 CQ01
Roadway stabilization
DME May 14, 2009
Apr 27, 2013 4.240 Santiago, Heather
Other certification with between 2 and 4 years PM experience (within the last five years)
2 Active 333,419 NGL fence repl
- W912BV-07-D-2024 DY01
Replace landing mat fence
Maint Jul 23, 2010
Oct 24, 2014 6.570 Schuh, William "Gary"
FAC-P/PM(DAWIA-1)– Entry Level
3 Active 333,642 RGV O-17 move fence/west rail - W912BV-08-D-2032 DZ02
Fence removal and reinstallation with modifications
DME Aug 30, 2010
Feb 1, 2012 0.430 Wilson, Scott Other certification with 4 or more years PM experience (within the last five years)
4 Active 352,538 MAR L-1 pipe
repair/extension - W912PP-11-
Repair and extend irrigation
Maint Apr 26, 2011
Dec 14, 2011
0.080 Santiago, Heather
Other certification with between
0060 pipes 2 and 4 years PM experience (within the last five years)
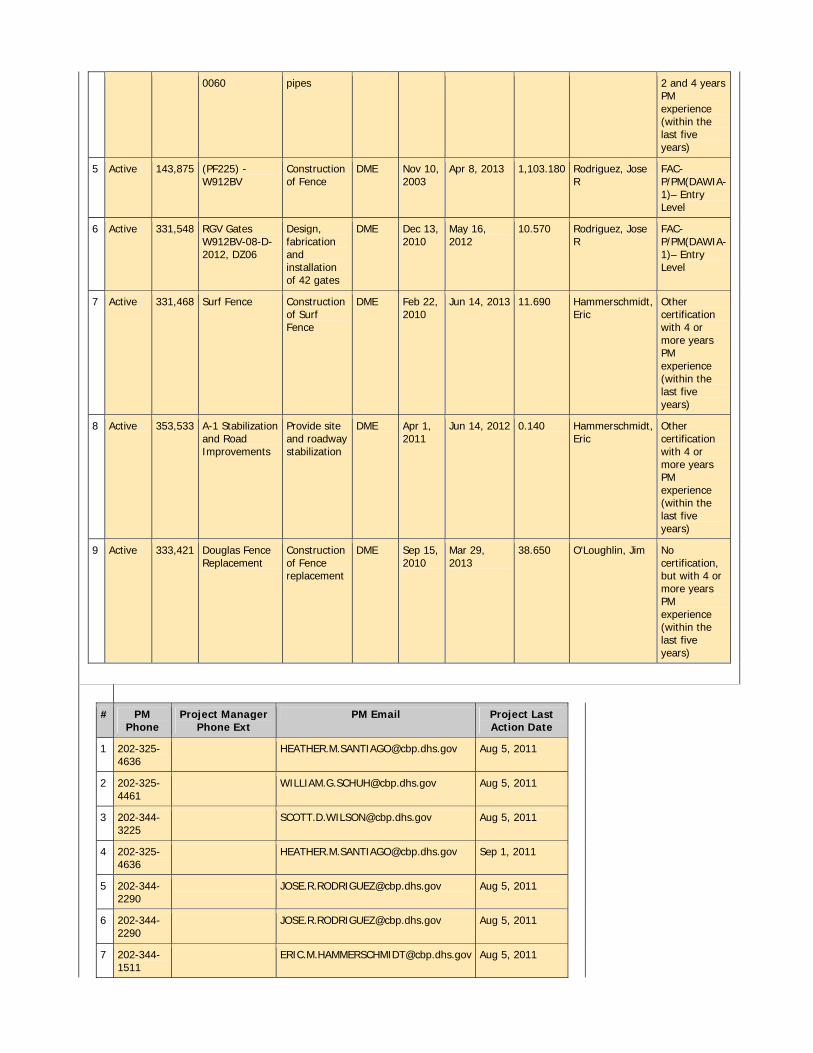
5 Active 143,875 (PF225) -
W912BV Construction of Fence
DME Nov 10, 2003
Apr 8, 2013 1,103.180 Rodriguez, Jose R
FAC-P/PM(DAWIA-1)– Entry Level
6 Active 331,548 RGV Gates W912BV-08-D-2012, DZ06
Design, fabrication and installation of 42 gates
DME Dec 13, 2010
May 16, 2012
10.570 Rodriguez, Jose R
FAC-P/PM(DAWIA-1)– Entry Level
7 Active 331,468 Surf Fence Construction of Surf Fence
DME Feb 22, 2010
Jun 14, 2013 11.690 Hammerschmidt, Eric
Other certification with 4 or more years PM experience (within the last five years)
8 Active 353,533 A-1 Stabilization and Road Improvements
Provide site and roadway stabilization
DME Apr 1, 2011
Jun 14, 2012 0.140 Hammerschmidt, Eric
Other certification with 4 or more years PM experience (within the last five years)
9 Active 333,421 Douglas Fence Replacement
Construction of Fence replacement
DME Sep 15, 2010
Mar 29, 2013
38.650 O'Loughlin, Jim No certification, but with 4 or more years PM experience (within the last five years)
# PM Phone
Project Manager Phone Ext
PM Email Project Last Action Date
1 202-325-4636
[email protected] Aug 5, 2011
2 202-325-4461
[email protected] Aug 5, 2011
3 202-344-3225
[email protected] Aug 5, 2011
4 202-325-4636
[email protected] Sep 1, 2011
5 202-344-2290
[email protected] Aug 5, 2011
6 202-344-2290
[email protected] Aug 5, 2011
7 202-344-1511
[email protected] Aug 5, 2011

300B - PROJECT EXECUTION
Project Activities Addresses planning, DME and significant maintenance projects for the investment.
In the Project Activities table, describe, at a minimum, all activities occurring during the current fiscal year. This table should be updated once a month at a minimum. In line with modular development principles, activities should be structured to provide usable functionality in measureable segments that complete at least once every six months or more often, as described in the 25-Point Implementation Plan to Reform Federal IT.
A. Project ID: An agency-specified number that uniquely identifies the project within this investment.
B. Activity Name: A short description consistent with the critical steps within the agency project management methodology.
C. Activity Description: Describe what work is accomplished by this activity
D. Structure ID: Agency-specified identifier which indicates work breakdown structure agency uses to associate this activity with other activities or a project. Please provide this in the format of “x.x.x.x.x” where the first string is the Project ID and each following string (separated by periods) matches the Structure ID of a parent activity. See below for more guidance about parent and child activities expressed through this structure.
E. Key Deliverable / Usable Functionality: Indicate whether the completion of this activity provides a key deliverable or usable functionality. This should only be provided for activities which do not have a child activity. Use this field to demonstrate this investment’s alignment with the modular development principles of the 25-Point Implementation Plan to Reform Federal IT.
F. Start Date Planned: The planned start date for this activity.
G. Start Date Projected: When activity has not yet started, enter current planned start date of the activity.
H. Start Date Actual: When activity starts, enter actual start date here.
I. Completion Date Planned: The planned completion date for this activity.
J. Completion Date Projected: When activity has not yet completed, enter current planned completion date of the activity.
K. Completion Date Actual: When activity ends, enter actual completion date here.
L. Total Costs Planned: The planned total cost for this activity. This is the baseline value.
M. Total Costs Projected: When activity has not yet completed, enter current planned total cost of the activity.
N. Total Costs Actual: When activity ends, enter actual total costs for the activity here.
Reporting Parent and Child Activities (WBS Structure) “Child” activities may be grouped into “Parent” activities to reflect the work breakdown structure (WBS) the agency uses to manage the investment. If a work breakdown structure is not used by the agency, please report the relationship between parent activities and child activities in “Structure ID” using this method.
When reporting an activity, enter the “Structure ID” as a period-delimited string consisting of the “Project ID” and each nested parent child activity between the project level and the child activity. The “Structure ID” to enter will vary depending on the activity’s WBS level.
Example: For child activity 3 which is part of parent activity 10, which in turn is part of parent activity 2, which in turn is part of Project A, please enter: A.2.10.3
Project A >>> Parent Activity 2 >>> Parent Activity 10 >>> Child Activity 3
There is no limit to the number of nested “child” and “parent” relationships allowed, and this depth may vary from activity to activity and from project to project.
If any of a parent activity's child activities occurs in the current fiscal year, then all child activities of the parent activity must be reported regardless of their timing. This is to ensure that a complete view of the parent activity is available.
All activities with no child activities must have, at a minimum, Project ID, Activity Name, Activity Description, Structure ID, Start Date Planned, Start Date Projected, Completion Date Planned, Completion Date Projected, Total Costs Planned, and Total Costs Projected. Completed activities must also have Start Date Actual, Completion Date Actual, and Total Costs Actual.
Any parent activities with a child activity must be completely described by the aggregate attributes of its child activities. In the IT Dashboard, the cost and schedule information for parent activities will be based on the cost and schedule information of their most detailed reported child activities. Agency-submitted cost and schedule information is not required for parent activities.
Project Execution (Activities) Table All financials are in millions ($M).
IMPORTANT Note: In order to ‘facilitate’ the transition from the old ‘Milestone table’ to the new ‘Project/Project Execution Table’ format, OMB has made a new requirement that the Project and Project Execution tables be expanded to include all Q4 FY2011 4th quarter projects and activities.
# Active? Project ID
Activity Name
Activity Description
Structure ID
Key Deliverable/Usable
Start Date
Start Date
Start Date
Completion Date

Functionality Planned Projected Actual Planned
1 Active 333,417 333417 - Phase 5
Phase 5 of Project Management, Environmental, Design, Construction
333417.5 Key Deliverable Apr 1, 2011
Apr 1, 2011
Sep 30, 2011
2 - 333,417 333417
- Phase 6
Phase 6 of Project Management, Environmental, Design, Construction
333417.6 Key Deliverable Oct 1, 2011
Oct 1, 2011
Mar 31, 2012
3 Active 333,417 333417 - Phase 7
Phase 7 of Project Management, Environmental, Design, Construction
333417.7 Key Deliverable Apr 1, 2012
Apr 1, 2012
Sep 30, 2012
4 Active 333,419 333419 - Phase 2
Phase 2 of Project Management, Real Estate, Environmental, Design, Construction
333419.2 Key Deliverable Apr 1, 2011
Apr 1, 2011
Sep 30, 2011
5 Active 333,419 333419 - Phase 3
Phase 3 of Project Management, Real Estate, Environmental, Design, Construction
333419.3 Key Deliverable Oct 1, 2011
Oct 1, 2011
Mar 31, 2012
6 Active 333,419 333419 - Phase 4
Phase 4 of Project Management, Real Estate, Environmental, Design, Construction
333419.4 Key Deliverable Apr 1, 2012
Apr 1, 2012
Sep 30, 2012
7 Active 333,642 333642 - Phase 2
Phase 2 of Project Management, Environmental, Design, Construction
333642.2 Key Deliverable Apr 1, 2011
Apr 1, 2011
Sep 30, 2011
8 Active 333,642 333642 - Phase 3
Phase 3 Final Delivery of Fence Removal And Reinstallation With Modifications
333642.3 Usable Functionality Oct 1, 2011
Oct 1, 2011
Feb 1, 2012
9 Active 352,538 352538
- Phase 1
Phase 1 of Project Management, Construction
352538.1 Key Deliverable Apr 26, 2011
Apr 26, 2011
Sep 30, 2011
10 Active 352,538 352538
- Phase 2
Phase 2 of Project Management, Construction
352538.2 Key Deliverable Oct 1, 2011
Oct 1, 2011
Dec 14, 2011
11 Active 143,875 143875 Phase 16 of 143875.16 Key Deliverable Apr 1, Apr 1, Sep 30,

- Phase 16
Project Management, Design, Construction, Real Estate, Environmental
2011 2011 2011
12 Active 143,875 143875 - Phase 17
Phase 17 of Project Management, Design, Construction, Real Estate, Environmental
143875.17 Key Deliverable Oct 1, 2011
Oct 1, 2011
Mar 31, 2012
13 Active 143,875 143875
- Phase 18
Phase 18 Final Delivery of Construction Of Fence
143875.18 Usable Functionality Apr 1, 2012
Apr 1, 2012
Sep 30, 2012
14 Active 331,548 331548
- Phase 2
Phase 2 of Project Management
331548.2 Key Deliverable Apr 1, 2011
Apr 1, 2011
Sep 30, 2011
15 Active 331,548 331548
- Phase 3
Phase 3 of Project Management
331548.3 Key Deliverable Oct 1, 2011
Oct 1, 2011
Mar 31, 2012
16 Active 331,548 331548 - Phase 4
Phase 4 Final Delivery of Design, Fabrication And Installation Of 42 Gates
331548.4 Usable Functionality Apr 1, 2012
Apr 1, 2012
May 16, 2012
17 Active 331,468 331468
- Phase 3
Phase 3 of Project Management, Construction
331468.3 Key Deliverable Apr 1, 2011
Apr 1, 2011
Sep 30, 2011
18 Active 331,468 331468
- Phase 4
Phase 4 of Project Management, Construction
331468.4 Key Deliverable Oct 1, 2011
Oct 1, 2011
Mar 31, 2012
19 Active 331,468 331468
- Phase 5
Phase 5 of Project Management, Construction
331468.5 Key Deliverable Apr 1, 2012
Apr 1, 2012
Sep 30, 2012
20 Active 353,533 353533
- Phase 1
Phase 1 of Project Management, Design
353533.1 Key Deliverable Apr 11, 2011
Apr 11, 2011
Sep 30, 2011
21 Active 353,533 353533
- Phase 2
Phase 2 of Project Management, Design
353533.2 Key Deliverable Oct 1, 2011
Oct 1, 2011
Mar 31, 2012
22 Active 353,533 353533 - Phase 3
Phase 3 Final Delivery of Site And Roadway Stabilization
353533.3 Usable Functionality Apr 1, 2012
Apr 1, 2012
Jun 14, 2012
23 Active 333,421 333421 - Phase 2
Phase 2 of Project Management, Real Estate, Environmental, Design, Construction
333421.2 Key Deliverable Apr 1, 2011
Apr 1, 2011
Sep 30, 2011

24 Active 333,421 333421 - Phase 3
Phase 3 of Project Management, Real Estate, Environmental, Design, Construction
333421.3 Key Deliverable Oct 1, 2011
Oct 1, 2011
Mar 31, 2012
25 Active 333,421 333421 - Phase 4
Phase 4 of Project Management, Real Estate, Environmental, Design, Construction
333421.4 Key Deliverable Apr 1, 2012
Apr 1, 2012
Sep 30, 2012
# Completion
Date Projected Completion Date Actual
Total Costs Planned
Total Cost Projected
Total Costs Actual
Activities Last Action Date
1 Sep 30, 2011 1.722 1.717 Sep 12, 2011
2 Mar 31, 2012 1.767 1.765 Sep 12, 2011
3 Sep 30, 2012 0.384 0.385 Sep 12, 2011
4 Sep 30, 2011 1.153 1.240 Sep 12, 2011
5 Mar 31, 2012 0.934 0.943 Sep 12, 2011
6 Sep 30, 2012 0.748 0.748 Sep 12, 2011
7 Sep 30, 2011 0.211 0.213 Sep 12, 2011
8 Feb 1, 2012 0.138 0.139 Sep 12, 2011
9 Sep 30, 2011 0.055 0.055 Sep 12, 2011
10 Dec 14, 2011 0.028 0.028 Sep 12, 2011
11 Sep 30, 2011 111.478 95.828 Sep 12, 2011
12 Mar 31, 2012 110.643 95.047 Sep 12, 2011
13 Sep 30, 2012 108.578 92.884 Sep 12, 2011
14 Sep 30, 2011 3.700 3.700 Sep 12, 2011
15 Mar 31, 2012 3.700 3.700 Sep 12, 2011
16 May 16, 2012 0.915 0.915 Sep 12, 2011
17 Sep 30, 2011 3.747 3.726 Sep 12, 2011
18 Mar 31, 2012 5.554 5.533 Sep 12, 2011
19 Sep 30, 2012 1.910 1.889 Sep 12, 2011
20 Sep 30, 2011 0.056 0.056 Sep 12, 2011
21 Mar 31, 2012 0.073 0.073 Sep 12, 2011
22 Jun 14, 2012 0.006 0.006 Sep 12, 2011
23 Sep 30, 2011 15.436 15.425 Sep 12, 2011

24 Mar 31, 2012 22.590 22.579 Sep 12, 2011
25 Sep 30, 2012 0.072 0.061 Sep 12, 2011

300B - PROJECT RISK
Project Risk Project Execution Data addresses planning, DME, and significant maintenance projects for the investment.
Risk assessments should include risk information from all stakeholders and should be performed at the initial concept stage and then monitored and controlled throughout the life-cycle of the investment.
In the Project Risk table, list all significant project related risks for the investment that are currently open and provide risk assessment information. (It is not necessary to address all 19 OMB Risk Categories).
A. Project ID: An agency-specified number that uniquely identifies a project within this investment. For each identified risk, lists the associated Project ID.
B. Risk Name: A short description provides details of a risk, the cause of the risk and the effect that the risk causes to the project.
C. Risk Category: Please select the relevant OMB Risk Category for each risk. Risk categories include: 1) schedule; 2) initial costs; 3) life-cycle costs; 4) technical obsolescence; 5) feasibility; 6) reliability of systems; 7) dependencies and interoperability between this investment and others; 8) surety (asset protection) considerations; 9) risk of creating a monopoly for future procurements; 10) capability of agency to manage the investment; and 11) overall risk of investment failure; 12) organizational and change management; 13) business; 14) data/info; 15) technology; 16) strategic; 17) security; 18) privacy; and 19) project resources.
D. Risk Probability: The likelihood that a risk will occur (Low, Medium, or High)
E. Risk Impact: The impact on the project if the risk occurs (Low, Medium, or High)
F. Mitigation Plan: A short description of the plan or steps to mitigate the identified risk.
Table B.3 - Project Risk Table
# Active? Project ID Risk Name Risk Category
Risk Probability
Risk Impact
Risk Mitigation Plan Risk Last
Action Date
1 Active See Individual Project Risk Assessments
Regulatory Compliance - Result in additional analysis and negotiations with Tribal Nations, international, federal, state, and local regulatory agencies.
Schedule Low High Maintain effective communication with Municipal & Federal agencies, as well as other organizations to ensure that Regulatory requirements are identified and met in a timely manner.
Jul 22, 2011
2 Active See Individual Project Risk Assessments
Scope Changes - Address potential change to scope of project resulting in cost increase (e.g. Increase in fence length, additional gates, change in alignment). Cost increases due to stakeholder requests can be largely controlled through a disciplined Change Management Process.
Schedule Low Medium Include business partner in all design development meetings and field verify construction drawings. Adhere to PMO Change Management Process.
Jul 22, 2011
3 Active See Individual Project Risk Assessments
Real Estate - Results in additional real estate and land acquisition actions or events not originally planned impacting cost, resources required and schedule
Initial costs
Medium Medium Coordinate with stakeholders, and responsible project teams to ensure that Real Estate needs are identified and met in accordance with baseline schedule.
Jul 22, 2011
4 Active See Individual Project Risk Assessments
Archeological/ Environmental - Unforeseen archeological and/or environmental findings requiring mitigation of some level. Changes in project cost
Life-cycle costs
Low Medium Communicate with survey teams and PMO Environmental branch to understand findings and determine
Jul 22, 2011

# Active? Project ID Risk Name Risk Category
Risk Probability
Risk Impact
Risk Mitigation Plan Risk Last
Action Date
or schedule dependent upon level of mitigation required. Expected impact addresses anticipated costs that are directly attributable to the Project. SHPO, FWS and other government agency coordination directly related to Archeological/Environmental issues should be considered here, as applicable.
requirements in accordance with project schedules.
5 Active See Individual Project Risk Assessments
Hazardous Waste - Specific sub-section of Environmental. Pertains directly to the changes in cost or schedule that are related to mitigation of hazardous waste issues. (Ex. Encounter high levels of heavy metals, hydrocarbons, pcb, etc..results in cost for storage, testing and disposal.)
Life-cycle costs
Low Medium Communicate with survey teams to quickly identify potential issues and develop mitigation/remediation plans as necessary.
Jul 22, 2011
6 Active See Individual Project Risk Assessments
Architecture/ Engineering - Results in changes in the architectural design or engineering deviating from approved plans and materials.
Feasibility Low High Coordinate with stakeholders, and design teams to fully understand requirements so final solution meets the need.
Jul 22, 2011
7 Active See Individual Project Risk Assessments
Latent Underground Water/ Utilities/ Sub-Surface rock - Encountering unforeseen sub-surface water/ public/private underground structures/ underground rock/Latent Conditions resulting in project delays and adding cost due to dewatering operations and/or changes in construction methods or potential relocation.
Feasibility Low Medium Coordinate with survey teams to understand project site location so that the solution provided effectively addresses potential site issues.
Jul 22, 2011
8 Active See Individual Project Risk Assessments
Resource Shortage - Specific risks related to changes in project cost or schedule due to lack of resources (i.e. material, human, capital)
Project resources
Low Medium Work with stakeholders and business partners to define requirements so that planned resources meet the needs of the project.
Jul 22, 2011

300B - OPERATIONAL DATA
Section C: Operational Data (Performance Metrics) Operational Data addresses operational activities which are not reported as part of a project in the Project Execution Data.
There are two essential types of operations metrics to be reported (see FEA Reference Model Mapping Quick Guide):
1. Results Specific: Provide a minimum of two metrics which measure the effectiveness of the investment in delivering the desired service or support level; if applicable, at least one metric should reflect customer results (e.g.; “Service Quality”).
2. Activities and Technology Specific: Provide a minimum of three –metrics which measure the investment against its defined process standards or technical service level agreements (SLAs) (e.g.; “Reliability and Availability”). At least one of these metrics must have a monthly “Reporting Frequency.”
Provide results specific metrics which are appropriate to the mission of the investment and its business owner or Customer. Generally these metrics should be provided by the investment’s business owner and will reflect performance in the broader business activities and not IT-specific functions. The best results specific metrics will support the business case justification and could be the foundation of a quantitative approach to defining benefits in a cost-benefit analysis. Unlike in private industry where identified benefits accrue to the organization, government benefits may accrue to the public. Therefore, results-specific metrics may demonstrate the value realized external to the Federal Government. The table must include a minimum of two results-specific metrics, one of which should reflect customer results.
Each metric description should help the user understand what is being measured. In this field, describe the units used, any calculation algorithm used, and the definition or limits of the population or “universe” measured.
The unit of measure should be characterized (e.g. number, percentage, dollar value etc) for each metric. If the unit is not on the drop down list, please choose “Other” and provide unit of measure description in the “Metric Description” field. Each metric listed in the table must also indicate how often actual measurements will be reported (monthly, quarterly or semi-annually), as well as baseline, targets and actual results. The “Actual for PY” should be final actual measurement from the previous year or the average actual results from the previous year. Describe whether a successful actual measurement would be “over the target” or be “under the target” in “Measurement Condition.” “Comment” field is required for performance metrics where target not expected to be met. All data will be displayed on the IT Dashboard.
Table C.1 - Operational Data Table
# Active? Metric Description
Unit of Measure
Measurement Area
Measurement Category
Measurement Grouping
Baseline Target for PY
Actual for PY
Target for CY
1 Active Performance Metric - Acquisition Management (A measure of the percentage of prior year (FY11) funds that are obligated. Funds are obligated throughout the fiscal year and are measured monthly.)
Percent Mission and Business Results
Homeland Security
Border and Transportation Security
0.000 80.000 81.000 85.000
2 Active Performance Metric - Technical Management (A Measure of the number of program standards, processes, policies and procedures that are defined, officially approved and distributed throughout the program. The policies, procedures and standards establish standardized management requirements for all phases of program
Number Mission and Business Results
Homeland Security
Border and Transportation Security
55.000 108.000 108.000 138.000
# Active? Metric Description
Unit of Measure
Measurement Area
Measurement Category
Measurement Grouping
Baseline Target for PY
Actual for PY
Target for CY
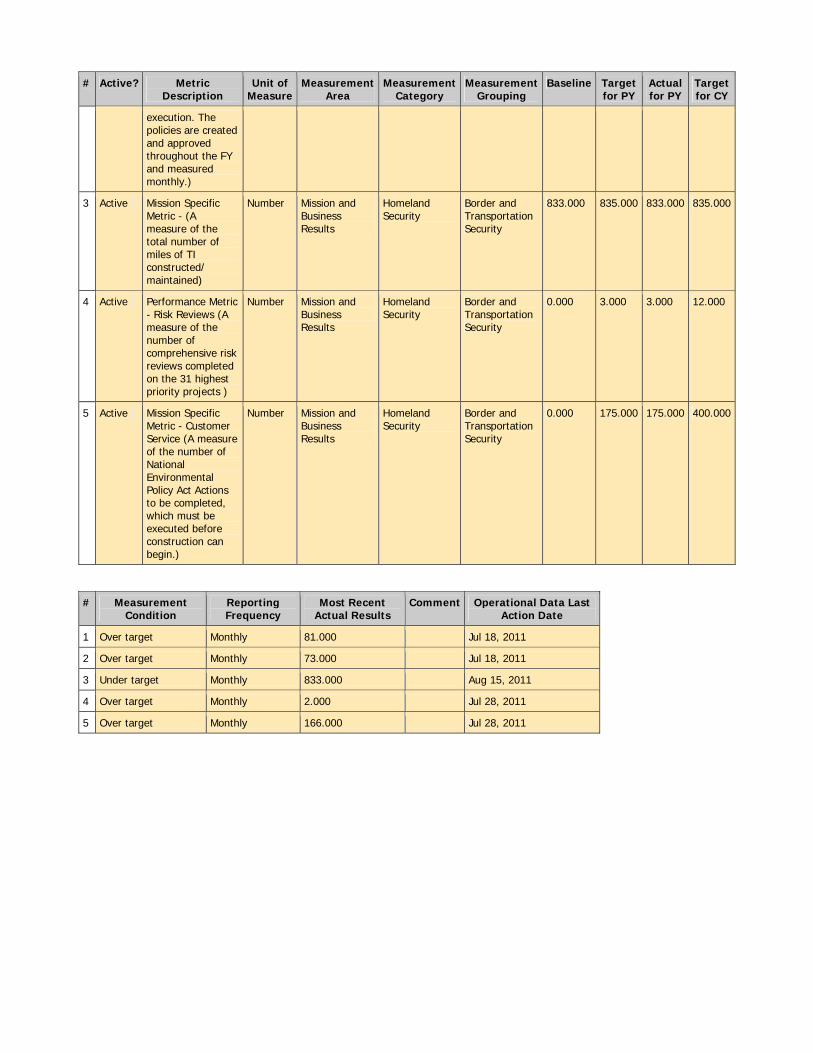
execution. The policies are created and approved throughout the FY and measured monthly.)
3 Active Mission Specific Metric - (A measure of the total number of miles of TI constructed/ maintained)
Number Mission and Business Results
Homeland Security
Border and Transportation Security
833.000 835.000 833.000 835.000
4 Active Performance Metric - Risk Reviews (A measure of the number of comprehensive risk reviews completed on the 31 highest priority projects )
Number Mission and Business Results
Homeland Security
Border and Transportation Security
0.000 3.000 3.000 12.000
5 Active Mission Specific Metric - Customer Service (A measure of the number of National Environmental Policy Act Actions to be completed, which must be executed before construction can begin.)
Number Mission and Business Results
Homeland Security
Border and Transportation Security
0.000 175.000 175.000 400.000
# Measurement Condition
Reporting Frequency
Most Recent Actual Results
Comment Operational Data Last Action Date
1 Over target Monthly 81.000 Jul 18, 2011
2 Over target Monthly 73.000 Jul 18, 2011
3 Under target Monthly 833.000 Aug 15, 2011
4 Over target Monthly 2.000 Jul 28, 2011
5 Over target Monthly 166.000 Jul 28, 2011

300B - OPERATIONAL RISK
Operational Risk Operational Data addresses operational activities which are not reported as a part of a project in Project Execution Data.
Risk assessments should include risk information from all stakeholders and should be performed at the initial concept stage and then monitored and controlled throughout the life-cycle of the investment.
In the Operational Risk table, list all significant operational related risks for the investment that are currently open and provide risk assessment information. (It is not necessary to address all 19 OMB Risk Categories).
A. Risk Name: A short description identifies a risk, the cause of the risk and the effect that the risk causes to the operational activity.
B. Risk Category: Please select the relevant OMB Risk Category for each risk. Risk categories include: 1) schedule; 2) initial costs; 3) life-cycle costs); 4) technical obsolescence; 5) feasibility; 6) reliability of systems; 7) dependencies and interoperability between this investment and others; 8) surety (asset protection) considerations; 9) risk of creating a monopoly for future procurements; 10) capability of agency to manage the investment; and 11) overall risk of investment failure; 12) organizational and change management; 13) business; 14) data/info; 15) technology; 16) strategic; 17) security; 18) privacy; and 19) project resources.
C. Risk Probability: The likelihood that a risk will occur (on scale from Low, Medium to High)
D. Risk Impact: The impact of a risk on the project if the risk occurs (on scale from Low, Medium to High)
E. Mitigation Plan: A short description provides how to mitigate the risk.
Table C.2 - Operational Risk
# Active? Risk Name Risk Category Risk Probability
Risk Impact
Risk Mitigation Plan Operational Risk Last
Action Date
1 Active Comprehensive Tactical Infrastructure Maintenance and Repair (CTIMR) contracts may not be awarded in time to meet the maintenance and repair needs of constructed TI
Dependencies and interoperability between this investment and others
Medium High Working with acquisitions team to ensure contractors are afforded as much information and assistance to minimize likelihood a protest. Maintaining high quality control in technical & cost evaluation proceedings to increase the likelihood of winning any protest.
Jul 18, 2011