exfoliated layered copper phosphonate showing enhanced ... filesupporting information exfoliated...
TRANSCRIPT
Supporting Information
Exfoliated layered copper phosphonate showing enhanced adsorption capability towards Pb ion
Wei-Xuan Nie, Song-Song Bao, Dai Zeng, Li-Rong Guo and Li-Min Zheng*
State Key Laboratory of Coordination Chemistry, Coordination Chemistry Institute, School of Chemistry and Chemical Engineering, Nanjing University, Nanjing 210093, P. R. China *Corresponding author. E-mail: [email protected], Fax: +86-25-83314502. Experimental section
Materials and methods. All reagents and solvents were commercially available
and were used without further purification. Elemental analyses were performed on an
Elementar Vario MICRO elemental analyzer. IR spectra were recorded on a Bruker
Tensor 27 spectrometer in the spectral range 4000-400 cm–1 using the KBr disk.
Thermogravimetric analyses were carried out on a Mettler–Toledo TGA/DSC1
instrument under a nitrogen flow. Powder X-ray diffraction (PXRD) data were
recorded on a D8 advance X-ray diffractometer with Cu–Kα radiation (λ = 1.54056 Å)
at room temperature. Atom force microscope (AFM) measurements were carried out
on VEECO Inc Multimode V. Scan electron microscopy (SEM) measurements were
performed on SHIMADZU SSX-550. Inductively Coupled Plasma (ICP) experiments
were performed on PE Optima 5300 DV.
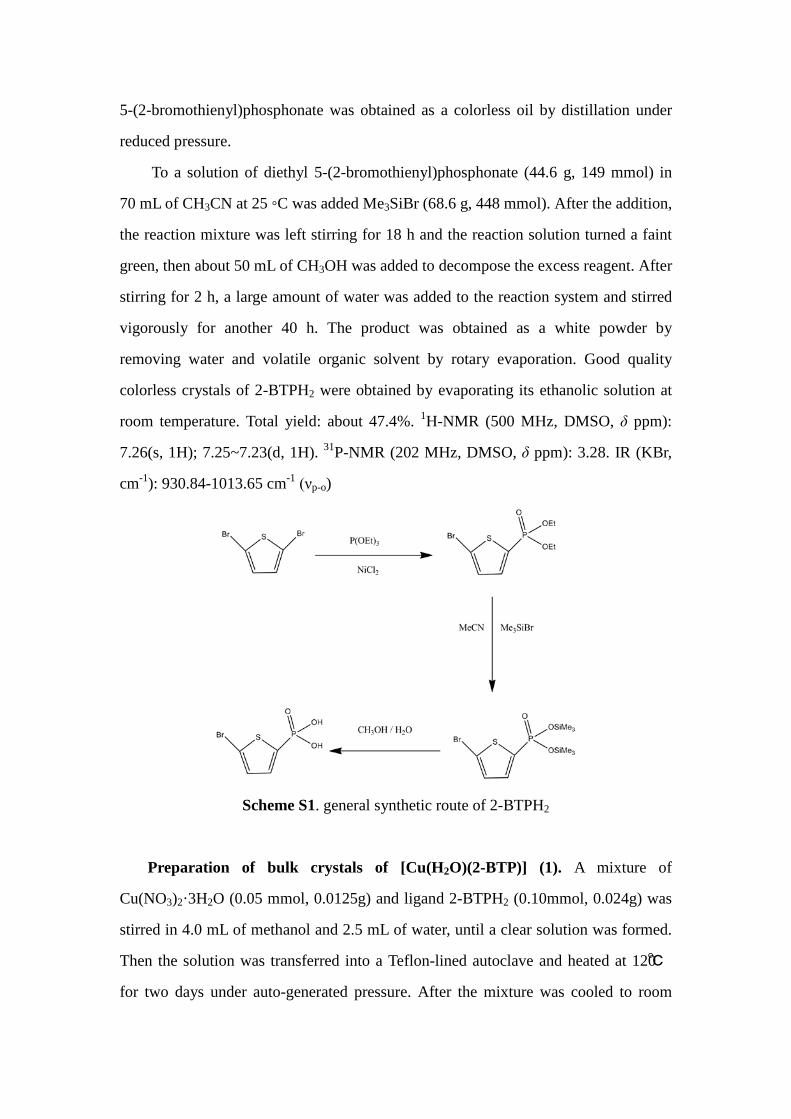
Synthesis of 5-(2-bromothienyl)phosphonic acid (2-BTPH2). 2-BTPH2 was
synthesized according to the method in the previous report1 which was shown in
Scheme S1. A 250 mL three-necked round bottomed flask was charged with 1.5 g
(11.6 mmol) of anhydrous NiCl2 and 102 mL (840 mmol) of 2,5-dibromothiophene. A
reflux condenser was attached and the system was purged with nitrogen. The flask
was heated to 160 ◦C on an oil bath, and then 49 mL (280 mmol) of triethyl phosphite
was added dropwise over about 4 h. During the course of the addition, the reactant
color changed from brown red to faint green, and then turned dark red gradually. After
the addition, the reaction was allowed to stir for an additional 4 h. Then diethyl
Electronic Supplementary Material (ESI) for ChemComm.This journal is © The Royal Society of Chemistry 2014
5-(2-bromothienyl)phosphonate was obtained as a colorless oil by distillation under
reduced pressure.
To a solution of diethyl 5-(2-bromothienyl)phosphonate (44.6 g, 149 mmol) in
70 mL of CH3CN at 25 ◦C was added Me3SiBr (68.6 g, 448 mmol). After the addition,
the reaction mixture was left stirring for 18 h and the reaction solution turned a faint
green, then about 50 mL of CH3OH was added to decompose the excess reagent. After
stirring for 2 h, a large amount of water was added to the reaction system and stirred
vigorously for another 40 h. The product was obtained as a white powder by
removing water and volatile organic solvent by rotary evaporation. Good quality
colorless crystals of 2-BTPH2 were obtained by evaporating its ethanolic solution at
room temperature. Total yield: about 47.4%. 1H-NMR (500 MHz, DMSO, δ ppm):
7.26(s, 1H); 7.25~7.23(d, 1H). 31P-NMR (202 MHz, DMSO, δ ppm): 3.28. IR (KBr,
cm-1): 930.84-1013.65 cm-1 (νp-o)
Scheme S1. general synthetic route of 2-BTPH2
Preparation of bulk crystals of [Cu(H2O)(2-BTP)] (1). A mixture of
Cu(NO3)2·3H2O (0.05 mmol, 0.0125g) and ligand 2-BTPH2 (0.10mmol, 0.024g) was
stirred in 4.0 mL of methanol and 2.5 mL of water, until a clear solution was formed.
Then the solution was transferred into a Teflon-lined autoclave and heated at 120℃
for two days under auto-generated pressure. After the mixture was cooled to room
temperature, blue-green lamellar crystals of [Cu(H2O)(2-BTP)] (1) were obtained.
The crystals which were suitable for both structural and property measurements were
manually collected. Yield: 62% based on Cu. Elemental anal. calcd for
BrC4H4SPO4Cu: C, 14.89; H, 1.24. Found: C, 15.14; H, 1.56. IR (KBr, cm–1): 3405s,
3060m, 1636m, 1508w, 1409s, 1299w, 1210w, 1093s, 1043s, 993s, 883w, 796m,
740w, 666m, 607m, 587m, 542m, 457w, 433w.
Crystallographic studies. A single crystal of dimensions 0.25×0.20×0.12 mm3
for 1 was selected for indexing and intensity data collection on a Brucker X–ray CCD
APEXⅡ diffractometer with graphite-monochromatized Mo–Kα radiation (λ =
0.71073 Å) at room temperature. The data were integrated using the Siemens SAINT
program, 2 with the intensities corrected for Lorentz factor, polarization, air absorption,
and absorption due to variation in the path length through the detector faceplate. The
structures was solved by direct methods and refined on F2 by full-matrix least-squares
using SHELXTL.3 All the non-hydrogen atoms were refined anisotropically. The
hydrogen atoms were located from the difference Fourier maps and refined
isotropically with the isotropic vibration parameters related to the non-hydrogen atom
to which they are bonded. Crystallographic and refinement details are listed in Table
S1. Selected bond lengths and angles for 1 are given in Table S2.
References
1 L.-R. Guo, F. Zhu, Y. Chen, Y.-Z. Li and L.-M. Zheng, Dalton Trans., 2009, 40,
8548.
2 SAINT: Program for Data Extraction and Reduction, Siemens Analytical X-ray
Instruments, Madison, WI, 1994–1996.
3 SHELXTL (version 5.0), Reference Manual, Siemens Industrial Automation,
Analytical Instruments, Madison, WI, 1995.
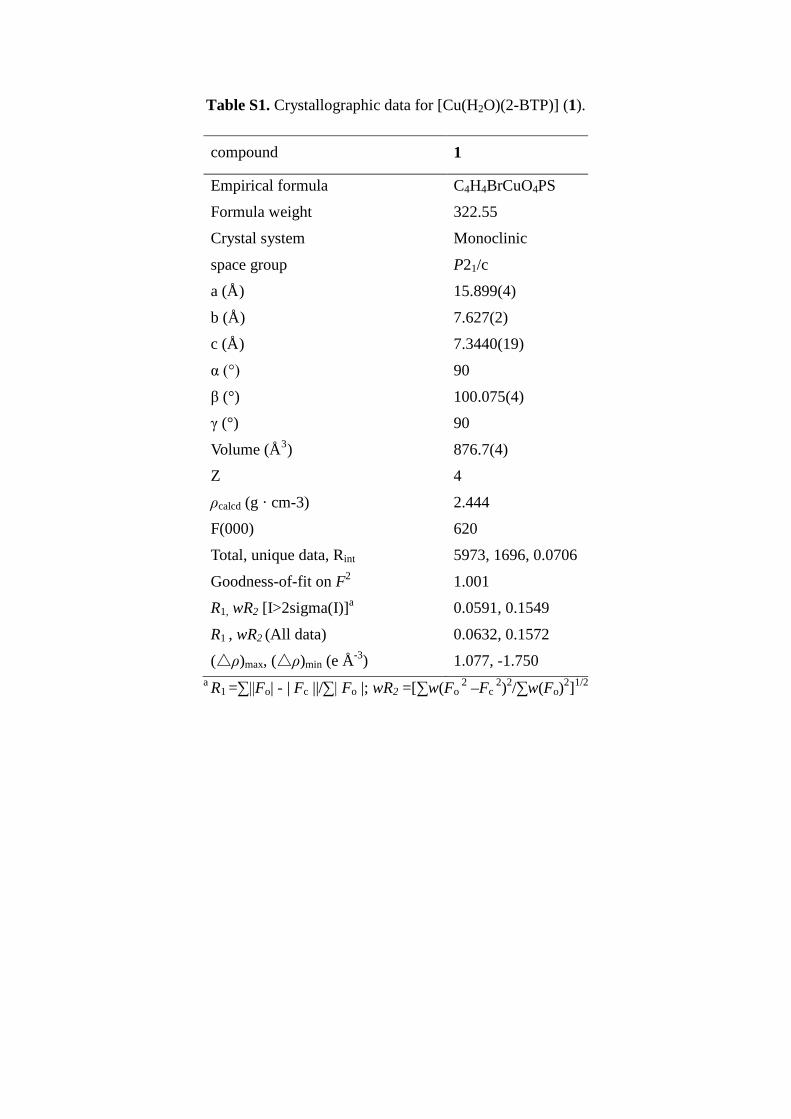
Table S1. Crystallographic data for [Cu(H2O)(2-BTP)] (1).
compound 1
Empirical formula C4H4BrCuO4PS
Formula weight 322.55
Crystal system Monoclinic
space group P21/c
a (Å) 15.899(4)
b (Å) 7.627(2)
c (Å) 7.3440(19)
α (°) 90
β (°) 100.075(4)
γ (°) 90
Volume (Å3) 876.7(4)
Z 4
ρcalcd (g · cm-3) 2.444
F(000) 620
Total, unique data, Rint 5973, 1696, 0.0706
Goodness-of-fit on F2 1.001
R1, wR2 [I>2sigma(I)]a 0.0591, 0.1549
R1 , wR2 (All data) 0.0632, 0.1572
(△ρ)max, (△ρ)min (e Å-3) 1.077, -1.750 a R1 =∑||Fo| - | Fc ||/∑| Fo |; wR2 =[∑w(Fo
2 –Fc 2)2/∑w(Fo)2]1/2
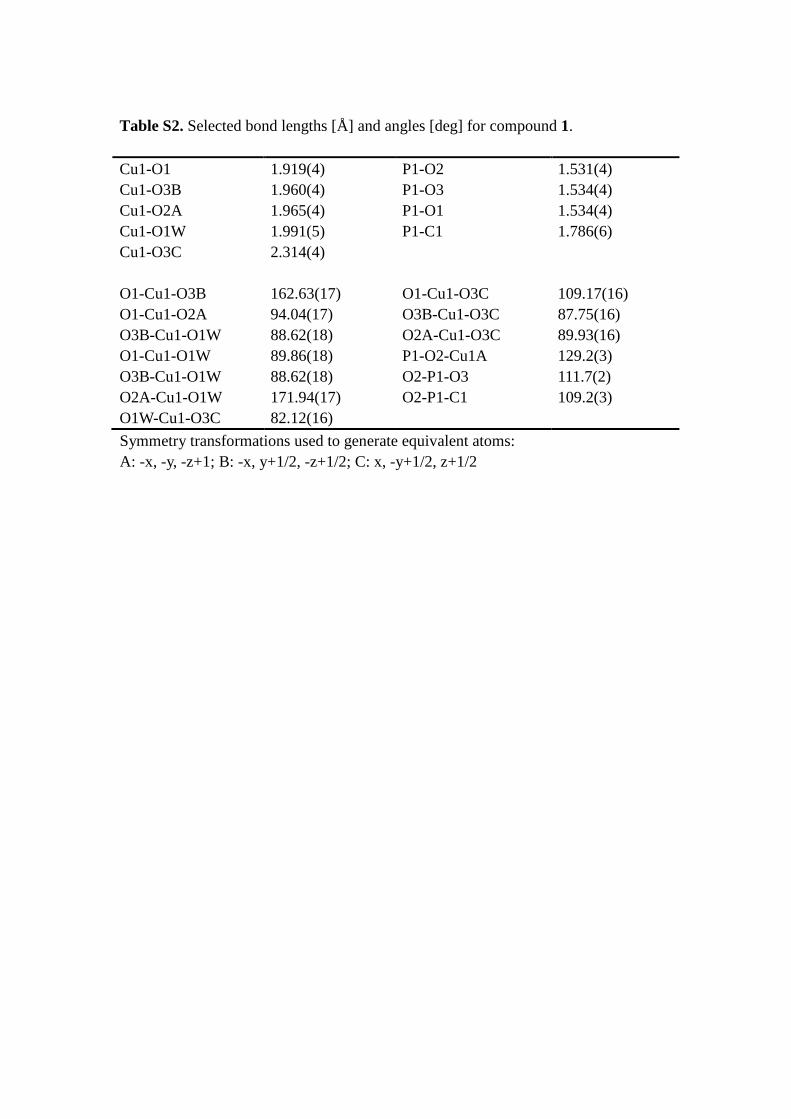
Table S2. Selected bond lengths [Å] and angles [deg] for compound 1. Cu1-O1 1.919(4) P1-O2 1.531(4) Cu1-O3B 1.960(4) P1-O3 1.534(4) Cu1-O2A 1.965(4) P1-O1 1.534(4) Cu1-O1W 1.991(5) P1-C1 1.786(6) Cu1-O3C 2.314(4) O1-Cu1-O3B 162.63(17) O1-Cu1-O3C 109.17(16) O1-Cu1-O2A 94.04(17) O3B-Cu1-O3C 87.75(16) O3B-Cu1-O1W 88.62(18) O2A-Cu1-O3C 89.93(16) O1-Cu1-O1W 89.86(18) P1-O2-Cu1A 129.2(3) O3B-Cu1-O1W 88.62(18) O2-P1-O3 111.7(2) O2A-Cu1-O1W 171.94(17) O2-P1-C1 109.2(3) O1W-Cu1-O3C 82.12(16) Symmetry transformations used to generate equivalent atoms: A: -x, -y, -z+1; B: -x, y+1/2, -z+1/2; C: x, -y+1/2, z+1/2
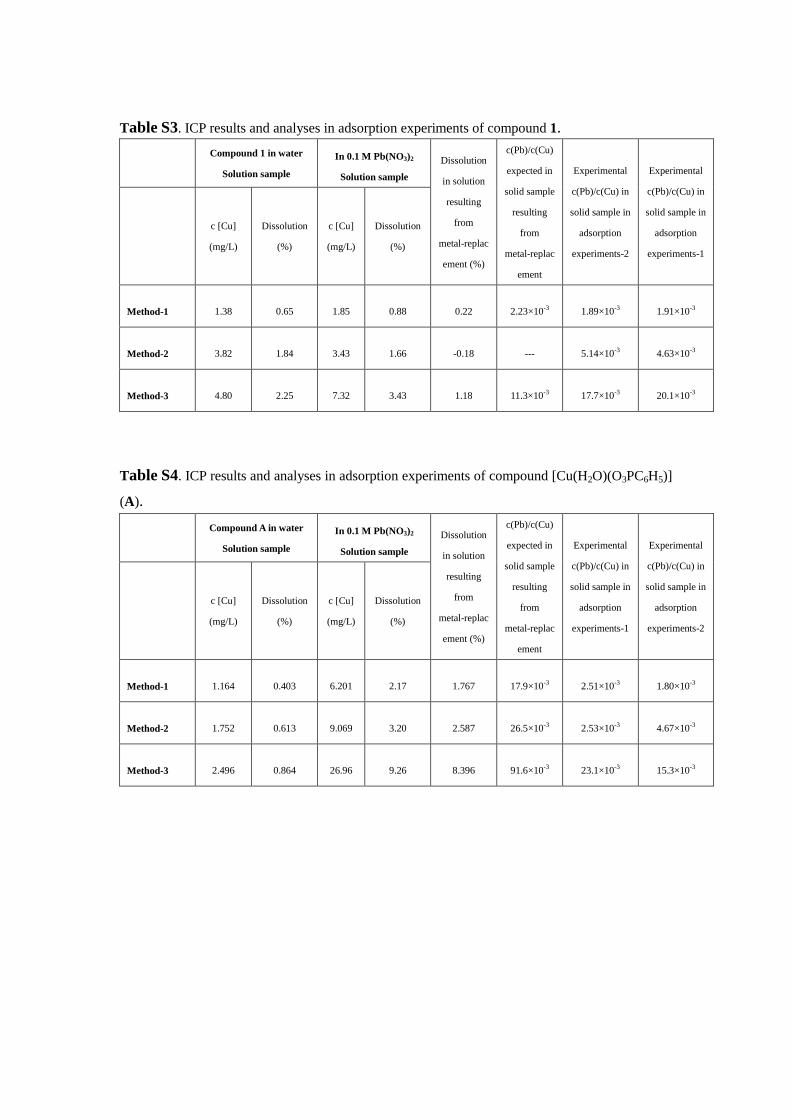
Table S3. ICP results and analyses in adsorption experiments of compound 1.
Compound 1 in water
Solution sample
In 0.1 M Pb(NO3)2
Solution sample Dissolution
in solution
resulting
from
metal-replac
ement (%)
c(Pb)/c(Cu)
expected in
solid sample
resulting
from
metal-replac
ement
Experimental
c(Pb)/c(Cu) in
solid sample in
adsorption
experiments-2
Experimental
c(Pb)/c(Cu) in
solid sample in
adsorption
experiments-1
c [Cu]
(mg/L)
Dissolution
(%)
c [Cu]
(mg/L)
Dissolution
(%)
Method-1 1.38 0.65 1.85 0.88 0.22 2.23×10⁻³ 1.89×10⁻³ 1.91×10⁻³
Method-2 3.82 1.84 3.43 1.66 -0.18 --- 5.14×10⁻³ 4.63×10⁻³
Method-3 4.80 2.25 7.32 3.43 1.18 11.3×10⁻³ 17.7×10⁻³ 20.1×10⁻³
Table S4. ICP results and analyses in adsorption experiments of compound [Cu(H2O)(O3PC6H5)]
(A).
Compound A in water
Solution sample
In 0.1 M Pb(NO3)2
Solution sample
Dissolution
in solution
resulting
from
metal-replac
ement (%)
c(Pb)/c(Cu)
expected in
solid sample
resulting
from
metal-replac
ement
Experimental
c(Pb)/c(Cu) in
solid sample in
adsorption
experiments-1
Experimental
c(Pb)/c(Cu) in
solid sample in
adsorption
experiments-2
c [Cu]
(mg/L)
Dissolution
(%)
c [Cu]
(mg/L)
Dissolution
(%)
Method-1 1.164 0.403 6.201 2.17 1.767 17.9×10⁻³ 2.51×10⁻³ 1.80×10⁻³
Method-2 1.752 0.613 9.069 3.20 2.587 26.5×10⁻³ 2.53×10⁻³ 4.67×10⁻³
Method-3 2.496 0.864 26.96 9.26 8.396 91.6×10⁻³ 23.1×10⁻³ 15.3×10⁻³
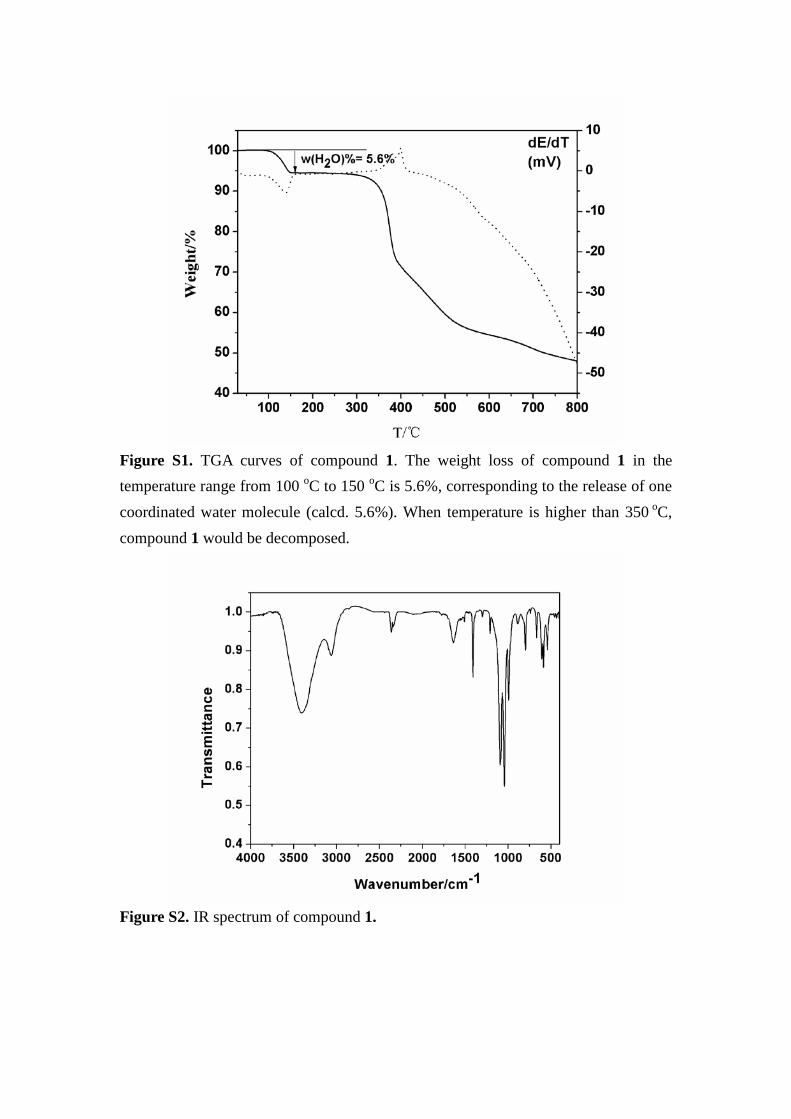
Figure S1. TGA curves of compound 1. The weight loss of compound 1 in the temperature range from 100 oC to 150 oC is 5.6%, corresponding to the release of one coordinated water molecule (calcd. 5.6%). When temperature is higher than 350 oC, compound 1 would be decomposed.
Figure S2. IR spectrum of compound 1.
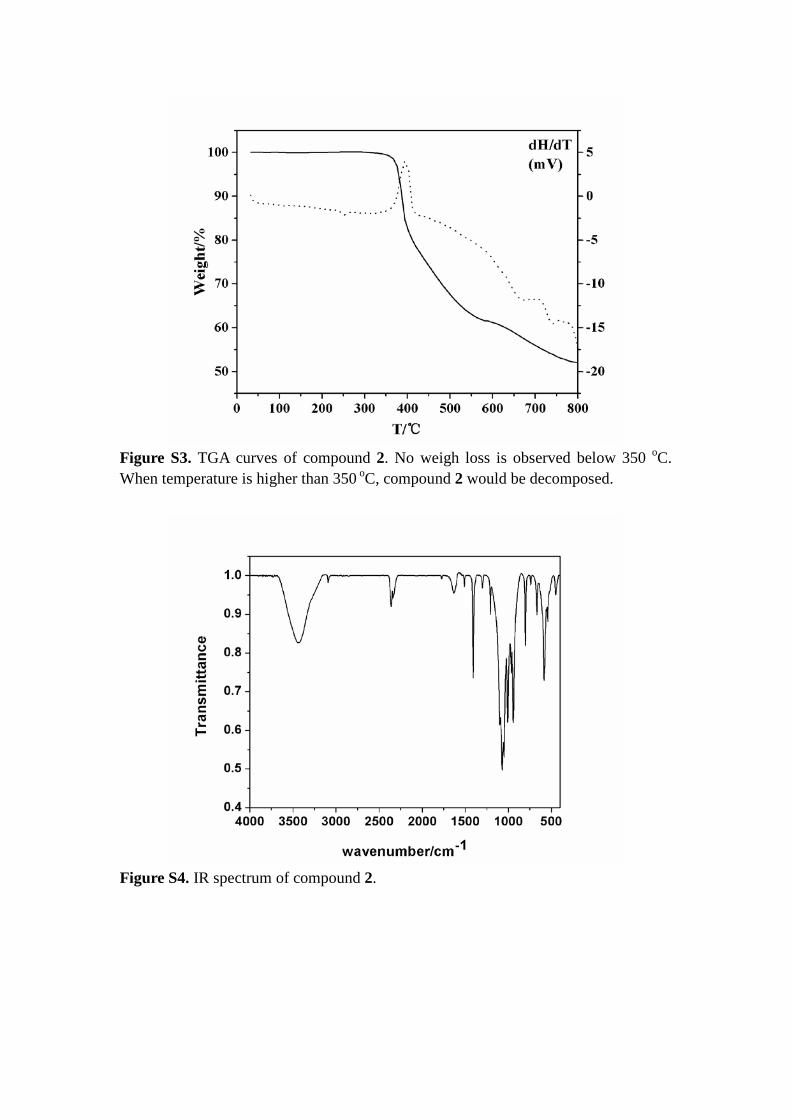
Figure S3. TGA curves of compound 2. No weigh loss is observed below 350 oC. When temperature is higher than 350 oC, compound 2 would be decomposed.
Figure S4. IR spectrum of compound 2.
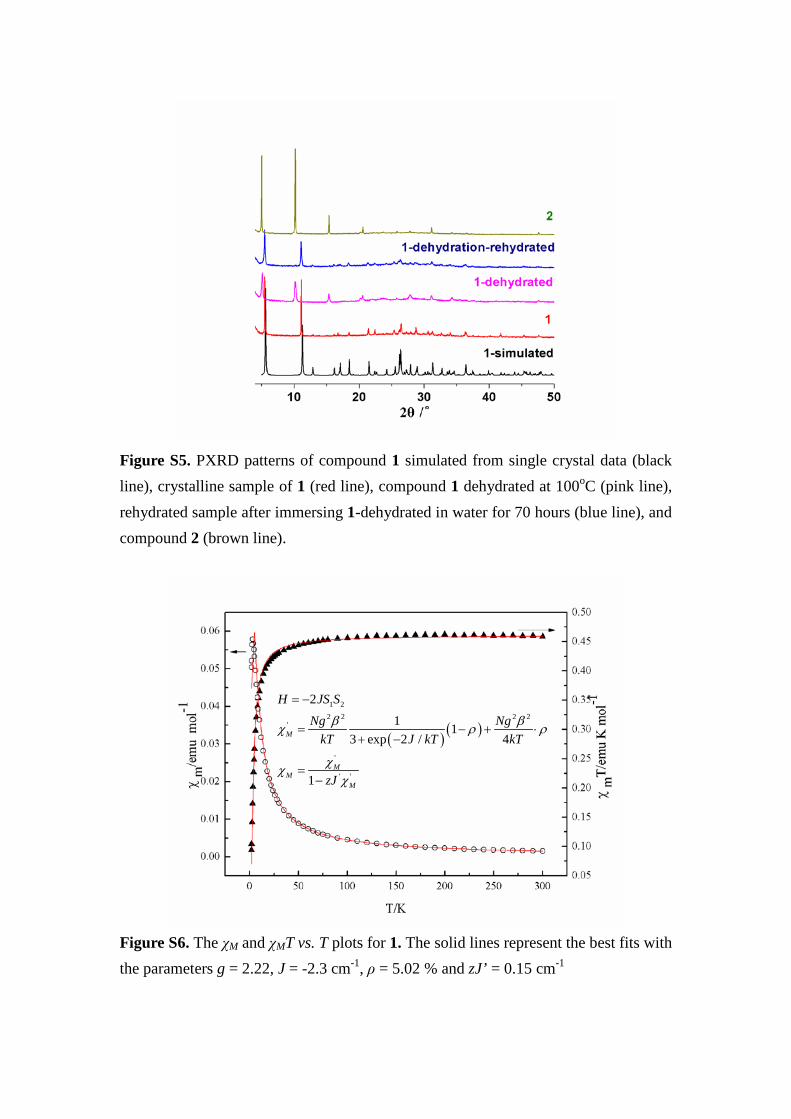
Figure S5. PXRD patterns of compound 1 simulated from single crystal data (black line), crystalline sample of 1 (red line), compound 1 dehydrated at 100oC (pink line), rehydrated sample after immersing 1-dehydrated in water for 70 hours (blue line), and compound 2 (brown line).
Figure S6. The χM and χMT vs. T plots for 1. The solid lines represent the best fits with the parameters g = 2.22, J = -2.3 cm-1, ρ = 5.02 % and zJ’ = 0.15 cm-1
( ) ( )
1 22 2 2 2
'
'
' '
2
1 13 exp 2 / 4
1
M
MM
M
H JS SNg Ng
kT J kT kT
zJ
β βχ ρ ρ
χχχ
= −
= − + ⋅+ −
=−
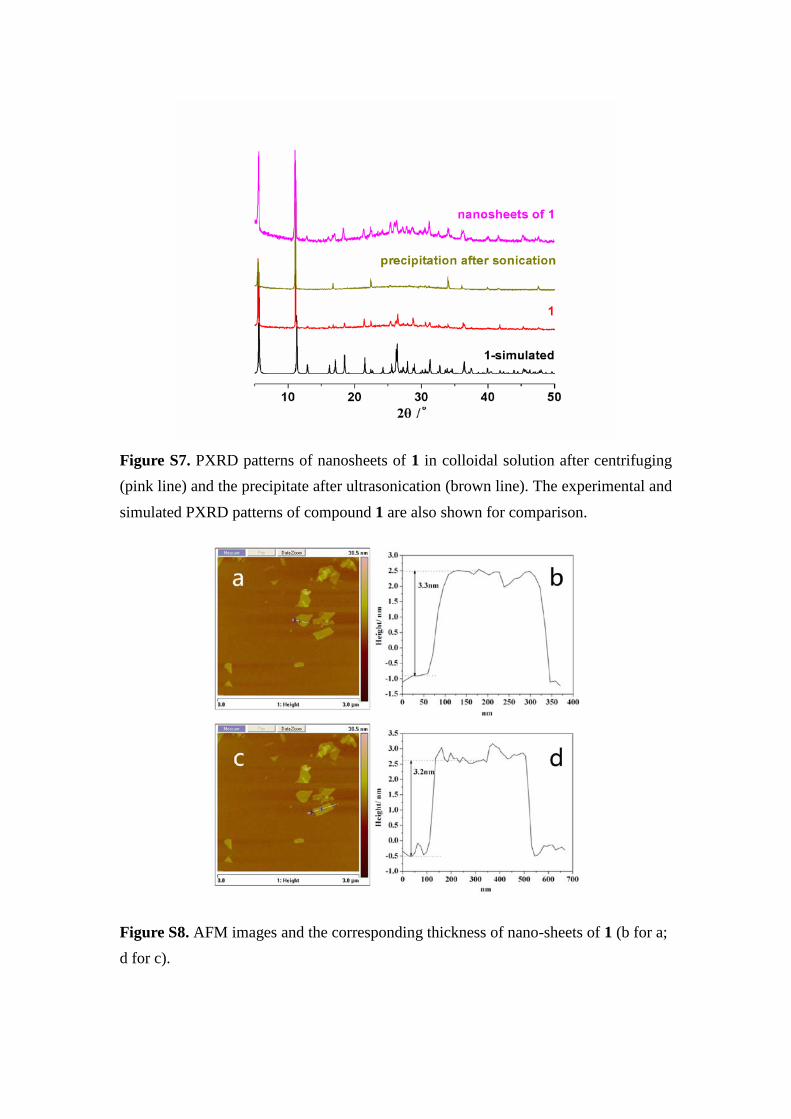
Figure S7. PXRD patterns of nanosheets of 1 in colloidal solution after centrifuging (pink line) and the precipitate after ultrasonication (brown line). The experimental and simulated PXRD patterns of compound 1 are also shown for comparison.
Figure S8. AFM images and the corresponding thickness of nano-sheets of 1 (b for a; d for c).
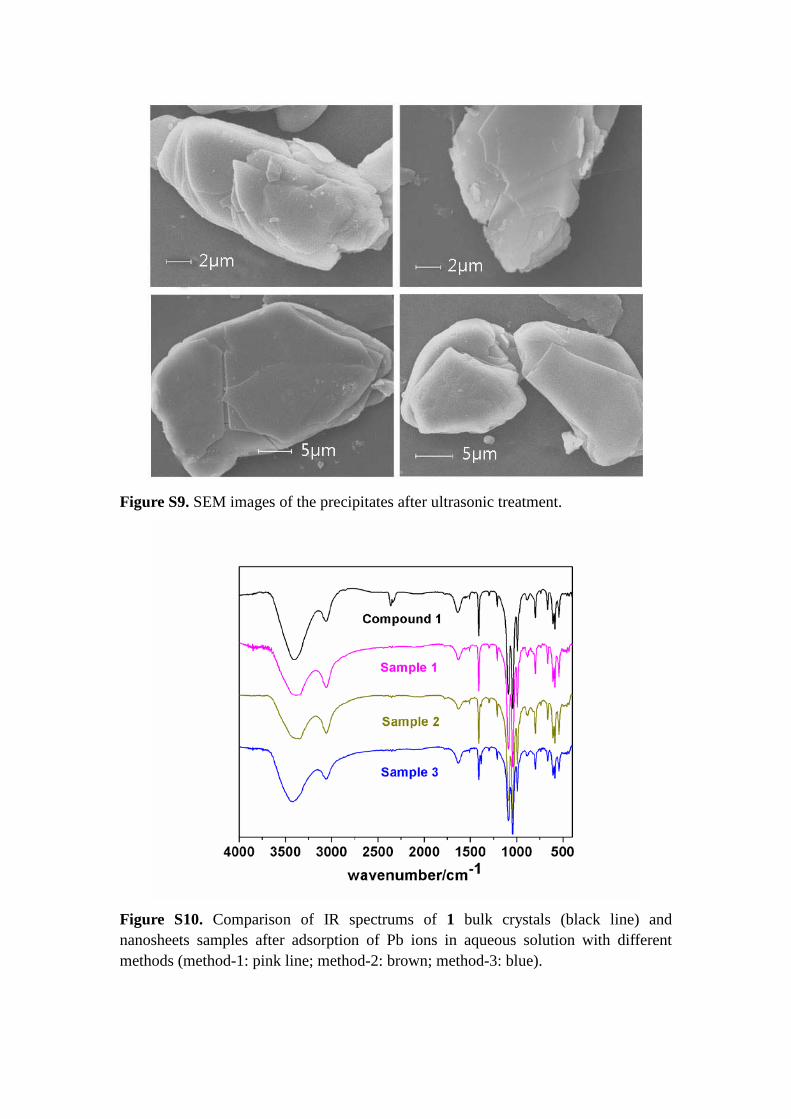
Figure S9. SEM images of the precipitates after ultrasonic treatment.
Figure S10. Comparison of IR spectrums of 1 bulk crystals (black line) and nanosheets samples after adsorption of Pb ions in aqueous solution with different methods (method-1: pink line; method-2: brown; method-3: blue).
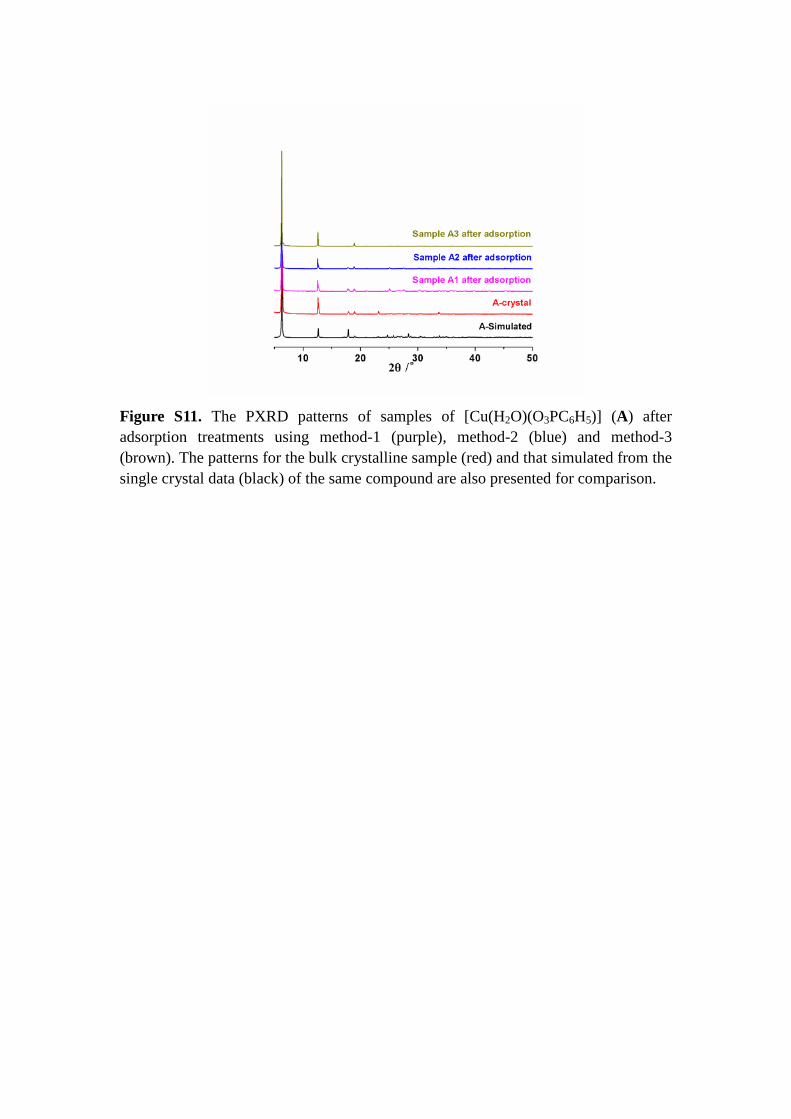
Figure S11. The PXRD patterns of samples of [Cu(H2O)(O3PC6H5)] (A) after adsorption treatments using method-1 (purple), method-2 (blue) and method-3 (brown). The patterns for the bulk crystalline sample (red) and that simulated from the single crystal data (black) of the same compound are also presented for comparison.