exergy-based control of electricity demand and microgeneration
TRANSCRIPT
APPLIED
Applied Energy 84 (2007) 239–253
www.elsevier.com/locate/apenergy
ENERGY
Exergy-based control of electricity demand andmicrogeneration
P.J. Boait *, R.M. Rylatt, A. Wright
Institute of Energy and Sustainable Development, De Montfort University, Queens Building,
The Gateway, Leicester LE1 9BH, UK
Accepted 4 September 2006
Abstract
As the penetration of weather-dependent embedded generation grows, the variations in apparentdemand experienced by distribution network operators will become more extreme. A method for theautonomous control of domestic electricity demand and microgeneration is proposed using theestablished, but underdeveloped, radio teleswitch technology. The disadvantages of cost or car-bon-emission based optimisation using this method are discussed and an alternative approach basedon minimisation of exergy loss is described. Results obtained from a computer model demonstrate itspotential contribution to the balancing of electricity supply and demand.� 2006 Elsevier Ltd. All rights reserved.
Keywords: Exergy; Demand management; Embedded generation
1. Introduction
1.1. Benefits of demand-side measures
The electricity industry has for a long time recognised the potential benefits of gaininginfluence or control over levels of demand, including reduction in peak system loads and
0306-2619/$ - see front matter � 2006 Elsevier Ltd. All rights reserved.
doi:10.1016/j.apenergy.2006.09.001
* Corresponding author. Tel.: +44 124 251 1278; fax: +44 116 257 7981.E-mail address: [email protected] (P.J. Boait).
List of symbols
a,b,c,d half-hour intervals from the diurnal cycle in which heating starts (a,c)and stops (b,d) events occur
Ch thermal capacity of house (kW h/K)E, EL exergy, exergy loss (kW h)Hi heat output (kW) of microCHP in ith half-hour intervalLi proportion of exergy lost in ith half-hour intervalPi electrical power consumed or generated in ith half-hour interval (kW)Q thermal energy (kWh)T, Ts, Te, Tr temperature, (set-point, external, and room)Trm, Tre, Tri predicted room-temperature (morning, evening, and ith half-hour
interval)Tem, Tee, Tei predicted external-temperature (morning, evening, and ith half-hour
interval)ti, tm, te duration of energy input during ith half-hour interval, durations of
morning and evening heating sessionsWh heat loss rate from house because of temperature difference between
interior and exteriorge, gh electrical efficiency and thermal efficiency (of CHP unit)
240 P.J. Boait et al. / Applied Energy 84 (2007) 239–253
hence installed-generation capacity, increased capacity utilisation through reduced loadvariance, and deferred investment in distribution networks. The advent of large-scalerenewable generation incentivised by government policy [1], with associated weatherdependencies [2], has made demand-side management potentially more attractive as ameans of mitigating the intermittency in renewable generation output. Recent studies[3,4] have shown the need for simple low-cost demand control mechanisms that couldbe used for domestic and small commercial and industrial consumers.
This paper proposes a demand-side management technique based on a radio broadcastof a signal indicating the efficiency with which electricity will be generated over the coming24 h. This will allow receiving devices that control electricity-consuming appliances to planthe time when they will place their demand, such that peak demand is reduced, and thevariance in apparent demand caused by embedded weather-dependent renewable genera-tors is reduced. As small generators embedded in distribution networks are seen by thebalancing system as negative demand, it is proposed to extend this form of demand man-agement to small and micro combined heat-and-power (CHP) units. Because of their costeffectiveness and carbon emission savings, it is possible such units may comprise 5 GW ofUK generation capacity by 2050 [5,6].
1.2. The radio teleswitch system
Electric heating, using thermal-storage radiators, is an established method of heating inthe UK currently used in about 1,500,000 homes. Their operation is normally limited bytime switches to a 7 h overnight period providing a simple form of demand management.
P.J. Boait et al. / Applied Energy 84 (2007) 239–253 241
When timed charging of storage radiators first became common in the 1970s, all the timeswitches came on at 1 a.m. leading to a sharp step in demand, which was difficult for gen-erating plant to track. To mitigate this problem the radio teleswitch system [7] was intro-duced in the early 1980s. This transmits switching times as a digital signal carried withinthe BBC Radio 4 broadcast on 198 kHz, with address codes allowing the population ofstorage radiators to be divided into up to 256 groups that can be started at different times.The system can also switch radiators on for a period during the day to top up the thermalcharge.
There have been schemes that extend the capability of the radio teleswitch system, toprovide a cost signal and a weather forecast allowing the storage radiators to be chargedprecisely to match the expected thermal load [8]. These have had limited take up, partlybecause the low turnover in the installed base of radio teleswitch receivers does not drawin new technology, and also the ability of consumers to switch suppliers easily means con-tracts that permit demand management are not maintained [3]. Given the new pressuresfor energy efficiency, there must be scope for developing this proven concept. Any new sys-tem should have two properties:
(i) it should be capable of installation by householders or tradesmen on their owninitiative;
(ii) it should allow any appliance to be controlled, not just storage radiators, but also,for example, freezers, tumble driers, immersion heaters, heat pumps and microCHPunits.
The first requirement implies that control and metering functions must be separated,since electricity meters can only be installed by Distribution Network Operators (DNOs)or their metering agents. For consumers to be rewarded for demand management, thisimplies some form of time-sensitive metering is needed. Such ‘‘smart’’ metering is widelyrecognised as a facilitator for energy efficiency: large-scale deployment is in progress inSweden, Denmark and Italy, and a substantial pilot programme has now been initiatedin the UK [9]. This paper takes as an assumption that the case for time-of-day meteringis so strong that it will be progressively adopted.
1.3. Despatch of domestic microgeneration
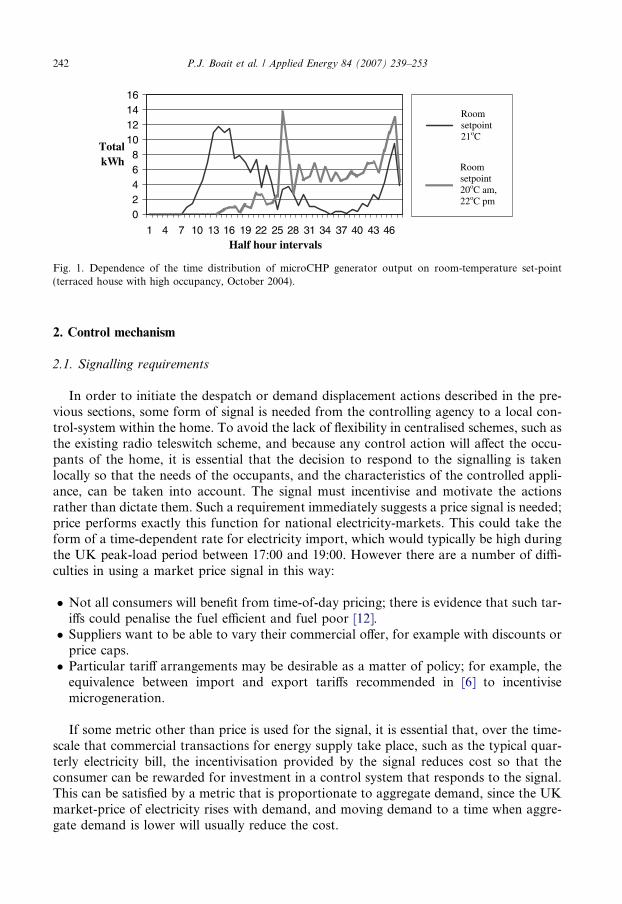
Since the domestic microCHP units currently in use or development are heat-led, theonly way to control electrical output is to manipulate the demand for heat. This can beperformed quite simply by raising the room temperature set-point that controls the heat-ing requirement, either as a step function or as a ramp change over time. The changeneed not be large (0.5–1 �C) and clearly must be acceptable to the occupants bothcontractually and in terms of comfort. This mechanism was first proposed in [10] andvalidated by practical experiment in [11], which shows how a rising room-temperatureset-point moves the microCHP output to later in the day, when it is more useful in meet-ing the local electrical demand. Fig. 1 shows the total generated output, over a month, ineach half-hour interval of the day, for a house where the set-point is maintained level at21 �C, compared with the same house with a set-point that rises from 20 �C to 22 �Cduring the day.
02468
10121416
1 4 7 10 13 16 19 22 25 28 31 34 37 40 43 46Half hour intervals
TotalkWh
Room 21C
Room 20 22
Roomsetpoint21oC
Roomsetpoint20oC am, 22oC pm
Fig. 1. Dependence of the time distribution of microCHP generator output on room-temperature set-point(terraced house with high occupancy, October 2004).
242 P.J. Boait et al. / Applied Energy 84 (2007) 239–253
2. Control mechanism
2.1. Signalling requirements
In order to initiate the despatch or demand displacement actions described in the pre-vious sections, some form of signal is needed from the controlling agency to a local con-trol-system within the home. To avoid the lack of flexibility in centralised schemes, such asthe existing radio teleswitch scheme, and because any control action will affect the occu-pants of the home, it is essential that the decision to respond to the signalling is takenlocally so that the needs of the occupants, and the characteristics of the controlled appli-ance, can be taken into account. The signal must incentivise and motivate the actionsrather than dictate them. Such a requirement immediately suggests a price signal is needed;price performs exactly this function for national electricity-markets. This could take theform of a time-dependent rate for electricity import, which would typically be high duringthe UK peak-load period between 17:00 and 19:00. However there are a number of diffi-culties in using a market price signal in this way:
� Not all consumers will benefit from time-of-day pricing; there is evidence that such tar-iffs could penalise the fuel efficient and fuel poor [12].� Suppliers want to be able to vary their commercial offer, for example with discounts or
price caps.� Particular tariff arrangements may be desirable as a matter of policy; for example, the
equivalence between import and export tariffs recommended in [6] to incentivisemicrogeneration.
If some metric other than price is used for the signal, it is essential that, over the time-scale that commercial transactions for energy supply take place, such as the typical quar-terly electricity bill, the incentivisation provided by the signal reduces cost so that theconsumer can be rewarded for investment in a control system that responds to the signal.This can be satisfied by a metric that is proportionate to aggregate demand, since the UKmarket-price of electricity rises with demand, and moving demand to a time when aggre-gate demand is lower will usually reduce the cost.
P.J. Boait et al. / Applied Energy 84 (2007) 239–253 243
An obvious candidate is the carbon intensity of the plant – the signal would be the aver-age carbon-emissions (in kg/kWh) of the generator units despatched; the objective func-tion of the local control unit would be to minimise carbon emissions. The disadvantageof this metric is equally obvious – in future there may be situations, perhaps overnightwhen demand is low, where the only plant operating is nuclear or wind powered; hencethe carbon-emission factor is zero and does not offer any useful discrimination. Alsothe metric must be meaningful for control decisions that take account of domestic energysources such as biomass or solar thermal heating for which carbon emissions are zero.
2.2. Signalling of exergy loss
Given these drawbacks in using price and carbon intensity as metrics, it is proposed tosignal the efficiency of electricity generation in the form of exergy loss. Exergy is an exten-sive thermodynamic property of a system, also known as availability, which quantifies theability of energy within the system to deliver useful work in accordance with the second lawof thermodynamics. Exergy efficiency captures the extent to which that available work issuccessfully extracted. So an exergy loss signal will indicate, for each kW h of delivered elec-tricity, the proportion that was lost of the available energy in the sources used to generate it.The domestic control system responding to this signal will have an objective function thatminimises exergy loss, both in respect of imported electricity, and any energy consuming orconverting devices within the home that are capable of being controlled. As long as exergyloss increases with rising demand, and reduces with increasing renewable content in the fuelmix, then the two objectives of cutting peak demand, and reducing variability of apparentdemand arising from embedded renewable generation, can be achieved.
The particular merit of minimising exergy loss, as an objective function, is that it is sen-sitive to the match between energy source and its use. For example, if a home is equippedwith a micro wind-turbine, and with solar water heating, then the domestic hot watercould be heated with either energy source. The energy efficiency in both cases would beclose to 100%, but the exergy efficiency of using electricity from the micro wind turbinewould be poor, i.e. around 20%, whereas the exergy efficiency of using the solar waterheating will be about 80%. So for this home, if the exergy loss inherent in grid electricityis also known, then a suitable control unit can make accurate decisions simply on the basisof minimising exergy loss, across all the energy sources at its disposal.
It will be shown that average exergy loss does increase with rising demand for a givenlevel of generation capacity of each fuel type, because:
(i) renewables and nuclear power have the highest exergy efficiency and sit at the lowestlevel of the merit order through their low (or zero) marginal cost of generation, whileincreasing demand is met using fossil-fuel plant with higher levels of exergy losses;and
(ii) increasing demand also causes higher exergy losses through network resistance (i.e.I2R losses).
The other desirable property of a signalled metric, tracking the proportion of renew-ables in the fuel mix, is satisfied because the exergy loss of renewables is much lower thanfor nuclear or fossil-fuel generation, so any increase in renewable generation during a24 h period will tend to attract demand. However, it is clearly necessary to show that
244 P.J. Boait et al. / Applied Energy 84 (2007) 239–253
the movement of demand to a time when exergy loss is lower does not have undesirableeffects on carbon emissions.
2.3. Calculation of exergy loss and carbon intensity
The simplest expression for exergy E uses the Carnot coefficient:
E ¼ QðT � T oÞ=T
where Q is a quantity of heat at temperature T with surroundings at To. Thus the exergycontent of the heat in the circulating hot water of a central-heating system, operating at333 K, with an outside temperature at 272 K (the temperature typically used to calculateheating-system capacities in the UK), is 18.3%. The overall exergy efficiency of such a cen-tral-heating system with a condensing gas-boiler operating with a 90% first-law efficiency isthe product of first and second law efficiencies, i.e. 16.5%.
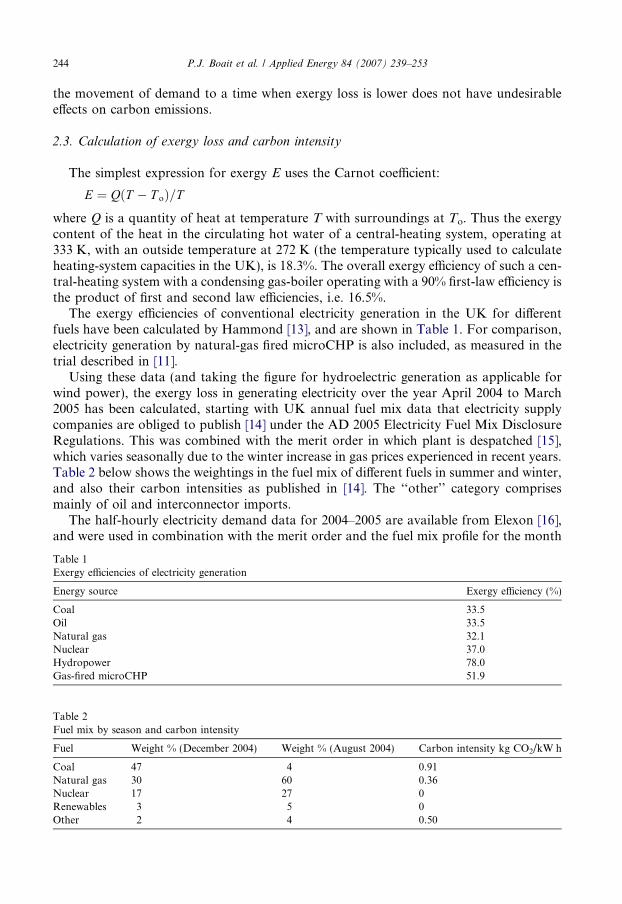
The exergy efficiencies of conventional electricity generation in the UK for differentfuels have been calculated by Hammond [13], and are shown in Table 1. For comparison,electricity generation by natural-gas fired microCHP is also included, as measured in thetrial described in [11].
Using these data (and taking the figure for hydroelectric generation as applicable forwind power), the exergy loss in generating electricity over the year April 2004 to March2005 has been calculated, starting with UK annual fuel mix data that electricity supplycompanies are obliged to publish [14] under the AD 2005 Electricity Fuel Mix DisclosureRegulations. This was combined with the merit order in which plant is despatched [15],which varies seasonally due to the winter increase in gas prices experienced in recent years.Table 2 below shows the weightings in the fuel mix of different fuels in summer and winter,and also their carbon intensities as published in [14]. The ‘‘other’’ category comprisesmainly of oil and interconnector imports.
The half-hourly electricity demand data for 2004–2005 are available from Elexon [16],and were used in combination with the merit order and the fuel mix profile for the month
Table 1Exergy efficiencies of electricity generation
Energy source Exergy efficiency (%)
Coal 33.5Oil 33.5Natural gas 32.1Nuclear 37.0Hydropower 78.0Gas-fired microCHP 51.9
Table 2Fuel mix by season and carbon intensity
Fuel Weight % (December 2004) Weight % (August 2004) Carbon intensity kg CO2/kW h
Coal 47 4 0.91Natural gas 30 60 0.36Nuclear 17 27 0Renewables 3 5 0Other 2 4 0.50
P.J. Boait et al. / Applied Energy 84 (2007) 239–253 245
to calculate daily exergy loss profiles and carbon intensities. As long as the variable ele-ment of demand is met by generators whose exergy loss and carbon intensity are greaterthan the average exergy loss and carbon intensity of the baseload generation, then exergyloss and carbon intensity will rise with demand. For recent years, the prices of gas and coalhave been such that, in summer, the combination of renewables and nuclear power meetsabout half of the baseload, and the balance is met with a gas and a small oil element. Var-iable demand is met with a mixture of gas and coal generation. In winter, there is a sub-stantial coal-fired component in the baseload, and the mix for variable demand has morecoal because of its improved position in the merit order. This seasonally varying fuel-mixdoes deliver the desired relationships as shown in Table 3; similar results confirming themarginal carbon-intensity of UK electricity generation have been published [17].
It can be seen that, in future, as long as the expansion of renewables at least keeps pacewith the decline in nuclear power, then the high exergy-efficiency and low carbon-intensityof the baseload generation will be maintained; if nuclear power expands, the position ofbaseload will be further improved in this respect. Variable demand is likely to be met usingfossil fuels for the foreseeable future, while the effect of this and other demand-manage-ment proposals will be to narrow the range of demand variation. If carbon capture isintroduced, such plant is likely to be employed as baseload because of its high capital cost.While its carbon emissions will be low, the exergy efficiency is also likely to be lower thanwith conventional plant because of the losses in the carbon-capture process. So the effectwill be to slightly degrade the average exergy efficiency of the baseload, but it is very unli-kely that the balance between baseload and variable efficiencies will be destabilised.
Table 3Seasonal exergy-efficiency and carbon intensity for electricity generation meeting baseload and variable demand
Season Baseload exergyefficiency (%)
Baseload carbonintensity (kg CO2/kW h)
Exergy efficiency ofvariable demand (%)
Carbon intensity of variabledemand (kg CO2/kW h)
Summer 37 0.21 33 0.6Winter 36 0.56 33 0.7
-1.20
-1.00
-0.80
-0.60
-0.40
-0.20
0.00
0.20
0.40
0.60
0.80
1 4 7 10 13 16 19 22 25 28 31 34 37 40 43 46%Half-hour intervals
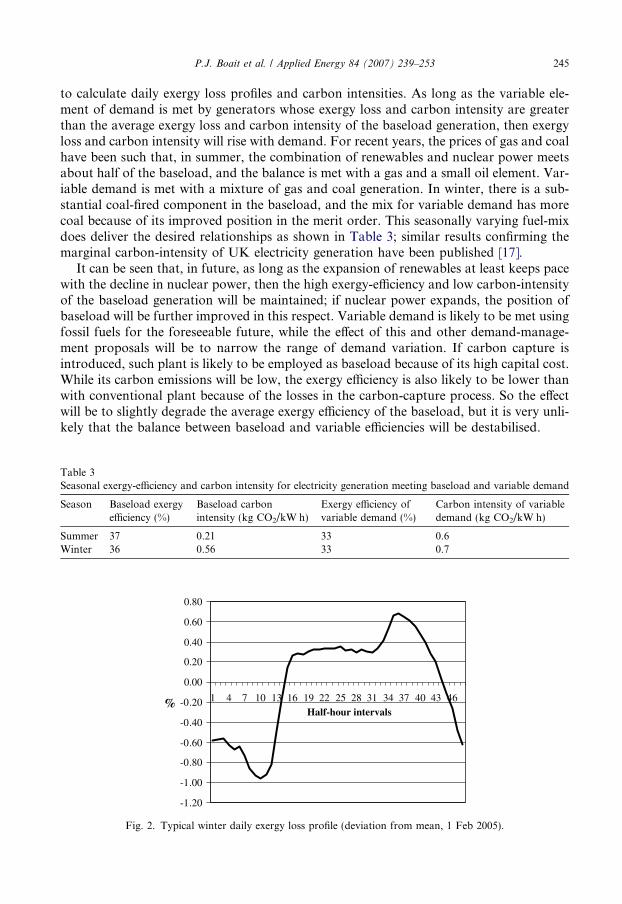
Fig. 2. Typical winter daily exergy loss profile (deviation from mean, 1 Feb 2005).
246 P.J. Boait et al. / Applied Energy 84 (2007) 239–253
An exergy loss profile as envisaged for broadcast as a control signal is shown in Fig. 2,for a winter weekday. Since the exergy loss does not vary widely during the day, and thereceiving control system only needs to know relative rather than absolute values, it is plot-ted as a deviation in percentage points from the mean for the day of 64.7%. Because theamount of generation from each fuel type in the merit order is unchanging during the day,it tracks demand exactly.
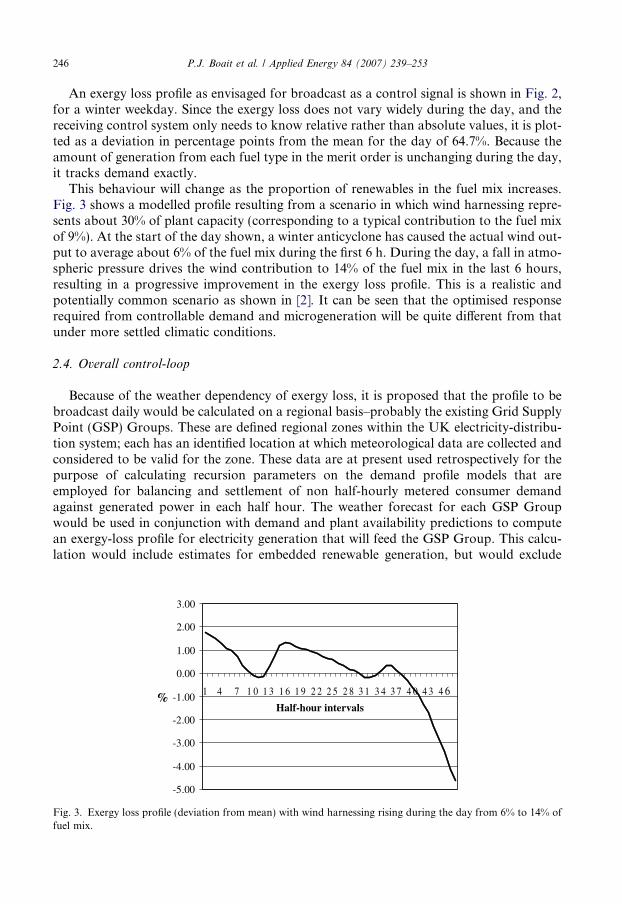
This behaviour will change as the proportion of renewables in the fuel mix increases.Fig. 3 shows a modelled profile resulting from a scenario in which wind harnessing repre-sents about 30% of plant capacity (corresponding to a typical contribution to the fuel mixof 9%). At the start of the day shown, a winter anticyclone has caused the actual wind out-put to average about 6% of the fuel mix during the first 6 h. During the day, a fall in atmo-spheric pressure drives the wind contribution to 14% of the fuel mix in the last 6 hours,resulting in a progressive improvement in the exergy loss profile. This is a realistic andpotentially common scenario as shown in [2]. It can be seen that the optimised responserequired from controllable demand and microgeneration will be quite different from thatunder more settled climatic conditions.
2.4. Overall control-loop
Because of the weather dependency of exergy loss, it is proposed that the profile to bebroadcast daily would be calculated on a regional basis–probably the existing Grid SupplyPoint (GSP) Groups. These are defined regional zones within the UK electricity-distribu-tion system; each has an identified location at which meteorological data are collected andconsidered to be valid for the zone. These data are at present used retrospectively for thepurpose of calculating recursion parameters on the demand profile models that areemployed for balancing and settlement of non half-hourly metered consumer demandagainst generated power in each half hour. The weather forecast for each GSP Groupwould be used in conjunction with demand and plant availability predictions to computean exergy-loss profile for electricity generation that will feed the GSP Group. This calcu-lation would include estimates for embedded renewable generation, but would exclude
-5.00
-4.00
-3.00
-2.00
-1.00
0.00
1.00
2.00
3.00
1 4 7 1 0 1 3 1 6 1 9 2 2 2 5 2 8 3 1 3 4 3 7 4 0 4 3 4 6%Half-hour intervals
Fig. 3. Exergy loss profile (deviation from mean) with wind harnessing rising during the day from 6% to 14% offuel mix.
P.J. Boait et al. / Applied Energy 84 (2007) 239–253 247
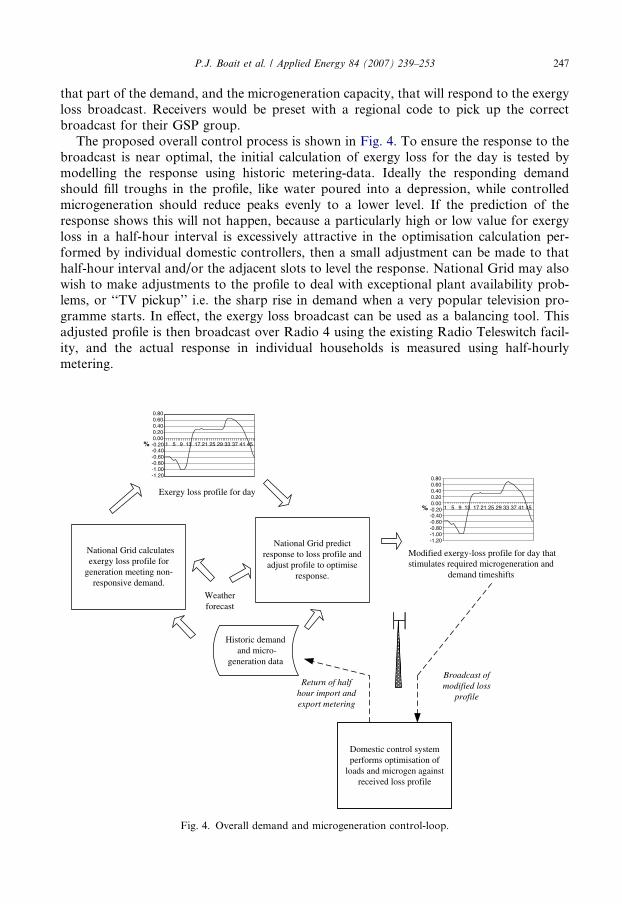
that part of the demand, and the microgeneration capacity, that will respond to the exergyloss broadcast. Receivers would be preset with a regional code to pick up the correctbroadcast for their GSP group.
The proposed overall control process is shown in Fig. 4. To ensure the response to thebroadcast is near optimal, the initial calculation of exergy loss for the day is tested bymodelling the response using historic metering-data. Ideally the responding demandshould fill troughs in the profile, like water poured into a depression, while controlledmicrogeneration should reduce peaks evenly to a lower level. If the prediction of theresponse shows this will not happen, because a particularly high or low value for exergyloss in a half-hour interval is excessively attractive in the optimisation calculation per-formed by individual domestic controllers, then a small adjustment can be made to thathalf-hour interval and/or the adjacent slots to level the response. National Grid may alsowish to make adjustments to the profile to deal with exceptional plant availability prob-lems, or ‘‘TV pickup’’ i.e. the sharp rise in demand when a very popular television pro-gramme starts. In effect, the exergy loss broadcast can be used as a balancing tool. Thisadjusted profile is then broadcast over Radio 4 using the existing Radio Teleswitch facil-ity, and the actual response in individual households is measured using half-hourlymetering.
stimulates required microgeneration anddemand timeshifts
Exergy loss profile for day
Weatherforecast
Domestic control systemperforms optimisation of
loads and microgen againstreceived loss profile
Broadcast ofmodified loss
profile
Return of halfhour import andexport metering
National Grid calculatesexergy loss profile for
generation meeting non-responsive demand.
Historic demandand micro-
generation data
National Grid predictresponse to loss profile andadjust profile to optimise
response.
-1.20-1.00-0.80-0.60-0.40-0.200.000.200.400.600.80
-1.20-1.00-0.80-0.60-0.40-0.200.000.200.400.600.80
1 5 9 13 17 21 25 29 33 37 41 45
1 5 9 13 17 21 25 29 33 37 41 45%
%
Modified exergy-loss profile for day that
Fig. 4. Overall demand and microgeneration control-loop.
248 P.J. Boait et al. / Applied Energy 84 (2007) 239–253
2.5. Control of storage and immersion heaters
A controller for storage heaters provides a suitable example of the functions that haveto be performed in responding to the exergy loss broadcast. The storage heater has to cap-ture sufficient energy to meet the heat load of the house over 24 h, with the least possibleexergy loss. It is assumed that the consumer can set morning and evening time intervals tm
and te during which sufficient heat must be supplied to achieve a room temperature set-point Ts. When the morning heating session starts at half-hour interval a, there must havebeen sufficient heat provided to re-attain the set-point Ts. Then, by the time tm is over athalf-hour interval b, sufficient heat must have been provided to sustain Ts during that per-iod. Equivalent heat budgets exist for the start of the evening heating session at half-hourinterval c, and finish at d. These four heat budget reference-points, expressed as cumulativeenergy inputs, provide the objective function:
Minimise EL ¼X48
i¼1
P iLiti
with the constraints :Xa
i¼1
P iti P ChðT s � T rmÞ
Xb
i¼1
P iti P ChðT s � T rmÞ þ ðT s � T emÞW htm
Xc
i¼1
P iti P ChðT s � T rmÞ þ ðT s � T emÞW htm þ ChðT s � T reÞ
Xd
i¼1
P iti P ChðT s � T rmÞ þ ðT s � T emÞW htm þ ChðT s � T reÞ
þ ðT s � T eeÞW hte
The morning and evening external-temperatures Tem and Tee are broadcast with the exergyloss data. Over time, the controller can calculate the house’s thermal capacity Ch and spec-ificheat loss Lh from its own records of the room temperature Tr making use of the sup-plied external temperature Te. It can also predict the room temperatures at the start ofeach morning and evening heating interval (Trm and Tre) from Te. The controller solvesthe problem formulation using a conventional linear-programming technique, such asthe Simplex method, and draws electrical power Pi over time interval ti during the ithhalf-hour interval to charge the storage heater.
A similar problem formulation can be employed for control of an immersion heater usedto heat domestic hot-water. The consumer sets time intervals when hot water is required, andthe controller brings the water up to temperature prior to the start of each time interval, whileminimising the exergy loss. It is assumed that the water cylinder is well insulated so that, forexample, it can be heated during the overnight demand-trough for use the next morning.
2.6. Despatch of microCHP generation
For despatch of microCHP, an initial assumption has to be made of the maximumamount that the heating temperature set-point can be raised (dTmax) to stimulate output;
P.J. Boait et al. / Applied Energy 84 (2007) 239–253 249
in the modelling described below, this was limited to 1 �C. The set-point can only be use-fully raised when the heat output of the CHP unit is not fully loaded at the default set-point, so the controller has to use the external temperatures provided in the broadcast,combined with the user’s heating time settings, to determine the half-hour intervals whenthere will be spare capacity that could be used. The controller can also calculate what frac-tion dTi of dTmax could actually be used in a given half-hour interval with spare capacity.Having identified half-hour intervals where despatch can occur, the controller then exe-cutes a linear-programming calculation to decide which will avoid the most exergy lossby substituting for large-scale generation. The set-point is then raised incrementally inthe most attractive half-hour intervals, whose total available capacity is equivalent to aset-point uplift not exceeding dTmax. Treating the CHP generator output Pi as a negativedemand gives the problem formulation:
Minimise EL ¼X48
i¼1
�P iLiti
with the constraints : Hiti ¼ dT iCh 61
2ðHi � ðT s � T eiÞW hÞ � ðT s � T riÞCh
for all time-slots i ¼ 1! 48;
P i ¼ge
gh
H i
X48
i¼1
dT i 6 dT max
The factor of 1/2 in the first inequality is simply the half-hour duration of the half-hourinterval, on the assumption that the energy is measured in kWh. The CHP efficiency ratioge/gh provides the electrical power output of the CHP unit for a given heat-output.
3. Evaluation
3.1. Modelling scenarios
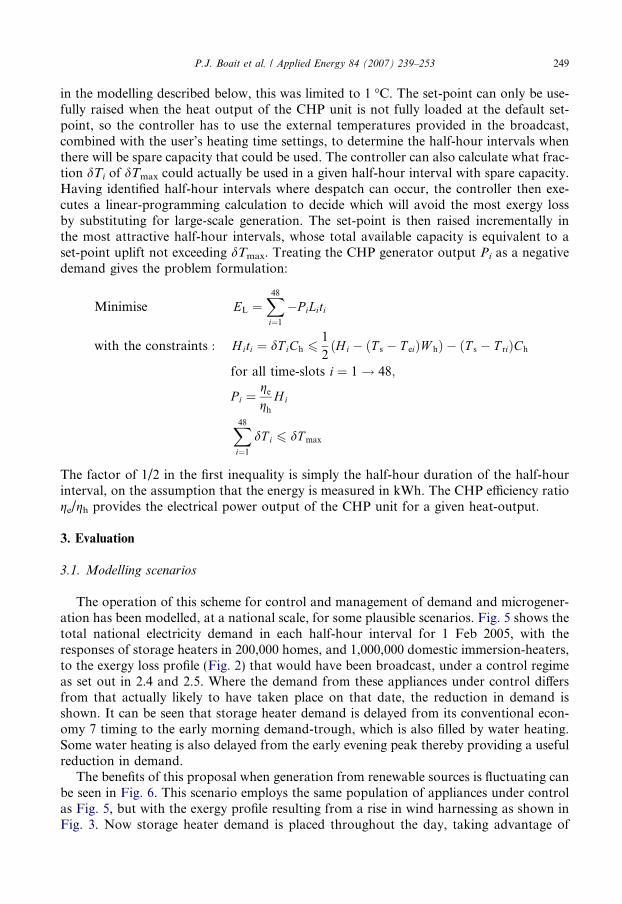
The operation of this scheme for control and management of demand and microgener-ation has been modelled, at a national scale, for some plausible scenarios. Fig. 5 shows thetotal national electricity demand in each half-hour interval for 1 Feb 2005, with theresponses of storage heaters in 200,000 homes, and 1,000,000 domestic immersion-heaters,to the exergy loss profile (Fig. 2) that would have been broadcast, under a control regimeas set out in 2.4 and 2.5. Where the demand from these appliances under control differsfrom that actually likely to have taken place on that date, the reduction in demand isshown. It can be seen that storage heater demand is delayed from its conventional econ-omy 7 timing to the early morning demand-trough, which is also filled by water heating.Some water heating is also delayed from the early evening peak thereby providing a usefulreduction in demand.
The benefits of this proposal when generation from renewable sources is fluctuating canbe seen in Fig. 6. This scenario employs the same population of appliances under controlas Fig. 5, but with the exergy profile resulting from a rise in wind harnessing as shown inFig. 3. Now storage heater demand is placed throughout the day, taking advantage of
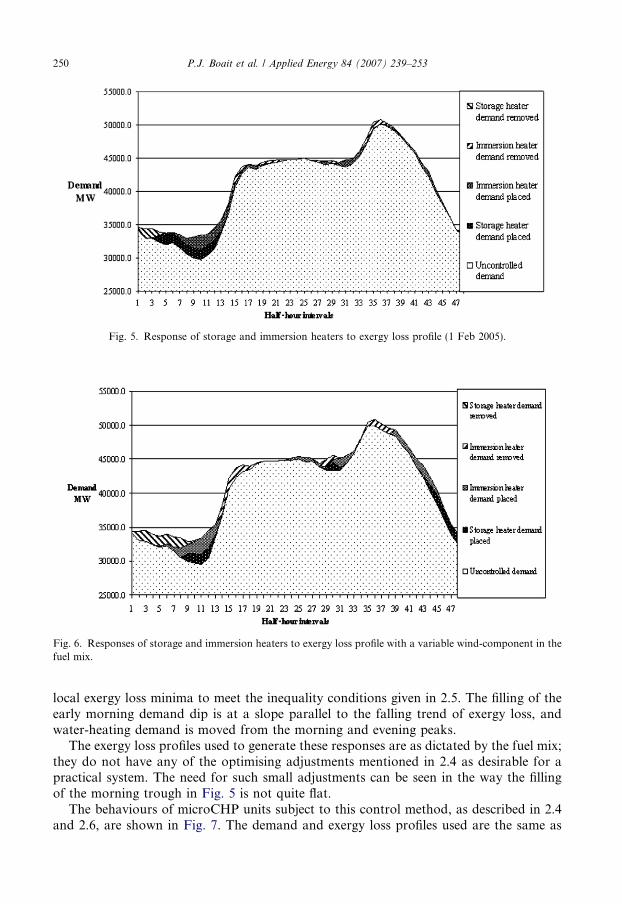
Fig. 5. Response of storage and immersion heaters to exergy loss profile (1 Feb 2005).
Fig. 6. Responses of storage and immersion heaters to exergy loss profile with a variable wind-component in thefuel mix.
250 P.J. Boait et al. / Applied Energy 84 (2007) 239–253
local exergy loss minima to meet the inequality conditions given in 2.5. The filling of theearly morning demand dip is at a slope parallel to the falling trend of exergy loss, andwater-heating demand is moved from the morning and evening peaks.
The exergy loss profiles used to generate these responses are as dictated by the fuel mix;they do not have any of the optimising adjustments mentioned in 2.4 as desirable for apractical system. The need for such small adjustments can be seen in the way the fillingof the morning trough in Fig. 5 is not quite flat.
The behaviours of microCHP units subject to this control method, as described in 2.4and 2.6, are shown in Fig. 7. The demand and exergy loss profiles used are the same as
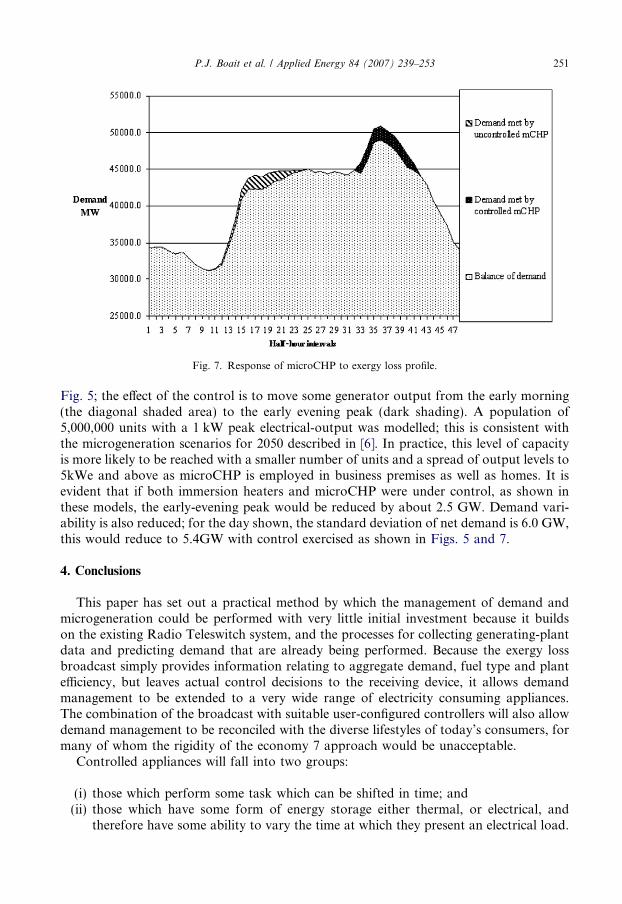
Fig. 7. Response of microCHP to exergy loss profile.
P.J. Boait et al. / Applied Energy 84 (2007) 239–253 251
Fig. 5; the effect of the control is to move some generator output from the early morning(the diagonal shaded area) to the early evening peak (dark shading). A population of5,000,000 units with a 1 kW peak electrical-output was modelled; this is consistent withthe microgeneration scenarios for 2050 described in [6]. In practice, this level of capacityis more likely to be reached with a smaller number of units and a spread of output levels to5kWe and above as microCHP is employed in business premises as well as homes. It isevident that if both immersion heaters and microCHP were under control, as shown inthese models, the early-evening peak would be reduced by about 2.5 GW. Demand vari-ability is also reduced; for the day shown, the standard deviation of net demand is 6.0 GW,this would reduce to 5.4GW with control exercised as shown in Figs. 5 and 7.
4. Conclusions
This paper has set out a practical method by which the management of demand andmicrogeneration could be performed with very little initial investment because it buildson the existing Radio Teleswitch system, and the processes for collecting generating-plantdata and predicting demand that are already being performed. Because the exergy lossbroadcast simply provides information relating to aggregate demand, fuel type and plantefficiency, but leaves actual control decisions to the receiving device, it allows demandmanagement to be extended to a very wide range of electricity consuming appliances.The combination of the broadcast with suitable user-configured controllers will also allowdemand management to be reconciled with the diverse lifestyles of today’s consumers, formany of whom the rigidity of the economy 7 approach would be unacceptable.
Controlled appliances will fall into two groups:
(i) those which perform some task which can be shifted in time; and(ii) those which have some form of energy storage either thermal, or electrical, and
therefore have some ability to vary the time at which they present an electrical load.
252 P.J. Boait et al. / Applied Energy 84 (2007) 239–253
The first group includes domestic appliances, such as washing machines and tumble dri-ers, and many kinds of small industrial and business plant, which cannot justify participa-tion in existing demand management schemes. The second group covers any form ofheating or cooling appliance with some degree of thermal inertia. Heat pumps are an inter-esting case since as the carbon intensity of electricity generation reduces, they becomecompetitive in both cost and carbon intensity terms with the gas boilers that are the dom-inant form of domestic heating in the UK [18]. It will be possible for them to make use ofthis method for optimising their electricity use, using thermal storage in a hot-water tankor in the fabric of the building.
Another potentially large application for this method is the charging of batteries inhybrid vehicles, which combine a small high-efficiency internal combustion engine with bat-tery power. Many investigators consider hybrid vehicles, which can exploit low-carbon gridelectricity to recharge their battery packs when not on the road, to be the most attractivesolution to the problem of reducing carbon emissions from road vehicles [19]. The exergyloss broadcast could be used by a charging controller to ensure that the batteries in a parkedvehicle are only charged at times when it is efficient in carbon intensity and cost terms.
If the level of participation in this scheme was to reach a level where, say, 10% of demandis controlled via the broadcast, then it is clear that it will take more than minor adjustmentsto the broadcast profile to ensure that the aggregate match of generation capacity todemand is optimised. The best method of enabling the broadcast and responding devicesto deal with this problem is the subject of ongoing research, but the emerging concepts are:
(i) use of neural-network filtering techniques to shape the exergy loss curve so that pro-nounced troughs and peaks, which would otherwise attract too much responses aresmoothed;
(ii) additional constraints in the optimisation algorithm that is executed by the receivingcontrollers such that half-hour intervals with equal merit are selected randomly forallocation of demand or microgeneration, with the objective of spreading theresponse so that demand troughs are filled evenly; and
(iii) variable time granularity in the exergy loss broadcast, allowing more precise stimu-lation of managed devices to deal with short-term events such as TV pickup.
Effective large-scale demand management has been a goal pursued intermittently by theUK electricity industry for 30 years; it is now a more pressing priority because of the rap-idly rising proportion of renewables in the fuel mix. These proposals exploit the ability oftoday’s electronic industry to deliver complex but reliable functionality, such as the linearprogramming described above, in a small and convenient unit and at a price that can bejustified by the likely savings to the consumer. Additionally, as these proposals willincrease the value – and hence the penetration – of smart metering, the energy-savingbehaviour encouraged by this supportive technology should become more widespread.
References
[1] Department of Trade and Industry (DTI) UK. The energy challenge – energy review Report 2006 Cm 6887.London: DTI; 2006.
[2] Sinden G. Characteristics of the UK wind resource: long-term patterns and relationship to energy demand.Energy Policy 2005; doi:10.1016/j.enpol.2005.10.003.
P.J. Boait et al. / Applied Energy 84 (2007) 239–253 253
[3] Kema Ltd. A scoping study: demand-side measures on the UK electrical system AEAT Rev1b. London:DTI; 2005.
[4] Hughes L, Sauter R, Watson J. Metering, communication, and control technologies for micro-generation –ESRC sustainable technologies programme Working Paper. Available from: http://www.sussex.ac.uk/spru/profile171813.html.
[5] Department for Environment, Food, and Rural Affairs (DEFRA) UK. The Government’s strategy forcombined heat-and-power to 2010. DEFRA: London; 2004.
[6] Energy Saving Trust. The potential for microgeneration – study and analysis final report. London: DTI;2005.
[7] British Standard Institute (BSI). Radio teleswitches for tariff and load control, BSI 7647. London: BSI; 1993.[8] Hawley R. Advanced control of energy consumption. In: IEE seminar on practical experience with predictive
control conference publication 2000/23. London: IEE; 2000. p. 4/1–4/10.[9] Department for Environment, Food, and Rural Affairs. Cutting energy bills-trial of innovative smart meters
starts, press release 178/2006. DEFRA; 2006.[10] Boait P. Telecommunication architectures and protocols for control and despatch of embedded micro-
generators. In: Proceedings of 5th international conference on power-supply management and control.London: IEE; 2002. p. 329–34.
[11] Boait P, Rylatt M, Stokes M. Optimisation of consumer benefits from microCHP. Energy and Buildings2006;38(8):981–7.
[12] Jardine C. The human angle. Presentation to Electricity Networks Strategy-Group seminar on electricitydemand-side management for small consumers 2006. Available from: http://www.ensg.gov.uk/index.php?article=108.
[13] Hammond G, Stapleton A. Exergy analysis of the UK energy system. Proc Inst Mech Eng, Part A J PowerEnergy 2001;215(A2):141–62.
[14] Electricity Info.org. Fuel mix disclosure data for years 2004–2005. Available from: http://www.electricity-info.org/supplierdataall.php.
[15] Brown M. The problem with carbon. Power UK 2005;138(Aug):2–4.[16] Elexon Ltd. Balancing mechanism reporting – historic out-turn. Available from: http://www.bmreports.com/
bwx_reporting.htm.[17] Bettle R, Pout C, Hitchin E. Interactions between electricity-saving measures and carbon emissions from
power generation in England and Wales. Energy Policy 2005; doi:10.1016/j.enpol.2005.07.014.[18] Cockcroft J, Kelly N. A comparative assessment of future heat-and-power sources for the UK domestic
sector. Energy Conversion and Management 2005; doi:10.1016/j.enconman.2005.11.021.[19] Sanna L, Driving the solution – the plug-in hybrid vehicle, Electric Power Res Ins J; 2005, Fall, p.10–17.