exercises in cartography
TRANSCRIPT

Chapter 2
Exercises in Cartography
Ferjan J. Ormeling
Abstract By describing the scope and intent of contemporary cartographic
exercises, the author pictures the changes that took place in cartography during
the last 50 years in the format of an autobiography. Although these exercises
changed from manual and repetitive ones towards digital and unique tasks, during
this development some freedom of expression was lost, as current GIS-oriented
software packages limit the design options. The author calls for exercises where the
geographical insight of cartography students is strengthened, where they are made
aware of the bandwidths of cartographic license and of the existence of many
different but valid ways of rendering the same realities. Also, through exercises
where they are addressed as map users, trainees may realise the map-use impact of
the graphical decisions taken and the real challenges cartographers face in
visualizing geospatial data for decision support.
2.1 Cartographic Apprentice
When I first started as an apprentice atlas editor, in 1961, I had to learn how to apply
lettering to maps, and I spent many evenings just drawing the letter o. After a week I
graduated to variations of o, such as a, b, d, g, q, c and e or p. Then I moved on to n,
and varied it with h, u andm; the next monthwould be focused on i and l, f, j, t and odd
letters like k, r, s, v, w, y and z. The next step would be to combine these letters and to
get used to the differing distances between them. I did not feel particularly enriched by
these long evenings and I merely wondered whether I had opted for the right
profession. Fortunately, nowadays this lettering is done digitally and cartography
students won’t loose time in doing lettering exercises—at least not on lettering itself,
but they still have to do exercises in the application of geographical names to maps.
F.J. Ormeling (*)
Utrecht University, Utrecht, The Netherlands
e-mail: [email protected]
L. Zentai and J.R. Nunez (eds.), Maps for the Future,Lecture Notes in Geoinformation and Cartography 5,
DOI 10.1007/978-3-642-19522-8_2, # Springer-Verlag Berlin Heidelberg 2012
15

Here they have to apply the theories of Imhof, Bonacker or Spiess to the map, in
order to make sure that there is no ambiguity regarding the symbols a name refers
to, to ensure the shortest possible time to find a name on the map, by using
variations in type styles, sizes, boldness, spacing and colour (Fig. 2.1).
In my cartography classes at the university at the same time I had to be able to
operate geodetical or photogrammetrical equipment, and map contour lines from
pairs of aerial photographs, using both hands and feet. So I had to do mapping
exercises with the equipment. Again, this was not particularly stimulating. As my
main subject was geography we also had to engage in statistical exercises, do sums
in order to compute the number of observations needed to end up with results that
were 99% significant, or compute different kind of averages. The course in statistics
was used as a threshold to keep out those without a head for mathematics although I
never later on perceived any need why such a head was required in geography, nor
in cartography. Fortunately for me, the looming onset of computers had
obliterated—in the mind of the teaching staff—the need to do exercises in the
plotting of map projections, with coordinatographs and the assistance of goniomet-
ric tables. As part of geography we also had to do geomorphology courses, and here
we had to learn to draw all kinds of diagrams, cross sections, block diagrams and
longitudinal sections. As we were interested in visualization we taught ourselves
how to draw panoramic maps, based on topographic maps (Fig. 2.2).
2.2 Cartography Courses
But the real interest in cartographic exercises only started when I had graduated and, as
a member of Utrecht university staff, helped to start up a Master’s programme in
cartography in 1971. Thenwe got to know a French publication calledLa cartographie
Fig. 2.1 Exercise in map lettering from the Basic Cartography Exercise Manual (1991)
16 F.J. Ormeling

thematique commemethode de recherche, by Claval andWieber (1969), which finally
presented some intellectual challenge. It contained statistics on point, linear or areal
data and base maps on which these data had to be visualized. Here at least there also
was an opportunity to apply one’s geographical knowledge, as doing these exercises
frequently called for judgment regarding what was most important from a geographi-
cal point of view. As an example, in Fig. 2.3, I show an assignment to map statistical
data on agriculture for Indonesia, where one has to pick the most important aspect of
the table (based on one’s geographical knowledge of the country) and visualize it.
The textbook by Claval andWieber also showed us that—at least within Europe—
there were different schools of cartographic design, using different mapping
techniques. For instance, in France in the 1970s the areal cartogram method devised
by Aime Perpillou was en vogue. This was a quite elaborate method of showing
different percentages of land use, per enumeration unit, by using coloured bands that
togethermade up 100% (Fig. 2.4). Themethod called for extreme generalization of the
data and the resulting images were not altogether straightforward. This method was
never used inGermany or in theUnitedKingdom. InGermany, isolinemapswere only
used for physical phenomena, and the United Kingdom was an early advocate of
anamorphosis maps, which were rather frowned upon in Germany. And it was only in
Czechoslovakia that a particular time-related diagram type ever occurred.
2.3 ICA’s Basic Cartography Programme
In the 1970s, there was already an ICA project under way to produce a textbook for
cartographers. This endeavourwas supported byUNESCO, and it resulted in theBasicCartography manual series (Anson and Ormeling, 1984-2002), containing three
Fig. 2.2 Producing a panorama from a topographic map
2 Exercises in Cartography 17

manuals (with contributions from France, FRG, GDR, Israel, Japan, the Netherlands,
Nigeria, UK, USA and Sweden) and an exercise book. I travelled all over Europe to
visit cartographic establishments in order to solicit 500 printed copies each of their
best exercises, framed in a uniform ICA template and to put together this exercise
manual, which finally consisted of contributions from, Austria, Belgium, Canada,
France, Germany, Hungary, Israel, Japan, the Netherlands, Sweden and Switzerland.
Fig. 2.3 Exercise on agricultural mapping with statistical data and base map (upper part). For
solution see lower part. From the Basic Cartography Exercise manual (1991)
18 F.J. Ormeling
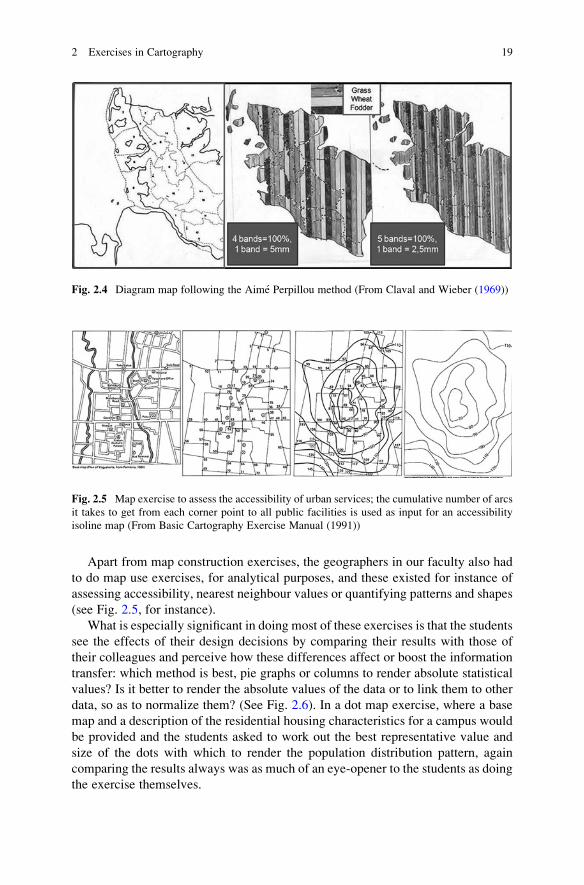
Apart from map construction exercises, the geographers in our faculty also had
to do map use exercises, for analytical purposes, and these existed for instance of
assessing accessibility, nearest neighbour values or quantifying patterns and shapes
(see Fig. 2.5, for instance).
What is especially significant in doing most of these exercises is that the students
see the effects of their design decisions by comparing their results with those of
their colleagues and perceive how these differences affect or boost the information
transfer: which method is best, pie graphs or columns to render absolute statistical
values? Is it better to render the absolute values of the data or to link them to other
data, so as to normalize them? (See Fig. 2.6). In a dot map exercise, where a base
map and a description of the residential housing characteristics for a campus would
be provided and the students asked to work out the best representative value and
size of the dots with which to render the population distribution pattern, again
comparing the results always was as much of an eye-opener to the students as doing
the exercise themselves.
Fig. 2.5 Map exercise to assess the accessibility of urban services; the cumulative number of arcs
it takes to get from each corner point to all public facilities is used as input for an accessibility
isoline map (From Basic Cartography Exercise Manual (1991))
Fig. 2.4 Diagram map following the Aime Perpillou method (From Claval and Wieber (1969))
2 Exercises in Cartography 19

Next to map lettering, the most important exercises before the advent of the
computer surely were those of rendering information according to a standardised
legend, in which all the symbols and their measurements, and the various line widths
were prescribed in a master legend. This part was rather repetitive, tiresome and
disappointing, as the teachers always seemed to be able to discern who had drawn
which map, in spite of us all adhering to the prescribed legend and specifications.
As my country is rather small there seemed not to be enough potential carto-
graphic draughtsmen to start a regular cartography course for, so we opted for a
correspondence course, in which the participants had to do exercises and had to send
them in, and would receive them back within a week, annotated with the comments of
the teachers (PBNA cursus, 1973-1976). On the exercise sheets the planimetry to be
inked in was rendered in blue, and with special drawing pens and India ink the map
detail had to be applied. In my first presentation to an ICA conference, in Moscow, in
1976, I reported on our experience with setting up this correspondence course.
2.4 Meta-exercises
Next to map drawing and map lettering came map generalization, and here it was
again important that one developed a feeling of hierarchy, a feeling of what was
important and should be retained, even if this activity was closely outlined as well,
Fig. 2.6 Unemployment in the Netherlands, left rendered with proportional symbols, and at right
normalized, i.e. expressed as a proportion of the total labour force
20 F.J. Ormeling

so as to render the differences between the results of individual cartographers as
small as possible. Legend-sheets with the exact dimensions of the symbols and lines
to be used served as examples but, even when these specifications were adhered to
as strictly as possible, students still ended up with a wide range of different results.
When we confronted the students with the variation in their results, there was a
meta-effect in this exercise—as the students could see that the results of their
colleagues would deviate to some degree from their own, and this showed them a
bandwidth of cartographic licence, it showed them that different results based on
the same original data still were acceptable to a certain degree (Fig. 2.7).
Another drawing technique that had to be mastered through exercises where
some geographic knowledge came in handy was hill-shading, which we would do
with pencil, but which Swiss and Austrian experts would apply with airbrushes.
Picking the correct colour schemes or colour ramps is another item to do
exercises in, in order to make sure that students see for themselves which colour
combinations work or not, when diverging hues should be opted for, or how a
colour ramp can be extended to accommodate a larger number of classes. Cynthia
Brewer here helps students doing exercises on these items enormously with her
Colorbrewer website (http://colorbrewer2.org).
For myself I have found much profit for the students in an exercise in which they
are asked to render a same phenomenon, using the same figures in as threatening a
way and in as inconspicuous a way, just by manipulating colours and class
boundaries. By doing this exercise they realize the impact of their selection of
class boundaries and colour schemes.
Fig. 2.7 Generalisation exercise (by Prof. E. Spiess, Basic Cartography Exercise manual, 1991)with different results
2 Exercises in Cartography 21
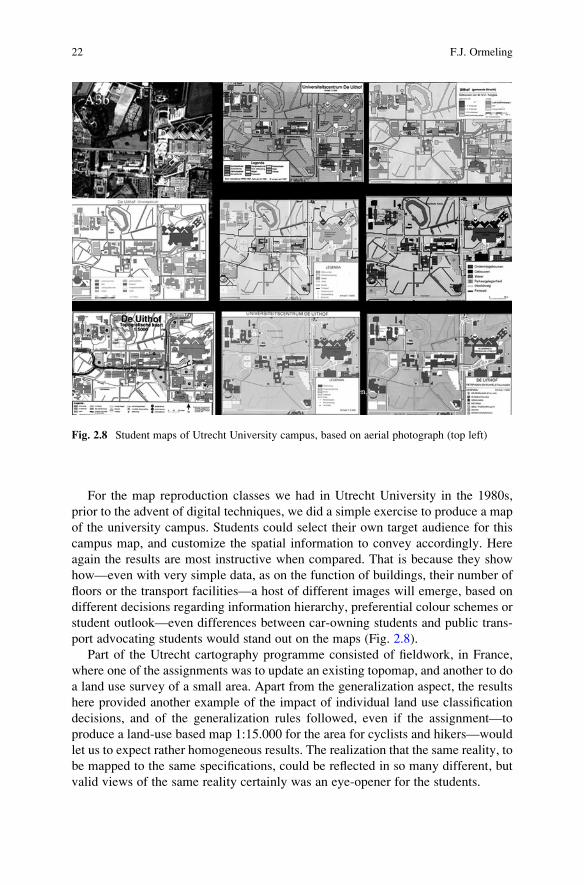
For the map reproduction classes we had in Utrecht University in the 1980s,
prior to the advent of digital techniques, we did a simple exercise to produce a map
of the university campus. Students could select their own target audience for this
campus map, and customize the spatial information to convey accordingly. Here
again the results are most instructive when compared. That is because they show
how—even with very simple data, as on the function of buildings, their number of
floors or the transport facilities—a host of different images will emerge, based on
different decisions regarding information hierarchy, preferential colour schemes or
student outlook—even differences between car-owning students and public trans-
port advocating students would stand out on the maps (Fig. 2.8).
Part of the Utrecht cartography programme consisted of fieldwork, in France,
where one of the assignments was to update an existing topomap, and another to do
a land use survey of a small area. Apart from the generalization aspect, the results
here provided another example of the impact of individual land use classification
decisions, and of the generalization rules followed, even if the assignment—to
produce a land-use based map 1:15.000 for the area for cyclists and hikers—would
let us to expect rather homogeneous results. The realization that the same reality, to
be mapped to the same specifications, could be reflected in so many different, but
valid views of the same reality certainly was an eye-opener for the students.
Fig. 2.8 Student maps of Utrecht University campus, based on aerial photograph (top left)
22 F.J. Ormeling

2.5 Computer Classes
The map drawing exercises that replaced the manual ones took place on the
computer, using specific drawing programmes like Aldus Freehand in the 1990s,
and now perhaps Adobe Illustrator. I suppose every university cartography depart-
ment would train its students with exercises to become familiar with these mapping
packages, learn to deal with the various layers, at least before the advent of GIS
software programmes, when boundary files could just be matched with statistical
data sets, and many students do not get beyond learning how to combine data sets in
EXCEL and deal with shape files in ArcGIS.
Of course the new digital environment also affected reproduction. The repro-
duction exercises contained in the ICA Basic Cartography Exercise manual, like
those on the production of small-scale topographic maps, or of tourist maps no
longer were relevant, and would have to be restructured. The same was valid for the
production diagrams. A fair amount of time used to be spent on exercises on their
compilation; I remember ICA workshops all over Asia where we trained students to
find the least expensive ways of reproducing maps through these exercises that now
had to be reworked, necessitating new sets of symbols for the new digital
techniques required.
2.6 Atlas Production Exercises
Atlas production exercises simulate many aspects of the cartographic profession, as
they would train both the design and the production planning aspects. I reported on
them at the Tokyo ICA conference (1980). In Atlas production classes e.g. lay-out
exercises were done, to establish a template for the individual atlas sheets, and for
finding the best sequence of map subjects. An example here is the exercise how to
structure a school atlas of Turkey, to be printed on both sides of a single printing
sheet, one side in colour and the other in black and white. The sequence had to make
sense and be thought logical; the most important maps would have to be coloured,
but also the chorochromatic maps that would not be legible in black and white. For
all individual atlas maps, preliminary drawings or mock-ups would be made, before
starting with their digital production, in order to be sure all necessary elements
would be incorporated (see Fig. 2.9).
Superior examples of atlas production exercises would be the atlases compiled at
Oxford Brookes University where Roger Anson would take his students to the
continent each year in order to gather the information to visualize in the next term.
Toponymy is another area of atlas cartography where exercises are used in order
to speed up the student’s grasp of the subject matter. We would ask them, for
instance, to do an exercise in script conversion, or to compare geographical names
on a map of Spain from a Spanish school atlas and from a British school atlas, and
then ask them to work out the rules the editor of the British atlas would have
followed in order to adjust the toponyms to his British audience. Production of a
place names index and from a map would teach students how to deal with generic
2 Exercises in Cartography 23

name parts like Rio or Cape in a names index, and what to do with homonyms and
allonyms. First they would have to copy all names from amap, identifying their object
category and location, and then reordering them according to a specific alphabet.
A final aspect of map production would be an annotation exercise: how to
prepare one’s map or atlas in such a way—through adding marginal information—
that an independent librarian would be able to list all the relevant information
(impressum, publisher, author, date and place of publication) for a web bibliogra-
phy or catalogue.
2.7 Map Use Exercises
Interpretation of maps or doing measurements on them is the other half of cartog-
raphy, and although map use exercises are not primarily oriented at cartographers,
they are still very suitable to increase the cartographers’ awareness of how map
users react to their products. Doing these kinds of exercises, they would for instance
find out to which degree different measurement outcomes thought to be relevant by
map users are just a consequence of generalisation.
Some examples ofmap use exercises are e.g. how to prepare a slopemap (where, per
grid cell the difference between the highest and lowest point is assessed first and then
converted in a slope value, assigned to the grid cell centre, and followed by interpolation
to produce an isoline slope map (Warn 1980)), drainage density assessment (here the
length of rivers per km2 grid cell would be computed, and the grid cell data categorized)
or an exercise to interpret landforms from a contour line map (Schulz 1995).
2.8 Map Exercises for the Future
The framework of all these cartographic exercises described here has been different
in scope—there were those meant for in-house training for apprentices, there were
exercises that were part of the training of geographers and exercises meant for
Fig. 2.9 Mock-up for an atlas map exercise, from ‘Ausbildungsleitfaden’ (2000)
24 F.J. Ormeling

cartographic draughtsmen. There were higher education or university cartography
courses that had exercises in a classroom environment, and there were exercises
that formed part of correspondence courses, or of manuals developed by carto-
graphic societies or individual teachers. The Netherlands Cartographic Society used
to invite foreign experts for its courses on specific techniques like map lettering or
hill shading, for the benefit of their members who had to do exercises in order to
master these techniques.
All of these exercises were meant to train, for the participants to practice the
theoretical aspects, to pass on knowledge and experience. The ICA tries to continue
this training work globally with the hands-on courses it has been organizing for
some 30 years, not only through its Commission on Education and Training (CET)
but also through the Commission on Management and Economics of Map Produc-
tion and the Commission on Maps and the Internet, frequently also jointly.
As only a small audience can be reached, however enthusiast these commissions
are, with lecturing teams only within the last 2 years (2009 and 2010) flying in into
Central Asia, Iran, Indonesia or Vietnam, developing web courses are a way to reach
larger audiences, even if interaction and feed-back still present problems. Already an
enormous variety of cartography courses is being offered on the web, and the ICA
Commission on Education and Training under Laszlo Zentai and David Fraser has
selected the best ones and incorporated them on the CET website, a major job that
deserves acknowledgement. The only aspect perhaps lacking in these web courses are
exercises. I think the best and most challenging exercises that we have devised for our
own students should be incorporated onto the CET website next to the current lessons
or lectures that have already been stored there, just as we collected the best paper
exercises in the past for the ICA Basic Cartography Exercise manual.
These best and most challenging exercises should show students how many-sided
and intellectually stimulating cartography is, and they might thus be induced to follow
a career in our discipline. With these exercises we would visualise the challenges of
our profession, to adapt geospatial data to the objectives and the target groups of
information transfer, to support spatial decision making now and in the future.
Annex 1: Overview of Cartographic Exercises
A. Map production exercises
A1. Information analysis
(1a) Establish information/parameter hierarchy
(1b) Establish parameter characteristics
(1c) establish rules for language-dependent toponymy
A2.Exercises in mapping technique
(2a) Map lettering
(2b) Hill shading
(2c) Generalisation
(2d) Drawing panoramic maps/block diagrams
(2e) Line drawing exercises
(continued)
2 Exercises in Cartography 25

References
Anson RE, Ormeling FJ (1984–1996, (1st ed), 1993–2002 (2nd ed)) Basic cartography for students
and technicians, 3 vols. Oxford: Pergamon Press and ICA; Butterworth
Anson RE, Ormeling FJ (1991) Basic cartography for students and technicians. Exercise manual.
Elsevier Applied Science, Oxford
Claval P, Wieber JC (1969) La cartographie thematique comme methode de recherche. Annales
litteraires de l’Universite de Besancon. Les Belles Lettres, Paris
PBNA cursus Cartografisch tekenen (1973–1976) Arnhem: Nederlandse Vereniging voor
Kartografie and Koninklijke
Schulz G (1995) Lexikon zur Bestimmung der Gel€andeformen in Karten, 3rd edn, Berliner
geographische Studien vol 28. Institut f€ur Geographie der Technischen Universit€at Berlin,Berlin
Warn C (1980) The Ordnance Survey map skills book. Nelson, London
Kommission Aus- und Weiterbildung, Deutsche Gesellschaft f€ur Kartographie e.V. (2000, 2004)Ausbildungsleitfaden Kartograph/Kartographin. M€unchen, DGfK
A3. Exercises in design
(3a) Selecting map types
(3b) Classification/characterization
(3c) Classification/manipulation
(3d) Colour ramp/colour scheme exercises
B. Exercises in map reproduction
B1. Devise optimal reproduction method
B2. Construct reproduction diagrams
B3. Devise optimal atlas structure (Turkey)
B4. Prepare (atlas) map annotation to enable proper documentation
B5. Prepare map names index
B6. Produce standard lay-out and specifications
B7. Produce a mock-up of an atlas (sheet)
C. Map use/analysis exercises
C1. Recognise symbology
C2. Assess accessibility
C3. Determine patterns: nearest neighbour
C4. Recognise terrain forms (geomorphology)
C5. Working with grids
C6. Find position, in degrees, minutes and seconds or in decimal degrees
C7. Convert decimal degrees into degrees, minutes and seconds
C8. Establish directions, describe way points
C9. Assess network densities
C10. Assess terrain changes in-between successive map editions
C11. Assess slopes/gradients; describe expected relief on a route
C12. Establish distances and time needed to reach a destination
C13. Compute areas and distances
C14. Establish profiles, visibility analyses
C15. Establish spatial association (Spearman’s rank correlation coefficient)
C16. Compute the map scale
26 F.J. Ormeling

http://www.springer.com/978-3-642-19521-1