executive summary - yale university · report to the president and provost of yale university:...
TRANSCRIPT

1
Executive Summary
Report to the President and Provost of Yale University: Findings and Recommendations on a Carbon-Charge Program at Yale
April 10, 2015
Executive Summary
The Yale Carbon Charge Task Force was asked in August 2014 by Yale President Peter Salovey to determine whether a carbon charge should be introduced at Yale, and if so to provide a blueprint for its design. The Task Force examined alternative plans and consulted with students, faculty, and staff on the campus as well as experts at other institutions. It concludes that the university should introduce a comprehensive program for a carbon charge on CO2 emissions from Yale-operated facilities and operations.
The Task Force bases its recommendations on the following advantageous features of a carbon charge: it will provide appropriate incentives for decision makers to reduce emissions from carbon-intensive activities; it will focus policies on carbon pricing as a superior tool for providing decentralized incentives and thereby engage students, faculty, and staff; and the program will serve the broader purpose of expanding Yale’s role as a pioneer in research, teaching, and policy design to cope with climate change.
We have concluded that the charge should be set at the social cost of emissions, currently estimated by the federal government to be $40 per ton of carbon dioxide. The charge would initially be levied on carbon emissions from energy use, and other carbon-intensive activities would be studied for future inclusion. The Task Force recommends that all facilities operated by the university, including those not part of the central campus, should be included in the footprint for the carbon charge. Additionally, the carbon charge should be used as a shadow price in planning for major capital investments.
The carbon change would be revenue-neutral for the campus as a whole, although not for individual administrative units. Under revenue-neutrality, administrative units would be assessed on their net emissions; these are the excess of their actual emissions over their adjusted historical base emissions. To a first approximation, this means that units whose emissions grow faster than the university average would incur a net charge, while units whose emissions grow slower than the average would receive a rebate. But all units taken together would have zero (or close to zero) net carbon charges.
Because of the innovative nature of the program, it is recommended that the program be phased in within three years. During 2015-16, a sufficient number of administrative units should be included so that full implementation can be tested in a wide range of units, including calculations of actual and base emissions and carbon charges, and billing. The Task Force believes that the carbon-charge program can serve as a model for other institutions considering how to align their social concerns about climate change with their day-to-day operations.

2
Report to the President and Provost of Yale University: Findings and Recommendations
on a Carbon-Charge Program at Yale
by
The Presidential Carbon Charge Task Force1
April 10, 2015 Overview
In August 2014, Yale President Peter Salovey announced the formation of a Presidential Carbon Charge Task Force to examine whether it would be feasible and effective for Yale to institute an internal carbon pricing mechanism as part of its sustainability efforts. The charge to the Task Force was defined by the President as follows:
I have asked the Task Force to determine whether a carbon charge should be introduced at Yale, and if so to provide a blueprint for its design. In considering different plans, the objective is a program that provides incentives for different units to reduce their carbon footprint in a way that is not administratively or economically burdensome. The Task Force will examine programs that have been implemented in other organizations and will consult with experts around the country and with interested individuals across Yale. I have asked the Task Force to report early next year with the hope that it will identify a way for us to move ahead with a pilot program in selected units for the academic year 2015-16.
The Task Force has met since October 2014, and held several smaller interviews and discussions with faculty, students, administrators, and outside experts. On November 3, 2014, the Task Force’s student members organized a public meeting, and we also broadly solicited the Yale community for ideas through a prize competition. In addition, on December 2, 2014, the Task Force organized a full-day meeting with experts from around the country to determine the state of the art for carbon pricing in companies and universities. The Task Force formed four Working Groups to investigate different aspects of the working of a carbon charge. The key question all along was, should Yale introduce a comprehensive internal carbon-charge program as an integral part of its climate-change policies? Our answer is yes. The following sketches the outlines of such a program and provides details on its implementation.
1 Members of the Task Force were William Nordhaus (chair), John Bollier, Robin Canavan, Virginia Chapman, Daniel Esty, Bradford Gentry, Peter Glazer, Sophie Janaskie, Linda Koch Lorimer, Jennifer Milikowsky, Sharon Oster, Mark Pagani, Frances Rosenbluth, Ted Snyder, and Ted Wittenstein. The Task Force would like to acknowledge the valuable advice and assistance of many members of the Yale community, as well as participants in the experts’ meeting of December 2, 2014.

3
Nature and purpose of a carbon charge
We begin with the nature and purpose of the carbon-charge program. A carbon charge is an internal fee on activities that reflects their associated carbon-dioxide (CO2) emissions. It would be levied on carbon-intensive activities proportional to their emissions.
A key feature of a charge is to provide appropriate incentives for decision makers
around the campus to reduce emissions from carbon-intensive activities. For example, keeping a facility such as a dormitory or hockey rink open for longer periods would incur higher net carbon charges, while using those facilities more intensively when open would have minimal energy and emissions impacts.
Additionally, the carbon-charge program is designed to ensure that the university's policies regarding climate change as well as its energy use are the concerns of more people and entities around the campus. This contrasts with the reach of Yale’s quantitative emissions targets, which are the concerns of central units such as facilities or the sustainability office, but are currently not the focus of most units across the university.
More broadly, introducing a carbon-charge program will point the way to
implementing what many think is the key to successful emissions-reductions programs – putting a price on carbon and other greenhouse gases. When carbon emissions are priced, individuals and firms will have incentives to reduce consumption of carbon-intensive products and shift their spending to low- or zero-carbon goods and services. The appeal of carbon prices is that they apply universally, in a decentralized and market-based fashion, whereas regulations apply selectively to a limited number of sectors.
The Task Force is mindful that the carbon-charge program must fit into the broader
goals and priorities of the Yale community. Energy expenditures are a small part of the university budget, and most academic units focus primarily on teaching, research, and clinical activities. The carbon-charge program is designed to tilt the university’s spending and activities in a low-carbon direction, demonstrate the importance of carbon pricing, promote innovative programs and strategies within the Yale community, and show how carbon pricing would work in practice.
The carbon-charge program would expand Yale’s role as a pioneer in research,
teaching, and designing practical applications of energy and climate policies. It would thereby contribute to society’s learning about ways to slow climate change while advancing Yale’s educational mission.
Major recommendations for the carbon-charge program The Task Force recommends that Yale introduce a carbon charge in 2015-16. It should be phased in within three years, as described in the last section of this report.
The carbon charge should be set at the social cost of carbon, which is the estimated social damage caused by a ton of CO2 emissions. The university should adopt the social cost
4
estimated by the federal government and currently used in federal rulemaking, which is $40 per metric ton of CO2 for 2015, rising at 3% per year plus inflation.2
There would be a uniform per-ton charge for carbon emissions across the campus. Initially the carbon charge would be applied to energy use (scopes 1 and 2 emissions).3 These emissions are associated with electricity, steam, and chilled water used by units, whether purchased or internally produced, as well as those associated with fuel combustion from vehicles owned and managed by the university. The university currently generates and distributes electricity, steam, and chilled water from its three power plants (Central, Sterling, and West), and, additionally, some units buy energy directly from local utility providers. Energy use is generally measured by building, and adding the carbon emissions factors is a straightforward adjustment. However, energy use and emissions by administrative unit have not yet been determined. Dividing the university’s 365 buildings and corresponding energy use into Yale’s administrative units is an important priority of the carbon-charge program.
Scope 3 emissions are also an important potential area for introduction of the
carbon change. These are defined as other indirect emissions, such as transport-related activities in vehicles not owned, air travel, and waste disposal. The Task Force proposes a feasibility study with the goal of applying the charge to what it calls scope 3A, which are the scope 3 activities controlled by the university. The activities that have been identified for further study and potential inclusion by the Working Group (see the attached report) are air travel and construction. Developing comprehensive information on these activities as well as their associated emissions should be another key priority of the carbon-charge program. Additional scope 3A activities (such as rental cars or use of cement) should also be examined. The Task Force recognizes that inclusion of Scope 3A activities raises additional complications, such as how to treat those activities which include overhead charges, and may be of heightened concern to those affected. Scope 3A requires the same level of careful scrutiny and analysis that the Task Force has brought to the analysis of scopes 1 and 2.
A rough estimate is that total university scopes 1 and 2 emissions are currently about 300,000 metric tons of CO2 per year. Current emissions estimates are not complete because they include certain energy exports, such as to Yale-New Haven Hospital, and exclude several areas of the campus, such as the West Campus and off-campus buildings. At this emissions rate, total carbon-charge revenues would be approximately $12 million per year for the university.
2 The methodology was developed by a federal interagency working group on the basis of three economic models. The social cost estimates have been used over the last decade in federal regulations involving hundreds of billions in costs. (See http://www.whitehouse.gov/sites/default/files/omb/assets/ inforeg/technical-update-social-cost-of-carbon-for-regulator-impact-analysis.pdf.) 3 A widely used set of categories for emissions divides them into scopes 1, 2, and 3. Definitions and references are provided in the Working Group report in the appendix.

5
The definition of coverage (carbon footprint) for the purposes of the carbon charge is determined by whether the university entity pays utility bills, either directly or in a bundled fashion, and has adequate operational control to determine energy use. In practice, coverage would include all facilities controlled by the university – central, Medical, and West Campus entities as well as remote athletic facilities and associated residential, laboratory, and clinical facilities. When completely phased in, the charge would be levied on all units without exemptions or exceptions, as is the case for energy charges now. There is some uncertainty about whether some units proposed to be included (such as remote residential units or clinical medical buildings) have adequate energy measurements at the present time. An important component of the carbon-charge program is that metering would need to encompass all buildings covered by the program. Moreover, metering would need to be designed to provide reliable estimates of energy use by administrative units.
The carbon charge also should be used when making university capital investment decisions. It would be included as a “shadow price” in making choices about alternative capital investments (especially energy-efficiency options) and in estimating life-cycle costs. Incorporating the carbon charge into the capital investment and construction process will shift investments to be more energy- and carbon-efficient. Shadow pricing for carbon in capital investments has been used both at Yale and elsewhere and is an important component of the proposed program. The Facilities Office believes that it is not technically difficult or administratively burdensome to incorporate a carbon shadow price into the financial models that are currently used for capital investment decisions.
This charge would serve as a cap as well as a floor. It provides a floor in ensuring that the social costs of carbon emissions are included in decisions. But it is also useful to use the carbon price as a cap so that the university does not undertake investments that incur excessive costs to reduce emissions. For example, putting triple-glazed windows in a structure that is only lightly used in the summer might reduce emissions at a cost of $500 per ton (and accomplish nothing else). This investment would be ruled out by a $40 carbon-charge cap.
A critical issue to explore further is how to ensure that the carbon charge be used in
the selection of equipment (such as used in laboratories or computer clusters) as well as in facilities. We have not identified an office around the campus that is systematically concerned with the energy use of equipment. It might be useful to designate an office, perhaps the Office of Procurement, as the unit responsible for monitoring long-term energy and emissions associated with major equipment purchases. Methods should be developed to provide appropriate incentives for energy- and emissions-efficiency for major equipment. For example, to the extent that those who purchase equipment do not pay the associated energy bills and carbon charges, there could be a requirement to pre-purchase energy upfront. Much like the questions involving scope 3A activities such as air travel, the recommendations for major equipment purchases require careful scrutiny and analysis to ensure that an effective program can be implemented.

6
Adjustment for external carbon prices Yale’s carbon prices should be adjusted when purchased goods or services contain
carbon charges. An example is that purchased electricity contains an embedded carbon price because it is part of the Regional Greenhouse Gas Initiative.4 For example, the December 2014 auction price for CO2 was $5. This means that the carbon charge associated with purchased electricity for that period would be $40 minus $5.
The adjustment would exclude de minimis embedded carbon costs. For example,
about half of output produced in the European Union is covered by the EU Emissions Trading Scheme, which has a current price of $8.5 per ton of CO2. It would seem too burdensome to make an adjustment for EU-produced goods at current EU carbon prices.
One important aspect of this adjustment is that it would lead to automatic phase out
of the Yale carbon-charge program if and when comprehensive carbon pricing is adopted. Use of revenues
The Task Force recommends that the program be revenue-neutral (or
approximately so). By this term, we mean that the sum of all carbon charges to all units should be zero, and the net revenues of the center should also be zero. Additionally, there should be no assessments, administrative fees, haircuts, or other overhead costs associated with the charges.
While the program is revenue-neutral for all units taken together, it will not be
neutral for each unit. If a unit experiences extraordinary growth in emissions, say because of adding energy-intensive space or equipment, then it will pay a net charge. If the unit undertakes strenuous energy-efficiency measures, it will receive a rebate. But taken all together, the sum of the net charges and rebates will be approximately zero.
The following will illustrate the concept of revenue-neutrality. In each year, each
administrative unit (schools, collections, officer units, and so forth) will have an adjusted base level of emissions. This is set in a manner described below but is generally based on the unit’s historical emissions. Suppose that in a particular year (perhaps 2016) unit A has an adjusted base of 1000 tons, while unit B has an adjusted base of 2000 tons. In that year, suppose that unit A has actual emissions of 1100 tons, while unit B has actual emissions of 1900 tons.
Unit A has an excess over its base of 100 tons, and would pay $40 x 100 = $4000 in
net carbon charges. (Alternatively, this could be seen as a charge of $40 x 1100 = $44,000 minus a rebate on its base emissions of $40 x 1000 = $40,000.) Unit B has a savings over its
4 The Regional Greenhouse Gas Initiative (RGGI) is a regional market-based regulatory program in the United States to reduce greenhouse gas emissions. Participants include the states of Connecticut, Delaware, Maine, Maryland, Massachusetts, New Hampshire, New York, Rhode Island, and Vermont. See http://www.rggi.org/design/overview for an explanation.

7
base of 100 tons, and would get a rebate of $40 x 100 = $4000 in net carbon charges. (Alternatively, this could be seen as a charge of $40 x 1900 = $76,000 minus a base rebate of $40 x 2000 = $80,000.)
In this example, we have assumed that the total adjusted base emissions for all units
(1000 + 2000 tons) are equal to total actual emissions (1100 + 1900 tons). The program is exactly revenue-neutral. If the adjusted base total for all units differs from the actual total for all units, there will be a surplus or deficit of the program. For example, suppose that the adjusted base emissions are as given above, but actual emissions are above the adjusted base – say that actual emissions of unit A are 1200 tons, while unit B has actual emissions of 1900 tons. In this case, net carbon charges for all units are $40 x (3100 – 3000) = $4000.
A key point of revenue-neutrality is that there are (almost) no income effects on
units, but units have full incentives to reduce their emissions. In the examples above, with a given adjusted base, if a unit reduces its emissions 10 tons, it gets the full benefit of $40 x 10 tons.
Adjustment of the base emissions for units Under the carbon-charge program, the carbon charge each year would apply to the
difference between the actual and the adjusted base emissions of each administrative unit. This would require both an initial or historical base emissions for each unit, and an adjustment to determine the adjusted base emissions for each subsequent year. The base emissions for each administrative unit would be set at the average emissions for the past three years, that is, for the period 2012-2014. This base would be rolled forward by an adjustment factor. The adjustment factor might be the same for each unit, or it might differ according to programmatic or other differences among units. We provide below a numerical example of how the charge would be calculated.
There are different possible methods for calculating the adjustment factor. The
following are possibilities that have been identified, but further analysis is required, and the Task Force has not determined which should be used.
A. Adjust by Yale average. The initial base emissions for each unit would be its annual emissions averaged over the three years, FY 2012-14 period. This base would be adjusted each year by the total emissions of the university. Note that each unit would have the same adjustment factor. Thus if total Yale emissions covered by the program in 2016 decline 5% relative to the 2012-14 period, each unit's base would be reduced 5% relative to its 2012-14 base. The advantage of this approach is that it would have a zero budget impact for the center and for all units taken together. The example in the last section was based on this approach. B. Adjust by a fixed percentage. In this approach, the university would select a uniform adjustment for each year. For example, the adjustment might be 2% per year. The example described in method A would be the same except that the

8
adjustment would be 2% per year instead of the 5%. As with method A, each unit would have the same adjustment factor. One advantage of this approach is its simplicity and predictability. On the other hand, a concern is that it would produce net revenues or losses for the center and for the totality of units. It might be proposed that the adjustment rate be very ambitious to reflect goals for sharp emissions reductions. This would produce substantial dollar deficits for entities around the campus (and corresponding surpluses for the center) while having no effect on incentives on the margin. For either of the two adjustment approaches, there might also be adjustments for
factors that cause individual variation. The simulations described below and the data on individual buildings in the Appendix indicate that there is considerable idiosyncratic year-to-year change in energy use by building. For example, a building that has a large residential component might be sensitive to the weather. Teaching laboratories might be sensitive to enrollments and course designs. Research laboratories might have energy use depend upon the nature of the experiments, changes in equipment, or the animal populations. It will be useful to determine whether normalization for weather (using heating and cooling degree days) would smooth out some of the year-to-year fluctuations in energy consumption. Additionally, a unit’s emissions might increase if it adds space.
The Task Force has considered the issue of whether to adjust for program-specific
factors and believes that it needs further analysis. The advantage of making adjustments is that it would give the carbon-charge program greater apparent equity. A disadvantage is the complexity of determining the importance of different factors in a manner that is statistically reliable and perceived as fair. Yet a further question is whether units should take into account the emissions impacts when they consider adding major new facilities and equipment, or whether programmatic expansion along with the implication for emissions should be more a central decision.
Illustration of calculations and adjustments The following will provide a numerical example of how the carbon charge is
calculated and show what is meant by revenue-neutrality. For this example, we will use procedure A above (adjusting by the Yale average). Procedure B is identical except that the adjusted bases will differ slightly, and the program will not be revenue-neutral at the university level.
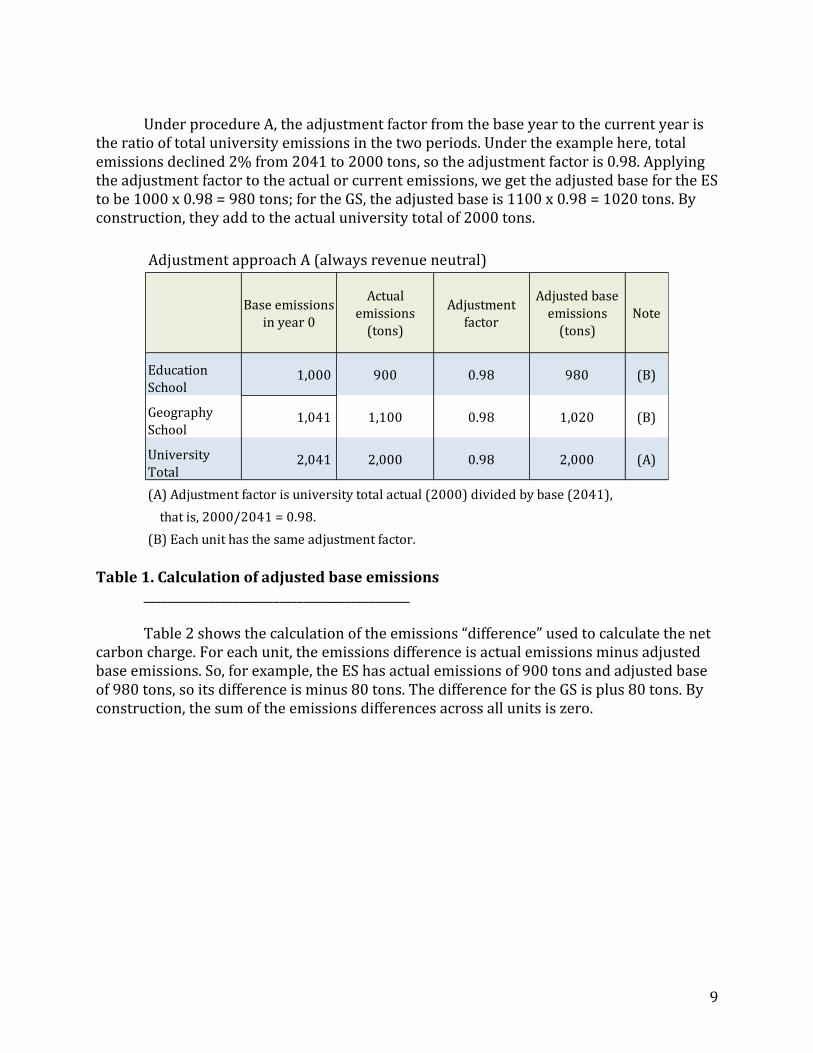
Table 1 shows how the base and adjusted base emissions are determined. We
assume there are two units, the Education School (ES) and the Geography School (GS). In the base year (year 0), assume their emissions are 1000 and 1041 tons of carbon dioxide, respectively. These are the “base emissions” of the schools, while the total base emissions for the university are the sum, 2041 tons.
In the current year, actual emissions are 900 and 1100 tons, and total Yale
emissions are 2000 tons. Perhaps the ES reduced its emissions because it turned off the lights at night, while the GS added a computer cluster.
9
Under procedure A, the adjustment factor from the base year to the current year is
the ratio of total university emissions in the two periods. Under the example here, total emissions declined 2% from 2041 to 2000 tons, so the adjustment factor is 0.98. Applying the adjustment factor to the actual or current emissions, we get the adjusted base for the ES to be 1000 x 0.98 = 980 tons; for the GS, the adjusted base is 1100 x 0.98 = 1020 tons. By construction, they add to the actual university total of 2000 tons.
Table 1. Calculation of adjusted base emissions _____________________________________________ Table 2 shows the calculation of the emissions “difference” used to calculate the net
carbon charge. For each unit, the emissions difference is actual emissions minus adjusted base emissions. So, for example, the ES has actual emissions of 900 tons and adjusted base of 980 tons, so its difference is minus 80 tons. The difference for the GS is plus 80 tons. By construction, the sum of the emissions differences across all units is zero.
Adjustment approach A (always revenue neutral)
Base emissions in year 0
Actual emissions
(tons)
Adjustment factor
Adjusted base emissions
(tons)Note
Education School
1,000 900 0.98 980 (B)
Geography
School 1,041 1,100 0.98 1,020 (B)
University Total
2,041 2,000 0.98 2,000 (A)
(A) Adjustment factor is university total actual (2000) divided by base (2041),
that is, 2000/2041 = 0.98.
(B) Each unit has the same adjustment factor.

10
Table 2. Calculation of the emissions difference for the carbon charge
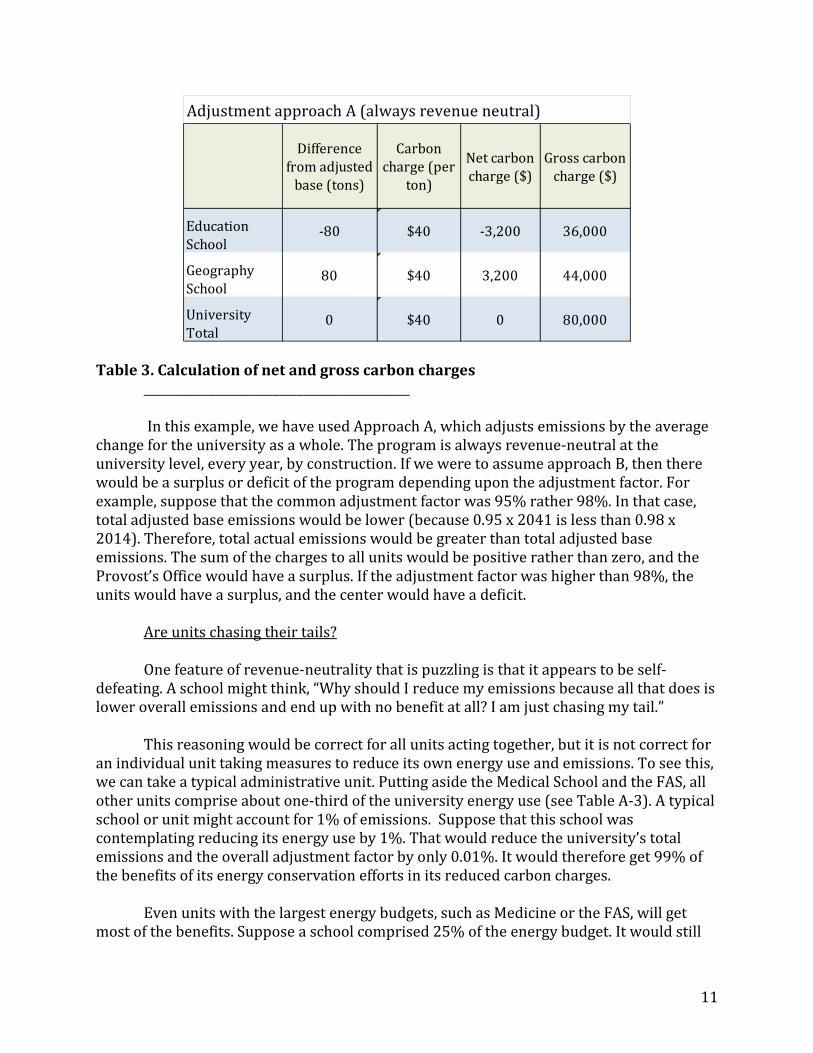
_____________________________________________ Finally, Table 3 shows the calculation of the net carbon charge. For each unit, we
take the difference in emissions (actual minus adjusted base emissions) and multiply that by the carbon charge ($40 per ton of CO2). For the ES, the net charge is minus 80 tons times $40, or a rebate of $3200. For the GS, the net charge is plus 80 tons times $40, or a charge of $3200. Again, by construction, the total of all units is zero (and the total net revenue of the Provost’s Office is also zero). However, individual units will have positive or negative net charges.
Table 3 also shows the gross carbon charges by units. The total or gross charges
(total emissions times $40) are $80,000. However, by construction the total is rebated, and that is why the net charges total to zero.
Adjustment approach A (always revenue neutral)
Actual emissions
(tons)
Adjusted base emissions
(tons)
Difference from adjusted
base (tons)
Education
School900 980 -80
Geography School
1,100 1,020 80
University
Total2,000 2,000 0
11
Table 3. Calculation of net and gross carbon charges
_____________________________________________ In this example, we have used Approach A, which adjusts emissions by the average
change for the university as a whole. The program is always revenue-neutral at the university level, every year, by construction. If we were to assume approach B, then there would be a surplus or deficit of the program depending upon the adjustment factor. For example, suppose that the common adjustment factor was 95% rather 98%. In that case, total adjusted base emissions would be lower (because 0.95 x 2041 is less than 0.98 x 2014). Therefore, total actual emissions would be greater than total adjusted base emissions. The sum of the charges to all units would be positive rather than zero, and the Provost’s Office would have a surplus. If the adjustment factor was higher than 98%, the units would have a surplus, and the center would have a deficit.
Are units chasing their tails? One feature of revenue-neutrality that is puzzling is that it appears to be self-
defeating. A school might think, “Why should I reduce my emissions because all that does is lower overall emissions and end up with no benefit at all? I am just chasing my tail.”
This reasoning would be correct for all units acting together, but it is not correct for
an individual unit taking measures to reduce its own energy use and emissions. To see this, we can take a typical administrative unit. Putting aside the Medical School and the FAS, all other units comprise about one-third of the university energy use (see Table A-3). A typical school or unit might account for 1% of emissions. Suppose that this school was contemplating reducing its energy use by 1%. That would reduce the university’s total emissions and the overall adjustment factor by only 0.01%. It would therefore get 99% of the benefits of its energy conservation efforts in its reduced carbon charges.
Even units with the largest energy budgets, such as Medicine or the FAS, will get
most of the benefits. Suppose a school comprised 25% of the energy budget. It would still
Adjustment approach A (always revenue neutral)
Difference from adjusted
base (tons)
Carbon charge (per
ton)
Net carbon
charge ($)
Gross carbon
charge ($)
Education
School-80 $40 -3,200 36,000
Geography School
80 $40 3,200 44,000
University
Total0 $40 0 80,000

12
get 75% of the benefits in reduced net carbon charges. Therefore, virtually all units will get virtually all the carbon-charge benefits of their individual energy-conservation efforts.
Application to different administrative units
Energy use around the campus is highly diverse, representing not only the different
activities but differences in how buildings and activities are metered. Additionally budget concepts and definitions may determine how energy charges enter the accounts. Tables A-1 through A-3 in the Data Appendix show actual expense budgets and energy budgets by administrative units sorted by different variables. Some units have no utility charges in the current budget format.
In considering the carbon charge, the Task Force found it useful to divide entities
into three categories.
(a) Self-support units that currently pay their energy bills. These include six self-support schools and a few autonomous entities.
(b) Units with substantial budgets and bottom-line guidance; these units
usually do not currently pay their energy bills. These include the balance of schools, the collections, the main library, athletics, and the officer units. Although these units do not pay their own bills, they are attentive to their budgets and can serve as model units to pilot the program.
(c) Units that are either small, have budget authority that covers only a small
fraction of their activities, or units that are co-located with other units which makes estimating energy use and carbon charges difficult. The (c) units include small departments and the residential colleges.
We have not made a full catalogue of units and energy measurements to determine a
definitive list of which units are in which categories. Moreover, we note that the Faculty of Arts and Sciences (FAS) is undergoing a restructuring of its budget in light of the creation of a Dean of the FAS. Given the size of the FAS, it is clearly important to introduce the carbon-charge program both in its overall planning and for large units. However, until the final structure of the FAS budget is determined, it will not be possible to determine exactly into which category the FAS carbon-charge program will fall.
One of the major challenges in making the carbon-charge program effective is that
few administrative units face the cost consequences of their energy decisions. For example, no department in the medical school pays its energy bills even though they are otherwise largely self-financing. A rough estimate is that about 90 percent of energy spending in the university is by units that do not pay their energy bills.
The Task Force considered the approach of decentralizing energy budgets for units
that currently do not pay them; this would apply to category (b) units as well as to medical departments and centers. This kind of budget reform clearly would improve incentives
13
because energy budgets are an order of magnitude larger than carbon charges. However, budget reform involves complex calculations and offsets and is not easily undertaken, particularly in a short period. Putting energy costs on units would raise the potential of requiring programmatic cuts if energy-price movements are adverse. Additionally, the carbon-charge program seems an inappropriate lever to use to impose budget reforms. In any case, budget reforms on a large-scale basis are unrealistic in the next year or two.
On the other hand, making units responsible for their carbon charges is a more
realistic approach. Carbon charges for most units will be a small part of the budget, and they do not involve price risks. Therefore, for most units that have budget responsibility, the Task Force recommends that they take responsibility for their carbon charges.
More specifically, we propose that the carbon charges be fully allocated to and paid
for by units in categories (a) and (b). These units either currently pay their energy bills, or are sufficiently large and diversified that the net carbon charges as described below can be absorbed with little risk of programmatic distortions.
For units with minimal budgets, we propose using experiments as described below. Carbon charges for units that are allocated carbon charges For units that are allocated their carbon charges in categories (a) and (b) defined
above, the net carbon charge would be 100% paid or rebated each year. Therefore, if a unit's emissions change at the same rate as its adjusted base, it will have no net charge. If its emissions grow (or decline) relative to its adjusted base, it will pay (or receive) an amount equal to the charge times the difference in emissions relative to its base.
Carbon charges for other units
For units that are in category (c), such as residential colleges and FAS departments,
there are several options. The Task Force does not have a firm recommendation among these.
One option would be to test various information and incentive programs through
experiments with similar units and control groups. The Task Force recommends exploring options raised by behavioral studies that suggest the value of clear communication of energy bills, easily viewable meters in facilities like dining halls, and competitions and other rewards programs. For example, the residential colleges might be put into three groups with one control group and two different experimental treatments. Similar experiments might be undertaken for FAS departments, medical departments, and other administrative units.
A second option would be a bonus plan for extraordinary reductions. If the
emissions of a unit are larger than their adjusted base, units will have no budget impact. However, if their emissions are less than their adjusted base (or the adjusted base less some threshold such as 5%), they will receive a budget bonus of 50% of the dollar value of

14
their normal rebate. As an example, assume that Unit B (which does not pay its energy bills) has adjusted base emissions of 5,000 tons, while its actual emissions are 4,000 tons. Then it would receive a rebate of (5,000 – 4,000) x $40 x 50% = $20,000 in that year. On the other hand, if its emissions were greater than 5,000 tons, there would be no budget consequences. The budget consequences of the bonus plan would need to be evaluated.
The Task Force emphasizes that, where possible, and particularly where several units are involved, new approaches and experiments should use randomized assignment. Even though the sample sizes will necessarily be small, randomization may allow inference as to the effectiveness of the experimental programs. The Task Force is mindful that individuals often resist being subject to randomization, but the interest of gathering reliable information is particularly important for the experiments suggested here.
An important component of the program will be improved information for
administrative units so that they can better understand their energy consumption and emissions and find ways to reduce these in ways that are consistent with their academic missions. Some of the approaches are described in the report of the Working Group on Incentives in the appendix.
Historical simulation of carbon charges To simulate how a carbon-charge program would work, the Task Force used
historical data for the period 2010-2014 to calculate the size and variability of a carbon charge. We used 34 buildings as test units. The actual data are shown in Appendix Table A-4. These comprised about 25% of the university’s energy use.
The calculations showed considerable idiosyncratic variation in emissions from year
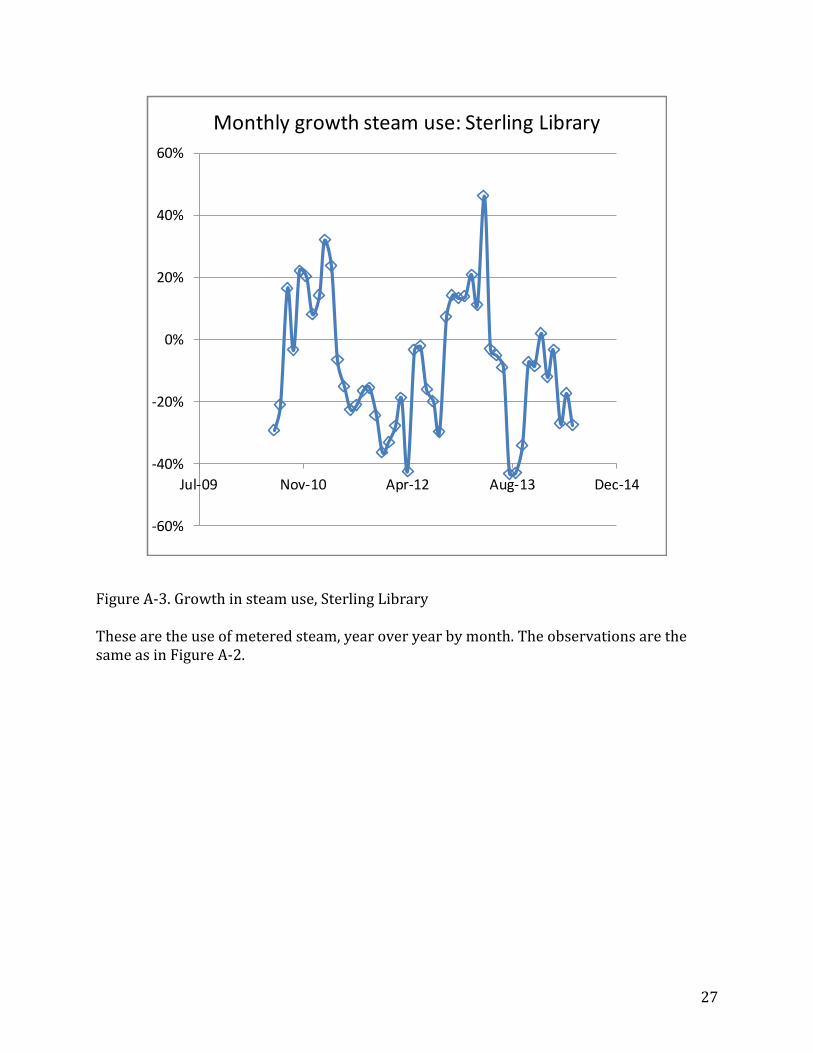
to year. For example, the average absolute change for the five years and 34 buildings from one year to the next was 15% of energy use. Appendix Figure A-1 shows a histogram of the year-to-year rates of growth in emissions for the 34 buildings. To move to a more granular level, Figure A-2 shows the year-over-year growth in monthly electricity use in Sterling Law (not in the 34 buildings), which again shows surprisingly high variability. Figure A-3 shows the steam use in Sterling Memorial Library (also not in the 34), with a sharp declining pattern. Figure A-4 selects electricity use in three residential colleges (detrended and adjusted for seasonal variation); these provide some similarity in structure and have considerable differential patterns. The striking feature of the aggregate and granular data is the variability across different buildings. While some of the differences probably can be explained (such as by weather), some differences reflect changes in measurements or special events such as weddings or summer programs.
To test the operation of the carbon charge, we selected the average of 2010-2011 as
the base period. We then calculated the adjusted emissions and net carbon charges for the three years 2012, 2013, and 2014 for estimated emissions for each of the 34 units. We then calculated the net carbon charges that each of the test units would pay for the three years, 2012-2014. For these calculations, we adjusted the base by the total emissions of the 34

15
test units. The total carbon charges averaged $2.1 million per year for the three years. Net carbon charges by design were zero.
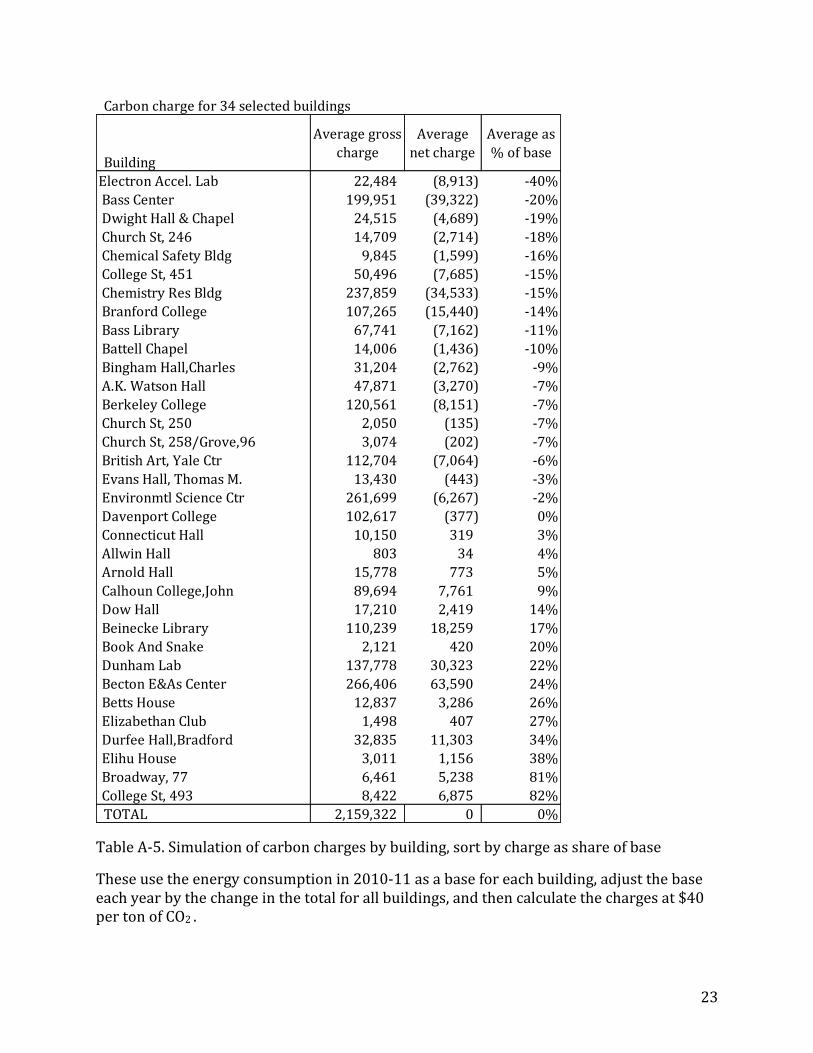
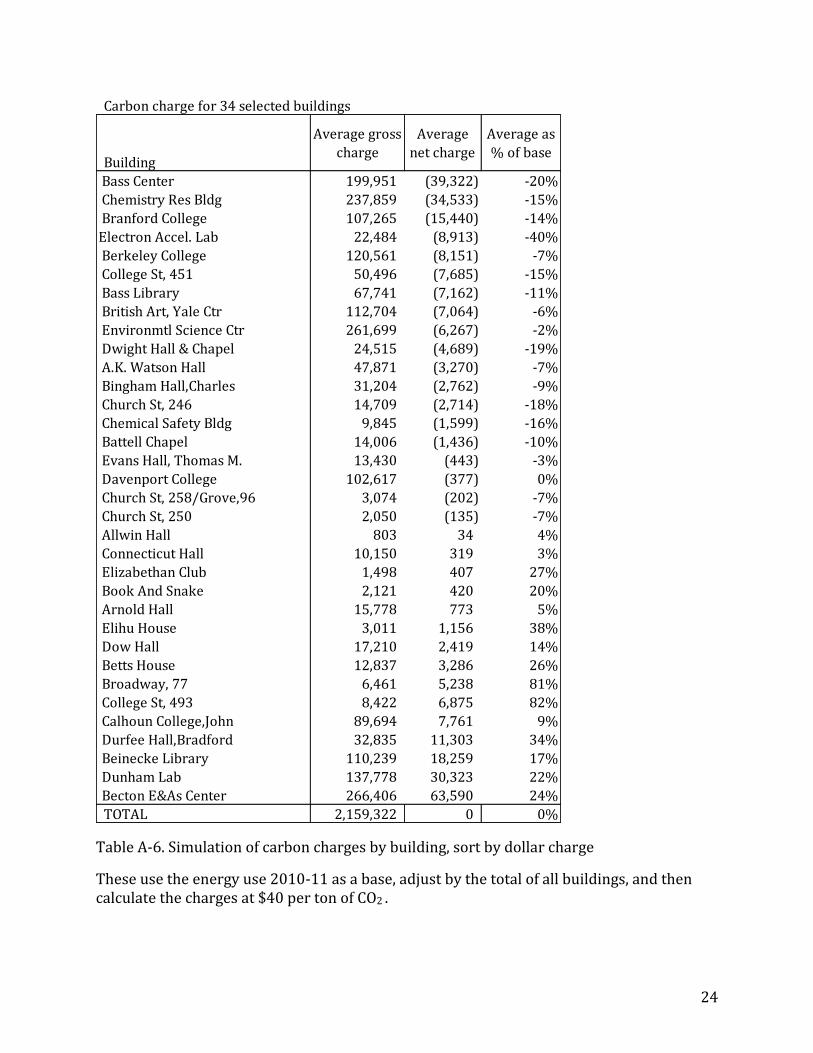
Appendix Tables A-5 and A-6 show the largest and smallest net carbon charges for
the 34 units. Looking at individual units, the net carbon charges for these years had a maximum of $64,000 for Becton Center and a maximum rebate of $39,000 for Bass Center. While illustrative, these calculations suggest that the carbon charges would be large enough to get the attention of management while not so large as to pose major difficulties for academic programs. It should be noted as well that these data have not been validated and are just used for illustrative purposes.
Communication of energy information and options A necessary component of the carbon-charge program will be the development of a
“utility bill” that can appropriately provide departments with information about current consumption of energy and historical trends. Energy consumption data and the associated costs are not currently being communicated to departments in an effective way. This information is currently buried in the departmental budget statements and is difficult to find and interpret. The Task Force recommends that improvements be considered to presentation of energy bills. Additionally, units will need to develop an understanding of how they can affect their energy use and what kind of energy-saving measures they should consider. For a discussion of possible approaches, see the appendix of the Working Group Report on Incentives, Information, and Best Practices.
Administration and funding This report has emphasized the role of different entities around the campus, such as
schools, departments, libraries, residential colleges, and the like. Two important questions are, who will administer the program, and who will take the financial risks involved?
With respect to administration, the Task Force emphasizes that a careful
implementation of the carbon-charge program is a major task. We therefore recommend that the university add a full-time professional, designated as the Director of the Carbon-Charge Program. This person would be tasked to oversee or design the pilot, run the program, provide definitive boundaries for the program, calculate emissions for different units, assign prices to different scope activities, run the experiments described below, test experiments with budget devolution described below, and work with units to manage their emissions programs. The Director should be associated with one of the officers, who would ensure that people around the university cooperate fully in launching the program.
Role of quantitative targets, offsets, and RECs The Task Force discussed quantitative emissions targets, emissions offsets, and the
disposition of funds from sales of renewable energy certificates (RECs). The issues involved are complex and politically charged, and there are no specific recommendations provided

16
by this report. However, the Task Force notes that there are major policy issues that should be addressed at the highest levels in the near term.
However, in one area, the interaction of offsets with the carbon charge needs to be
addressed. Where offset prices are lower than the university's carbon charge, the offset price should not be substituted for carbon charges by units. Nor should the offset price be used for shadow pricing purposes in capital investment decisions.
Phase-in of the program A carbon-charge program such as the one proposed for Yale is clearly experimental.
Currently, no institution has instituted a comprehensive internal carbon-charge program of the kind outlined here. Moreover, while this blueprint provides guidance on program design, many details remain to be completed before it can be launched.
Given the complexity and comprehensive nature of the program, the Task Force
recommends that it be phased in beginning in 2015-16 with complete phase in within three years. The key purpose of the phase-in will be to test the concepts, make actual calculations, and undertake the budget charges for selected units.
Administrative units that participate would be designated as “pilot units.” For the
first year, it is suggested that a small number of units should be selected to participate. To show leadership, it would be useful to have one or more officer units as pilots in the first year. Additionally, two of the self-support units in category (a) as well as a small number of category (b) units should be included. It would be important to add a small number of medical departments or centers. Additionally, some category (c) units, perhaps two residential colleges and two FAS departments, should be included. Because of the need to calculate emissions, it would be useful if the pilot units have easily identified emissions.
Additionally, the first year should be used to create the informational infrastructure
for rolling out the comprehensive program. Important information include the estimation of emissions by administrative units, development of the measuring, monitoring and reporting structures needed to track energy use, estimation of the base period emissions, adjustments of the base for special factors if necessary, and development of improved displays of information for decision makers. Additionally, information gathering and feasibility study are necessary for the methodologies and estimates of the emissions associated with scope 3A emissions such as air travel and construction, as well as for energy-intensive purchased equipment.
The Task Force will conclude its deliberations with the current report. At that point,
it would be important to have a full discussion of the proposals with the Yale community, particularly with affected parties. It is recognized that there are many complex issues yet to be determined, such as the phase-in, calculation of emissions by administrative unit, and calculation of base and adjusted base emissions. A key next step will be to appoint the Director and the staff to implement the program.
17
During the phase-in years, the pilot units would have base and actual emissions calculated according to the procedures outlined above. The pilot carbon charge would be set at one-half the recommended per ton charge. Operating the phase-in would allow those administering the program to move from the blueprint provided here to operational details.
A reasonable target is that full implementation should come by the third year. Additionally, in the fifth year, it should be reviewed to determine whether it has met the objectives of reducing carbon emissions and uneconomic energy use, improving planning, and having a light administrative footprint.

18
APPENDICES
The appendices that follow include data developed and used by the Task Force as well as the reports of the Working Groups. These are background that formed the informational basis for the report of the Task Force above. The data and analyses developed for the report were not verified by the offices in the university that provided the data and may differ from the officially developed reports. Further, the reports and recommendations of the Working Groups were not adopted by the Task Force. The Task Force decided to provide the data, analyses, and Working Group Reports in full to provide a fuller examination of the background to the report.
Data Appendix
Tables A-1 through A-3 show expenses and energy use ranked by share, expense budget, and energy budget. Table A-4 shows the energy use of 34 selected buildings, 2010-2014, used in the analysis in the report. Tables A-5 and A-6 show the simulated carbon charges in each of the 34 buildings. Figure A-1 provides a histogram of the year-to-year changes in energy use by building.
19
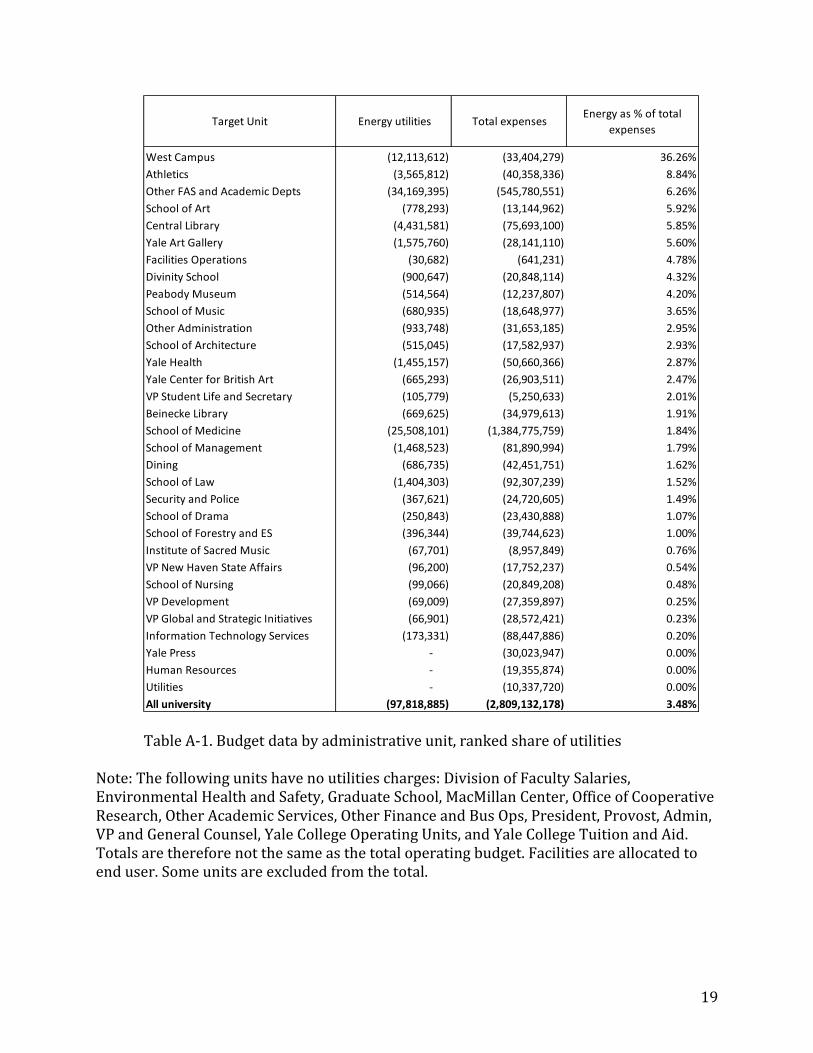
Table A-1. Budget data by administrative unit, ranked share of utilities
Note: The following units have no utilities charges: Division of Faculty Salaries, Environmental Health and Safety, Graduate School, MacMillan Center, Office of Cooperative Research, Other Academic Services, Other Finance and Bus Ops, President, Provost, Admin, VP and General Counsel, Yale College Operating Units, and Yale College Tuition and Aid. Totals are therefore not the same as the total operating budget. Facilities are allocated to end user. Some units are excluded from the total.
Target Unit Energy utilities Total expenses Energy as % of total
expenses
West Campus (12,113,612) (33,404,279) 36.26%
Athletics (3,565,812) (40,358,336) 8.84%
Other FAS and Academic Depts (34,169,395) (545,780,551) 6.26%
School of Art (778,293) (13,144,962) 5.92%
Central Library (4,431,581) (75,693,100) 5.85%
Yale Art Gallery (1,575,760) (28,141,110) 5.60%
Facilities Operations (30,682) (641,231) 4.78%
Divinity School (900,647) (20,848,114) 4.32%
Peabody Museum (514,564) (12,237,807) 4.20%
School of Music (680,935) (18,648,977) 3.65%
Other Administration (933,748) (31,653,185) 2.95%
School of Architecture (515,045) (17,582,937) 2.93%
Yale Health (1,455,157) (50,660,366) 2.87%
Yale Center for British Art (665,293) (26,903,511) 2.47%
VP Student Life and Secretary (105,779) (5,250,633) 2.01%
Beinecke Library (669,625) (34,979,613) 1.91%
School of Medicine (25,508,101) (1,384,775,759) 1.84%
School of Management (1,468,523) (81,890,994) 1.79%
Dining (686,735) (42,451,751) 1.62%
School of Law (1,404,303) (92,307,239) 1.52%
Security and Police (367,621) (24,720,605) 1.49%
School of Drama (250,843) (23,430,888) 1.07%
School of Forestry and ES (396,344) (39,744,623) 1.00%
Institute of Sacred Music (67,701) (8,957,849) 0.76%
VP New Haven State Affairs (96,200) (17,752,237) 0.54%
School of Nursing (99,066) (20,849,208) 0.48%
VP Development (69,009) (27,359,897) 0.25%
VP Global and Strategic Initiatives (66,901) (28,572,421) 0.23%
Information Technology Services (173,331) (88,447,886) 0.20%
Yale Press - (30,023,947) 0.00%
Human Resources - (19,355,874) 0.00%
Utilities - (10,337,720) 0.00%
All university (97,818,885) (2,809,132,178) 3.48%
20
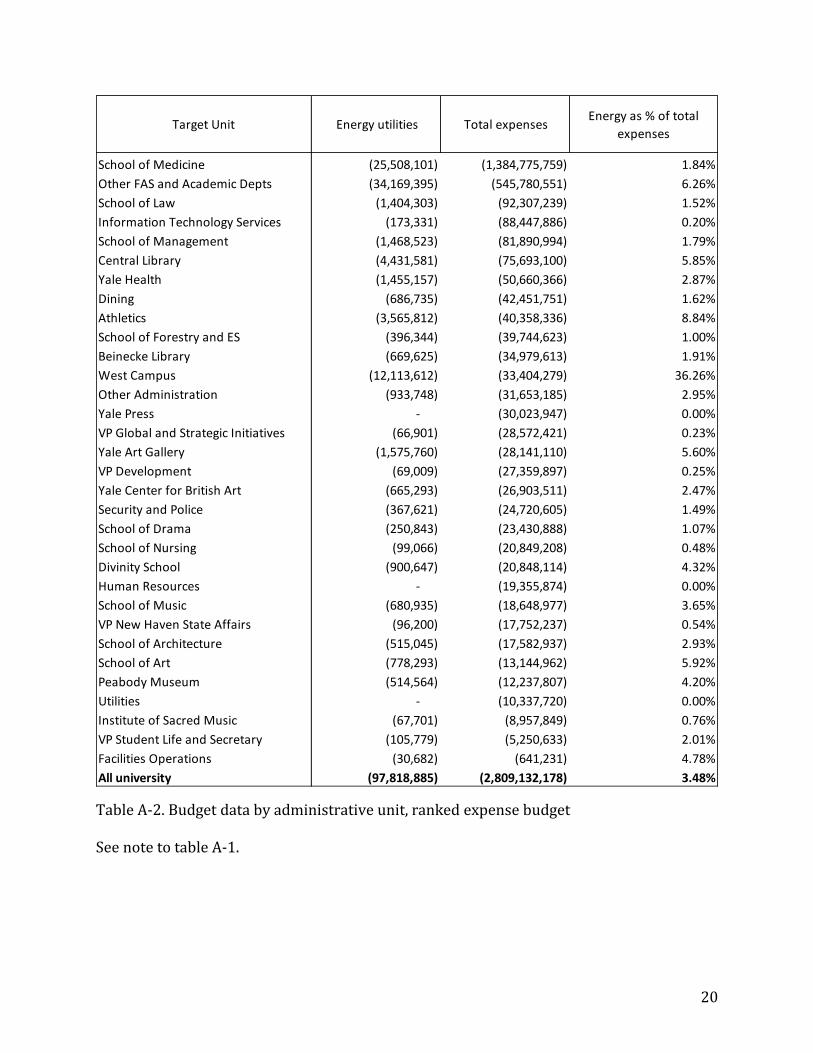
Table A-2. Budget data by administrative unit, ranked expense budget See note to table A-1.
Target Unit Energy utilities Total expenses Energy as % of total
expenses
School of Medicine (25,508,101) (1,384,775,759) 1.84%
Other FAS and Academic Depts (34,169,395) (545,780,551) 6.26%
School of Law (1,404,303) (92,307,239) 1.52%
Information Technology Services (173,331) (88,447,886) 0.20%
School of Management (1,468,523) (81,890,994) 1.79%
Central Library (4,431,581) (75,693,100) 5.85%
Yale Health (1,455,157) (50,660,366) 2.87%
Dining (686,735) (42,451,751) 1.62%
Athletics (3,565,812) (40,358,336) 8.84%
School of Forestry and ES (396,344) (39,744,623) 1.00%
Beinecke Library (669,625) (34,979,613) 1.91%
West Campus (12,113,612) (33,404,279) 36.26%
Other Administration (933,748) (31,653,185) 2.95%
Yale Press - (30,023,947) 0.00%
VP Global and Strategic Initiatives (66,901) (28,572,421) 0.23%
Yale Art Gallery (1,575,760) (28,141,110) 5.60%
VP Development (69,009) (27,359,897) 0.25%
Yale Center for British Art (665,293) (26,903,511) 2.47%
Security and Police (367,621) (24,720,605) 1.49%
School of Drama (250,843) (23,430,888) 1.07%
School of Nursing (99,066) (20,849,208) 0.48%
Divinity School (900,647) (20,848,114) 4.32%
Human Resources - (19,355,874) 0.00%
School of Music (680,935) (18,648,977) 3.65%
VP New Haven State Affairs (96,200) (17,752,237) 0.54%
School of Architecture (515,045) (17,582,937) 2.93%
School of Art (778,293) (13,144,962) 5.92%
Peabody Museum (514,564) (12,237,807) 4.20%
Utilities - (10,337,720) 0.00%
Institute of Sacred Music (67,701) (8,957,849) 0.76%
VP Student Life and Secretary (105,779) (5,250,633) 2.01%
Facilities Operations (30,682) (641,231) 4.78%
All university (97,818,885) (2,809,132,178) 3.48%

21
Table A-3. Budget data by administrative unit, ranked by energy expenses
See note to table A-1.
Target Unit Energy utilities Total expenses Energy as % of total
expenses
Other FAS and Academic Depts (34,169,395) (545,780,551) 6.26%
School of Medicine (25,508,101) (1,384,775,759) 1.84%
West Campus (12,113,612) (33,404,279) 36.26%
Central Library (4,431,581) (75,693,100) 5.85%
Athletics (3,565,812) (40,358,336) 8.84%
Yale Art Gallery (1,575,760) (28,141,110) 5.60%
School of Management (1,468,523) (81,890,994) 1.79%
Yale Health (1,455,157) (50,660,366) 2.87%
School of Law (1,404,303) (92,307,239) 1.52%
Other Administration (933,748) (31,653,185) 2.95%
Divinity School (900,647) (20,848,114) 4.32%
School of Art (778,293) (13,144,962) 5.92%
Dining (686,735) (42,451,751) 1.62%
School of Music (680,935) (18,648,977) 3.65%
Beinecke Library (669,625) (34,979,613) 1.91%
Yale Center for British Art (665,293) (26,903,511) 2.47%
School of Architecture (515,045) (17,582,937) 2.93%
Peabody Museum (514,564) (12,237,807) 4.20%
School of Forestry and ES (396,344) (39,744,623) 1.00%
Security and Police (367,621) (24,720,605) 1.49%
School of Drama (250,843) (23,430,888) 1.07%
Information Technology Services (173,331) (88,447,886) 0.20%
VP Student Life and Secretary (105,779) (5,250,633) 2.01%
School of Nursing (99,066) (20,849,208) 0.48%
VP New Haven State Affairs (96,200) (17,752,237) 0.54%
VP Development (69,009) (27,359,897) 0.25%
Institute of Sacred Music (67,701) (8,957,849) 0.76%
VP Global and Strategic Initiatives (66,901) (28,572,421) 0.23%
Facilities Operations (30,682) (641,231) 4.78%
Yale Press - (30,023,947) 0.00%
Human Resources - (19,355,874) 0.00%
Utilities - (10,337,720) 0.00%
All university (97,818,885) (2,809,132,178) 3.48%

22
Table A-4. Energy Use of 34 Selected Buildings, 2010-2014
Note that the simulations reported in the text assume emissions are proportional to energy use.
Total Plant Supplied Energy MMBTU
Building FY10 Total FY11 Total FY12 Total FY13 Total FY14 Total Average
Standard
deviation of
growth rate (%
log)
A.K. WATSON HALL 7,403 8,875 8,037 7,520 8,000 7,967 13%
ALLWIN HALL 137 136 171 144 127 143 18%
ARNOLD HALL 2,801 2,564 2,386 3,008 3,348 2,821 15%
BASS CENTER 35,183 32,807 30,200 29,069 25,570 30,566 4%
BASS LIBRARY 10,482 12,552 11,526 10,407 10,063 11,006 13%
BATTELL CHAPEL 2,269 2,494 2,105 2,293 2,241 2,280 12%
BECTON E&AS CENTER 43,969 46,618 54,936 57,060 62,298 52,976 6%
BEINECKE LIBRARY 18,746 18,738 22,415 22,692 22,762 21,071 9%
BERKELEY COLLEGE 19,713 21,282 18,972 19,984 20,415 20,073 9%
BETTS HOUSE 2,020 2,345 2,410 3,058 3,047 2,576 11%
BINGHAM HALL,CHARLES 5,465 5,145 4,788 4,967 5,267 5,126 7%
BOOK AND SNAKE 438 283 387 372 583 413 39%
BRANFORD COLLEGE 18,655 17,819 14,839 17,686 15,975 16,995 15%
BRITISH ART, YALE CTR 20,802 17,521 17,884 18,914 18,998 18,824 10%
BROADWAY, 77 743 1,454 1,798 2,112 2,270 1,675 27%
CALHOUN COLLEGE,JOHN 14,736 15,763 15,476 19,670 16,326 16,394 18%
CHEMICAL SAFETY BLDG 2,071 1,276 1,169 1,456 1,731 1,541 32%
CHEMISTRY RES BLDG 38,754 42,126 33,831 35,425 38,134 37,654 14%
CHURCH ST, 246 2,713 2,288 1,975 2,057 2,303 2,267 14%
CHURCH ST, 250 352 345 283 318 410 342 19%
CHURCH ST, 258/GROVE,96 528 517 425 476 616 512 19%
COLLEGE ST, 451 8,353 8,817 9,075 8,123 5,412 7,956 21%
COLLEGE ST, 493 1,331 1,533 2,568 2,984 2,528 2,189 28%
CONNECTICUT HALL 1,745 1,706 1,566 1,926 2,037 1,796 13%
DAVENPORT COLLEGE 16,669 18,224 16,794 17,144 20,061 17,779 10%
DOW HALL 3,073 2,779 3,090 3,113 4,165 3,244 17%
DUNHAM LAB 22,979 23,870 28,614 29,467 30,704 27,127 7%
DURFEE HALL,BRADFORD 5,392 5,773 6,031 7,638 9,643 6,895 10%
DWIGHT HALL & CHAPEL 3,749 4,587 4,093 2,731 3,647 3,762 32%
ELECTRON ACCEL. LAB 3,922 3,723 2,687 2,467 2,014 2,963 12%
ELIHU HOUSE 403 621 660 538 1,004 645 37%
ELIZABETHAN CLUB 243 266 203 364 439 303 35%
ENVIRONMTL SCIENCE CTR 49,515 39,471 45,799 46,399 42,713 44,779 16%
EVANS HALL, THOMAS M. 2,540 2,026 2,385 2,453 2,022 2,285 19%
Total, 34 buildings 367,894 366,346 369,577 384,036 386,874 374,945 2%
23
Table A-5. Simulation of carbon charges by building, sort by charge as share of base
These use the energy consumption in 2010-11 as a base for each building, adjust the base each year by the change in the total for all buildings, and then calculate the charges at $40 per ton of CO2 .
Carbon charge for 34 selected buildings
Building
Average gross
charge
Average
net charge
Average as
% of base
Electron Accel. Lab 22,484 (8,913) -40%
Bass Center 199,951 (39,322) -20%
Dwight Hall & Chapel 24,515 (4,689) -19%
Church St, 246 14,709 (2,714) -18%
Chemical Safety Bldg 9,845 (1,599) -16%
College St, 451 50,496 (7,685) -15%
Chemistry Res Bldg 237,859 (34,533) -15%
Branford College 107,265 (15,440) -14%
Bass Library 67,741 (7,162) -11%
Battell Chapel 14,006 (1,436) -10%
Bingham Hall,Charles 31,204 (2,762) -9%
A.K. Watson Hall 47,871 (3,270) -7%
Berkeley College 120,561 (8,151) -7%
Church St, 250 2,050 (135) -7%
Church St, 258/Grove,96 3,074 (202) -7%
British Art, Yale Ctr 112,704 (7,064) -6%
Evans Hall, Thomas M. 13,430 (443) -3%
Environmtl Science Ctr 261,699 (6,267) -2%
Davenport College 102,617 (377) 0%
Connecticut Hall 10,150 319 3%
Allwin Hall 803 34 4%
Arnold Hall 15,778 773 5%
Calhoun College,John 89,694 7,761 9%
Dow Hall 17,210 2,419 14%
Beinecke Library 110,239 18,259 17%
Book And Snake 2,121 420 20%
Dunham Lab 137,778 30,323 22%
Becton E&As Center 266,406 63,590 24%
Betts House 12,837 3,286 26%
Elizabethan Club 1,498 407 27%
Durfee Hall,Bradford 32,835 11,303 34%
Elihu House 3,011 1,156 38%
Broadway, 77 6,461 5,238 81%
College St, 493 8,422 6,875 82%
TOTAL 2,159,322 0 0%
24
Table A-6. Simulation of carbon charges by building, sort by dollar charge
These use the energy use 2010-11 as a base, adjust by the total of all buildings, and then calculate the charges at $40 per ton of CO2 .
Carbon charge for 34 selected buildings
Building
Average gross
charge
Average
net charge
Average as
% of base
Bass Center 199,951 (39,322) -20%
Chemistry Res Bldg 237,859 (34,533) -15%
Branford College 107,265 (15,440) -14%
Electron Accel. Lab 22,484 (8,913) -40%
Berkeley College 120,561 (8,151) -7%
College St, 451 50,496 (7,685) -15%
Bass Library 67,741 (7,162) -11%
British Art, Yale Ctr 112,704 (7,064) -6%
Environmtl Science Ctr 261,699 (6,267) -2%
Dwight Hall & Chapel 24,515 (4,689) -19%
A.K. Watson Hall 47,871 (3,270) -7%
Bingham Hall,Charles 31,204 (2,762) -9%
Church St, 246 14,709 (2,714) -18%
Chemical Safety Bldg 9,845 (1,599) -16%
Battell Chapel 14,006 (1,436) -10%
Evans Hall, Thomas M. 13,430 (443) -3%
Davenport College 102,617 (377) 0%
Church St, 258/Grove,96 3,074 (202) -7%
Church St, 250 2,050 (135) -7%
Allwin Hall 803 34 4%
Connecticut Hall 10,150 319 3%
Elizabethan Club 1,498 407 27%
Book And Snake 2,121 420 20%
Arnold Hall 15,778 773 5%
Elihu House 3,011 1,156 38%
Dow Hall 17,210 2,419 14%
Betts House 12,837 3,286 26%
Broadway, 77 6,461 5,238 81%
College St, 493 8,422 6,875 82%
Calhoun College,John 89,694 7,761 9%
Durfee Hall,Bradford 32,835 11,303 34%
Beinecke Library 110,239 18,259 17%
Dunham Lab 137,778 30,323 22%
Becton E&As Center 266,406 63,590 24%
TOTAL 2,159,322 0 0%

25
Figure A-1. Histogram of year-to-year changes in energy use of 34 buildings, 2010-2014 The underlying data are the rates of growth of energy use in the 34 buildings over the period as estimated by a regression of the logarithm of use against time. The units are logarithmic growth rates, so the median growth rate of 0.024 is 2.4% per year.
0
4
8
12
16
20
24
-0.4 -0.2 0.0 0.2 0.4 0.6 0.8 1.0
Annual growth rate
Ob
se
rva
tio
ns
Series: GROWTH Observations 120 Mean 0.037 Median 0.024 Maximum 0.95 Minimum -0.38 Std. Dev. 0.18

26
Figure A-2. Growth in electricity use, Sterling Law These are metered use of electricity, year over year by month. The first observation is the rate of growth from July 2009 to July 2010. The last observation is the rate of growth from June 2013 to June 2014.
-40%
-30%
-20%
-10%
0%
10%
20%
30%
40%
7/6/2009 11/18/2010 4/1/2012 8/14/2013 12/27/2014
Monthly growth electricity use: Sterling Law
27
Figure A-3. Growth in steam use, Sterling Library These are the use of metered steam, year over year by month. The observations are the same as in Figure A-2.
-60%
-40%
-20%
0%
20%
40%
60%
Jul-09 Nov-10 Apr-12 Aug-13 Dec-14
Monthly growth steam use: Sterling Library

28
Figure A-4. Electricity growth, three residential colleges These are metered use in electricity by college. These are monthly, seasonally adjusted, and divided by the mean for each college, so the mean value is 1 for each college. The data for Calhoun were clearly anomalous for 2014 and were removed from the sample.
0.7
0.8
0.9
1.0
1.1
1.2
1.3
1.4
1.5
7 10 1 4 7 10 1 4 7 10 1 4 7 10 1 4 7 10 1 4
2009 2010 2011 2012 2013 2014
Calhoun
Branford
Silliman
Se
aso
na
lly a
dju
ste
d,
ave
rag
e =
1.
29
Appendix. Working Group Report on Incentives, Information, and Best Practices Objective
A successful carbon-pricing mechanism changes the behavior of energy consumers with a price signal that induces reduced energy consumption. But many members of the Yale community do not pay energy bills so that an additional structure of incentives, information, and actions are required to engage this set of students, faculty, and staff in playing a role in the university’s efforts to cut its carbon emissions. The working group identified industry-leading strategies for inducing energy-saving behavior, with the purpose of providing incentives to reduce consumption and make energy information more salient to the many Yale energy consumers who do not see electricity or heating bills. The group also strived to build a broader sense of ownership of the energy conservation initiative across the Yale community by inviting suggestions about how the students, faculty, and staff might best be drawn in to efforts to reduce energy consumption across the campus. Investigating best practices in incentive programs and energy information flow yielded recommendations that will complement the carbon charge and ensure that everyone in the Yale community plays a role in helping to deliver on the university’s commitment to energy efficiency and greenhouse gas emissions reductions.
Methods
The working group met to compile known best practices from across the campus and from recognized experts. The group also organized a set of contests to “crowd source” ideas for reducing energy use and a student research effort to identify best practices in energy conservation at other universities. For a detailed description of the contests and student research, see Annex A.
Recommendations
The recommendations fall into five categories:
Students, faculty, and/or staff behavior; University and/or departmental policies; Building use, operations, and/or construction; Future campus planning; and The purchase and use of major equipment.
Students, faculty, and/or staff behavior:
For students, we recommend developing annual energy-saving competitions, with financial rewards related to energy-spend savings, to incentivize energy reductions in the residential colleges. Because students do not receive or pay energy bills, they have no direct financial incentive to reduce consumption. Competitions with rewards would create financial incentives that have the potential to induce energy-saving behavior. We first suggest that both the cost-benefit of student competitions be evaluated and the history of intercollege competitions be studied. A cost-benefit analysis is important because while

30
competitions can be great ways to raise awareness about energy use and best practices, the long-lasting energy-saving impacts tend to be the result of default strategies being put into place during the contest. If the competitions are found to be beneficial, then we recommend that they be developed and piloted by the Sustainability Office in conjunction with the Council of Masters, Facilities / Energy Management, professors, and residential college sustainability coordinators. For a working model of the competitions, see Annex B.
We divide faculty/staff units into two subgroups and recommend developing distinct energy incentive programs for each. The first is comprised of self-support units, units with complete budget control, and units with devolved energy budgets. Because these units have a direct financial incentive to reduce consumption, we recommend a charge-and-rebate program. Units that observe an increase in emissions relative to a defined baseline would receive a charge equal to the net increase in emissions multiplied by the carbon price, while those units that observe a relative decrease in emissions would receive a rebate equal to the net decrease in energy-spend. This carrot-and-stick approach has proven effective in reducing energy consumption at both UC Berkeley and another California university. For a detailed description of the energy savings achieved by these universities’ energy incentive programs, see Annex C.
The second subgroup is comprised of units without budgets, for which we recommend developing a “gain share” energy conservation program. Because these units do not pay energy bills today, they have limited budgetary incentives to reduce consumption. Thus, we recommend that a “gain share” incentive program be established for these units, which provides that decreases in energy consumption relative to a predetermined baseline be shared with that unit so that half of the dollar value of the reductions go to the unit. In the following year, a new baseline will be established based on the results from the prior year. Some normalization of the consumption trends based on degree days should be undertaken to account for the effects of year-to-year fluctuations in weather and perhaps for other factors as well. Units that observe a relative increase in emissions would not be penalized with a charge. This gain sharing approach would create a financial incentive to induce energy-saving behavior for units without budgets.
In addition to the rebate-only program, we recommend increased focus on energy consumption and salience to conservation for all units through the following initiatives:
Devolving energy budgets to units when possible to give them control of their energy expenditure and thus make them pay attention to their energy use;
Evaluating the technical feasibility of utilizing campus metering systems with the Opower model of behavior modification;
Studying historical energy use data, projected use, and campus or external
benchmarks to establish baselines in conjunction with individual units, with the creation of a process for key decision-makers to agree upon their baselines;

31
Evaluating the effectiveness of energy dashboards that display real-time energy use and historical consumption patterns for the residential colleges and other high-use units through pilot programs;
Researching further the most effective strategies for engaging building occupants in energy conservation and providing the technical and administrative support needed to implement them; and
Developing an energy investment portfolio of projects for consideration and implementation within individual units, e.g. space utilization studies.
University and/or departmental policies:
We recommend renewing efforts to set and promote university-wide operating practices and default rules (e.g., thermostat settings) that promote greater energy efficiency. We recognize that there will need to be override options available in specific contexts. We also recommend developing both new student/hire orientation and individual building occupancy training programs to educate students, faculty, and staff about Yale’s culture of sustainability and individual building operations. This approach has proven effective at the School of Forestry & Environmental Studies, and the undergraduate sustainability coordinators employed by the sustainability office are currently working with Dean Marichal Gentry on developing and piloting such a program for undergraduates. We finally suggest creating an initiative on space rationalization to decrease wasteful space utilization through a number of measures such as designating workspaces within building for after-hour activities when possible.
Building use, operations, and/or construction:
We first recommend pilot efforts to put up energy dashboards that display real-time energy use and historical consumption patterns for the residential colleges and high-use buildings – with broader introduction of these dashboards if they prove to be effective in making students, faculty, and staff more aware of energy use. We also recommend investing strategically in the best available technologies to promote ongoing energy conservation, e.g., fully automated/integrated lighting and heating/cooling controls in buildings and automated computer/AV system shutdown.5 We also suggest exploring the possibility of online scheduling and door-to-door service for shuttle transportation to optimize routes and thus reduce fuel consumption. We finally suggest exploring the effectiveness and feasibility of a whistle-blower program whereby students, faculty, and staff can be rewarded for reporting energy waste.
Future campus planning:
5 It will be important to conduct research on how occupancy sensors have long-term positive or negative impacts, since occupancy sensors at Yale have had a 30% failure rate after 8 years. Because occupancy sensors are in fact technical solution to a behavioral problem, we recommend researching and investing in behavioral solutions, manpower to manually shut off lights/systems, and/or technological solutions.

32
We recommend incorporating a shadow carbon price in all future university planning, creating an energy efficiency investment fund with revenue generated from the Record Hill Wind Farm REC sales, and increasing energy management staffing and capacity so that energy-spend decisions can be optimized and energy efficiency choices will become more accessible to units that want to explore internal energy reduction options.
Organizational readiness — especially at the implementation level — is essential to implementing a carbon charge because experienced staff is critical to achieving significant reductions across campus. Priorities and timelines for reductions will need to be set in conjunction with key-decision makers.
Purchase and use of major equipment:
We recommend that all major equipment purchases (including lab equipment and other machines) be subject to a life-cycle analysis that ensures energy efficiency optimization — with a university fund available to help offset the cost of moving from average equipment efficiency to high efficiency that optimizes the sum of up-front and operating costs. We also suggest exploring the possibility of centralized procurement for major equipment purchases and requiring units to pre-purchase electricity at a higher rate when they opt out of an energy efficient alternative.
* * *

33
Annex to Working Group Report on Incentives
A. Contests and student research
The working group organized a set of contests to solicit ideas from students, faculty, and staff for reducing energy use and a student research effort to identify best practices in energy conservation at other universities.
The first contest asked the question: On a campus where many energy consumers are unaware of the amount of energy used and the associated greenhouse gas emissions, how can the university direct attention to – and ultimately reduce – energy use? The Task Force encouraged individuals to think of opportunities to help Yale reduce energy use in the following areas:
Students, faculty, and/or staff behavior University and/or departmental policies Building use, operations, and/or construction Future campus planning The purchase and use of major equipment
There were 47 submissions, totaling 65 unique suggestions, with cash prizes of $100 per winning idea awarded to the 6 best ideas.
The second contest asked the question: What is the “best practice” that you know of to promote energy conservation? There were 10 submissions, totaling 11 unique suggestions, with one grand prize of $500 awarded to the best idea.
Participation breakdown was an approximate 50-50 split between students and staff, with 29 and 28 submissions respectively. There were 32 unique respondents, with many individuals making multiple submissions and even multiple recommendations per submission. The contests took place over the course of 12 days, running from January 20 – February 1.
The Task Force also hired 5 students to research best practices in energy conservation and awareness at universities across the U.S. ranking high for their sustainability. Each student was responsible for investigating a small number of universities’ energy conservation programs, exploring in some detail how those institutions use incentives, contests, prizes, and information to induce energy conservation among students, faculty, and staff. Each student prepared a written report for the Task Force detailing his or her findings. The following were the most useful in preparing the group’s recommendations:
B. Model of competitions
We recommend the development of two annual energy-saving competitions with financial rewards to incent students to reduce energy use. We suggest two unique competitions, as opposed to one, to avoid participant fatigue.
For the first competition, which would take place during the fall semester, we recommend that the university compete with Harvard for the highest percentage reduction in total

34
energy use per square-foot for all student residences from a baseline set according to the previous year, normalized by degree days. To encourage participation on each campus, we recommend that each university’s sustainability office, in collaboration with their energy management group, develop a pledge asking students to take a number of energy-saving actions, with an energy-related reward for reaching a specified participation. The winner would be awarded a percentage of the energy-spend savings from both universities, with the percentage value equal to the energy-saving pledge participation rate for the winning school. To inform the student bodies of their energy use, we recommend that the Yale Daily News and Harvard Crimson publish the current and previous year’s energy use data for both universities’ student residences leading up the Harvard-Yale football game, where the winner would be announced. The final design of the contests could be developed with professors. Brad Neff, Long-term Energy Planner at PG&E, who was supposed to attend the conference, recommended reaching out to Elliot Hoffman of True Market Solutions to develop custom energy reduction competitions.
For the second competition, which would take place during the spring semester, we recommend that the residential colleges compete with each other for the highest percentage reduction in total energy use per square-foot from a baseline set according to the same guidelines as the first competition. Each college would be awarded a percentage of its energy-spend savings, with the percentage value set according to a sliding scale based on each college’s end-of-year rank. The overall winner would receive an addition reward. We once again recommend that the Yale Daily News publish the current and previous year’s monthly energy use data for each of the colleges.
C. Energy incentive programs at California universities
One California university implemented an incentive program where an energy consumption baseline was established based on historical consumption, adjusted for new infrastructure. Savings were returned to departments that consumed less than their baselines and charges were imposed on units that used use over their baseline. The program achieved an average of 3% below baseline in each of the 4 years following implementation, resulting in cost savings and reduced emissions.6
Similarly, UC Berkeley created the Energy Incentive Program to shift campus culture from a “free-energy” mentality to a “vested-interest” mentality.7 Berkeley devolved energy budgets to “operating” units and set baselines according to a 1-year energy use study. Only rewards (i.e. no penalizations) were administered in the first year of implementation, with penalizations introduced in the second year for units that increased relative to their baseline. Operating units received monthly meter reports indicating actual consumption relative to their historic baseline, as well as end-of-year statements with dividends. The program led to $870,000 in incentive payments and 1,500 MTCDE saved in year one.8
6http://oe.berkeley.edu/sites/default/files/ diagnostic%20report%20bain%20uc%20berkeley.pdf 7 http://www.appa.org/membershipawards/documents/ APPAEffectiveandInnovativePracticesAwardAp 8 http://sustainability.berkeley.edu/news/how-are-energy-incentive-program-payments-being-u
35
Appendix. Working Group Report on Carbon Emissions Scopes and the Carbon-Charge Base Scope Definitions
In order to institute a carbon emissions charge at Yale, a clear designation of what would be covered by the charge is needed. In order to determine which activities at Yale would be subject to the charge, the GHG protocol developed the World Resource Institute and the World Business Council for Sustainable Development was utilized. It is the most widely used international GHG accounting tool and categorizes all emissions into three scopes. These are defined as:
Scope 1: Direct emissions from owned or controlled sources. This includes the onsite combustion of fossil fuels from power plants and the vehicle fleet. Scope 2: Indirect GHG emissions from consumption of purchased electricity, heat or steam. Scope 3: Other indirect emissions, such as the extraction and production of purchased materials and fuels, transport-related activities in vehicles not owned or controlled by the reporting entity, electricity-related activities (e.g. transmission and distribution losses) not covered in Scope 2, commuting, air travel, outsourced activities, waste disposal, etc.
To examine the emissions classified in Scope 3, the group further separated these
emissions into two distinct categories. These were defined as those emissions under which Yale has operational control (Scope 3A) and those for which Yale does not (Scope 3B). The rationale for this separation is that the carbon charge is applied only to those activities over which Yale has operational control. Examples of these include:
Scope 3A. Emissions embedded in supplies, materials, food purchased by Yale, student/staff/faculty travel paid for by Yale, on-campus construction, and waste disposal. Scope 3B. Emissions embedded in commuting, off-campus housing, and student/staff/faculty travel not paid for by Yale.
Criteria for Carbon Charge Inclusion
In order for the carbon charge to be useful, a large base for the charge is necessary. Yet, a sweeping charge covering all emissions would be difficult to implement due to a lack of measurability. Additional complications arise when trying to pass the charge onto other entities. Therefore, the main criteria used when making recommendations for inclusion into the base are whether the emissions category is controlled operationally by Yale and can be easily calculated with current or easily modified information systems.

36
Based on these criteria, the base of the carbon charge would include all scope 1 and scope 2 emissions for which Yale pays the utility bill. This includes all energy uses for which Yale is financially responsible, such as generated utilities, purchased utilities, and purchased fuel for fleet vehicles. These are well measured at this time, although some additional metering and data collection may be necessary for facilities not attached to the universities power plants.
It is the recommendation of this group that scope 3A emissions be introduced into the base as they become appropriately measurable and studied from a feasibility standpoint. Scope 3B emissions are beyond the control of Yale and therefore should not be included in the charge. Scope 3A emissions that should be immediately considered for inclusion are air travel and building construction. While additional steps need to be taken to ensure accurate measurement and determine the implementation plan, these scope 3A activities can meet the necessary criteria for inclusion if further studied within a year. Additionally, both of these activities are significant contributors to Yale’s overall emissions – air travel is estimated at 10% of total emissions. It is worth the effort to ensure these activities can be included in the base.
Average MTCO2e output for 1 year
Scope 1 & 2 emissions/year 250 sq. ft. office
1.84 MTCO2e
Scope 1 & 2 emissions/year 250 sq. ft. laboratory
5.6 MTCO2e
Emissions from one person flying from Hartford to Los Angeles (economy class)
1 MTCO2e