executive summary - office of diversity and … · web viewdepartment of veterans affairs executive...
TRANSCRIPT

Department of Veterans Affairs
Management Directive 715
FY 2014 EEO Report/FY 2015 EEO Plan
Table of Contents
Page
Department of Veterans Affairs Organizational Chart 3
FY 2013 EEO Report and FY 2014 EEO Plan
EEOC FORM 715-01 PART A-D 5
EEOC FORM 715-01 PART E 9
EEOC FORM 715-01 PART F 27
EEOC FORM 715-01 PART G 29
EEOC FORM 715-01 PART H 43
EEOC FORM 715-01 PART I 55
EEOC FORM 715-01 PART J 77
WORKFORCE DATA TABLES 81
1

(This Page Intentionally Left Blank)
2

3

(This Page Intentionally Left Blank)
4

EEOC FORM715-01 PART A - D
U.S. Equal Employment Opportunity Commission
FEDERAL AGENCY ANNUAL EEO PROGRAM STATUS REPORT
For period covering October 1, 2013, to September 30, 2014.
PART A
Departmentor AgencyIdentifyingInformation
1. Agency 1. Department of Veterans Affairs
1.a. 2nd level reporting component
1.b. 3rd level reporting component
1.c. 4th level reporting component
2. Address 2. 810 Vermont Ave., N.W.
3. City, State, Zip Code 3. Washington, DC 20420
4. CPDF Code
5. FIPS code(s) 4. VA 5. 11 DC
PART B
TotalEmployment
1. Enter total number of permanent full-time and part-time employees 323,538
2. Enter total number of temporary employees 19,969
3. Enter total number employees paid from non-appropriated funds 3,547
4. TOTAL EMPLOYMENT [add lines B 1 through 3] 347,054
PART C
AgencyOfficial(s)
ResponsibleFor Oversight
of EEOProgram(s)
1. Head of Agency Official Title
1. Robert A. McDonald, Secretary of Veterans Affairs
2. Agency Head Designee 2.
3. Principal EEO Director/Official Title/series/grade
3. Gina S. Farrisee, Assistant Secretary for Human Resources and Administration
4. Title VII Affirmative EEO Program Official
4. Georgia Coffey, Deputy Assistant Secretary for Diversity and Inclusion
5. Section 501 Affirmative ActionProgram Official
5. Georgia Coffey, Deputy Assistant Secretary for Diversity and Inclusion
6. Complaint Processing Program Manager
6. Catherine Mitrano, Deputy Assistant Secretary for Resolution Management
7. Other Responsible EEO Staff 7. Maxanne Witkin, Director, Office of Employment Discrimination Complaint Adjudication
8. Paula Molloy, Deputy Assistant Secretary of
5

Human Resources Management
EEOC FORM715-01 PART A - D
U.S. Equal Employment Opportunity Commission
FEDERAL AGENCY ANNUAL EEO PROGRAM STATUS REPORT
PART D
List of Subordinate Components Covered in This Report
Subordinate Component and Location (City/State)
CPDF and FIPS codes
Veterans Health Administration(Washington, DC)
VATA 11 DC
Veterans Benefits Administration(Washington, DC)
VALA 11 DC
National Cemetery Administration(Washington, DC)
VAPA 11 DC
6

EEOC FORMS and Documents Included With This Report
*Executive Summary [FORM 715-01 PART E], that includes: √ *Optional Annual Self-Assessment Checklist Against Essential Elements [FORM 715-01PART G]
√
Brief paragraph describing the agency's mission and mission-related functions
√ *EEO Plan To Attain the Essential Elements of a Model EEO Program [FORM 715-01PART H] for each programmatic essential element requiring improvement
√
Summary of results of agency's annual self-assessment against MD-715 "Essential Elements"
√ *EEO Plan To Eliminate Identified Barrier [FORM 715-01 PART I] for each identified barrier
√
Summary of Analysis of Work Force Profiles including net change analysis and comparison to the Relevant Civilian Labor Force
√ *Special Program Plan for the Recruitment, Hiring, and Advancement of Individuals With Targeted Disabilities for agencies with 1,000 or more employees [FORM 715-01 PART J]
√
Summary of EEO Plan objectives planned to eliminate identified barriers or correct program deficiencies
√ *Copy of Workforce Data Tables as necessary to support Executive Summary and/or EEO Plans
√Attached
Summary of EEO Plan action items implemented or accomplished
√ *Copy of data from 462 Report as necessary to support action items related to Complaint Processing Program deficiencies, ADR effectiveness, or other compliance issues.
N/A
*Statement of Establishment of Continuing Equal Employment Opportunity Programs[FORM 715-01 PART F]
√ *Copy of Facility Accessibility Survey results as necessary to support EEO Action Plan for building renovation projects
N/A
*Copies of relevant EEO Policy Statement(s) and/or excerpts from revisions made to EEO Policy Statements. Referenced athttp://www.diversity.va.gov/policy/files/EEO_Policy_Statement.pdf
√ *Organizational Chart √
7

(This Page Intentionally Left Blank)
8

Introduction
The Department of Veterans Affairs (VA) is proud to present VA’s Management Directive (MD) 715 Equal Employment Opportunity (EEO) Program Status Report for fiscal year (FY) 2014 and EEO Plan for FY 2015. This report addresses all the required elements of the Equal Employment Opportunity Commission’s (EEOC) MD-715 for building and sustaining a Model EEO Program.
VA is comprised of a Central Office (VACO), which is located in Washington, DC, and field facilities throughout the Nation, as well as the U.S. territories and the Philippines. Programs are administered by three major line organizations: Veterans Health Administration (VHA), Veterans Benefits Administration (VBA), and the National Cemetery Administration (NCA). VA is the second largest Federal Department, with a workforce of over 347,000 employees. VA employs 113,432 Veterans, which is approximately 32.7 percent of the workforce.
VA provides health care, benefits, and memorial services for approximately 21.6 million Veterans.1 VA provides these services through three major organizational subcomponents: the VHA, with 150 medical centers, 997 outpatient clinics (including hospital-based, independent, mobile, and community-based outpatient clinics), 136 community living centers, 105 domiciliary rehabilitation treatment programs, and 300 readjustment counseling centers; VBA, with 56 regional offices; and the NCA, with 131 cemeteries. In addition to the national cemeteries, NCA supports VA’s Cemetery Grant Program which is designed to complement NCA’s national cemeteries across the country. VACO is the national headquarters office comprising numerous Staff Offices reporting to the Secretary.
Unlike most Federal agencies, VA maintains a tri-partite structure for the administration of its Department-wide EEO and diversity management functions. The respective functions and responsibilities are distributed among three independent offices as described below:
The Office of Diversity and Inclusion (ODI) develops Department-wide EEO and diversity policies; performs workforce analyses and reporting; develops outreach and retention programs, and provides training and communication on EEO and diversity topics.
The Office of Resolution Management (ORM) administers the Department’s EEO complaint processing system (counseling, procedural decisions, investigation, and compliance) and oversees the Workplace Alternative Dispute Resolution (ADR) Program.
The Office of Employment Discrimination Complaint Adjudication (OEDCA) issues final agency decisions (FAD) based upon an investigative record or final orders following a decision by an EEOC administrative judge.
Summary of Self-Assessment against the Model EEO Program Essential Elements1 Data Source: National Center for Veterans Analysis and Statistics Web site, http://www1.va.gov/vetdata/Veteran_Population.asp; date pulled October 2, 2013.
Executive Summary
EEOC FORM715-01PART E
U.S. Equal Employment Opportunity CommissionFEDERAL AGENCY ANNUAL
EEO PROGRAM STATUS REPORT
Department of Veterans Affairs
EXECUTIVE SUMMARY

In FY 2014, VA continued to make progress toward implementing a Model EEO Program in accordance with EEOC’s six essential elements identified in Part G, which contains a list of yes/no type questions, grouped under each of the elements. A “no” response indicates a deficiency in that aspect of the EEO program. ODI monitors VA’s status on these elements through a sophisticated Web-based system that enables VA components to enter and track their self-assessments on the MD 715 Parts G and H at all organizational levels. Deficiencies identified at the national level focused mainly on structural challenges, such as inconsistent coordination between EEO and human resources (HR) staff and lack of centralized tracking and enforcement in some areas. These issues have been addressed in Part H. Table 1 displays the percent of the “Compliance Indicators” assessed as met in Part G of the report and is grouped by each Model EEO program essential element. Overall, 94.2 percent of all appropriate “Compliance Indicators” in Part G were assessed as being met, a marginal improvement from FY 2013. The paragraphs following Table 1 depict some of VA’s major accomplishments and challenges under each of the six essential elements.
Table 1. Percent of Compliance Indicators met by EEOC Essential Element
EEO Essential Element FY 2013 FY 2014Demonstrated Commitment by Agency Leadership 100% 100%Integration of EEO into the Agency's Strategic Mission 100% 100%Management and Program Accountability 60% 80%Proactive Prevention of Unlawful Discrimination 100% 100%Efficiency 90.3%2 90.3%Responsiveness and Legal Compliance 100% 100%
DEMONSTRATED COMMITMENT BY AGENCY LEADERSHIP: Robert A. McDonald was nominated by President Obama to serve as the eighth Secretary of Veterans Affairs and was confirmed by the United State Senate on July 29, 2014. As the new Secretary of VA, he has demonstrated his strong commitment to EEO and diversity in the workforce through several initiatives. In FY 2014, the Secretary reaffirmed VA’s commitment to the rights and protections enshrined in the Civil Rights Act of 1964, the Notification and Federal Employee Antidiscrimination and Retaliation Act, the Whistleblower Protection Act, and all Federal laws that protect our employees as outlined in his predecessor’s Policy Statement dated June 11, 2014. In his memorandum, dated June 9, 2014, Acting Secretary Sloan Gibson reaffirmed the 3 percent hiring goal for Individuals with Targeted Disabilities (IWTD) in FY 2014. For FY 2014, hires of IWTDs were 3.27 percent of total hires. The representation of IWTDs was 2.10 percent, exceeding the Secretary’s 2 percent onboard goal for IWTD. The Assistant Secretary for Human Resources and Administration (ASHRA) and the Deputy Assistant Secretary (DAS) for Diversity and Inclusion continue to co-chair the VA Diversity Council, comprising senior executives, employee unions, and affinity groups, and expanded the membership of
2 Incorrectly recorded as 90.6 percent in FY 2013 MD 715 report.
Executive Summary
DEPARTMENT OF VETERANS AFFAIRS
10

VA’s Diversity Council to include employee unions and affinity group representatives. Additionally, the Council supported the Secretary’s Annual Diversity and Inclusion Excellence Awards Program. The newly appointed Interim Under Secretary for Health (IUSH) demonstrated her commitment and leadership by holding Senior Executives accountable to their performance measures related to EEO and diversity; and by implementing other policies to strengthen the message of the importance of EEO, diversity and inclusion. EEO and Diversity and Inclusion policies were distributed to VHA employees.
The VBA leadership annually reviews, up-dates and disseminates all EEO and diversity policies including but not limited to the Equal Employment Opportunity Policy Statement, Prevention of Sexual Harassment, Prevention & Elimination of Harassment and VBA’s Alternative Dispute Resolution Policy. The VBA leadership is a contributing member to the quarterly VA Diversity Council, the ADR Advisory Council, Reasonable Accommodations Council, and the MD 715 workgroup. Each fiscal year, VBA allocates resources and funds for training and educational programs designed to provide career opportunities and advancement for employees, and to expand its leadership to include qualified individuals from diverse backgrounds.
Senior NCA officials and other key employees participated in over 66 outreach events to provide information on both benefits and employment opportunities. NCA updated EEO policies and commemorative information was posted on employee bulletin boards and placed on the NCA Intranet. A review of NCA electronic forms was conducted to ensure they were Section 508 compliant. NCA leadership supported and marketed the Individuals with Disabilities (IWD) Program. As a result, NCA met the Secretary’s 3% new hires and 2% on-board goals for IWTDs. Over twenty-five reasonable accommodations were provided to employees in FY14. Senior officials and managers were held accountable for supporting this program and the results of their efforts were noted in the end of the year Senior Executive Service (SES) EEO Accomplishment Reports. All regions exceeded the hiring and on-board goals. In addition to supporting the IWD Program, senior leaders were evaluated on their participation in other areas of the EEO program. The evaluation included their efforts to resolve complaints and participate in the alternate dispute resolution programs; to attend or support the special emphasis program; as well as a review of all demographic data for their respective areas.
In 2014, the Office of Information Technology established a Diversity Management Advisory Council (DMAC) consisting of a diverse group of talented people. OIT has launched “Cultural Competency” as the first in a series of Dignity and Respect Solution modules ensuring high quality and cultural competent customer service.
INTEGRATION OF EEO INTO THE AGENCY’S STRATEGIC MISSION: During FY 2014, ODI continued to lead the implementation of VA’s Diversity and Inclusion Strategic Plan for FY 2012 – 2016 that served as a Government-wide model. Progress on the strategic objectives was reported to the Secretary, senior leadership, and will be disseminated publicly in VA’s fifth Diversity and Inclusion Annual Performance Report for FY 2014. Additionally, the ASHRA, as the designated EEO Director, meets regularly with the Secretary and Deputy Secretary on EEO and diversity issues. Furthermore, the DAS for Diversity and Inclusion participates in the Monthly Performance Review process, the
Executive Summary
DEPARTMENT OF VETERANS AFFAIRS
11
ASHRA’s senior staff meetings, the Integrated Human Resources Management Board, quarterly HR statistics reviews, and leadership development oversight boards to ensure integration of EEO and diversity policies in Departmental operations.
In FY 2014, the DAS for Diversity and Inclusion published the VA Reasonable Accommodations (RA) Handbook and VA EEO Planning and Barrier Analysis Policy Handbook, in November 2013 and October 2014, respectively, which provides authoritative guidance on MD 715, Barrier Analysis and EEO Action Planning, in support of VA Directive 5975 on Diversity and Inclusion.
The VA Diversity Council commissioned the National Center for Organization Development to perform a follow-up analysis to validate its findings in its original study “Exploring Disparate Perceptions of Fairness and Empowerment by Gender and Race/Ethnicity within the VA Workforce and SES.” EEO and diversity policies and initiatives were widely communicated through ODI’s expansive nationwide communication vehicles, including the monthly Diversity News video broadcast, weekly NewsLink summaries, bi-monthly Diversity@Work newsletters, technical assistance publications, and the redesigned ODI internet Web pages.
VA signed a Memorandum of Understanding to establish a mutually beneficial partnership with the African American Federal Executive Association (AAFEA), and the Asian American Government Executives Network (AAGEN) to establish a partnership to collaborate, perform outreach, and share resources to promote diversity and inclusion in VA’s senior leadership.
In FY 2014, VA’s ODI and Office of General Counsel coordinated with White House Counsel and Department of Justice lawyers on the development of policy guidance on Religious Exercise and Expression in the VA workplace The final Guidance was issued VA-wide on November 7, 2014.
FY 2014 was a record breaking year for the VA National Diversity Intern Program (NDIP). The NDIP is a program that facilitates the hiring of a diverse group of students to the VA workforce. In FY 2014, over 200 talented student interns from diverse institutions of postsecondary education in a variety of professional fields were acquired at the VA. This program, administered by ODI, serves to build a pipeline of diverse candidates for future VA employment.
During FY 2014, ODI’s signature inclusion program, the MyCareer@VA Day program expanded to three more facilities: the Board of Veterans’ Appeals (BVA), VA Maryland Healthcare System (Baltimore), and Boston VA Healthcare System. This program serves to assist employees in overcoming obstacles and navigating their career paths toward career advancement. Facilities with high concentrations of diverse groups at lower pay grades were targeted for this program.
The VHA Equal Employment Opportunity/Affirmative Employment Office (EEO/AEO) Diversity and Inclusion Subcommittee disseminated quarterly information to all the VISN Directors on the VHA’s EEO program and share best business practices. Nine graduates from the 2012 EEO Technical Career Field (TCF) Class were successfully placed into EEO Manager/Specialist positions within VHA. Five trainees from the 2013 Program have completed their first year of the program and continue to receive specific training as described in their Individual Development Plan. The 2014
Executive Summary
DEPARTMENT OF VETERANS AFFAIRS
12

EEO TCF Program hired 10 trainees who began their training in the summer of 2014. VHA established a collaborative partnership with the National Council of Hispanic Employment Program Managers (NCHEPM) to access Hispanic Employment Program Manager (HEPM) resources from other external federal agencies.
VBA’s New York Regional Office partnered with the Vocational Rehabilitation & Employment Division and NY State Department of Labor to obtain an applicant pool of qualified candidates with targeted disabilities. This regional office also includes VA employment information as part of its Transition Assistance Program (TAP) briefings to returning service members for the purpose of removing barriers to employment for Veterans with disabilities and targeted disabilities. The San Juan and Waco regional offices both participated in the HERO Program to hire qualified Veterans.
The NCA EEO Office remains under the office of the Under Secretary for Memorial Affairs. The NCA EEO Manager meets with the Acting USMA weekly on diversity initiatives and other EEO topics. The EEO Director also attends senior staff meetings. The Acting USMA is also briefed on EEO objectives contained in the strategic plan which is reviewed and updated during the monthly strategic plan meeting. NCA’s EEO Office and hiring officials also participated in an on-line training titled “Training for Hiring Managers, The Hiring Process.”
NCA’s EEO Office strengthened its partnership with the Human Resources department, and the Labor and Employee Relations department, and other key departments. EEO was consulted on difficult issues dealing with reasonable accommodations, alleged discrimination, and other challenging areas with senior officials, subject matter experts (SMEs), and the Office of General Counsel (OGC) to determine the best course of action. In FY 2014, NCA selected fifteen applicants to attend the year-long Cemetery Director Intern Program. Twelve (80 percent) were Veterans and two were Schedule A hires. Fourteen of this diverse group graduated and were assigned to leadership positions at national cemeteries nationwide. NCA’s Apprenticeship Program, established in 2012, supports the VA’s strategic priority of ending Veteran homelessness by 2015, as well as President Obama's Veterans Employment Initiative (Executive Order 13518). The first class of apprentices was appointed in October 2012 and 13 graduated in November 2013. A second cohort matriculated in November 2013 and will graduate in December 2014. This group has experienced a dramatic increase in retention over the initial class, most in part due to improved screening of participants.
During FY 2014, NCA initiated the development of plans to create nationwide Employee Resource Groups (ERG) in FY 2015. This will also include a Veterans’ ERG. NCA’s ERG functions will include participating in the onboarding process by serving as a resource to new employees; providing coaching and mentoring for new employees; and assisting in the nation-wide recruitment and retention program to be developed in FY15.
The Office of Information Technology (OIT) developed its own Diversity and Inclusion Strategic plan, which aligns with VA’s Diversity and Inclusion Strategic Plan.
MANAGEMENT AND PROGRAM ACCOUNTABILITY: ODI conducted quarterly MD-715 progress review meetings with all Administrations, the Office of Information Technology and VACO and
Executive Summary
DEPARTMENT OF VETERANS AFFAIRS
13

developed standard monthly diversity reports for distribution to VACO Staff Offices and the Administrations. ODI also performed six on-site EEO Technical Assistance Reviews (TAR) at selected field facilities to analyze hires, separations, promotions, EEO complaints, and employee survey results systematically to identify potential EEO barriers and share best practices. ODI continued to report EEO workforce statistics to the senior leadership through monthly and quarterly workforce diversity reports and briefings. ODI prepared and submitted the Department’s EEO status and plans to EEOC in accordance with MD-715 and produced and published the VA Diversity and Inclusion FY 2012 report documenting the accomplishments and outcomes of meeting the VA Diversity and Inclusion Strategic Plan. The Office of Special Counsel certified VA’s Whistleblower Policy. This certified policy has been integrated in all VA internet and intranet sites.
ODI conducted six national outreach events in collaboration with its affinity group partners to build a diverse and inclusive workforce in VA and administered six TARs of VA facilities to ensure compliance with mandated EEO, and Diversity and Inclusion requirements. ODI also partnered with Administrations and Staff Offices to conduct 12 outreach events to the Hispanic community and Hispanic Veterans.
ODI continued to provide training on RA and Schedule A hiring. ODI also provided centralized funding for RAs, which OPM has recognized as a best practice for the retention of IWTD. ODI also provides quarterly hiring updates by Administration subcomponents to the VA leadership. VA hired 11 students under VA’s centralized Workforce Recruitment Program (WRP) for college students with disabilities. These strategies contributed a marginal increase in VA's employment of IWTD (permanent and temporary) from 1.99 percent in FY 2013 to 2.10 percent in FY 2014. The employment of these strategies was also instrumental in helping VA make strides in meeting the Secretary's 3 percent hiring goal for IWTD.
ODI has been working with OPM to refine the applicant data format and accurately differentiate applicant hire date from applicants for internal competitive promotions and increase usability of the applicant data.
To support leadership accountability, ODI’s newly developed Diversity Index Methodology was further refined in the new HR&A dashboard to allow managers and EEO specialists the drill down capability at the facility level. This allows managers and EEO specialists to view five-year trends of the Diversity Index at the facility level. Eleven VISN directors conducted a Peer Review pilot project during FY 2013 and FY 2014, which identified the top 5 trends in VHA EEO Programs. VHA EEO/AEO reviewed the pilot program and determined the outcomes support continuance of this program in FY 2015 and beyond. Each VHA VISN will be required to conduct a minimum of one Peer Review in FY 2015. EEO/AEO will continue to monitor completion and review reports in order to identify additional training needs within VHA.
VBA integrated the mandatory EEO, Diversity and Inclusion Element in Senior Executive Service performance standards. The inclusion of this element requires senior leadership to be rated on their effectiveness in implementing and managing EEO programs. VBA has a Local Reasonable
Executive Summary
DEPARTMENT OF VETERANS AFFAIRS
14

Accommodation Coordinator (LRAC) at each RO and Central Office to provide guidance and process reasonable accommodation requests. Additionally, VBA has a Reasonable Accommodation Coordinator who oversees the program and works closely with ODI to ensure LRACs are informed of policy changes. In FY 2014, VBA continued to require all LRACs to record each stage of requests in the tracking system, in order to monitor the processing time for requests and the overall efficiency of the program. LRACs also received training in FY 2014
NCA developed a new Merit Promotion Program (MPP) which consolidated all central office and Memorial Service Network (MSN) facilities under one plan. The implementation of the new MPP will provide the administration consistency and a more effective program. ODI expects NCA’s new MPP will serve as a model for the other VA administrations to develop their MPPs. NCA conducted site visits at various cemeteries addressing concerns about the work environment. During these visits, the NCA EEO Office facilitated the development of strategies with employees to improve the overall workforce.
In FY 2014, NCA initiated a cultural competency program. The National Cemetery Administration Scheduling Office (NCSO), located in St. Louis, Missouri, served as the pilot location due to new responsibilities of serving the Spanish-speaking community in Puerto Rico. As a result of this program, NCA was able to maintain excellent customer service to its clients.
PROACTIVE PREVENTION OF UNLAWFUL DISCRIMINATION: In FY 2014, more than 32,000 (96.5 percent) managers and supervisors nationwide completed their biennial and mandatory EEO, Diversity and Inclusion, and Conflict Management Training (VA Talent Management System (TMS) Course 1328672, EEO, Diversity, and Conflict Management Training for Managers and Supervisors.). The course is an online, mandatory biennial training requirement that provides VA executives, managers, and supervisors with the knowledge and tools necessary to meet their legal obligations and supervisory responsibilities in the areas of EEO, RA, Diversity and Inclusion, Alternative Dispute Resolution (ADR), and Conflict Management. As a result of this and the other proactive prevention strategies described below, VA’s informal EEO Resolution Rate increased from 52 percent in FY 2013 to 53 percent in FY 2014.
In FY 14, VA’s ODI led the development of Whistleblower Protection and Prohibited Personnel Practices mandatory training for all managers and supervisors. Approximately 95 percent of the Department’s targeted supervisory level employees completed TMS Course 3883649, Whistleblower Rights and Protection and Prohibited Personnel Practices Training. The Department has required the completion of this learning program to be a mandatory biennial training for VA senior executives, managers, and supervisors that will provide them with the awareness and knowledge necessary to meet their legal obligations and supervisory responsibilities under the Whistleblower Protection Act (WPA) of 1989 and Whistleblower Protection Enhancement Act (WPEA) of 2012. This course meets the program requirements prescribed by the Office of Special Counsel (OSC) 2302(c) Certification Program and enabled the Department to meet its statutory obligation regarding informing VA employees of the rights and remedies available to them under the WPA, the WPEA, and related civil service laws.
Executive Summary
DEPARTMENT OF VETERANS AFFAIRS
15

Approximately 99.6 percent (335,679) of VA employees completed TMS Course 8872 Prevention of Workplace Harassment/No FEAR. This mandatory biennial training requirement for all VA employees is intended to meet the Department’s obligation under the Notification and Federal Employee Anti-discrimination and Retaliation Act of 2002, that all Federal employees receive training on their rights and responsibilities in the areas of EEO, non-discrimination, and Whistleblower protections. This course supports the Department’s focus on cultivating a fair, diverse, and harassment-free work environment. This course also provides the Department’s policy and practice regarding the Prevention of Sexual Harassment (POSH). Additionally, after consulting with the EEOC, VA created the framework for a new Anti-Harassment Program and Program Office, which stood up in ORM in December 2014. The Program is responsible for creating detailed procedures and guidance to managers and supervisors for proactively addressing allegations of harassment in the workplace.
During FY 2014, ODI continued to expand its partnership with VA Learning University (VALU). Working closely with VALU’s Career and Employee Development Directorate (CEDD), ODI provided the subject matter expertise enabling the 2QTR FY 2014 release of VA TMS 3866746, Cultural Competence and Your Career at VA. This one-hour, online learning program provides VA learners with a general awareness of the concepts of workforce diversity and workplace inclusion; it defines cultural competence and explains why these concepts are becoming increasingly important in the workplace. This course is an introductory complement of the Department’s “Interpersonal Effectiveness Learning Program.” ODI continues to provide CEDD subject matter expertise, which supports the dynamic development of: 1) “Diversity: Valuing Diversity in the Workplace,” a foundational level course that introduces the concepts of diversity in the workplace as well as techniques aimed at improving communication skills to build better working relationships, and 2) “Diversity: Fostering an Inclusive Culture,“ an intermediate level course that outlines methods for seeking out diverse ideal and alternative viewpoints.
ORM conducted numerous training and awareness programs in the area of ADR and increased its complaint resolution rate from 52 percent in FY 2013 to 53 percent in FY 2014. One strategy included disseminating ADR videos to educate parties on complaint processes and the value of ADR. During FY 2014, ODI expanded the delivery of customized EEO and Diversity and Inclusion learning events and organizational consultations. ODI conducted:
Over 125 face-to-face learning events at VA facilities nation-wide to over 4,500 VA employees to deliver content addressing civility and cultural competence.
Two customized learning events delivered to over 281 employees at the invitation of external Federal agencies and the Department of Defense. These events addressed LGBT issues with the intent of building awareness of Agency responsibilities under emerging legal obligations and shifting social perspectives.
26 New Employee Organization (NEO) briefings to acquaint new hires with VA policy and practice regarding EEO, Diversity and Inclusion, and RA.
Executive Summary
DEPARTMENT OF VETERANS AFFAIRS
16

Four new manager and supervisor learning events to prepare newly appointed VA managers and supervisors to execute their obligations to build a diverse workforce and sustain an Inclusive workplace.
Presentations at all VA Senior Leader Conferences to inform VA’s newly appointed members of the Senior Executive Service and Title 38 Equivalents of VA’s policy and Agency expectations to support institutions of VA Diversity and Inclusion values and strategies.
VHA’s EEO Institute conducted 21 Equal Employment Opportunity/Diversity and Inclusion classes during FY 2014. VHA EEO Managers, ADR Coordinators and Mediators participated in monthly calls conducted by ORM. VHA EEO Program Managers, Special Emphasis Program Managers, and HR staff received annual training on the VHA Special Emphasis Program Advisory Committee Strategic Plan.
In January 2014, VBA’s Office of Diversity Management (DM&EEO) sponsored Reasonable Accommodation Training for managers and supervisors. The purpose of this training was to provide participants with the legal requirements of RA and to guide them through the stages of the RA process including the interactive process. VA’s Office of General Counsel (OGC) presented the laws pertaining to RA and ODI provided each step of the process for RA requests in accordance with VA Handbook 5975.1 and EEOC provisions. DM&EEO also conducts a monthly EEO training class at VBA’s Training Academy in Baltimore for candidates enrolled in various leadership programs.
NCA has decreased the number of complaints filed in FY 2014. Informal complaints decreased by 61.36 percent and formal complaints decreased by 38.46 percent from the previous fiscal year. Additionally, NCA has implemented a pre-mediation discussion with RMO’s, managers, MSN directors, OGC, and subject matter experts to develop strategies to resolve complaints. This pre-mediation discussion has equipped management to be better prepared for mediations and provided opportunities for more creative solutions to resolve complaints.
EFFICIENCY: VA’s capability to process, track, and report data concerning the EEO process has been maintained through continued upgrades and the use of the Complaints Automated Tracking System (CATS). CATS allows ORM to track EEO complaint processing for each stage of the EEO complaint process from the initial, informal contact through closure. ORM continued to process counseling sessions below the requisite 30 days (23 days in FY 2014) for completion of the counseling process in which ADR was elected in an average of 64 days, well below the EEOC requirement of 90 days. This rate has marginally exceeded the investigation processing time of 180 days (193 days in FY 2014).
OEDCAs case inventory increased by 42 percent during FY 2014. In FY 2014, OEDCA issued 86 percent of its FADs within the 60-day regulatory time period where the complainant requested a FAD.
ORM’s ADR program has had an extremely positive impact on the efficiency of VA’s EEO program nationwide, with ADR being offered in 98 percent of all informal EEO complaints. The ADR election
Executive Summary
DEPARTMENT OF VETERANS AFFAIRS
17

rate of informal EEO complaints in which both VA and the aggrieved person agree to participate in ADR was 55 percent. ADR is used for both EEO and non-EEO disputes with very positive results:
Table 2. ADR in EEO Process
FY 2013 FY 2014Contacts 4,221 4,626Offers3 98% 98%Participation4 58% 55%
Table 3. ADR Outcomes
EEO Non EEOFY 2013 FY 2014 FY 2013 FY 2014
Completed 2,440 2,508 1,858 1,727Resolved 50% 49% 88% 85%
VA estimates that without early intervention, approximately 50 percent of the non-EEO disputes could become EEO complaints. ORM recognizes exemplary effort in managing conflict and resolving disputes within VA through an annual ADR awards program.
VHA has an active ADR Program with a 99 percent offer rate for EEO cases in FY 2014. Conflict coaching is recommended for all managers and supervisors to help them resolve workplace disputes at the earliest opportunity. Mediation was also offered for use in other forums, such as negotiated grievances, administrative grievances, Merit Systems Protection Board appeals, and EEOC hearings.
ORM conducted 12 Conflict Assessments in FY 2014. Offered as another tool to determine areas in which proactive measures may resolve disputes at the earliest opportunity, the Assessments provide leadership with in-depth, confidential feedback regarding employee concerns, root analysis of problem areas, and customized suggestions for resolution.
ORM provides all VA administrations access to the CATS, the ADR Tracker system, as well as the EEO, Diversity, and ADR Dashboard. These tracking systems are used to monitor and identify the status of EEO complaints, the complaint resolution process, and other information/data necessary to analyze complaint activity and historical trends. 3 ADR offer rate represents the percentage of informal EEO complaints in which VA offers the aggrieved person an opportunity to participate in ADR versus traditional counseling.4 ADR participation rate represents the percentage of informal EEO complaints in which both VA and the aggrieved person agree to participate in ADR.
Executive Summary
DEPARTMENT OF VETERANS AFFAIRS
18

VBA used ADR to facilitate early, effective and efficient resolution of workplace disputes and EEO complaints, which has resulted in a significant decrease of informal contacts in FY 2014 as shown above. VBA’s offer rate increased from 98 percent in 2013 to 99 percent in FY 2014. Both fiscal years are exceeding the benchmark of 80 percent of employees being offered ADR. The participation rate remained the same as FY 2013 at 59 percent, which exceeded the benchmark of 50 percent of employees participating in ADR. The resolution rate significantly increased from 43 percent in FY 2013 to 53.2 percent in FY 2014. VBA in FY 2014 exceeded the benchmark of 50 percent of those employees that participate in ADR resulting in resolution as compared to FY 2013 when the resolution rate was not met.
RESPONSIVENESS AND LEGAL COMPLIANCE: ODI, ORM, OEDCA, OHRM, and the Administrations share responsibility for responsiveness and legal compliance in the area of EEO. ORM enters hearing requests and appeal files through the EEOC Portal Hearings Electronic Case Processing System (HECAPS) and EEOC File Exchange (EFX). ORM’s use of digital files is fully compliant with EEOC requirements for HECAPS and EFX.
Workforce Composition
As the second largest Cabinet level department, VA is proud to be one of the most diverse agencies in the Federal Government. The Relevant Civilian Labor Force (RCLF) is the benchmark against which we measure the diversity of our workforce. Compared to the RCLF, VA’s workforce is at or above the RCLF representation in all areas except for White and Hispanic females, and Hispanic and Asian males. While the overall representation of most demographic groups increased in FY 2014, the proportional representation of Hispanic females increased marginally from 3.52 percent to 3.53 percent. The proportional representation of White females decreased from 35.58 percent to 35.17 percent. The proportional representation of Hispanic males increased from 3.10 percent to 3.15 percent. The proportional representation of Asian males increased from 2.75 percent to 2.81 percent. Figure 1 depicts VA’s current on-board representation as compared with the CLF and RCLF.
Figure 1. VA Onboard versus RCLF/CLF (Permanent and Temporary)
Executive Summary
DEPARTMENT OF VETERANS AFFAIRS
19

Hispan
ic Male
Hispan
ic Fem
ale
White Fe
male
Asian M
ale
White M
ale
Black o
r Afri
can Ameri
can M
ale
Black o
r Afri
can Ameri
can Fe
male
Asian Fe
male
Native
Hawaiia
n or Other
Pacific Is
lander
Male
Native
Hawaiia
n or Other
Pacific Is
lander
Female
American
Indian
or Alas
ka Nati
ve Male
American
Indian
or Alas
ka Nati
ve Male
Two or M
ore Race
s Male
Two or M
ore Race
s Fem
ale0.00%
5.00%
10.00%
15.00%
20.00%
25.00%
30.00%
35.00%
40.00%
45.00%
50.00%
LESS THAN EXPECT REPRE-SENTATION
Met or Exceeded Expected Representation
CLF includes all occupations and RCLF is limited to VA occupations in VA proportions. The Civilian Labor Force (CLF) consists of all U.S. citizens 16 years of age and over, excluding those in the Armed Forces, who are employed or unemployed and seeking employment in all U.S. occupations. The CLF does not include Puerto Rico or other U.S. territories. The Relevant Civilian Labor Force (RCLF) consists of all U.S. citizens 16 years of age and over, excluding those in the Armed Forces, who are employed in or unemployed and seeking employment in VA specific occupations. When the organization has a presence in Puerto Rico, the population of Puerto Rico is included.
.
We look at net change in order to determine whether the groups with low participation rates are increasing at the same rate or higher than the change for the total VA workforce. The net change for the total VA workforce in FY 2014 was a 3.25 percent increase, or 10,935 employees. At the end of FY 2014, VA’s workforce totaled 347,054 employees, including 29,969 temporary employees5. For the first time since EEOC’s MD 715 was enacted, the growth rate for all minority groups, excluding White women, exceeded the total workforce average growth rate. This is a “good” news story. ODI believes this is a testament to the success of improving the workforce diversity by focusing on outreach and retention programs to the historically under-represented race, ethnicity, and gender (REG) groups.5 This figure includes intermittent employees, so it is greater than the figure in Part B of this report which excludes intermittent employees.
Executive Summary
DEPARTMENT OF VETERANS AFFAIRS
20

The workforce growth rate for White males and females decreased. White females had a lower than expected representation rate (compared with the RCLF) and experienced a growth rate of 2.07 percent. White males experienced a growth rate of 2.85 percent and still exceeded its expected representation. VA will continue to place special emphasis on outreach and retention efforts for Hispanic males and females, White females, and Asian males given that they fall below their expected representation. Table 4 provides detail of the net changes of the total workforce by Race, Ethnicity, and Gender (REG). The net change for each REG is compared to the net change for the total number of employees. Net changes below the average net change for the entire workforce are highlighted in red.
Table 4. Net Change Analysis
All VA
TOTAL EMPLOYE
ES
RACE/ETHNICITY
Hispanic or Latino
Non-Hispanic or Latino
WhiteBlack or African
AmericanAsian
Native Hawaiian or Other Pacific
Islander
American Indian or
Alaska Native
Two or More Races/
Undisclosed
All male female male female male female male female male female male female male female
Net Change 3.25% 4.78% 3.51% 2.85% 2.07% 4.98% 3.54% 5.46% 5.38% 17.71% 12.27% 5.69% 7.70% 11.31% 14.92%
Net change is calculated by dividing the difference between the number of current employees and the number of employees in the prior year by the number of employees in the prior year.
Targeted Disabilities
In addition to examining the workforce by REG, we also review the data for IWTD6. Continuing with last year’s trend, the representation of IWTD (permanent and temporary) increased from 1.99 percent in FY 2013 to 2.10 percent in FY 2014, the highest among all cabinet level departments. The net change for this group’s population was a positive 9.13 percent, compared to 3.25 percent for the total VA workforce. We believe this increase is a testament to the success of VA’s focused efforts as guided by its FY 2012-2016 Diversity and Inclusion Strategic Plan, and the Secretary’s 3 percent hiring goal for IWTD. In addition, VA annually resurveys its workforce, focusing on the disability status of its employees. The resurvey was executed on a volunteer self-identification basis. Permanent employees with targeted disabilities increased from 1.92 percent in FY 2013 to 2.08 percent of the VA permanent workforce in FY 2014. VA will continue to monitor, monthly, the onboard and hiring statistics for IWTD as a performance metric and to determine if VA policy goals for IWTD should be adjusted to higher goals starting in FY 2016. Approximately 62 percent of VA’s employees with targeted disabilities are Veterans.
According to Figure 2, from FY 2013 to FY 2014 there was an increase of employees with targeted disabilities who self-identified as having a psychiatric disability. Individuals with psychiatric disabilities are the largest component (55.61 percent) of IWTD. The number of employees who identified with a 6 Disabilities: The Federal Government, as a matter of policy, has identified for special emphasis in affirmative action programs. They are deafness, blindness, partial paralysis, complete paralysis, missing extremities, severe intellectual disabilities, psychiatric disabilities, epilepsy, and dwarfism. There are no RCLF standards for targeted disabilities categories. Census does not track these categories.
Executive Summary
DEPARTMENT OF VETERANS AFFAIRS
21

psychiatric disability increased from 3,716 in FY 2013 to 4,266 in FY 2014. This group also had the highest involuntary separation rate of all EEO groups, compared to their onboard rate. Many of these employees are disabled Veterans. The separation rate for permanent employees with targeted disabilities is of particular concern. Although they represented 1.99 percent of the permanent workforce at the beginning of FY 2014, their voluntary separation rate during the fiscal year was 1.42 percent, and their involuntary separation rate was 5.22 percent. This high separation rate does impact VA’s efforts to maintain its 2 percent or higher onboard goal for employees with targeted disabilities.
Figure 2. Comparison of Targeted Disabilities by Type of Disability.
Hearing
Vision
Missing E
xtemities
Partial
Paralys
is
Complete P
araysi
s
Epilep
sy
Severe
Intel
lectual
Disabilit
y
Psychiat
ric Disa
bility
Dwarfism
0500
1000150020002500300035004000
368 532 224 577170
585 289
3149
99398 527234
640172
605300
3716
90 FY 2012FY 2013
Secretary McDonald is committed to maintaining the 2 percent onboard goal for this group. For FY 2014, Secretary McDonald is also committed to setting the hiring goal at 3 percent. Further corrective strategies will focus on: 1) Develop enhanced capabilities in the Reasonable Accommodations Compliance System; 2) Continued training to HR and managers on the use of Schedule A and VA’s RA procedures; and 3) Improving advancement opportunities as part of a retention strategy.
Diversity and Inclusion Indices
In FY 2012, ODI developed and implemented two innovative methods for measuring workforce diversity and workplace inclusion. The new methods provide leadership with the capability to view quickly how well their diversity and inclusion program is performing versus relying on a series of 28 analytical tables and employment survey results to interpret. The Diversity Index measures the convergence of an organization’s aggregate workforce representation by race, ethnicity, gender (REG) with the CLF or RCLF, as applicable. The metric can be expanded to include other dimensions such as education and disability once baselines are established. The algorithm calculates the aggregate mean of the ratios of an agency’s workforce representation by REG with the corresponding
Executive Summary
DEPARTMENT OF VETERANS AFFAIRS
22

representation in the RCLF or CLF. The result is a single metric on a scale of 0 to 100 percent, reflecting an organization’s overall diversity. Where appropriate, the algorithm is applied to the RCLF to isolate the qualified relevant labor force. This method provides a more appropriate, efficient metric to gauge Federal workforce diversity. An index value of 100 percent means the organization’s diversity aligns perfectly with the RCLF or CLF. VA’s monthly Diversity Index for FY 2014 is provided at Figure 3. Note: This index currently focuses on REG and does not track the disability aspect of diversity. The monthly Diversity Index is incorporated within the Monthly Performance Review process.
Figure 3. VA’s FY 2014 Diversity Index
Oct Nov Dec Jan Feb Mar Apr May Jun Jul Aug Sep0.00%
10.00%
20.00%
30.00%
40.00%
50.00%
60.00%
70.00%
80.00%
90.00%
100.00%
VA’s Inclusion Index is a measure of organizational inclusion based on employee responses to empirically validated items in the Federal Employee Viewpoint Survey (FEVS). It is calculated as the ratio of the total favorable responses to the total responses utilizing OPM’s weighted survey results. In FY 2013, OPM adopted VA’s methodology to measure workforce inclusion for the entire Federal Government and relabeled it as the Inclusion Quotient. The Inclusion Indices for FY 2014 are provided at Table 5.
Executive Summary
DEPARTMENT OF VETERANS AFFAIRS
23

Table 5. Inclusion Index
FY 2013 FY 2014VA-wide 55% 53%VHA 55% 53%VBA 52% 50%NCA 60% 61%VACO 54% 54%OIG 68% 70%
Barrier Analysis
The EEOC guidance regarding barriers to full participation refers to the indication of a possible barrier as a “trigger.” VA has identified six primary triggers in its barrier analysis, which are addressed in Part I of this report. VA is able to track and report on its barrier analyses and the impact of corrective strategies through its Web-based workforce data system, VHA Service Support Center applications (VSSC). In order to fully integrate VA’s Diversity and Inclusion Strategic Plan goals with Administration operations, ODI embedded the Department-wide goals into the objectives of the MD-715 Part I Plans. This was done to ensure that field components assume some accountability for Departmental goals because their EEO offices do not report directly to ODI. While the goals are Department-wide, subcomponent organizations were encouraged to identify and address their organization-specific triggers in their Part I Plans. This was communicated through quarterly Microsoft Live Web-based technical assistance meetings with field entities to assist them in the development of their organization-specific EEO Plans.
The six triggers identified in the VA Part I plans are:
1. Less than expected representation of White females: Compared with the respective RCLFs, White females (permanent and temporary employees) had less than expected representation in the VA workforce. White women are 35.17 percent (20.33 percent below the RCLF of 45.50 percent). This less than expected participation trickles down to Administration level (VHA, VBA, NCA, and VACO). The RCLF for White females increased from 45.38 percent to 45.50 percent. A more detailed trigger and barrier analysis is provided at Part I of this report.
2. Less than expected representation of Hispanics: Compared with the respective RCLF, Hispanic males and females (permanent and temporary employees) had less than expected representation in the VA workforce. In VA, Hispanic males represent 3.15 percent of the permanent and temporary workforce and Hispanic females represent 3.53 percent, whereas Hispanic males represent 3.89 percent of the RCLF and 5.17 percent of the CLF and Hispanic females represent 5.70 percent and 4.79 percent, respectively. The net change for Hispanic males (4.78 percent) and females (3.51 percent) is above the net change for the total workforce (3.25 percent), meaning that Hispanic males and females are growing at a rate greater than that of the total workforce. This less than expected participation trickles down to
Executive Summary
DEPARTMENT OF VETERANS AFFAIRS
24

the Administration level (VHA, VBA, NCA, and VACO). A more detailed trigger and barrier analysis is provided at Part I of this report.
3. Less than expected representation of Asian males: Compared with the respective RCLF, Asian males (permanent and temporary employees) had less than expected representation in the VA workforce. In VA, Asian males represent 2.81 percent of the permanent and temporary workforce, whereas Asian males represent 2.95 percent of the RCLF. However, the net change for Asian males (5.46 percent) is above the net change for the total workforce (3.25 percent), meaning that Asian males are growing at a rate above that of the total workforce. This less than expected participation trickles down to Administration level (VHA, VBA, NCA, and VACO). A more detailed trigger and barrier analysis is provided at Part I of this report.
4. Disparate Promotion Rates: Black females experienced lower promotion rates (11.51 percent) as compared to the overall promotion rate (13.24 percent) for permanent entry level positions (GS 3-8). Black females also had lower promotion rates (6.10 percent) as compared to the overall promotion rate (6.36 percent) for permanent mid-level positions (GS 9-12). For permanent senior level positions (GS 13-15), Black females had lower promotion rates (7.37 percent) as compared to the overall promotion rate (8.15 percent). Black females experienced low promotion rates at the entry level (grades 3 thru 8) and senior level (grades 13 thru 15) when compared to the overall promotion rate at each level. The promotion rate for Black females is at the entry level was 8.17 percent while the overall promotion rate at the entry level was 9.08 percent. The promotion rate for Black females is at the senior level was 6.72 percent while the overall promotion rate at the senior level was 7.01 percent. Black females and Native Hawaiian/Pacific Islander males (NHPIM) experienced a low promotion rate only at the senior level. The promotion rates for Black females and NHPIMs were 6.62 percent and 2.56 percent, respectively. Asian females experienced low promotion rates at the entry level and mid-level only, 4.56 percent and 19.16 percent, respectively. A more detailed trigger and barrier analysis is provided at Part I of this report.
5. High volume of discrimination complaints: The per capita filing rate at the informal stage increased from 1.26 percent to 1.33 percent from FY 2013 to FY 2014, while the formal complaint filing rate remained at 0.61 percent. These rates remain slightly higher than the government-wide rates of 1.1 percent and .5 percent, respectively. In FY 2014, the number of findings in discrimination decreased (37 in FY 2013 and 31 in FY 2014). Reprisal, disability, and race were the most prevalent bases of discrimination in those findings. Recommended corrective strategies include increasing early resolution of EEO complaints through counseling and ADR, reviewing findings and incorporating lessons learned into training, and increasing EEO and consultative services. A more detailed trigger and barrier analysis is provided at Part I of this report.
6. Less than expected representation in the SES Cadre: With the exception of White and Hispanic males, all the other race/ethnicity and gender groups fall below their expected representation. The representation of White men alone is about double the expected representation and most likely serves as the catalyst for the less than expected representation
Executive Summary
DEPARTMENT OF VETERANS AFFAIRS
25

for the other demographic groups. A more detailed trigger and barrier analysis is provided at Part I of this report.
Summary of Planned Objectives for FY 2015
The following list summarizes the planned initiatives laid out in Part H, I, and J for FY 2015 to eliminate identified barriers or correct program deficiencies.
Launch a structured anti-harassment program and program office in ORM. VA will continue to partner with AAPI affinity organizations such as Federal Asian Pacific
American Council (FAPAC) and Asian American Government Executive Network (AAGEN) to enhance AAPI outreach and leadership development programs and leverage VA’s National Diversity Internship and Pathways Programs.
Expand the ODI/VALU Pilot program on MyCareer@VA to additional facilities focusing on career mapping strategies to facilitate career advancement for all groups.
Track VA-wide disciplinary actions taken against RMOs in findings of discrimination and report as appropriate in MD 715 Part G.
Work with VACO and Administrations to develop a single and streamlined merit promotion plan for all Administrations and Field Offices.
Increase the number of Conflict Assessments conducted to provide insight that may improve workplaces and reduce disputes and complaints.
Continue implementation of training evaluation instrument and metrics. Continue refinement of USA Staffing Applicant Flow System in VA. Update VSSC to track participation in VA leadership development programs by REG in VA’s
TMS. Strengthen VA’s Special Emphasis Programs through virtual education and training programs
- training forums can be conducted on a quarterly and annual basis. Develop virtual leadership and professional development forums to enhance VA’s Special
Employment Program Manager’s capacity in the areas of outreach and retention. Improve standard reporting features in RA Compliance tracking system and implement system
enhancements VA-wide. Implement an exit interview process to capture responses by demographics for those
separating from VA. Continue to streamline the FAD process.
Executive Summary
DEPARTMENT OF VETERANS AFFAIRS
26

CERTIFICATION of ESTABLISHMENT of CONTINUINGEQUAL EMPLOYMENT OPPORTUNITY PROGRAMS
I, Gina Farrisee, Assistant Secretary for Human Resources and Administration, am the
(Insert name above)
Principal EEO Director/Official for Department of Veterans Affairs
(Insert Agency/Component Name above)
The agency has conducted an annual self-assessment of Section 717 and Section 501 programs against the essential elements as prescribed by EEO MD-715. If an essential element was not fully compliant with the standards of EEO MD-715, a further evaluation was conducted and, as appropriate, EEO Plans for Attaining the Essential Elements of a Model EEO Program, are included with this Federal Agency Annual EEO Program Status Report.
The agency has also analyzed its workforce profiles and conducted barrier analyses aimed at detecting whether any management or personnel policy, procedure or practice is operating to disadvantage any group based on race, national origin, gender or disability. EEO Plans to Eliminate Identified Barriers, as appropriate, are included with this Federal Agency Annual EEO Program Status Report.
I certify that proper documentation of this assessment is in place and is being maintained for EEOC review upon request.
Signature of Principal EEO Director/OfficialCertifies that this Federal Agency Annual EEO Program Status Report is in compliance with EEO MD-715.
Date
Signature of Agency Head or Agency Head Designee Date
EEOC FORM715-01PART F
U.S. Equal Employment Opportunity CommissionFEDERAL AGENCY ANNUAL
EEO PROGRAM STATUS REPORT
27

(This Page Intentionally Left Blank)
28

EEOC FORM715-01 PART G
National
U.S. Equal Employment Opportunity CommissionFEDERAL Agency ANNUAL EEO PROGRAM STATUS REPORT
AGENCY SELF-ASSESSMENT CHECKLIST MEASURING ESSENTIAL ELEMENTS
Report Generated on 11/17/2014
Who contributed to the responses?
#
Agency Secretary 0
Agency HR Chief 1
Agency EEO/Diversity Manager
1
Agency Disabilities Manager 1
Agency Program Manager 3
Resolution Management 1
Human Resources Management
1
Others who contributed to the responses: Has the Agency Secretary given written approval of these responses? Yes
XNo
29

Essential Element A: DEMONSTRATED COMMITMENT FROM AGENCY LEADERSHIPRequires the Agency head to issue written policy statements ensuring a workplace free of discriminatory harassment and a commitment to
equal employment opportunity.
Compliance Indicator
EEO policy statements are up-to-date.
Measure has been met
Measures Yes No
1. Was the EEO policy Statement issued within 9 months of the installation of the Agency Head?** Robert A. McDonald became the 8th Secretary of VA and was confirmed by the Senate on July 29, 2014. There was insufficient time and resources available to re-issue new EEO Policy Statement during the final 2 months of this reporting period. Anticipate the EEO policy to be revised and re-issued by March 31, 2015.
Yes
XNo
2. During the current Agency Head's tenure, has the EEO policy Statement been re-issued annually?** EEO Policy Statement was last issued on June 11, 2014. The next re-issuance is planned for no later than March 31, 2015.
Yes
XNo
3. Are new employees provided a copy of the EEO policy statement during orientation? Yes
XNo
4. When an employee is promoted into the supervisory ranks, is s/he provided a copy of the EEO policy statement? Yes
XNo
Compliance Indicator
EEO policy statements have been communicated to all employees.
Measure has been met
Measures Yes No
5. Have the heads of subordinate reporting components communicated support of all Agency EEO policies through the ranks?
Yes
XNo
6. Has the Agency made written materials available to all employees and applicants, informing them of the variety of EEO programs and administrative and judicial remedial procedures available to them?
Yes
XNo
7. Has the Agency prominently posted such written materials in all personnel offices, EEO offices, and on the Agency's internal Website? [see 29 CFR §1614.102(b)(5)]
Yes
XNo
Compliance Indicator
Agency EEO policy is vigorously enforced by Agency management.
Measure has been met
Measures Yes No
Are managers and supervisors evaluated on their commitment to Agency EEO policies and principles, including their efforts to:
8. resolve problems/disagreements and other conflicts in their respective work environments as they arise?** VA stresses compliance with these guidelines but has not identified a method to measure.
Yes
XNo
9. address concerns, whether perceived or real, raised by employees and following-up with appropriate action to correct or eliminate tension in the workplace?** VA stresses compliance with these guidelines but has not identified a method to measure.
Yes
XNo
30

10. support the Agency's EEO program through allocation of mission personnel to participate in community out-reach and recruitment programs with private employers, public schools and universities?** VA stresses compliance with these guidelines but has not identified a method to measure.
Yes
XNo
11. ensure full cooperation of employees under his/her supervision with EEO office officials such as EEO Counselors, EEO Investigators, etc.?
Yes
XNo
12. ensure a workplace that is free from all forms of discrimination, harassment and retaliation? Yes
XNo
13. ensure that subordinate supervisors have effective managerial, communication and interpersonal skills in order to supervise most effectively in a workplace with diverse employees and avoid disputes arising from ineffective communications?
Yes
XNo
14. ensure the provision of requested religious accommodations when such accommodations do not cause an undue hardship?
Yes
XNo
15. ensure the provision of requested disability accommodations to qualified individuals with disabilities when such accommodations do not cause an undue hardship?
Yes
XNo
16. Have all employees been informed about what behaviors are inappropriate in the workplace and that this behavior may result in disciplinary actions?
Yes
XNo
17. Describe what means were utilized by the Agency to so inform its workforce about the penalties for unacceptable behavior.** Information is posted on web pages, in the form of policy statements, training materials, through VA-wide communications media (newsletters, broadcasts, etc.), and through bulletin board postings of findings of discrimination. New employees are briefed during on-boarding process.
Yes
X
No
18. Have the procedures for reasonable accommodation for individuals with disabilities been made readily available/accessible to all employees by disseminating such procedures during orientation of new employees and by making such procedures available on the World Wide Web or Internet?
Yes
XNo
19. Have managers and supervisor been trained on their responsibilities under the procedures for reasonable accommodation?
Yes
XNo
31

Essential Element B: INTEGRATION OF EEO INTO THE AGENCY'S STRATEGIC MISSIONRequires that the Agency's EEO programs be organized and structured to maintain a workplace that is free from discrimination in any of the
Agency's policies, procedures or practices and supports the Agency's strategic mission.
Compliance Indicator The reporting structure for the EEO Program provides the Principal EEO Official with appropriate authority and resources to effectively carry out a successful EEO
Program.
Measure has been met
Measures Yes No
20. Is the EEO Manager/Officer under the immediate supervision of the Agency head official?(For example, does the Regional EEO Officer report to the Regional Administrator?)
Yes
XNo
21. Are the duties and responsibilities of EEO staff clearly defined? Yes
XNo
22. Does the EEO staff have the knowledge, skills, and abilities to carry out the duties and responsibilities of their positions? Yes
XNo
23. If the facility has 2nd level reporting components, are there organizational charts that clearly define the reporting structure for EEO programs?** Each VA administration is required to submit a separate MD 715 report which includes an organization chart with the EEO program office separately identified.
Yes
XNo
24. If the facility has 2nd level reporting components, does the facility-wide EEO Manager have authority for the EEO programs within the subordinate reporting components? If not, please describe how EEO program authority is delegated to subordinate reporting components.
Yes
XNo
Compliance Indicator The EEO Manager and other EEO professional staff responsible for EEO programs have regular and effective means of informing the facility head and senior
management officials of the status of EEO programs and are involved in, and consulted on, management/personnel actions.
Measure has been met
Measures Yes No
25. Does the EEO Manager have a regular and effective means of informing the facility head and other top management officials of the effectiveness, efficiency and legal compliance of the facility's EEO program?
Yes
XNo
26. Following the submission of the immediately preceding FORM 715-01, did the EEO Director/Officer present to the head of the facility and other senior officials the "EEO state of the Facility" briefing covering all components of the EEO report, including an assessment of the performance of the facility in each of the six elements of the Model EEO Program and a report on the progress of the facility in completing its barrier analysis including any barriers it identified and/or eliminated or reduced the impact of?** State of the Agency brief provided June 2014 to Acting Secretary Sloan Gibson. Robert A. McDonald became the 8th Secretary of VA and was confirmed by the Senate on July 29, 2014. Sloan Gibson is now the Deputy Secretary.
Yes
XNo
27. Are EEO program officials present during facility deliberations prior to decisions regarding recruitment strategies, vacancy projections, succession planning, selections for training/career development opportunities, and other workforce changes?
Yes
XNo
28. Does the facility consider whether any group of employees or applicants might be negatively impacted prior to making human resource decisions such as re-organizations and re-alignments?
Yes
XNo
29. Are management/personnel policies, procedures and practices examined at regular intervals to assess whether there are hidden impediments to the realization of equality of opportunity for any group(s) of employees or applicants? [see 29 C.F.R. § 1614.102(b)(3)]
Yes
XNo
32

30. Is the EEO Manager included in the facility's strategic planning, especially the facility's human capital plan, regarding succession planning, training, etc., to ensure that EEO concerns are integrated into the facility's strategic mission?
Yes
XNo
Compliance IndicatorThe facility has committed sufficient human resources and budget allocations to
its EEO programs to ensure successful operation.
Measure has been met
Measures Yes No
31. Does the EEO Manager have the authority and funding to ensure implementation of facility EEO action plans to improve EEO program efficiency and/or eliminate identified barriers to the realization of equality of opportunity?
Yes
XNo
32. Are sufficient personnel resources allocated to the EEO Program to ensure that facility self-assessments and self-analyses prescribed by EEO MD-715 are conducted annually and to maintain an effective complaint processing system?
Yes
XNo
33. Are statutory/regulatory EEO related Special Emphasis Programs sufficiently staffed? Yes
XNo
34. Federal Women's Program - 5 U.S.C. 7201; 38 U.S.C. 4214; Title 5 CFR, Subpart B, 720.204 Yes
XNo
35. Hispanic Employment Program - Title 5 CFR, Subpart B, 720.204 Yes
XNo
36. People With Disabilities Program Manager; Selective Placement Program for Individuals With Disabilities - Section 501 of the Rehabilitation Act; Title 5 U.S.C. Subpart B, Chapter 31, Subchapter I-3102; 5 CFR 213.3102(t) and (u); 5 CFR 315.709
Yes
XNo
37. Are other facility special emphasis programs monitored by the EEO Office for coordination and compliance with EEO guidelines and principles, such as FEORP - 5 CFR 720; Veterans Employment Programs; and Black/African American; American Indian/Alaska Native, Asian American/Pacific Islander programs?
Yes
XNo
38. Are there sufficient resources to enable the facility to conduct a thorough barrier analysis of its workforce, including the provision of adequate data collection and tracking systems?
Yes
XNo
39. Is there sufficient budget allocated to all employees to utilize, when desired, all EEO programs, including the complaint processing program and ADR, and to make a request for reasonable accommodation? (Including subordinate level reporting components?)
Yes
XNo
40. Has funding been secured for publication and distribution of EEO materials (e.g. harassment policies, EEO posters, reasonable accommodations procedures, etc.)?
Yes
XNo
41. Is there a central fund or other mechanism for funding supplies, equipment and services necessary to provide disability accommodations?
Yes
XNo
42. Does the facility fund major renovation projects to ensure timely compliance with Uniform Federal Accessibility Standards?** The Federal Accessibility Standards are superseded by the Architectural Barriers Act Accessibility Standards (ABAAS). Each VA facility has its own budget.
Yes
XNo
43. Is the EEO Program allocated sufficient resources to train all employees on EEO Programs, including administrative and judicial remedial procedures available to employees?
Yes
XNo
33

44. Is there sufficient funding to ensure the prominent posting of written materials in all personnel and EEO offices? Yes
XNo
Compliance IndicatorThe facility has committed sufficient human resources and budget allocations to
its EEO programs to ensure successful operation.
Measure has been met
Measures Yes No
45. Is there sufficient funding to ensure that all employees have access to this training and information? Yes
XNo
46. Is there sufficient funding to provide all managers and supervisors with training and periodic up-dates on their EEO responsibilities:
Yes No
47. for ensuring a workplace that is free from all forms of discrimination, including harassment and retaliation? Yes
XNo
48. to provide religious accommodations? Yes
XNo
49. to provide disability accommodations in accordance with the facility's written procedures? Yes
XNo
50. in the EEO discrimination complaint process?** Office of Resolution Management has sole responsibility
Yes
XNo
51. to participate in ADR?** Office of Resolution Management has sole responsibility
Yes
XNo
34

Essential Element C: MANAGEMENT AND PROGRAM ACCOUNTABILITYThis element requires the facility Head to hold all managers, supervisors, and EEO Officials responsible for the effective implementation of the
facility's EEO Program and Plan.
Compliance Indicator EEO program officials advise and provide appropriate assistance to managers/supervisors about the
status of EEO programs within each manager's or supervisor's area or responsibility.
Measure has been met
Measures Yes No
52. Are regular (monthly/quarterly/semi-annually) EEO updates provided to management/supervisory officials by EEO program officials?
Yes
XNo
53. Do EEO program officials coordinate the development and implementation of EEO Plans with all appropriate facility managers to include facility Counsel, Human Resource Officials, Finance, and the Chief information Officer?
Yes
XNo
Compliance Indicator The Human Resources Manager and the EEO Manager meet regularly to assess whether personnel
programs, policies, and procedures are in conformity with instructions contained in EEOC management directives. [see 29 CFR § 1614.102(b)(3)]
Measure has been met
Measures Yes No
54. Have time-tables or schedules been established for the facility to review its Merit Promotion Program Policy and Procedures for systemic barriers that may be impeding full participation in promotion opportunities by all groups?
Yes
XNo
55. Have time-tables or schedules been established for the facility to review its Employee Recognition Awards Program and Procedures for systemic barriers that may be impeding full participation in the program by all groups?
Yes
XNo
56. Have time-tables or schedules been established for the facility to review its Employee Development/Training Programs for systemic barriers that may be impeding full participation in training opportunities by all groups?
Yes
XNo
Compliance Indicator When findings of discrimination are made, the facility explores whether or not disciplinary actions should
be taken.
Measure has been met
Measures Yes No
57. Does the facility have a disciplinary policy and/or a table of penalties that covers employees found to have committed discrimination?
Yes
XNo
58. Have all employees, supervisors, and managers been informed as to the penalties for being found to perpetrate discriminatory behavior or for taking personnel actions based upon a prohibited basis?
Yes
XNo
59. Has the facility, when appropriate, disciplined or sanctioned managers/supervisors or employees found to have discriminated over the past two years? If so, cite number found to have discriminated and list penalty /disciplinary action for each type of violation.**In FY 2013, there were a total of 44 findings of discrimination. In 37 of the 44 cases, the Department was ordered to consider taking disciplinary actions. Ultimately, discipline was taken in 16 of these complaints; nine of which were reported as counseling or admonishment. Data for FY 2014 will not be available in time for the submission of this report.** The Secretary issued a Memorandum, “Ensuring Appropriate Review of Findings of Discrimination,” dated June 4, 2014, establishing policy addressing the enforcement of appropriate disciplinary actions.
** Information to findings/actions taken in FY 2014 are limited at the time of this writing. Actions monitored to date are Management Determined Disciplinary Action Not Warranted (9); No Disciplinary Action Taken - Civil Suit Filed (1); Verbal Counseling (3); Written Counseling (2); Admonishment (1); Written Reprimand (1); Removed from Agency (1); RMO Left Agency prior to Decision (4); Training (2); Decision on Disciplinary Action is pending (9)
Yes
XNo
35

60. Does the facility promptly (within the established time frame) comply with EEOC, Merit Systems Protection Board, Federal Labor Relations Authority, labor arbitrators, and District Court orders?** Office of Resolution Management has sole responsibility for enforcing compliance with EEOC and OEDCA.
Yes
X
No
61. Does the facility review disability accommodation decisions/actions to ensure compliance with its written procedures and analyze the information tracked for trends, problems, etc.?
Yes No
X
36

Essential Element D: PROACTIVE PREVENTIONRequires that the facility head makes early efforts to prevent discriminatory actions and eliminate barriers to equal employment opportunity
in the workplace.
Compliance Indicator Analyses to identify and remove unnecessary barriers to employment are conducted
throughout the year.
Measure has been met
Measures Yes No
62. Do senior managers meet with and assist the EEO Manager and/or other EEO staff in the identification of barriers that may be impeding the realization of equal employment opportunity?
Yes
XNo
63. When barriers are identified, do senior managers develop and implement, with the assistance of the facility EEO office, facility EEO Action Plans to eliminate said barriers?
Yes
XNo
64. Do senior managers successfully implement EEO Action Plans and incorporate the EEO Action Plan Objectives into facility strategic plans?
Yes
XNo
65. Are trend analyses of workforce profiles conducted by race, national origin, sex and disability? Yes
XNo
66. Are trend analyses of the workforce's major occupations conducted by race, national origin, sex and disability? Yes
XNo
67. Are trends analyses of the workforce's grade level distribution conducted by race, national origin, sex and disability? Yes
XNo
68. Are trend analyses of the workforce's compensation and reward system conducted by race, national origin, sex and disability?** During FY 2013, minimal trend analysis was conducted on the compensation and reward system using Table A13. Current analytical tools do not possess the robust and discrete capabilities to drill into the data.
Yes
XNo
69. Are trend analyses of the effects of management/personnel policies, procedures and practices conducted by race, national origin, sex and disability?
Yes
XNo
Compliance Indicator
The use of Alternative Dispute Resolution (ADR) is encouraged by senior management.
Measure has been met
Measures Yes No
70. Are all employees encouraged to use ADR?** Office of Resolution Management has responsibility
Yes
XNo
71. Is the participation of supervisors and managers in the ADR process required?** Office of Resolution Management has responsibility to encourage parties to participate
Yes
XNo
37

Essential Element E: EFFICIENCYRequires that the facility head ensure that there are effective systems in place for evaluating the impact and effectiveness of the facility's EEO
Programs as well as an efficient and fair dispute resolution process.
Compliance Indicator The facility has sufficient staffing, funding, and authority to achieve the elimination of
identified barriers.
Measure has been met
Measures Yes No
72. Does the EEO Office employ personnel with adequate training and experience to conduct the analyses required by MD-715 and these instructions?
Yes
XNo
73. Has the facility implemented an adequate data collection and analysis systems that permit tracking of the information required by MD-715 and these instructions?
Yes
XNo
74. Have sufficient resources been provided to conduct effective audits of field facilities' efforts to achieve a model EEO program and eliminate discrimination under Title VII and the Rehabilitation Act?** Curtailment of future travel funds could negatively affect our ability to audit facilities.
Yes
XNo
75. Is there a designated facility official or other mechanism in place to coordinate or assist with processing requests for disability accommodations in all major components of the facility?
Yes
XNo
76. Are 90 percent of accommodation requests processed within the time frame set forth in the facility procedures for RA?
Yes No
X
Compliance Indicator The facility has an effective complaint tracking and monitoring system in place to increase
the effectiveness of the facility's EEO Programs.
Measure has been met
Measures Yes No
77. Does the facility use a complaint tracking and monitoring system that allows identification of the location and status of complaints and length of time elapsed at each stage of the facility's complaint resolution process?** Office of Resolution Management has sole responsibility
Yes
XNo
78. Does the facility's tracking system identify the issues and bases of the complaints, the aggrieved individuals/complainants, the involved management officials and other information to analyze complaint activity and trends?** Office of Resolution Management has sole responsibility
Yes
XNo
79. Does the facility hold contractors accountable for delay in counseling and investigation processing times?** Office of Resolution Management has sole responsibility
Yes
XNo
80. Does the facility monitor and ensure that new investigators, counselors, including contract and collateral duty investigators, receive the 32 hours of training required in accordance with EEO Management Directive MD-110?** Office of Resolution Management has sole responsibility
Yes
XNo
81. Does the facility monitor and ensure that experienced counselors, investigators, including contract and collateral duty investigators, receive the 8 hours of refresher training required on an annual basis in accordance with EEO Management Directive MD-110?** Office of Resolution Management has sole responsibility
Yes
XNo
Compliance Indicator
The facility has sufficient staffing, funding and authority to comply with the time frames in accordance with the EEOC (29 C.F.R. Part 1614) regulations for processing EEO complaints
Measure has been met
38

of employment discrimination.Measures Yes No
82. Are benchmarks in place that compares the facility's discrimination complaint processes with 29 C.F.R. Part 1614?** Office of Resolution Management has sole responsibility
Yes
XNo
83. Does the facility provide timely EEO counseling within 30 days of the initial request or within an agreed upon extension in writing, up to 60 days?** Office of Resolution Management has sole responsibility
Yes
XNo
84. Does the facility provide an aggrieved person with written notification of his/her rights and responsibilities in the EEO process in a timely fashion?** Office of Resolution Management has sole responsibility
Yes
XNo
85. Does the facility complete the investigations within the applicable prescribed time frame? Yes No
X
86. When a complainant requests a final Agency decision, does the facility issue the decision within 60 days of the request?
Yes No
X
87. When a complainant requests a hearing, does the facility immediately upon receipt of the request from the EEOC AJ forward the investigative file to the EEOC Hearing Office?** Office of Resolution Management has sole responsibility
Yes
XNo
88. When a settlement agreement is entered into, does the facility timely complete any obligations provided for in such agreements?** Office of Resolution Management has oversight responsibility only
Yes
XNo
89. Does the facility ensure timely compliance with EEOC AJ decisions which are not the subject of an appeal by the facility?** Office of Resolution Management has oversight responsibility only
Yes
XNo
Compliance Indicator There is an efficient and fair dispute resolution process and effective systems for evaluating
the impact and effectiveness of the facility's EEO complaint processing program.
Measure has been met
Measures Yes No
90. In accordance with 29 C.F.R. §1614.102(b), has the facility established an ADR Program during the pre-complaint and formal complaint stages of the EEO process?** Office of Resolution Management has oversight responsibility only
Yes
XNo
91. Does the facility require all managers and supervisors to receive ADR training in accordance with EEOC (29 C.F.R. Part 1614) regulations, with emphasis on the federal government's interest in encouraging mutual resolution of disputes and the benefits associated with utilizing ADR?** Office of Resolution Management has oversight responsibility only
Yes
XNo
92. After the facility has offered ADR and the complainant has elected to participate in ADR, are the managers required to participate?
Yes
XNo
93. Does the responsible management official directly involved in the dispute have settlement authority?** It should be noted that EEOC regulations do not allow for the responsible management official directly involved in the dispute to have settlement authority. It should be someone at a higher level with signature authority. No Part H is required.
Yes NoX
Compliance Indicator The facility has effective systems in place for maintaining and evaluating the impact and
effectiveness of its EEO programs.
Measure has been met
Measures Yes No
94. Does the facility have a system of management controls in place to ensure the timely, accurate, complete and Yes No
39

consistent reporting of EEO complaint data to the EEOC?X
95. Does the facility provide reasonable resources for the EEO complaint process to ensure efficient and successful operation in accordance with 29 C.F.R. § 1614.102(a) (1)?
Yes
XNo
96. Does the facility EEO office have management controls in place to monitor and ensure that the data received from Human Resources is accurate, timely received, and contains all the required data elements for submitting annual reports to the EEOC?
Yes
XNo
97. Do the facility's EEO programs address all of the laws enforced by the EEOC? Yes
XNo
98. Does the facility identify and monitor significant trends in complaint processing to determine whether the facility is meeting its obligations under Title VII and the Rehabilitation Act?** Office of Resolution Management has sole responsibility
Yes
XNo
99. Does the facility track recruitment efforts and analyze efforts to identify potential barriers in accordance with MD-715 standards?
Yes
XNo
100. Does the facility consult with other agencies of similar size on the effectiveness of their EEO programs to identify best practices and share ideas?
Yes
XNo
Compliance Indicator The facility ensures that the investigation and adjudication function of its complaint
resolution process are separate from its legal defense arm of facility or other offices with conflicting or competing interests.
Measure has been met
Measures Yes No
101. Are legal sufficiency reviews of EEO matters handled by a functional unit that is separate and apart from the unit which handles facility representation in EEO complaints?
Yes
XNo
102. Does the facility discrimination complaint process ensure a neutral adjudication function? Yes
XNo
103. If applicable, are processing time frames incorporated for the legal counsel's sufficiency review for timely processing of complaints?
Yes
XNo
40

Essential Element F: RESPONSIVENESS AND LEGAL COMPLIANCEThis element requires that federal agencies are in full compliance with EEO statutes and EEOC regulations, policy guidance, and other written
instructions.
Compliance Indicator Facility personnel are accountable for timely compliance with orders issued by EEOC
Administrative Judges.
Measure has been met
Measures Yes No
104. Does the facility have a system of management control to ensure that facility officials timely comply with any orders or directives issued by EEOC Administrative Judges?** Office of Resolution Management has oversight responsibility only
Yes
XNo
Compliance Indicator The facility's system of management controls ensures that the facility timely completes all
ordered corrective action and submits its compliance report to EEOC within 30 days of such completion.
Measure has been met
Measures Yes No
105. Does the agency have control over the payroll processing function of the agency? If Yes, answer the two questions below.
Yes No
X
106. Are there steps in place to guarantee responsive, timely, and predictable processing of ordered monetary relief?** Office of Resolution Management has responsibility for monitoring compliance. The facility is responsible for the processing.
Yes No
107. Are procedures in place to promptly process other forms of ordered relief?** Office of Resolution Management has oversight responsibility only. Facilities have responsibilities for processing.
Yes No
Compliance Indicator Facility personnel are accountable for the timely completion of actions required to comply
with orders of EEOC.
Measure has been met
Measures Yes No
108. Is compliance with EEOC orders encompassed in the performance standards of any facility employees?** Office of Resolution Management has oversight responsibility only
Yes
XNo
If so, please identify the employees by title in the comments section, and state how performance is measured.
109. Is the unit charged with the responsibility for compliance with EEOC orders located in the EEO office? If not, please identify the unit in which it is located, the number of employees in the unit, and their grade levels in the comments section.** Office of Resolution Management has oversight responsibility only
Yes
XNo
110. Have the involved employees received any formal training in EEO compliance?** Office of Resolution Management has oversight responsibility only
Yes
XNo
111. Does the facility promptly provide to the EEOC the following documentation for completing compliance: Yes No
112. Attorney Fees: Copy of check issued for attorney fees and /or a narrative statement by an appropriate facility official, or facility payment order dating the dollar amount of attorney fees paid?** Office of Resolution Management has oversight responsibility only
Yes
XNo
113. Awards: A narrative statement by an appropriate facility official stating the dollar amount and the criteria used to calculate the award?
Yes No
41
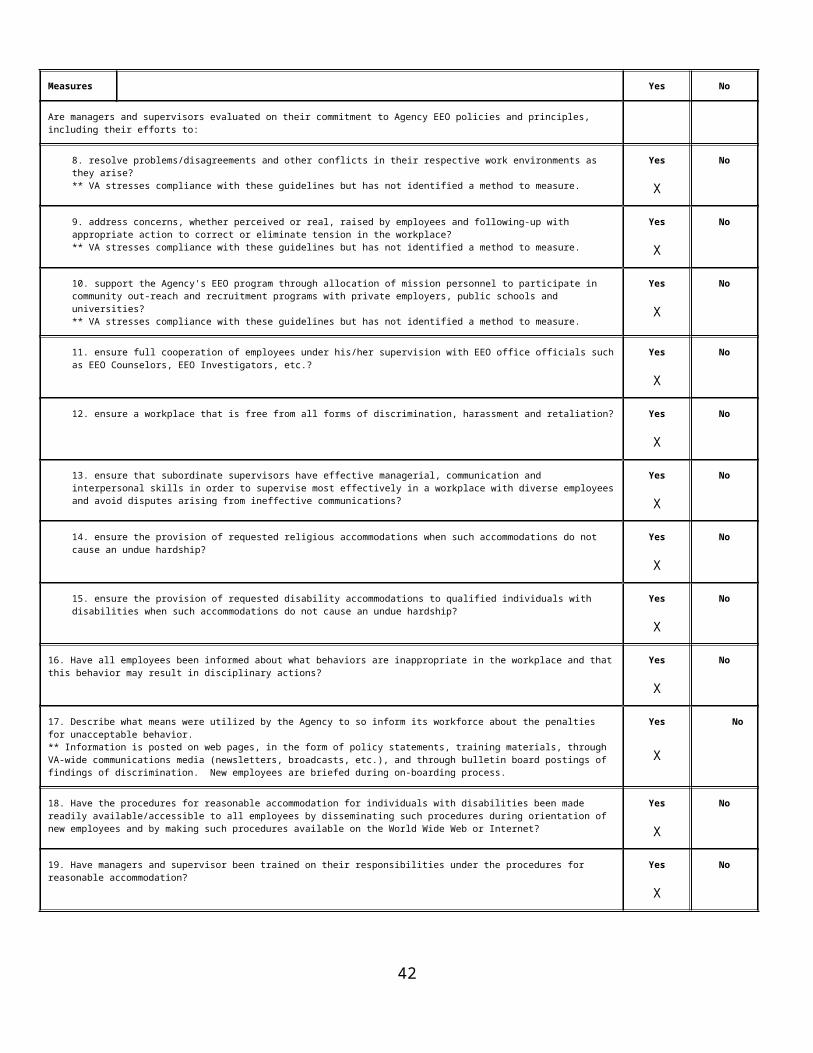
** Office of Resolution Management has oversight responsibility only X
114. Back Pay and Interest: Computer print-outs or payroll documents outlining gross back pay and interest, copy of any checks issued, narrative statement by an appropriate facility official of total monies paid?** Office of Resolution Management has oversight responsibility only
Yes
XNo
115. Compensatory Damages: The final Agency decision and evidence of payment, if made?** Office of Resolution Management has oversight responsibility only
Yes
XNo
116. Training: Attendance roster at training session(s) or a narrative statement by an appropriate facility official confirming that specific persons or groups of persons attended training on a date certain?** Office of Resolution Management has oversight responsibility only
Yes
XNo
117. Personnel Actions (e.g., Reinstatement, Promotion, Hiring, Reassignment): Copies of SF-50s?** Office of Resolution Management has oversight responsibility only
Yes
XNo
118. Posting of Notice of Violation: Original signed and dated notice reflecting the dates that the notice was posted? A copy of the notice will suffice if the original is not available.** Office of Resolution Management has oversight responsibility only
Yes
XNo
119. Supplemental Investigation: 1. Copy of letter to complainant acknowledging receipt from EEOC of remanded case. 2. Copy of letter to complainant transmitting the Report of Investigation (not the ROI itself unless specified). 3. Copy of request for a hearing (complainant's request or facility's transmittal letter)?** Office of Resolution Management has sole responsibility
Yes
XNo
120. Final Agency Decision (FAD): FAD or copy of the complainant's request for a hearing?** Office of Resolution Management has sole responsibility
Yes
XNo
121. Restoration of Leave: Print-out or statement identifying the amount of leave restored, if applicable. If not, an explanation or statement?** Office of Resolution Management has oversight responsibility only
Yes
XNo
122. Civil Actions: A complete copy of the civil action complaint demonstrating same issues raised as in compliance matters?
Yes
XNo
123. Settlement Agreements: Signed and dated agreement with specific dollar amounts, if applicable? Also, appropriate documentation of relief is provided.** Office of Resolution Management has oversight responsibility only
Yes
XNo
42

EEOC FORM715-01 PART H
National
U.S. Equal Employment Opportunity CommissionANNUAL EEO PROGRAM STATUS REPORT
Plan To Attain the Essential Elements of a Model EEO Program
Report Generated on 11/17/2014
STATEMENT of MODEL PROGRAM ESSENTIAL ELEMENT DEFICIENCY:
DEMONSTRATED COMMITMENT BY AGENCY LEADERSHIP: Agency EEO policy is vigorously enforced by Agency management.
Lack of anti-harassment program.
OBJECTIVE 1: (National) Develop an Anti-Harassment Program in VA
RESPONSIBLE OFFICIAL: OHRM, ORM, ODI
DATE OBJECTIVE INITIATED: June 13, 2014
TARGET DATE FOR COMPLETION OF OBJECTIVE:
September 30, 2015
PLANNED ACTIVITIES TOWARD COMPLETION OF OBJECTIVE: TARGET DATE(Must be specific) example: mm/dd/yyyy
VA will issue a new directive/policy guidance memorandum establishing ORM as the responsible office and central point of contact for oversight of the Anti-harassment Program.
12/31/2014
VA’s ORM will take the lead for implementing a more structured Anti-harassment Program in VA. 09/30/2015
VA will issue a new directive/policy guidance memorandum establishing ORM as the responsible office and central point of contact for oversight of the Anti-harassment Program.
09/30/2015
ORM will utilize VA’s Resolution Support Center as the “hotline” for reporting and referring allegations of workplace harassment.
09/30/2015
ORM will work with the Office of Human Resources Management (OHRM)) and Office of Diversity and Inclusion (ODI) to create an automated centralized database to track VA-wide allegations and incidents of workplace harassment that are outside the Federal EEO complaint process.
09/30/2015
ORM will assess resource needs to fully implement this responsibility and provide a timeline for full implementation.
09/30/2015
ODI, and the Office of General Counsel will support and assist as appropriate, ensuring appropriate “firewalls” (functional separations) are observed to maintain integrity of the process.
09/30/2015
REPORT OF ACCOMPLISHMENTS:
43

Report Generated on 12/30/2014
STATEMENT of MODEL PROGRAM ESSENTIAL ELEMENT DEFICIENCY:
MANAGEMENT AND PROGRAM ACCOUNTABILITY: Regular EEO briefings with officials, HR, and review for disciplinary action; (Q52-61)
73. Has the facility implemented an adequate data collection and analysis systems that permit tracking of the information required by MD-715 and these instructions?
OBJECTIVE 2: (National) Integrate applicant flow data with VA’s MD 715 reporting system. Currently tables A/B 7, 9, 11, and 12 are lacking of applicant data as required by EEOC.
RESPONSIBLE OFFICIAL: ODI is the responsible organization to manage the program which will require collaboration with the VA Learning University (VALU), OHRM, CSEMO, Administration Training Officers (TOs)
DATE OBJECTIVE INITIATED: October, 1, 2014
TARGET DATE FOR COMPLETION OF OBJECTIVE:
September 30, 2016
PLANNED ACTIVITIES TOWARD COMPLETION OF OBJECTIVE: TARGET DATE(Must be specific) example: mm/dd/yyyy
Develop an IPT, project plan and project milestones 9/30/2015
Document existing HR and applicant flow infrastructure 9/30/2015
Collaborate with OPM to refine USAJOBS applicant flow data to provide additional information to separate applicant data to respective MD 715 data tables
9/30/2015
Develop a requirements document outlining functional and capability requirements along with interface design with multiple information systems (HR, VSSC, VALU, CSEMO).
9/30/2015
Modify existing applicant flow process to include new required features. 9/30/2015
Integrate applicant data to VSSC MD 715 system (i.e. tables 7, 9, 11 and 12) 9/30/2016
REPORT OF ACCOMPLISHMENTS:
44

Report Generated on 1/31/2014
STATEMENT of MODEL PROGRAM ESSENTIAL ELEMENT DEFICIENCY:
MANAGEMENT AND PROGRAM ACCOUNTABILITY: Regular EEO briefings with officials, HR, and review for disciplinary action; (Q52-61)
Q54. Have time-tables or schedules been established for the facility to review its Merit Promotion Program Policy and Procedures for systemic barriers that may be impeding full participation in promotion opportunities by all groups?
OBJECTIVE 3: (National) Collaborate with HR and Administrations to conduct analyses of Merit Promotion Policies and Procedures.
RESPONSIBLE OFFICIAL: VA Learning University (VALU), ODI, OHRM, Administrations
DATE OBJECTIVE INITIATED: January 7, 2010
TARGET DATE FOR COMPLETION OF OBJECTIVE:
September 30, 2016
PLANNED ACTIVITIES TOWARD COMPLETION OF OBJECTIVE: TARGET DATE(Must be specific) example: mm/dd/yyyy
NCA will update and develop a single merit promotion plan to be used for its VACO and NCA Field offices.
10/31/2014Completed
VBA will streamline its merit promotion plan to a single plan to be used for its VACO and VBA Field offices.
09/30/2015
VHA will streamline its merit promotion plan to a single plan to be used for its VACO and VHA Field offices.
09/30/2016
OHRM will update and seek approval for 5005 Directive – VA-wide merit promotion policy and procedures.
09/30/2015
REPORT OF ACCOMPLISHMENTS:
45

Report Generated on 12/30/2014
STATEMENT of MODEL PROGRAM ESSENTIAL ELEMENT DEFICIENCY:
MANAGEMENT AND PROGRAM ACCOUNTABILITY: Regular EEO briefings with officials, HR, and review for disciplinary action; (Q52-61)
Q55. Have time-tables or schedules been established for the facility to review its Employee Recognition Awards Program and Procedures for systemic barriers that may be impeding full participation in the program by all groups?
OBJECTIVE 4: (National) Collaborate with HR to conduct analyses of Employee Recognition and Awards Program.
RESPONSIBLE OFFICIAL: VA Learning University (VALU), ODI, OHRM, Administration Training Officers (TOs)
DATE OBJECTIVE INITIATED: January 7, 2010
TARGET DATE FOR COMPLETION OF OBJECTIVE:
September 30, 2013NEW DATE: September 30, 2016
PLANNED ACTIVITIES TOWARD COMPLETION OF OBJECTIVE: TARGET DATE(Must be specific) example: mm/dd/yyyy
Work with OHRM to review Employee Recognition Awards Program policy for VACO 9/30/2015
Conduct semi-annual meetings with OHRM specialists conducting the reviews and audits of annual performance awards.
9/30/2015Continuous
Develop quarterly schedule to meet with OHRM to review the related policies and procedures. 06/30/2014Completed
REPORT OF ACCOMPLISHMENTS:
OHRM now is included in quarterly meetings. ODI also participates in OHRM’s IHRMB & HRStat quarterly meetings
46

Report Generated on 12/30/2014
STATEMENT of MODEL PROGRAM ESSENTIAL ELEMENT DEFICIENCY:
MANAGEMENT AND PROGRAM ACCOUNTABILITY: Regular EEO briefings with officials, HR, and review for disciplinary action; (Q52-61)
Q56: Have timetables or schedules been established for the organization to review its Employee Development/Training Programs for systemic barriers that may be impeding full participation in the programs by all groups?
OBJECTIVE 5: (National) Collaborate with HR to conduct analyses of Employee Development and Training Programs.
RESPONSIBLE OFFICIAL: VA Learning University (VALU), ODI, OHRM, Administration Training Officers (TOs)
DATE OBJECTIVE INITIATED: January 7, 2010
TARGET DATE FOR COMPLETION OF OBJECTIVE:
September 30, 2013NEW DATE: June 30, 2016
PLANNED ACTIVITIES TOWARD COMPLETION OF OBJECTIVE: TARGET DATE(Must be specific) example: mm/dd/yyyy
Work with OHRM, VALU, and Admin TOs to identify system for reporting aggregate statistics on training participant demographics (race, ethnicity, gender, and disability status) for purposes of barrier analysis.
3/30/2014New Date: 9/30/2014
CANCELLEDdue to lack of resources
Develop quarterly schedule to meet with OHRM to review the related policies and procedures.** OHRM now is included in quarterly meetings. ODI also participates in OHRM’s IHRMB & HRStat quarterly meetings
06/30/2014Completed
Integrate employee demographic data into the Talent Management System 06/30/2016
Work with OHRM, VALU, VHA, NCA, and VBA to review competitive Employee Development/Training Programs.
9/30/2013NEW DATE 9/30/2015
REPORT OF ACCOMPLISHMENTS: Last year’s planned activities to eliminate deficiencies noted were not accomplished by the original target date, due to competing priorities. Accordingly, target dates have been modified.
47

Report Generated on 11/21/2014 STATEMENT of MODEL PROGRAM ESSENTIAL ELEMENT DEFICIENCY:
MANAGEMENT AND PROGRAM ACCOUNTABILITY: Regular EEO briefings with officials, HR, and review for disciplinary action; (Q52-61)
Q59. Has the facility, when appropriate, disciplined or sanctioned managers/supervisors or employees found to have discriminated over the past two years? If so, cite number found to have discriminated and list penalty /disciplinary action for each type of violation.
**. Since last year, we have conducted an analysis. Our analysis reveals that an appropriate disciplinary action wasn’t always taken. In FY 2013, there were a total of 44 findings of discrimination. In 37 of the 44 cases, the Department was ordered to consider taking disciplinary actions. Ultimately, discipline was taken in 16 of these complaints; nine of which were reported as counseling or admonishment.
** Information to findings/actions taken in FY 2014 is limited at the time of this writing. Actions monitored to date are: Management Determined Disciplinary Action Not Warranted (9); No Disciplinary Action Taken - Civil Suit Filed (1); Verbal Counseling (3); Written Counseling (2); Admonishment (1); Written Reprimand (1); Removed from Agency (1); RMO Left Agency prior to Decision (4); Training (2); Decision on Disciplinary Action is pending (9)
OBJECTIVE 6: (National) Implement a new policy ensuring appropriate review and accountability.
RESPONSIBLE OFFICIAL: VA Learning University (VALU), ODI, OHRM, Administration Training Officers (TOs)
DATE OBJECTIVE INITIATED: January 7, 2010
TARGET DATE FOR COMPLETION OF OBJECTIVE:
September 30, 2013NEW DATE: June 30, 2015
PLANNED ACTIVITIES TOWARD COMPLETION OF OBJECTIVE: TARGET DATE(Must be specific) example: mm/dd/yyyy
Reconvene task force of subject matter experts and stakeholders to update proposed process for reviewing corrective actions taken against RMOs in findings of discrimination
05/30/2014Canceled
Issue policy on enforcement of disciplinary actions** The Secretary issued a Memorandum, “Ensuring Appropriate Review of Findings of Discrimination,” dated June 4, 2014, establishing policy addressing the enforcement of appropriate disciplinary actions.
06/30/2014Completed
Monitor and enforce new policy 09/30/2015In process
Prepare report for FY 2014 disciplinary actions taken 06/30/2015
Update and finalize proposal and draft SOP for EEO Accountability Board 06/30/2014Canceled
Brief senior leadership on proposal and obtain necessary approvals 09/30/2014Canceled
Appoint Board members and finalize Charter for EEO Accountability Board 09/30/2014Canceled
Hold initial training meeting of Board 11/30/2014Canceled
Hold first Board meeting 11/30/2014Canceled
Issue first report of recommendations to RMO leadership chain and OSVA 03/30/2015Canceled
REPORT OF ACCOMPLISHMENTS:
48

Report Generated on 12/1/2014
STATEMENT of MODEL PROGRAM ESSENTIAL ELEMENT DEFICIENCY:
MANAGEMENT AND PROGRAM ACCOUNTABILITY: Regular EEO briefings with officials, HR, and review for disciplinary action; (Q52-61)
Q61. Does the facility review disability accommodation decisions/actions to ensure compliance with its written procedures and analyze the information tracked for trends, problems, etc.?
OBJECTIVE 7: (National) Develop a centralized tracking mechanism and establish timetables for reviewing employee development/training programs for systemic barriers that may be impeding full participation by all groups.
RESPONSIBLE OFFICIAL: VA Learning University (VALU), ODI, OHRM, Administration Training Officers (TOs)
DATE OBJECTIVE INITIATED: January 7, 2010
TARGET DATE FOR COMPLETION OF OBJECTIVE:
September 30, 2013NEW DATE: March 30, 2015
PLANNED ACTIVITIES TOWARD COMPLETION OF OBJECTIVE: TARGET DATE(Must be specific) example: mm/dd/yyyy
Develop standard reporting features in the disability tracking system to RA decisions/actions 06/30/2015
REPORT OF ACCOMPLISHMENTS: Last year’s planned activities to eliminate deficiencies noted were not accomplished by the original target date, due to competing priorities. Accordingly, target dates have been modified. Due to competing resources for high priority FY 2014 initiatives, target dates pushed to FY 2015 and beyond.VA ODI implemented a new RA tracking system in FY2013 and is currently customizing the reporting feature for VA’s organizational hierarchy.
49

Report Generated on 12/1/2014
STATEMENT of MODEL PROGRAM ESSENTIAL ELEMENT DEFICIENCY:
EFFICIENCY: Sufficient staffing for barrier analysis, complaints processing, ADR, and program evaluation (Q72-103)
Q76: Are 90 percent of accommodation requests processed within the time frame set forth within the agency procedures for RA?
OBJECTIVE 8: (National) Establish and deploy a VA-wide centralized RA system to track timely processing of RA requests.
RESPONSIBLE OFFICIAL: ODI, ORM, VHA EEO Manager, Administration EEO and HR Officials
DATE OBJECTIVE INITIATED: 6/08/2010
TARGET DATE FOR COMPLETION OF OBJECTIVE:
9/30/2014
PLANNED ACTIVITIES TOWARD COMPLETION OF OBJECTIVE: TARGET DATE(Must be specific) example: mm/dd/yyyy
Develop communications plan and market new system to train users on the reporting feature in RACS through existing communication media (print, web, Integrated Human Resources Management Board, VA Diversity Council, MD-715 Liaison Work Group, etc.)
05/20/2011New Date: 09/20/2015
Monitor timeliness and denial rates. Provide quarterly feedback to the components. 09/20/2013NEW DATE:09/30/2015
Ongoing
NEW: Hold quarterly conference calls with Local Reasonable Accommodation Coordinators (LRACs) to provide training and answer questions.
9/30/2015Ongoing
NEW: Conduct virtual training for LRACs and EEO in each VA component. 9/30/2015Ongoing
REPORT OF ACCOMPLISHMENTS:
Report Generated on 12/1/2014 STATEMENT of MODEL PROGRAM EFFICIENCY: Sufficient staffing for barrier analysis, complaints processing, ADR, and program
50

ESSENTIAL ELEMENT DEFICIENCY: evaluation (Q72-103)
Q86. When a complainant requests a final facility decision, does the facility issue the decision within 60 days of the request?
OBJECTIVE 9: (National) NEW: Issue final decisions within 60 days of complainant request.
RESPONSIBLE OFFICIAL: ODI, ORM, OEDCA, Administration EEO and HR Officials
DATE OBJECTIVE INITIATED: 10/01/2012
TARGET DATE FOR COMPLETION OF OBJECTIVE:
9/30/2015
PLANNED ACTIVITIES TOWARD COMPLETION OF OBJECTIVE: TARGET DATE(Must be specific) example: mm/dd/yyyy
Continue streamlining FAD decision formats. 09/30/2015
Increase incentives for increased production** Received over 1000 decision requests for FY 2014. Each OEDCA attorney is required to produce 72 cases or more per fiscal year. The inventory increase (representing 77 case closures) resulted from the vacancy of one attorney position in FY 14
9/30/2015
REPORT OF ACCOMPLISHMENTS:Overall case inventory increased by 42 percent
51

Report Generated on 12/1/2014 STATEMENT of MODEL PROGRAM ESSENTIAL ELEMENT DEFICIENCY:
EFFICIENCY: Sufficient staffing for barrier analysis, complaints processing, ADR, and program evaluation (Q72-103)
Q85: Does the facility complete the investigations within the applicable prescribed time frame?
OBJECTIVE 10: (National) Utilize contract investigators to eliminate backlog of investigations.
RESPONSIBLE OFFICIAL: ORM
DATE OBJECTIVE INITIATED: 09/23/2013
TARGET DATE FOR COMPLETION OF OBJECTIVE:
9/30/2015
PLANNED ACTIVITIES TOWARD COMPLETION OF OBJECTIVE: TARGET DATE(Must be specific) example: mm/dd/yyyy
Assignment of backlog of complaints to contract investigators. 09/30/2015(assignments are made
monthly)
Fill investigator vacancies. 09/30/2015
Monitor contract and internal investigator performance. 09/30/2015Ongoing/monthly
REPORT OF ACCOMPLISHMENTS:
1. Contractors have completed 995 cases since beginning of FY 2014.2. Complaints pending investigation decreased by 9.5 percent.3. The average age of complaints pending investigations decreased by 15.8 percent.4. The total number of days of complaints pending completion decreased by 15.8 percent.
52

Report Generated on 12/30/2014
STATEMENT of MODEL PROGRAM ESSENTIAL ELEMENT DEFICIENCY:
RESPONSIVENESS AND LEGAL COMPLIANCE: Federal agencies are in full compliance with EEO statutes and EEOC regulations, policy guidance, and other written instructions. (Q72-103)
Q105. Does the agency have control over the payroll processing function of the agency? If Yes, answer the two questions below.
OBJECTIVE 11: (National) Continue with Tri-parte structure with payroll provider, DFAS.
RESPONSIBLE OFFICIAL: ODI, ORM, HR
DATE OBJECTIVE INITIATED: 10/01/2009
TARGET DATE FOR COMPLETION OF OBJECTIVE:
9/30/2020
PLANNED ACTIVITIES TOWARD COMPLETION OF OBJECTIVE: TARGET DATE(Must be specific) example: mm/dd/yyyy
Maintain a system in place with the payroll provider (e.g., DFAS) to make timely and orderly submissions for all types of payment requests.
09/30/2020
Maintain a tri-partite structure (ORM, OEDCA, and HR) and system to provide an on-going check and balance process for ensuring monetary relief is prompt.
09/30/2020
REPORT OF ACCOMPLISHMENTS:VA continues its success with the tri-partite structure to ensure prompt process of monetary relief through the payroll process.
53

(This Page Intentionally Left Blank)
54

EEOC FORM715-01 PART I National
U.S. Equal Employment Opportunity CommissionANNUAL EEO PROGRAM STATUS REPORT
EEO Plan to Eliminate Identified Barrier
Report Generated on 11/30/2014
EEOC FORM715-01PART I
U.S. Equal Employment Opportunity CommissionFEDERAL AGENCY ANNUAL
EEO PROGRAM STATUS REPORT
DEPARTMENT OF VETERANS AFFAIRS FY 2014
STATEMENT OF CONDITION THAT WAS A TRIGGER FOR A POTENTIAL BARRIER:
Less than Expected Participation of White Females
VA is experiencing less than expected participation for White females (WF) when compared to the Relevant Civilian Labor Force (RCLF). This less than expected participation trickles down to Administration level (Veterans Health Administration (VHA), Veterans Benefits Administration (VBA) and National Cemetery Administration (NCA)) and to VA’s Central Office (VACO).
BARRIER ANALYSIS 1: The first indication of a possible barrier was the disparity in the participation rate of WFs in VA as indicated in Workforce Data Table A1. In VA, WFs represent 35.17 percent of the permanent and temporary workforce, whereas WFs represent 45.50 percent of the RCLF. The RCLF for the nursing and allied health care field is statistically weighted towards women. Because VA’s workforce is heavily concentrated in these fields, VA has a higher benchmark to reach in order to achieve parity.
The net change for WFs (2.07 percent) is below the net change for the total workforce (3.25 percent), meaning that WFs are growing at a rate below that of the total workforce. In VHA, WFs represent 36.39 percent of the permanent and temporary workforce, whereas WFs represent 46.62 percent of the RCLF. The net change for WFs (2.34 percent) is below the net change for VHA’s total workforce (3.50 percent), meaning that WFs are growing at a rate below that of the total workforce. In VBA, WFs represent 27.46 percent of the permanent and temporary workforce, whereas WFs represent 41.47 percent of the RCLF. The net change for WFs (-0.83 percent) is below the net change for VBA’s total workforce (2.03 percent). A negative net change means WFs have experienced a decrease in representation since FY 2013. In NCA, WFs represent 13.29 percent of the permanent and temporary workforce, whereas WFs represent 21.86 percent of the RCLF. The net change for WFs in NCA (-2.12 percent) is below the net change for the total workforce (-1.03 percent), meaning that WFs are growing at a rate below that of the total workforce. In VACO, WFs represent 21.38 percent of the permanent and temporary workforce, whereas WFs represent 27.99 percent of the RCLF. The net change for WFs (-2.11 percent) is below the net change for VACO’s total workforce (0.07 percent), meaning that WFs are growing at a rate below that of the total workforce. The less than expected participation VA-wide prompted a review of Tables A4-2, A6, A8 and A14.
Table A4-2 revealed less than expected participation in the following permanent General Schedule (GS) grades for WFs as compared to the participation of the total permanent workforce in a particular grade in GS-2 (WF: 0.02 percent; Total: 0.03 percent), GS-3 (WF: 0.17 percent; Total: 0.31 percent), GS-4 (WF: 1.26 percent; Total: 2.08 percent), GS-5 (WF: 8.18 percent; Total: 10.36 percent), GS-6 (WF: 12.81 percent; Total: 13.24 percent), GS-7 (WF: 6.24 percent; Total: 7.02 percent), GS-9 (WF: 5.80 percent; Total: 6.20 percent), GS-10 (WF: 1.18 percent; Total: 1.27 percent), GS-14 (WF: 2.33 percent; Total: 2.37 percent), and GS-15 (WF: 4.73 percent; Total: 8.34 percent).
A review of Table A6 revealed a less than expected participation rate for 23 (Police, Social Science, Human Resources Management, Equal Employment Opportunity, Miscellaneous Administration and Program, Program Management, Auditing, Nurse, Practical Nurse, Nursing Assistant, Medical Technologist, Diagnostic Radiologic Technologist, Medical Records Technician, Legal Assistance, Veterans Claims Examining, Claims Assistance and Examining, General Business and Industry, Loan Specialist, Appraising, Cemetery Administration, Criminal Investigating, Information Technology Management, and Cemetery Caretaking) out of 28 identified major occupations in the permanent workforce.
55

Table A8 revealed that the hiring distribution for WFs (33.78 percent) is below their representation in the RCLF (44.61 percent).
In reviewing Table A14, WFs have a separation rate (34.98 percent) in the permanent workforce higher than their workforce participation rate (34.96 percent).
We also reviewed promotion rates for WFs. WFs experienced low promotion rates at the entry level (grades 3 thru 8), journeyman level (grades 9 thru 12), and senior level (grades 13 thru 15) when compared to the overall promotion rate at each level. The promotion rate for WFs at the entry level was 8.04 percent while the overall promotion rate at the entry level was 9.08 percent. The promotion rate for WFs at the journeyman level was 18.49 percent while the overall promotion rate at the journeyman level was 20.29 percent. The promotion rate for WFs at the senior level was 6.81 percent while the overall promotion rate at the senior level was 7.01 percent.
The analysis of the promotion rates is inclusive of competitive and non-competitive promotions.
STATEMENT OF IDENTIFIED BARRIER:
Provide a succinct statement of the agency policy, procedure or practice that has been determined to be the barrier of the undesired condition.
The cause of the less than expected participation rate for WFs is unknown. It appears that our hiring of WFs is not exceeding the growth of the total workforce like it should if we want to see progress in participation. Also, WFs in the workforce are leaving at a high proportion. Further examination of the policies, procedures, and practices impacting the hiring, retention, and separation processes is needed.
OBJECTIVE:
State the alternative or revised agency policy, procedure or practice to be implemented to correct the undesired condition.
Refine the applicant flow system to identify potential barriers in the recruitment and selection processes.Review the hiring policies, procedure and practices.Implement an exit interview process for those separating from VA.Eliminate, when possible, any barriers to equal opportunity.
RESPONSIBLE OFFICIAL: Assistant Secretary for Human Resources and Administration; Deputy Assistant Secretary for Human Resources Management; Deputy Assistant Secretary for Diversity and Inclusion; Other Administration HR Officials
DATE OBJECTIVE INITIATED: 09/30/2009
TARGET DATE FOR COMPLETION OF OBJECTIVE:
09/30/2016
56

EEOC FORM715-01PART I
EEO Plan To Eliminate Identified Barrier
INSTRUCTIONS: Describe the plans to implement the identified activities in the spaces below showing dates of benchmarks and responsible individuals. The success in implementing these plans should be shown in the REPORT OF ACCOMPLISHMENTS and MODIFICATIONS TO OBJECTIVE section.
TARGET DATE(Must be specific)
example: mm/dd/yyyy
VA will develop and implement a strategic plan that will address issues affecting female employment, career development, promotions, awards, and overall retention of females within the Department.
09/30/2015
VA will annually monitor Department-wide complaint trends to determine if there are adverse trends affecting White females in the workforce. 08/31/2015
VA will continue to partner with women’s professional and Veterans organizations, and post-secondary educational institutions to increase awareness of VA occupations, annually. 08/31/2015
ODI will refine its existing applicant flow process and automate and integrate it into MD-715 tables.
06/30/2016
VA will continue meeting with Workforce Planners to incorporate VA’s EEO and Diversity and Inclusion goals into VA’s Strategic Plan and to ensure EEO demographic data considerations are factored into VA’s Workforce Succession and Human Capital Plans, annually.
09/30/2015
VA will continue to administer mentoring (formal and informal) programs to promote career development, retention, and upward mobility within the VA workforce. 09/30/2015
VA will ensure information on career development and leadership programs is disseminated to all employees to ensure employment opportunities are maximized, annually. 09/30/2015
VA will develop and facilitate virtual training and professional development forums annually to enhance workforce capacity in the areas of cultural competence, barrier analysis, unconscious bias, inclusion, special emphasis program management, etc.
09/30/2015
VA will roll out unconscious bias and cultural competency training for VA employees. 09/30/2014Completed
VA will refine the unconscious bias training for VA employees. 09/30/2015
ODI will analyze exit survey data to determine if there are barriers that may impact the retention of White females. 06/30/2015
VA will market and continue to enhance VA’s exit survey system. 09/30/2016
REPORT OF ACCOMPLISHMENTS and MODIFICATIONS TO OBJECTIVE
A strategic plan for the women’s program is still being researched and drafted to ensure it is inclusive of women’s issues specific to VA and contains achievable goals to address those identified issues. The VA’s Office of Diversity and Inclusion (ODI) will continue to develop an appropriate plan for women in the VA, ensuring coordination and feedback from the field are included.
The National Federal Women’s Program Manager, located in ODI, reviewed the FY 2012 and 2013 462 reports, as well as VA-wide EEO findings of discrimination and found no indication of adverse trends specifically affecting WFs. ODI will continue to monitor.
ODI continues to partner with and support women’s organizations such as Federally Employed Women, and internal women’s Veterans organizations such as the VA’s Center for Women Veterans to increase awareness of opportunities for employment, training, and career development.
The applicant flow system has been developed. However the data structure is still being refined to be able to show MD-715 specific data.
ODI has continued to meet with staff involved in creating VA-wide strategic plans to ensure diversity and inclusion are imbedded within. To date, language exists in the Human Resources Strategic Plan, as well as the Diversity and Inclusion Strategic Plan.
During FY 2014, the VA Learning University (VALU) launched a pilot for a new Career Development Facilitator Program, which is commonly referred to as “CDF” to address the need for career counseling and guidance for VA employees. The CDF, if determined effective through the pilot, should be implemented by VALU by September 30, 2015. ODI will utilize this tool and assist with marketing to ensure field knowledge of
57

the CDF and other talent management tools such as MyCareer@VA.
ODI continues to develop and offer virtual training and provide training at professional development forums during national affinity group conferences.
VA has fully implemented virtual barrier analysis training and received positive feedback and continually increasing participation in the training. In addition, the Deputy Assistant Secretary for Diversity and Inclusion provided a training presentation titled “The Inclusion Paradigm,” either in-person or virtually, to senior staff in at least six different VA field facilities.
ODI’s Training and Communications team provided 114 sessions of “Cultural Competency – Key Considerations for an Inclusive VA Workforce” training to 24 VA medical facilities, staff offices, and the Board of Veterans Appeals. In addition, VA also began a train-the-trainer program for unconscious bias training that is planned to be continued in FY 2015.
58

EEOC FORM715-01PART I
U.S. Equal Employment Opportunity CommissionFEDERAL AGENCY ANNUAL
EEO PROGRAM STATUS REPORT
DEPARTMENT OF VETERANS AFFAIRS FY 2014
STATEMENT OF CONDITION THAT WAS A TRIGGER FOR A POTENTIAL BARRIER:
Less than Expected Participation Rates for Hispanic Males and Females
VA is experiencing less than expected participation for Hispanic males and females (HM and HF, respectively) when compared to the RCLF and the Civilian Labor Force (CLF). This less than expected participation trickles down to Administration level (VHA, VBA and NCA) and to VACO.
BARRIER ANALYSIS 2: The first indication of a possible barrier was the disparity in the participation rate of HMs and HFs in VA as indicated in Workforce Data Table A1. In VA, HMs represent 3.15 percent of the permanent and temporary workforce and HFs represent 3.53 percent, whereas HMs represent 3.89 percent of the RCLF and 5.17 percent of the CLF and HFs represent 5.70 percent and 4.79 percent, respectively. The RCLF for nursing and allied health care field is statistically weighted towards women. Because VA’s workforce is heavily concentrated in these fields, VA has a higher benchmark to reach in order to achieve parity.
The net change for HMs (4.78 percent) and HFs (3.51 percent) is above the net change for the total workforce (3.25 percent), meaning that HMs and HFs are growing at a rate above that of the total workforce. In VHA, HMs represent 3.08 percent of the permanent and temporary workforce and HFs represent 3.67 percent, whereas HMs represent 3.82 percent of the RCLF and HFs represent 5.81 percent. The net change for HMs (5.23 percent) and HFs (3.77 percent) is above the net change for VHA’s total workforce (3.50 percent), meaning that HMs and HFs are growing at a rate above that of the total workforce. In VBA, HMs represent 3.02 percent of the permanent and temporary workforce and HFs represent 2.67 percent, whereas HMs represent 3.13 percent of the RCLF and HFs represent 5.69 percent. However, the net change for HMs in VBA (2.86 percent) and HFs (2.33 percent) is above the net change for total workforce (2.03 percent), meaning that HMs and HFs are growing at a rate above that of the total workforce. In NCA, HMs represent 8.46 percent of the permanent and temporary workforce and HFs represent 2.07 percent, whereas HMs represent 18.53 percent of the RCLF and HFs represent 3.34 percent. However, the net change for HMs (2.08 percent) and HFs (2.86 percent) in NCA is above the net change for the total workforce (-1.03 percent), meaning that HMs and HFs are growing at a rate above that of the total workforce. A negative net change means that the total workforce has decreased since FY 2013. In VACO, HMs represent 4.27 percent of the permanent and temporary workforce and HFs represent 1.89 percent, whereas HMs represent 4.62 percent of the RCLF and HFs represent 3.19 percent. The net change for HMs (0.18 percent) is above the net change for VACO’s total workforce (0.07 percent); however, the net change for HFs (-4.72 percent) is below the net change for VACO’s total workforce, meaning that HFs are growing at a rate below that of the total workforce. The less than expected participation VA-wide prompted a review of Tables A4-2, A6, A8, and A14.
Table A4-2 revealed less than expected participation in the following permanent GS grades for HMs as compared to the participation of the total permanent workforce in a particular grade in GS-2 (HM: 0.02 percent; Total: 0.03 percent), GS-8 (HM: 6.66 percent; Total: 7.00 percent), GS-11 (HM: 15.09 percent; Total: 20.42 percent), GS-12 (HM: 8.36 percent; Total: 9.53 percent), GS-13 (HM: 7.48 percent; Total: 11.70 percent), and GS-14 (HM: 1.54 percent; Total: 2.37 percent). Table A4-2 also revealed less than expected participation in the following permanent GS grades for HFs in GS-9 (HF: 5.80 percent; Total: 6.20 percent), GS-10 (HF: 1.14 percent; Total: 1.27 percent), GS-12 (HF: 8.46 percent; Total: 9.53 percent), GS-13 (HF: 9.07 percent; Total: 11.70 percent), GS-14 (HF: 1.23 percent; Total: 2.37 percent), and GS-15 (HF: 4.75 percent; Total: 8.34 percent).
A review of Table A6 revealed a less than expected participation rate for HMs for 17 (Human Resources Management, Equal Employment Opportunity, Miscellaneous Administration and Program, Program Management, Financial Administration and Program, Medical Officer, Medical Technologist, Pharmacist, Medical Records Technician, General Attorney, Legal Assistant, Veterans Claims Examining, Loan Specialist, Appraising, Cemetery Administration, Criminal Investigating, and Cemetery Caretaking) out of 28 identified major occupations in the permanent workforce. A review of Table A6 revealed a less than expected participation rate for HFs for 22 (Police, Social Science, Human Resources Management, Equal Employment Opportunity, Miscellaneous Administration and Program, Program Management,
59

Financial Administration and Program, Practical Nurse, Nursing Assistant, Diagnostic Radiologic Technologist, Medical Records Technician, General Attorney, Legal Assistance, Veterans Claims Examining, Claims Assistance and Examining, General Business and Industry, Loan Specialist, Appraising, Cemetery Administration, Criminal Investigating, Information Technology Management, and Cemetery Caretaking) out of 28 identified major occupations in the permanent workforce.
Table A8 revealed that the hiring distribution for HMs (3.24 percent) is below their representation in the RCLF (4.45 percent) and the hiring distribution for HFs (3.10 percent) is below their representation in the RCLF (5.97 percent).
In reviewing Table A14, HMs have a separation rate (2.97 percent) in the permanent workforce lower than their workforce participation rate (3.20 percent) and HFs have a separation rate (2.79 percent) lower than their workforce participation rate (3.57 percent).
We also reviewed promotion rates for HMs and HFs. HFs experienced low promotion rates at the entry level (grades 3 thru 8), journeyman level (grades 9 thru 12), and senior level (grades 13 thru 15) when compared to the overall promotion rate at each level. The promotion rate for HFs at the entry level was 8.49 percent while the overall promotion rate at the entry level was 9.08 percent. The promotion rate for HFs at the journeyman level was 19.00 percent while the overall promotion rate at the journeyman level was 20.29 percent. The promotion rate for HFs at the senior level was 6.91 percent while the overall promotion rate at the senior level was 7.01 percent. HMs experienced a marginally low promotion rates at the journeyman level only (20.07 percent).
The analysis of the promotion rates is inclusive of competitive and non-competitive promotions.
STATEMENT OF IDENTIFIED BARRIER:
Provide a succinct statement of the agency policy, procedure or practice that has been determined to be the barrier of the undesired condition.
The cause of the less than expected participation rate for HMs and HFs is unknown. It appears that our hiring of HMs and HFs exceeds the growth of the total workforce like it should if we expect to see progress in the participation. However, we still have less than expected participation. Further examination of the policies, procedures, and practices impacting the hiring, retention, and separation processes is needed.
OBJECTIVE:
State the alternative or revised agency policy, procedure or practice to be implemented to correct the undesired condition.
Refine the applicant flow system to identify potential barriers in the recruitment and selection process.Review the hiring and promotion policies, procedures and practices.Implement an exit interview process for those separating from VA.Eliminate, when possible, any barriers to equal opportunity.
RESPONSIBLE OFFICIAL: Assistant Secretary for Human Resources and Administration; Deputy Assistant Secretary for Human Resources Management; Deputy Assistant Secretary for Office of Diversity and Inclusion; Other Administration HR Officials
DATE OBJECTIVE INITIATED: 09/30/2009
TARGET DATE FOR COMPLETION OF OBJECTIVE:
06/30/2016
60

EEOC FORM715-01PART I
EEO Plan To Eliminate Identified Barrier
INSTRUCTIONS: Describe the plans to implement the identified activities in the spaces below showing dates of benchmarks and responsible individuals. The success in implementing these plans should be shown in the REPORT OF ACCOMPLISHMENTS and MODIFICATIONS TO OBJECTIVE section.
TARGET DATE(Must be specific)
example: mm/dd/yyyy
Annually increase communications between ODI and Hispanic Employment Program Managers (HEPM) Department-wide. 09/30/2015
ODI will refine its existing applicant flow process and automate and integrate it into MD-715 tables. 09/30/2016
Each VA organization will make a concerted effort to conduct, annually, targeted outreach at educational institutions focused on demographic groups with low participation rates in VA’s workforce. This includes Minority Serving Institutions (MSIs) as well as professional associations, and affinity groups.
09/30/2015
VA will ensure VA sub-components are adhering to the goals and objectives contained in VA’s HERO Plan by strategically collaborating with key VA stakeholders, integrating and embedding EEO and diversity and inclusion goals into day-to-day processes, across all business lines, and at all levels.
09/30/2015
ODI will continue meeting with Workforce Planners to incorporate VA’s EEO and Diversity and Inclusion goals into VA’s Strategic Plan and to ensure EEO demographic data considerations are factored into VA’s Workforce Succession and Human Capital Plans, annually.
09/30/2015
VA will continue to partner with Hispanic serving post-secondary educational institutions, professional organizations, military transition assistance program and Veterans Service Organizations for the conduct of targeted outreach, annually.
09/30/2015
VA will continue to optimize recruitment outreach activities and market VA as an Employer of Choice by leveraging the Student Outreach and Retention Program (SOAR) with two Hispanic serving post-secondary educational institutions in the state of Florida.
09/30/2015
VA will continue to administer mentoring (formal and informal) programs to promote career development, retention, and upward mobility within the VA workforce. 09/30/2015
VA will ensure information on career development and leadership programs is disseminated to all employees to ensure employment opportunities are maximized, annually. 09/30/2015
VA will develop and facilitate virtual training and professional development forums annually to enhance workforce capacity in the areas of cultural competence, barrier analysis, unconscious bias, inclusion, special emphasis program management, etc.
09/30/2015
VA will roll out unconscious bias and cultural competency training for VA employees. 09/30/2014Completed
VA will refine the unconscious bias training for VA employees. 09/30/2015
REPORT OF ACCOMPLISHMENTS and MODIFICATIONS TO OBJECTIVE
Program Management: Conducted workforce analysis, targeted outreach to the Hispanic community, including VA employees and Veterans, in alignment with applicable program goals noted in the VA Diversity and Inclusion Strategic Plan, MD-715, and other related goals linked to Executive Orders, and Federal regulations.
Targeted Outreach: VA continues to conduct targeted outreach to groups with less than expected participation rates, including Hispanics. ODI partnered with NCA and VHA field facilities, Center for Minority Veterans (CMV), and the Veterans Employment Service Office (VESO) to conduct outreach to the Hispanic community. The Deputy Assistant Secretary for Diversity and Inclusion continues to serve as a keynote speaker at many of these events. VA personnel from ODI, CMV and VESO were in charge of exhibit booths at various outreach events and also conducted multiple workshops for the Hispanic community and Hispanic Veterans. ODI has instituted an extensive HEP outreach network with whom we have made great strides in strengthening partnerships and working relationships with national Hispanic civil rights and social work organizations. To build a diverse and inclusive workforce, the following Hispanic affinity events were supported by VA personnel:
61

U.S. Hispanic Leadership Institute National Conference, Chicago, Illinois, February 2014 National Hispanic Medical Association, Washington, DC, March 2014 League of United Latin American Citizens (LULAC) Women’s Conference, Milwaukee, Wisconsin, March 2014 LULAC’s Annual Convention and Federal Training Institute, New York, New York, July 2014* A supported employee participation in the LULAC FTI Partnership that was held on September 16-17, 2014 in Washington,
DC. This event included plenary sessions, workshops and executive coaching designed to help facilitate government employees towards enhancing their leadership skills and developing Executive Core Qualifications required for senior leader positions and appointment to the Senior Executive Service.
*VA held Agency pre-conference training forums for VA employees during these events.
VA created the National Diversity Internship Program (NDIP) with affinity organizations, including the Hispanic Association of Colleges and Universities (HACU) and Hispanic Serving Health Professionals Schools (HSHPS), to build a pipeline for workforce diversity.
HEP Virtual and Onsite Training and Career Development: ODI continues to utilize various modalities to provide career and professional development to HEPMs and VA employees nationwide. Virtual meetings have been held monthly, throughout FY14, featuring speakers at the various levels from Hines VA
Medical Center, VHA’s Chief Business Office, Deputy Assistant Secretary for Resolution Management, Acting Director for Veteran Employment Services Office, ODI’s Director, Workforce Analysis Team, Workforce Management and Consulting Office, VHA Diversity and Inclusion Office, President, National Council of Hispanic Employment Program Managers, and EEO Specialists from ODI. The VA Deputy Assistant Secretary for Diversity and Inclusion has been a prominent participant and supporter of this effort.
ODI hosted its fourth annual training program for HEPMs in conjunction with LULAC’s Annual Convention Federal Training Institute in July 2014, in New York, New York. In addition, the Deputy Assistant Secretary for Diversity and Inclusion, Mrs. Georgia Coffey, has launched a new leadership training initiative focused on cultivating inclusion and employee engagement in the workplace. The initiative’s kickoff was held during LULAC’s 2014 Conference with the VISN 3 Network Director and members of her Executive Staff.
During Hispanic affinity groups’ national conferences, VA employees and other federal agency attendees were provided with training on VA Learning University’s MyCareer@VA career mapping program.
VA created the National Diversity Internship Program (NDIP) with affinity organizations, including the Hispanic Association of Colleges and Universities and Hispanic-Serving Health Professionals Schools to build a pipeline for workforce diversity.
VA implemented cultural competency and unconscious bias training for employees, and mandatory Diversity and Inclusion (D&I) training for all managers.
o During FY14, ODI conducted 114 sessions of the training “Cultural Competency – Key Considerations for an Inclusive VA Workforce” at 24 VA Medical Centers, 35 associated Community Based Outpatient Clinics, 2 VA Staff Offices, and the Board of Veterans Appeals staff.
External Agency Support: ODI continues to collaborate with the Office of Personnel Management and the National Council of Hispanic Employment Program Managers (NCHEPM) on various outreach projects.
62

EEOC FORM715-01PART I
U.S. Equal Employment Opportunity CommissionFEDERAL AGENCY ANNUAL
EEO PROGRAM STATUS REPORT
DEPARTMENT OF VETERANS AFFAIRS FY 2014
STATEMENT OF CONDITION THAT WAS A TRIGGER FOR A POTENTIAL BARRIER:
Less than Expected Participation of Asian Males
VA is experiencing less than expected participation for Asian males (AM) when compared to the RCLF. This less than expected participation trickles down to Administration level (VHA, VBA and NCA) and to VACO.
BARRIER ANALYSIS 3: The first indication of a possible barrier was the disparity in the participation rate of AMs in VA as indicated in Workforce Data Table A1. In VA, AMs represent 2.81 percent of the permanent and temporary workforce, whereas AMs represent 2.95 percent of the RCLF. However, the net change for AMs (5.46 percent) is above the net change for the total workforce (3.25 percent), meaning that AMs are growing at a rate above that of the total workforce. In VHA, AMs represent 2.88 percent of the permanent and temporary workforce, whereas AMs represent 2.94 percent of the RCLF. However, the net change for AMs (5.79 percent) is above the net change for VHA’s total workforce (3.50 percent), meaning that AMs are growing at a rate above that of the total workforce. In VBA, AMs represent 1.49 percent of the permanent and temporary workforce, whereas AMs represent 1.95 percent of the RCLF. However, the net change for AMs (4.58 percent) is above the net change for VBA’s total workforce (2.03 percent), meaning that AMs are growing at a rate above that of the total workforce. Also, in NCA, AMs represent 1.32 percent of the permanent and temporary workforce, whereas AMs represent 1.67 percent of the RCLF. The net change for AMs (-7.86 percent) is below the net change for NCA’s total workforce (-1.03 percent). A negative net change means the workforce has experienced a decrease in representation since FY 2013. In VACO, AMs represent 3.34 percent of the permanent and temporary workforce, whereas AMs represent 4.83 percent of the RCLF. However, the net change for AMs (0.94 percent) is above the net change for VACO’s total workforce (0.07 percent), meaning that AMs are growing at a rate above that of the total workforce. The less than expected participation VA-wide prompted a review of Tables A4-2, A6, A8, and A14.
Table A4-2 revealed less than expected participation in the following permanent GS grades for AMs as compared to the participation of the total permanent workforce in a particular grade in GS-2 (AM: 0.01 percent; Total: 0.03 percent), GS-3 (AM: 0.07 percent; Total: 0.31 percent), GS-4 (AM: 1.06 percent; Total: 2.08 percent), GS-5 (AM: 4.99 percent; Total: 10.36 percent), GS-6 (AM: 7.49 percent; Total: 13.24 percent), GS-7 (AM: 4.94 percent; Total: 7.02 percent), GS-8 (AM: 6.74 percent; Total: 7.00 percent), GS-9 (AM: 5.09 percent; Total: 6.20 percent), GS-11 (AM: 15.58 percent; Total: 20.42 percent), GS-12 (AM: 8.31 percent; Total: 9.53 percent), GS-13 (AM: 6.82 percent; Total: 11.70 percent), and GS-14 (AM: 1.93 percent; Total: 2.37 percent).
A review of Table A6 revealed a less than expected participation rate for 20 (Police, Social Science, Human Resources Management, Equal Employment Opportunity, Miscellaneous Administration and Program, Program Management, Management and Program Analyst, Financial Administration and Program, Auditing, Pharmacist, Medical Records Technician, General Attorney, Legal Assistant, Veterans Claims Examiner, Claims Assistance and Examiner, General Business and Industry, Loan Specialist, Appraising, Cemetery Administration, and Information Technology Management) out of 28 identified major occupations in the permanent workforce.
Table A8 revealed that the hiring distribution for AMs (3.07 percent) is above their representation in the RCLF (2.81 percent).
In reviewing Table A14, AMs have a separation rate (2.28 percent) in the permanent workforce lower than their workforce participation rate (2.65 percent).
We also reviewed promotion rates for AMs. AMs experienced low promotion rates at the entry level (grades 3 thru 8), journeyman level (grades 9 thru 12), and senior level (grades 13 thru 15) when compared to the overall promotion rate at each level. The promotion rate for AMs at the entry level was 8.47 percent while the overall promotion rate at the entry level was 9.08 percent. The promotion rate for AMs at the journeyman level was 19.85 percent while the overall promotion rate at the journeyman level was 20.29 percent. The promotion rate for AMs at the senior level was 6.03 percent while the overall promotion rate at the senior level was 7.01 percent.
63

The analysis of the promotion rates is inclusive of competitive and non-competitive promotions.
STATEMENT OF IDENTIFIED BARRIER:
Provide a succinct statement of the agency policy, procedure or practice that has been determined to be the barrier of the undesired condition.
The cause of the lower than expected participation rate for AMs is unknown. It appears that our hiring of AMs is exceeding the growth of the total workforce like it should if we expect to see progress in the participation. However, we still have less than expected participation. Further examination of the policies, procedures, and practices impacting the hiring, retention, and separation processes is needed.
OBJECTIVE:
State the alternative or revised agency policy, procedure or practice to be implemented to correct the undesired condition.
Refine the applicant flow system to identify potential barriers in the recruitment and selection process.Review the hiring policies, procedure and practices.Implement an exit interview process for those separating from VA.Eliminate, when possible, any barriers to equal opportunity.
RESPONSIBLE OFFICIAL: Assistant Secretary for Human Resources and Administration; Deputy Assistant Secretary for Human Resources Management; Deputy Assistant Secretary for Office of Diversity and Inclusion; Other Administration HR Officials
DATE OBJECTIVE INITIATED: 09/30/2009
TARGET DATE FOR COMPLETION OF OBJECTIVE:
09/30/2016
64

EEOC FORM715-01PART I
EEO Plan To Eliminate Identified Barrier
INSTRUCTIONS: Describe the plans to implement the identified activities in the spaces below showing dates of benchmarks and responsible individuals. The success in implementing these plans should be shown in the REPORT OF ACCOMPLISHMENTS and MODIFICATIONS TO OBJECTIVE section.
TARGET DATE(Must be specific)
example: mm/dd/yyyy
ODI will refine its existing applicant flow process and automate and integrate it into MD-715 tables. 09/30/2016
ODI will continue meeting with Workforce Planners to incorporate VA’s EEO and Diversity and Inclusion goals into VA’s Strategic Plan and to ensure EEO demographic data considerations are factored into VA’s Workforce Succession and Human Capital Plans, annually.
09/30/2015
VA will continue to administer mentoring (formal and informal) programs to promote career development, retention, and upward mobility within the VA workforce. 09/30/2015
VA will ensure information on career development and leadership programs is disseminated to all employees to ensure employment opportunities are maximized, annually. 09/30/2015
VA will develop and facilitate virtual training and professional development forums annually to enhance workforce capacity in the areas of cultural competence, barrier analysis, unconscious bias, inclusion, special emphasis program management, etc.
09/30/2015
VA will develop virtual leadership and professional development forums to enhance Special Emphasis Program Manager’s competence in the areas of recruitment and retention outreach.
09/30/2015
VA will continue partnerships with AAPI affinity organizations, such as Federal Asian Pacific American Council (FAPAC) and Asian American Government Executive Network (AAGEN) to enhance AAPI outreach and leadership development programs and leverage VA's National Diversity Internship and Pathways Programs.
09/30/2015
VA will increase outreach/assistance to the AAPI communities and Veteran population via participation in affinity group national and regional conferences, activities sponsored by Veterans and professional organizations, AAPI affinity organizations, and Asian American/Native American/Pacific Islander Education Serving Institutions.
09/30/2015
ODI will work with VALU and VHA Healthcare Retention and Recruitment Office to ensure information on recruitment, career development/leadership programs are disseminated to all employees.
09/30/2015
ODI will review workforce data for promotions, SES participation, training and developmental programs for all race/ethnicity and gender groups. 09/30/2016
VA will roll out unconscious bias and cultural competency training for VA employees. 09/30/2014Completed
VA will refine the unconscious bias training for VA employees. 09/30/2015
REPORT OF ACCOMPLISHMENTS and MODIFICATIONS TO OBJECTIVE
Program Management: Conducted workforce analysis, targeted outreach to the AAPI community, including VA employees and Veterans, in alignment with applicable program goals noted in the VA Diversity and Inclusion Strategic Plan, MD-715, White House Initiative on Asian Americans and Pacific Islanders (WHIAAPI) and other related goals linked to Executive Orders, and Federal regulations.
The VA National AAPI Employment Program Manager has formed an intra-agency WHIAAPI work group that meets to ensure WHIAAPI plan goals and objectives are complied with in a timely manner. The VA WHAPPI workgroup collaborated to submit VA’s FY14 Mid-Year WHIAAPI Accomplishment Report on April 25, 2014, and the FY14/FY15 Agency Action Plan on November 22, 2014.
Targeted Outreach: VA continues to conduct targeted outreach to groups with less than expected participation rates, including AAPIs.
65

VA produced a departmental memorandum announcing and encouraging participation in the 29th Annual Federal Asian Pacific American Council (FAPAC) 2014 National Leadership Training Program (NLTP) held May 2014 in Charlotte, North Carolina. The memo was disseminated VA-wide. The Agency fully supported FAPAC’s NLTP.
o During the conference, VA personnel from ODI staffed an exhibit booth to showcase VA Learning University (VALU), VA’s Diversity program and Veterans Services.
o In addition, personnel from VA’s CMV Office, VBA, NCA, and the local VA Minority Veterans Program Coordinator were in attendance to staff two additional exhibit booths to provide information on Veterans program/services and employment opportunities.
o During the Training Program, VA’s Deputy Assistant Secretary for Diversity and Inclusion (DAS D&I), Mrs. Georgia Coffey, had an important role as a Guest Speaker and panelist.
ODI produced a Department level memorandum commemorating May 2014 as AAPI Heritage Month. The memo, encouraging VA employees to support attendance at events and recognize the contributions of AAPIs, was disseminated throughout the VA.
The VA Central Office AAPI Heritage Month planning committee executed two AAPI Heritage Month related events: 1. Kick-off event on May 15, and, 2. cultural event on May 22.
VA created the National Diversity Internship Program (NDIP) with affinity organizations, including Minority Access, Inc., Indtai Inc., and the Washington Center (TWC) to build a pipeline for workforce diversity.
o Representatives from the VHA, VBA, NCA, and VACO participated in this effort. VA has implemented a MyCareer@VA career mapping program to address grade disparities and glass ceilings for all
groups, including AAPIs.
External Agency Support (Leadership Development): VA has entered into a Memorandum of Understanding (MOU) with the African American Federal Executives Association (AAFEA), and the Asian American Government Executives Network (AAGEN). The intent of the MOU is to build on collaborations for performing outreach, and leveraging resources for talent
management of diverse groups within the Federal sector. It is anticipated that VA’s partnership with AAFEA and AAGEN respectively, will encourage and promote more participation from diverse groups in the pipelines for the Senior Executive Service and senior level positions within the Department, and other Federal sector agencies. ODI is the lead Office for this diversity initiative.
The AAGEN Memorandum was signed during its 10th annual Leadership Development Training Workshop at the Doubletree Hotel in Crystal City, VA on June 5, 2014, as part of VA’s DAS D&I participation as a panelist during a Leadership seminar sponsored by AAGEN. The workshop was designed to provide valuable learning and networking opportunities for all public servants to enhance their professional careers.
VA implemented cultural competency and unconscious bias training for employees, and mandatory Diversity and Inclusion (D&I) training for all managers.
o During FY14, ODI conducted 114 sessions of the training “Cultural Competency – Key Considerations for an Inclusive VA Workforce” at 24 VA Medical Centers, 35 associated Community Based Outpatient Clinics, 2 VA Staff Offices, and the Board of Veterans Appeals staff.
ODI held several AAPI focused conference calls to provide program information to the field offices and VA’s intra-agency WHIAAPI work group.
66

EEOC FORM715-01PART I
U.S. Equal Employment Opportunity CommissionFEDERAL AGENCY ANNUAL
EEO PROGRAM STATUS REPORT
DEPARTMENT OF VETERANS AFFAIRS
FY 2014
STATEMENT OF CONDITION THAT WAS A TRIGGER FOR A POTENTIAL BARRIER:
Low Promotion Rates for Black Males and Females, Asian Females, and Native Hawaiian/Pacific Islander Males
VA is experiencing low promotion rates in GS grades for Black males (BM) and females (BF), Asian females (AF), and Native Hawaiian/Pacific islander males (NHOPIM) when compared to the career level promotion rates for the aggregate workforce.
BARRIER ANALYSIS 4: BFs experienced low promotion rates at the entry level (grades 3 thru 8) and senior level (grades 13 thru 15) when compared to the overall promotion rate at each level. The promotion rate for BFs at the entry level was 8.17 percent while the overall promotion rate at the entry level was 9.08 percent. The promotion rate for BFs at the senior level was 6.72 percent while the overall promotion rate at the senior level was 7.01 percent.
BMs and NHOPIMs experienced a low promotion rate only at the senior level. The promotion rates for BMs and NHOPIMs were 6.62 percent and 2.56 percent, respectively.
AFs experienced low promotion rates at the entry level and journeyman level only, 4.56 percent and 19.16 percent respectively.
The analysis of the promotion rates is inclusive of competitive and non-competitive promotions.
STATEMENT OF IDENTIFIED BARRIER:
Provide a succinct statement of the agency policy, procedure or practice that has been determined to be the barrier of the undesired condition.
The cause of the low promotion rates is unknown. Further examination of the policies, procedures, and practices impacting promotions is needed.
OBJECTIVE:
State the alternative or revised agency policy, procedure or practice to be implemented to correct the undesired condition.
Review the policies, procedures, and practices impacting promotions. Eliminate, when possible, any barriers to equal opportunity.
RESPONSIBLE OFFICIAL: Assistant Secretary for Human Resources and Administration; Deputy Assistant Secretary for Human Resources Management; Deputy Assistant Secretary for Office of Diversity and Inclusion; VA Learning University; Other Administration HR Officials
DATE OBJECTIVE INITIATED: 09/30/2013
TARGET DATE FOR COMPLETION OF OBJECTIVE:
06/30/2016
67

(This Page Intentionally Left Blank)
68

EEOC FORM715-01PART I
EEO Plan To Eliminate Identified Barrier
INSTRUCTIONS: Describe the plans to implement the identified activities in the spaces below showing dates of benchmarks and responsible individuals. The success in implementing these plans should be shown in the REPORT OF ACCOMPLISHMENTS and MODIFICATIONS TO OBJECTIVE section.
TARGET DATE(Must be specific) example:
mm/dd/yyyy
ODI will conduct an educational/training needs assessment for employees and conduct barrier analysis to determine if there are challenges to attaining training. 06/30/2016
VA will roll out unconscious bias and cultural competency training for VA employees. 09/30/2014Completed
VA will refine the unconscious bias training for VA employees. 09/30/2015
VA will expand the ODI/VALU Pilot program on MyCareer@VA to additional facilities focusing on training/developmental strategies to facilitate promotion.**MyCareer@VA events were held at three sites (DC, Boston, and Baltimore).
09/30/2014Completed
VA will conduct MyCareer@VA Day (successor to the ODI/VALU pilot program) events for additional facilities focusing on training/developmental strategies to facilitate promotion.**Draft proposal has been developed (1st Quarter)
09/30/2015
VA will track and monitor advancement of employees in selected occupations within the pipeline to ensure upward mobility is occurring using the applicant pool data. 09/30/2015
ODI will work with OHRM to review Merit Promotion Policies (i.e. Directive 5005). 09/30/2015
REPORT OF ACCOMPLISHMENTS and MODIFICATIONS TO OBJECTIVE
VA has entered into a Memorandum of Understanding (MOU) with the African American Federal Executives Association (AAFEA), and the Asian American Government Executives Network (AAGEN). The intent of the MOU is to build on collaborations for performing outreach, and leveraging resources for talent management of
diverse groups within the Federal sector. It is anticipated that VA’s partnership with AAFEA and AAGEN respectively, will encourage and promote more participation from diverse groups in the pipelines for the Senior Executive Service and senior level positions within the Department, and other Federal sector agencies. ODI is the lead Office for this diversity initiative.
The AAGEN Memorandum was signed during its 10th annual Leadership Development Training Workshop at the Doubletree Hotel in Crystal City, VA on June 5, 2014, as part of VA’s DAS D&I participation as a panelist during a Leadership seminar sponsored by AAGEN. The workshop was designed to provide valuable learning and networking opportunities for all public servants to enhance their professional careers. During fiscal year (FY) 2014, VA Learning University (VALU) and the Office of Diversity and Inclusion (ODI) partnered to facilitate MyCareer@VA Day events at three VA facilities: the Board of Veterans’ Appeals (BVA), VA Maryland Healthcare System (Baltimore), and Boston VA Healthcare System. The MyCareer@VA Day events were VA, in-person career development workshops designed to improve VA employees’ understanding of career development principles and resources in order to improve their engagement and career mobility. These events were designed to support President Obama’s goal of engaging a higher performing diverse Federal workforce by creating programs aimed to address career progression barriers and bottle necks experienced by individuals of diverse groups and people with targeted disabilities (PWTD) in Wage Grade (WG) positions and at GS levels 9 and below.
The MyCareer@VA Day workshops consisted of the following events: Sessions for all employees that covered: the importance of career planning; demonstration of the innovative tools and
resources on MyCareer@VA; how to learn essential skills for the application process (e.g., resume writing, interviewing, job fit). MyCareer@VA Team members worked with employees one-on-one to help them use the MyCareer@VA website, register for CareerPower, and answer any questions.
Sessions for managers, supervisors, and mentors that assists in fostering more engaged, diverse, and effective teams. Participants had access to either a virtual career development course (Career Power) or a career development
workbook, each designed to guide the employee step-by-step through the entire career development process.
During these events, VA directly informed 176 VA employees through the career development sessions and indirectly informed the 8,386 VA employees through distributing facility-wide, marketing and communications. Entering the second year of conducting these events, progress has been demonstrated through participant feedback on improved opportunities for career progression.
69

70

EEOC FORM715-01PART I
U.S. Equal Employment Opportunity CommissionFEDERAL AGENCY ANNUAL
EEO PROGRAM STATUS REPORT
DEPARTMENT OF VETERANS AFFAIRS
FY 2014
STATEMENT OF CONDITION THAT WAS A TRIGGER FOR A POTENTIAL BARRIER:
High Volume of Discrimination Complaints: In FY 2014, the number of findings of discrimination for VA decreased (37** in FY 2013 and 31 in FY 2014). Retaliation, disability, and race were the most prevalent bases of discrimination in those findings.
** It was previously reported in the FY 2013 MD 715 report as 36.
BARRIER ANALYSIS 5: (National)
The per capita filing rate at the informal and formal stages is higher than the FY2012 Government wide average. FY2012 rates are the most recent Government wide per capita rates available. ORM’s informal rate increased from 1.26 percent to 1.33 percent from FY 2013 to 2014 (slightly higher than the Government wide average of 1.1 percent); and the formal filing rate remained at 0.61 percent (still higher than the government-wide average is of .5 percent). While the Department continues to make some progress continued work is needed to reach the Government wide levels. In FY 2014, the number of findings in discrimination decreased (37 in 2013 and 31 in 2014). Retaliation, disability, and race were the most prevalent bases of discrimination in those findings. Some corrective strategies to focus on include increasing early resolution of EEO complaints through counseling and ADR, reviewing findings and incorporating lessons learned into training, and increasing EEO and consultative services.
STATEMENT OF IDENTIFIED BARRIER:
Provide a succinct statement of the agency policy, procedure or practice that has been determined to be the barrier of the undesired condition.
Lack of understanding by managers and supervisors of EEO obligations.Delays in requesting or scheduling ADR. There also appears to be a lack of communications by managers and supervisors with Human Resources and EEO Program Managers.
Current findings indicate that more efficient training is required.
OBJECTIVE:
State the alternative or revised agency policy, procedure or practice to be implemented to correct the undesired condition.
Review findings of discrimination to identify lessons learned and incorporate into manager and supervisor training. Develop and implement standardized and customized resolution strategies that are disseminated to all managers and supervisors. Target pending cases that are likely to result in a finding of discrimination and encourage resolution through available ADR tools. More actively promote the use of ADR before and during the EEO complaint process. Utilize mechanisms that allow facilities to track progress in EEO/ADR.
RESPONSIBLE OFFICIAL: ORM, ODI, VALU, Administrations
DATE OBJECTIVE INITIATED: 09/30/2010
TARGET DATE FOR COMPLETION OF OBJECTIVE:
09/30/2015
71

EEOC FORM715-01PART I
EEO Plan To Eliminate Identified Barrier
INSTRUCTIONS: Describe the plans to implement the identified activities in the spaces below showing dates of benchmarks and responsible individuals. The success in implementing these plans should be shown in the REPORT OF ACCOMPLISHMENTS and MODIFICATIONS TO OBJECTIVE section. Items from the VA Diversity and Inclusion Annual Performance (DISP)
TARGET DATE(Must be specific) example:
mm/dd/yyyy
Encourage Resolution of Complaints Likely To Result in Findings of Discrimination. ORM has a process in place to alert senior leaders of pending cases that may result in findings of discrimination. ORM encourages and facilitates resolution of these cases where possible.
09/30/2015Annual process
Utilize mechanisms that allow facilities to track progress in EEO/ADR. One of the responsibilities of ORM is to be proactive in providing VA managers resources to assist them in identifying and resolving workplace disputes as early as possible. ORM has deployed an electronic dashboard nationwide that is designed to provide current data regarding key indicators of the work environment. Data in the dashboard (graphs, charts, and raw data) identifies trends and provides the basis for strategies to address out-of-line scenarios or to establish strategic targets regarding EEO and ADR activity at the facility level.
09/30/2014Annual process
Encourage Resolution of EEO Complaints at the Informal Stage. ORM has developed strategies for EEO counselors, facility EEO and ADR program managers and ADR neutrals to use to support early resolution of complaints. Strategies include video teleconferencing and on-site counseling, increased assignment of full-time neutrals with record of effective results, greater use of pre-mediation meetings with the parties, and increased collaboration with General/Regional Counsel to timely review and finalize settlement agreements. Additionally, ORM developed a resource document with examples of resolution strategies and settlement outcomes that is shared with managers participating in ADR. ORM has also established a call center that allows employees and managers to inquire about various forums available to address workplace disputes that often lead to EEO complaints. These initiatives have promoted ADR as a primary resource to address workplace disputes and EEO complaints
09/30/2014Annual process
Based on the Critical Indicators page in the automated MD-715 workforce analysis slides, identify the topics coded red for this and subordinate facilities. Describe your plan to address these issues. ODI has systematically been rank ordering all-employee survey data, separation rates, complaint rates, and sick leave rates and other workforce data to identify the facilities that appear to have the greatest potential risk (including facilities where findings of discrimination have been rendered). Facilities ranking lowest are selected for Technical Assistance Reviews (TAR). ODI later reviews the implementation of the resulting recommendations. Regions also use this data for their own interventions.**ODI completed 6 TARs during FY 2012. This is a recurring process.
09/30/2015Annual process
Identify and address any process or systemic issues at facilities where findings of discrimination have been made. ORM Monitors compliance for training ordered as a result of a finding of discrimination and certifies all training content and training agendas. ORM works with facility or network EEO managers to schedule the training. Training is completed in all cases involving a finding of discrimination and evaluations are analyzed and published.
09/30/2015Annual process
Roll out unconscious bias, cultural competency, and interpersonal effectiveness training for VA employees in partnership with VALU.
09/30/2014Completed
REPORT OF ACCOMPLISHMENTS and MODIFICATIONS TO OBJECTIVE
72

In FY 2014, the informal per capita filing rate increased to 1.33 percent and the formal filing rate remained at 0.61 percent. Informal resolution rate increased from 52 percent in FY 2013 to 53 percent in FY 2014.
ORM has a process in place to identify cases that may result in a finding of discrimination. ORM brings these cases to the attention senior leaders to explore resolution.
While ORM monitors and ensures compliance with all findings of discrimination, it is more important to take actions that will ultimately result in less findings of discrimination. To that end, ORM and ODI have developed training programs for senior leaders that focus on both EEO responsibilities in the areas of RA retaliation, and harassment as well as proactive conflict management skills. ODI has posted new EEO and diversity training modules on its Web site for easy, nationwide access. Finally, ODI is currently increasing its training and organizational staffing complement in order to accede to the growing demand for these services. ODI will continue to partner with HR and ORM to provide diversity awareness training to the administrations and facilities. Our goal is to provide facilities with a clear understanding of what diversity is and what it isn't, to raise a greater awareness and sensitivity to diversity issues that go well beyond the assumed categories, and to recommend behavioral tools for fostering a more cohesive workplace.
In FY 2013, VA ODI updated its mandatory EEO, Diversity, and Conflict Management Training for Executives, Managers, and Supervisors and trained over 30,000 managers nationwide. This training includes modules on disability employment and RA. As a result of this and the other proactive prevention strategies described below, VA’s informal per capita rate of discrimination complaint filings increased minimally from FY 2013 (from 1.26 percent to 1.33 percent) while VA’s formal per capita rate remained at 0.61 percent.
ORM conducted numerous training and awareness programs in the area of ADR and increased its complaint resolution rate from 52 percent in FY 2013 to 53 percent in FY 2014. One strategy included disseminating ADR pre-mediation videos to all parties in conflict to educate them about the process, the value of ADR, and how it can be a tool in successful resolution.
As of September 30, 2014:
32,259 Department of Veterans Affairs (VA) executives, managers, and supervisors (approximately 96.5 percent of the Department’s supervisory officials) had completed VA Talent Management System (TMS) Course 1328672, “EEO, Diversity, and Conflict Management Training for Managers and Supervisors." VA TMS Course 1328672 is an online mandatory biennial training requirement that provides VA executives, managers, and supervisors with the knowledge and tools necessary to meet their legal obligations and supervisory responsibilities in the areas of Equal Employment Opportunity (EEO), Reasonable Accommodation, Diversity and Inclusion, and Alternative Dispute Resolution (ADR) and Conflict Management.
Approximately 95 percent of the Department’s targeted supervisory level employees completed TMS Course 3883649, “Whistleblower Rights and Protection & Prohibited Personnel Practices Training.” The Department has established completing this learning program as a mandatory biennial training requirement to provide VA senior executives, managers, and supervisors with the awareness and knowledge necessary to meet their legal obligations and supervisory responsibilities under the Whistleblower Protection Act (WPA) of 1989 and Whistleblower Protection Enhancement Act (WPEA) of 2012. This course meets the program requirements prescribed by the Office of Special Counsel (OSC) 2302(c) Certification Program and enabled the Department to meet its statutory obligation regarding informing VA employees of the rights and remedies available to them under the WPA, the WPEA, and related civil service laws.
Approximately 335,679 VA employees completed TMS Course 8872 Prevention of Workplace Harassment/No FEAR.” This mandatory biennial training requirement for all VA employees is intended to meet the Department’s obligation under the Notification and Federal Employee Anti-discrimination and Retaliation Act of 2002, that all federal employees receive training on their rights and responsibilities in the areas of equal employment opportunity, non-discrimination, and Whistleblower protections. This course supports the Department’s focus on cultivating a fair, diverse, and harassment-free work environment. This course also provides the Department’s policy and practice regarding the Prevention of Sexual Harassment (POSH).
During FY 2014, ODI expanded the delivery of customized EEO and diversity and inclusion learning events and organizational consultations. ODI conducted:
Over 125 face–to-face learning events at VA facilities national wide to over 4,500 VA employees to deliver content addressing civility and cultural competence.
Two customized learning events delivered at the invitation of external Federal agencies and the Department of Defense to over 281 employees. These events addressed LGBT issues with the intent of building awareness of agency responsibilities under emerging legal obligations and shifting social perspectives.
26 New Employee Organization (NEO) briefings top acquaint new hires with VA policy and practice regarding EEO, Diversity & Inclusion, and RA.
4 New Manager & Supervisor learning events to prepare newly appointed VA managers and supervisors to execute their obligations to build a diverse workforce and sustain an Inclusive workplace.
Presentations at all VA’s Senior Leader Conferences to inform VA’s newly appointed members of the Senior Executives Service ) and title 38 Equivalents) of VA’s policy and agency expectations of VA executive to support institutions of VA Diversity and Inclusion values and strategies.
73

74

EEOC FORM715-01PART I
U.S. Equal Employment Opportunity CommissionFEDERAL AGENCY ANNUAL
EEO PROGRAM STATUS REPORT
DEPARTMENT OF VETERANS AFFAIRS
FY 2014
STATEMENT OF CONDITION THAT WAS A TRIGGER FOR A POTENTIAL BARRIER:
Less than Expected Participation in the SES Cadre
With the exception of White and Hispanic males, there is a less than expected participation rate for all the other race/ethnicity and gender groups in the SES and Title 38 SES equivalents cadre.
BARRIER ANALYSIS 6: The benchmark for comparing the SES and Title 38 SES equivalents cadre is the participation rates for the entire workforce. White females represented 32.1 percent which was below its baseline of 35.17 percent. Black males and females represented 5.29 percent and 5.01 percent, respectively, which were below their respective baselines of 9.25 percent and 14.77 percent. Hispanic females represented 1.11 percent and were significantly below its benchmark of 3.53 percent. Asian male and female represented 1.67 percent and 1.11 percent, respectively, which were below their benchmarks of 2.81 percent and 4.45 percent. There were no Native Hawaiian/Pacific islander males and females in the SES cadre. The benchmark was 0.14 percent and 0.16 percent, respectively. American Indian and Alaska Native males and females represented 0.56 percent and 0.56 percent which were below the benchmark of 0.59 percent and 0.90 percent, respectively.
In the VA SES cadre, White males represented 47.35 percent, almost double the benchmark of 24.78 percent. This is the trigger and could account for the less than expected participation for most of the other demographic groups.
Similarly White males represent about 52 percent of the SES appointments, which again is more than double the benchmark of 24.78 percent.
STATEMENT OF IDENTIFIED BARRIER:
Provide a succinct statement of the agency policy, procedure or practice that has been determined to be the barrier of the undesired condition.
Further examination of the policies, procedures, and practices impacting the hiring, appointment processes, and separation processes is needed.
OBJECTIVE:
State the alternative or revised agency policy, procedure or practice to be implemented to correct the undesired condition.
Refine the applicant flow system to identify potential barriers in the recruitment and selection process.Review the hiring policies, procedure and practices.Eliminate, when possible, any barriers to equal opportunity.
RESPONSIBLE OFFICIAL: Assistant Secretary for Human Resources and Administration; Deputy Assistant Secretary for Human Resources Management; Deputy Assistant Secretary for Office of Diversity and Inclusion; Executive Director for CSEMO, Other Administration HR Officials
DATE OBJECTIVE INITIATED: 11/01/2014
TARGET DATE FOR COMPLETION OF OBJECTIVE:
03/31/2016
EEOC FORM715-01PART I
EEO Plan To Eliminate Identified Barrier
75
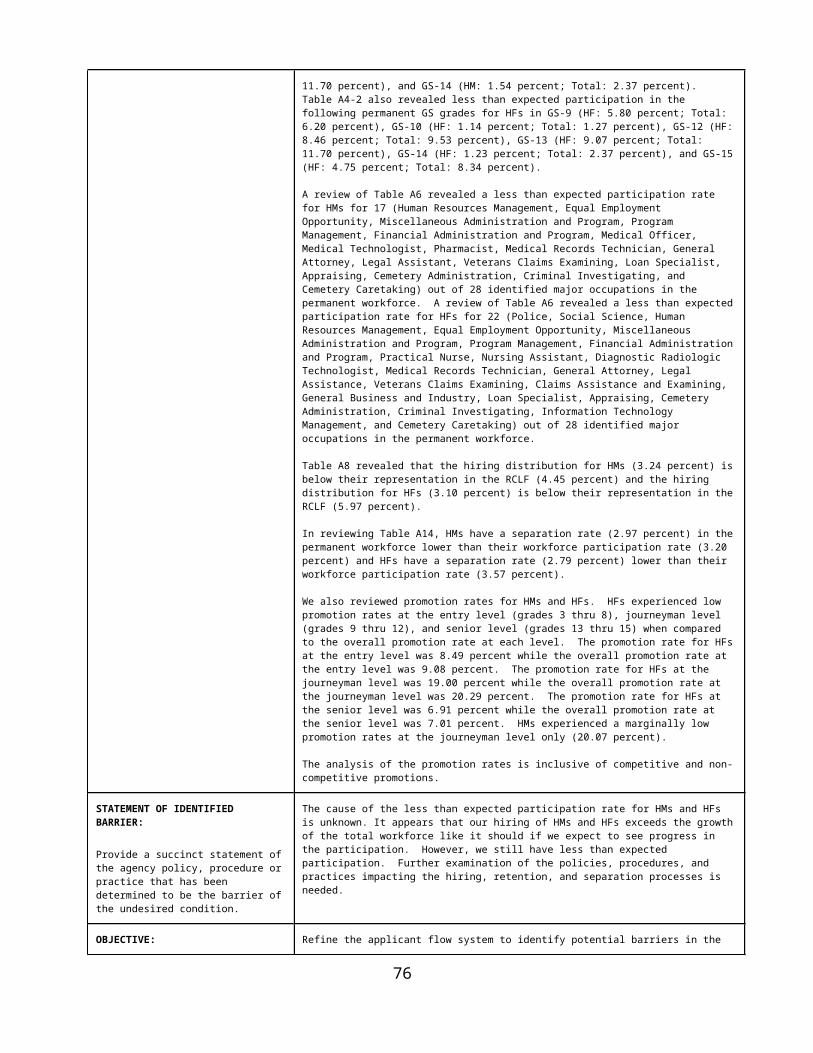
INSTRUCTIONS: Describe the plans to implement the identified activities in the spaces below showing dates of benchmarks and responsible individuals. The success in implementing these plans should be shown in the REPORT OF ACCOMPLISHMENTS and MODIFICATIONS TO OBJECTIVE section.
TARGET DATE(Must be specific)
example: mm/dd/yyyy
ODI will meet with newly appointed Executive Director of CSEMO to discuss SES applicant flow issues. 12/31/2014
ODI will define capability requirements to integrate SES applicant data into existing system. 05/31/2015
ODI will integrate capability requirements into the refined applicant flow system. 12/31/2015
ODI will test the newly integrated system. 03/31/2016
ODI will deploy the newly integrated system. 03/31/2016
REPORT OF ACCOMPLISHMENTS and MODIFICATIONS TO OBJECTIVE
76

EEOC FORM 715-01 PART J
PART IDepartment or
Agency Information
1. Agency 1. U.S. Department of Veterans Affairs
1.a. 2nd Level Component 1.a.
1.b. 3rd Level or lower 1.b.
PART IIEmployment Trend and
Special Recruitment for Individuals With
Targeted Disabilities
Enter Actual Number at the ...
SEP - FY13. SEP - FY14. Net Change
Number % Number % Number Rate of Change
Total Work Force 336,119 100.00% 347,054 100.00% 10,935 03.25%
Reportable Disability 36,996 11.01% 40,629 11.71% 3,633 09.82%
Targeted Disability* 6,682 01.99% 7,292 02.10% 610 09.13%
1. Total Number of Applications Received From Persons With Targeted Disabilities during the reporting period.
***
2. Total Number of Selections of Individuals with Targeted Disabilities during the reporting period.
1,621
PART III Participation Rates In Agency Employment Programs
Other Employment/Personne
l Programs
TOTAL Reportable Disability Targeted Disability Not Identified No Disability
# % # % # % # %
3. Competitive Promotions
8,585 1,579 18.39% 207 02.41% 380 04.43% 6,626 77.18%
4. Non-Competitive Promotions
9,927 2,215 22.31% 355 03.58% 428 04.31% 7,284 73.38%
5. Employee Development/Training
*** *** *** *** *** *** *** *** ***
5.a. Grades 5 - 12 *** *** *** *** *** *** *** *** ***
5.b. Grades 13 - 14 *** *** *** *** *** *** *** *** ***
5.c. Grade 15/SES Development Training
*** *** *** *** *** *** *** *** ***
6. Employee Recognition and Awards
--- --- --- --- --- --- --- --- ---
6.a. Time-Off Awards (Total hrs. awarded)
195,003 24,826 12.73% 3,138 01.61% 5,497 02.82% 164,680 84.45%
6.b. Cash Awards (total $$$ awarded)
$205,971,902
$22,424,072
10.89% $3,072,969
01.49% $4,765,370
02.31% $178,782,460
86.80%
6.c. Quality-Step Increase
838 115 13.72% 14 01.67% 0 00.00% 723 86.28%
*** = Data is not currently being collected.
77

MD-715 - Part J*= Data shown includes full-time, part-time and intermittent permanent employees in a pay status and excluding medical and manila residents. Please see Data Definitions for a listing of the Nature of Action codes that are included for Time-Off awards, Cash Awards, and Quality-Step Increase.
Analysis
VA’s representation of individuals with targeted disabilities has exceeded the Administration’s goal of 2 percent and is above the government average of 0.99 percent for FY 2012 (the latest data available). However, this group has a glass ceiling at the GS-9/title 38 equivalent level. Approximately 9 percent of the total workforce are in wage grade jobs. About 5.97 percent of the wage grade workforce are IWTDs. Whereas, for the white collar positions about 1.72 percent are IWTDs.
In FY 2014, the percent of VA’s permanent workforce with a targeted disability increased to 2.08 percent, up from 1.92 percent in FY 2013 and 1.80 percent in FY 2012. The rate of growth, or net change, for the total permanent workforce with targeted disabilities (12.19 percent) was more than three times the rate of growth for the entire permanent workforce (3.59 percent), [Reference Table B1]. This high net change was essential to achieving the on board ratio increase.
Permanent employees with targeted disabilities are not well represented above GS-9/Title 38 equivalent pay levels nor at the Senior Executive Level (0.10 percent compared to 0.12 percent for the total workforce). From FY 2013 to 2014, employees with targeted disabilities experienced a marginal increase in their participation rate at the GS-11, GS-12, GS-13 and 14/title 38 equivalents. There was a marginal decrease at the GS-10, 15/title 38 equivalent.
With the exception of Executive/Senior Level and Mid-Level Officials and Managers (Table B3), employees with targeted disabilities made gains in FY 2014 in all other occupational categories. They are now 1.29 percent of the Executive/Senior Level (1.48 percent in FY 2013), 1.27 percent of Mid-Level Officials and Managers (1.30 percent in 2013), 2.01 percent of First-Level Officials and Managers (1.87 percent in 2013) and 1.84 of Total Officials and Managers (1.74 percent in 2013).
The five job series with the largest number of individuals with targeted disabilities are Custodial Workers (901), Medical Support Assistant (545), Miscellaneous Clerk and Assistant (476), Food Service Worker (400), and Nurse (339).
Individuals with targeted disabilities (IWTD) represented 3.58 percent of the non-competitive promotions pool exceeding the expected baseline of 1.99 percent. Similarly, individuals with targeted disabilities represented 2.47 percent of the competitive promotions pool, which also exceeds the expected baseline of 1.99 percent. During FY 2014, IWTDs experienced a 5.14 percent promotion rate in the leadership pipeline (promotions to GS 13, 14, and 15), which is lower than the 8.14 percent promotion rate experienced by individuals with no disabilities. The trend is reversed for promotions to GS 7 through GS12. IWTDS experienced a 17.43 percent promotion rate while individuals with no disabilities experienced a 16.91 percent promotion rate.
At the end of FY 2014, 24.53 percent of employees with targeted disabilities in permanent positions were in wage grade occupations, up from 23.35 percent in FY 2013. In comparison, at the end of FY 2014, 7.38 percent of individuals with no disabilities (includes those who did not identify) in permanent positions were in wage grade positions, down from 7.69 percent in FY 2013.
Generally, the glass ceiling for IWTDs in the wage grade occupations occurs at grade 3. Approximately, 80 percent of IWTDs in Wage Grades 1 and 2 self-reported having severe intellectual or psychiatric disabilities. This same group is approximately 67 percent of the number of IWTDs in wage grade positions. With the exception of one instance, there are no IWTDs at wage grades 12 through 15.
The top three wage grade occupations for individuals without disabilities (includes those who did not identify) are Custodial Worker (7,329), Food Service Worker (3,630) and Motor Vehicle Operator (1,254). By legislation, the Custodial job series is reserved for Veterans. There were 901 Custodial Workers with a targeted disability.
Also, while 8.39 percent of the total VA permanent workforce with no disabilities separated in FY 2014, 13.40 percent of employees with targeted disabilities separated. Sixty-seven percent of the employees with targeted disabilities who separated have psychiatric disabilities. Of the employees with targeted disabilities who were involuntarily separated, 83 percent (141) have psychiatric disabilities. Of VA’s permanent employees with targeted disabilities, 58 percent have psychiatric disabilities. While this group is only 1.20 percent of VA’s workforce, they were 5.22 percent of involuntary separations.
The number of Selective Placement Coordinators and Local RA Coordinators with the proper skill set remains insufficient throughout the Department.
The ratio of complaints based on disability remains high. It increased to 30 percent in FY 2014, up from 29 percent in FY 2013. Total number of cases filed in FY2013 was 2047, in FY2014 was 2030. The table below provides the number of complaints based on disability.
FY13 FY14
78
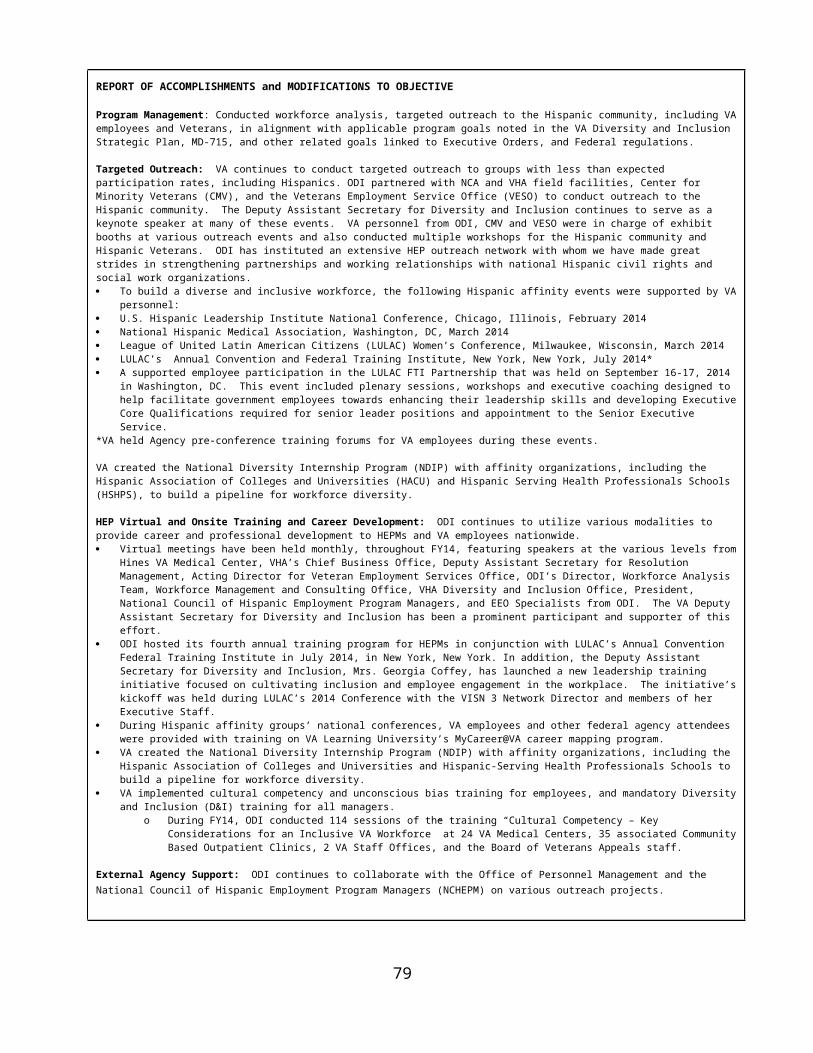
# % # %Psychiatric Disability
227 11% 256 12%
Physical Disability 427 21% 480 23%TOTAL Disability* 586 29% 635 30%
VA has encountered obstacles in installing assistive technology because each facility has a slightly different infrastructure.
Accomplishments
In FY 2014, ODI trained approximately 400 employees on how to identify less than expected participation rates within their respective facilities. ODI reports quarterly on the progress of hiring individuals with targeted disabilities. ODI conducted Schedule A and RA training on all six technical assistance review visits. ODI issued guidance on Schedule A hiring, disability law, RA, etc. to the Selective Placement Coordinators and the LRACs.
In FY 2014, VA made great strides toward the goal that two percent of the workforce be people with targeted disabilities. This group is now 2.10 percent of the work force, an increase from 1.99 percent at the end of FY 2013. While the VA total workforce had a 3.25 percent net change, there was an 9.13 percent net change for employees with targeted disabilities. This group was 3.27 percent of total hires.
For 2014, 14 interns were hired VA-wide; 11 were paid by ODI’s central fund. VA ranked second highest in government for placement of WRP interns during FY 2014
Quarterly updates on hires of people with targeted disabilities were sent to all facilities and VACO, letting them know of their progress. Periodically, the Disability Program Manager sent emails providing guidance on the Schedule A excepted appointment authority and other pertinent guidance.
RA is required by the Rehabilitation Act of 1973, as amended, and is also critical to the retention of these employees. The Centralized Fund was used to reimburse the $376,606 in accommodation costs throughout the VA The VA employees, LRACs, who are responsible for processing accommodation requests received training on the process and on the automated tracking system. The automated tracking program “Reasonable Accommodations Compliance System” was rolled out in FY 2013 and all Administrations were instructed to ensure that every LRAC was using the system.
Based on questions from LRACs, supervisors, and employees, as well as new EEOC guidance, VA Handbook 5975.1, Processing Requests for Reasonable Accommodation from Applicants and Employees, was updated November 27, 2013. Several other agencies have said they are waiting to see VA’s new procedures.
Data on employment of individuals with targeted disabilities is included in ODI’s quarterly reports which were given to senior staff. Quarterly hiring data is also shared with EEO and HR staff VA-wide. This resulted in most VA components exceeding the hiring goal in FY 2014.
79

Planned Activities
Recruiting Individuals with Targeted Disabilities Target DateODI will publicize best practices from facilities that have taken proactive steps and demonstrated an increase in hiring of individuals with targeted disabilities, annually.
09/30/2015Annually
ODI will release quarterly reports on success in meeting the 2 percent hiring goal in FY 2014. These reports will go to the Secretary and the Administrators.
09/30/2015
ODI will continue to conduct Schedule A and RA training biannually to HR, EEO staff, and all managers and supervisors to encourage the use of this special hiring authority and support the employment of IWTDs.
09/30/2015Biennial
Placing Individuals with Targeted Disabilities to Improve Possibilities for Career Development
Target Date
ODI will ensure that placement for career growth is included in training, newsletter articles, and site visits as a topic, annually.
02/15/2015
When ODI trains HR staff and hiring officials on employment of individuals with targeted disabilities, including the Schedule A hiring process. We will stress the need to place them in positions with promotion potential.
09/30/2015
ODI will encourage VA components to report successes and best practices, which can be shared via the Diversity Newsletter issued bi-monthly by ODI.
09/30/2015
ODI will contact OPM and EEOC for guidance on how to legally provide opportunities for advancement.
Ongoing
Identify Individuals with Targeted Disabilities who can be advanced to higher positions
Target Date
ODI will instruct the administrations on pulling education/pay data so that they can monitor their progress, annually.
09/30/2015Ongoing
ODI will encourage VA components to report successes and best practices, which can be shared via the Diversity Newsletter issued bi-monthly by ODI.
09/30/2015Ongoing
ODI will expand ODI/VALU program on MyCareer@va to additional facilities focusing on training/developmental strategies to facilitate promotion potential.
09/30/2015
During these events, VA directly informed 176 VA employees through the career development sessions and indirectly informed the 8,386 VA employees through distributing facility-wide marketing and communications. Entering the second year of conducting these events, progress has been demonstrated through participant feedback on improved opportunities for career progression.
09/30/2015Ongoing
Coordination and Collaboration Efforts Target DateODI will monitor progress on the hiring objective for individuals with disabilities contained Diversity and Inclusion Strategic Plan on a quarterly basis through the VA’s MD-715 on-line reporting system.
09/30/2015
ODI will provide VA Managers and HR staff with quarterly training in disability law and RA procedures.
09/30/2015Ongoing
ODI will continue to work with CIO staff to create guidance on streamlining the approval and procurement of electronic/information technology accommodations.
09/30/2015Ongoing
ODI will work with the Veterans Employment Services Office to explore options for employees who are Veterans with psychiatric disabilities, in an effort to reduce involuntary separations.
09/30/2015Ongoing
ODI will work with Mental Health services to identify strategies to eliminate any barriers to reasonable accommodations specific to employees with psychiatric disabilities.
09/30/2015Ongoing
ODI will continue to issue guidance to the Selective Placement Coordinators and the LRACs.
09/30/2015Ongoing
ODI will solicit members for a disability employment workgroup to address disability employment issues.
09/30/2015
80

Workforce Analytical Tables
81

(This Page Intentionally Left Blank)
82

83
Table A1: Total Workforce - by Race/Ethnicity and Sex - SEP - FY2014
All VA TOTAL
EMPLOYEES
RACE/ETHNICITY
Hispanic or Latino
Non-Hispanic or Latino
White Black or African American
Asian Native Hawaiian or Other Pacific
Islander
American Indian or Alaska Native
Two or More Races/ Undisclosed
All male female male female male female male female male female male female male female male female
TOTAL
FY 2013 # 336,119 136,576 199,543 10,428 11,836 83,600 119,585 30,572 49,496 9,236 14,644 401 489 1,950 2,910 389 583
% 100.02% 40.64% 59.38% 03.10% 03.52% 24.87% 35.58% 09.10% 14.73% 02.75% 04.36% 00.12% 00.15% 00.58% 00.87% 00.12% 00.17%
FY 2014 # 347,054 141,708 205,346 10,926 12,252 85,983 122,062 32,093 51,247 9,740 15,432 472 549 2,061 3,134 433 670
% 100.01% 40.84% 59.17% 03.15% 03.53% 24.78% 35.17% 09.25% 14.77% 02.81% 04.45% 00.14% 00.16% 00.59% 00.90% 00.12% 00.19%
RCLF (2010)
% 99.96% 34.12% 65.84% 03.89% 05.70% 23.23% 45.50% 03.54% 09.19% 02.95% 04.36% 00.04% 00.08% 00.27% 00.64% 00.20% 00.37%
CLF (2010) % 100.00% 51.84% 48.16% 5.17% 4.79% 38.33% 34.03% 5.49% 6.53% 1.97% 1.93% 0.07% 0.07% 0.53% 0.53% 0.26% 0.28%
Difference
Ratio Change
# 10,935 5,132 5,803 498 416 2,383 2,477 1,521 1,751 504 788 71 60 111 224 44 87
% -0.01% 0.20% -0.21% 0.05% 0.01% -0.09% -0.41% 0.15% 0.04% 0.06% 0.09% 0.02% 0.01% 0.01% 0.03% 0.00% 0.02%
Net Change
% 3.25% 3.76% 2.91% 4.78% 3.51% 2.85% 2.07% 4.98% 3.54% 5.46% 5.38% 17.71% 12.27% 5.69% 7.70% 11.31% 14.92%
PERMANENT
FY 2013 # 312,325 127,034 185,291 9,774 11,043 77,764 110,811 28,939 46,680 8,067 13,104 362 439 1,776 2,687 352 527
% 100.02% 40.68% 59.34% 03.13% 03.54% 24.90% 35.48% 09.27% 14.95% 02.58% 04.20% 00.12% 00.14% 00.57% 00.86% 00.11% 00.17%
FY 2014 # 323,538 132,490 191,048 10,270 11,445 80,443 113,285 30,436 48,394 8,604 13,918 437 505 1,903 2,888 397 613
% 100.00% 40.95% 59.05% 03.17% 03.54% 24.86% 35.01% 09.41% 14.96% 02.66% 04.30% 00.14% 00.16% 00.59% 00.89% 00.12% 00.19%
Difference
Ratio Change
# 11,213 5,456 5,757 496 402 2,679 2,474 1,497 1,714 537 814 75 66 127 201 45 86
% -0.02% 0.27% -0.29% 0.04% 0.00% -0.04% -0.47% 0.14% 0.01% 0.08% 0.10% 0.02% 0.02% 0.02% 0.03% 0.01% 0.02%
Net Change
% 3.59% 4.29% 3.11% 5.07% 3.64% 3.45% 2.23% 5.17% 3.67% 6.66% 6.21% 20.72% 15.03% 7.15% 7.48% 12.78% 16.32%
TEMPORARY
FY 2013 # 20,271 8,243 12,028 469 529 5,252 7,750 1,192 2,040 1,107 1,427 33 43 154 190 36 49
% 99.99% 40.66% 59.33% 02.31% 02.61% 25.91% 38.23% 05.88% 10.06% 05.46% 07.04% 00.16% 00.21% 00.76% 00.94% 00.18% 00.24%
FY 2014 # 19,969 7,891 12,078 466 549 4,966 7,769 1,186 2,055 1,077 1,405 26 37 139 214 31 49

84
Table A1: Total Workforce - by Race/Ethnicity and Sex - SEP - FY2014
All VA TOTAL
EMPLOYEES
RACE/ETHNICITY
Hispanic or Latino
Non-Hispanic or Latino
White Black or African American
Asian Native Hawaiian or Other Pacific
Islander
American Indian or Alaska Native
Two or More Races/ Undisclosed
All male female male female male female male female male female male female male female male female
% 100.02% 39.52% 60.50% 02.33% 02.75% 24.87% 38.91% 05.94% 10.29% 05.39% 07.04% 00.13% 00.19% 00.70% 01.07% 00.16% 00.25%
Difference
Ratio Change
# -302 -352 50 -3 20 -286 19 -6 15 -30 -22 -7 -6 -15 24 -5 0
% 0.03% -1.14% 1.17% 0.02% 0.14% -1.04% 0.68% 0.06% 0.23% -0.07% 0.00% -0.03% -0.02% -0.06% 0.13% -0.02% 0.01%
Net Change
% -1.49% -4.27% 0.42% -0.64% 3.78% -5.45% 0.25% -0.50% 0.74% -2.71% -1.54% -1.21% -3.95% -9.74% 12.63% -3.89% 0.00%
NON-APPROPRIATED
FY 2013 # 3,523 1,299 2,224 185 264 584 1,024 441 776 62 113 6 7 20 33 1 7
% 100.02% 36.88% 63.14% 05.25% 07.49% 16.58% 29.07% 12.52% 22.03% 01.76% 03.21% 00.17% 00.20% 00.57% 00.94% 00.03% 00.20%
FY 2014 # 3,547 1,327 2,220 190 258 574 1,008 471 798 59 109 9 7 19 32 5 8
% 100.00% 37.41% 62.59% 05.36% 07.27% 16.18% 28.42% 13.28% 22.50% 01.66% 03.07% 00.25% 00.20% 00.54% 00.90% 00.14% 00.23%
Difference
Ratio Change
# 24 28 -4 5 -6 -10 -16 30 22 -3 -4 3 0 -1 -1 4 1
% -0.02% 0.53% -0.55% 0.11% -0.22% -0.40% -0.65% 0.76% 0.47% -0.10% -0.14% 0.08% 0.00% -0.03% -0.04% 0.11% 0.03%
Net Change
% 0.68% 2.16% -0.18% 2.70% -2.27% -1.71% -1.56% 6.80% 2.84% -4.84% -3.54% 50.00% 0.00% -5.00% -3.03% 400.00% 14.29%
Data shown includes full-time, part-time, and intermittent employees in a pay status and excluding medical and Manila residents.The CLF data is based on the 2010 National Census Data and excludes Puerto Rico, and other US territories (i.e., Guam, ...)RCLF comparisons are based on 2010 National Census National data.For VHA, the methodology for computing RCLF has changed. The new methodology uses state level data for determining RCLF and is consistent with the methodology for VBA and NCA.Non-Appropriated employees include all employees whose salaries are paid from funds generated by the Canteens (Cost Center 8990).Ratio Change - Simple subtraction of Current Fiscal Year % from Prior Fiscal Year %. This is the standard VA measure of change of representation and is called Change % in other VSSC reports.Net Change - According to EEOC, this is calculated by dividing difference in employment numbers (current year vs prior year) by the number of employees in the prior year.

85
Table B1: Total Workforce - by Disability - SEP - FY2014
All VA TOTAL Total by Disability Status Detail for Targeted Disabilities
[04,05]No
Disability
[01]Not
Identified
[06-98]ReportableDisability
TotalTargetedDisability
[16,17,18]Hearing
[21,23,25]Vision
[28,30,32-38]Missing
Extremities
[64-69]Partial
Paralysis
[71-79]CompleteParalysis
[82]Epilepsy
[90]Severe
IntellectualDisability
[91]PsychiatricDisability
[92]Dwarfism
TOTAL
FY 2013 # 336,119 283,408 9,033 43,678 6,682 398 527 234 640 172 605 300 3,716 90
% 100.00% 84.32% 02.69% 12.99% 01.99% 00.12% 00.16% 00.07% 00.19% 00.05% 00.18% 00.09% 01.11% 00.03%
FY 2014 # 347,054 289,370 9,763 47,921 7,292 403 533 227 649 158 643 324 4,266 89
% 100.00% 83.38% 02.81% 13.81% 02.10% 00.12% 00.15% 00.07% 00.19% 00.05% 00.19% 00.09% 01.23% 00.03%
Difference
Ratio Change
# 10,935 5,962 730 4,243 610 5 6 -7 9 -14 38 24 550 -1
% 00.00% -00.94% 00.12% 00.82% 00.11% 00.00% -00.01% 00.00% 00.00% 00.00% 00.01% 00.00% 00.12% 00.00%
Net Change % 03.25% 02.10% 08.08% 09.71% 09.13% 01.26% 01.14% -02.99% 01.41% -08.14% 06.28% 08.00% 14.80% -01.11%
Federal High % 02.67%
PERMANENT
FY 2013 # 312,325 263,327 8,380 40,618 5,996 369 492 214 588 161 567 275 3,248 82
% 100.00% 84.31% 02.68% 13.01% 01.92% 00.12% 00.16% 00.07% 00.19% 00.05% 00.18% 00.09% 01.04% 00.03%
FY 2014 # 323,538 269,626 9,079 44,833 6,727 382 501 216 605 150 594 301 3,898 80
% 100.00% 83.34% 02.81% 13.86% 02.08% 00.12% 00.15% 00.07% 00.19% 00.05% 00.18% 00.09% 01.20% 00.02%
Difference
Ratio Change
# 11,213 6,299 699 4,215 731 13 9 2 17 -11 27 26 650 -2
% 00.00% -00.97% 00.13% 00.85% 00.16% 00.00% -00.01% 00.00% 00.00% 00.00% 00.00% 00.00% 00.16% -00.01%
Net Change % 03.59% 02.39% 08.34% 10.38% 12.19% 03.52% 01.83% 00.93% 02.89% -06.83% 04.76% 09.45% 20.01% -02.44%
TEMPORARY
FY 2013 # 20,271 17,032 554 2,685 611 21 27 19 46 11 33 15 433 6
% 100.00% 84.02% 02.73% 13.25% 03.01% 00.10% 00.13% 00.09% 00.23% 00.05% 00.16% 00.07% 02.14% 00.03%
FY 2014 # 19,969 16,685 583 2,701 495 15 24 11 37 8 40 14 339 7
% 100.00% 83.55% 02.92% 13.53% 02.48% 00.08% 00.12% 00.06% 00.19% 00.04% 00.20% 00.07% 01.70% 00.04%
Difference
Ratio Change
# -302 -347 29 16 -116 -6 -3 -8 -9 -3 7 -1 -94 1
% 00.00% -00.47% 00.19% 00.28% -00.53% -00.02% -00.01% -00.03% -00.04% -00.01% 00.04% 00.00% -00.44% 00.01%
Net Change % -01.49% -02.04% 05.23% 00.60% -18.99% -28.57% -11.11% -42.11% -19.57% -27.27% 21.21% -06.67% -21.71% 16.67%
NON-APPROPRIATED

86
Table B1: Total Workforce - by Disability - SEP - FY2014
All VA TOTAL Total by Disability Status Detail for Targeted Disabilities
[04,05]No
Disability
[01]Not
Identified
[06-98]ReportableDisability
TotalTargetedDisability
[16,17,18]Hearing
[21,23,25]Vision
[28,30,32-38]Missing
Extremities
[64-69]Partial
Paralysis
[71-79]CompleteParalysis
[82]Epilepsy
[90]Severe
IntellectualDisability
[91]PsychiatricDisability
[92]Dwarfism
FY 2013 # 3,523 3,049 99 375 75 8 8 1 6 0 5 10 35 2
% 100.00% 86.55% 02.81% 10.64% 02.13% 00.23% 00.23% 00.03% 00.17% 00.00% 00.14% 00.28% 00.99% 00.06%
FY 2014 # 3,547 3,059 101 387 70 6 8 0 7 0 9 9 29 2
% 100.00% 86.24% 02.85% 10.91% 01.97% 00.17% 00.23% 00.00% 00.20% 00.00% 00.25% 00.25% 00.82% 00.06%
Difference
Ratio Change
# 24 10 2 12 -5 -2 0 -1 1 0 4 -1 -6 0
% 00.00% -00.31% 00.04% 00.27% -00.16% -00.06% 00.00% -00.03% 00.03% 00.00% 00.11% -00.03% -00.17% 00.00%
Net Change % 00.68% 00.33% 02.02% 03.20% -06.67% -25.00% 00.00% -00.00% 16.67% 00.00% 80.00% -10.00% -17.14% 00.00%Data shown includes full-time, part-time, and intermittent employees in a pay status and excluding medical and Manila residents.Non-Appropriated employees include all employees whose salaries are paid from funds generated by the Canteens (Cost Center 8990).Ratio Change - Simple subtraction of Current Fiscal Year % from Prior Fiscal Year %. This is the standard VA measure of change of representation and is called Change % in other VSSC reports.Net Change - According to EEOC, this is calculated by dividing difference in employment numbers (current year vs prior year) by the number of employees in the prior year.

87
Table A2: TOTAL WORKFORCE BY COMPONENT - Permanent Workforce - by Race/Ethnicity and Sex - SEP - FY2014
All VABy Administration
TOTAL
EMPLOYEES
RACE/ETHNICITY
Hispanic or Latino
Non-Hispanic or Latino
White Black or African American
Asian Native Hawaiian or Other Pacific
Islander
American Indian or Alaska Native
Two or More Races/Undisclosed
All male female male female male female male female male female male female male female male female
TOTAL # 326,561 133,623 192,938 10,435 11,671 80,941 114,158 30,832 49,052 8,655 14,010 443 511 1,918 2,917 399 619
% 100.01% 40.93% 59.08% 03.20% 03.57% 24.79% 34.96% 09.44% 15.02% 02.65% 04.29% 00.14% 00.16% 00.59% 00.89% 00.12% 00.19%
RCLF (2010)
% 99.96% 33.78% 66.18% 03.90% 05.76% 22.96% 45.69% 03.56% 09.33% 02.85% 04.31% 00.04% 00.08% 00.27% 00.64% 00.20% 00.37%
VHA # 291,086 114,017 177,069 9,121 10,830 68,230 105,371 26,520 43,813 7,895 13,484 369 474 1,563 2,561 319 536
% 99.99% 39.17% 60.82% 03.13% 03.72% 23.44% 36.20% 09.11% 15.05% 02.71% 04.63% 00.13% 00.16% 00.54% 00.88% 00.11% 00.18%
VBA # 21,189 10,461 10,728 638 566 6,582 5,845 2,609 3,643 316 294 45 23 228 296 43 61
% 100.00% 49.36% 50.64% 03.01% 02.67% 31.06% 27.59% 12.31% 17.19% 01.49% 01.39% 00.21% 00.11% 01.08% 01.40% 00.20% 00.29%
NCA # 1,653 1,236 417 136 36 841 227 187 132 22 10 16 2 25 7 9 3
% 99.99% 74.77% 25.22% 08.23% 02.18% 50.88% 13.73% 11.31% 07.99% 01.33% 00.60% 00.97% 00.12% 01.51% 00.42% 00.54% 00.18%
STAFF OFFICES
# 12,633 7,909 4,724 540 239 5,288 2,715 1,516 1,464 422 222 13 12 102 53 28 19
% 99.99% 62.60% 37.39% 04.27% 01.89% 41.86% 21.49% 12.00% 11.59% 03.34% 01.76% 00.10% 00.09% 00.81% 00.42% 00.22% 00.15%Data shown includes full-time, part-time, and intermittent permanent employees in a pay status and excluding medical and Manila residents.RCLF comparisons are based on 2010 Census National data.For VHA, the methodology for computing RCLF has changed. The new methodology uses state level data for determining RCLF and is consistent with the methodology for VBA and NCA.

88
Table B2: TOTAL WORKFORCE BY COMPONENT - Permanent Workforce - by Disability - SEP - FY2014
All VABy Administration
TOTAL Total by Disability Status Detail for Targeted Disabilities
[04,05]No
Disability
[01]Not
Identified
[06-98]ReportableDisability
TotalTargetedDisability
[16,17,18]Hearing
[21,23,25]Vision
[28,30,32-38]Missing
Extremities
[64-69]Partial
Paralysis
[71-79]CompleteParalysis
[82]Epilepsy
[90]Severe
IntellectualDisability
[91]PsychiatricDisability
[92]Dwarfism
TOTAL # 326,561 272,252 9,158 45,151 6,783 388 506 216 611 150 600 310 3,920 82
% 100.00% 83.37% 02.80% 13.83% 02.08% 00.12% 00.15% 00.07% 00.19% 00.05% 00.18% 00.09% 01.20% 00.03%
Federal High % 02.27%
VHA # 291,086 245,344 7,573 38,169 6,008 312 452 177 514 122 523 301 3,535 72
% 100.00% 84.29% 02.60% 13.11% 02.06% 00.11% 00.16% 00.06% 00.18% 00.04% 00.18% 00.10% 01.21% 00.02%
VBA # 21,189 15,702 980 4,507 510 54 28 25 68 19 49 6 255 6
% 100.00% 74.10% 04.63% 21.27% 02.41% 00.25% 00.13% 00.12% 00.32% 00.09% 00.23% 00.03% 01.20% 00.03%
NCA # 1,653 1,123 91 439 49 2 2 3 4 1 2 0 35 0
% 100.00% 67.94% 05.51% 26.56% 02.96% 00.12% 00.12% 00.18% 00.24% 00.06% 00.12% 00.00% 02.12% 00.00%
STAFF OFFICES # 12,633 10,083 514 2,036 216 20 24 11 25 8 26 3 95 4
% 100.00% 79.81% 04.07% 16.12% 01.71% 00.16% 00.19% 00.09% 00.20% 00.06% 00.21% 00.02% 00.75% 00.03%
Data shown includes full-time, part-time, and intermittent permanent employees in a pay status and excluding medical and Manila residents.

89
Table A2: TOTAL WORKFORCE BY COMPONENT - Temporary Workforce - by Race/Ethnicity and Sex - SEP - FY2014
All VABy Administration
TOTAL
EMPLOYEES
RACE/ETHNICITY
Hispanic or Latino
Non-Hispanic or Latino
White Black or African American
Asian Native Hawaiian or Other Pacific
Islander
American Indian or Alaska Native
Two or More Races/Undisclosed
All male female male female male female male female male female male female male female male female
TOTAL # 20,493 8,085 12,408 491 581 5,042 7,904 1,261 2,195 1,085 1,422 29 38 143 217 34 51
% 100.01% 39.45% 60.56% 02.40% 02.84% 24.60% 38.57% 06.15% 10.71% 05.29% 06.94% 00.14% 00.19% 00.70% 01.06% 00.17% 00.25%
RCLF (2010)
% 99.35% 39.11% 60.24% 03.58% 04.67% 27.59% 42.51% 03.12% 06.92% 04.37% 05.24% 00.01% 00.03% 00.27% 00.53% 00.17% 00.34%
VHA # 19,993 7,782 12,211 464 572 4,877 7,838 1,175 2,084 1,074 1,419 27 38 132 210 33 50
% 100.00% 38.93% 61.07% 02.32% 02.86% 24.39% 39.20% 05.88% 10.42% 05.37% 07.10% 00.14% 00.19% 00.66% 01.05% 00.17% 00.25%
VBA # 242 112 130 9 6 50 39 42 76 4 1 1 0 5 7 1 1
% 99.99% 46.28% 53.71% 03.72% 02.48% 20.66% 16.12% 17.36% 31.40% 01.65% 00.41% 00.41% 00.00% 02.07% 02.89% 00.41% 00.41%
NCA # 85 78 7 11 0 53 4 8 3 1 0 1 0 4 0 0 0
% 100.01% 91.77% 08.24% 12.94% 00.00% 62.35% 04.71% 09.41% 03.53% 01.18% 00.00% 01.18% 00.00% 04.71% 00.00% 00.00% 00.00%
STAFF OFFICES
# 173 113 60 7 3 62 23 36 32 6 2 0 0 2 0 0 0
% 100.01% 65.33% 34.68% 04.05% 01.73% 35.84% 13.29% 20.81% 18.50% 03.47% 01.16% 00.00% 00.00% 01.16% 00.00% 00.00% 00.00%Data shown includes full-time, part-time, and intermittent temporary employees in a pay status and excluding medical and Manila residents.RCLF comparisons are based on 2010 Census National data.For VHA, the methodology for computing RCLF has changed. The new methodology uses state level data for determining RCLF and is consistent with the methodology for VBA and NCA.

90
Table B2: TOTAL WORKFORCE BY COMPONENT - Temporary Workforce - by Disability - SEP - FY2014
All VABy Administration
TOTAL Total by Disability Status Detail for Targeted Disabilities
[04,05]No
Disability
[01]Not
Identified
[06-98]ReportableDisability
TotalTargetedDisability
[16,17,18]Hearing
[21,23,25]Vision
[28,30,32-38]Missing
Extremities
[64-69]Partial
Paralysis
[71-79]CompleteParalysis
[82]Epilepsy
[90]Severe
IntellectualDisability
[91]PsychiatricDisability
[92]Dwarfism
TOTAL # 20,493 17,118 605 2,770 509 15 27 11 38 8 43 14 346 7
% 100.00% 83.53% 02.95% 13.52% 02.48% 00.07% 00.13% 00.05% 00.19% 00.04% 00.21% 00.07% 01.69% 00.03%
Federal High % 02.27%
VHA # 19,993 16,839 575 2,579 488 15 25 10 38 6 39 14 334 7
% 100.00% 84.22% 02.88% 12.90% 02.44% 00.08% 00.13% 00.05% 00.19% 00.03% 00.20% 00.07% 01.67% 00.04%
VBA # 242 133 12 97 7 0 0 1 0 1 1 0 4 0
% 100.00% 54.96% 04.96% 40.08% 02.89% 00.00% 00.00% 00.41% 00.00% 00.41% 00.41% 00.00% 01.65% 00.00%
NCA # 85 54 0 31 6 0 1 0 0 1 2 0 2 0
% 100.00% 63.53% 00.00% 36.47% 07.06% 00.00% 01.18% 00.00% 00.00% 01.18% 02.35% 00.00% 02.35% 00.00%
STAFF OFFICES # 173 92 18 63 8 0 1 0 0 0 1 0 6 0
% 100.00% 53.18% 10.40% 36.42% 04.62% 00.00% 00.58% 00.00% 00.00% 00.00% 00.58% 00.00% 03.47% 00.00%
Data shown includes full-time, part-time, and intermittent temporary employees in a pay status and excluding medical and Manila residents.

91
Table A3: OCCUPATIONAL GROUPS - Permanent Workforce - Distribution by Race/Ethnicity and Sex - SEP - FY2014
All VA TOTAL
EMPLOYEES
RACE/ETHNICITY
Hispanic or Latino
Non-Hispanic or Latino
White Black or African American
Asian Native Hawaiian or Other Pacific
Islander
American Indian or Alaska Native
Two or More Races/
Undisclosed
All male female male female male female male female male female male female male female male female
Executive/Senior Level Officials and Managers
# 1,237 725 512 40 20 561 379 93 91 20 15 2 2 7 4 2 1
% 100.00% 58.61% 41.39% 03.23% 01.62% 45.35% 30.64% 07.52% 07.36% 01.62% 01.21% 00.16% 00.16% 00.57% 00.32% 00.16% 00.08%
Mid-Level Officials and Managers
# 7,954 3,677 4,277 205 196 2,639 2,721 651 1,136 129 163 7 7 39 40 7 14
% 100.00% 46.23% 53.77% 02.58% 02.46% 33.18% 34.21% 08.18% 14.28% 01.62% 02.05% 00.09% 00.09% 00.49% 00.50% 00.09% 00.18%
First-Level Officials and Managers
# 31,228 14,392 16,836 1,047 987 9,140 9,690 3,298 5,094 535 569 57 46 259 370 56 80
% 100.00% 46.08% 53.91% 03.35% 03.16% 29.27% 31.03% 10.56% 16.31% 01.71% 01.82% 00.18% 00.15% 00.83% 01.18% 00.18% 00.26%
TOTAL Officials and Managers
# 40,419 18,794 21,625 1,292 1,203 12,340 12,790 4,042 6,321 684 747 66 55 305 414 65 95
% 100.00% 46.49% 53.51% 03.20% 02.98% 30.53% 31.64% 10.00% 15.64% 01.69% 01.85% 00.16% 00.14% 00.75% 01.02% 00.16% 00.24%
Professionals # 143,156 50,538 92,618 3,165 4,905 36,054 60,795 4,940 15,299 5,480 9,959 108 196 681 1,246 110 218
% 100.00% 35.32% 64.71% 02.21% 03.43% 25.19% 42.47% 03.45% 10.69% 03.83% 06.96% 00.08% 00.14% 00.48% 00.87% 00.08% 00.15%
Technicians # 37,853 11,364 26,489 1,203 1,804 6,556 15,845 2,400 6,708 919 1,559 48 73 193 431 45 69
% 100.00% 30.03% 69.98% 03.18% 04.77% 17.32% 41.86% 06.34% 17.72% 02.43% 04.12% 00.13% 00.19% 00.51% 01.14% 00.12% 00.18%
Sales Workers # 817 205 612 25 57 100 328 61 192 12 25 3 2 3 6 1 2
% 100.00% 25.10% 74.90% 03.06% 06.98% 12.24% 40.15% 07.47% 23.50% 01.47% 03.06% 00.37% 00.24% 00.37% 00.73% 00.12% 00.24%
Office and Clerical
# 49,898 18,239 31,659 1,824 2,185 9,056 16,216 6,268 11,636 639 835 88 114 276 511 88 162
% 100.00% 36.56% 63.44% 03.66% 04.38% 18.15% 32.50% 12.56% 23.32% 01.28% 01.67% 00.18% 00.23% 00.55% 01.02% 00.18% 00.32%
Craft Workers # 6,748 6,601 147 528 13 4,669 93 1,063 33 206 6 22 1 103 1 10 0
% 100.00% 97.82% 02.17% 07.82% 00.19% 69.19% 01.38% 15.75% 00.49% 03.05% 00.09% 00.33% 00.01% 01.53% 00.01% 00.15% 00.00%
Operatives # 3,761 3,332 429 298 37 1,676 193 1,236 176 70 14 12 1 33 7 7 1
% 100.00% 88.59% 11.41% 07.92% 00.98% 44.56% 05.13% 32.86% 04.68% 01.86% 00.37% 00.32% 00.03% 00.88% 00.19% 00.19% 00.03%
Laborers # 1,056 1,011 45 111 10 586 25 273 7 12 1 9 1 17 1 3 0
% 100.00% 95.73% 04.25% 10.51% 00.95% 55.49% 02.37% 25.85% 00.66% 01.14% 00.09% 00.85% 00.09% 01.61% 00.09% 00.28% 00.00%
Service Workers # 42,853 23,539 19,314 1,989 1,457 9,904 7,873 10,549 8,680 633 864 87 68 307 300 70 72
% 100.00% 54.93% 45.08% 04.64% 03.40% 23.11% 18.37% 24.62% 20.26% 01.48% 02.02% 00.20% 00.16% 00.72% 00.70% 00.16% 00.17%
TOTAL # 326,561 133,623 192,938 10,435 11,671 80,941 114,158 30,832 49,052 8,655 14,010 443 511 1,918 2,917 399 619

92
Table A3: OCCUPATIONAL GROUPS - Permanent Workforce - Distribution by Race/Ethnicity and Sex - SEP - FY2014
All VA TOTAL
EMPLOYEES
RACE/ETHNICITY
Hispanic or Latino
Non-Hispanic or Latino
White Black or African American
Asian Native Hawaiian or Other Pacific
Islander
American Indian or Alaska Native
Two or More Races/
Undisclosed
All male female male female male female male female male female male female male female male female
WORKFORCE % 100.00% 40.93% 59.08% 03.20% 03.57% 24.79% 34.96% 09.44% 15.02% 02.65% 04.29% 00.14% 00.16% 00.59% 00.89% 00.12% 00.19%
Data shown includes full-time, part-time, and intermittent permanent employees in a pay status and excluding medical and Manila residents.RCLF comparisons are based on 2000 Census National data.For purposes of this report, Title 38 nurses are coded to GS equivalent grades. Please see Data Definitions.The Executive/Senior Level Officials and Managers includes grades 15, 16, 17, 18, 19, 0 (SES), and 99 (Executive Pay Act). Mid-level Officials and Managers includes grades 13 and 14. First-level Officials and Managers includes grades 1 to 12.*** VA is not yet collecting this data.

93
Table B3: OCCUPATIONAL GROUPS - Permanent Workforce - Distribution by Disability- SEP - FY2014
All VAOccupational Category
TOTAL Total by Disability Status Detail for Targeted Disabilities
[04,05]No
Disability
[01]Not
Identified
[06-98]ReportableDisability
TotalTargetedDisability
[16,17,18]Hearing
[21,23,25]Vision
[28,30,32-38]
MissingExtremities
[64-69]Partial
Paralysis
[71-79]CompleteParalysis
[82]Epilepsy
[90]Severe
IntellectualDisability
[91]PsychiatricDisability
[92]Dwarfism
Executive/Senior Level Officials and Managers
# 1,237 1,054 51 132 16 0 2 2 6 0 2 0 4 0
% 100.00% 85.21% 04.12% 10.67% 01.29% 00.00% 00.16% 00.16% 00.49% 00.00% 00.16% 00.00% 00.32% 00.00%
Mid-Level Officials and Managers
# 7,954 6,724 252 978 101 2 11 9 19 7 9 1 43 0
% 100.00% 84.54% 03.17% 12.30% 01.27% 00.03% 00.14% 00.11% 00.24% 00.09% 00.11% 00.01% 00.54% 00.00%
First-Level Officials and Managers
# 31,228 24,470 1,205 5,553 627 20 26 32 85 18 59 8 369 10
% 100.00% 78.36% 03.86% 17.78% 02.01% 00.06% 00.08% 00.10% 00.27% 00.06% 00.19% 00.03% 01.18% 00.03%
TOTAL Officials and Managers
# 40,419 32,248 1,508 6,663 744 22 39 43 110 25 70 9 416 10
% 100.00% 79.78% 03.73% 16.48% 01.84% 00.05% 00.10% 00.11% 00.27% 00.06% 00.17% 00.02% 01.03% 00.02%
Professionals # 143,156 127,703 2,974 12,479 1,361 41 190 55 143 50 172 8 682 20
% 100.00% 89.21% 02.08% 08.72% 00.95% 00.03% 00.13% 00.04% 00.10% 00.03% 00.12% 00.01% 00.48% 00.01%
Technicians # 37,853 32,796 766 4,291 698 32 36 31 42 13 96 9 434 5
% 100.00% 86.64% 02.02% 11.34% 01.84% 00.08% 00.10% 00.08% 00.11% 00.03% 00.25% 00.02% 01.15% 00.01%
Sales Workers # 817 679 22 116 15 1 0 1 5 0 2 1 5 0
% 100.00% 83.11% 02.69% 14.20% 01.84% 00.12% 00.00% 00.12% 00.61% 00.00% 00.24% 00.12% 00.61% 00.00%
Office and Clerical # 49,898 36,445 1,901 11,552 1,909 154 138 59 197 42 153 82 1,052 32
% 100.00% 73.04% 03.81% 23.15% 03.83% 00.31% 00.28% 00.12% 00.39% 00.08% 00.31% 00.16% 02.11% 00.06%
Craft Workers # 6,748 5,278 261 1,209 164 13 8 4 14 4 7 5 108 1
% 100.00% 78.22% 03.87% 17.92% 02.43% 00.19% 00.12% 00.06% 00.21% 00.06% 00.10% 00.07% 01.60% 00.01%
Operatives # 3,761 2,773 161 827 191 18 5 1 6 0 12 27 120 2
% 100.00% 73.73% 04.28% 21.99% 05.08% 00.48% 00.13% 00.03% 00.16% 00.00% 00.32% 00.72% 03.19% 00.05%
Laborers # 1,056 679 57 320 65 4 1 0 3 1 1 5 50 0
% 100.00% 64.30% 05.40% 30.30% 06.16% 00.38% 00.09% 00.00% 00.28% 00.09% 00.09% 00.47% 04.73% 00.00%
Service Workers # 42,853 33,651 1,508 7,694 1,636 103 89 22 91 15 87 164 1,053 12
% 100.00% 78.53% 03.52% 17.95% 03.82% 00.24% 00.21% 00.05% 00.21% 00.04% 00.20% 00.38% 02.46% 00.03%
TOTAL WORKFORCE # 326,561 272,252 9,158 45,151 6,783 388 506 216 611 150 600 310 3,920 82
% 100.00% 83.37% 02.80% 13.83% 02.08% 00.12% 00.15% 00.07% 00.19% 00.05% 00.18% 00.09% 01.20% 00.03%Data shown includes full-time, part-time, and intermittent permanent employees in a pay status and excluding medical and manila residents.

94
For purposes of this report, Title 38 nurses are coded to GS equivalent grades. Please see Data Definitions.

95
Table A3: OCCUPATIONAL GROUPS - Temporary Workforce - Distribution by Race/Ethnicity and Sex - SEP - FY2014
All VA TOTAL
EMPLOYEES
RACE/ETHNICITY
Hispanic or Latino
Non-Hispanic or Latino
White Black or African American
Asian Native Hawaiian or Other Pacific
Islander
American Indian or Alaska Native
Two or More Races/
Undisclosed
All male female male female male female male female male female male female male female male female
Executive/Senior Level Officials and Managers
# 25 12 13 0 0 10 9 1 2 1 1 0 0 0 1 0 0
% 100.00% 48.00% 52.00% 00.00% 00.00% 40.00% 36.00% 04.00% 08.00% 04.00% 04.00% 00.00% 00.00% 00.00% 04.00% 00.00% 00.00%
Mid-Level Officials and Managers
# 69 40 29 3 0 23 17 9 11 3 0 0 0 2 1 0 0
% 100.00% 57.97% 42.03% 04.35% 00.00% 33.33% 24.64% 13.04% 15.94% 04.35% 00.00% 00.00% 00.00% 02.90% 01.45% 00.00% 00.00%
First-Level Officials and Managers
# 749 329 420 21 17 204 235 70 133 21 18 3 2 7 9 3 6
% 100.00% 43.92% 56.08% 02.80% 02.27% 27.24% 31.38% 09.35% 17.76% 02.80% 02.40% 00.40% 00.27% 00.93% 01.20% 00.40% 00.80%
TOTAL Officials and Managers
# 843 381 462 24 17 237 261 80 146 25 19 3 2 9 11 3 6
% 100.00% 45.21% 54.80% 02.85% 02.02% 28.11% 30.96% 09.49% 17.32% 02.97% 02.25% 00.36% 00.24% 01.07% 01.30% 00.36% 00.71%
Professionals # 12,757 4,734 8,023 202 305 3,218 5,540 339 900 869 1,110 6 18 88 131 12 19
% 100.00% 37.11% 62.89% 01.58% 02.39% 25.23% 43.43% 02.66% 07.05% 06.81% 08.70% 00.05% 00.14% 00.69% 01.03% 00.09% 00.15%
Technicians # 2,767 911 1,856 59 109 567 1,149 150 359 111 187 7 8 8 35 9 9
% 100.00% 32.92% 67.08% 02.13% 03.94% 20.49% 41.53% 05.42% 12.97% 04.01% 06.76% 00.25% 00.29% 00.29% 01.26% 00.33% 00.33%
Sales Workers # 116 40 76 3 6 13 29 21 36 2 3 1 0 0 2 0 0
% 100.00% 34.48% 65.51% 02.59% 05.17% 11.21% 25.00% 18.10% 31.03% 01.72% 02.59% 00.86% 00.00% 00.00% 01.72% 00.00% 00.00%
Office and Clerical
# 1,981 908 1,073 88 74 429 495 317 408 50 58 6 8 15 22 3 8
% 100.00% 45.83% 54.17% 04.44% 03.74% 21.66% 24.99% 16.00% 20.60% 02.52% 02.93% 00.30% 00.40% 00.76% 01.11% 00.15% 00.40%
Craft Workers # 206 200 6 19 0 140 5 32 0 3 1 1 0 5 0 0 0
% 100.00% 97.09% 02.92% 09.22% 00.00% 67.96% 02.43% 15.53% 00.00% 01.46% 00.49% 00.49% 00.00% 02.43% 00.00% 00.00% 00.00%
Operatives # 172 158 14 11 0 88 8 53 6 3 0 0 0 2 0 1 0
% 100.00% 91.85% 08.14% 06.40% 00.00% 51.16% 04.65% 30.81% 03.49% 01.74% 00.00% 00.00% 00.00% 01.16% 00.00% 00.58% 00.00%
Laborers # 125 117 8 15 0 70 7 23 0 3 1 1 0 5 0 0 0
% 100.00% 93.60% 06.40% 12.00% 00.00% 56.00% 05.60% 18.40% 00.00% 02.40% 00.80% 00.80% 00.00% 04.00% 00.00% 00.00% 00.00%
Service Workers # 1,524 634 890 70 70 279 410 246 340 18 43 4 2 11 16 6 9
% 100.00% 41.59% 58.39% 04.59% 04.59% 18.31% 26.90% 16.14% 22.31% 01.18% 02.82% 00.26% 00.13% 00.72% 01.05% 00.39% 00.59%
TOTAL # 20,491 8,083 12,408 491 581 5,041 7,904 1,261 2,195 1,084 1,422 29 38 143 217 34 51

96
Table A3: OCCUPATIONAL GROUPS - Temporary Workforce - Distribution by Race/Ethnicity and Sex - SEP - FY2014
All VA TOTAL
EMPLOYEES
RACE/ETHNICITY
Hispanic or Latino
Non-Hispanic or Latino
White Black or African American
Asian Native Hawaiian or Other Pacific
Islander
American Indian or Alaska Native
Two or More Races/
Undisclosed
All male female male female male female male female male female male female male female male female
WORKFORCE % 100.00% 39.45% 60.56% 02.40% 02.84% 24.60% 38.57% 06.15% 10.71% 05.29% 06.94% 00.14% 00.19% 00.70% 01.06% 00.17% 00.25%
Data shown includes full-time, part-time, and intermittent temporary employees in a pay status and excluding medical and Manila residents.RCLF comparisons are based on 2000 Census National data.For purposes of this report, Title 38 nurses are coded to GS equivalent grades. Please see Data Definitions.The Executive/Senior Level Officials and Managers includes grades 15, 16, 17, 18, 19, 0 (SES), and 99 (Executive Pay Act). Mid-level Officials and Managers includes grades 13 and 14. First-level Officials and Managers includes grades 1 to 12.*** VA is not yet collecting this data.

97
Table B3: OCCUPATIONAL GROUPS - Temporary Workforce - Distribution by Disability- SEP - FY2014
All VAOccupational Category
TOTAL Total by Disability Status Detail for Targeted Disabilities
[04,05]No
Disability
[01]Not
Identified
[06-98]ReportableDisability
TotalTargetedDisability
[16,17,18]Hearing
[21,23,25]Vision
[28,30,32-38]
MissingExtremities
[64-69]Partial
Paralysis
[71-79]CompleteParalysis
[82]Epilepsy
[90]Severe
IntellectualDisability
[91]PsychiatricDisability
[92]Dwarfism
Executive/Senior Level Officials and Managers
# 25 21 2 2 0 0 0 0 0 0 0 0 0 0
% 100.00% 84.00% 08.00% 08.00% 00.00% 00.00% 00.00% 00.00% 00.00% 00.00% 00.00% 00.00% 00.00% 00.00%
Mid-Level Officials and Managers
# 69 51 1 17 1 0 1 0 0 0 0 0 0 0
% 100.00% 73.91% 01.45% 24.64% 01.45% 00.00% 01.45% 00.00% 00.00% 00.00% 00.00% 00.00% 00.00% 00.00%
First-Level Officials and Managers
# 749 515 33 201 26 0 2 0 1 3 2 1 16 1
% 100.00% 68.76% 04.41% 26.84% 03.47% 00.00% 00.27% 00.00% 00.13% 00.40% 00.27% 00.13% 02.14% 00.13%
TOTAL Officials and Managers
# 843 587 36 220 27 0 3 0 1 3 2 1 16 1
% 100.00% 69.63% 04.27% 26.10% 03.20% 00.00% 00.36% 00.00% 00.12% 00.36% 00.24% 00.12% 01.90% 00.12%
Professionals # 12,757 11,526 278 953 147 2 7 5 11 3 15 4 97 3
% 100.00% 90.35% 02.18% 07.47% 01.15% 00.02% 00.05% 00.04% 00.09% 00.02% 00.12% 00.03% 00.76% 00.02%
Technicians # 2,767 2,366 77 324 76 2 2 4 7 1 8 2 50 0
% 100.00% 85.51% 02.78% 11.71% 02.75% 00.07% 00.07% 00.14% 00.25% 00.04% 00.29% 00.07% 01.81% 00.00%
Sales Workers # 116 96 4 16 3 0 0 0 0 0 1 0 2 0
% 100.00% 82.76% 03.45% 13.79% 02.59% 00.00% 00.00% 00.00% 00.00% 00.00% 00.86% 00.00% 01.72% 00.00%
Office and Clerical # 1,981 1,198 121 662 106 5 3 1 11 0 12 3 70 1
% 100.00% 60.47% 06.11% 33.42% 05.35% 00.25% 00.15% 00.05% 00.56% 00.00% 00.61% 00.15% 03.53% 00.05%
Craft Workers # 206 128 9 69 20 1 2 1 0 0 1 0 15 0
% 100.00% 62.14% 04.37% 33.50% 09.71% 00.49% 00.97% 00.49% 00.00% 00.00% 00.49% 00.00% 07.28% 00.00%
Operatives # 172 76 9 87 18 1 1 0 0 0 0 2 14 0
% 100.00% 44.19% 05.23% 50.58% 10.47% 00.58% 00.58% 00.00% 00.00% 00.00% 00.00% 01.16% 08.14% 00.00%
Laborers # 125 73 2 50 14 1 1 0 0 1 1 0 10 0
% 100.00% 58.40% 01.60% 40.00% 11.20% 00.80% 00.80% 00.00% 00.00% 00.80% 00.80% 00.00% 08.00% 00.00%
Service Workers # 1,524 1,067 68 389 98 3 8 0 8 0 3 2 72 2
% 100.00% 70.01% 04.46% 25.52% 06.43% 00.20% 00.52% 00.00% 00.52% 00.00% 00.20% 00.13% 04.72% 00.13%
TOTAL WORKFORCE # 20,491 17,117 604 2,770 509 15 27 11 38 8 43 14 346 7
% 100.00% 83.53% 02.95% 13.52% 02.48% 00.07% 00.13% 00.05% 00.19% 00.04% 00.21% 00.07% 01.69% 00.03%Data shown includes full-time, part-time, and intermittent temporary employees in a pay status and excluding medical and manila residents.

98
For purposes of this report, Title 38 nurses are coded to GS equivalent grades. Please see Data Definitions.

99
Table A4-1: PARTICIPATION RATES ACROSS GENERAL SCHEDULE (GS) GRADES - Permanent Workforce - by Race/Ethnicity and Sex - SEP - FY2014
All VA TOTAL
EMPLOYEES
RACE/ETHNICITY
Hispanic or Latino
Non-Hispanic or Latino
White Black or African American
Asian Native Hawaiian or Other Pacific
Islander
American Indian or Alaska Native
Two or More Races/Undisclosed
All male female male female male female male female male female male female male female male female
GS - 1 # 13 5 8 1 2 3 4 1 2 0 0 0 0 0 0 0 0
% 99.99% 38.46% 61.53% 07.69% 15.38% 23.08% 30.77% 07.69% 15.38% 00.00% 00.00% 00.00% 00.00% 00.00% 00.00% 00.00% 00.00%
GS - 2 # 83 45 38 2 3 22 20 18 15 1 0 2 0 0 0 0 0
% 100.00% 54.22% 45.78% 02.41% 03.61% 26.51% 24.10% 21.69% 18.07% 01.20% 00.00% 02.41% 00.00% 00.00% 00.00% 00.00% 00.00%
GS - 3 # 922 462 460 70 35 177 194 195 201 6 17 1 3 10 6 3 4
% 100.00% 50.11% 49.89% 07.59% 03.80% 19.20% 21.04% 21.15% 21.80% 00.65% 01.84% 00.11% 00.33% 01.08% 00.65% 00.33% 00.43%
GS - 4 # 6,148 2,619 3,529 306 326 1,148 1,409 1,031 1,584 86 117 12 17 29 62 7 14
% 100.00% 42.60% 57.40% 04.98% 05.30% 18.67% 22.92% 16.77% 25.76% 01.40% 01.90% 00.20% 00.28% 00.47% 01.01% 00.11% 00.23%
GS - 5 # 30,629 10,359 20,270 1,052 1,324 4,879 9,142 3,753 8,529 406 720 45 69 168 375 56 111
% 100.00% 33.82% 66.18% 03.43% 04.32% 15.93% 29.85% 12.25% 27.85% 01.33% 02.35% 00.15% 00.23% 00.55% 01.22% 00.18% 00.36%
GS - 6 # 39,162 12,451 26,711 1,328 1,830 6,576 14,320 3,616 8,790 609 1,187 60 83 210 398 52 103
% 100.00% 31.79% 68.21% 03.39% 04.67% 16.79% 36.57% 09.23% 22.45% 01.56% 03.03% 00.15% 00.21% 00.54% 01.02% 00.13% 00.26%
GS - 7 # 20,750 8,128 12,622 790 926 4,417 6,973 2,318 3,945 402 453 44 50 123 230 34 45
% 99.99% 39.17% 60.82% 03.81% 04.46% 21.29% 33.60% 11.17% 19.01% 01.94% 02.18% 00.21% 00.24% 00.59% 01.11% 00.16% 00.22%
GS - 8 # 20,699 6,120 14,579 567 881 3,761 9,008 1,098 3,179 548 1,165 26 57 102 247 18 42
% 100.01% 29.57% 70.44% 02.74% 04.26% 18.17% 43.52% 05.30% 15.36% 02.65% 05.63% 00.13% 00.28% 00.49% 01.19% 00.09% 00.20%
GS - 9 # 18,331 7,594 10,737 645 649 4,551 6,488 1,772 2,776 414 528 24 33 154 226 34 37
% 100.00% 41.44% 58.56% 03.52% 03.54% 24.83% 35.39% 09.67% 15.14% 02.26% 02.88% 00.13% 00.18% 00.84% 01.23% 00.19% 00.20%
GS - 10 # 3,750 1,707 2,043 135 127 1,042 1,318 390 437 104 115 6 3 23 35 7 8
% 100.00% 45.52% 54.48% 03.60% 03.39% 27.79% 35.15% 10.40% 11.65% 02.77% 03.07% 00.16% 00.08% 00.61% 00.93% 00.19% 00.21%
GS - 11 # 60,377 17,216 43,161 1,285 2,450 11,529 26,913 2,787 8,510 1,267 4,509 61 94 236 583 51 102
% 100.01% 28.52% 71.49% 02.13% 04.06% 19.10% 44.57% 04.62% 14.09% 02.10% 07.47% 00.10% 00.16% 00.39% 00.97% 00.08% 00.17%
GS - 12 # 28,177 11,610 16,567 712 946 8,412 11,049 1,585 3,123 676 1,135 27 28 174 227 24 59
% 100.02% 41.22% 58.80% 02.53% 03.36% 29.85% 39.21% 05.63% 11.08% 02.40% 04.03% 00.10% 00.10% 00.62% 00.81% 00.09% 00.21%
GS - 13 # 34,609 11,097 23,512 637 1,015 8,550 16,948 1,186 3,748 555 1,462 21 37 125 251 23 51

100
Table A4-1: PARTICIPATION RATES ACROSS GENERAL SCHEDULE (GS) GRADES - Permanent Workforce - by Race/Ethnicity and Sex - SEP - FY2014
All VA TOTAL
EMPLOYEES
RACE/ETHNICITY
Hispanic or Latino
Non-Hispanic or Latino
White Black or African American
Asian Native Hawaiian or Other Pacific
Islander
American Indian or Alaska Native
Two or More Races/Undisclosed
All male female male female male female male female male female male female male female male female
% 100.00% 32.06% 67.94% 01.84% 02.93% 24.70% 48.97% 03.43% 10.83% 01.60% 04.22% 00.06% 00.11% 00.36% 00.73% 00.07% 00.15%
GS - 14 # 6,994 3,341 3,653 131 138 2,636 2,600 385 723 157 144 2 7 24 32 6 9
% 99.99% 47.76% 52.23% 01.87% 01.97% 37.69% 37.17% 05.50% 10.34% 02.24% 02.06% 00.03% 00.10% 00.34% 00.46% 00.09% 00.13%
GS - 15 # 24,655 15,704 8,951 840 531 11,020 5,288 689 697 2,893 2,253 23 15 214 151 25 16
% 99.99% 63.69% 36.30% 03.41% 02.15% 44.70% 21.45% 02.79% 02.83% 11.73% 09.14% 00.09% 00.06% 00.87% 00.61% 00.10% 00.06%
All Other GS
# 54 18 36 0 1 15 7 1 26 2 2 0 0 0 0 0 0
% 99.99% 33.33% 66.66% 00.00% 01.85% 27.78% 12.96% 01.85% 48.15% 03.70% 03.70% 00.00% 00.00% 00.00% 00.00% 00.00% 00.00%
SES # 358 214 144 16 4 170 116 19 18 6 4 0 0 2 1 1 1
% 100.02% 59.79% 40.23% 04.47% 01.12% 47.49% 32.40% 05.31% 05.03% 01.68% 01.12% 00.00% 00.00% 00.56% 00.28% 00.28% 00.28%
TOTAL # 295,711 108,690 187,021 8,517 11,188 68,908 111,797 20,844 46,303 8,132 13,811 354 496 1,594 2,824 341 602
% 100.00% 36.76% 63.24% 02.88% 03.78% 23.30% 37.81% 07.05% 15.66% 02.75% 04.67% 00.12% 00.17% 00.54% 00.95% 00.12% 00.20%Data shown includes GS/GM, SES, and related grades for full-time, part-time, and intermittent permanent employees in a pay status and excluding medical and Manila residents.For purposes of this report, Title 38 nurses are coded to GS equivalent grades. Please see Data Definitions.Percentages are based on row totals

101
Table B4-1: PARTICIPATION RATES ACROSS GENERAL SCHEDULE (GS) GRADES - Permanent Workforce - by Disability- SEP - FY2014
All VA TOTAL Total by Disability Status Detail for Targeted Disabilities
[04,05]No
Disability
[01]Not
Identified
[06-98]ReportableDisability
TotalTargetedDisability
[16,17,18]Hearing
[21,23,25]Vision
[28,30,32-38]Missing
Extremities
[64-69]Partial
Paralysis
[71-79]CompleteParalysis
[82]Epilepsy
[90]Severe
IntellectualDisability
[91]PsychiatricDisability
[92]Dwarfism
GS - 1 # 13 5 1 7 3 1 0 0 0 1 0 1 0 0
% 100.00% 38.46% 07.69% 53.85% 23.08% 07.69% 00.00% 00.00% 00.00% 07.69% 00.00% 07.69% 00.00% 00.00%
GS - 2 # 83 42 5 36 13 0 1 0 1 1 4 4 1 1
% 100.00% 50.60% 06.02% 43.37% 15.66% 00.00% 01.20% 00.00% 01.20% 01.20% 04.82% 04.82% 01.20% 01.20%
GS - 3 # 922 615 27 280 75 4 3 1 4 0 3 27 33 0
% 100.00% 66.70% 02.93% 30.37% 08.13% 00.43% 00.33% 00.11% 00.43% 00.00% 00.33% 02.93% 03.58% 00.00%
GS - 4 # 6,148 4,452 232 1,464 323 44 29 5 21 8 23 27 161 5
% 100.00% 72.41% 03.77% 23.81% 05.25% 00.72% 00.47% 00.08% 00.34% 00.13% 00.37% 00.44% 02.62% 00.08%
GS - 5 # 30,629 23,728 1,063 5,838 945 56 75 23 88 15 96 31 548 13
% 100.00% 77.47% 03.47% 19.06% 03.09% 00.18% 00.24% 00.08% 00.29% 00.05% 00.31% 00.10% 01.79% 00.04%
GS - 6 # 39,162 31,889 1,220 6,053 866 55 58 29 71 17 84 23 517 12
% 100.00% 81.43% 03.12% 15.46% 02.21% 00.14% 00.15% 00.07% 00.18% 00.04% 00.21% 00.06% 01.32% 00.03%
GS - 7 # 20,750 16,285 688 3,777 577 23 36 21 69 13 49 10 348 8
% 100.00% 78.48% 03.32% 18.20% 02.78% 00.11% 00.17% 00.10% 00.33% 00.06% 00.24% 00.05% 01.68% 00.04%
GS - 8 # 20,699 18,330 446 1,923 213 9 15 5 15 3 30 2 133 1
% 100.00% 88.56% 02.15% 09.29% 01.03% 00.04% 00.07% 00.02% 00.07% 00.01% 00.14% 00.01% 00.64% 00.00%
GS - 9 # 18,331 14,845 536 2,950 385 12 15 11 39 14 36 8 245 5
% 100.00% 80.98% 02.92% 16.09% 02.10% 00.07% 00.08% 00.06% 00.21% 00.08% 00.20% 00.04% 01.34% 00.03%
GS - 10 # 3,750 3,108 111 531 59 3 1 4 5 0 12 0 34 0
% 100.00% 82.88% 02.96% 14.16% 01.57% 00.08% 00.03% 00.11% 00.13% 00.00% 00.32% 00.00% 00.91% 00.00%
GS - 11 # 60,377 52,691 1,377 6,309 719 23 95 34 67 21 70 5 396 8
% 100.00% 87.27% 02.28% 10.45% 01.19% 00.04% 00.16% 00.06% 00.11% 00.03% 00.12% 00.01% 00.66% 00.01%
GS - 12 # 28,177 24,045 711 3,421 410 22 49 26 55 15 50 0 182 11
% 100.00% 85.34% 02.52% 12.14% 01.46% 00.08% 00.17% 00.09% 00.20% 00.05% 00.18% 00.00% 00.65% 00.04%
GS - 13 # 34,609 30,744 757 3,108 302 7 39 20 50 13 49 0 122 2
% 100.00% 88.83% 02.19% 08.98% 00.87% 00.02% 00.11% 00.06% 00.14% 00.04% 00.14% 00.00% 00.35% 00.01%
GS - 14 # 6,994 6,125 213 656 54 1 9 7 8 2 4 1 19 3

102
Table B4-1: PARTICIPATION RATES ACROSS GENERAL SCHEDULE (GS) GRADES - Permanent Workforce - by Disability- SEP - FY2014
All VA TOTAL Total by Disability Status Detail for Targeted Disabilities
[04,05]No
Disability
[01]Not
Identified
[06-98]ReportableDisability
TotalTargetedDisability
[16,17,18]Hearing
[21,23,25]Vision
[28,30,32-38]Missing
Extremities
[64-69]Partial
Paralysis
[71-79]CompleteParalysis
[82]Epilepsy
[90]Severe
IntellectualDisability
[91]PsychiatricDisability
[92]Dwarfism
% 100.00% 87.58% 03.05% 09.38% 00.77% 00.01% 00.13% 00.10% 00.11% 00.03% 00.06% 00.01% 00.27% 00.04%
GS - 15 # 24,655 22,809 487 1,359 116 1 9 12 24 13 18 0 38 1
% 100.00% 92.51% 01.98% 05.51% 00.47% 00.00% 00.04% 00.05% 00.10% 00.05% 00.07% 00.00% 00.15% 00.00%
All Other GS # 54 53 0 1 0 0 0 0 0 0 0 0 0 0
% 100.00% 98.15% 00.00% 01.85% 00.00% 00.00% 00.00% 00.00% 00.00% 00.00% 00.00% 00.00% 00.00% 00.00%
SES # 358 308 12 38 5 0 0 0 4 0 0 0 1 0
% 100.00% 86.03% 03.35% 10.61% 01.40% 00.00% 00.00% 00.00% 01.12% 00.00% 00.00% 00.00% 00.28% 00.00%
TOTAL # 295,711 250,074 7,886 37,751 5,065 261 434 198 521 136 528 139 2,778 70
% 100.00% 84.57% 02.67% 12.77% 01.71% 00.09% 00.15% 00.07% 00.18% 00.05% 00.18% 00.05% 00.94% 00.02%Data shown includes GS/GM, SES, and related grades for full-time, part-time, and intermittent permanent employees in a pay status and excluding medical and Manila residents.For purposes of this report, Title 38 nurses are coded to GS equivalent grades. Please see Data Definitions.Percentages are based on row totals

103
Table A4-1: PARTICIPATION RATES ACROSS GENERAL SCHEDULE (GS) GRADES - Temporary Workforce - by Race/Ethnicity and Sex - SEP - FY2014
All VA TOTAL
EMPLOYEES
RACE/ETHNICITY
Hispanic or Latino
Non-Hispanic or Latino
White Black or African American
Asian Native Hawaiian or Other Pacific
Islander
American Indian or Alaska Native
Two or More Races/Undisclosed
All male female male female male female male female male female male female male female male female
GS - 1 # 49 16 33 1 3 11 16 3 9 1 3 0 0 0 2 0 0
% 99.99% 32.65% 67.34% 02.04% 06.12% 22.45% 32.65% 06.12% 18.37% 02.04% 06.12% 00.00% 00.00% 00.00% 04.08% 00.00% 00.00%
GS - 2 # 128 48 80 1 5 28 50 15 22 2 1 1 0 1 2 0 0
% 100.00% 37.50% 62.50% 00.78% 03.91% 21.88% 39.06% 11.72% 17.19% 01.56% 00.78% 00.78% 00.00% 00.78% 01.56% 00.00% 00.00%
GS - 3 # 226 90 136 14 10 51 85 21 30 3 7 0 1 1 3 0 0
% 99.99% 39.82% 60.17% 06.19% 04.42% 22.57% 37.61% 09.29% 13.27% 01.33% 03.10% 00.00% 00.44% 00.44% 01.33% 00.00% 00.00%
GS - 4 # 1,000 358 642 33 40 198 335 83 197 34 53 2 5 7 9 1 3
% 100.00% 35.80% 64.20% 03.30% 04.00% 19.80% 33.50% 08.30% 19.70% 03.40% 05.30% 00.20% 00.50% 00.70% 00.90% 00.10% 00.30%
GS - 5 # 1,714 714 1,000 56 68 333 434 254 381 49 75 3 7 12 23 7 12
% 100.02% 41.67% 58.35% 03.27% 03.97% 19.43% 25.32% 14.82% 22.23% 02.86% 04.38% 00.18% 00.41% 00.70% 01.34% 00.41% 00.70%
GS - 6 # 688 274 414 31 25 148 234 69 124 20 20 1 2 1 7 4 2
% 100.01% 39.84% 60.17% 04.51% 03.63% 21.51% 34.01% 10.03% 18.02% 02.91% 02.91% 00.15% 00.29% 00.15% 01.02% 00.58% 00.29%
GS - 7 # 945 432 513 37 27 222 287 111 144 45 38 3 2 13 12 1 3
% 100.02% 45.73% 54.29% 03.92% 02.86% 23.49% 30.37% 11.75% 15.24% 04.76% 04.02% 00.32% 00.21% 01.38% 01.27% 00.11% 00.32%
GS - 8 # 999 239 760 14 30 139 434 49 196 30 79 0 3 7 13 0 5
% 99.98% 23.91% 76.07% 01.40% 03.00% 13.91% 43.44% 04.90% 19.62% 03.00% 07.91% 00.00% 00.30% 00.70% 01.30% 00.00% 00.50%
GS - 9 # 1,287 480 807 27 38 297 524 97 163 43 60 4 4 9 12 3 6
% 100.00% 37.30% 62.70% 02.10% 02.95% 23.08% 40.71% 07.54% 12.67% 03.34% 04.66% 00.31% 00.31% 00.70% 00.93% 00.23% 00.47%
GS - 10 # 27 4 23 0 0 1 18 2 2 0 2 0 0 1 1 0 0
% 100.00% 14.81% 85.19% 00.00% 00.00% 03.70% 66.67% 07.41% 07.41% 00.00% 07.41% 00.00% 00.00% 03.70% 03.70% 00.00% 00.00%
GS - 11 # 1,988 555 1,433 27 67 393 972 66 204 52 164 1 2 10 22 6 2
% 100.00% 27.92% 72.08% 01.36% 03.37% 19.77% 48.89% 03.32% 10.26% 02.62% 08.25% 00.05% 00.10% 00.50% 01.11% 00.30% 00.10%
GS - 12 # 1,126 369 757 10 28 277 547 25 71 51 94 2 1 3 14 1 2
% 100.02% 32.78% 67.24% 00.89% 02.49% 24.60% 48.58% 02.22% 06.31% 04.53% 08.35% 00.18% 00.09% 00.27% 01.24% 00.09% 00.18%
GS - 13 # 1,281 541 740 12 15 416 589 20 38 85 89 0 0 8 9 0 0

104
Table A4-1: PARTICIPATION RATES ACROSS GENERAL SCHEDULE (GS) GRADES - Temporary Workforce - by Race/Ethnicity and Sex - SEP - FY2014
All VA TOTAL
EMPLOYEES
RACE/ETHNICITY
Hispanic or Latino
Non-Hispanic or Latino
White Black or African American
Asian Native Hawaiian or Other Pacific
Islander
American Indian or Alaska Native
Two or More Races/Undisclosed
All male female male female male female male female male female male female male female male female
% 100.00% 42.23% 57.77% 00.94% 01.17% 32.47% 45.98% 01.56% 02.97% 06.64% 06.95% 00.00% 00.00% 00.62% 00.70% 00.00% 00.00%
GS - 14 # 237 146 91 5 0 102 75 6 3 30 11 0 0 3 2 0 0
% 100.01% 61.61% 38.40% 02.11% 00.00% 43.04% 31.65% 02.53% 01.27% 12.66% 04.64% 00.00% 00.00% 01.27% 00.84% 00.00% 00.00%
GS - 15 # 2,406 1,564 842 79 17 931 460 41 46 481 297 3 2 27 18 2 2
% 99.97% 64.98% 34.99% 03.28% 00.71% 38.69% 19.12% 01.70% 01.91% 19.99% 12.34% 00.12% 00.08% 01.12% 00.75% 00.08% 00.08%
All Other GS
# 5,053 1,313 3,740 49 174 1,017 2,670 86 408 136 407 2 7 19 63 4 11
% 100.00% 25.99% 74.01% 00.97% 03.44% 20.13% 52.84% 01.70% 08.07% 02.69% 08.05% 00.04% 00.14% 00.38% 01.25% 00.08% 00.22%
SES # 1 0 1 0 0 0 0 0 0 0 0 0 0 0 1 0 0
% 100.00% 00.00% 100.00% 00.00% 00.00% 00.00% 00.00% 00.00% 00.00% 00.00% 00.00% 00.00% 00.00% 00.00% 100.00% 00.00% 00.00%
TOTAL # 19,155 7,143 12,012 396 547 4,564 7,730 948 2,038 1,062 1,400 22 36 122 213 29 48
% 100.00% 37.29% 62.71% 02.07% 02.86% 23.83% 40.35% 04.95% 10.64% 05.54% 07.31% 00.11% 00.19% 00.64% 01.11% 00.15% 00.25%Data shown includes GS/GM, SES, and related grades for full-time, part-time, and intermittent temporary employees in a pay status and excluding medical and Manila residents.For purposes of this report, Title 38 nurses are coded to GS equivalent grades. Please see Data Definitions.Percentages are based on row totals

105
Table B4-1: PARTICIPATION RATES ACROSS GENERAL SCHEDULE (GS) GRADES - Temporary Workforce - by Disability- SEP - FY2014
All VA TOTAL Total by Disability Status Detail for Targeted Disabilities
[04,05]No
Disability
[01]Not
Identified
[06-98]ReportableDisability
TotalTargetedDisability
[16,17,18]Hearing
[21,23,25]Vision
[28,30,32-38]Missing
Extremities
[64-69]Partial
Paralysis
[71-79]CompleteParalysis
[82]Epilepsy
[90]Severe
IntellectualDisability
[91]PsychiatricDisability
[92]Dwarfism
GS - 1 # 49 37 4 8 4 0 0 0 0 0 0 0 4 0
% 100.00% 75.51% 08.16% 16.33% 08.16% 00.00% 00.00% 00.00% 00.00% 00.00% 00.00% 00.00% 08.16% 00.00%
GS - 2 # 128 101 4 23 3 1 0 0 1 0 0 1 0 0
% 100.00% 78.91% 03.13% 17.97% 02.34% 00.78% 00.00% 00.00% 00.78% 00.00% 00.00% 00.78% 00.00% 00.00%
GS - 3 # 226 168 8 50 8 2 0 0 1 0 0 0 5 0
% 100.00% 74.34% 03.54% 22.12% 03.54% 00.88% 00.00% 00.00% 00.44% 00.00% 00.00% 00.00% 02.21% 00.00%
GS - 4 # 1,000 771 39 190 29 2 2 0 2 0 4 0 19 0
% 100.00% 77.10% 03.90% 19.00% 02.90% 00.20% 00.20% 00.00% 00.20% 00.00% 00.40% 00.00% 01.90% 00.00%
GS - 5 # 1,714 1,119 97 498 100 1 2 2 9 0 8 4 73 1
% 100.00% 65.29% 05.66% 29.05% 05.83% 00.06% 00.12% 00.12% 00.53% 00.00% 00.47% 00.23% 04.26% 00.06%
GS - 6 # 688 510 24 154 31 1 1 0 3 0 2 0 23 1
% 100.00% 74.13% 03.49% 22.38% 04.51% 00.15% 00.15% 00.00% 00.44% 00.00% 00.29% 00.00% 03.34% 00.15%
GS - 7 # 945 671 40 234 41 1 1 0 4 2 2 2 29 0
% 100.00% 71.01% 04.23% 24.76% 04.34% 00.11% 00.11% 00.00% 00.42% 00.21% 00.21% 00.21% 03.07% 00.00%
GS - 8 # 999 897 21 81 6 0 1 0 0 0 1 0 4 0
% 100.00% 89.79% 02.10% 08.11% 00.60% 00.00% 00.10% 00.00% 00.00% 00.00% 00.10% 00.00% 00.40% 00.00%
GS - 9 # 1,287 952 49 286 73 0 1 1 4 2 3 2 57 3
% 100.00% 73.97% 03.81% 22.22% 05.67% 00.00% 00.08% 00.08% 00.31% 00.16% 00.23% 00.16% 04.43% 00.23%
GS - 10 # 27 24 1 2 1 0 0 1 0 0 0 0 0 0
% 100.00% 88.89% 03.70% 07.41% 03.70% 00.00% 00.00% 03.70% 00.00% 00.00% 00.00% 00.00% 00.00% 00.00%
GS - 11 # 1,988 1,753 48 187 28 1 2 1 3 1 5 1 13 1
% 100.00% 88.18% 02.41% 09.41% 01.41% 00.05% 00.10% 00.05% 00.15% 00.05% 00.25% 00.05% 00.65% 00.05%
GS - 12 # 1,126 1,030 20 76 10 0 2 1 0 0 1 0 6 0
% 100.00% 91.47% 01.78% 06.75% 00.89% 00.00% 00.18% 00.09% 00.00% 00.00% 00.09% 00.00% 00.53% 00.00%
GS - 13 # 1,281 1,183 33 65 7 0 3 0 1 1 1 0 1 0
% 100.00% 92.35% 02.58% 05.07% 00.55% 00.00% 00.23% 00.00% 00.08% 00.08% 00.08% 00.00% 00.08% 00.00%
GS - 14 # 237 210 5 22 1 0 0 0 0 0 1 0 0 0

106
Table B4-1: PARTICIPATION RATES ACROSS GENERAL SCHEDULE (GS) GRADES - Temporary Workforce - by Disability- SEP - FY2014
All VA TOTAL Total by Disability Status Detail for Targeted Disabilities
[04,05]No
Disability
[01]Not
Identified
[06-98]ReportableDisability
TotalTargetedDisability
[16,17,18]Hearing
[21,23,25]Vision
[28,30,32-38]Missing
Extremities
[64-69]Partial
Paralysis
[71-79]CompleteParalysis
[82]Epilepsy
[90]Severe
IntellectualDisability
[91]PsychiatricDisability
[92]Dwarfism
% 100.00% 88.61% 02.11% 09.28% 00.42% 00.00% 00.00% 00.00% 00.00% 00.00% 00.42% 00.00% 00.00% 00.00%
GS - 15 # 2,406 2,300 38 68 4 0 0 1 0 1 0 0 2 0
% 100.00% 95.59% 01.58% 02.83% 00.17% 00.00% 00.00% 00.04% 00.00% 00.04% 00.00% 00.00% 00.08% 00.00%
All Other GS # 5,053 4,602 111 340 21 0 1 3 3 0 9 0 5 0
% 100.00% 91.07% 02.20% 06.73% 00.42% 00.00% 00.02% 00.06% 00.06% 00.00% 00.18% 00.00% 00.10% 00.00%
SES # 1 1 0 0 0 0 0 0 0 0 0 0 0 0
% 100.00% 100.00% 00.00% 00.00% 00.00% 00.00% 00.00% 00.00% 00.00% 00.00% 00.00% 00.00% 00.00% 00.00%
TOTAL # 19,155 16,329 542 2,284 367 9 16 10 31 7 37 10 241 6
% 100.00% 85.25% 02.83% 11.92% 01.92% 00.05% 00.08% 00.05% 00.16% 00.04% 00.19% 00.05% 01.26% 00.03%Data shown includes GS/GM, SES, and related grades for full-time, part-time, and intermittent temporary employees in a pay status and excluding medical and Manila residents.For purposes of this report, Title 38 nurses are coded to GS equivalent grades. Please see Data Definitions.Percentages are based on row totals

107
Table A4-2: PARTICIPATION RATES ACROSS GENERAL SCHEDULE (GS) GRADES - Permanent Workforce - by Race/Ethnicity and Sex - SEP - FY2014
All VA TOTAL
EMPLOYEES
RACE/ETHNICITY
Hispanic or Latino Non-Hispanic or Latino
White Black or African American
Asian Native Hawaiian or Other Pacific
Islander
American Indian or Alaska Native
Two or More Races/Undisclosed
All male female male female male female male female male female male female male female male female
GS - 1 # 13 5 8 1 2 3 4 1 2 0 0 0 0 0 0 0 0
% 00.00% 00.00% 00.00% 00.01% 00.02% 00.00% 00.00% 00.00% 00.00% 00.00% 00.00% 00.00% 00.00% 00.00% 00.00% 00.00% 00.00%
GS - 2 # 83 45 38 2 3 22 20 18 15 1 0 2 0 0 0 0 0
% 00.03% 00.04% 00.02% 00.02% 00.03% 00.03% 00.02% 00.09% 00.03% 00.01% 00.00% 00.56% 00.00% 00.00% 00.00% 00.00% 00.00%
GS - 3 # 922 462 460 70 35 177 194 195 201 6 17 1 3 10 6 3 4
% 00.31% 00.43% 00.25% 00.82% 00.31% 00.26% 00.17% 00.94% 00.43% 00.07% 00.12% 00.28% 00.60% 00.63% 00.21% 00.88% 00.66%
GS - 4 # 6,148 2,619 3,529 306 326 1,148 1,409 1,031 1,584 86 117 12 17 29 62 7 14
% 02.08% 02.41% 01.89% 03.59% 02.91% 01.67% 01.26% 04.95% 03.42% 01.06% 00.85% 03.39% 03.43% 01.82% 02.20% 02.05% 02.33%
GS - 5 # 30,629 10,359 20,270 1,052 1,324 4,879 9,142 3,753 8,529 406 720 45 69 168 375 56 111
% 10.36% 09.53% 10.84% 12.35% 11.83% 07.08% 08.18% 18.01% 18.42% 04.99% 05.21% 12.71% 13.91% 10.54% 13.28% 16.42% 18.44%
GS - 6 # 39,162 12,451 26,711 1,328 1,830 6,576 14,320 3,616 8,790 609 1,187 60 83 210 398 52 103
% 13.24% 11.46% 14.28% 15.59% 16.36% 09.54% 12.81% 17.35% 18.98% 07.49% 08.59% 16.95% 16.73% 13.17% 14.09% 15.25% 17.11%
GS - 7 # 20,750 8,128 12,622 790 926 4,417 6,973 2,318 3,945 402 453 44 50 123 230 34 45
% 07.02% 07.48% 06.75% 09.28% 08.28% 06.41% 06.24% 11.12% 08.52% 04.94% 03.28% 12.43% 10.08% 07.72% 08.14% 09.97% 07.48%
GS - 8 # 20,699 6,120 14,579 567 881 3,761 9,008 1,098 3,179 548 1,165 26 57 102 247 18 42
% 07.00% 05.63% 07.80% 06.66% 07.87% 05.46% 08.06% 05.27% 06.87% 06.74% 08.44% 07.34% 11.49% 06.40% 08.75% 05.28% 06.98%
GS - 9 # 18,331 7,594 10,737 645 649 4,551 6,488 1,772 2,776 414 528 24 33 154 226 34 37
% 06.20% 06.99% 05.74% 07.57% 05.80% 06.60% 05.80% 08.50% 06.00% 05.09% 03.82% 06.78% 06.65% 09.66% 08.00% 09.97% 06.15%
GS - 10
# 3,750 1,707 2,043 135 127 1,042 1,318 390 437 104 115 6 3 23 35 7 8
% 01.27% 01.57% 01.09% 01.59% 01.14% 01.51% 01.18% 01.87% 00.94% 01.28% 00.83% 01.69% 00.60% 01.44% 01.24% 02.05% 01.33%
GS - 11
# 60,377 17,216 43,161 1,285 2,450 11,529 26,913 2,787 8,510 1,267 4,509 61 94 236 583 51 102
% 20.42% 15.84% 23.08% 15.09% 21.90% 16.73% 24.07% 13.37% 18.38% 15.58% 32.65% 17.23% 18.95% 14.81% 20.64% 14.96% 16.94%
GS - 12
# 28,177 11,610 16,567 712 946 8,412 11,049 1,585 3,123 676 1,135 27 28 174 227 24 59
% 09.53% 10.68% 08.86% 08.36% 08.46% 12.21% 09.88% 07.60% 06.74% 08.31% 08.22% 07.63% 05.65% 10.92% 08.04% 07.04% 09.80%
GS - # 34,609 11,097 23,512 637 1,015 8,550 16,948 1,186 3,748 555 1,462 21 37 125 251 23 51

108
Table A4-2: PARTICIPATION RATES ACROSS GENERAL SCHEDULE (GS) GRADES - Permanent Workforce - by Race/Ethnicity and Sex - SEP - FY2014
All VA TOTAL
EMPLOYEES
RACE/ETHNICITY
Hispanic or Latino Non-Hispanic or Latino
White Black or African American
Asian Native Hawaiian or Other Pacific
Islander
American Indian or Alaska Native
Two or More Races/Undisclosed
All male female male female male female male female male female male female male female male female
13 % 11.70% 10.21% 12.57% 07.48% 09.07% 12.41% 15.16% 05.69% 08.09% 06.82% 10.59% 05.93% 07.46% 07.84% 08.89% 06.74% 08.47%
GS - 14
# 6,994 3,341 3,653 131 138 2,636 2,600 385 723 157 144 2 7 24 32 6 9
% 02.37% 03.07% 01.95% 01.54% 01.23% 03.83% 02.33% 01.85% 01.56% 01.93% 01.04% 00.56% 01.41% 01.51% 01.13% 01.76% 01.50%
GS - 15
# 24,655 15,704 8,951 840 531 11,020 5,288 689 697 2,893 2,253 23 15 214 151 25 16
% 08.34% 14.45% 04.79% 09.86% 04.75% 15.99% 04.73% 03.31% 01.51% 35.58% 16.31% 06.50% 03.02% 13.43% 05.35% 07.33% 02.66%
All Other GS
# 54 18 36 0 1 15 7 1 26 2 2 0 0 0 0 0 0
% 00.02% 00.02% 00.02% 00.00% 00.01% 00.02% 00.01% 00.00% 00.06% 00.02% 00.01% 00.00% 00.00% 00.00% 00.00% 00.00% 00.00%
SES # 358 214 144 16 4 170 116 19 18 6 4 0 0 2 1 1 1
% 00.12% 00.20% 00.08% 00.19% 00.04% 00.25% 00.10% 00.09% 00.04% 00.07% 00.03% 00.00% 00.00% 00.13% 00.04% 00.29% 00.17%
TOTAL # 295,711 108,690 187,021 8,517 11,188 68,908 111,797 20,844 46,303 8,132 13,811 354 496 1,594 2,824 341 602
% 100.00% 100.00% 100.00% 100.00% 100.00% 100.00% 100.00% 100.00% 100.00% 100.00% 100.00% 100.00% 100.00% 100.00% 100.00% 100.00% 100.00%Data shown includes GS/GM, SES, and related grades for full-time, part-time, and intermittent permanent employees in a pay status and excluding medical and Manila residents.For purposes of this report, Title 38 nurses are coded to GS equivalent grades. Please see Data Definitions.Percentages are based on column totals

109
Table B4-2: PARTICIPATION RATES ACROSS GENERAL SCHEDULE (GS) GRADES - Permanent Workforce - by Disability - SEP - FY2014
All VA TOTAL Total by Disability Status Detail for Targeted Disabilities
[04,05]No
Disability
[01]Not
Identified
[06-98]ReportableDisability
TotalTargetedDisability
[16,17,18]Hearing
[21,23,25]Vision
[28,30,32-38]Missing
Extremities
[64-69]Partial
Paralysis
[71-79]CompleteParalysis
[82]Epilepsy
[90]Severe
IntellectualDisability
[91]PsychiatricDisability
[92]Dwarfism
GS - 1 # 13 5 1 7 3 1 0 0 0 1 0 1 0 0
% 00.00% 00.00% 00.01% 00.02% 00.06% 00.38% 00.00% 00.00% 00.00% 00.74% 00.00% 00.72% 00.00% 00.00%
GS - 2 # 83 42 5 36 13 0 1 0 1 1 4 4 1 1
% 00.03% 00.02% 00.06% 00.10% 00.26% 00.00% 00.23% 00.00% 00.19% 00.74% 00.76% 02.88% 00.04% 01.43%
GS - 3 # 922 615 27 280 75 4 3 1 4 0 3 27 33 0
% 00.31% 00.25% 00.34% 00.74% 01.48% 01.53% 00.69% 00.51% 00.77% 00.00% 00.57% 19.42% 01.19% 00.00%
GS - 4 # 6,148 4,452 232 1,464 323 44 29 5 21 8 23 27 161 5
% 02.08% 01.78% 02.94% 03.88% 06.38% 16.86% 06.68% 02.53% 04.03% 05.88% 04.36% 19.42% 05.80% 07.14%
GS - 5 # 30,629 23,728 1,063 5,838 945 56 75 23 88 15 96 31 548 13
% 10.36% 09.49% 13.48% 15.46% 18.66% 21.46% 17.28% 11.62% 16.89% 11.03% 18.18% 22.30% 19.73% 18.57%
GS - 6 # 39,162 31,889 1,220 6,053 866 55 58 29 71 17 84 23 517 12
% 13.24% 12.75% 15.47% 16.03% 17.10% 21.07% 13.36% 14.65% 13.63% 12.50% 15.91% 16.55% 18.61% 17.14%
GS - 7 # 20,750 16,285 688 3,777 577 23 36 21 69 13 49 10 348 8
% 07.02% 06.51% 08.72% 10.01% 11.39% 08.81% 08.29% 10.61% 13.24% 09.56% 09.28% 07.19% 12.53% 11.43%
GS - 8 # 20,699 18,330 446 1,923 213 9 15 5 15 3 30 2 133 1
% 07.00% 07.33% 05.66% 05.09% 04.21% 03.45% 03.46% 02.53% 02.88% 02.21% 05.68% 01.44% 04.79% 01.43%
GS - 9 # 18,331 14,845 536 2,950 385 12 15 11 39 14 36 8 245 5
% 06.20% 05.94% 06.80% 07.81% 07.60% 04.60% 03.46% 05.56% 07.49% 10.29% 06.82% 05.76% 08.82% 07.14%
GS - 10 # 3,750 3,108 111 531 59 3 1 4 5 0 12 0 34 0
% 01.27% 01.24% 01.41% 01.41% 01.16% 01.15% 00.23% 02.02% 00.96% 00.00% 02.27% 00.00% 01.22% 00.00%
GS - 11 # 60,377 52,691 1,377 6,309 719 23 95 34 67 21 70 5 396 8
% 20.42% 21.07% 17.46% 16.71% 14.20% 08.81% 21.89% 17.17% 12.86% 15.44% 13.26% 03.60% 14.25% 11.43%
GS - 12 # 28,177 24,045 711 3,421 410 22 49 26 55 15 50 0 182 11
% 09.53% 09.62% 09.02% 09.06% 08.09% 08.43% 11.29% 13.13% 10.56% 11.03% 09.47% 00.00% 06.55% 15.71%
GS - 13 # 34,609 30,744 757 3,108 302 7 39 20 50 13 49 0 122 2
% 11.70% 12.29% 09.60% 08.23% 05.96% 02.68% 08.99% 10.10% 09.60% 09.56% 09.28% 00.00% 04.39% 02.86%
GS - 14 # 6,994 6,125 213 656 54 1 9 7 8 2 4 1 19 3

110
Table B4-2: PARTICIPATION RATES ACROSS GENERAL SCHEDULE (GS) GRADES - Permanent Workforce - by Disability - SEP - FY2014
All VA TOTAL Total by Disability Status Detail for Targeted Disabilities
[04,05]No
Disability
[01]Not
Identified
[06-98]ReportableDisability
TotalTargetedDisability
[16,17,18]Hearing
[21,23,25]Vision
[28,30,32-38]Missing
Extremities
[64-69]Partial
Paralysis
[71-79]CompleteParalysis
[82]Epilepsy
[90]Severe
IntellectualDisability
[91]PsychiatricDisability
[92]Dwarfism
% 02.37% 02.45% 02.70% 01.74% 01.07% 00.38% 02.07% 03.54% 01.54% 01.47% 00.76% 00.72% 00.68% 04.29%
GS - 15 # 24,655 22,809 487 1,359 116 1 9 12 24 13 18 0 38 1
% 08.34% 09.12% 06.18% 03.60% 02.29% 00.38% 02.07% 06.06% 04.61% 09.56% 03.41% 00.00% 01.37% 01.43%
All Other GS # 54 53 0 1 0 0 0 0 0 0 0 0 0 0
% 00.02% 00.02% 00.00% 00.00% 00.00% 00.00% 00.00% 00.00% 00.00% 00.00% 00.00% 00.00% 00.00% 00.00%
SES # 358 308 12 38 5 0 0 0 4 0 0 0 1 0
% 00.12% 00.12% 00.15% 00.10% 00.10% 00.00% 00.00% 00.00% 00.77% 00.00% 00.00% 00.00% 00.04% 00.00%
TOTAL # 295,711 250,074 7,886 37,751 5,065 261 434 198 521 136 528 139 2,778 70
% 100.00% 100.00% 100.00% 100.00% 100.00% 100.00% 100.00% 100.00% 100.00% 100.00% 100.00% 100.00% 100.00% 100.00%Data shown includes GS/GM, SES, and related grades for full-time, part-time, and intermittent permanent employees in a pay status and excluding medical and Manila residents.For purposes of this report, Title 38 nurses are coded to GS equivalent grades. Please see Data Definitions.Percentages are based on column totals

111
Table A4-2: PARTICIPATION RATES ACROSS GENERAL SCHEDULE (GS) GRADES - Temporary Workforce - by Race/Ethnicity and Sex - SEP - FY2014
All VA TOTAL
EMPLOYEES
RACE/ETHNICITY
Hispanic or Latino Non-Hispanic or Latino
White Black or African American
Asian Native Hawaiian or Other Pacific
Islander
American Indian or Alaska Native
Two or More Races/Undisclosed
All male female male female male female male female male female male female male female male female
GS - 1 # 49 16 33 1 3 11 16 3 9 1 3 0 0 0 2 0 0
% 00.26% 00.22% 00.27% 00.25% 00.55% 00.24% 00.21% 00.32% 00.44% 00.09% 00.21% 00.00% 00.00% 00.00% 00.94% 00.00% 00.00%
GS - 2 # 128 48 80 1 5 28 50 15 22 2 1 1 0 1 2 0 0
% 00.67% 00.67% 00.67% 00.25% 00.91% 00.61% 00.65% 01.58% 01.08% 00.19% 00.07% 04.55% 00.00% 00.82% 00.94% 00.00% 00.00%
GS - 3 # 226 90 136 14 10 51 85 21 30 3 7 0 1 1 3 0 0
% 01.18% 01.26% 01.13% 03.54% 01.83% 01.12% 01.10% 02.22% 01.47% 00.28% 00.50% 00.00% 02.78% 00.82% 01.41% 00.00% 00.00%
GS - 4 # 1,000 358 642 33 40 198 335 83 197 34 53 2 5 7 9 1 3
% 05.22% 05.01% 05.34% 08.33% 07.31% 04.34% 04.33% 08.76% 09.67% 03.20% 03.79% 09.09% 13.89% 05.74% 04.23% 03.45% 06.25%
GS - 5 # 1,714 714 1,000 56 68 333 434 254 381 49 75 3 7 12 23 7 12
% 08.95% 10.00% 08.33% 14.14% 12.43% 07.30% 05.61% 26.79% 18.69% 04.61% 05.36% 13.64% 19.44% 09.84% 10.80% 24.14% 25.00%
GS - 6 # 688 274 414 31 25 148 234 69 124 20 20 1 2 1 7 4 2
% 03.59% 03.84% 03.45% 07.83% 04.57% 03.24% 03.03% 07.28% 06.08% 01.88% 01.43% 04.55% 05.56% 00.82% 03.29% 13.79% 04.17%
GS - 7 # 945 432 513 37 27 222 287 111 144 45 38 3 2 13 12 1 3
% 04.93% 06.05% 04.27% 09.34% 04.94% 04.86% 03.71% 11.71% 07.07% 04.24% 02.71% 13.64% 05.56% 10.66% 05.63% 03.45% 06.25%
GS - 8 # 999 239 760 14 30 139 434 49 196 30 79 0 3 7 13 0 5
% 05.22% 03.35% 06.33% 03.54% 05.48% 03.05% 05.61% 05.17% 09.62% 02.82% 05.64% 00.00% 08.33% 05.74% 06.10% 00.00% 10.42%
GS - 9 # 1,287 480 807 27 38 297 524 97 163 43 60 4 4 9 12 3 6
% 06.72% 06.72% 06.72% 06.82% 06.95% 06.51% 06.78% 10.23% 08.00% 04.05% 04.29% 18.18% 11.11% 07.38% 05.63% 10.34% 12.50%
GS - 10
# 27 4 23 0 0 1 18 2 2 0 2 0 0 1 1 0 0
% 00.14% 00.06% 00.19% 00.00% 00.00% 00.02% 00.23% 00.21% 00.10% 00.00% 00.14% 00.00% 00.00% 00.82% 00.47% 00.00% 00.00%
GS - 11
# 1,988 555 1,433 27 67 393 972 66 204 52 164 1 2 10 22 6 2
% 10.38% 07.77% 11.93% 06.82% 12.25% 08.61% 12.57% 06.96% 10.01% 04.90% 11.71% 04.55% 05.56% 08.20% 10.33% 20.69% 04.17%
GS - 12
# 1,126 369 757 10 28 277 547 25 71 51 94 2 1 3 14 1 2
% 05.88% 05.17% 06.30% 02.53% 05.12% 06.07% 07.08% 02.64% 03.48% 04.80% 06.71% 09.09% 02.78% 02.46% 06.57% 03.45% 04.17%
GS - # 1,281 541 740 12 15 416 589 20 38 85 89 0 0 8 9 0 0

112
Table A4-2: PARTICIPATION RATES ACROSS GENERAL SCHEDULE (GS) GRADES - Temporary Workforce - by Race/Ethnicity and Sex - SEP - FY2014
All VA TOTAL
EMPLOYEES
RACE/ETHNICITY
Hispanic or Latino Non-Hispanic or Latino
White Black or African American
Asian Native Hawaiian or Other Pacific
Islander
American Indian or Alaska Native
Two or More Races/Undisclosed
All male female male female male female male female male female male female male female male female
13 % 06.69% 07.57% 06.16% 03.03% 02.74% 09.11% 07.62% 02.11% 01.86% 08.00% 06.36% 00.00% 00.00% 06.56% 04.23% 00.00% 00.00%
GS - 14
# 237 146 91 5 0 102 75 6 3 30 11 0 0 3 2 0 0
% 01.24% 02.04% 00.76% 01.26% 00.00% 02.23% 00.97% 00.63% 00.15% 02.82% 00.79% 00.00% 00.00% 02.46% 00.94% 00.00% 00.00%
GS - 15
# 2,406 1,564 842 79 17 931 460 41 46 481 297 3 2 27 18 2 2
% 12.56% 21.90% 07.01% 19.95% 03.11% 20.40% 05.95% 04.32% 02.26% 45.29% 21.21% 13.64% 05.56% 22.13% 08.45% 06.90% 04.17%
All Other GS
# 5,053 1,313 3,740 49 174 1,017 2,670 86 408 136 407 2 7 19 63 4 11
% 26.38% 18.38% 31.14% 12.37% 31.81% 22.28% 34.54% 09.07% 20.02% 12.81% 29.07% 09.09% 19.44% 15.57% 29.58% 13.79% 22.92%
SES # 1 0 1 0 0 0 0 0 0 0 0 0 0 0 1 0 0
% 00.01% 00.00% 00.01% 00.00% 00.00% 00.00% 00.00% 00.00% 00.00% 00.00% 00.00% 00.00% 00.00% 00.00% 00.47% 00.00% 00.00%
TOTAL # 19,155 7,143 12,012 396 547 4,564 7,730 948 2,038 1,062 1,400 22 36 122 213 29 48
% 100.00% 100.00% 100.00% 100.00% 100.00% 100.00% 100.00% 100.00% 100.00% 100.00% 100.00% 100.00% 100.00% 100.00% 100.00% 100.00% 100.00%Data shown includes GS/GM, SES, and related grades for full-time, part-time, and intermittent temporary employees in a pay status and excluding medical and Manila residents.For purposes of this report, Title 38 nurses are coded to GS equivalent grades. Please see Data Definitions.Percentages are based on column totals

113
Table B4-2: PARTICIPATION RATES ACROSS GENERAL SCHEDULE (GS) GRADES - Temporary Workforce - by Disability - SEP - FY2014
All VA TOTAL Total by Disability Status Detail for Targeted Disabilities
[04,05]No
Disability
[01]Not
Identified
[06-98]ReportableDisability
TotalTargetedDisability
[16,17,18]Hearing
[21,23,25]Vision
[28,30,32-38]Missing
Extremities
[64-69]Partial
Paralysis
[71-79]CompleteParalysis
[82]Epilepsy
[90]Severe
IntellectualDisability
[91]PsychiatricDisability
[92]Dwarfism
GS - 1 # 49 37 4 8 4 0 0 0 0 0 0 0 4 0
% 00.26% 00.23% 00.74% 00.35% 01.09% 00.00% 00.00% 00.00% 00.00% 00.00% 00.00% 00.00% 01.66% 00.00%
GS - 2 # 128 101 4 23 3 1 0 0 1 0 0 1 0 0
% 00.67% 00.62% 00.74% 01.01% 00.82% 11.11% 00.00% 00.00% 03.23% 00.00% 00.00% 10.00% 00.00% 00.00%
GS - 3 # 226 168 8 50 8 2 0 0 1 0 0 0 5 0
% 01.18% 01.03% 01.48% 02.19% 02.18% 22.22% 00.00% 00.00% 03.23% 00.00% 00.00% 00.00% 02.07% 00.00%
GS - 4 # 1,000 771 39 190 29 2 2 0 2 0 4 0 19 0
% 05.22% 04.72% 07.20% 08.32% 07.90% 22.22% 12.50% 00.00% 06.45% 00.00% 10.81% 00.00% 07.88% 00.00%
GS - 5 # 1,714 1,119 97 498 100 1 2 2 9 0 8 4 73 1
% 08.95% 06.85% 17.90% 21.80% 27.25% 11.11% 12.50% 20.00% 29.03% 00.00% 21.62% 40.00% 30.29% 16.67%
GS - 6 # 688 510 24 154 31 1 1 0 3 0 2 0 23 1
% 03.59% 03.12% 04.43% 06.74% 08.45% 11.11% 06.25% 00.00% 09.68% 00.00% 05.41% 00.00% 09.54% 16.67%
GS - 7 # 945 671 40 234 41 1 1 0 4 2 2 2 29 0
% 04.93% 04.11% 07.38% 10.25% 11.17% 11.11% 06.25% 00.00% 12.90% 28.57% 05.41% 20.00% 12.03% 00.00%
GS - 8 # 999 897 21 81 6 0 1 0 0 0 1 0 4 0
% 05.22% 05.49% 03.87% 03.55% 01.63% 00.00% 06.25% 00.00% 00.00% 00.00% 02.70% 00.00% 01.66% 00.00%
GS - 9 # 1,287 952 49 286 73 0 1 1 4 2 3 2 57 3
% 06.72% 05.83% 09.04% 12.52% 19.89% 00.00% 06.25% 10.00% 12.90% 28.57% 08.11% 20.00% 23.65% 50.00%
GS - 10 # 27 24 1 2 1 0 0 1 0 0 0 0 0 0
% 00.14% 00.15% 00.18% 00.09% 00.27% 00.00% 00.00% 10.00% 00.00% 00.00% 00.00% 00.00% 00.00% 00.00%
GS - 11 # 1,988 1,753 48 187 28 1 2 1 3 1 5 1 13 1
% 10.38% 10.74% 08.86% 08.19% 07.63% 11.11% 12.50% 10.00% 09.68% 14.29% 13.51% 10.00% 05.39% 16.67%
GS - 12 # 1,126 1,030 20 76 10 0 2 1 0 0 1 0 6 0
% 05.88% 06.31% 03.69% 03.33% 02.72% 00.00% 12.50% 10.00% 00.00% 00.00% 02.70% 00.00% 02.49% 00.00%
GS - 13 # 1,281 1,183 33 65 7 0 3 0 1 1 1 0 1 0
% 06.69% 07.24% 06.09% 02.85% 01.91% 00.00% 18.75% 00.00% 03.23% 14.29% 02.70% 00.00% 00.41% 00.00%
GS - 14 # 237 210 5 22 1 0 0 0 0 0 1 0 0 0

114
Table B4-2: PARTICIPATION RATES ACROSS GENERAL SCHEDULE (GS) GRADES - Temporary Workforce - by Disability - SEP - FY2014
All VA TOTAL Total by Disability Status Detail for Targeted Disabilities
[04,05]No
Disability
[01]Not
Identified
[06-98]ReportableDisability
TotalTargetedDisability
[16,17,18]Hearing
[21,23,25]Vision
[28,30,32-38]Missing
Extremities
[64-69]Partial
Paralysis
[71-79]CompleteParalysis
[82]Epilepsy
[90]Severe
IntellectualDisability
[91]PsychiatricDisability
[92]Dwarfism
% 01.24% 01.29% 00.92% 00.96% 00.27% 00.00% 00.00% 00.00% 00.00% 00.00% 02.70% 00.00% 00.00% 00.00%
GS - 15 # 2,406 2,300 38 68 4 0 0 1 0 1 0 0 2 0
% 12.56% 14.09% 07.01% 02.98% 01.09% 00.00% 00.00% 10.00% 00.00% 14.29% 00.00% 00.00% 00.83% 00.00%
All Other GS # 5,053 4,602 111 340 21 0 1 3 3 0 9 0 5 0
% 26.38% 28.18% 20.48% 14.89% 05.72% 00.00% 06.25% 30.00% 09.68% 00.00% 24.32% 00.00% 02.07% 00.00%
SES # 1 1 0 0 0 0 0 0 0 0 0 0 0 0
% 00.01% 00.01% 00.00% 00.00% 00.00% 00.00% 00.00% 00.00% 00.00% 00.00% 00.00% 00.00% 00.00% 00.00%
TOTAL # 19,155 16,329 542 2,284 367 9 16 10 31 7 37 10 241 6
% 100.00% 100.00% 100.00% 100.00% 100.00% 100.00% 100.00% 100.00% 100.00% 100.00% 100.00% 100.00% 100.00% 100.00%Data shown includes GS/GM, SES, and related grades for full-time, part-time, and intermittent temporary employees in a pay status and excluding medical and Manila residents.For purposes of this report, Title 38 nurses are coded to GS equivalent grades. Please see Data Definitions.Percentages are based on column totals

115
Table A5-1: PARTICIPATION RATES ACROSS WAGE GRADES - Permanent Workforce - by Race/Ethnicity and Sex - SEP - FY2014
All VA TOTAL
EMPLOYEES
RACE/ETHNICITY
Hispanic or Latino
Non-Hispanic or Latino
White Black or African American
Asian Native Hawaiian or Other Pacific
Islander
American Indian or Alaska Native
Two or More Races/Undisclosed
All male female male female male female male female male female male female male female male female
Grade - 1 # 784 669 115 36 11 244 52 373 47 8 1 3 0 3 4 2 0
% 99.99% 85.33% 14.66% 04.59% 01.40% 31.12% 06.63% 47.58% 05.99% 01.02% 00.13% 00.38% 00.00% 00.38% 00.51% 00.26% 00.00%
Grade - 2 # 11,620 9,641 1,979 606 124 3,543 695 5,157 1,067 157 55 32 1 120 30 26 7
% 100.00% 82.97% 17.03% 05.22% 01.07% 30.49% 05.98% 44.38% 09.18% 01.35% 00.47% 00.28% 00.01% 01.03% 00.26% 00.22% 00.06%
Grade - 3 # 3,217 2,331 886 198 68 795 309 1,267 467 32 21 4 2 25 16 10 3
% 99.98% 72.44% 27.54% 06.15% 02.11% 24.71% 09.61% 39.38% 14.52% 00.99% 00.65% 00.12% 00.06% 00.78% 00.50% 00.31% 00.09%
Grade - 4 # 1,548 941 607 74 26 377 223 441 330 25 17 2 3 22 7 0 1
% 99.99% 60.78% 39.21% 04.78% 01.68% 24.35% 14.41% 28.49% 21.32% 01.61% 01.10% 00.13% 00.19% 01.42% 00.45% 00.00% 00.06%
Grade - 5 # 1,327 1,219 108 120 11 607 52 440 39 29 4 5 0 15 2 3 0
% 100.01% 91.87% 08.14% 09.04% 00.83% 45.74% 03.92% 33.16% 02.94% 02.19% 00.30% 00.38% 00.00% 01.13% 00.15% 00.23% 00.00%
Grade - 6 # 1,838 1,657 181 126 5 867 86 585 79 39 7 12 2 24 2 4 0
% 100.01% 90.16% 09.85% 06.86% 00.27% 47.17% 04.68% 31.83% 04.30% 02.12% 00.38% 00.65% 00.11% 01.31% 00.11% 00.22% 00.00%
Grade - 7 # 830 772 58 102 8 389 21 263 27 10 0 2 0 6 2 0 0
% 99.99% 93.01% 06.98% 12.29% 00.96% 46.87% 02.53% 31.69% 03.25% 01.20% 00.00% 00.24% 00.00% 00.72% 00.24% 00.00% 00.00%
Grade - 8 # 870 823 47 71 2 498 24 217 21 20 0 4 0 11 0 2 0
% 99.99% 94.59% 05.40% 08.16% 00.23% 57.24% 02.76% 24.94% 02.41% 02.30% 00.00% 00.46% 00.00% 01.26% 00.00% 00.23% 00.00%
Grade - 9 # 1,554 1,519 35 131 2 1,064 21 266 11 24 0 5 1 26 0 3 0
% 99.99% 97.74% 02.25% 08.43% 00.13% 68.47% 01.35% 17.12% 00.71% 01.54% 00.00% 00.32% 00.06% 01.67% 00.00% 00.19% 00.00%
Grade - 10
# 3,242 3,214 28 238 2 2,397 17 426 8 98 0 9 0 40 1 6 0
% 100.00% 99.14% 00.86% 07.34% 00.06% 73.94% 00.52% 13.14% 00.25% 03.02% 00.00% 00.28% 00.00% 01.23% 00.03% 00.19% 00.00%
Grade - 11
# 954 944 10 51 1 689 7 154 2 30 0 5 0 15 0 0 0
% 99.98% 98.94% 01.04% 05.35% 00.10% 72.22% 00.73% 16.14% 00.21% 03.14% 00.00% 00.52% 00.00% 01.57% 00.00% 00.00% 00.00%
Grade - 12
# 24 24 0 0 0 22 0 1 0 0 0 0 0 1 0 0 0
% 100.01% 100.01% 00.00% 00.00% 00.00% 91.67% 00.00% 04.17% 00.00% 00.00% 00.00% 00.00% 00.00% 04.17% 00.00% 00.00% 00.00%
Grade - # 23 23 0 1 0 18 0 3 0 0 0 0 0 1 0 0 0

116
Table A5-1: PARTICIPATION RATES ACROSS WAGE GRADES - Permanent Workforce - by Race/Ethnicity and Sex - SEP - FY2014
All VA TOTAL
EMPLOYEES
RACE/ETHNICITY
Hispanic or Latino
Non-Hispanic or Latino
White Black or African American
Asian Native Hawaiian or Other Pacific
Islander
American Indian or Alaska Native
Two or More Races/Undisclosed
All male female male female male female male female male female male female male female male female
13 % 100.00% 100.00% 00.00% 04.35% 00.00% 78.26% 00.00% 13.04% 00.00% 00.00% 00.00% 00.00% 00.00% 04.35% 00.00% 00.00% 00.00%
Grade - 14
# 17 16 1 1 0 12 1 3 0 0 0 0 0 0 0 0 0
% 100.00% 94.12% 05.88% 05.88% 00.00% 70.59% 05.88% 17.65% 00.00% 00.00% 00.00% 00.00% 00.00% 00.00% 00.00% 00.00% 00.00%
Grade - 15
# 9 9 0 0 0 8 0 1 0 0 0 0 0 0 0 0 0
% 100.00% 100.00% 00.00% 00.00% 00.00% 88.89% 00.00% 11.11% 00.00% 00.00% 00.00% 00.00% 00.00% 00.00% 00.00% 00.00% 00.00%
All Other Wage Grades
# 2 2 0 0 0 1 0 1 0 0 0 0 0 0 0 0 0
% 100.00% 100.00% 00.00% 00.00% 00.00% 50.00% 00.00% 50.00% 00.00% 00.00% 00.00% 00.00% 00.00% 00.00% 00.00% 00.00% 00.00%
TOTAL # 27,859 23,804 4,055 1,755 260 11,531 1,508 9,598 2,098 472 105 83 9 309 64 56 11
% 99.99% 85.44% 14.55% 06.30% 00.93% 41.39% 05.41% 34.45% 07.53% 01.69% 00.38% 00.30% 00.03% 01.11% 00.23% 00.20% 00.04%Data shown includes WG grades for full-time, part-time, and intermittent permanent employees in a pay status and excluding medical and Manila residents.Percentages are based on row totals

117
Table B5-1: PARTICIPATION RATES ACROSS WAGE GRADES - Permanent Workforce - by Disability - SEP - FY2014
All VA TOTAL Total by Disability Status Detail for Targeted Disabilities
[04,05]No
Disability
[01]Not
Identified
[06-98]ReportableDisability
TotalTargetedDisability
[16,17,18]Hearing
[21,23,25]Vision
[28,30,32-38]Missing
Extremities
[64-69]Partial
Paralysis
[71-79]CompleteParalysis
[82]Epilepsy
[90]Severe
IntellectualDisability
[91]PsychiatricDisability
[92]Dwarfism
Grade - 1 # 784 401 41 342 102 5 1 0 3 0 6 16 70 1
% 100.00% 51.15% 05.23% 43.62% 13.01% 00.64% 00.13% 00.00% 00.38% 00.00% 00.77% 02.04% 08.93% 00.13%
Grade - 2 # 11,620 7,313 541 3,766 1,042 72 42 11 48 6 39 108 712 4
% 100.00% 62.93% 04.66% 32.41% 08.97% 00.62% 00.36% 00.09% 00.41% 00.05% 00.34% 00.93% 06.13% 00.03%
Grade - 3 # 3,217 2,385 130 702 181 16 7 2 14 3 6 23 108 2
% 100.00% 74.14% 04.04% 21.82% 05.63% 00.50% 00.22% 00.06% 00.44% 00.09% 00.19% 00.71% 03.36% 00.06%
Grade - 4 # 1,548 1,196 50 302 64 12 3 1 4 1 2 6 35 0
% 100.00% 77.26% 03.23% 19.51% 04.13% 00.78% 00.19% 00.06% 00.26% 00.06% 00.13% 00.39% 02.26% 00.00%
Grade - 5 # 1,327 979 56 292 56 3 2 2 1 1 5 2 40 0
% 100.00% 73.78% 04.22% 22.00% 04.22% 00.23% 00.15% 00.15% 00.08% 00.08% 00.38% 00.15% 03.01% 00.00%
Grade - 6 # 1,838 1,407 69 362 49 2 3 0 2 0 2 2 37 1
% 100.00% 76.55% 03.75% 19.70% 02.67% 00.11% 00.16% 00.00% 00.11% 00.00% 00.11% 00.11% 02.01% 00.05%
Grade - 7 # 830 639 52 139 21 0 0 0 2 0 1 2 15 1
% 100.00% 76.99% 06.27% 16.75% 02.53% 00.00% 00.00% 00.00% 00.24% 00.00% 00.12% 00.24% 01.81% 00.12%
Grade - 8 # 870 654 47 169 27 1 2 0 2 0 0 0 22 0
% 100.00% 75.17% 05.40% 19.43% 03.10% 00.11% 00.23% 00.00% 00.23% 00.00% 00.00% 00.00% 02.53% 00.00%
Grade - 9 # 1,554 1,201 60 293 43 4 3 0 3 0 2 0 31 0
% 100.00% 77.28% 03.86% 18.85% 02.77% 00.26% 00.19% 00.00% 00.19% 00.00% 00.13% 00.00% 01.99% 00.00%
Grade - 10 # 3,242 2,582 117 543 64 5 3 2 3 3 2 3 43 0
% 100.00% 79.64% 03.61% 16.75% 01.97% 00.15% 00.09% 00.06% 00.09% 00.09% 00.06% 00.09% 01.33% 00.00%
Grade - 11 # 954 754 33 167 14 1 1 0 2 0 1 0 8 1
% 100.00% 79.04% 03.46% 17.51% 01.47% 00.10% 00.10% 00.00% 00.21% 00.00% 00.10% 00.00% 00.84% 00.10%
Grade - 12 # 24 19 0 5 1 0 0 0 1 0 0 0 0 0
% 100.00% 79.17% 00.00% 20.83% 04.17% 00.00% 00.00% 00.00% 04.17% 00.00% 00.00% 00.00% 00.00% 00.00%
Grade - 13 # 23 18 1 4 0 0 0 0 0 0 0 0 0 0
% 100.00% 78.26% 04.35% 17.39% 00.00% 00.00% 00.00% 00.00% 00.00% 00.00% 00.00% 00.00% 00.00% 00.00%
Grade - 14 # 17 17 0 0 0 0 0 0 0 0 0 0 0 0

118
Table B5-1: PARTICIPATION RATES ACROSS WAGE GRADES - Permanent Workforce - by Disability - SEP - FY2014
All VA TOTAL Total by Disability Status Detail for Targeted Disabilities
[04,05]No
Disability
[01]Not
Identified
[06-98]ReportableDisability
TotalTargetedDisability
[16,17,18]Hearing
[21,23,25]Vision
[28,30,32-38]Missing
Extremities
[64-69]Partial
Paralysis
[71-79]CompleteParalysis
[82]Epilepsy
[90]Severe
IntellectualDisability
[91]PsychiatricDisability
[92]Dwarfism
% 100.00% 100.00% 00.00% 00.00% 00.00% 00.00% 00.00% 00.00% 00.00% 00.00% 00.00% 00.00% 00.00% 00.00%
Grade - 15 # 9 9 0 0 0 0 0 0 0 0 0 0 0 0
% 100.00% 100.00% 00.00% 00.00% 00.00% 00.00% 00.00% 00.00% 00.00% 00.00% 00.00% 00.00% 00.00% 00.00%
All Other Wage Grades # 2 2 0 0 0 0 0 0 0 0 0 0 0 0
% 100.00% 100.00% 00.00% 00.00% 00.00% 00.00% 00.00% 00.00% 00.00% 00.00% 00.00% 00.00% 00.00% 00.00%
TOTAL # 27,859 19,576 1,197 7,086 1,664 121 67 18 85 14 66 162 1,121 10
% 100.00% 70.27% 04.30% 25.44% 05.97% 00.43% 00.24% 00.06% 00.31% 00.05% 00.24% 00.58% 04.02% 00.04%Data shown includes WG grades for full-time, part-time, and intermittent permanent employees in a pay status and excluding medical and Manila residents.Percentages are based on row totals

119
Table A5-1: PARTICIPATION RATES ACROSS WAGE GRADES - Temporary Workforce - by Race/Ethnicity and Sex - SEP - FY2014
All VA TOTAL
EMPLOYEES
RACE/ETHNICITY
Hispanic or Latino
Non-Hispanic or Latino
White Black or African American
Asian Native Hawaiian or Other Pacific
Islander
American Indian or Alaska Native
Two or More Races/Undisclosed
All male female male female male female male female male female male female male female male female
Grade - 1 # 45 32 13 0 0 20 8 11 4 1 0 0 0 0 1 0 0
% 99.99% 71.10% 28.89% 00.00% 00.00% 44.44% 17.78% 24.44% 08.89% 02.22% 00.00% 00.00% 00.00% 00.00% 02.22% 00.00% 00.00%
Grade - 2 # 278 248 30 27 2 89 13 117 11 6 2 2 1 6 0 1 1
% 100.01% 89.21% 10.80% 09.71% 00.72% 32.01% 04.68% 42.09% 03.96% 02.16% 00.72% 00.72% 00.36% 02.16% 00.00% 00.36% 00.36%
Grade - 3 # 58 56 2 6 0 24 0 24 0 0 2 0 0 2 0 0 0
% 100.00% 96.55% 03.45% 10.34% 00.00% 41.38% 00.00% 41.38% 00.00% 00.00% 03.45% 00.00% 00.00% 03.45% 00.00% 00.00% 00.00%
Grade - 4 # 38 37 1 6 0 23 1 6 0 0 0 1 0 1 0 0 0
% 100.00% 97.37% 02.63% 15.79% 00.00% 60.53% 02.63% 15.79% 00.00% 00.00% 00.00% 02.63% 00.00% 02.63% 00.00% 00.00% 00.00%
Grade - 5 # 67 62 5 7 0 38 5 13 0 1 0 0 0 3 0 0 0
% 100.00% 92.54% 07.46% 10.45% 00.00% 56.72% 07.46% 19.40% 00.00% 01.49% 00.00% 00.00% 00.00% 04.48% 00.00% 00.00% 00.00%
Grade - 6 # 82 77 5 3 0 52 4 18 1 3 0 0 0 0 0 1 0
% 100.00% 93.90% 06.10% 03.66% 00.00% 63.41% 04.88% 21.95% 01.22% 03.66% 00.00% 00.00% 00.00% 00.00% 00.00% 01.22% 00.00%
Grade - 7 # 59 57 2 6 0 26 0 20 2 3 0 0 0 2 0 0 0
% 100.00% 96.61% 03.39% 10.17% 00.00% 44.07% 00.00% 33.90% 03.39% 05.08% 00.00% 00.00% 00.00% 03.39% 00.00% 00.00% 00.00%
Grade - 8 # 12 10 2 0 0 7 1 3 1 0 0 0 0 0 0 0 0
% 99.99% 83.33% 16.66% 00.00% 00.00% 58.33% 08.33% 25.00% 08.33% 00.00% 00.00% 00.00% 00.00% 00.00% 00.00% 00.00% 00.00%
Grade - 9 # 88 86 2 6 0 63 1 15 0 0 1 0 0 2 0 0 0
% 100.01% 97.73% 02.28% 06.82% 00.00% 71.59% 01.14% 17.05% 00.00% 00.00% 01.14% 00.00% 00.00% 02.27% 00.00% 00.00% 00.00%
Grade - 10
# 67 67 0 8 0 47 0 9 0 1 0 1 0 1 0 0 0
% 99.99% 99.99% 00.00% 11.94% 00.00% 70.15% 00.00% 13.43% 00.00% 01.49% 00.00% 01.49% 00.00% 01.49% 00.00% 00.00% 00.00%
Grade - 11
# 5 5 0 1 0 2 0 2 0 0 0 0 0 0 0 0 0
% 100.00% 100.00% 00.00% 20.00% 00.00% 40.00% 00.00% 40.00% 00.00% 00.00% 00.00% 00.00% 00.00% 00.00% 00.00% 00.00% 00.00%
Grade - 12
# 0 0 0 0 0 0 0 0 0 0 0 0 0 0 0 0 0
% 00.00% 00.00% 00.00% 00.00% 00.00% 00.00% 00.00% 00.00% 00.00% 00.00% 00.00% 00.00% 00.00% 00.00% 00.00% 00.00% 00.00%
Grade - # 0 0 0 0 0 0 0 0 0 0 0 0 0 0 0 0 0

120
Table A5-1: PARTICIPATION RATES ACROSS WAGE GRADES - Temporary Workforce - by Race/Ethnicity and Sex - SEP - FY2014
All VA TOTAL
EMPLOYEES
RACE/ETHNICITY
Hispanic or Latino
Non-Hispanic or Latino
White Black or African American
Asian Native Hawaiian or Other Pacific
Islander
American Indian or Alaska Native
Two or More Races/Undisclosed
All male female male female male female male female male female male female male female male female
13 % 00.00% 00.00% 00.00% 00.00% 00.00% 00.00% 00.00% 00.00% 00.00% 00.00% 00.00% 00.00% 00.00% 00.00% 00.00% 00.00% 00.00%
Grade - 14
# 0 0 0 0 0 0 0 0 0 0 0 0 0 0 0 0 0
% 00.00% 00.00% 00.00% 00.00% 00.00% 00.00% 00.00% 00.00% 00.00% 00.00% 00.00% 00.00% 00.00% 00.00% 00.00% 00.00% 00.00%
Grade - 15
# 0 0 0 0 0 0 0 0 0 0 0 0 0 0 0 0 0
% 00.00% 00.00% 00.00% 00.00% 00.00% 00.00% 00.00% 00.00% 00.00% 00.00% 00.00% 00.00% 00.00% 00.00% 00.00% 00.00% 00.00%
All Other Wage Grades
# 7 6 1 0 0 6 1 0 0 0 0 0 0 0 0 0 0
% 100.00% 85.71% 14.29% 00.00% 00.00% 85.71% 14.29% 00.00% 00.00% 00.00% 00.00% 00.00% 00.00% 00.00% 00.00% 00.00% 00.00%
TOTAL # 806 743 63 70 2 397 34 238 19 15 5 4 1 17 1 2 1
% 100.00% 92.19% 07.81% 08.68% 00.25% 49.26% 04.22% 29.53% 02.36% 01.86% 00.62% 00.50% 00.12% 02.11% 00.12% 00.25% 00.12%Data shown includes WG grades for full-time, part-time, and intermittent temporary employees in a pay status and excluding medical and Manila residents.Percentages are based on row totals

121
Table B5-1: PARTICIPATION RATES ACROSS WAGE GRADES - Temporary Workforce - by Disability - SEP - FY2014
All VA TOTAL Total by Disability Status Detail for Targeted Disabilities
[04,05]No
Disability
[01]Not
Identified
[06-98]ReportableDisability
TotalTargetedDisability
[16,17,18]Hearing
[21,23,25]Vision
[28,30,32-38]Missing
Extremities
[64-69]Partial
Paralysis
[71-79]CompleteParalysis
[82]Epilepsy
[90]Severe
IntellectualDisability
[91]PsychiatricDisability
[92]Dwarfism
Grade - 1 # 45 23 4 18 3 0 0 0 0 0 0 0 3 0
% 100.00% 51.11% 08.89% 40.00% 06.67% 00.00% 00.00% 00.00% 00.00% 00.00% 00.00% 00.00% 06.67% 00.00%
Grade - 2 # 278 64 18 196 76 3 4 0 5 0 1 1 61 1
% 100.00% 23.02% 06.47% 70.50% 27.34% 01.08% 01.44% 00.00% 01.80% 00.00% 00.36% 00.36% 21.94% 00.36%
Grade - 3 # 58 21 0 37 12 2 1 0 1 0 0 2 6 0
% 100.00% 36.21% 00.00% 63.79% 20.69% 03.45% 01.72% 00.00% 01.72% 00.00% 00.00% 03.45% 10.34% 00.00%
Grade - 4 # 38 19 1 18 4 0 1 0 0 1 1 0 1 0
% 100.00% 50.00% 02.63% 47.37% 10.53% 00.00% 02.63% 00.00% 00.00% 02.63% 02.63% 00.00% 02.63% 00.00%
Grade - 5 # 67 44 1 22 5 1 0 0 0 0 0 1 3 0
% 100.00% 65.67% 01.49% 32.84% 07.46% 01.49% 00.00% 00.00% 00.00% 00.00% 00.00% 01.49% 04.48% 00.00%
Grade - 6 # 82 34 5 43 8 0 0 0 0 0 0 0 8 0
% 100.00% 41.46% 06.10% 52.44% 09.76% 00.00% 00.00% 00.00% 00.00% 00.00% 00.00% 00.00% 09.76% 00.00%
Grade - 7 # 59 33 3 23 6 0 1 0 0 0 1 0 4 0
% 100.00% 55.93% 05.08% 38.98% 10.17% 00.00% 01.69% 00.00% 00.00% 00.00% 01.69% 00.00% 06.78% 00.00%
Grade - 8 # 12 9 1 2 1 0 0 0 0 0 0 0 1 0
% 100.00% 75.00% 08.33% 16.67% 08.33% 00.00% 00.00% 00.00% 00.00% 00.00% 00.00% 00.00% 08.33% 00.00%
Grade - 9 # 88 44 5 39 11 0 1 1 0 0 0 0 9 0
% 100.00% 50.00% 05.68% 44.32% 12.50% 00.00% 01.14% 01.14% 00.00% 00.00% 00.00% 00.00% 10.23% 00.00%
Grade - 10 # 67 54 2 11 1 0 0 0 0 0 0 0 1 0
% 100.00% 80.60% 02.99% 16.42% 01.49% 00.00% 00.00% 00.00% 00.00% 00.00% 00.00% 00.00% 01.49% 00.00%
Grade - 11 # 5 1 0 4 0 0 0 0 0 0 0 0 0 0
% 100.00% 20.00% 00.00% 80.00% 00.00% 00.00% 00.00% 00.00% 00.00% 00.00% 00.00% 00.00% 00.00% 00.00%
Grade - 12 # 0 0 0 0 0 0 0 0 0 0 0 0 0 0
% 00.00% 00.00% 00.00% 00.00% 00.00% 00.00% 00.00% 00.00% 00.00% 00.00% 00.00% 00.00% 00.00% 00.00%
Grade - 13 # 0 0 0 0 0 0 0 0 0 0 0 0 0 0
% 00.00% 00.00% 00.00% 00.00% 00.00% 00.00% 00.00% 00.00% 00.00% 00.00% 00.00% 00.00% 00.00% 00.00%
Grade - 14 # 0 0 0 0 0 0 0 0 0 0 0 0 0 0

122
Table B5-1: PARTICIPATION RATES ACROSS WAGE GRADES - Temporary Workforce - by Disability - SEP - FY2014
All VA TOTAL Total by Disability Status Detail for Targeted Disabilities
[04,05]No
Disability
[01]Not
Identified
[06-98]ReportableDisability
TotalTargetedDisability
[16,17,18]Hearing
[21,23,25]Vision
[28,30,32-38]Missing
Extremities
[64-69]Partial
Paralysis
[71-79]CompleteParalysis
[82]Epilepsy
[90]Severe
IntellectualDisability
[91]PsychiatricDisability
[92]Dwarfism
% 00.00% 00.00% 00.00% 00.00% 00.00% 00.00% 00.00% 00.00% 00.00% 00.00% 00.00% 00.00% 00.00% 00.00%
Grade - 15 # 0 0 0 0 0 0 0 0 0 0 0 0 0 0
% 00.00% 00.00% 00.00% 00.00% 00.00% 00.00% 00.00% 00.00% 00.00% 00.00% 00.00% 00.00% 00.00% 00.00%
All Other Wage Grades # 7 4 0 3 1 0 0 0 0 0 0 0 1 0
% 100.00% 57.14% 00.00% 42.86% 14.29% 00.00% 00.00% 00.00% 00.00% 00.00% 00.00% 00.00% 14.29% 00.00%
TOTAL # 806 350 40 416 128 6 8 1 6 1 3 4 98 1
% 100.00% 43.42% 04.96% 51.61% 15.88% 00.74% 00.99% 00.12% 00.74% 00.12% 00.37% 00.50% 12.16% 00.12%Data shown includes WG grades for full-time, part-time, and intermittent temporary employees in a pay status and excluding medical and Manila residents.Percentages are based on row totals

123
Table A5-2: PARTICIPATION RATES ACROSS WAGE GRADES - Permanent Workforce - by Race/Ethnicity and Sex - SEP - FY2014
All VA TOTAL
EMPLOYEES
RACE/ETHNICITY
Hispanic or Latino Non-Hispanic or Latino
White Black or African American
Asian Native Hawaiian or Other Pacific
Islander
American Indian or Alaska Native
Two or More Races/Undisclosed
All male female male female male female male female male female male female male female male female
Grade - 1
# 784 669 115 36 11 244 52 373 47 8 1 3 0 3 4 2 0
% 02.81% 02.81% 02.84% 02.05% 04.23% 02.12% 03.45% 03.89% 02.24% 01.69% 00.95% 03.61% 00.00% 00.97% 06.25% 03.57% 00.00%
Grade - 2
# 11,620 9,641 1,979 606 124 3,543 695 5,157 1,067 157 55 32 1 120 30 26 7
% 41.71% 40.50% 48.80% 34.53% 47.69% 30.73% 46.09% 53.73% 50.86% 33.26% 52.38% 38.55% 11.11% 38.83% 46.88% 46.43% 63.64%
Grade - 3
# 3,217 2,331 886 198 68 795 309 1,267 467 32 21 4 2 25 16 10 3
% 11.55% 09.79% 21.85% 11.28% 26.15% 06.89% 20.49% 13.20% 22.26% 06.78% 20.00% 04.82% 22.22% 08.09% 25.00% 17.86% 27.27%
Grade - 4
# 1,548 941 607 74 26 377 223 441 330 25 17 2 3 22 7 0 1
% 05.56% 03.95% 14.97% 04.22% 10.00% 03.27% 14.79% 04.59% 15.73% 05.30% 16.19% 02.41% 33.33% 07.12% 10.94% 00.00% 09.09%
Grade - 5
# 1,327 1,219 108 120 11 607 52 440 39 29 4 5 0 15 2 3 0
% 04.76% 05.12% 02.66% 06.84% 04.23% 05.26% 03.45% 04.58% 01.86% 06.14% 03.81% 06.02% 00.00% 04.85% 03.13% 05.36% 00.00%
Grade - 6
# 1,838 1,657 181 126 5 867 86 585 79 39 7 12 2 24 2 4 0
% 06.60% 06.96% 04.46% 07.18% 01.92% 07.52% 05.70% 06.10% 03.77% 08.26% 06.67% 14.46% 22.22% 07.77% 03.13% 07.14% 00.00%
Grade - 7
# 830 772 58 102 8 389 21 263 27 10 0 2 0 6 2 0 0
% 02.98% 03.24% 01.43% 05.81% 03.08% 03.37% 01.39% 02.74% 01.29% 02.12% 00.00% 02.41% 00.00% 01.94% 03.13% 00.00% 00.00%
Grade - 8
# 870 823 47 71 2 498 24 217 21 20 0 4 0 11 0 2 0
% 03.12% 03.46% 01.16% 04.05% 00.77% 04.32% 01.59% 02.26% 01.00% 04.24% 00.00% 04.82% 00.00% 03.56% 00.00% 03.57% 00.00%
Grade - 9
# 1,554 1,519 35 131 2 1,064 21 266 11 24 0 5 1 26 0 3 0
% 05.58% 06.38% 00.86% 07.46% 00.77% 09.23% 01.39% 02.77% 00.52% 05.08% 00.00% 06.02% 11.11% 08.41% 00.00% 05.36% 00.00%
Grade - 10
# 3,242 3,214 28 238 2 2,397 17 426 8 98 0 9 0 40 1 6 0
% 11.64% 13.50% 00.69% 13.56% 00.77% 20.79% 01.13% 04.44% 00.38% 20.76% 00.00% 10.84% 00.00% 12.94% 01.56% 10.71% 00.00%
Grade - 11
# 954 944 10 51 1 689 7 154 2 30 0 5 0 15 0 0 0
% 03.42% 03.97% 00.25% 02.91% 00.38% 05.98% 00.46% 01.60% 00.10% 06.36% 00.00% 06.02% 00.00% 04.85% 00.00% 00.00% 00.00%
Grade - 12
# 24 24 0 0 0 22 0 1 0 0 0 0 0 1 0 0 0
% 00.09% 00.10% 00.00% 00.00% 00.00% 00.19% 00.00% 00.01% 00.00% 00.00% 00.00% 00.00% 00.00% 00.32% 00.00% 00.00% 00.00%
Grade # 23 23 0 1 0 18 0 3 0 0 0 0 0 1 0 0 0
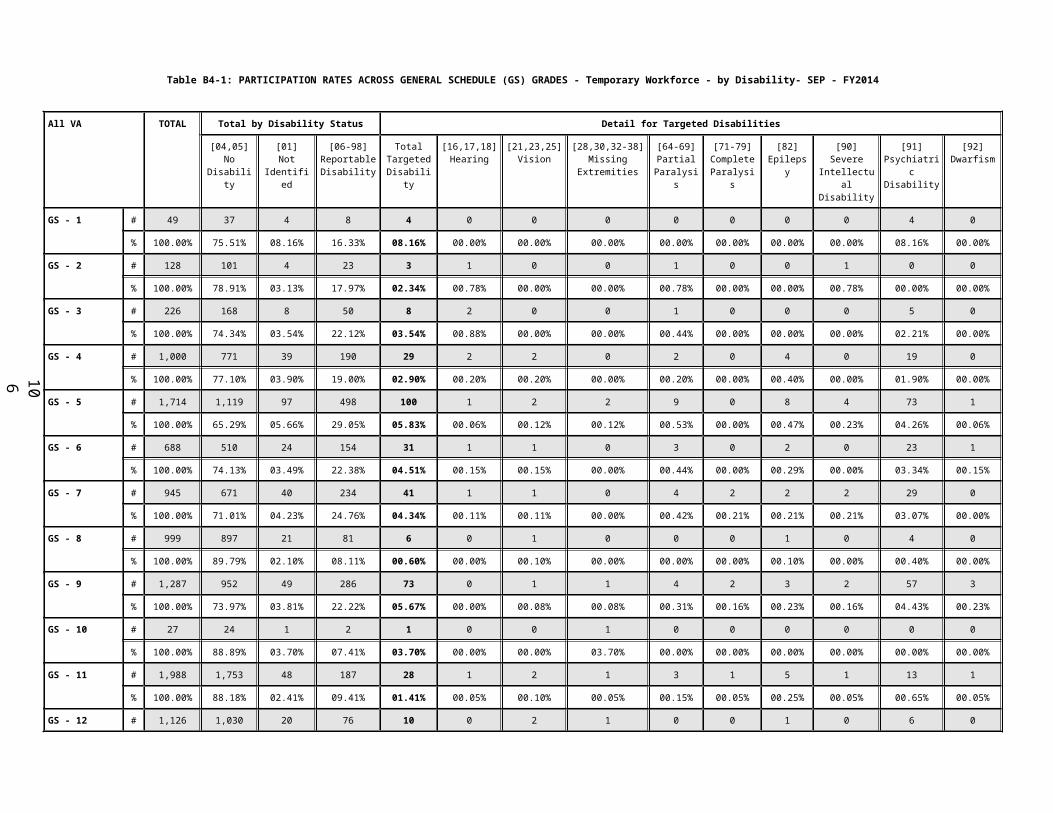
124
Table A5-2: PARTICIPATION RATES ACROSS WAGE GRADES - Permanent Workforce - by Race/Ethnicity and Sex - SEP - FY2014
All VA TOTAL
EMPLOYEES
RACE/ETHNICITY
Hispanic or Latino Non-Hispanic or Latino
White Black or African American
Asian Native Hawaiian or Other Pacific
Islander
American Indian or Alaska Native
Two or More Races/Undisclosed
All male female male female male female male female male female male female male female male female
- 13 % 00.08% 00.10% 00.00% 00.06% 00.00% 00.16% 00.00% 00.03% 00.00% 00.00% 00.00% 00.00% 00.00% 00.32% 00.00% 00.00% 00.00%
Grade - 14
# 17 16 1 1 0 12 1 3 0 0 0 0 0 0 0 0 0
% 00.06% 00.07% 00.02% 00.06% 00.00% 00.10% 00.07% 00.03% 00.00% 00.00% 00.00% 00.00% 00.00% 00.00% 00.00% 00.00% 00.00%
Grade - 15
# 9 9 0 0 0 8 0 1 0 0 0 0 0 0 0 0 0
% 00.03% 00.04% 00.00% 00.00% 00.00% 00.07% 00.00% 00.01% 00.00% 00.00% 00.00% 00.00% 00.00% 00.00% 00.00% 00.00% 00.00%
All Other Wage Grades
# 2 2 0 0 0 1 0 1 0 0 0 0 0 0 0 0 0
% 00.01% 00.01% 00.00% 00.00% 00.00% 00.01% 00.00% 00.01% 00.00% 00.00% 00.00% 00.00% 00.00% 00.00% 00.00% 00.00% 00.00%
TOTAL # 27,859 23,804 4,055 1,755 260 11,531 1,508 9,598 2,098 472 105 83 9 309 64 56 11
% 100.00% 100.00% 100.00% 100.00% 100.00% 100.00% 100.00% 100.00% 100.00% 100.00% 100.00% 100.00% 100.00% 100.00% 100.00% 100.00% 100.00%Data shown includes WG grades for full-time, part-time, and intermittent permanent employees in a pay status and excluding medical and Manila residents.Percentages are based on column totals

125
Table B5-2: PARTICIPATION RATES ACROSS WAGE GRADES - Permanent Workforce - by Disability - SEP - FY2014
All VA TOTAL Total by Disability Status Detail for Targeted Disabilities
[04,05]No
Disability
[01]Not
Identified
[06-98]ReportableDisability
TotalTargetedDisability
[16,17,18]Hearing
[21,23,25]Vision
[28,30,32-38]Missing
Extremities
[64-69]Partial
Paralysis
[71-79]CompleteParalysis
[82]Epilepsy
[90]Severe
IntellectualDisability
[91]PsychiatricDisability
[92]Dwarfism
Grade - 1 # 784 401 41 342 102 5 1 0 3 0 6 16 70 1
% 02.81% 02.05% 03.43% 04.83% 06.13% 04.13% 01.49% 00.00% 03.53% 00.00% 09.09% 09.88% 06.24% 10.00%
Grade - 2 # 11,620 7,313 541 3,766 1,042 72 42 11 48 6 39 108 712 4
% 41.71% 37.36% 45.20% 53.15% 62.62% 59.50% 62.69% 61.11% 56.47% 42.86% 59.09% 66.67% 63.51% 40.00%
Grade - 3 # 3,217 2,385 130 702 181 16 7 2 14 3 6 23 108 2
% 11.55% 12.18% 10.86% 09.91% 10.88% 13.22% 10.45% 11.11% 16.47% 21.43% 09.09% 14.20% 09.63% 20.00%
Grade - 4 # 1,548 1,196 50 302 64 12 3 1 4 1 2 6 35 0
% 05.56% 06.11% 04.18% 04.26% 03.85% 09.92% 04.48% 05.56% 04.71% 07.14% 03.03% 03.70% 03.12% 00.00%
Grade - 5 # 1,327 979 56 292 56 3 2 2 1 1 5 2 40 0
% 04.76% 05.00% 04.68% 04.12% 03.37% 02.48% 02.99% 11.11% 01.18% 07.14% 07.58% 01.23% 03.57% 00.00%
Grade - 6 # 1,838 1,407 69 362 49 2 3 0 2 0 2 2 37 1
% 06.60% 07.19% 05.76% 05.11% 02.94% 01.65% 04.48% 00.00% 02.35% 00.00% 03.03% 01.23% 03.30% 10.00%
Grade - 7 # 830 639 52 139 21 0 0 0 2 0 1 2 15 1
% 02.98% 03.26% 04.34% 01.96% 01.26% 00.00% 00.00% 00.00% 02.35% 00.00% 01.52% 01.23% 01.34% 10.00%
Grade - 8 # 870 654 47 169 27 1 2 0 2 0 0 0 22 0
% 03.12% 03.34% 03.93% 02.38% 01.62% 00.83% 02.99% 00.00% 02.35% 00.00% 00.00% 00.00% 01.96% 00.00%
Grade - 9 # 1,554 1,201 60 293 43 4 3 0 3 0 2 0 31 0
% 05.58% 06.14% 05.01% 04.13% 02.58% 03.31% 04.48% 00.00% 03.53% 00.00% 03.03% 00.00% 02.77% 00.00%
Grade - 10 # 3,242 2,582 117 543 64 5 3 2 3 3 2 3 43 0
% 11.64% 13.19% 09.77% 07.66% 03.85% 04.13% 04.48% 11.11% 03.53% 21.43% 03.03% 01.85% 03.84% 00.00%
Grade - 11 # 954 754 33 167 14 1 1 0 2 0 1 0 8 1
% 03.42% 03.85% 02.76% 02.36% 00.84% 00.83% 01.49% 00.00% 02.35% 00.00% 01.52% 00.00% 00.71% 10.00%
Grade - 12 # 24 19 0 5 1 0 0 0 1 0 0 0 0 0
% 00.09% 00.10% 00.00% 00.07% 00.06% 00.00% 00.00% 00.00% 01.18% 00.00% 00.00% 00.00% 00.00% 00.00%
Grade - 13 # 23 18 1 4 0 0 0 0 0 0 0 0 0 0
% 00.08% 00.09% 00.08% 00.06% 00.00% 00.00% 00.00% 00.00% 00.00% 00.00% 00.00% 00.00% 00.00% 00.00%
Grade - 14 # 17 17 0 0 0 0 0 0 0 0 0 0 0 0

126
Table B5-2: PARTICIPATION RATES ACROSS WAGE GRADES - Permanent Workforce - by Disability - SEP - FY2014
All VA TOTAL Total by Disability Status Detail for Targeted Disabilities
[04,05]No
Disability
[01]Not
Identified
[06-98]ReportableDisability
TotalTargetedDisability
[16,17,18]Hearing
[21,23,25]Vision
[28,30,32-38]Missing
Extremities
[64-69]Partial
Paralysis
[71-79]CompleteParalysis
[82]Epilepsy
[90]Severe
IntellectualDisability
[91]PsychiatricDisability
[92]Dwarfism
% 00.06% 00.09% 00.00% 00.00% 00.00% 00.00% 00.00% 00.00% 00.00% 00.00% 00.00% 00.00% 00.00% 00.00%
Grade - 15 # 9 9 0 0 0 0 0 0 0 0 0 0 0 0
% 00.03% 00.05% 00.00% 00.00% 00.00% 00.00% 00.00% 00.00% 00.00% 00.00% 00.00% 00.00% 00.00% 00.00%
All Other Wage Grades # 2 2 0 0 0 0 0 0 0 0 0 0 0 0
% 00.01% 00.01% 00.00% 00.00% 00.00% 00.00% 00.00% 00.00% 00.00% 00.00% 00.00% 00.00% 00.00% 00.00%
TOTAL # 27,859 19,576 1,197 7,086 1,664 121 67 18 85 14 66 162 1,121 10
% 100.00% 100.00% 100.00% 100.00% 100.00% 100.00% 100.00% 100.00% 100.00% 100.00% 100.00% 100.00% 100.00% 100.00%Data shown includes WG grades for full-time, part-time, and intermittent permanent employees in a pay status and excluding medical and Manila residents.Percentages are based on column totals

127
Table A5-2: PARTICIPATION RATES ACROSS WAGE GRADES - Temporary Workforce - by Race/Ethnicity and Sex - SEP - FY2014
All VA TOTAL
EMPLOYEES
RACE/ETHNICITY
Hispanic or Latino Non-Hispanic or Latino
White Black or African American
Asian Native Hawaiian or Other Pacific
Islander
American Indian or Alaska Native
Two or More Races/Undisclosed
All male female male female male female male female male female male female male female male female
Grade - 1
# 45 32 13 0 0 20 8 11 4 1 0 0 0 0 1 0 0
% 05.58% 04.31% 20.63% 00.00% 00.00% 05.04% 23.53% 04.62% 21.05% 06.67% 00.00% 00.00% 00.00% 00.00% 100.00% 00.00% 00.00%
Grade - 2
# 278 248 30 27 2 89 13 117 11 6 2 2 1 6 0 1 1
% 34.49% 33.38% 47.62% 38.57% 100.00% 22.42% 38.24% 49.16% 57.89% 40.00% 40.00% 50.00% 100.00% 35.29% 00.00% 50.00% 100.00%
Grade - 3
# 58 56 2 6 0 24 0 24 0 0 2 0 0 2 0 0 0
% 07.20% 07.54% 03.17% 08.57% 00.00% 06.05% 00.00% 10.08% 00.00% 00.00% 40.00% 00.00% 00.00% 11.76% 00.00% 00.00% 00.00%
Grade - 4
# 38 37 1 6 0 23 1 6 0 0 0 1 0 1 0 0 0
% 04.71% 04.98% 01.59% 08.57% 00.00% 05.79% 02.94% 02.52% 00.00% 00.00% 00.00% 25.00% 00.00% 05.88% 00.00% 00.00% 00.00%
Grade - 5
# 67 62 5 7 0 38 5 13 0 1 0 0 0 3 0 0 0
% 08.31% 08.34% 07.94% 10.00% 00.00% 09.57% 14.71% 05.46% 00.00% 06.67% 00.00% 00.00% 00.00% 17.65% 00.00% 00.00% 00.00%
Grade - 6
# 82 77 5 3 0 52 4 18 1 3 0 0 0 0 0 1 0
% 10.17% 10.36% 07.94% 04.29% 00.00% 13.10% 11.76% 07.56% 05.26% 20.00% 00.00% 00.00% 00.00% 00.00% 00.00% 50.00% 00.00%
Grade - 7
# 59 57 2 6 0 26 0 20 2 3 0 0 0 2 0 0 0
% 07.32% 07.67% 03.17% 08.57% 00.00% 06.55% 00.00% 08.40% 10.53% 20.00% 00.00% 00.00% 00.00% 11.76% 00.00% 00.00% 00.00%
Grade - 8
# 12 10 2 0 0 7 1 3 1 0 0 0 0 0 0 0 0
% 01.49% 01.35% 03.17% 00.00% 00.00% 01.76% 02.94% 01.26% 05.26% 00.00% 00.00% 00.00% 00.00% 00.00% 00.00% 00.00% 00.00%
Grade - 9
# 88 86 2 6 0 63 1 15 0 0 1 0 0 2 0 0 0
% 10.92% 11.57% 03.17% 08.57% 00.00% 15.87% 02.94% 06.30% 00.00% 00.00% 20.00% 00.00% 00.00% 11.76% 00.00% 00.00% 00.00%
Grade - 10
# 67 67 0 8 0 47 0 9 0 1 0 1 0 1 0 0 0
% 08.31% 09.02% 00.00% 11.43% 00.00% 11.84% 00.00% 03.78% 00.00% 06.67% 00.00% 25.00% 00.00% 05.88% 00.00% 00.00% 00.00%
Grade - 11
# 5 5 0 1 0 2 0 2 0 0 0 0 0 0 0 0 0
% 00.62% 00.67% 00.00% 01.43% 00.00% 00.50% 00.00% 00.84% 00.00% 00.00% 00.00% 00.00% 00.00% 00.00% 00.00% 00.00% 00.00%
Grade - 12
# 0 0 0 0 0 0 0 0 0 0 0 0 0 0 0 0 0
% 00.00% 00.00% 00.00% 00.00% 00.00% 00.00% 00.00% 00.00% 00.00% 00.00% 00.00% 00.00% 00.00% 00.00% 00.00% 00.00% 00.00%
Grade # 0 0 0 0 0 0 0 0 0 0 0 0 0 0 0 0 0

128
Table A5-2: PARTICIPATION RATES ACROSS WAGE GRADES - Temporary Workforce - by Race/Ethnicity and Sex - SEP - FY2014
All VA TOTAL
EMPLOYEES
RACE/ETHNICITY
Hispanic or Latino Non-Hispanic or Latino
White Black or African American
Asian Native Hawaiian or Other Pacific
Islander
American Indian or Alaska Native
Two or More Races/Undisclosed
All male female male female male female male female male female male female male female male female
- 13 % 00.00% 00.00% 00.00% 00.00% 00.00% 00.00% 00.00% 00.00% 00.00% 00.00% 00.00% 00.00% 00.00% 00.00% 00.00% 00.00% 00.00%
Grade - 14
# 0 0 0 0 0 0 0 0 0 0 0 0 0 0 0 0 0
% 00.00% 00.00% 00.00% 00.00% 00.00% 00.00% 00.00% 00.00% 00.00% 00.00% 00.00% 00.00% 00.00% 00.00% 00.00% 00.00% 00.00%
Grade - 15
# 0 0 0 0 0 0 0 0 0 0 0 0 0 0 0 0 0
% 00.00% 00.00% 00.00% 00.00% 00.00% 00.00% 00.00% 00.00% 00.00% 00.00% 00.00% 00.00% 00.00% 00.00% 00.00% 00.00% 00.00%
All Other Wage Grades
# 7 6 1 0 0 6 1 0 0 0 0 0 0 0 0 0 0
% 00.87% 00.81% 01.59% 00.00% 00.00% 01.51% 02.94% 00.00% 00.00% 00.00% 00.00% 00.00% 00.00% 00.00% 00.00% 00.00% 00.00%
TOTAL # 806 743 63 70 2 397 34 238 19 15 5 4 1 17 1 2 1
% 100.00% 100.00% 100.00% 100.00% 100.00% 100.00% 100.00% 100.00% 100.00% 100.00% 100.00% 100.00% 100.00% 100.00% 100.00% 100.00% 100.00%Data shown includes WG grades for full-time, part-time, and intermittent temporary employees in a pay status and excluding medical and Manila residents.Percentages are based on column totals
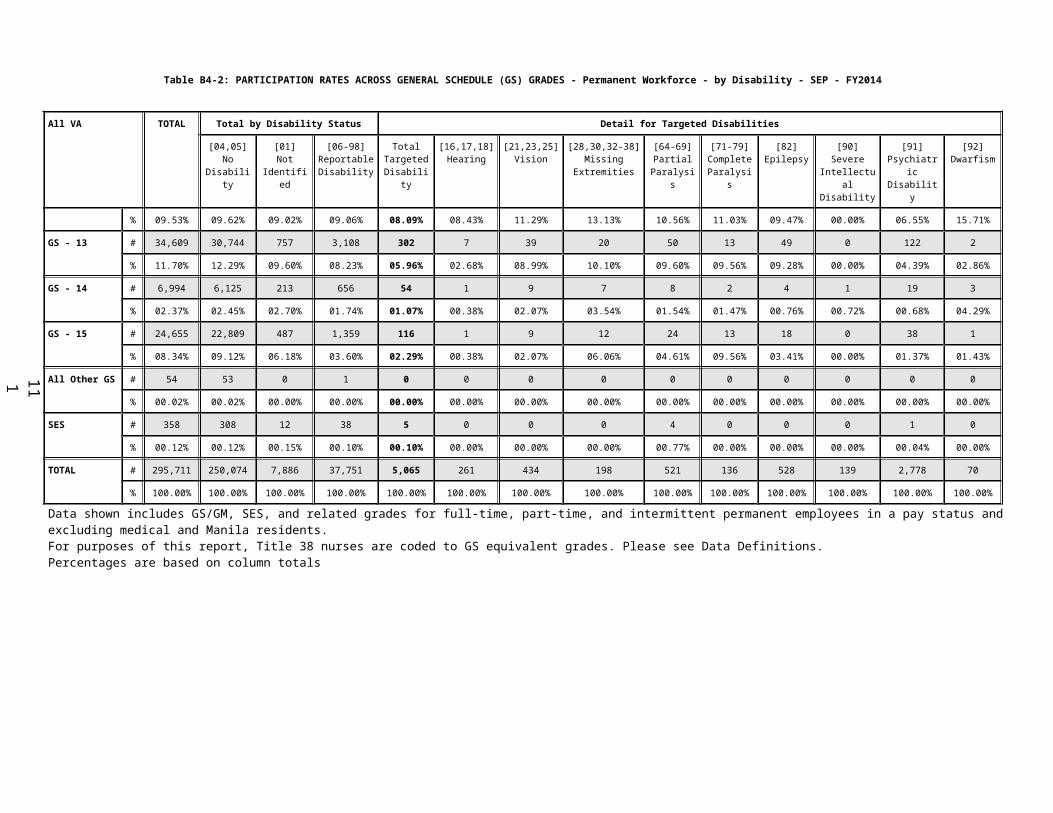
129
Table B5-2: PARTICIPATION RATES ACROSS WAGE GRADES - Temporary Workforce - by Disability - SEP - FY2014
All VA TOTAL Total by Disability Status Detail for Targeted Disabilities
[04,05]No
Disability
[01]Not
Identified
[06-98]ReportableDisability
TotalTargetedDisability
[16,17,18]Hearing
[21,23,25]Vision
[28,30,32-38]Missing
Extremities
[64-69]Partial
Paralysis
[71-79]CompleteParalysis
[82]Epilepsy
[90]Severe
IntellectualDisability
[91]PsychiatricDisability
[92]Dwarfism
Grade - 1 # 45 23 4 18 3 0 0 0 0 0 0 0 3 0
% 05.58% 06.57% 10.00% 04.33% 02.34% 00.00% 00.00% 00.00% 00.00% 00.00% 00.00% 00.00% 03.06% 00.00%
Grade - 2 # 278 64 18 196 76 3 4 0 5 0 1 1 61 1
% 34.49% 18.29% 45.00% 47.12% 59.38% 50.00% 50.00% 00.00% 83.33% 00.00% 33.33% 25.00% 62.24% 100.00%
Grade - 3 # 58 21 0 37 12 2 1 0 1 0 0 2 6 0
% 07.20% 06.00% 00.00% 08.89% 09.38% 33.33% 12.50% 00.00% 16.67% 00.00% 00.00% 50.00% 06.12% 00.00%
Grade - 4 # 38 19 1 18 4 0 1 0 0 1 1 0 1 0
% 04.71% 05.43% 02.50% 04.33% 03.13% 00.00% 12.50% 00.00% 00.00% 100.00% 33.33% 00.00% 01.02% 00.00%
Grade - 5 # 67 44 1 22 5 1 0 0 0 0 0 1 3 0
% 08.31% 12.57% 02.50% 05.29% 03.91% 16.67% 00.00% 00.00% 00.00% 00.00% 00.00% 25.00% 03.06% 00.00%
Grade - 6 # 82 34 5 43 8 0 0 0 0 0 0 0 8 0
% 10.17% 09.71% 12.50% 10.34% 06.25% 00.00% 00.00% 00.00% 00.00% 00.00% 00.00% 00.00% 08.16% 00.00%
Grade - 7 # 59 33 3 23 6 0 1 0 0 0 1 0 4 0
% 07.32% 09.43% 07.50% 05.53% 04.69% 00.00% 12.50% 00.00% 00.00% 00.00% 33.33% 00.00% 04.08% 00.00%
Grade - 8 # 12 9 1 2 1 0 0 0 0 0 0 0 1 0
% 01.49% 02.57% 02.50% 00.48% 00.78% 00.00% 00.00% 00.00% 00.00% 00.00% 00.00% 00.00% 01.02% 00.00%
Grade - 9 # 88 44 5 39 11 0 1 1 0 0 0 0 9 0
% 10.92% 12.57% 12.50% 09.38% 08.59% 00.00% 12.50% 100.00% 00.00% 00.00% 00.00% 00.00% 09.18% 00.00%
Grade - 10 # 67 54 2 11 1 0 0 0 0 0 0 0 1 0
% 08.31% 15.43% 05.00% 02.64% 00.78% 00.00% 00.00% 00.00% 00.00% 00.00% 00.00% 00.00% 01.02% 00.00%
Grade - 11 # 5 1 0 4 0 0 0 0 0 0 0 0 0 0
% 00.62% 00.29% 00.00% 00.96% 00.00% 00.00% 00.00% 00.00% 00.00% 00.00% 00.00% 00.00% 00.00% 00.00%
Grade - 12 # 0 0 0 0 0 0 0 0 0 0 0 0 0 0
% 00.00% 00.00% 00.00% 00.00% 00.00% 00.00% 00.00% 00.00% 00.00% 00.00% 00.00% 00.00% 00.00% 00.00%
Grade - 13 # 0 0 0 0 0 0 0 0 0 0 0 0 0 0
% 00.00% 00.00% 00.00% 00.00% 00.00% 00.00% 00.00% 00.00% 00.00% 00.00% 00.00% 00.00% 00.00% 00.00%
Grade - 14 # 0 0 0 0 0 0 0 0 0 0 0 0 0 0

130
Table B5-2: PARTICIPATION RATES ACROSS WAGE GRADES - Temporary Workforce - by Disability - SEP - FY2014
All VA TOTAL Total by Disability Status Detail for Targeted Disabilities
[04,05]No
Disability
[01]Not
Identified
[06-98]ReportableDisability
TotalTargetedDisability
[16,17,18]Hearing
[21,23,25]Vision
[28,30,32-38]Missing
Extremities
[64-69]Partial
Paralysis
[71-79]CompleteParalysis
[82]Epilepsy
[90]Severe
IntellectualDisability
[91]PsychiatricDisability
[92]Dwarfism
% 00.00% 00.00% 00.00% 00.00% 00.00% 00.00% 00.00% 00.00% 00.00% 00.00% 00.00% 00.00% 00.00% 00.00%
Grade - 15 # 0 0 0 0 0 0 0 0 0 0 0 0 0 0
% 00.00% 00.00% 00.00% 00.00% 00.00% 00.00% 00.00% 00.00% 00.00% 00.00% 00.00% 00.00% 00.00% 00.00%
All Other Wage Grades # 7 4 0 3 1 0 0 0 0 0 0 0 1 0
% 00.87% 01.14% 00.00% 00.72% 00.78% 00.00% 00.00% 00.00% 00.00% 00.00% 00.00% 00.00% 01.02% 00.00%
TOTAL # 806 350 40 416 128 6 8 1 6 1 3 4 98 1
% 100.00% 100.00% 100.00% 100.00% 100.00% 100.00% 100.00% 100.00% 100.00% 100.00% 100.00% 100.00% 100.00% 100.00%Data shown includes WG grades for full-time, part-time, and intermittent temporary employees in a pay status and excluding medical and Manila residents.Percentages are based on column totals

131
Table A6: PARTICIPATION RATES FOR MAJOR OCCUPATIONS - Permanent Workforce - Distribution by Race/Ethnicity and Sex - SEP - FY2014
All VA TOTAL
EMPLOYEES
RACE/ETHNICITY
Hispanic or Latino
Non-Hispanic or Latino
White Black or African American
Asian Native Hawaiian or Other Pacific
Islander
American Indian or Alaska Native
Two or More Races/Undisclosed
All male female male female male female male female male female male female male female male female
0083 Police # 3,259 3,026 233 340 18 1,899 119 661 91 64 1 13 1 42 2 7 1
% 100.00% 92.84% 07.14% 10.43% 00.55% 58.27% 03.65% 20.28% 02.79% 01.96% 00.03% 00.40% 00.03% 01.29% 00.06% 00.21% 00.03%
0083 RCLF 100.01% 85.16% 14.85% 10.25% 02.21% 62.23% 08.53% 09.02% 03.56% 02.02% 00.26% 00.20% 00.02% 00.88% 00.14% 00.56% 00.13%
0101 Social Science
# 2,643 1,293 1,350 88 87 831 826 315 379 22 32 6 1 24 20 7 5
% 100.00% 48.92% 51.08% 03.33% 03.29% 31.44% 31.25% 11.92% 14.34% 00.83% 01.21% 00.23% 00.04% 00.91% 00.76% 00.26% 00.19%
0101 RCLF 100.00% 48.15% 51.85% 02.89% 03.64% 37.91% 39.61% 04.40% 04.51% 02.19% 03.09% 00.04% 00.02% 00.41% 00.69% 00.31% 00.29%
0201 Human Resources Management
# 3,484 1,138 2,346 100 190 703 1,278 288 747 25 71 2 10 12 35 8 15
% 100.00% 32.67% 67.33% 02.87% 05.45% 20.18% 36.68% 08.27% 21.44% 00.72% 02.04% 00.06% 00.29% 00.34% 01.00% 00.23% 00.43%
0201 RCLF 99.99% 40.58% 59.41% 04.76% 06.40% 29.64% 42.57% 03.36% 06.91% 02.31% 02.70% 00.04% 00.09% 00.26% 00.45% 00.21% 00.29%
0260 Equal Employment Opportunity
# 381 165 216 13 14 65 65 80 127 5 3 0 0 0 6 2 1
% 100.00% 43.30% 56.68% 03.41% 03.67% 17.06% 17.06% 21.00% 33.33% 01.31% 00.79% 00.00% 00.00% 00.00% 01.57% 00.52% 00.26%
0260 RCLF 99.99% 53.40% 46.59% 04.57% 04.59% 40.40% 31.74% 04.32% 06.89% 03.12% 02.42% 00.06% 00.12% 00.62% 00.51% 00.31% 00.32%
0301 Miscellaneous Administration and Program
# 7,119 2,768 4,351 202 266 1,673 2,446 755 1,400 97 143 9 13 24 59 8 24
% 100.00% 38.89% 61.13% 02.84% 03.74% 23.50% 34.36% 10.61% 19.67% 01.36% 02.01% 00.13% 00.18% 00.34% 00.83% 00.11% 00.34%
0301 RCLF 100.00% 37.56% 62.44% 03.68% 06.19% 26.33% 42.15% 03.59% 08.69% 03.36% 04.37% 00.02% 00.05% 00.32% 00.59% 00.26% 00.40%
0340 Program Management
# 812 389 423 20 17 293 285 54 99 12 14 1 2 9 5 0 1
% 100.00% 47.90% 52.09% 02.46% 02.09% 36.08% 35.10% 06.65% 12.19% 01.48% 01.72% 00.12% 00.25% 01.11% 00.62% 00.00% 00.12%
0340 RCLF 100.00% 37.56% 62.44% 03.68% 06.19% 26.33% 42.15% 03.59% 08.69% 03.36% 04.37% 00.02% 00.05% 00.32% 00.59% 00.26% 00.40%
0343 Management and Program Analysis
# 5,331 2,178 3,153 148 147 1,483 1,969 398 853 116 133 4 7 21 32 8 12
% 100.00% 40.87% 59.14% 02.78% 02.76% 27.82% 36.93% 07.47% 16.00% 02.18% 02.49% 00.08% 00.13% 00.39% 00.60% 00.15% 00.23%
0343 RCLF 100.00% 59.05% 40.95% 02.78% 02.23% 47.37% 31.11% 03.01% 03.64% 05.25% 03.36% 00.02% 00.04% 00.29% 00.30% 00.33% 00.27%
0501 Financial Administration and Program
# 920 274 646 16 39 195 439 49 130 8 21 3 2 3 13 0 2
% 100.00% 29.80% 70.22% 01.74% 04.24% 21.20% 47.72% 05.33% 14.13% 00.87% 02.28% 00.33% 00.22% 00.33% 01.41% 00.00% 00.22%
0501 RCLF 100.00% 43.95% 56.05% 04.32% 06.24% 31.63% 37.25% 04.77% 07.69% 02.50% 03.82% 00.00% 00.06% 00.37% 00.79% 00.36% 00.20%

132
Table A6: PARTICIPATION RATES FOR MAJOR OCCUPATIONS - Permanent Workforce - Distribution by Race/Ethnicity and Sex - SEP - FY2014
All VA TOTAL
EMPLOYEES
RACE/ETHNICITY
Hispanic or Latino
Non-Hispanic or Latino
White Black or African American
Asian Native Hawaiian or Other Pacific
Islander
American Indian or Alaska Native
Two or More Races/Undisclosed
All male female male female male female male female male female male female male female male female
0511 Auditing # 210 94 116 8 10 68 63 12 30 4 11 0 0 1 2 1 0
% 100.00% 44.76% 55.24% 03.81% 04.76% 32.38% 30.00% 05.71% 14.29% 01.90% 05.24% 00.00% 00.00% 00.48% 00.95% 00.48% 00.00%
0511 RCLF 100.00% 40.01% 59.99% 02.43% 04.21% 30.65% 42.55% 02.63% 05.63% 03.90% 06.83% 00.03% 00.06% 00.18% 00.41% 00.19% 00.30%
0602 Medical Officer
# 21,582 13,802 7,780 763 485 9,470 4,416 563 549 2,772 2,164 21 11 193 140 20 15
% 100.00% 63.95% 36.05% 03.54% 02.25% 43.88% 20.46% 02.61% 02.54% 12.84% 10.03% 00.10% 00.05% 00.89% 00.65% 00.09% 00.07%
0602 RCLF 99.98% 67.55% 32.43% 03.92% 01.92% 48.84% 20.13% 02.67% 02.33% 11.46% 07.62% 00.02% 00.02% 00.21% 00.13% 00.43% 00.28%
0610 Nurse # 60,376 10,559 49,817 883 2,589 7,165 31,524 1,135 9,219 1,170 5,578 27 123 164 681 15 103
% 100.00% 17.48% 82.51% 01.46% 04.29% 11.87% 52.21% 01.88% 15.27% 01.94% 09.24% 00.04% 00.20% 00.27% 01.13% 00.02% 00.17%
0610 RCLF 100.00% 09.01% 90.99% 00.64% 03.99% 06.25% 69.84% 00.89% 08.98% 01.10% 07.05% 00.01% 00.07% 00.07% 00.64% 00.05% 00.42%
0620 Practical Nurse
# 14,170 2,552 11,618 298 718 1,444 6,537 532 3,513 207 587 12 34 46 198 13 31
% 100.00% 17.99% 81.99% 02.10% 05.07% 10.19% 46.13% 03.75% 24.79% 01.46% 04.14% 00.08% 00.24% 00.32% 01.40% 00.09% 00.22%
0620 RCLF 100.01% 07.40% 92.61% 00.82% 06.43% 03.94% 59.94% 01.85% 21.69% 00.66% 03.06% 00.02% 00.06% 00.06% 00.95% 00.05% 00.48%
0621 Nursing Assistant
# 10,826 2,869 7,957 269 499 1,012 2,616 1,352 4,192 174 470 18 22 34 129 10 29
% 100.00% 26.50% 73.49% 02.48% 04.61% 09.35% 24.16% 12.49% 38.72% 01.61% 04.34% 00.17% 00.20% 00.31% 01.19% 00.09% 00.27%
0621 RCLF 99.98% 12.03% 87.95% 01.49% 11.28% 05.59% 41.56% 03.70% 29.73% 00.94% 03.30% 00.03% 00.17% 00.16% 01.22% 00.12% 00.69%
0644 Medical Technologist
# 4,372 1,214 3,158 103 259 752 1,979 139 416 197 433 3 3 18 60 2 8
% 100.00% 27.78% 72.23% 02.36% 05.92% 17.20% 45.27% 03.18% 09.52% 04.51% 09.90% 00.07% 00.07% 00.41% 01.37% 00.05% 00.18%
0644 RCLF 99.98% 25.93% 74.05% 02.97% 05.75% 14.90% 48.08% 03.62% 10.64% 04.04% 08.45% 00.05% 00.09% 00.17% 00.56% 00.18% 00.48%
0647 Diagnostic Radiologic Technologist
# 3,588 1,670 1,918 169 100 1,047 1,436 289 275 131 73 5 3 25 28 4 3
% 100.00% 46.54% 53.44% 04.71% 02.79% 29.18% 40.02% 08.05% 07.66% 03.65% 02.03% 00.14% 00.08% 00.70% 00.78% 00.11% 00.08%
0647 RCLF 100.01% 28.19% 71.82% 03.92% 04.74% 18.26% 58.48% 03.08% 05.51% 02.51% 02.31% 00.06% 00.04% 00.20% 00.50% 00.16% 00.24%
0660 Pharmacist # 7,202 2,683 4,519 94 211 2,085 2,966 146 421 317 844 4 5 32 62 5 10
% 100.00% 37.26% 62.75% 01.31% 02.93% 28.95% 41.18% 02.03% 05.85% 04.40% 11.72% 00.06% 00.07% 00.44% 00.86% 00.07% 00.14%
0660 RCLF 100.00% 47.35% 52.65% 01.57% 02.12% 37.03% 36.26% 02.06% 03.68% 06.21% 10.16% 00.04% 00.03% 00.21% 00.20% 00.23% 00.20%
0675 Medical # 2,389 370 2,019 26 130 208 1,258 110 531 19 61 0 4 6 34 1 1
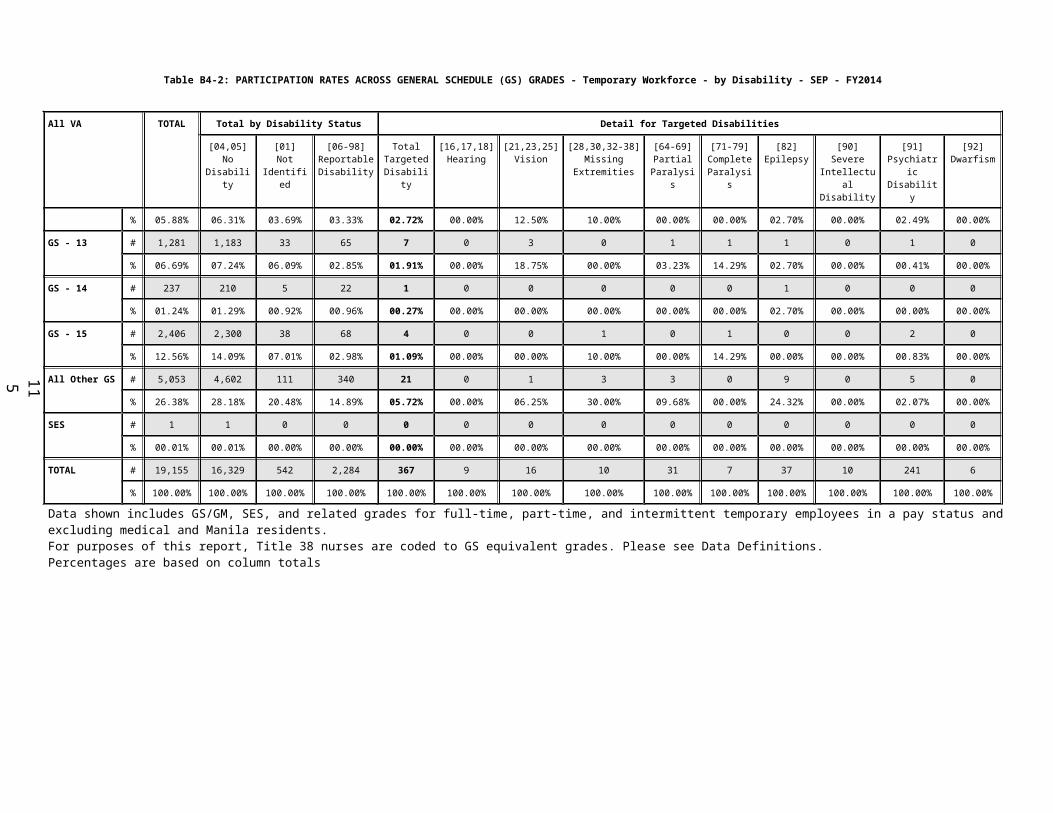
133
Table A6: PARTICIPATION RATES FOR MAJOR OCCUPATIONS - Permanent Workforce - Distribution by Race/Ethnicity and Sex - SEP - FY2014
All VA TOTAL
EMPLOYEES
RACE/ETHNICITY
Hispanic or Latino
Non-Hispanic or Latino
White Black or African American
Asian Native Hawaiian or Other Pacific
Islander
American Indian or Alaska Native
Two or More Races/Undisclosed
All male female male female male female male female male female male female male female male female
Records Technician
% 100.00% 15.49% 84.51% 01.09% 05.44% 08.71% 52.66% 04.60% 22.23% 00.80% 02.55% 00.00% 00.17% 00.25% 01.42% 00.04% 00.04%
0675 RCLF 100.01% 10.38% 89.63% 01.56% 11.23% 04.89% 57.03% 02.29% 15.39% 01.38% 03.84% 00.00% 00.15% 00.18% 01.70% 00.08% 00.29%
0905 General Attorney
# 1,004 445 559 9 11 373 414 38 100 19 30 0 0 5 4 1 0
% 100.00% 44.32% 55.69% 00.90% 01.10% 37.15% 41.24% 03.78% 09.96% 01.89% 02.99% 00.00% 00.00% 00.50% 00.40% 00.10% 00.00%
0905 RCLF 100.01% 66.58% 33.43% 02.65% 01.92% 59.21% 26.54% 02.15% 02.63% 02.02% 01.90% 00.02% 00.01% 00.31% 00.23% 00.22% 00.20%
0986 Legal Assistance
# 77 14 63 0 4 8 26 6 32 0 1 0 0 0 0 0 0
% 100.00% 18.18% 81.82% 00.00% 05.19% 10.39% 33.77% 07.79% 41.56% 00.00% 01.30% 00.00% 00.00% 00.00% 00.00% 00.00% 00.00%
0986 RCLF 99.99% 26.26% 73.73% 02.26% 07.77% 19.01% 54.65% 02.68% 07.48% 01.90% 02.43% 00.01% 00.09% 00.30% 00.87% 00.10% 00.44%
0996 Veterans Claims Examining
# 11,811 5,704 6,107 346 309 3,670 3,423 1,295 1,933 185 176 25 10 159 223 24 33
% 100.00% 48.29% 51.71% 02.93% 02.62% 31.07% 28.98% 10.96% 16.37% 01.57% 01.49% 00.21% 00.08% 01.35% 01.89% 00.20% 00.28%
0996 RCLF 100.01% 38.20% 61.81% 02.98% 05.68% 29.92% 41.18% 03.39% 11.69% 01.58% 02.46% 00.03% 00.08% 00.18% 00.42% 00.12% 00.30%
0998 Claims Assistance and Examining
# 2,105 1,009 1,096 79 57 535 532 338 449 31 35 5 1 15 15 6 7
% 100.00% 47.94% 52.06% 03.75% 02.71% 25.42% 25.27% 16.06% 21.33% 01.47% 01.66% 00.24% 00.05% 00.71% 00.71% 00.29% 00.33%
0998 RCLF 99.99% 25.01% 74.98% 03.16% 08.19% 16.55% 51.57% 03.28% 10.90% 01.48% 02.91% 00.07% 00.15% 00.31% 00.86% 00.16% 00.40%
1101 General Business and Industry
# 773 426 347 37 20 285 221 89 82 11 14 1 0 3 6 0 4
% 100.00% 55.11% 44.90% 04.79% 02.59% 36.87% 28.59% 11.51% 10.61% 01.42% 01.81% 00.13% 00.00% 00.39% 00.78% 00.00% 00.52%
1101 RCLF 100.00% 37.56% 62.44% 03.68% 06.19% 26.33% 42.15% 03.59% 08.69% 03.36% 04.37% 00.02% 00.05% 00.32% 00.59% 00.26% 00.40%
1165 Loan Specialist
# 473 225 248 11 13 147 150 57 76 4 7 2 1 2 1 2 0
% 100.00% 47.57% 52.43% 02.33% 02.75% 31.08% 31.71% 12.05% 16.07% 00.85% 01.48% 00.42% 00.21% 00.42% 00.21% 00.42% 00.00%
1165 RCLF 100.01% 46.67% 53.34% 04.78% 06.48% 35.28% 36.84% 03.73% 06.21% 02.34% 03.03% 00.08% 00.13% 00.21% 00.32% 00.25% 00.33%
1171 Appraising # 254 180 74 7 5 134 42 29 23 3 1 2 0 5 1 0 2
% 100.00% 70.88% 29.14% 02.76% 01.97% 52.76% 16.54% 11.42% 09.06% 01.18% 00.39% 00.79% 00.00% 01.97% 00.39% 00.00% 00.79%
1171 RCLF 99.99% 66.02% 33.97% 03.05% 02.00% 58.84% 28.48% 01.87% 01.86% 01.71% 01.04% 00.04% 00.02% 00.26% 00.49% 00.25% 00.08%
1630 Cemetery Administration
# 95 70 25 2 1 51 12 12 7 1 3 0 0 3 1 1 1
% 100.00% 73.68% 26.31% 02.11% 01.05% 53.68% 12.63% 12.63% 07.37% 01.05% 03.16% 00.00% 00.00% 03.16% 01.05% 01.05% 01.05%

134
Table A6: PARTICIPATION RATES FOR MAJOR OCCUPATIONS - Permanent Workforce - Distribution by Race/Ethnicity and Sex - SEP - FY2014
All VA TOTAL
EMPLOYEES
RACE/ETHNICITY
Hispanic or Latino
Non-Hispanic or Latino
White Black or African American
Asian Native Hawaiian or Other Pacific
Islander
American Indian or Alaska Native
Two or More Races/Undisclosed
All male female male female male female male female male female male female male female male female
1630 RCLF 100.00% 37.56% 62.44% 03.68% 06.19% 26.33% 42.15% 03.59% 08.69% 03.36% 04.37% 00.02% 00.05% 00.32% 00.59% 00.26% 00.40%
1811 Criminal Investigating
# 57 53 4 2 0 31 2 16 2 2 0 0 0 1 0 1 0
% 100.00% 92.98% 07.02% 03.51% 00.00% 54.39% 03.51% 28.07% 03.51% 03.51% 00.00% 00.00% 00.00% 01.75% 00.00% 01.75% 00.00%
1811 RCLF 100.01% 76.34% 23.67% 08.28% 03.03% 57.74% 15.29% 07.50% 04.34% 01.60% 00.53% 00.07% 00.03% 00.80% 00.29% 00.35% 00.16%
2210 Information Technology Management
# 6,605 5,030 1,575 387 87 3,398 1,016 842 349 301 100 8 4 73 12 21 7
% 100.00% 76.17% 23.84% 05.86% 01.32% 51.45% 15.38% 12.75% 05.28% 04.56% 01.51% 00.12% 00.06% 01.11% 00.18% 00.32% 00.11%
2210 RCLF 100.00% 70.62% 29.38% 05.78% 02.30% 50.58% 20.17% 06.69% 04.41% 06.52% 01.99% 00.12% 00.05% 00.51% 00.28% 00.42% 00.18%
4754 Cemetery Caretaking
# 582 566 16 71 4 372 11 93 0 7 0 7 1 14 0 2 0
% 100.00% 97.25% 02.75% 12.20% 00.69% 63.92% 01.89% 15.98% 00.00% 01.20% 00.00% 01.20% 00.17% 02.41% 00.00% 00.34% 00.00%
4754 RCLF 99.98% 93.55% 06.43% 38.27% 01.25% 44.19% 04.39% 08.27% 00.50% 01.19% 00.12% 00.16% 00.02% 00.97% 00.12% 00.50% 00.03%Data shown includes full-time, part-time, and intermittent permanent employees in a pay status and excluding medical and manila residents.This fixed list of major occupations was identified by the Administration EEO Office.RCLF comparisons are based on 2010 Census National data.For VHA, the methodology for computing RCLF has changed. The new methodology uses state level data for determining RCLF and is consistent with the methodology for VBA and NCA.

135
Table B6: PARTICIPATION RATES FOR MAJOR OCCUPATIONS - Permanent Workforce - Distribution by Disability - SEP - FY2014
All VA TOTAL Total by Disability Status Detail for Targeted Disabilities
[04,05]No
Disability
[01]Not
Identified
[06-98]ReportableDisability
TotalTargetedDisability
[16,17,18]Hearing
[21,23,25]Vision
[28,30,32-38]
MissingExtremities
[64-69]Partial
Paralysis
[71-79]CompleteParalysis
[82]Epilepsy
[90]Severe
IntellectualDisability
[91]PsychiatricDisability
[92]Dwarfism
0083 Police # 3,259 2,654 177 428 17 0 3 1 4 0 2 0 7 0
% 100.00% 81.44% 05.43% 13.13% 00.52% 00.00% 00.09% 00.03% 00.12% 00.00% 00.06% 00.00% 00.21% 00.00%
0101 Social Science # 2,643 1,854 117 672 104 2 14 4 15 12 5 1 51 0
% 100.00% 70.15% 04.43% 25.43% 03.93% 00.08% 00.53% 00.15% 00.57% 00.45% 00.19% 00.04% 01.93% 00.00%
0201 Human Resources Management
# 3,484 2,735 108 641 88 3 6 3 12 0 7 0 56 1
% 100.00% 78.50% 03.10% 18.40% 02.53% 00.09% 00.17% 00.09% 00.34% 00.00% 00.20% 00.00% 01.61% 00.03%
0260 Equal Employment Opportunity
# 381 250 24 107 23 0 1 0 6 1 2 0 13 0
% 100.00% 65.62% 06.30% 28.08% 06.04% 00.00% 00.26% 00.00% 01.57% 00.26% 00.52% 00.00% 03.41% 00.00%
0301 Miscellaneous Administration and Program
# 7,119 5,736 243 1,140 126 3 5 9 14 4 12 2 74 3
% 100.00% 80.57% 03.41% 16.01% 01.77% 00.04% 00.07% 00.13% 00.20% 00.06% 00.17% 00.03% 01.04% 00.04%
0340 Program Management
# 812 685 25 102 14 0 0 0 5 1 0 0 8 0
% 100.00% 84.36% 03.08% 12.56% 01.72% 00.00% 00.00% 00.00% 00.62% 00.12% 00.00% 00.00% 00.99% 00.00%
0343 Management and Program Analysis
# 5,331 4,461 170 700 83 2 11 4 15 3 7 3 38 0
% 100.00% 83.68% 03.19% 13.13% 01.56% 00.04% 00.21% 00.08% 00.28% 00.06% 00.13% 00.06% 00.71% 00.00%
0501 Financial Administration and Program
# 920 776 35 109 9 0 1 1 2 0 0 0 5 0
% 100.00% 84.35% 03.80% 11.85% 00.98% 00.00% 00.11% 00.11% 00.22% 00.00% 00.00% 00.00% 00.54% 00.00%
0511 Auditing # 210 164 9 37 4 1 0 0 0 0 1 0 2 0
% 100.00% 78.10% 04.29% 17.62% 01.90% 00.48% 00.00% 00.00% 00.00% 00.00% 00.48% 00.00% 00.95% 00.00%
0602 Medical Officer # 21,582 20,044 415 1,123 95 1 6 9 20 11 14 0 33 1
% 100.00% 92.87% 01.92% 05.20% 00.44% 00.00% 00.03% 00.04% 00.09% 00.05% 00.06% 00.00% 00.15% 00.00%
0610 Nurse # 60,376 55,023 1,052 4,301 332 6 34 7 25 2 59 2 191 6
% 100.00% 91.13% 01.74% 07.12% 00.55% 00.01% 00.06% 00.01% 00.04% 00.00% 00.10% 00.00% 00.32% 00.01%
0620 Practical Nurse # 14,170 12,647 243 1,280 127 4 16 0 7 2 36 1 59 2
% 100.00% 89.25% 01.71% 09.03% 00.90% 00.03% 00.11% 00.00% 00.05% 00.01% 00.25% 00.01% 00.42% 00.01%
0621 Nursing Assistant # 10,826 9,650 271 905 124 4 19 3 6 2 17 8 64 1
% 100.00% 89.14% 02.50% 08.36% 01.15% 00.04% 00.18% 00.03% 00.06% 00.02% 00.16% 00.07% 00.59% 00.01%

136
Table B6: PARTICIPATION RATES FOR MAJOR OCCUPATIONS - Permanent Workforce - Distribution by Disability - SEP - FY2014
All VA TOTAL Total by Disability Status Detail for Targeted Disabilities
[04,05]No
Disability
[01]Not
Identified
[06-98]ReportableDisability
TotalTargetedDisability
[16,17,18]Hearing
[21,23,25]Vision
[28,30,32-38]
MissingExtremities
[64-69]Partial
Paralysis
[71-79]CompleteParalysis
[82]Epilepsy
[90]Severe
IntellectualDisability
[91]PsychiatricDisability
[92]Dwarfism
0644 Medical Technologist # 4,372 3,975 76 321 37 3 0 4 6 1 6 0 17 0
% 100.00% 90.92% 01.74% 07.34% 00.85% 00.07% 00.00% 00.09% 00.14% 00.02% 00.14% 00.00% 00.39% 00.00%
0647 Diagnostic Radiologic Technologist
# 3,588 3,197 66 325 31 2 1 0 3 1 6 0 18 0
% 100.00% 89.10% 01.84% 09.06% 00.86% 00.06% 00.03% 00.00% 00.08% 00.03% 00.17% 00.00% 00.50% 00.00%
0660 Pharmacist # 7,202 6,803 86 313 33 3 1 2 5 0 7 0 15 0
% 100.00% 94.46% 01.19% 04.35% 00.46% 00.04% 00.01% 00.03% 00.07% 00.00% 00.10% 00.00% 00.21% 00.00%
0675 Medical Records Technician
# 2,389 1,973 48 368 52 5 5 4 3 1 5 2 27 0
% 100.00% 82.59% 02.01% 15.40% 02.18% 00.21% 00.21% 00.17% 00.13% 00.04% 00.21% 00.08% 01.13% 00.00%
0905 General Attorney # 1,004 912 32 60 4 0 0 1 1 0 0 0 1 1
% 100.00% 90.84% 03.19% 05.98% 00.40% 00.00% 00.00% 00.10% 00.10% 00.00% 00.00% 00.00% 00.10% 00.10%
0986 Legal Assistance # 77 62 3 12 1 0 0 0 0 0 0 1 0 0
% 100.00% 80.52% 03.90% 15.58% 01.30% 00.00% 00.00% 00.00% 00.00% 00.00% 00.00% 01.30% 00.00% 00.00%
0996 Veterans Claims Examining
# 11,811 9,007 529 2,275 233 8 9 14 33 6 19 1 139 4
% 100.00% 76.26% 04.48% 19.26% 01.97% 00.07% 00.08% 00.12% 00.28% 00.05% 00.16% 00.01% 01.18% 00.03%
0998 Claims Assistance and Examining
# 2,105 1,350 110 645 104 18 2 4 7 1 10 1 60 1
% 100.00% 64.13% 05.23% 30.64% 04.94% 00.86% 00.10% 00.19% 00.33% 00.05% 00.48% 00.05% 02.85% 00.05%
1101 General Business and Industry
# 773 654 30 89 10 0 0 0 1 0 2 0 7 0
% 100.00% 84.61% 03.88% 11.51% 01.29% 00.00% 00.00% 00.00% 00.13% 00.00% 00.26% 00.00% 00.91% 00.00%
1165 Loan Specialist # 473 384 15 74 9 1 1 0 0 1 2 0 4 0
% 100.00% 81.18% 03.17% 15.64% 01.90% 00.21% 00.21% 00.00% 00.00% 00.21% 00.42% 00.00% 00.85% 00.00%
1171 Appraising # 254 189 16 49 5 0 0 1 1 0 1 0 2 0
% 100.00% 74.41% 06.30% 19.29% 01.97% 00.00% 00.00% 00.39% 00.39% 00.00% 00.39% 00.00% 00.79% 00.00%
1630 Cemetery Administration
# 95 57 3 35 4 0 0 1 1 0 0 0 2 0
% 100.00% 60.00% 03.16% 36.84% 04.21% 00.00% 00.00% 01.05% 01.05% 00.00% 00.00% 00.00% 02.11% 00.00%
1811 Criminal Investigating
# 57 50 2 5 0 0 0 0 0 0 0 0 0 0
% 100.00% 87.72% 03.51% 08.77% 00.00% 00.00% 00.00% 00.00% 00.00% 00.00% 00.00% 00.00% 00.00% 00.00%
2210 Information # 6,605 5,180 266 1,159 124 12 11 4 15 5 19 2 54 2

137
Table B6: PARTICIPATION RATES FOR MAJOR OCCUPATIONS - Permanent Workforce - Distribution by Disability - SEP - FY2014
All VA TOTAL Total by Disability Status Detail for Targeted Disabilities
[04,05]No
Disability
[01]Not
Identified
[06-98]ReportableDisability
TotalTargetedDisability
[16,17,18]Hearing
[21,23,25]Vision
[28,30,32-38]
MissingExtremities
[64-69]Partial
Paralysis
[71-79]CompleteParalysis
[82]Epilepsy
[90]Severe
IntellectualDisability
[91]PsychiatricDisability
[92]Dwarfism
% 100.00% 78.43% 04.03% 17.55% 01.88% 00.18% 00.17% 00.06% 00.23% 00.08% 00.29% 00.03% 00.82% 00.03%
4754 Cemetery Caretaking # 582 363 33 186 33 2 1 0 2 1 1 0 26 0
% 100.00% 62.37% 05.67% 31.96% 05.67% 00.34% 00.17% 00.00% 00.34% 00.17% 00.17% 00.00% 04.47% 00.00%Data shown includes full-time, part-time, and intermittent permanent employees in a pay status and excluding medical and manila residents.This fixed list of major occupations was identified by the Administration EEO Office.

138
Table A6: PARTICIPATION RATES FOR MAJOR OCCUPATIONS - Temporary Workforce - Distribution by Race/Ethnicity and Sex - SEP - FY2014
All VA TOTAL
EMPLOYEES
RACE/ETHNICITY
Hispanic or Latino
Non-Hispanic or Latino
White Black or African American
Asian Native Hawaiian or Other Pacific
Islander
American Indian or Alaska Native
Two or More Races/Undisclosed
All male female male female male female male female male female male female male female male female
0083 Police # 16 14 2 0 0 7 0 6 2 0 0 0 0 1 0 0 0
% 100.00% 87.50% 12.50% 00.00% 00.00% 43.75% 00.00% 37.50% 12.50% 00.00% 00.00% 00.00% 00.00% 06.25% 00.00% 00.00% 00.00%
0083 RCLF 100.01% 85.16% 14.85% 10.25% 02.21% 62.23% 08.53% 09.02% 03.56% 02.02% 00.26% 00.20% 00.02% 00.88% 00.14% 00.56% 00.13%
0101 Social Science
# 95 38 57 1 0 25 40 10 11 1 4 0 1 1 1 0 0
% 100.00% 40.00% 60.00% 01.05% 00.00% 26.32% 42.11% 10.53% 11.58% 01.05% 04.21% 00.00% 01.05% 01.05% 01.05% 00.00% 00.00%
0101 RCLF 100.00% 48.15% 51.85% 02.89% 03.64% 37.91% 39.61% 04.40% 04.51% 02.19% 03.09% 00.04% 00.02% 00.41% 00.69% 00.31% 00.29%
0201 Human Resources Management
# 33 19 14 1 3 14 7 4 4 0 0 0 0 0 0 0 0
% 100.00% 57.57% 42.42% 03.03% 09.09% 42.42% 21.21% 12.12% 12.12% 00.00% 00.00% 00.00% 00.00% 00.00% 00.00% 00.00% 00.00%
0201 RCLF 99.99% 40.58% 59.41% 04.76% 06.40% 29.64% 42.57% 03.36% 06.91% 02.31% 02.70% 00.04% 00.09% 00.26% 00.45% 00.21% 00.29%
0260 Equal Employment Opportunity
# 3 2 1 0 0 1 0 1 1 0 0 0 0 0 0 0 0
% 100.00% 66.66% 33.33% 00.00% 00.00% 33.33% 00.00% 33.33% 33.33% 00.00% 00.00% 00.00% 00.00% 00.00% 00.00% 00.00% 00.00%
0260 RCLF 99.99% 53.40% 46.59% 04.57% 04.59% 40.40% 31.74% 04.32% 06.89% 03.12% 02.42% 00.06% 00.12% 00.62% 00.51% 00.31% 00.32%
0301 Miscellaneous Administration and Program
# 272 98 174 6 7 65 109 14 43 9 8 2 1 1 2 1 4
% 100.00% 36.05% 63.97% 02.21% 02.57% 23.90% 40.07% 05.15% 15.81% 03.31% 02.94% 00.74% 00.37% 00.37% 00.74% 00.37% 01.47%
0301 RCLF 100.00% 37.56% 62.44% 03.68% 06.19% 26.33% 42.15% 03.59% 08.69% 03.36% 04.37% 00.02% 00.05% 00.32% 00.59% 00.26% 00.40%
0340 Program Management
# 61 23 38 1 1 17 26 2 7 1 2 1 0 1 2 0 0
% 100.00% 37.71% 62.30% 01.64% 01.64% 27.87% 42.62% 03.28% 11.48% 01.64% 03.28% 01.64% 00.00% 01.64% 03.28% 00.00% 00.00%
0340 RCLF 100.00% 37.56% 62.44% 03.68% 06.19% 26.33% 42.15% 03.59% 08.69% 03.36% 04.37% 00.02% 00.05% 00.32% 00.59% 00.26% 00.40%
0343 Management and Program Analysis
# 147 77 70 5 2 56 48 9 14 6 4 0 1 1 0 0 1
% 100.00% 52.38% 47.61% 03.40% 01.36% 38.10% 32.65% 06.12% 09.52% 04.08% 02.72% 00.00% 00.68% 00.68% 00.00% 00.00% 00.68%
0343 RCLF 100.00% 59.05% 40.95% 02.78% 02.23% 47.37% 31.11% 03.01% 03.64% 05.25% 03.36% 00.02% 00.04% 00.29% 00.30% 00.33% 00.27%
0501 Financial Administration and Program
# 7 5 2 0 1 3 0 1 1 0 0 0 0 1 0 0 0
% 100.00% 71.44% 28.58% 00.00% 14.29% 42.86% 00.00% 14.29% 14.29% 00.00% 00.00% 00.00% 00.00% 14.29% 00.00% 00.00% 00.00%
0501 RCLF 100.00% 43.95% 56.05% 04.32% 06.24% 31.63% 37.25% 04.77% 07.69% 02.50% 03.82% 00.00% 00.06% 00.37% 00.79% 00.36% 00.20%

139
Table A6: PARTICIPATION RATES FOR MAJOR OCCUPATIONS - Temporary Workforce - Distribution by Race/Ethnicity and Sex - SEP - FY2014
All VA TOTAL
EMPLOYEES
RACE/ETHNICITY
Hispanic or Latino
Non-Hispanic or Latino
White Black or African American
Asian Native Hawaiian or Other Pacific
Islander
American Indian or Alaska Native
Two or More Races/Undisclosed
All male female male female male female male female male female male female male female male female
0511 Auditing # 0 0 0 0 0 0 0 0 0 0 0 0 0 0 0 0 0
% 00.00% 00.00% 00.00% 00.00% 00.00% 00.00% 00.00% 00.00% 00.00% 00.00% 00.00% 00.00% 00.00% 00.00% 00.00% 00.00% 00.00%
0511 RCLF 00.00% 00.00% 00.00% 00.00% 00.00% 00.00% 00.00% 00.00% 00.00% 00.00% 00.00% 00.00% 00.00% 00.00% 00.00% 00.00% 00.00%
0602 Medical Officer
# 2,347 1,476 871 77 16 852 468 43 51 471 312 3 2 28 20 2 2
% 100.00% 62.89% 37.11% 03.28% 00.68% 36.30% 19.94% 01.83% 02.17% 20.07% 13.29% 00.13% 00.09% 01.19% 00.85% 00.09% 00.09%
0602 RCLF 99.98% 67.55% 32.43% 03.92% 01.92% 48.84% 20.13% 02.67% 02.33% 11.46% 07.62% 00.02% 00.02% 00.21% 00.13% 00.43% 00.28%
0610 Nurse # 1,770 295 1,475 14 53 178 907 47 297 43 185 0 1 12 26 1 6
% 100.00% 16.68% 83.33% 00.79% 02.99% 10.06% 51.24% 02.66% 16.78% 02.43% 10.45% 00.00% 00.06% 00.68% 01.47% 00.06% 00.34%
0610 RCLF 100.00% 09.01% 90.99% 00.64% 03.99% 06.25% 69.84% 00.89% 08.98% 01.10% 07.05% 00.01% 00.07% 00.07% 00.64% 00.05% 00.42%
0620 Practical Nurse
# 258 41 217 1 10 22 109 9 73 8 16 0 2 0 7 1 0
% 100.00% 15.90% 84.11% 00.39% 03.88% 08.53% 42.25% 03.49% 28.29% 03.10% 06.20% 00.00% 00.78% 00.00% 02.71% 00.39% 00.00%
0620 RCLF 100.01% 07.40% 92.61% 00.82% 06.43% 03.94% 59.94% 01.85% 21.69% 00.66% 03.06% 00.02% 00.06% 00.06% 00.95% 00.05% 00.48%
0621 Nursing Assistant
# 527 103 424 12 28 46 184 38 181 5 16 0 0 0 10 2 5
% 100.00% 19.55% 80.46% 02.28% 05.31% 08.73% 34.91% 07.21% 34.35% 00.95% 03.04% 00.00% 00.00% 00.00% 01.90% 00.38% 00.95%
0621 RCLF 99.98% 12.03% 87.95% 01.49% 11.28% 05.59% 41.56% 03.70% 29.73% 00.94% 03.30% 00.03% 00.17% 00.16% 01.22% 00.12% 00.69%
0644 Medical Technologist
# 87 28 59 1 5 19 38 2 9 3 6 2 0 1 1 0 0
% 100.00% 32.19% 67.82% 01.15% 05.75% 21.84% 43.68% 02.30% 10.34% 03.45% 06.90% 02.30% 00.00% 01.15% 01.15% 00.00% 00.00%
0644 RCLF 99.98% 25.93% 74.05% 02.97% 05.75% 14.90% 48.08% 03.62% 10.64% 04.04% 08.45% 00.05% 00.09% 00.17% 00.56% 00.18% 00.48%
0647 Diagnostic Radiologic Technologist
# 96 45 51 1 2 33 38 8 5 3 4 0 1 0 1 0 0
% 100.00% 46.88% 53.12% 01.04% 02.08% 34.38% 39.58% 08.33% 05.21% 03.13% 04.17% 00.00% 01.04% 00.00% 01.04% 00.00% 00.00%
0647 RCLF 100.01% 28.19% 71.82% 03.92% 04.74% 18.26% 58.48% 03.08% 05.51% 02.51% 02.31% 00.06% 00.04% 00.20% 00.50% 00.16% 00.24%
0660 Pharmacist
# 988 253 735 7 23 183 514 7 48 48 140 1 1 7 9 0 0
% 100.00% 25.61% 74.39% 00.71% 02.33% 18.52% 52.02% 00.71% 04.86% 04.86% 14.17% 00.10% 00.10% 00.71% 00.91% 00.00% 00.00%
0660 RCLF 100.00% 47.35% 52.65% 01.57% 02.12% 37.03% 36.26% 02.06% 03.68% 06.21% 10.16% 00.04% 00.03% 00.21% 00.20% 00.23% 00.20%
0675 Medical # 53 9 44 0 2 4 24 3 18 2 0 0 0 0 0 0 0

140
Table A6: PARTICIPATION RATES FOR MAJOR OCCUPATIONS - Temporary Workforce - Distribution by Race/Ethnicity and Sex - SEP - FY2014
All VA TOTAL
EMPLOYEES
RACE/ETHNICITY
Hispanic or Latino
Non-Hispanic or Latino
White Black or African American
Asian Native Hawaiian or Other Pacific
Islander
American Indian or Alaska Native
Two or More Races/Undisclosed
All male female male female male female male female male female male female male female male female
Records Technician
% 100.00% 16.98% 83.01% 00.00% 03.77% 07.55% 45.28% 05.66% 33.96% 03.77% 00.00% 00.00% 00.00% 00.00% 00.00% 00.00% 00.00%
0675 RCLF 100.01% 10.38% 89.63% 01.56% 11.23% 04.89% 57.03% 02.29% 15.39% 01.38% 03.84% 00.00% 00.15% 00.18% 01.70% 00.08% 00.29%
0905 General Attorney
# 14 5 9 0 0 5 8 0 1 0 0 0 0 0 0 0 0
% 100.00% 35.71% 64.28% 00.00% 00.00% 35.71% 57.14% 00.00% 07.14% 00.00% 00.00% 00.00% 00.00% 00.00% 00.00% 00.00% 00.00%
0905 RCLF 100.01% 66.58% 33.43% 02.65% 01.92% 59.21% 26.54% 02.15% 02.63% 02.02% 01.90% 00.02% 00.01% 00.31% 00.23% 00.22% 00.20%
0986 Legal Assistance
# 1 1 0 0 0 1 0 0 0 0 0 0 0 0 0 0 0
% 100.00% 100.00% 00.00% 00.00% 00.00% 100.00% 00.00% 00.00% 00.00% 00.00% 00.00% 00.00% 00.00% 00.00% 00.00% 00.00% 00.00%
0986 RCLF 99.99% 26.26% 73.73% 02.26% 07.77% 19.01% 54.65% 02.68% 07.48% 01.90% 02.43% 00.01% 00.09% 00.30% 00.87% 00.10% 00.44%
0996 Veterans Claims Examining
# 172 75 97 6 4 32 32 29 55 4 1 0 0 3 4 1 1
% 100.00% 43.60% 56.40% 03.49% 02.33% 18.60% 18.60% 16.86% 31.98% 02.33% 00.58% 00.00% 00.00% 01.74% 02.33% 00.58% 00.58%
0996 RCLF 100.01% 38.20% 61.81% 02.98% 05.68% 29.92% 41.18% 03.39% 11.69% 01.58% 02.46% 00.03% 00.08% 00.18% 00.42% 00.12% 00.30%
0998 Claims Assistance and Examining
# 98 40 58 1 0 14 17 24 39 0 0 0 0 1 2 0 0
% 100.00% 40.82% 59.19% 01.02% 00.00% 14.29% 17.35% 24.49% 39.80% 00.00% 00.00% 00.00% 00.00% 01.02% 02.04% 00.00% 00.00%
0998 RCLF 99.99% 25.01% 74.98% 03.16% 08.19% 16.55% 51.57% 03.28% 10.90% 01.48% 02.91% 00.07% 00.15% 00.31% 00.86% 00.16% 00.40%
1101 General Business and Industry
# 13 6 7 0 0 2 2 3 5 1 0 0 0 0 0 0 0
% 100.00% 46.15% 53.84% 00.00% 00.00% 15.38% 15.38% 23.08% 38.46% 07.69% 00.00% 00.00% 00.00% 00.00% 00.00% 00.00% 00.00%
1101 RCLF 100.00% 37.56% 62.44% 03.68% 06.19% 26.33% 42.15% 03.59% 08.69% 03.36% 04.37% 00.02% 00.05% 00.32% 00.59% 00.26% 00.40%
1165 Loan Specialist
# 0 0 0 0 0 0 0 0 0 0 0 0 0 0 0 0 0
% 00.00% 00.00% 00.00% 00.00% 00.00% 00.00% 00.00% 00.00% 00.00% 00.00% 00.00% 00.00% 00.00% 00.00% 00.00% 00.00% 00.00%
1165 RCLF 00.00% 00.00% 00.00% 00.00% 00.00% 00.00% 00.00% 00.00% 00.00% 00.00% 00.00% 00.00% 00.00% 00.00% 00.00% 00.00% 00.00%
1171 Appraising # 0 0 0 0 0 0 0 0 0 0 0 0 0 0 0 0 0
% 00.00% 00.00% 00.00% 00.00% 00.00% 00.00% 00.00% 00.00% 00.00% 00.00% 00.00% 00.00% 00.00% 00.00% 00.00% 00.00% 00.00%
1171 RCLF 00.00% 00.00% 00.00% 00.00% 00.00% 00.00% 00.00% 00.00% 00.00% 00.00% 00.00% 00.00% 00.00% 00.00% 00.00% 00.00% 00.00%
1630 Cemetery Administration
# 0 0 0 0 0 0 0 0 0 0 0 0 0 0 0 0 0
% 00.00% 00.00% 00.00% 00.00% 00.00% 00.00% 00.00% 00.00% 00.00% 00.00% 00.00% 00.00% 00.00% 00.00% 00.00% 00.00% 00.00%

141
Table A6: PARTICIPATION RATES FOR MAJOR OCCUPATIONS - Temporary Workforce - Distribution by Race/Ethnicity and Sex - SEP - FY2014
All VA TOTAL
EMPLOYEES
RACE/ETHNICITY
Hispanic or Latino
Non-Hispanic or Latino
White Black or African American
Asian Native Hawaiian or Other Pacific
Islander
American Indian or Alaska Native
Two or More Races/Undisclosed
All male female male female male female male female male female male female male female male female
1630 RCLF 00.00% 00.00% 00.00% 00.00% 00.00% 00.00% 00.00% 00.00% 00.00% 00.00% 00.00% 00.00% 00.00% 00.00% 00.00% 00.00% 00.00%
1811 Criminal Investigating
# 1 1 0 0 0 1 0 0 0 0 0 0 0 0 0 0 0
% 100.00% 100.00% 00.00% 00.00% 00.00% 100.00% 00.00% 00.00% 00.00% 00.00% 00.00% 00.00% 00.00% 00.00% 00.00% 00.00% 00.00%
1811 RCLF 100.01% 76.34% 23.67% 08.28% 03.03% 57.74% 15.29% 07.50% 04.34% 01.60% 00.53% 00.07% 00.03% 00.80% 00.29% 00.35% 00.16%
2210 Information Technology Management
# 28 24 4 3 0 12 2 5 2 3 0 0 0 1 0 0 0
% 100.00% 85.71% 14.28% 10.71% 00.00% 42.86% 07.14% 17.86% 07.14% 10.71% 00.00% 00.00% 00.00% 03.57% 00.00% 00.00% 00.00%
2210 RCLF 100.00% 70.62% 29.38% 05.78% 02.30% 50.58% 20.17% 06.69% 04.41% 06.52% 01.99% 00.12% 00.05% 00.51% 00.28% 00.42% 00.18%
4754 Cemetery Caretaking
# 56 55 1 7 0 37 1 5 0 1 0 1 0 4 0 0 0
% 100.00% 98.22% 01.79% 12.50% 00.00% 66.07% 01.79% 08.93% 00.00% 01.79% 00.00% 01.79% 00.00% 07.14% 00.00% 00.00% 00.00%
4754 RCLF 99.98% 93.55% 06.43% 38.27% 01.25% 44.19% 04.39% 08.27% 00.50% 01.19% 00.12% 00.16% 00.02% 00.97% 00.12% 00.50% 00.03%Data shown includes full-time, part-time, and intermittent temporary employees in a pay status and excluding medical and manila residents.This fixed list of major occupations was identified by the Administration EEO Office.RCLF comparisons are based on 2010 Census National data.For VHA, the methodology for computing RCLF has changed. The new methodology uses state level data for determining RCLF and is consistent with the methodology for VBA and NCA.

142
Table B6: PARTICIPATION RATES FOR MAJOR OCCUPATIONS - Temporary Workforce - Distribution by Disability - SEP - FY2014
All VA TOTAL Total by Disability Status Detail for Targeted Disabilities
[04,05]No
Disability
[01]Not
Identified
[06-98]ReportableDisability
TotalTargetedDisability
[16,17,18]Hearing
[21,23,25]Vision
[28,30,32-38]
MissingExtremities
[64-69]Partial
Paralysis
[71-79]CompleteParalysis
[82]Epilepsy
[90]Severe
IntellectualDisability
[91]PsychiatricDisability
[92]Dwarfism
0083 Police # 16 5 0 11 0 0 0 0 0 0 0 0 0 0
% 100.00% 31.25% 00.00% 68.75% 00.00% 00.00% 00.00% 00.00% 00.00% 00.00% 00.00% 00.00% 00.00% 00.00%
0101 Social Science # 95 73 3 19 4 0 0 0 1 0 0 0 2 1
% 100.00% 76.84% 03.16% 20.00% 04.21% 00.00% 00.00% 00.00% 01.05% 00.00% 00.00% 00.00% 02.11% 01.05%
0201 Human Resources Management
# 33 22 2 9 3 0 0 0 0 0 1 0 2 0
% 100.00% 66.67% 06.06% 27.27% 09.09% 00.00% 00.00% 00.00% 00.00% 00.00% 03.03% 00.00% 06.06% 00.00%
0260 Equal Employment Opportunity
# 3 1 0 2 1 0 1 0 0 0 0 0 0 0
% 100.00% 33.33% 00.00% 66.67% 33.33% 00.00% 33.33% 00.00% 00.00% 00.00% 00.00% 00.00% 00.00% 00.00%
0301 Miscellaneous Administration and Program
# 272 201 11 60 8 0 1 0 1 1 1 0 3 1
% 100.00% 73.90% 04.04% 22.06% 02.94% 00.00% 00.37% 00.00% 00.37% 00.37% 00.37% 00.00% 01.10% 00.37%
0340 Program Management
# 61 48 2 11 1 0 0 0 0 1 0 0 0 0
% 100.00% 78.69% 03.28% 18.03% 01.64% 00.00% 00.00% 00.00% 00.00% 01.64% 00.00% 00.00% 00.00% 00.00%
0343 Management and Program Analysis
# 147 106 6 35 4 0 0 0 0 0 0 0 4 0
% 100.00% 72.11% 04.08% 23.81% 02.72% 00.00% 00.00% 00.00% 00.00% 00.00% 00.00% 00.00% 02.72% 00.00%
0501 Financial Administration and Program
# 7 2 2 3 0 0 0 0 0 0 0 0 0 0
% 100.00% 28.57% 28.57% 42.86% 00.00% 00.00% 00.00% 00.00% 00.00% 00.00% 00.00% 00.00% 00.00% 00.00%
0511 Auditing # 0 0 0 0 0 0 0 0 0 0 0 0 0 0
% 00.00% 00.00% 00.00% 00.00% 00.00% 00.00% 00.00% 00.00% 00.00% 00.00% 00.00% 00.00% 00.00% 00.00%
0602 Medical Officer # 2,347 2,253 36 58 4 0 0 1 0 1 0 0 2 0
% 100.00% 95.99% 01.53% 02.47% 00.17% 00.00% 00.00% 00.04% 00.00% 00.04% 00.00% 00.00% 00.09% 00.00%
0610 Nurse # 1,770 1,618 36 116 7 1 1 0 0 0 0 0 5 0
% 100.00% 91.41% 02.03% 06.55% 00.40% 00.06% 00.06% 00.00% 00.00% 00.00% 00.00% 00.00% 00.28% 00.00%
0620 Practical Nurse # 258 234 4 20 1 0 0 0 0 0 1 0 0 0
% 100.00% 90.70% 01.55% 07.75% 00.39% 00.00% 00.00% 00.00% 00.00% 00.00% 00.39% 00.00% 00.00% 00.00%
0621 Nursing Assistant # 527 459 14 54 3 0 1 0 0 0 0 0 2 0
% 100.00% 87.10% 02.66% 10.25% 00.57% 00.00% 00.19% 00.00% 00.00% 00.00% 00.00% 00.00% 00.38% 00.00%

143
Table B6: PARTICIPATION RATES FOR MAJOR OCCUPATIONS - Temporary Workforce - Distribution by Disability - SEP - FY2014
All VA TOTAL Total by Disability Status Detail for Targeted Disabilities
[04,05]No
Disability
[01]Not
Identified
[06-98]ReportableDisability
TotalTargetedDisability
[16,17,18]Hearing
[21,23,25]Vision
[28,30,32-38]
MissingExtremities
[64-69]Partial
Paralysis
[71-79]CompleteParalysis
[82]Epilepsy
[90]Severe
IntellectualDisability
[91]PsychiatricDisability
[92]Dwarfism
0644 Medical Technologist # 87 75 2 10 0 0 0 0 0 0 0 0 0 0
% 100.00% 86.21% 02.30% 11.49% 00.00% 00.00% 00.00% 00.00% 00.00% 00.00% 00.00% 00.00% 00.00% 00.00%
0647 Diagnostic Radiologic Technologist
# 96 84 1 11 2 0 0 0 0 0 2 0 0 0
% 100.00% 87.50% 01.04% 11.46% 02.08% 00.00% 00.00% 00.00% 00.00% 00.00% 02.08% 00.00% 00.00% 00.00%
0660 Pharmacist # 988 937 12 39 6 0 0 0 1 0 1 0 4 0
% 100.00% 94.84% 01.21% 03.95% 00.61% 00.00% 00.00% 00.00% 00.10% 00.00% 00.10% 00.00% 00.40% 00.00%
0675 Medical Records Technician
# 53 45 1 7 0 0 0 0 0 0 0 0 0 0
% 100.00% 84.91% 01.89% 13.21% 00.00% 00.00% 00.00% 00.00% 00.00% 00.00% 00.00% 00.00% 00.00% 00.00%
0905 General Attorney # 14 12 2 0 0 0 0 0 0 0 0 0 0 0
% 100.00% 85.71% 14.29% 00.00% 00.00% 00.00% 00.00% 00.00% 00.00% 00.00% 00.00% 00.00% 00.00% 00.00%
0986 Legal Assistance # 1 0 1 0 0 0 0 0 0 0 0 0 0 0
% 100.00% 00.00% 100.00% 00.00% 00.00% 00.00% 00.00% 00.00% 00.00% 00.00% 00.00% 00.00% 00.00% 00.00%
0996 Veterans Claims Examining
# 172 103 5 64 5 0 0 0 0 1 1 0 3 0
% 100.00% 59.88% 02.91% 37.21% 02.91% 00.00% 00.00% 00.00% 00.00% 00.58% 00.58% 00.00% 01.74% 00.00%
0998 Claims Assistance and Examining
# 98 39 9 50 2 0 0 0 1 0 0 0 1 0
% 100.00% 39.80% 09.18% 51.02% 02.04% 00.00% 00.00% 00.00% 01.02% 00.00% 00.00% 00.00% 01.02% 00.00%
1101 General Business and Industry
# 13 11 1 1 0 0 0 0 0 0 0 0 0 0
% 100.00% 84.62% 07.69% 07.69% 00.00% 00.00% 00.00% 00.00% 00.00% 00.00% 00.00% 00.00% 00.00% 00.00%
1165 Loan Specialist # 0 0 0 0 0 0 0 0 0 0 0 0 0 0
% 00.00% 00.00% 00.00% 00.00% 00.00% 00.00% 00.00% 00.00% 00.00% 00.00% 00.00% 00.00% 00.00% 00.00%
1171 Appraising # 0 0 0 0 0 0 0 0 0 0 0 0 0 0
% 00.00% 00.00% 00.00% 00.00% 00.00% 00.00% 00.00% 00.00% 00.00% 00.00% 00.00% 00.00% 00.00% 00.00%
1630 Cemetery Administration
# 0 0 0 0 0 0 0 0 0 0 0 0 0 0
% 00.00% 00.00% 00.00% 00.00% 00.00% 00.00% 00.00% 00.00% 00.00% 00.00% 00.00% 00.00% 00.00% 00.00%
1811 Criminal Investigating
# 1 0 0 1 0 0 0 0 0 0 0 0 0 0
% 100.00% 00.00% 00.00% 100.00% 00.00% 00.00% 00.00% 00.00% 00.00% 00.00% 00.00% 00.00% 00.00% 00.00%
2210 Information # 28 8 4 16 4 0 1 0 0 0 0 0 3 0

144
Table B6: PARTICIPATION RATES FOR MAJOR OCCUPATIONS - Temporary Workforce - Distribution by Disability - SEP - FY2014
All VA TOTAL Total by Disability Status Detail for Targeted Disabilities
[04,05]No
Disability
[01]Not
Identified
[06-98]ReportableDisability
TotalTargetedDisability
[16,17,18]Hearing
[21,23,25]Vision
[28,30,32-38]
MissingExtremities
[64-69]Partial
Paralysis
[71-79]CompleteParalysis
[82]Epilepsy
[90]Severe
IntellectualDisability
[91]PsychiatricDisability
[92]Dwarfism
% 100.00% 28.57% 14.29% 57.14% 14.29% 00.00% 03.57% 00.00% 00.00% 00.00% 00.00% 00.00% 10.71% 00.00%
4754 Cemetery Caretaking # 56 35 0 21 4 0 1 0 0 1 1 0 1 0
% 100.00% 62.50% 00.00% 37.50% 07.14% 00.00% 01.79% 00.00% 00.00% 01.79% 01.79% 00.00% 01.79% 00.00%Data shown includes full-time, part-time, and intermittent temporary employees in a pay status and excluding medical and manila residents.This fixed list of major occupations was identified by the Administration EEO Office.

145
Table A7: APPLICANT AND HIRES FOR MAJOR OCCUPATIONS - Permanent and Temporary Workforce - Distribution by Race/Ethnicity and Sex - SEP - FY2014
All VA TOTAL
EMPLOYEES
RACE/ETHNICITY
Hispanic or Latino
Non-Hispanic or Latino
White Black or African American
Asian Native Hawaiian or Other Pacific
Islander
American Indian or Alaska Native
Two or More Races/Undisclosed
All male female male female male female male female male female male female male female male female
0083 Police
Total Received
# 24,624 *** *** *** *** *** *** *** *** *** *** *** *** *** *** *** ***
Voluntarily Identified
# 10,703 9,992 711 2,566 173 4,905 278 1,837 226 359 13 26 0 100 5 199 16
% 100.00% 93.36% 6.64% 23.97% 1.62% 45.83% 2.60% 17.16% 2.11% 3.35% 0.12% 0.24% 0.00% 0.93% 0.05% 1.86% 0.15%
Qualified of those Identified
# 5,570 5,284 286 1,387 76 2,666 126 870 72 188 4 14 0 50 3 109 5
% 100.00% 94.87% 5.13% 24.90% 1.36% 47.86% 2.26% 15.62% 1.29% 3.38% 0.07% 0.25% 0.00% 0.90% 0.05% 1.96% 0.09%
Selected of those Identified
# 280 262 18 50 3 150 10 53 5 4 0 2 0 1 0 2 0
% 100.00% 93.57% 6.43% 17.86% 1.07% 53.57% 3.57% 18.93% 1.79% 1.43% 0.00% 0.71% 0.00% 0.36% 0.00% 0.71% 0.00%
0083 RCLF 100.01% 85.16% 14.85% 10.25% 2.21% 62.23% 8.53% 9.02% 3.56% 2.02% 0.26% 0.20% 0.02% 0.88% 0.14% 0.56% 0.13%
0101 Social Science
Total Received
# 13,146 *** *** *** *** *** *** *** *** *** *** *** *** *** *** *** ***
Voluntarily Identified
# 5,778 1,972 3,806 322 468 869 1,611 662 1,499 40 127 14 9 20 21 45 71
% 100.00% 34.13% 65.87% 5.57% 8.10% 15.04% 27.88% 11.46% 25.94% 0.69% 2.20% 0.24% 0.16% 0.35% 0.36% 0.78% 1.23%
Qualified of those Identified
# 2,464 835 1,629 136 152 411 724 261 685 10 37 0 1 2 4 15 26
% 100.00% 33.89% 66.11% 5.52% 6.17% 16.68% 29.38% 10.59% 27.80% 0.41% 1.50% 0.00% 0.04% 0.08% 0.16% 0.61% 1.06%
Selected of those Identified
# 83 38 45 3 4 25 24 10 14 0 1 0 0 0 1 0 1
% 100.00% 45.78% 54.22% 3.61% 4.82% 30.12% 28.92% 12.05% 16.87% 0.00% 1.20% 0.00% 0.00% 0.00% 1.20% 0.00% 1.20%
0101 RCLF 100.00% 48.15% 51.85% 2.89% 3.64% 37.91% 39.61% 4.40% 4.51% 2.19% 3.09% 0.04% 0.02% 0.41% 0.69% 0.31% 0.29%
0201 Human Resources Management
Total Received
# 39,392 *** *** *** *** *** *** *** *** *** *** *** *** *** *** *** ***
Voluntarily Identified
# 14,044 6,514 7,530 1,216 1,230 2,921 2,556 1,904 3,087 238 337 24 49 80 61 131 210
% 100.00% 46.38% 53.62% 8.66% 8.76% 20.80% 18.20% 13.56% 21.98% 1.69% 2.40% 0.17% 0.35% 0.57% 0.43% 0.93% 1.50%
Qualified of # 6,927 3,175 3,752 553 570 1,437 1,213 944 1,608 125 179 16 27 32 31 68 124

146
Table A7: APPLICANT AND HIRES FOR MAJOR OCCUPATIONS - Permanent and Temporary Workforce - Distribution by Race/Ethnicity and Sex - SEP - FY2014
All VA TOTAL
EMPLOYEES
RACE/ETHNICITY
Hispanic or Latino
Non-Hispanic or Latino
White Black or African American
Asian Native Hawaiian or Other Pacific
Islander
American Indian or Alaska Native
Two or More Races/Undisclosed
All male female male female male female male female male female male female male female male female
those Identified % 100.00% 45.84% 54.16% 7.98% 8.23% 20.74% 17.51% 13.63% 23.21% 1.80% 2.58% 0.23% 0.39% 0.46% 0.45% 0.98% 1.79%
Selected of those Identified
# 235 103 132 17 15 59 69 19 33 2 8 0 1 3 0 3 6
% 100.00% 43.83% 56.17% 7.23% 6.38% 25.11% 29.36% 8.09% 14.04% 0.85% 3.40% 0.00% 0.43% 1.28% 0.00% 1.28% 2.55%
0201 RCLF 99.99% 40.58% 59.41% 4.76% 6.40% 29.64% 42.57% 3.36% 6.91% 2.31% 2.70% 0.04% 0.09% 0.26% 0.45% 0.21% 0.29%
0260 Equal Employment Opportunity
Total Received
# 3,371 *** *** *** *** *** *** *** *** *** *** *** *** *** *** *** ***
Voluntarily Identified
# 1,609 814 795 200 136 243 148 316 453 19 28 5 1 12 6 19 23
% 100.00% 50.59% 49.41% 12.43% 8.45% 15.10% 9.20% 19.64% 28.15% 1.18% 1.74% 0.31% 0.06% 0.75% 0.37% 1.18% 1.43%
Qualified of those Identified
# 792 389 403 103 67 107 62 157 247 8 12 2 0 5 3 7 12
% 100.00% 49.12% 50.88% 13.01% 8.46% 13.51% 7.83% 19.82% 31.19% 1.01% 1.52% 0.25% 0.00% 0.63% 0.38% 0.88% 1.52%
Selected of those Identified
# 20 5 15 1 2 1 3 3 6 0 2 0 0 0 1 0 1
% 100.00% 25.00% 75.00% 5.00% 10.00% 5.00% 15.00% 15.00% 30.00% 0.00% 10.00% 0.00% 0.00% 0.00% 5.00% 0.00% 5.00%
0260 RCLF 99.99% 53.40% 46.59% 4.57% 4.59% 40.40% 31.74% 4.32% 6.89% 3.12% 2.42% 0.06% 0.12% 0.62% 0.51% 0.31% 0.32%
0301 Miscellaneous Administration and Program
Total Received
# 66,727 *** *** *** *** *** *** *** *** *** *** *** *** *** *** *** ***
Voluntarily Identified
# 26,974 12,973 14,001 2,747 2,224 5,154 4,088 4,027 6,569 611 586 60 52 118 87 256 395
% 100.00% 48.09% 51.91% 10.18% 8.24% 19.11% 15.16% 14.93% 24.35% 2.27% 2.17% 0.22% 0.19% 0.44% 0.32% 0.95% 1.46%
Qualified of those Identified
# 15,545 7,219 8,326 1,467 1,265 2,970 2,472 2,212 3,942 350 349 30 29 52 54 138 215
% 100.00% 46.44% 53.56% 9.44% 8.14% 19.11% 15.90% 14.23% 25.36% 2.25% 2.25% 0.19% 0.19% 0.33% 0.35% 0.89% 1.38%
Selected of those Identified
# 420 180 240 31 40 94 105 43 78 8 10 2 0 1 2 1 5
% 100.00% 42.86% 57.14% 7.38% 9.52% 22.38% 25.00% 10.24% 18.57% 1.90% 2.38% 0.48% 0.00% 0.24% 0.48% 0.24% 1.19%
0301 RCLF 100.00% 37.56% 62.44% 3.68% 6.19% 26.33% 42.15% 3.59% 8.69% 3.36% 4.37% 0.02% 0.05% 0.32% 0.59% 0.26% 0.40%
0340 Program Management

147
Table A7: APPLICANT AND HIRES FOR MAJOR OCCUPATIONS - Permanent and Temporary Workforce - Distribution by Race/Ethnicity and Sex - SEP - FY2014
All VA TOTAL
EMPLOYEES
RACE/ETHNICITY
Hispanic or Latino
Non-Hispanic or Latino
White Black or African American
Asian Native Hawaiian or Other Pacific
Islander
American Indian or Alaska Native
Two or More Races/Undisclosed
All male female male female male female male female male female male female male female male female
Total Received
# 5,178 *** *** *** *** *** *** *** *** *** *** *** *** *** *** *** ***
Voluntarily Identified
# 2,158 1,464 694 275 107 744 238 344 284 51 33 2 3 17 4 31 25
% 100.00% 67.84% 32.16% 12.74% 4.96% 34.48% 11.03% 15.94% 13.16% 2.36% 1.53% 0.09% 0.14% 0.79% 0.19% 1.44% 1.16%
Qualified of those Identified
# 1,174 783 391 146 61 409 133 175 158 23 21 2 2 12 1 16 15
% 100.00% 66.70% 33.30% 12.44% 5.20% 34.84% 11.33% 14.91% 13.46% 1.96% 1.79% 0.17% 0.17% 1.02% 0.09% 1.36% 1.28%
Selected of those Identified
# 25 16 9 3 1 10 3 3 5 0 0 0 0 0 0 0 0
% 100.00% 64.00% 36.00% 12.00% 4.00% 40.00% 12.00% 12.00% 20.00% 0.00% 0.00% 0.00% 0.00% 0.00% 0.00% 0.00% 0.00%
0340 RCLF 100.00% 37.56% 62.44% 3.68% 6.19% 26.33% 42.15% 3.59% 8.69% 3.36% 4.37% 0.02% 0.05% 0.32% 0.59% 0.26% 0.40%
0343 Management and Program Analysis
Total Received
# 55,771 *** *** *** *** *** *** *** *** *** *** *** *** *** *** *** ***
Voluntarily Identified
# 23,050 12,854 10,196 2,618 1,624 5,150 3,092 3,907 4,555 684 501 26 36 177 77 292 311
% 100.00% 55.77% 44.23% 11.36% 7.05% 22.34% 13.41% 16.95% 19.76% 2.97% 2.17% 0.11% 0.16% 0.77% 0.33% 1.27% 1.35%
Qualified of those Identified
# 12,480 6,687 5,793 1,311 855 2,753 1,798 1,973 2,601 412 298 10 20 83 43 145 178
% 100.00% 53.58% 46.42% 10.50% 6.85% 22.06% 14.41% 15.81% 20.84% 3.30% 2.39% 0.08% 0.16% 0.67% 0.34% 1.16% 1.43%
Selected of those Identified
# 312 140 172 36 12 64 98 26 50 11 11 0 0 2 0 1 1
% 100.00% 44.87% 55.13% 11.54% 3.85% 20.51% 31.41% 8.33% 16.03% 3.53% 3.53% 0.00% 0.00% 0.64% 0.00% 0.32% 0.32%
0343 RCLF 100.00% 59.05% 40.95% 2.78% 2.23% 47.37% 31.11% 3.01% 3.64% 5.25% 3.36% 0.02% 0.04% 0.29% 0.30% 0.33% 0.27%
0501 Financial Administration and Program
Total Received
# 6,493 *** *** *** *** *** *** *** *** *** *** *** *** *** *** *** ***
Voluntarily Identified
# 2,575 1,250 1,325 342 242 535 442 262 522 66 66 2 12 17 12 26 29
% 100.00% 48.54% 51.46% 13.28% 9.40% 20.78% 17.17% 10.17% 20.27% 2.56% 2.56% 0.08% 0.47% 0.66% 0.47% 1.01% 1.13%
Qualified of those Identified
# 1,177 494 683 116 106 212 237 106 274 42 33 0 7 7 9 11 17
% 100.00% 41.97% 58.03% 9.86% 9.01% 18.01% 20.14% 9.01% 23.28% 3.57% 2.80% 0.00% 0.59% 0.59% 0.76% 0.93% 1.44%

148
Table A7: APPLICANT AND HIRES FOR MAJOR OCCUPATIONS - Permanent and Temporary Workforce - Distribution by Race/Ethnicity and Sex - SEP - FY2014
All VA TOTAL
EMPLOYEES
RACE/ETHNICITY
Hispanic or Latino
Non-Hispanic or Latino
White Black or African American
Asian Native Hawaiian or Other Pacific
Islander
American Indian or Alaska Native
Two or More Races/Undisclosed
All male female male female male female male female male female male female male female male female
Selected of those Identified
# 56 22 34 4 5 12 16 4 7 2 0 0 0 0 2 0 4
% 100.00% 39.29% 60.71% 7.14% 8.93% 21.43% 28.57% 7.14% 12.50% 3.57% 0.00% 0.00% 0.00% 0.00% 3.57% 0.00% 7.14%
0501 RCLF 100.00% 43.95% 56.05% 4.32% 6.24% 31.63% 37.25% 4.77% 7.69% 2.50% 3.82% 0.00% 0.06% 0.37% 0.79% 0.36% 0.20%
0511 Auditing
Total Received
# 708 *** *** *** *** *** *** *** *** *** *** *** *** *** *** *** ***
Voluntarily Identified
# 155 90 65 23 4 41 21 16 30 8 7 0 1 0 1 2 1
% 100.00% 58.06% 41.94% 14.84% 2.58% 26.45% 13.55% 10.32% 19.35% 5.16% 4.52% 0.00% 0.65% 0.00% 0.65% 1.29% 0.65%
Qualified of those Identified
# 46 28 18 10 1 14 4 3 7 1 5 0 0 0 1 0 0
% 100.00% 60.87% 39.13% 21.74% 2.17% 30.43% 8.70% 6.52% 15.22% 2.17% 10.87% 0.00% 0.00% 0.00% 2.17% 0.00% 0.00%
Selected of those Identified
# 4 1 3 0 1 1 0 0 0 0 1 0 0 0 1 0 0
% 100.00% 25.00% 75.00% 0.00% 25.00% 25.00% 0.00% 0.00% 0.00% 0.00% 25.00% 0.00% 0.00% 0.00% 25.00% 0.00% 0.00%
0511 RCLF 100.00% 40.01% 59.99% 2.43% 4.21% 30.65% 42.55% 2.63% 5.63% 3.90% 6.83% 0.03% 0.06% 0.18% 0.41% 0.19% 0.30%
0602 Medical Officer
Total Received
# 12,268 *** *** *** *** *** *** *** *** *** *** *** *** *** *** *** ***
Voluntarily Identified
# 5,162 3,738 1,424 546 220 1,696 511 284 151 1,190 532 1 0 5 1 16 9
% 100.00% 72.41% 27.59% 10.58% 4.26% 32.86% 9.90% 5.50% 2.93% 23.05% 10.31% 0.02% 0.00% 0.10% 0.02% 0.31% 0.17%
Qualified of those Identified
# 4,019 2,920 1,099 419 163 1,381 407 207 122 899 400 1 0 1 1 12 6
% 100.00% 72.65% 27.35% 10.43% 4.06% 34.36% 10.13% 5.15% 3.04% 22.37% 9.95% 0.02% 0.00% 0.02% 0.02% 0.30% 0.15%
Selected of those Identified
# 259 160 99 13 11 97 48 11 7 37 32 0 0 0 0 2 1
% 100.00% 61.78% 38.22% 5.02% 4.25% 37.45% 18.53% 4.25% 2.70% 14.29% 12.36% 0.00% 0.00% 0.00% 0.00% 0.77% 0.39%
0602 RCLF 99.98% 67.55% 32.43% 3.92% 1.92% 48.84% 20.13% 2.67% 2.33% 11.46% 7.62% 0.02% 0.02% 0.21% 0.13% 0.43% 0.28%
0610 Nurse
Total Received
# 177,594 *** *** *** *** *** *** *** *** *** *** *** *** *** *** *** ***

149
Table A7: APPLICANT AND HIRES FOR MAJOR OCCUPATIONS - Permanent and Temporary Workforce - Distribution by Race/Ethnicity and Sex - SEP - FY2014
All VA TOTAL
EMPLOYEES
RACE/ETHNICITY
Hispanic or Latino
Non-Hispanic or Latino
White Black or African American
Asian Native Hawaiian or Other Pacific
Islander
American Indian or Alaska Native
Two or More Races/Undisclosed
All male female male female male female male female male female male female male female male female
Voluntarily Identified
# 72,768 14,734 58,034 2,514 6,251 7,790 31,512 2,000 12,518 2,099 6,423 56 125 152 318 123 887
% 100.00% 20.25% 79.75% 3.45% 8.59% 10.71% 43.30% 2.75% 17.20% 2.88% 8.83% 0.08% 0.17% 0.21% 0.44% 0.17% 1.22%
Qualified of those Identified
# 51,463 10,570 40,893 1,786 4,270 5,689 22,075 1,465 9,112 1,410 4,510 34 87 106 232 80 607
% 100.00% 20.54% 79.46% 3.47% 8.30% 11.05% 42.89% 2.85% 17.71% 2.74% 8.76% 0.07% 0.17% 0.21% 0.45% 0.16% 1.18%
Selected of those Identified
# 3,366 710 2,656 110 262 412 1,558 80 494 92 289 3 3 10 17 3 33
% 100.00% 21.09% 78.91% 3.27% 7.78% 12.24% 46.29% 2.38% 14.68% 2.73% 8.59% 0.09% 0.09% 0.30% 0.51% 0.09% 0.98%
0610 RCLF 100.00% 9.01% 90.99% 0.64% 3.99% 6.25% 69.84% 0.89% 8.98% 1.10% 7.05% 0.01% 0.07% 0.07% 0.64% 0.05% 0.42%
0620 Practical Nurse
Total Received
# 41,162 *** *** *** *** *** *** *** *** *** *** *** *** *** *** *** ***
Voluntarily Identified
# 16,036 3,065 12,971 534 1,420 1,252 5,929 695 4,288 510 938 20 52 24 69 30 275
% 100.00% 19.11% 80.89% 3.33% 8.86% 7.81% 36.97% 4.33% 26.74% 3.18% 5.85% 0.12% 0.32% 0.15% 0.43% 0.19% 1.71%
Qualified of those Identified
# 9,687 1,878 7,809 310 847 750 3,568 453 2,597 316 558 15 34 15 55 19 150
% 100.00% 19.39% 80.61% 3.20% 8.74% 7.74% 36.83% 4.68% 26.81% 3.26% 5.76% 0.15% 0.35% 0.15% 0.57% 0.20% 1.55%
Selected of those Identified
# 768 181 587 31 55 81 316 47 171 18 31 2 2 0 8 2 4
% 100.00% 23.57% 76.43% 4.04% 7.16% 10.55% 41.15% 6.12% 22.27% 2.34% 4.04% 0.26% 0.26% 0.00% 1.04% 0.26% 0.52%
0620 RCLF 100.01% 7.40% 92.61% 0.82% 6.43% 3.94% 59.94% 1.85% 21.69% 0.66% 3.06% 0.02% 0.06% 0.06% 0.95% 0.05% 0.48%
0621 Nursing Assistant
Total Received
# 27,404 *** *** *** *** *** *** *** *** *** *** *** *** *** *** *** ***
Voluntarily Identified
# 9,316 2,116 7,200 338 803 695 2,180 837 3,694 165 298 6 26 26 48 49 151
% 100.00% 22.71% 77.29% 3.63% 8.62% 7.46% 23.40% 8.98% 39.65% 1.77% 3.20% 0.06% 0.28% 0.28% 0.52% 0.53% 1.62%
Qualified of those Identified
# 4,620 1,002 3,618 153 387 326 1,003 392 1,950 90 154 3 13 13 27 25 84
% 100.00% 21.69% 78.31% 3.31% 8.38% 7.06% 21.71% 8.48% 42.21% 1.95% 3.33% 0.06% 0.28% 0.28% 0.58% 0.54% 1.82%
Selected of those Identified
# 506 166 340 24 24 53 139 58 141 23 26 1 0 1 3 6 7
% 100.00% 32.81% 67.19% 4.74% 4.74% 10.47% 27.47% 11.46% 27.87% 4.55% 5.14% 0.20% 0.00% 0.20% 0.59% 1.19% 1.38%

150
Table A7: APPLICANT AND HIRES FOR MAJOR OCCUPATIONS - Permanent and Temporary Workforce - Distribution by Race/Ethnicity and Sex - SEP - FY2014
All VA TOTAL
EMPLOYEES
RACE/ETHNICITY
Hispanic or Latino
Non-Hispanic or Latino
White Black or African American
Asian Native Hawaiian or Other Pacific
Islander
American Indian or Alaska Native
Two or More Races/Undisclosed
All male female male female male female male female male female male female male female male female
0621 RCLF 99.98% 12.03% 87.95% 1.49% 11.28% 5.59% 41.56% 3.70% 29.73% 0.94% 3.30% 0.03% 0.17% 0.16% 1.22% 0.12% 0.69%
0644 Medical Technologist
Total Received
# 8,922 *** *** *** *** *** *** *** *** *** *** *** *** *** *** *** ***
Voluntarily Identified
# 3,385 1,391 1,994 218 306 482 866 442 528 222 245 8 2 5 18 14 29
% 100.00% 41.09% 58.91% 6.44% 9.04% 14.24% 25.58% 13.06% 15.60% 6.56% 7.24% 0.24% 0.06% 0.15% 0.53% 0.41% 0.86%
Qualified of those Identified
# 1,314 482 832 73 125 167 398 151 162 87 132 0 1 3 9 1 5
% 100.00% 36.68% 63.32% 5.56% 9.51% 12.71% 30.29% 11.49% 12.33% 6.62% 10.05% 0.00% 0.08% 0.23% 0.68% 0.08% 0.38%
Selected of those Identified
# 202 66 136 9 25 33 64 13 21 11 23 0 0 0 2 0 1
% 100.00% 32.67% 67.33% 4.46% 12.38% 16.34% 31.68% 6.44% 10.40% 5.45% 11.39% 0.00% 0.00% 0.00% 0.99% 0.00% 0.50%
0644 RCLF 99.98% 25.93% 74.05% 2.97% 5.75% 14.90% 48.08% 3.62% 10.64% 4.04% 8.45% 0.05% 0.09% 0.17% 0.56% 0.18% 0.48%
0647 Diagnostic Radiologic Technologist
Total Received
# 9,796 *** *** *** *** *** *** *** *** *** *** *** *** *** *** *** ***
Voluntarily Identified
# 3,782 1,866 1,916 247 182 1,032 1,347 344 269 182 88 32 1 10 6 19 23
% 100.00% 49.34% 50.66% 6.53% 4.81% 27.29% 35.62% 9.10% 7.11% 4.81% 2.33% 0.85% 0.03% 0.26% 0.16% 0.50% 0.61%
Qualified of those Identified
# 2,187 1,095 1,092 139 93 614 771 199 153 105 58 17 0 9 5 12 12
% 100.00% 50.07% 49.93% 6.36% 4.25% 28.07% 35.25% 9.10% 7.00% 4.80% 2.65% 0.78% 0.00% 0.41% 0.23% 0.55% 0.55%
Selected of those Identified
# 173 93 80 16 8 54 54 10 13 9 4 1 0 1 0 2 1
% 100.00% 53.76% 46.24% 9.25% 4.62% 31.21% 31.21% 5.78% 7.51% 5.20% 2.31% 0.58% 0.00% 0.58% 0.00% 1.16% 0.58%
0647 RCLF 100.01% 28.19% 71.82% 3.92% 4.74% 18.26% 58.48% 3.08% 5.51% 2.51% 2.31% 0.06% 0.04% 0.20% 0.50% 0.16% 0.24%
0660 Pharmacist
Total Received
# 14,668 *** *** *** *** *** *** *** *** *** *** *** *** *** *** *** ***
Voluntarily Identified
# 6,711 3,044 3,667 389 190 1,324 1,808 424 569 846 1,038 4 10 5 5 52 47
% 100.00% 45.36% 54.64% 5.80% 2.83% 19.73% 26.94% 6.32% 8.48% 12.61% 15.47% 0.06% 0.15% 0.07% 0.07% 0.77% 0.70%

151
Table A7: APPLICANT AND HIRES FOR MAJOR OCCUPATIONS - Permanent and Temporary Workforce - Distribution by Race/Ethnicity and Sex - SEP - FY2014
All VA TOTAL
EMPLOYEES
RACE/ETHNICITY
Hispanic or Latino
Non-Hispanic or Latino
White Black or African American
Asian Native Hawaiian or Other Pacific
Islander
American Indian or Alaska Native
Two or More Races/Undisclosed
All male female male female male female male female male female male female male female male female
Qualified of those Identified
# 4,490 2,012 2,478 289 127 862 1,190 296 386 533 733 0 8 3 1 29 33
% 100.00% 44.81% 55.19% 6.44% 2.83% 19.20% 26.50% 6.59% 8.60% 11.87% 16.33% 0.00% 0.18% 0.07% 0.02% 0.65% 0.73%
Selected of those Identified
# 286 90 196 5 6 67 114 6 20 10 53 0 1 0 0 2 2
% 100.00% 31.47% 68.53% 1.75% 2.10% 23.43% 39.86% 2.10% 6.99% 3.50% 18.53% 0.00% 0.35% 0.00% 0.00% 0.70% 0.70%
0660 RCLF 100.00% 47.35% 52.65% 1.57% 2.12% 37.03% 36.26% 2.06% 3.68% 6.21% 10.16% 0.04% 0.03% 0.21% 0.20% 0.23% 0.20%
0675 Medical Records Technician
Total Received
# 20,001 *** *** *** *** *** *** *** *** *** *** *** *** *** *** *** ***
Voluntarily Identified
# 7,113 1,969 5,144 431 744 799 2,082 564 1,959 112 195 5 11 15 34 43 119
% 100.00% 27.68% 72.32% 6.06% 10.46% 11.23% 29.27% 7.93% 27.54% 1.57% 2.74% 0.07% 0.15% 0.21% 0.48% 0.60% 1.67%
Qualified of those Identified
# 1,796 358 1,438 87 176 153 633 91 537 14 55 0 2 4 8 9 27
% 100.00% 19.93% 80.07% 4.84% 9.80% 8.52% 35.24% 5.07% 29.90% 0.78% 3.06% 0.00% 0.11% 0.22% 0.45% 0.50% 1.50%
Selected of those Identified
# 138 29 109 6 10 16 66 7 27 0 6 0 0 0 0 0 0
% 100.00% 21.01% 78.99% 4.35% 7.25% 11.59% 47.83% 5.07% 19.57% 0.00% 4.35% 0.00% 0.00% 0.00% 0.00% 0.00% 0.00%
0675 RCLF 100.01% 10.38% 89.63% 1.56% 11.23% 4.89% 57.03% 2.29% 15.39% 1.38% 3.84% 0.00% 0.15% 0.18% 1.70% 0.08% 0.29%
0905 General Attorney
Total Received
# 1,990 *** *** *** *** *** *** *** *** *** *** *** *** *** *** *** ***
Voluntarily Identified
# 787 440 347 67 47 246 136 68 126 44 33 4 0 6 0 5 5
% 100.00% 55.91% 44.09% 8.51% 5.97% 31.26% 17.28% 8.64% 16.01% 5.59% 4.19% 0.51% 0.00% 0.76% 0.00% 0.64% 0.64%
Qualified of those Identified
# 596 332 264 48 35 192 101 47 94 31 30 3 0 6 0 5 4
% 100.00% 55.70% 44.30% 8.05% 5.87% 32.21% 16.95% 7.89% 15.77% 5.20% 5.03% 0.50% 0.00% 1.01% 0.00% 0.84% 0.67%
Selected of those Identified
# 5 4 1 0 0 2 1 1 0 1 0 0 0 0 0 0 0
% 100.00% 80.00% 20.00% 0.00% 0.00% 40.00% 20.00% 20.00% 0.00% 20.00% 0.00% 0.00% 0.00% 0.00% 0.00% 0.00% 0.00%
0905 RCLF 100.01% 66.58% 33.43% 2.65% 1.92% 59.21% 26.54% 2.15% 2.63% 2.02% 1.90% 0.02% 0.01% 0.31% 0.23% 0.22% 0.20%
0986 Legal Assistance

152
Table A7: APPLICANT AND HIRES FOR MAJOR OCCUPATIONS - Permanent and Temporary Workforce - Distribution by Race/Ethnicity and Sex - SEP - FY2014
All VA TOTAL
EMPLOYEES
RACE/ETHNICITY
Hispanic or Latino
Non-Hispanic or Latino
White Black or African American
Asian Native Hawaiian or Other Pacific
Islander
American Indian or Alaska Native
Two or More Races/Undisclosed
All male female male female male female male female male female male female male female male female
Total Received
# 738 *** *** *** *** *** *** *** *** *** *** *** *** *** *** *** ***
Voluntarily Identified
# 293 89 204 9 29 40 73 35 86 2 10 1 1 1 1 1 4
% 100.00% 30.38% 69.62% 3.07% 9.90% 13.65% 24.91% 11.95% 29.35% 0.68% 3.41% 0.34% 0.34% 0.34% 0.34% 0.34% 1.37%
Qualified of those Identified
# 227 74 153 8 21 33 57 29 63 1 7 1 1 1 1 1 3
% 100.00% 32.60% 67.40% 3.52% 9.25% 14.54% 25.11% 12.78% 27.75% 0.44% 3.08% 0.44% 0.44% 0.44% 0.44% 0.44% 1.32%
Selected of those Identified
# 5 1 4 0 0 0 1 1 3 0 0 0 0 0 0 0 0
% 100.00% 20.00% 80.00% 0.00% 0.00% 0.00% 20.00% 20.00% 60.00% 0.00% 0.00% 0.00% 0.00% 0.00% 0.00% 0.00% 0.00%
0986 RCLF 99.99% 26.26% 73.73% 2.26% 7.77% 19.01% 54.65% 2.68% 7.48% 1.90% 2.43% 0.01% 0.09% 0.30% 0.87% 0.10% 0.44%
0996 Veterans Claims Examining
Total Received
# 39,059 *** *** *** *** *** *** *** *** *** *** *** *** *** *** *** ***
Voluntarily Identified
# 19,106 9,795 9,311 1,807 1,281 4,041 2,778 3,092 4,623 445 247 61 30 99 72 250 280
% 100.00% 51.27% 48.73% 9.46% 6.70% 21.15% 14.54% 16.18% 24.20% 2.33% 1.29% 0.32% 0.16% 0.52% 0.38% 1.31% 1.47%
Qualified of those Identified
# 11,821 5,638 6,183 1,040 837 2,351 1,883 1,745 3,084 283 150 35 20 60 40 124 169
% 100.00% 47.69% 52.31% 8.80% 7.08% 19.89% 15.93% 14.76% 26.09% 2.39% 1.27% 0.30% 0.17% 0.51% 0.34% 1.05% 1.43%
Selected of those Identified
# 742 398 344 74 48 201 161 90 104 20 7 3 0 0 5 10 19
% 100.00% 53.64% 46.36% 9.97% 6.47% 27.09% 21.70% 12.13% 14.02% 2.70% 0.94% 0.40% 0.00% 0.00% 0.67% 1.35% 2.56%
0996 RCLF 100.01% 38.20% 61.81% 2.98% 5.68% 29.92% 41.18% 3.39% 11.69% 1.58% 2.46% 0.03% 0.08% 0.18% 0.42% 0.12% 0.30%
0998 Claims Assistance and Examining
Total Received
# 17,230 *** *** *** *** *** *** *** *** *** *** *** *** *** *** *** ***
Voluntarily Identified
# 6,751 2,733 4,018 425 489 1,218 1,291 876 2,008 112 111 16 6 32 19 54 94
% 100.00% 40.48% 59.52% 6.30% 7.24% 18.04% 19.12% 12.98% 29.74% 1.66% 1.64% 0.24% 0.09% 0.47% 0.28% 0.80% 1.39%
Qualified of those Identified
# 4,090 1,717 2,373 246 271 812 809 538 1,156 65 72 7 2 20 11 29 52
% 100.00% 41.98% 58.02% 6.01% 6.63% 19.85% 19.78% 13.15% 28.26% 1.59% 1.76% 0.17% 0.05% 0.49% 0.27% 0.71% 1.27%

153
Table A7: APPLICANT AND HIRES FOR MAJOR OCCUPATIONS - Permanent and Temporary Workforce - Distribution by Race/Ethnicity and Sex - SEP - FY2014
All VA TOTAL
EMPLOYEES
RACE/ETHNICITY
Hispanic or Latino
Non-Hispanic or Latino
White Black or African American
Asian Native Hawaiian or Other Pacific
Islander
American Indian or Alaska Native
Two or More Races/Undisclosed
All male female male female male female male female male female male female male female male female
Selected of those Identified
# 156 82 74 12 10 42 32 21 28 2 0 2 0 1 2 2 2
% 100.00% 52.56% 47.44% 7.69% 6.41% 26.92% 20.51% 13.46% 17.95% 1.28% 0.00% 1.28% 0.00% 0.64% 1.28% 1.28% 1.28%
0998 RCLF 99.99% 25.01% 74.98% 3.16% 8.19% 16.55% 51.57% 3.28% 10.90% 1.48% 2.91% 0.07% 0.15% 0.31% 0.86% 0.16% 0.40%
1101 General Business and Industry
Total Received
# 4,767 *** *** *** *** *** *** *** *** *** *** *** *** *** *** *** ***
Voluntarily Identified
# 1,886 1,181 705 223 84 470 214 382 351 69 23 1 6 16 6 20 21
% 100.00% 62.62% 37.38% 11.82% 4.45% 24.92% 11.35% 20.25% 18.61% 3.66% 1.22% 0.05% 0.32% 0.85% 0.32% 1.06% 1.11%
Qualified of those Identified
# 804 531 273 96 35 247 102 146 111 29 7 0 5 6 6 7 7
% 100.00% 66.04% 33.96% 11.94% 4.35% 30.72% 12.69% 18.16% 13.81% 3.61% 0.87% 0.00% 0.62% 0.75% 0.75% 0.87% 0.87%
Selected of those Identified
# 29 17 12 3 2 7 1 6 8 1 1 0 0 0 0 0 0
% 100.00% 58.62% 41.38% 10.34% 6.90% 24.14% 3.45% 20.69% 27.59% 3.45% 3.45% 0.00% 0.00% 0.00% 0.00% 0.00% 0.00%
1101 RCLF 100.00% 37.56% 62.44% 3.68% 6.19% 26.33% 42.15% 3.59% 8.69% 3.36% 4.37% 0.02% 0.05% 0.32% 0.59% 0.26% 0.40%
1165 Loan Specialist
Total Received
# 2,301 *** *** *** *** *** *** *** *** *** *** *** *** *** *** *** ***
Voluntarily Identified
# 992 553 439 90 62 244 175 170 160 33 17 0 3 6 9 10 13
% 100.00% 55.75% 44.25% 9.07% 6.25% 24.60% 17.64% 17.14% 16.13% 3.33% 1.71% 0.00% 0.30% 0.60% 0.91% 1.01% 1.31%
Qualified of those Identified
# 624 340 284 49 36 145 112 108 108 27 14 0 2 4 2 7 10
% 100.00% 54.49% 45.51% 7.85% 5.77% 23.24% 17.95% 17.31% 17.31% 4.33% 2.24% 0.00% 0.32% 0.64% 0.32% 1.12% 1.60%
Selected of those Identified
# 24 10 14 1 5 8 4 1 3 0 2 0 0 0 0 0 0
% 100.00% 41.67% 58.33% 4.17% 20.83% 33.33% 16.67% 4.17% 12.50% 0.00% 8.33% 0.00% 0.00% 0.00% 0.00% 0.00% 0.00%
1165 RCLF 100.01% 46.67% 53.34% 4.78% 6.48% 35.28% 36.84% 3.73% 6.21% 2.34% 3.03% 0.08% 0.13% 0.21% 0.32% 0.25% 0.33%
1171 Appraising
Total Received
# 838 *** *** *** *** *** *** *** *** *** *** *** *** *** *** *** ***

154
Table A7: APPLICANT AND HIRES FOR MAJOR OCCUPATIONS - Permanent and Temporary Workforce - Distribution by Race/Ethnicity and Sex - SEP - FY2014
All VA TOTAL
EMPLOYEES
RACE/ETHNICITY
Hispanic or Latino
Non-Hispanic or Latino
White Black or African American
Asian Native Hawaiian or Other Pacific
Islander
American Indian or Alaska Native
Two or More Races/Undisclosed
All male female male female male female male female male female male female male female male female
Voluntarily Identified
# 358 234 124 40 17 125 44 52 47 3 13 4 2 5 0 5 1
% 100.00% 65.36% 34.64% 11.17% 4.75% 34.92% 12.29% 14.53% 13.13% 0.84% 3.63% 1.12% 0.56% 1.40% 0.00% 1.40% 0.28%
Qualified of those Identified
# 206 123 83 12 11 76 29 27 33 2 9 0 0 3 0 3 1
% 100.00% 59.71% 40.29% 5.83% 5.34% 36.89% 14.08% 13.11% 16.02% 0.97% 4.37% 0.00% 0.00% 1.46% 0.00% 1.46% 0.49%
Selected of those Identified
# 10 8 2 0 0 5 1 2 1 0 0 0 0 0 0 1 0
% 100.00% 80.00% 20.00% 0.00% 0.00% 50.00% 10.00% 20.00% 10.00% 0.00% 0.00% 0.00% 0.00% 0.00% 0.00% 10.00% 0.00%
1171 RCLF 99.99% 66.02% 33.97% 3.05% 2.00% 58.84% 28.48% 1.87% 1.86% 1.71% 1.04% 0.04% 0.02% 0.26% 0.49% 0.25% 0.08%
1630 Cemetery Administration
Total Received
# 1,070 *** *** *** *** *** *** *** *** *** *** *** *** *** *** *** ***
Voluntarily Identified
# 426 328 98 71 13 189 29 39 44 7 7 0 1 19 1 3 3
% 100.00% 77.00% 23.00% 16.67% 3.05% 44.37% 6.81% 9.15% 10.33% 1.64% 1.64% 0.00% 0.23% 4.46% 0.23% 0.70% 0.70%
Qualified of those Identified
# 208 160 48 30 5 104 11 14 26 4 4 0 0 6 0 2 2
% 100.00% 76.92% 23.08% 14.42% 2.40% 50.00% 5.29% 6.73% 12.50% 1.92% 1.92% 0.00% 0.00% 2.88% 0.00% 0.96% 0.96%
Selected of those Identified
# 18 12 6 0 0 10 1 1 3 0 2 0 0 1 0 0 0
% 100.00% 66.67% 33.33% 0.00% 0.00% 55.56% 5.56% 5.56% 16.67% 0.00% 11.11% 0.00% 0.00% 5.56% 0.00% 0.00% 0.00%
1630 RCLF 100.00% 37.56% 62.44% 3.68% 6.19% 26.33% 42.15% 3.59% 8.69% 3.36% 4.37% 0.02% 0.05% 0.32% 0.59% 0.26% 0.40%
1811 Criminal Investigating
Total Received
# 551 *** *** *** *** *** *** *** *** *** *** *** *** *** *** *** ***
Voluntarily Identified
# 210 184 26 41 5 97 11 36 8 6 1 0 0 3 0 1 1
% 100.00% 87.62% 12.38% 19.52% 2.38% 46.19% 5.24% 17.14% 3.81% 2.86% 0.48% 0.00% 0.00% 1.43% 0.00% 0.48% 0.48%
Qualified of those Identified
# 55 51 4 8 1 29 1 11 2 1 0 0 0 2 0 0 0
% 100.00% 92.73% 7.27% 14.55% 1.82% 52.73% 1.82% 20.00% 3.64% 1.82% 0.00% 0.00% 0.00% 3.64% 0.00% 0.00% 0.00%
Selected of those Identified
# 4 2 2 0 0 2 1 0 1 0 0 0 0 0 0 0 0
% 100.00% 50.00% 50.00% 0.00% 0.00% 50.00% 25.00% 0.00% 25.00% 0.00% 0.00% 0.00% 0.00% 0.00% 0.00% 0.00% 0.00%
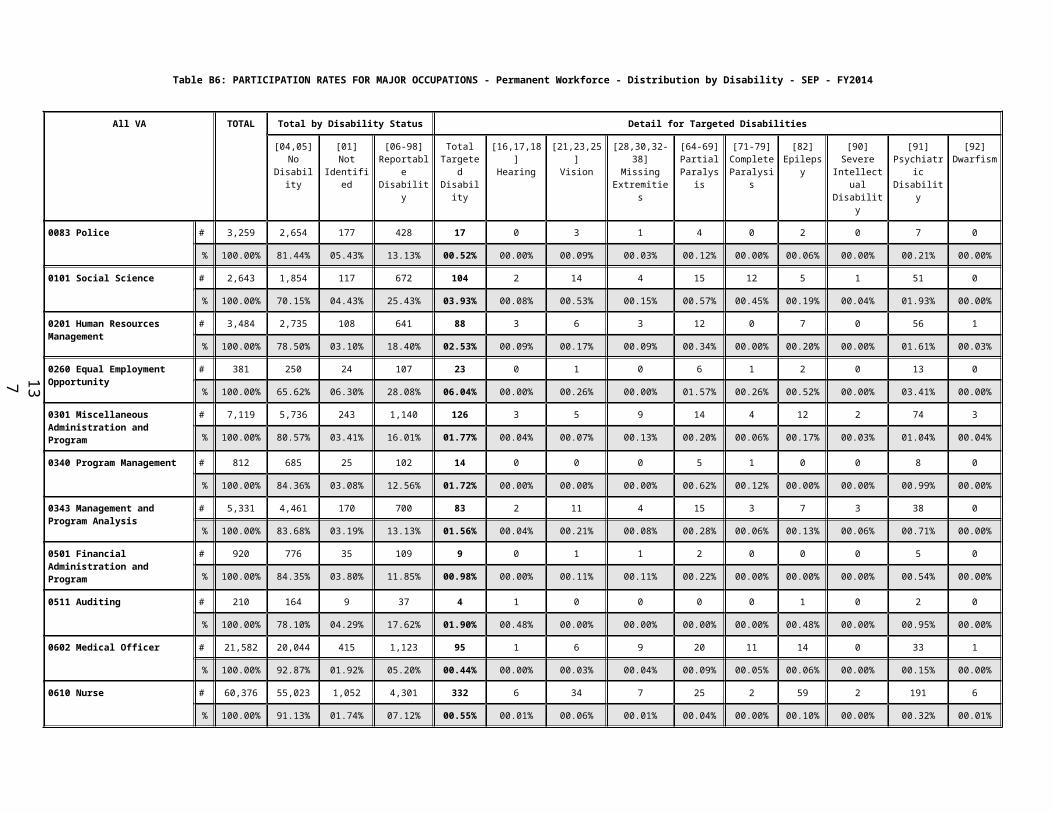
155
Table A7: APPLICANT AND HIRES FOR MAJOR OCCUPATIONS - Permanent and Temporary Workforce - Distribution by Race/Ethnicity and Sex - SEP - FY2014
All VA TOTAL
EMPLOYEES
RACE/ETHNICITY
Hispanic or Latino
Non-Hispanic or Latino
White Black or African American
Asian Native Hawaiian or Other Pacific
Islander
American Indian or Alaska Native
Two or More Races/Undisclosed
All male female male female male female male female male female male female male female male female
1811 RCLF 100.01% 76.34% 23.67% 8.28% 3.03% 57.74% 15.29% 7.50% 4.34% 1.60% 0.53% 0.07% 0.03% 0.80% 0.29% 0.35% 0.16%
2210 Information Technology Management
Total Received
# 40,405 *** *** *** *** *** *** *** *** *** *** *** *** *** *** *** ***
Voluntarily Identified
# 13,380 10,982 2,398 1,999 322 4,976 782 2,670 969 837 209 47 20 120 22 333 74
% 100.00% 82.08% 17.92% 14.94% 2.41% 37.19% 5.84% 19.96% 7.24% 6.26% 1.56% 0.35% 0.15% 0.90% 0.16% 2.49% 0.55%
Qualified of those Identified
# 8,059 6,590 1,469 1,183 202 2,990 507 1,566 558 564 145 27 5 76 12 184 40
% 100.00% 81.77% 18.23% 14.68% 2.51% 37.10% 6.29% 19.43% 6.92% 7.00% 1.80% 0.34% 0.06% 0.94% 0.15% 2.28% 0.50%
Selected of those Identified
# 178 145 33 19 5 80 13 35 12 7 1 0 0 1 0 3 2
% 100.00% 81.46% 18.54% 10.67% 2.81% 44.94% 7.30% 19.66% 6.74% 3.93% 0.56% 0.00% 0.00% 0.56% 0.00% 1.69% 1.12%
2210 RCLF 100.00% 70.62% 29.38% 5.78% 2.30% 50.58% 20.17% 6.69% 4.41% 6.52% 1.99% 0.12% 0.05% 0.51% 0.28% 0.42% 0.18%
4754 Cemetery Caretaking
Total Received
# 5,408 *** *** *** *** *** *** *** *** *** *** *** *** *** *** *** ***
Voluntarily Identified
# 1,909 1,792 117 360 32 950 51 366 29 29 1 14 1 20 2 53 1
% 100.00% 93.87% 6.13% 18.86% 1.68% 49.76% 2.67% 19.17% 1.52% 1.52% 0.05% 0.73% 0.05% 1.05% 0.10% 2.78% 0.05%
Qualified of those Identified
# 946 919 27 168 5 515 14 182 7 7 0 2 0 15 0 30 1
% 100.00% 97.15% 2.85% 17.76% 0.53% 54.44% 1.48% 19.24% 0.74% 0.74% 0.00% 0.21% 0.00% 1.59% 0.00% 3.17% 0.11%
Selected of those Identified
# 62 60 2 16 1 31 1 10 0 0 0 0 0 1 0 2 0
% 100.00% 96.77% 3.23% 25.81% 1.61% 50.00% 1.61% 16.13% 0.00% 0.00% 0.00% 0.00% 0.00% 1.61% 0.00% 3.23% 0.00%
4754 RCLF 99.98% 93.55% 6.43% 38.27% 1.25% 44.19% 4.39% 8.27% 0.50% 1.19% 0.12% 0.16% 0.02% 0.97% 0.12% 0.50% 0.03%Data source: OPM's USA Staffing quarterly data file for VA vacancies filtered by "Date Entered Status" field; includes all recruitment sources.Data shown includes full-time, part-time, and intermittent permanent employees in a pay status and excluding medical and Manila residents.This fixed list of major occupations was identified by the Administration EEO Office.RCLF comparisons are based on 2010 Census National data.For VHA, the methodology for computing RCLF has changed. The new methodology uses state level data for determining RCLF and is consistent with the methodology for VBA and NCA.

156
Table B7: APPLICANTS AND HIRES FOR MAJOR OCCUPATIONS - Permanent Workforce - Distribution by Disability - SEP - FY2014
All VA TOTAL Total by Disability Status Detail for Targeted Disabilities
[04,05]No
Disability
[01]Not
Identified
[06-98]ReportableDisability
TotalTargetedDisability
[16,17,18]Hearing
[21,23,25]Vision
[28,30,32-38]Missing
Extremities
[64-69]Partial
Paralysis
[71-79]CompleteParalysis
[82]Epilepsy
[90]Severe
IntellectualDisability
[91]PsychiatricDisability
[92]Dwarfism
Schedule A
Applications # *** *** *** *** *** *** *** *** *** *** *** *** *** ***
% *** *** *** *** *** *** *** *** *** *** *** *** *** ***
Hires # 178 74 5 99 21 1 1 1 1 2 1 0 14 0
% 100.00.% 41.57.% 02.81.% 55.62.% 11.80.% 00.56.% 00.56.% 00.56.% 00.56.% 01.12.% 00.56.% 00.00.% 07.87.% 00.00.%
Voluntarily Identified (Outside of Schedule A Applicants)
Applications # *** *** *** *** *** *** *** *** *** *** *** *** *** ***
% *** *** *** *** *** *** *** *** *** *** *** *** *** ***
Hires # 16,913 13,909 628 2,376 181 3 7 2 17 4 24 2 122 0
% 100.00.% 82.24.% 03.71.% 14.05.% 01.07.% 00.02.% 00.04.% 00.01.% 00.10.% 00.02.% 00.14.% 00.01.% 00.72.% 00.00.%Data shown includes full-time, part-time, and intermittent permanent employees in a pay status and excluding medical and Manila residents.This fixed list of major occupations was identified by the Administration EEO Office.
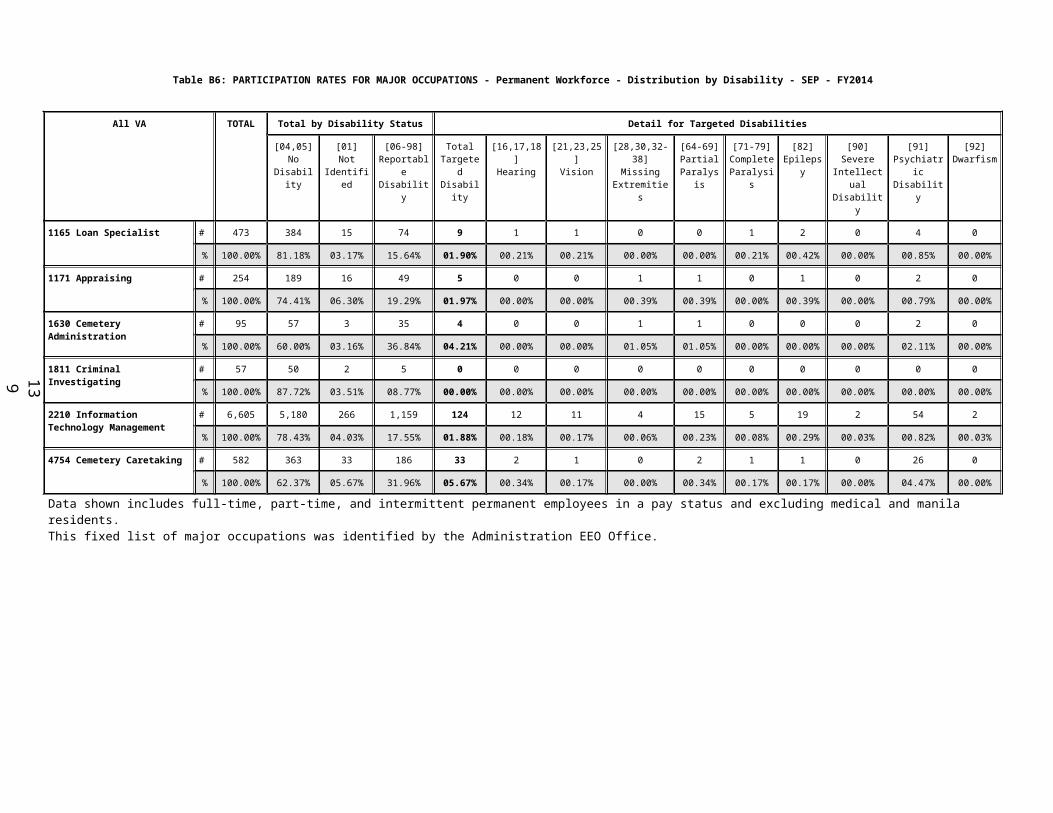
157
Table B7: APPLICANTS AND HIRES FOR MAJOR OCCUPATIONS - Temporary Workforce - Distribution by Disability - SEP - FY2014
All VA TOTAL Total by Disability Status Detail for Targeted Disabilities
[04,05]No
Disability
[01]Not
Identified
[06-98]ReportableDisability
TotalTargetedDisability
[16,17,18]Hearing
[21,23,25]Vision
[28,30,32-38]Missing
Extremities
[64-69]Partial
Paralysis
[71-79]CompleteParalysis
[82]Epilepsy
[90]Severe
IntellectualDisability
[91]PsychiatricDisability
[92]Dwarfism
Schedule A
Applications # *** *** *** *** *** *** *** *** *** *** *** *** *** ***
% *** *** *** *** *** *** *** *** *** *** *** *** *** ***
Hires # 39 10 2 27 8 0 1 0 1 1 1 0 4 0
% 100.00.% 25.64.% 05.13.% 69.23.% 20.51.% 00.00.% 02.56.% 00.00.% 02.56.% 02.56.% 02.56.% 00.00.% 10.26.% 00.00.%
Voluntarily Identified (Outside of Schedule A Applicants)
Applications # *** *** *** *** *** *** *** *** *** *** *** *** *** ***
% *** *** *** *** *** *** *** *** *** *** *** *** *** ***
Hires # 4,435 3,825 136 474 35 2 1 0 1 1 6 0 23 1
% 100.00.% 86.25.% 03.07.% 10.69.% 00.79.% 00.05.% 00.02.% 00.00.% 00.02.% 00.02.% 00.14.% 00.00.% 00.52.% 00.02.%Data shown includes full-time, part-time, and intermittent temporary employees in a pay status and excluding medical and Manila residents.This fixed list of major occupations was identified by the Administration EEO Office.

158
Table A8: NEW HIRES BY TYPE OF APPOINTMENT - Permanent and Temporary Workforce - Distribution by Race/Ethnicity and Sex - SEP - FY2014
All VA TOTAL
EMPLOYEES
RACE/ETHNICITY
Hispanic or Latino
Non-Hispanic or Latino
White Black or African American
Asian Native Hawaiian or Other Pacific
Islander
American Indian or Alaska Native
Two or More Races/Undisclosed
All male female male female male female male female male female male female male female male female
Permanent # 33,619 15,892 17,727 1,191 1,000 9,464 10,356 3,755 4,375 1,029 1,416 91 67 276 385 86 128
% 99.99% 47.27% 52.72% 03.54% 02.97% 28.15% 30.80% 11.17% 13.01% 03.06% 04.21% 00.27% 00.20% 00.82% 01.15% 00.26% 00.38%
Temporary # 14,667 5,378 9,289 361 465 3,419 6,045 975 1,637 476 898 20 26 98 175 29 43
% 100.00% 36.68% 63.32% 02.46% 03.17% 23.31% 41.21% 06.65% 11.16% 03.25% 06.12% 00.14% 00.18% 00.67% 01.19% 00.20% 00.29%
Non-Appropriated
# 1,247 522 725 53 69 232 332 206 292 14 11 5 2 8 13 4 6
% 99.98% 41.85% 58.13% 04.25% 05.53% 18.60% 26.62% 16.52% 23.42% 01.12% 00.88% 00.40% 00.16% 00.64% 01.04% 00.32% 00.48%
TOTAL # 49,533 21,792 27,741 1,605 1,534 13,115 16,733 4,936 6,304 1,519 2,325 116 95 382 573 119 177
% 100.01% 44.00% 56.01% 03.24% 03.10% 26.48% 33.78% 09.97% 12.73% 03.07% 04.69% 00.23% 00.19% 00.77% 01.16% 00.24% 00.36%
RCLF % 99.70% 34.73% 64.97% 04.45% 05.97% 23.21% 44.61% 03.78% 09.13% 02.81% 04.21% 00.03% 00.06% 00.27% 00.63% 00.18% 00.36%Data shown includes full-time, part-time, and intermittent permanent and temporary employees in a pay status and excluding medical and Manila residents.RCLF comparisons are based on 2010 Census National data.For VHA, the methodology for computing RCLF has changed. The new methodology uses state level data for determining RCLF and is consistent with the methodology for VBA and NCA.

159
Table B8: NEW HIRES BY TYPE OF APPOINTMENT - Permanent and Temporary Workforce - Distribution by Disability - SEP - FY2014
All VA TOTAL Total by Disability Status Detail for Targeted Disabilities
[04,05]No
Disability
[01]Not
Identified
[06-98]ReportableDisability
TotalTargetedDisability
[16,17,18]Hearing
[21,23,25]Vision
[28,30,32-38]Missing
Extremities
[64-69]Partial
Paralysis
[71-79]CompleteParalysis
[82]Epilepsy
[90]Severe
IntellectualDisability
[91]PsychiatricDisability
[92]Dwarfism
Permanent # 33,619 24,159 1,490 7,970 1,197 37 36 14 81 12 66 37 909 5
% 100.00% 71.86% 04.43% 23.71% 03.56% 00.11% 00.11% 00.04% 00.24% 00.04% 00.20% 00.11% 02.70% 00.01%
Temporary # 14,667 11,655 544 2,468 399 12 18 5 26 3 36 5 290 4
% 100.00% 79.46% 03.71% 16.83% 02.72% 00.08% 00.12% 00.03% 00.18% 00.02% 00.25% 00.03% 01.98% 00.03%
Non-Appropriated # 1,247 1,031 38 178 25 1 4 0 1 0 7 1 11 0
% 100.00% 82.68% 03.05% 14.27% 02.00% 00.08% 00.32% 00.00% 00.08% 00.00% 00.56% 00.08% 00.88% 00.00%
TOTAL # 49,533 36,845 2,072 10,616 1,621 50 58 19 108 15 109 43 1,210 9
% 100.00% 74.38% 04.18% 21.43% 03.27% 00.10% 00.12% 00.04% 00.22% 00.03% 00.22% 00.09% 02.44% 00.02%
Prior Year % 100.00.% 77.21.% 03.90.% 18.89.% 02.83.% 00.10.% 00.11.% 00.06.% 00.20.% 00.03.% 00.16.% 00.06.% 02.11.% 00.01.%
Data shown includes full-time, part-time, and intermittent permanent and temporary employees in a pay status and excluding medical and Manila residents.

160
Table A9: SELECTIONS FOR INTERNAL COMPETITIVE PROMOTIONS FOR MAJOR OCCUPATIONS - Permanent and Temporary Workforce - by Race/Ethnicity and Sex - SEP - FY2014
All VA TOTAL
EMPLOYEES
RACE/ETHNICITY
Hispanic or Latino
Non-Hispanic or Latino
White Black or African American
Asian Native Hawaiian or Other Pacific
Islander
American Indian or Alaska Native
Two or More Races/Undisclosed
All male female male female male female male female male female male female male female male female
0083 Police
Total Applications Received
#1,237 1,130 107 312 15 495 41 271 47 28 2 6 0 8 1 10 1
Qualified # 382 356 26 84 4 175 9 78 12 8 0 3 0 4 1 4 0
% 100.00% 93.19% 6.81% 21.99% 1.05% 45.81% 2.36% 20.42% 3.14% 2.09% 0.00% 0.79% 0.00% 1.05% 0.26% 1.05% 0.00%
Selected # 61 55 6 5 2 31 2 15 2 0 0 2 0 1 0 1 0
% 100.00% 90.16% 9.84% 8.20% 3.28% 50.82% 3.28% 24.59% 3.28% 0.00% 0.00% 3.28% 0.00% 1.64% 0.00% 1.64% 0.00%
Relevant Applicant Pool % 99.99% 92.82% 7.17% 10.38% 0.55% 58.20% 3.63% 20.37% 2.84% 1.95% 0.03% 0.40% 0.03% 1.31% 0.06% 0.21% 0.03%
0101 Social Science
Total Applications Received
#229 67 162 15 17 30 69 21 67 0 4 0 1 1 1 0 3
Qualified # 53 19 34 4 2 7 11 7 18 0 0 0 0 1 1 0 2
% 100.00% 35.85% 64.15% 7.55% 3.77% 13.21% 20.75% 13.21% 33.96% 0.00% 0.00% 0.00% 0.00% 1.89% 1.89% 0.00% 3.77%
Selected # 8 4 4 1 0 3 2 0 0 0 0 0 0 0 1 0 1
% 100.00% 50.00% 50.00% 12.50% 0.00% 37.50% 25.00% 0.00% 0.00% 0.00% 0.00% 0.00% 0.00% 0.00% 12.50% 0.00% 12.50%
Relevant Applicant Pool % 99.99% 48.61% 51.38% 3.25% 3.18% 31.26% 31.63% 11.87% 14.24% 0.84% 1.31% 0.22% 0.07% 0.91% 0.77% 0.26% 0.18%
0201 Human Resources Management
Total Applications Received
#2,886 1,260 1,626 285 270 469 517 442 700 25 79 1 5 18 12 20 43
Qualified # 843 384 459 78 74 139 144 151 202 3 22 0 1 5 2 8 14
% 100.00% 45.55% 54.45% 9.25% 8.78% 16.49% 17.08% 17.91% 23.96% 0.36% 2.61% 0.00% 0.12% 0.59% 0.24% 0.95% 1.66%
Selected # 76 27 49 5 6 18 22 3 16 0 3 0 1 0 0 1 1
% 100.00% 35.53% 64.47% 6.58% 7.89% 23.68% 28.95% 3.95% 21.05% 0.00% 3.95% 0.00% 1.32% 0.00% 0.00% 1.32% 1.32%

161
Table A9: SELECTIONS FOR INTERNAL COMPETITIVE PROMOTIONS FOR MAJOR OCCUPATIONS - Permanent and Temporary Workforce - by Race/Ethnicity and Sex - SEP - FY2014
All VA TOTAL
EMPLOYEES
RACE/ETHNICITY
Hispanic or Latino
Non-Hispanic or Latino
White Black or African American
Asian Native Hawaiian or Other Pacific
Islander
American Indian or Alaska Native
Two or More Races/Undisclosed
All male female male female male female male female male female male female male female male female
Relevant Applicant Pool % 100.01% 32.90% 67.11% 2.87% 5.49% 20.39% 36.54% 8.30% 21.35% 0.71% 2.02% 0.06% 0.28% 0.34% 1.00% 0.23% 0.43%
0260 Equal Employment Opportunity
Total Applications Received
#112 64 48 18 5 13 14 30 26 0 2 0 0 1 1 2 0
Qualified # 41 22 19 8 2 4 4 9 11 0 1 0 0 1 1 0 0
% 100.00% 53.66% 46.34% 19.51% 4.88% 9.76% 9.76% 21.95% 26.83% 0.00% 2.44% 0.00% 0.00% 2.44% 2.44% 0.00% 0.00%
Selected # 2 0 2 0 0 0 0 0 1 0 1 0 0 0 0 0 0
% 100.00% 0.00% 100.00% 0.00% 0.00% 0.00% 0.00% 0.00% 50.00% 0.00% 50.00% 0.00% 0.00% 0.00% 0.00% 0.00% 0.00%
Relevant Applicant Pool % 100.00% 43.49% 56.51% 3.39% 3.65% 17.19% 16.93% 21.09% 33.33% 1.30% 0.78% 0.00% 0.00% 0.00% 1.56% 0.52% 0.26%
0301 Miscellaneous Administration and Program
Total Applications Received
#4,886 2,292 2,594 490 413 855 823 800 1,189 75 76 9 8 23 13 40 72
Qualified # 2,042 971 1,071 192 169 384 361 333 472 27 35 4 4 10 7 21 23
% 100.00% 47.55% 52.45% 9.40% 8.28% 18.81% 17.68% 16.31% 23.11% 1.32% 1.71% 0.20% 0.20% 0.49% 0.34% 1.03% 1.13%
Selected # 178 76 102 11 15 41 49 21 29 3 5 0 0 0 1 0 3
% 100.00% 42.70% 57.30% 6.18% 8.43% 23.03% 27.53% 11.80% 16.29% 1.69% 2.81% 0.00% 0.00% 0.00% 0.56% 0.00% 1.69%
Relevant Applicant Pool % 99.99% 38.77% 61.22% 2.81% 3.69% 23.52% 34.57% 10.40% 19.52% 1.43% 2.04% 0.15% 0.19% 0.34% 0.83% 0.12% 0.38%
0340 Program Management
Total Applications Received
#113 57 56 11 5 28 16 18 31 0 3 0 0 0 1 0 0
Qualified # 36 17 19 3 1 9 5 5 13 0 0 0 0 0 0 0 0
% 100.00% 47.22% 52.78% 8.33% 2.78% 25.00% 13.89% 13.89% 36.11% 0.00% 0.00% 0.00% 0.00% 0.00% 0.00% 0.00% 0.00%
Selected # 5 2 3 0 0 1 0 1 3 0 0 0 0 0 0 0 0

162
Table A9: SELECTIONS FOR INTERNAL COMPETITIVE PROMOTIONS FOR MAJOR OCCUPATIONS - Permanent and Temporary Workforce - by Race/Ethnicity and Sex - SEP - FY2014
All VA TOTAL
EMPLOYEES
RACE/ETHNICITY
Hispanic or Latino
Non-Hispanic or Latino
White Black or African American
Asian Native Hawaiian or Other Pacific
Islander
American Indian or Alaska Native
Two or More Races/Undisclosed
All male female male female male female male female male female male female male female male female
% 100.00% 40.00% 60.00% 0.00% 0.00% 20.00% 0.00% 20.00% 60.00% 0.00% 0.00% 0.00% 0.00% 0.00% 0.00% 0.00% 0.00%
Relevant Applicant Pool % 99.99% 47.20% 52.79% 2.41% 2.06% 35.51% 35.62% 6.41% 12.14% 1.49% 1.83% 0.23% 0.23% 1.15% 0.80% 0.00% 0.11%
0343 Management and Program Analysis
Total Applications Received
#4,294 2,217 2,077 509 342 817 696 718 852 91 104 4 8 33 17 45 58
Qualified # 1,763 838 925 172 143 348 348 256 351 33 49 0 4 13 5 16 25
% 100.00% 47.53% 52.47% 9.76% 8.11% 19.74% 19.74% 14.52% 19.91% 1.87% 2.78% 0.00% 0.23% 0.74% 0.28% 0.91% 1.42%
Selected # 146 55 91 13 9 30 51 7 24 3 6 0 0 1 0 1 1
% 100.00% 37.67% 62.33% 8.90% 6.16% 20.55% 34.93% 4.79% 16.44% 2.05% 4.11% 0.00% 0.00% 0.68% 0.00% 0.68% 0.68%
Relevant Applicant Pool % 100.00% 41.16% 58.84% 2.79% 2.72% 28.09% 36.82% 7.43% 15.83% 2.23% 2.50% 0.07% 0.15% 0.40% 0.58% 0.15% 0.24%
0501 Financial Administration and Program
Total Applications Received
#480 176 304 51 57 63 123 55 97 3 15 0 4 2 2 2 6
Qualified # 193 61 132 24 20 20 58 14 43 2 3 0 2 0 2 1 4
% 100.00% 31.61% 68.39% 12.44% 10.36% 10.36% 30.05% 7.25% 22.28% 1.04% 1.55% 0.00% 1.04% 0.00% 1.04% 0.52% 2.07%
Selected # 20 5 15 1 1 4 7 0 3 0 0 0 0 0 1 0 3
% 100.00% 25.00% 75.00% 5.00% 5.00% 20.00% 35.00% 0.00% 15.00% 0.00% 0.00% 0.00% 0.00% 0.00% 5.00% 0.00% 15.00%
Relevant Applicant Pool % 100.00% 30.09% 69.91% 1.73% 4.31% 21.36% 47.36% 5.39% 14.13% 0.86% 2.27% 0.32% 0.22% 0.43% 1.40% 0.00% 0.22%
0511 Auditing
Total Applications Received
#49 26 23 6 2 8 6 8 13 4 2 0 0 0 0 0 0
Qualified # 17 11 6 3 0 5 1 2 3 1 2 0 0 0 0 0 0
% 100.00% 64.71% 35.29% 17.65% 0.00% 29.41% 5.88% 11.76% 17.65% 5.88% 11.76% 0.00% 0.00% 0.00% 0.00% 0.00% 0.00%

163
Table A9: SELECTIONS FOR INTERNAL COMPETITIVE PROMOTIONS FOR MAJOR OCCUPATIONS - Permanent and Temporary Workforce - by Race/Ethnicity and Sex - SEP - FY2014
All VA TOTAL
EMPLOYEES
RACE/ETHNICITY
Hispanic or Latino
Non-Hispanic or Latino
White Black or African American
Asian Native Hawaiian or Other Pacific
Islander
American Indian or Alaska Native
Two or More Races/Undisclosed
All male female male female male female male female male female male female male female male female
Selected # 4 3 1 1 0 2 0 0 0 0 1 0 0 0 0 0 0
% 100.00% 75.00% 25.00% 25.00% 0.00% 50.00% 0.00% 0.00% 0.00% 0.00% 25.00% 0.00% 0.00% 0.00% 0.00% 0.00% 0.00%
Relevant Applicant Pool % 100.00% 44.76% 55.24% 3.81% 4.76% 32.38% 30.00% 5.71% 14.29% 1.90% 5.24% 0.00% 0.00% 0.48% 0.95% 0.48% 0.00%
0602 Medical Officer
Total Applications Received
#48 35 13 3 3 21 4 3 4 7 2 0 0 0 0 1 0
Qualified # 43 31 12 2 3 19 4 3 3 6 2 0 0 0 0 1 0
% 100.00% 72.09% 27.91% 4.65% 6.98% 44.19% 9.30% 6.98% 6.98% 13.95% 4.65% 0.00% 0.00% 0.00% 0.00% 2.33% 0.00%
Selected # 11 6 5 0 2 3 1 1 1 2 1 0 0 0 0 0 0
% 100.00% 54.55% 45.45% 0.00% 18.18% 27.27% 9.09% 9.09% 9.09% 18.18% 9.09% 0.00% 0.00% 0.00% 0.00% 0.00% 0.00%
Relevant Applicant Pool % 99.98% 63.84% 36.14% 3.51% 2.09% 43.13% 20.40% 2.53% 2.51% 13.56% 10.35% 0.10% 0.05% 0.92% 0.67% 0.09% 0.07%
0610 Nurse
Total Applications Received
#2,893 543 2,350 191 341 249 1,202 67 617 30 150 1 3 2 7 3 30
Qualified # 1,786 342 1,444 133 231 149 695 45 410 13 86 1 1 1 5 0 16
% 100.00% 19.15% 80.85% 7.45% 12.93% 8.34% 38.91% 2.52% 22.96% 0.73% 4.82% 0.06% 0.06% 0.06% 0.28% 0.00% 0.90%
Selected # 308 56 252 20 52 28 136 4 41 2 20 1 0 1 2 0 1
% 100.00% 18.18% 81.82% 6.49% 16.88% 9.09% 44.16% 1.30% 13.31% 0.65% 6.49% 0.32% 0.00% 0.32% 0.65% 0.00% 0.32%
Relevant Applicant Pool % 100.00% 17.46% 82.54% 1.44% 4.25% 11.82% 52.19% 1.90% 15.31% 1.95% 9.27% 0.04% 0.20% 0.28% 1.14% 0.03% 0.18%
0620 Practical Nurse
Total Applications Received
#808 129 679 28 82 54 329 23 229 21 22 0 4 2 3 1 10
Qualified # 304 50 254 16 41 20 124 5 74 9 5 0 1 0 3 0 6

164
Table A9: SELECTIONS FOR INTERNAL COMPETITIVE PROMOTIONS FOR MAJOR OCCUPATIONS - Permanent and Temporary Workforce - by Race/Ethnicity and Sex - SEP - FY2014
All VA TOTAL
EMPLOYEES
RACE/ETHNICITY
Hispanic or Latino
Non-Hispanic or Latino
White Black or African American
Asian Native Hawaiian or Other Pacific
Islander
American Indian or Alaska Native
Two or More Races/Undisclosed
All male female male female male female male female male female male female male female male female
% 100.00% 16.45% 83.55% 5.26% 13.49% 6.58% 40.79% 1.64% 24.34% 2.96% 1.64% 0.00% 0.33% 0.00% 0.99% 0.00% 1.97%
Selected # 80 16 64 5 12 8 33 2 14 1 3 0 1 0 0 0 1
% 100.00% 20.00% 80.00% 6.25% 15.00% 10.00% 41.25% 2.50% 17.50% 1.25% 3.75% 0.00% 1.25% 0.00% 0.00% 0.00% 1.25%
Relevant Applicant Pool % 99.99% 17.97% 82.02% 2.07% 5.05% 10.16% 46.06% 3.75% 24.85% 1.49% 4.18% 0.08% 0.25% 0.32% 1.42% 0.10% 0.21%
0621 Nursing Assistant
Total Applications Received
#643 119 524 24 41 26 147 60 308 7 7 0 2 1 7 1 12
Qualified # 237 49 188 7 11 10 56 28 101 3 6 0 0 0 6 1 8
% 100.00% 20.68% 79.32% 2.95% 4.64% 4.22% 23.63% 11.81% 42.62% 1.27% 2.53% 0.00% 0.00% 0.00% 2.53% 0.42% 3.38%
Selected # 57 13 44 2 4 3 16 7 19 1 2 0 0 0 1 0 2
% 100.00% 22.81% 77.19% 3.51% 7.02% 5.26% 28.07% 12.28% 33.33% 1.75% 3.51% 0.00% 0.00% 0.00% 1.75% 0.00% 3.51%
Relevant Applicant Pool %
100.00% 26.19% 73.81% 2.48% 4.64% 9.32% 24.66% 12.24% 38.52% 1.58% 4.28% 0.16% 0.19% 0.30% 1.22% 0.11% 0.30%
0644 Medical Technologist
Total Applications Received
# 152 47 105 10 21 15 45 13 23 9 14 0 0 0 0 0 2
Qualified # 88 26 62 4 10 9 31 8 15 5 5 0 0 0 0 0 1
% 100.00% 29.55% 70.45% 4.55% 11.36% 10.23% 35.23% 9.09% 17.05% 5.68% 5.68% 0.00% 0.00% 0.00% 0.00% 0.00% 1.14%
Selected # 25 8 17 3 3 3 9 0 3 2 1 0 0 0 0 0 1
% 100.00% 32.00% 68.00% 12.00% 12.00% 12.00% 36.00% 0.00% 12.00% 8.00% 4.00% 0.00% 0.00% 0.00% 0.00% 0.00% 4.00%
Relevant Applicant Pool %
100.00% 27.85% 72.15% 2.33% 5.92% 17.29% 45.23% 3.16% 9.53% 4.49% 9.85% 0.11% 0.07% 0.43% 1.37% 0.04% 0.18%
0647 Diagnostic Radiologic Technologist
Total Applications Received
# 176 95 81 21 12 49 52 17 9 5 5 1 0 1 0 1 3

165
Table A9: SELECTIONS FOR INTERNAL COMPETITIVE PROMOTIONS FOR MAJOR OCCUPATIONS - Permanent and Temporary Workforce - by Race/Ethnicity and Sex - SEP - FY2014
All VA TOTAL
EMPLOYEES
RACE/ETHNICITY
Hispanic or Latino
Non-Hispanic or Latino
White Black or African American
Asian Native Hawaiian or Other Pacific
Islander
American Indian or Alaska Native
Two or More Races/Undisclosed
All male female male female male female male female male female male female male female male female
Qualified # 68 36 32 10 7 19 21 6 3 0 0 0 0 1 0 0 1
% 100.00% 52.94% 47.06% 14.71% 10.29% 27.94% 30.88% 8.82% 4.41% 0.00% 0.00% 0.00% 0.00% 1.47% 0.00% 0.00% 1.47%
Selected # 32 11 21 3 4 6 14 1 3 0 0 0 0 1 0 0 0
% 100.00% 34.38% 65.63% 9.38% 12.50% 18.75% 43.75% 3.13% 9.38% 0.00% 0.00% 0.00% 0.00% 3.13% 0.00% 0.00% 0.00%
Relevant Applicant Pool % 100.01% 46.56% 53.45% 4.61% 2.77% 29.32% 40.01% 8.06% 7.60% 3.64% 2.09% 0.14% 0.11% 0.68% 0.79% 0.11% 0.08%
0660 Pharmacist
Total Applications Received
#425 147 278 13 22 81 149 16 47 36 56 0 0 0 0 1 4
Qualified # 199 64 135 5 11 39 76 5 21 14 26 0 0 0 0 1 1
% 100.00% 32.16% 67.84% 2.51% 5.53% 19.60% 38.19% 2.51% 10.55% 7.04% 13.07% 0.00% 0.00% 0.00% 0.00% 0.50% 0.50%
Selected # 59 18 41 0 3 15 19 0 9 2 10 0 0 0 0 1 0
% 100.00% 30.51% 69.49% 0.00% 5.08% 25.42% 32.20% 0.00% 15.25% 3.39% 16.95% 0.00% 0.00% 0.00% 0.00% 1.69% 0.00%
Relevant Applicant Pool % 100.00% 35.85% 64.15% 1.23% 2.86% 27.69% 42.49% 1.87% 5.73% 4.46% 12.01% 0.06% 0.07% 0.48% 0.87% 0.06% 0.12%
0675 Medical Records Technician
Total Applications Received
#598 195 403 56 53 64 155 59 166 7 15 0 0 3 5 6 9
Qualified # 194 63 131 22 9 16 46 22 65 1 5 0 0 2 2 0 4
% 100.00% 32.47% 67.53% 11.34% 4.64% 8.25% 23.71% 11.34% 33.51% 0.52% 2.58% 0.00% 0.00% 1.03% 1.03% 0.00% 2.06%
Selected # 29 6 23 2 2 3 14 1 5 0 2 0 0 0 0 0 0
% 100.00% 20.69% 79.31% 6.90% 6.90% 10.34% 48.28% 3.45% 17.24% 0.00% 6.90% 0.00% 0.00% 0.00% 0.00% 0.00% 0.00%
Relevant Applicant Pool % 100.00% 15.52% 84.48% 1.06% 5.41% 8.68% 52.50% 4.63% 22.48% 0.86% 2.50% 0.00% 0.16% 0.25% 1.39% 0.04% 0.04%
0905 General Attorney
Total # 15 12 3 0 2 7 0 2 1 1 0 0 0 2 0 0 0
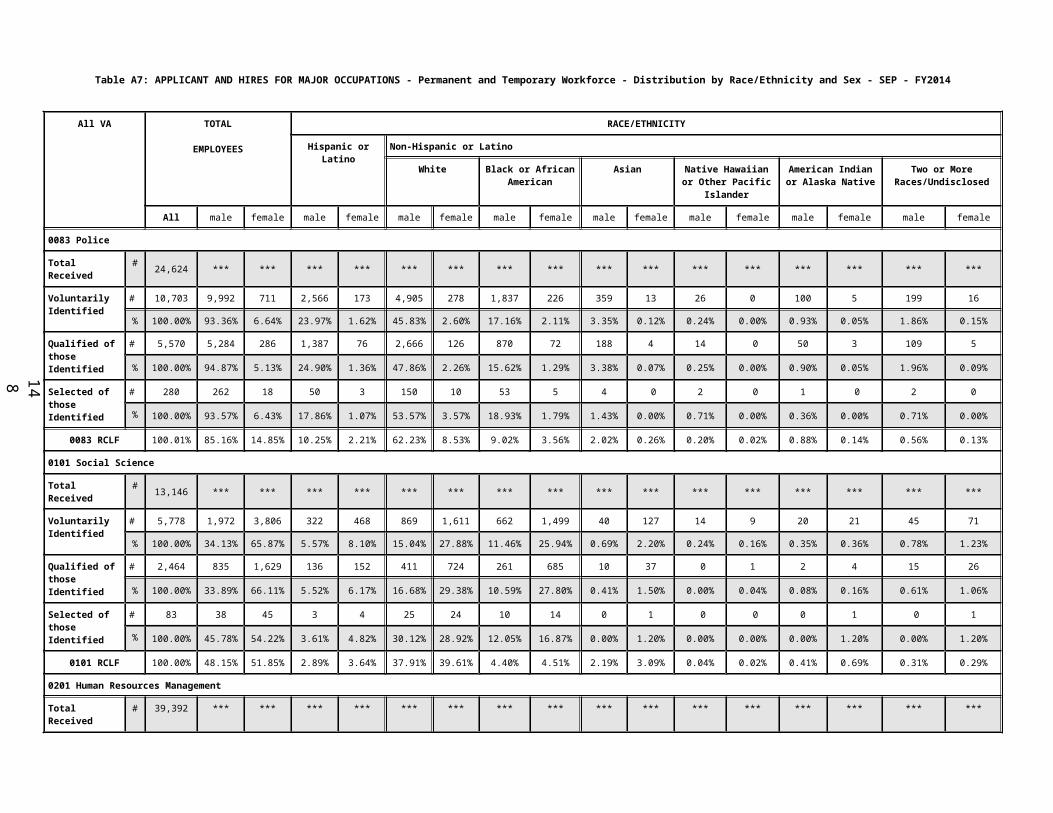
166
Table A9: SELECTIONS FOR INTERNAL COMPETITIVE PROMOTIONS FOR MAJOR OCCUPATIONS - Permanent and Temporary Workforce - by Race/Ethnicity and Sex - SEP - FY2014
All VA TOTAL
EMPLOYEES
RACE/ETHNICITY
Hispanic or Latino
Non-Hispanic or Latino
White Black or African American
Asian Native Hawaiian or Other Pacific
Islander
American Indian or Alaska Native
Two or More Races/Undisclosed
All male female male female male female male female male female male female male female male female
Applications Received
Qualified # 13 10 3 0 2 6 0 1 1 1 0 0 0 2 0 0 0
% 100.00% 76.92% 23.08% 0.00% 15.38% 46.15% 0.00% 7.69% 7.69% 7.69% 0.00% 0.00% 0.00% 15.38% 0.00% 0.00% 0.00%
Selected # 0 0 0 0 0 0 0 0 0 0 0 0 0 0 0 0 0
% 0.00% 0.00% 0.00% 0.00% 0.00% 0.00% 0.00% 0.00% 0.00% 0.00% 0.00% 0.00% 0.00% 0.00% 0.00% 0.00% 0.00%
Relevant Applicant Pool % 99.99% 44.20% 55.79% 0.88% 1.08% 37.13% 41.45% 3.73% 9.92% 1.87% 2.95% 0.00% 0.00% 0.49% 0.39% 0.10% 0.00%
0986 Legal Assistance
Total Applications Received
#46 22 24 1 4 6 4 12 13 1 3 0 0 1 0 1 0
Qualified # 16 13 3 1 0 3 1 7 2 0 0 0 0 1 0 1 0
% 100.00% 81.25% 18.75% 6.25% 0.00% 18.75% 6.25% 43.75% 12.50% 0.00% 0.00% 0.00% 0.00% 6.25% 0.00% 6.25% 0.00%
Selected # 2 1 1 0 0 0 0 1 1 0 0 0 0 0 0 0 0
% 100.00% 50.00% 50.00% 0.00% 0.00% 0.00% 0.00% 50.00% 50.00% 0.00% 0.00% 0.00% 0.00% 0.00% 0.00% 0.00% 0.00%
Relevant Applicant Pool % 100.00% 19.23% 80.77% 0.00% 5.13% 11.54% 33.33% 7.69% 41.03% 0.00% 1.28% 0.00% 0.00% 0.00% 0.00% 0.00% 0.00%
0996 Veterans Claims Examining
Total Applications Received
#3,027 1,513 1,514 290 210 628 535 436 646 61 32 8 2 21 22 69 67
Qualified # 1,420 679 741 130 98 292 335 186 252 32 11 5 1 9 13 25 31
% 100.00% 47.82% 52.18% 9.15% 6.90% 20.56% 23.59% 13.10% 17.75% 2.25% 0.77% 0.35% 0.07% 0.63% 0.92% 1.76% 2.18%
Selected # 331 161 170 32 18 88 81 27 50 8 5 1 0 0 3 5 13
% 100.00% 48.64% 51.36% 9.67% 5.44% 26.59% 24.47% 8.16% 15.11% 2.42% 1.51% 0.30% 0.00% 0.00% 0.91% 1.51% 3.93%
Relevant Applicant Pool % 99.98% 48.21% 51.77% 2.93% 2.61% 30.88% 28.84% 11.05% 16.59% 1.58% 1.48% 0.21% 0.08% 1.35% 1.89% 0.21% 0.28%

167
Table A9: SELECTIONS FOR INTERNAL COMPETITIVE PROMOTIONS FOR MAJOR OCCUPATIONS - Permanent and Temporary Workforce - by Race/Ethnicity and Sex - SEP - FY2014
All VA TOTAL
EMPLOYEES
RACE/ETHNICITY
Hispanic or Latino
Non-Hispanic or Latino
White Black or African American
Asian Native Hawaiian or Other Pacific
Islander
American Indian or Alaska Native
Two or More Races/Undisclosed
All male female male female male female male female male female male female male female male female
0998 Claims Assistance and Examining
Total Applications Received
#743 293 450 46 62 133 144 82 207 12 14 3 1 7 6 10 16
Qualified # 206 89 117 17 26 35 35 27 44 4 5 0 0 3 5 3 2
% 100.00% 43.20% 56.80% 8.25% 12.62% 16.99% 16.99% 13.11% 21.36% 1.94% 2.43% 0.00% 0.00% 1.46% 2.43% 1.46% 0.97%
Selected # 38 19 19 1 4 9 9 7 3 1 0 0 0 0 1 1 2
% 100.00% 50.00% 50.00% 2.63% 10.53% 23.68% 23.68% 18.42% 7.89% 2.63% 0.00% 0.00% 0.00% 0.00% 2.63% 2.63% 5.26%
Relevant Applicant Pool % 100.00% 64.14% 35.86% 4.74% 2.01% 31.75% 16.06% 23.91% 15.24% 2.01% 1.37% 0.27% 0.00% 1.19% 0.91% 0.27% 0.27%
1101 General Business and Industry
Total Applications Received
#421 255 166 58 18 98 47 73 88 16 4 1 0 4 1 5 8
Qualified # 103 74 29 17 5 29 7 23 14 2 0 0 0 0 1 3 2
% 100.00% 71.84% 28.16% 16.50% 4.85% 28.16% 6.80% 22.33% 13.59% 1.94% 0.00% 0.00% 0.00% 0.00% 0.97% 2.91% 1.94%
Selected # 6 2 4 0 1 2 1 0 2 0 0 0 0 0 0 0 0
% 100.00% 33.33% 66.67% 0.00% 16.67% 33.33% 16.67% 0.00% 33.33% 0.00% 0.00% 0.00% 0.00% 0.00% 0.00% 0.00% 0.00%
Relevant Applicant Pool % 99.99% 54.96% 45.03% 4.71% 2.54% 36.51% 28.37% 11.70% 11.07% 1.53% 1.78% 0.13% 0.00% 0.38% 0.76% 0.00% 0.51%
1165 Loan Specialist
Total Applications Received
#199 104 95 20 22 42 32 39 34 2 2 0 1 1 4 0 0
Qualified # 44 24 20 2 7 10 7 12 5 0 1 0 0 0 0 0 0
% 100.00% 54.55% 45.45% 4.55% 15.91% 22.73% 15.91% 27.27% 11.36% 0.00% 2.27% 0.00% 0.00% 0.00% 0.00% 0.00% 0.00%
Selected # 16 6 10 1 4 4 2 1 3 0 1 0 0 0 0 0 0
% 100.00% 37.50% 62.50% 6.25% 25.00% 25.00% 12.50% 6.25% 18.75% 0.00% 6.25% 0.00% 0.00% 0.00% 0.00% 0.00% 0.00%

168
Table A9: SELECTIONS FOR INTERNAL COMPETITIVE PROMOTIONS FOR MAJOR OCCUPATIONS - Permanent and Temporary Workforce - by Race/Ethnicity and Sex - SEP - FY2014
All VA TOTAL
EMPLOYEES
RACE/ETHNICITY
Hispanic or Latino
Non-Hispanic or Latino
White Black or African American
Asian Native Hawaiian or Other Pacific
Islander
American Indian or Alaska Native
Two or More Races/Undisclosed
All male female male female male female male female male female male female male female male female
Relevant Applicant Pool % 100.00% 47.57% 52.43% 2.33% 2.75% 31.08% 31.71% 12.05% 16.07% 0.85% 1.48% 0.42% 0.21% 0.42% 0.21% 0.42% 0.00%
1171 Appraising
Total Applications Received
#79 50 29 11 5 21 11 18 9 0 4 0 0 0 0 0 0
Qualified # 23 15 8 0 1 7 3 8 2 0 2 0 0 0 0 0 0
% 100.00% 65.22% 34.78% 0.00% 4.35% 30.43% 13.04% 34.78% 8.70% 0.00% 8.70% 0.00% 0.00% 0.00% 0.00% 0.00% 0.00%
Selected # 5 3 2 0 0 1 1 2 1 0 0 0 0 0 0 0 0
% 100.00% 60.00% 40.00% 0.00% 0.00% 20.00% 20.00% 40.00% 20.00% 0.00% 0.00% 0.00% 0.00% 0.00% 0.00% 0.00% 0.00%
Relevant Applicant Pool % 100.02% 70.88% 29.14% 2.76% 1.97% 52.76% 16.54% 11.42% 9.06% 1.18% 0.39% 0.79% 0.00% 1.97% 0.39% 0.00% 0.79%
1630 Cemetery Administration
Total Applications Received
#209 167 42 37 9 100 16 15 13 1 3 0 0 14 0 0 1
Qualified # 75 58 17 9 3 46 5 1 7 0 2 0 0 2 0 0 0
% 100.00% 77.33% 22.67% 12.00% 4.00% 61.33% 6.67% 1.33% 9.33% 0.00% 2.67% 0.00% 0.00% 2.67% 0.00% 0.00% 0.00%
Selected # 6 3 3 0 0 3 0 0 1 0 2 0 0 0 0 0 0
% 100.00% 50.00% 50.00% 0.00% 0.00% 50.00% 0.00% 0.00% 16.67% 0.00% 33.33% 0.00% 0.00% 0.00% 0.00% 0.00% 0.00%
Relevant Applicant Pool % 99.99% 73.68% 26.31% 2.11% 1.05% 53.68% 12.63% 12.63% 7.37% 1.05% 3.16% 0.00% 0.00% 3.16% 1.05% 1.05% 1.05%
1811 Criminal Investigating
Total Applications Received
#85 68 17 14 5 40 8 11 4 1 0 0 0 1 0 1 0
Qualified # 9 6 3 0 1 4 1 2 1 0 0 0 0 0 0 0 0
% 100.00% 66.67% 33.33% 0.00% 11.11% 44.44% 11.11% 22.22% 11.11% 0.00% 0.00% 0.00% 0.00% 0.00% 0.00% 0.00% 0.00%
Selected # 3 1 2 0 0 1 1 0 1 0 0 0 0 0 0 0 0

169
Table A9: SELECTIONS FOR INTERNAL COMPETITIVE PROMOTIONS FOR MAJOR OCCUPATIONS - Permanent and Temporary Workforce - by Race/Ethnicity and Sex - SEP - FY2014
All VA TOTAL
EMPLOYEES
RACE/ETHNICITY
Hispanic or Latino
Non-Hispanic or Latino
White Black or African American
Asian Native Hawaiian or Other Pacific
Islander
American Indian or Alaska Native
Two or More Races/Undisclosed
All male female male female male female male female male female male female male female male female
% 100.00% 33.33% 66.67% 0.00% 0.00% 33.33% 33.33% 0.00% 33.33% 0.00% 0.00% 0.00% 0.00% 0.00% 0.00% 0.00% 0.00%
Relevant Applicant Pool % 100.00% 93.10% 6.90% 3.45% 0.00% 55.17% 3.45% 27.59% 3.45% 3.45% 0.00% 0.00% 0.00% 1.72% 0.00% 1.72% 0.00%
2210 Information Technology Management
Total Applications Received
#1,939 1,607 332 349 47 692 128 405 127 87 18 6 3 21 5 47 4
Qualified # 861 693 168 149 19 319 70 165 65 35 9 0 1 8 2 17 2
% 100.00% 80.49% 19.51% 17.31% 2.21% 37.05% 8.13% 19.16% 7.55% 4.07% 1.05% 0.00% 0.12% 0.93% 0.23% 1.97% 0.23%
Selected # 67 49 18 8 2 27 10 10 5 3 0 0 0 0 0 1 1
% 100.00% 73.13% 26.87% 11.94% 2.99% 40.30% 14.93% 14.93% 7.46% 4.48% 0.00% 0.00% 0.00% 0.00% 0.00% 1.49% 1.49%
Relevant Applicant Pool % 100.01% 76.20% 23.81% 5.88% 1.31% 51.41% 15.35% 12.77% 5.29% 4.58% 1.51% 0.12% 0.06% 1.12% 0.18% 0.32% 0.11%
4754 Cemetery Caretaking
Total Applications Received
#202 187 15 30 4 106 5 38 6 2 0 1 0 5 0 5 0
Qualified # 63 61 2 7 0 37 1 12 1 1 0 0 0 4 0 0 0
% 100.00% 96.83% 3.17% 11.11% 0.00% 58.73% 1.59% 19.05% 1.59% 1.59% 0.00% 0.00% 0.00% 6.35% 0.00% 0.00% 0.00%
Selected # 6 6 0 1 0 4 0 1 0 0 0 0 0 0 0 0 0
% 100.00% 100.00% 0.00% 16.67% 0.00% 66.67% 0.00% 16.67% 0.00% 0.00% 0.00% 0.00% 0.00% 0.00% 0.00% 0.00% 0.00%
Relevant Applicant Pool % 100.00% 97.33% 2.67% 12.24% 0.63% 64.05% 1.88% 15.38% 0.00% 1.26% 0.00% 1.26% 0.16% 2.83% 0.00% 0.31% 0.00%
Data source: OPM's USA Staffing quarterly data file for VA vacancies filtered by "Date Entered Status" field; includes "Internal Merit Promotion" only. "Relevant Applicant Pool %" data from PAID system; provided as reference only and not for comparative purposes. "Total Application Received" includes volunteered demographic data only.Data shown includes full-time, part-time, and intermittent permanent employees in a pay status and excluding medical and Manila residents.This fixed list of major occupations was identified by the Administration EEO Office.

170
Table B9: SELECTIONS FOR INTERNAL COMPETITIVE PROMOTIONS FOR MAJOR OCCUPATIONS - Permanent Workforce - by Disability - SEP - FY2014
All VA TOTAL Total by Disability Status Detail for Targeted Disabilities
[04,05]No
Disability
[01]Not
Identified
[06-98]ReportableDisability
TotalTargetedDisability
[16,17,18]Hearing
[21,23,25]Vision
[28,30,32-38]Missing
Extremities
[64-69]Partial
Paralysis
[71-79]CompleteParalysis
[82]Epilepsy
[90]Severe
IntellectualDisability
[91]PsychiatricDisability
[92]Dwarfism
0083 Police
Total Applications Received
# *** *** *** *** *** *** *** *** *** *** *** *** *** ***
% *** *** *** *** *** *** *** *** *** *** *** *** *** ***
Qualified # *** *** *** *** *** *** *** *** *** *** *** *** *** ***
% *** *** *** *** *** *** *** *** *** *** *** *** *** ***
Selected # 284 231 15 38 0 0 0 0 0 0 0 0 0 0
% 100.00% 81.34% 05.28% 13.38% 00.00% 00.00% 00.00% 00.00% 00.00% 00.00% 00.00% 00.00% 00.00% 00.00%
Relevant Applicant Pool % *** *** *** *** *** *** *** *** *** *** *** *** *** ***
0101 Social Science
Total Applications Received
# *** *** *** *** *** *** *** *** *** *** *** *** *** ***
% *** *** *** *** *** *** *** *** *** *** *** *** *** ***
Qualified # *** *** *** *** *** *** *** *** *** *** *** *** *** ***
% *** *** *** *** *** *** *** *** *** *** *** *** *** ***
Selected # 69 39 8 22 0 0 0 0 0 0 0 0 0 0
% 100.00% 56.52% 11.59% 31.88% 00.00% 00.00% 00.00% 00.00% 00.00% 00.00% 00.00% 00.00% 00.00% 00.00%
Relevant Applicant Pool % *** *** *** *** *** *** *** *** *** *** *** *** *** ***
0201 Human Resources Management
Total Applications Received
# *** *** *** *** *** *** *** *** *** *** *** *** *** ***
% *** *** *** *** *** *** *** *** *** *** *** *** *** ***
Qualified # *** *** *** *** *** *** *** *** *** *** *** *** *** ***
% *** *** *** *** *** *** *** *** *** *** *** *** *** ***
Selected # 332 261 11 60 13 0 1 1 1 0 4 0 6 0
% 100.00% 78.61% 03.31% 18.07% 03.92% 00.00% 00.30% 00.30% 00.30% 00.00% 01.20% 00.00% 01.81% 00.00%
Relevant Applicant Pool % *** *** *** *** *** *** *** *** *** *** *** *** *** ***
0260 Equal Employment Opportunity
Total Applications Received
# *** *** *** *** *** *** *** *** *** *** *** *** *** ***
% *** *** *** *** *** *** *** *** *** *** *** *** *** ***

171
Table B9: SELECTIONS FOR INTERNAL COMPETITIVE PROMOTIONS FOR MAJOR OCCUPATIONS - Permanent Workforce - by Disability - SEP - FY2014
All VA TOTAL Total by Disability Status Detail for Targeted Disabilities
[04,05]No
Disability
[01]Not
Identified
[06-98]ReportableDisability
TotalTargetedDisability
[16,17,18]Hearing
[21,23,25]Vision
[28,30,32-38]Missing
Extremities
[64-69]Partial
Paralysis
[71-79]CompleteParalysis
[82]Epilepsy
[90]Severe
IntellectualDisability
[91]PsychiatricDisability
[92]Dwarfism
Qualified # *** *** *** *** *** *** *** *** *** *** *** *** *** ***
% *** *** *** *** *** *** *** *** *** *** *** *** *** ***
Selected # 24 16 5 3 0 0 0 0 0 0 0 0 0 0
% 100.00% 66.67% 20.83% 12.50% 00.00% 00.00% 00.00% 00.00% 00.00% 00.00% 00.00% 00.00% 00.00% 00.00%
Relevant Applicant Pool % *** *** *** *** *** *** *** *** *** *** *** *** *** ***
0301 Miscellaneous Administration and Program
Total Applications Received
# *** *** *** *** *** *** *** *** *** *** *** *** *** ***
% *** *** *** *** *** *** *** *** *** *** *** *** *** ***
Qualified # *** *** *** *** *** *** *** *** *** *** *** *** *** ***
% *** *** *** *** *** *** *** *** *** *** *** *** *** ***
Selected # 642 542 26 74 5 0 0 1 0 0 2 0 1 1
% 100.00% 84.42% 04.05% 11.53% 00.78% 00.00% 00.00% 00.16% 00.00% 00.00% 00.31% 00.00% 00.16% 00.16%
Relevant Applicant Pool % *** *** *** *** *** *** *** *** *** *** *** *** *** ***
0340 Program Management
Total Applications Received
# *** *** *** *** *** *** *** *** *** *** *** *** *** ***
% *** *** *** *** *** *** *** *** *** *** *** *** *** ***
Qualified # *** *** *** *** *** *** *** *** *** *** *** *** *** ***
% *** *** *** *** *** *** *** *** *** *** *** *** *** ***
Selected # 96 78 3 15 1 0 0 0 0 0 0 0 1 0
% 100.00% 81.25% 03.13% 15.63% 01.04% 00.00% 00.00% 00.00% 00.00% 00.00% 00.00% 00.00% 01.04% 00.00%
Relevant Applicant Pool % *** *** *** *** *** *** *** *** *** *** *** *** *** ***
0343 Management and Program Analysis
Total Applications Received
# *** *** *** *** *** *** *** *** *** *** *** *** *** ***
% *** *** *** *** *** *** *** *** *** *** *** *** *** ***
Qualified # *** *** *** *** *** *** *** *** *** *** *** *** *** ***
% *** *** *** *** *** *** *** *** *** *** *** *** *** ***
Selected # 526 441 18 67 5 0 0 0 1 0 1 0 3 0

172
Table B9: SELECTIONS FOR INTERNAL COMPETITIVE PROMOTIONS FOR MAJOR OCCUPATIONS - Permanent Workforce - by Disability - SEP - FY2014
All VA TOTAL Total by Disability Status Detail for Targeted Disabilities
[04,05]No
Disability
[01]Not
Identified
[06-98]ReportableDisability
TotalTargetedDisability
[16,17,18]Hearing
[21,23,25]Vision
[28,30,32-38]Missing
Extremities
[64-69]Partial
Paralysis
[71-79]CompleteParalysis
[82]Epilepsy
[90]Severe
IntellectualDisability
[91]PsychiatricDisability
[92]Dwarfism
% 100.00% 83.84% 03.42% 12.74% 00.95% 00.00% 00.00% 00.00% 00.19% 00.00% 00.19% 00.00% 00.57% 00.00%
Relevant Applicant Pool % *** *** *** *** *** *** *** *** *** *** *** *** *** ***
0501 Financial Administration and Program
Total Applications Received
# *** *** *** *** *** *** *** *** *** *** *** *** *** ***
% *** *** *** *** *** *** *** *** *** *** *** *** *** ***
Qualified # *** *** *** *** *** *** *** *** *** *** *** *** *** ***
% *** *** *** *** *** *** *** *** *** *** *** *** *** ***
Selected # 140 117 5 18 2 0 0 0 2 0 0 0 0 0
% 100.00% 83.57% 03.57% 12.86% 01.43% 00.00% 00.00% 00.00% 01.43% 00.00% 00.00% 00.00% 00.00% 00.00%
Relevant Applicant Pool % *** *** *** *** *** *** *** *** *** *** *** *** *** ***
0511 Auditing
Total Applications Received
# *** *** *** *** *** *** *** *** *** *** *** *** *** ***
% *** *** *** *** *** *** *** *** *** *** *** *** *** ***
Qualified # *** *** *** *** *** *** *** *** *** *** *** *** *** ***
% *** *** *** *** *** *** *** *** *** *** *** *** *** ***
Selected # 12 9 1 2 0 0 0 0 0 0 0 0 0 0
% 100.00% 75.00% 08.33% 16.67% 00.00% 00.00% 00.00% 00.00% 00.00% 00.00% 00.00% 00.00% 00.00% 00.00%
Relevant Applicant Pool % *** *** *** *** *** *** *** *** *** *** *** *** *** ***
0602 Medical Officer
Total Applications Received
# *** *** *** *** *** *** *** *** *** *** *** *** *** ***
% *** *** *** *** *** *** *** *** *** *** *** *** *** ***
Qualified # *** *** *** *** *** *** *** *** *** *** *** *** *** ***
% *** *** *** *** *** *** *** *** *** *** *** *** *** ***
Selected # 0 0 0 0 0 0 0 0 0 0 0 0 0 0
% 00.00% 00.00% 00.00% 00.00% 00.00% 00.00% 00.00% 00.00% 00.00% 00.00% 00.00% 00.00% 00.00% 00.00%
Relevant Applicant Pool % *** *** *** *** *** *** *** *** *** *** *** *** *** ***
0610 Nurse

173
Table B9: SELECTIONS FOR INTERNAL COMPETITIVE PROMOTIONS FOR MAJOR OCCUPATIONS - Permanent Workforce - by Disability - SEP - FY2014
All VA TOTAL Total by Disability Status Detail for Targeted Disabilities
[04,05]No
Disability
[01]Not
Identified
[06-98]ReportableDisability
TotalTargetedDisability
[16,17,18]Hearing
[21,23,25]Vision
[28,30,32-38]Missing
Extremities
[64-69]Partial
Paralysis
[71-79]CompleteParalysis
[82]Epilepsy
[90]Severe
IntellectualDisability
[91]PsychiatricDisability
[92]Dwarfism
Total Applications Received
# *** *** *** *** *** *** *** *** *** *** *** *** *** ***
% *** *** *** *** *** *** *** *** *** *** *** *** *** ***
Qualified # *** *** *** *** *** *** *** *** *** *** *** *** *** ***
% *** *** *** *** *** *** *** *** *** *** *** *** *** ***
Selected # 3 1 2 0 0 0 0 0 0 0 0 0 0 0
% 100.00% 33.33% 66.67% 00.00% 00.00% 00.00% 00.00% 00.00% 00.00% 00.00% 00.00% 00.00% 00.00% 00.00%
Relevant Applicant Pool % *** *** *** *** *** *** *** *** *** *** *** *** *** ***
0620 Practical Nurse
Total Applications Received
# *** *** *** *** *** *** *** *** *** *** *** *** *** ***
% *** *** *** *** *** *** *** *** *** *** *** *** *** ***
Qualified # *** *** *** *** *** *** *** *** *** *** *** *** *** ***
% *** *** *** *** *** *** *** *** *** *** *** *** *** ***
Selected # 8 6 0 2 0 0 0 0 0 0 0 0 0 0
% 100.00% 75.00% 00.00% 25.00% 00.00% 00.00% 00.00% 00.00% 00.00% 00.00% 00.00% 00.00% 00.00% 00.00%
Relevant Applicant Pool % *** *** *** *** *** *** *** *** *** *** *** *** *** ***
0621 Nursing Assistant
Total Applications Received
# *** *** *** *** *** *** *** *** *** *** *** *** *** ***
% *** *** *** *** *** *** *** *** *** *** *** *** *** ***
Qualified # *** *** *** *** *** *** *** *** *** *** *** *** *** ***
% *** *** *** *** *** *** *** *** *** *** *** *** *** ***
Selected # 2 2 0 0 0 0 0 0 0 0 0 0 0 0
% 100.00% 100.00% 00.00% 00.00% 00.00% 00.00% 00.00% 00.00% 00.00% 00.00% 00.00% 00.00% 00.00% 00.00%
Relevant Applicant Pool % *** *** *** *** *** *** *** *** *** *** *** *** *** ***
0644 Medical Technologist
Total Applications Received
# *** *** *** *** *** *** *** *** *** *** *** *** *** ***
% *** *** *** *** *** *** *** *** *** *** *** *** *** ***
Qualified # *** *** *** *** *** *** *** *** *** *** *** *** *** ***

174
Table B9: SELECTIONS FOR INTERNAL COMPETITIVE PROMOTIONS FOR MAJOR OCCUPATIONS - Permanent Workforce - by Disability - SEP - FY2014
All VA TOTAL Total by Disability Status Detail for Targeted Disabilities
[04,05]No
Disability
[01]Not
Identified
[06-98]ReportableDisability
TotalTargetedDisability
[16,17,18]Hearing
[21,23,25]Vision
[28,30,32-38]Missing
Extremities
[64-69]Partial
Paralysis
[71-79]CompleteParalysis
[82]Epilepsy
[90]Severe
IntellectualDisability
[91]PsychiatricDisability
[92]Dwarfism
% *** *** *** *** *** *** *** *** *** *** *** *** *** ***
Selected # 19 18 1 0 0 0 0 0 0 0 0 0 0 0
% 100.00% 94.74% 05.26% 00.00% 00.00% 00.00% 00.00% 00.00% 00.00% 00.00% 00.00% 00.00% 00.00% 00.00%
Relevant Applicant Pool % *** *** *** *** *** *** *** *** *** *** *** *** *** ***
0647 Diagnostic Radiologic Technologist
Total Applications Received
# *** *** *** *** *** *** *** *** *** *** *** *** *** ***
% *** *** *** *** *** *** *** *** *** *** *** *** *** ***
Qualified # *** *** *** *** *** *** *** *** *** *** *** *** *** ***
% *** *** *** *** *** *** *** *** *** *** *** *** *** ***
Selected # 3 2 0 1 0 0 0 0 0 0 0 0 0 0
% 100.00% 66.67% 00.00% 33.33% 00.00% 00.00% 00.00% 00.00% 00.00% 00.00% 00.00% 00.00% 00.00% 00.00%
Relevant Applicant Pool % *** *** *** *** *** *** *** *** *** *** *** *** *** ***
0660 Pharmacist
Total Applications Received
# *** *** *** *** *** *** *** *** *** *** *** *** *** ***
% *** *** *** *** *** *** *** *** *** *** *** *** *** ***
Qualified # *** *** *** *** *** *** *** *** *** *** *** *** *** ***
% *** *** *** *** *** *** *** *** *** *** *** *** *** ***
Selected # 3 2 0 1 0 0 0 0 0 0 0 0 0 0
% 100.00% 66.67% 00.00% 33.33% 00.00% 00.00% 00.00% 00.00% 00.00% 00.00% 00.00% 00.00% 00.00% 00.00%
Relevant Applicant Pool % *** *** *** *** *** *** *** *** *** *** *** *** *** ***
0675 Medical Records Technician
Total Applications Received
# *** *** *** *** *** *** *** *** *** *** *** *** *** ***
% *** *** *** *** *** *** *** *** *** *** *** *** *** ***
Qualified # *** *** *** *** *** *** *** *** *** *** *** *** *** ***
% *** *** *** *** *** *** *** *** *** *** *** *** *** ***
Selected # 11 6 0 5 0 0 0 0 0 0 0 0 0 0
% 100.00% 54.55% 00.00% 45.45% 00.00% 00.00% 00.00% 00.00% 00.00% 00.00% 00.00% 00.00% 00.00% 00.00%

175
Table B9: SELECTIONS FOR INTERNAL COMPETITIVE PROMOTIONS FOR MAJOR OCCUPATIONS - Permanent Workforce - by Disability - SEP - FY2014
All VA TOTAL Total by Disability Status Detail for Targeted Disabilities
[04,05]No
Disability
[01]Not
Identified
[06-98]ReportableDisability
TotalTargetedDisability
[16,17,18]Hearing
[21,23,25]Vision
[28,30,32-38]Missing
Extremities
[64-69]Partial
Paralysis
[71-79]CompleteParalysis
[82]Epilepsy
[90]Severe
IntellectualDisability
[91]PsychiatricDisability
[92]Dwarfism
Relevant Applicant Pool % *** *** *** *** *** *** *** *** *** *** *** *** *** ***
0905 General Attorney
Total Applications Received
# *** *** *** *** *** *** *** *** *** *** *** *** *** ***
% *** *** *** *** *** *** *** *** *** *** *** *** *** ***
Qualified # *** *** *** *** *** *** *** *** *** *** *** *** *** ***
% *** *** *** *** *** *** *** *** *** *** *** *** *** ***
Selected # 2 2 0 0 0 0 0 0 0 0 0 0 0 0
% 100.00% 100.00% 00.00% 00.00% 00.00% 00.00% 00.00% 00.00% 00.00% 00.00% 00.00% 00.00% 00.00% 00.00%
Relevant Applicant Pool % *** *** *** *** *** *** *** *** *** *** *** *** *** ***
0986 Legal Assistance
Total Applications Received
# *** *** *** *** *** *** *** *** *** *** *** *** *** ***
% *** *** *** *** *** *** *** *** *** *** *** *** *** ***
Qualified # *** *** *** *** *** *** *** *** *** *** *** *** *** ***
% *** *** *** *** *** *** *** *** *** *** *** *** *** ***
Selected # 7 7 0 0 0 0 0 0 0 0 0 0 0 0
% 100.00% 100.00% 00.00% 00.00% 00.00% 00.00% 00.00% 00.00% 00.00% 00.00% 00.00% 00.00% 00.00% 00.00%
Relevant Applicant Pool % *** *** *** *** *** *** *** *** *** *** *** *** *** ***
0996 Veterans Claims Examining
Total Applications Received
# *** *** *** *** *** *** *** *** *** *** *** *** *** ***
% *** *** *** *** *** *** *** *** *** *** *** *** *** ***
Qualified # *** *** *** *** *** *** *** *** *** *** *** *** *** ***
% *** *** *** *** *** *** *** *** *** *** *** *** *** ***
Selected # 656 524 24 108 11 0 0 1 2 0 0 0 8 0
% 100.00% 79.88% 03.66% 16.46% 01.68% 00.00% 00.00% 00.15% 00.30% 00.00% 00.00% 00.00% 01.22% 00.00%
Relevant Applicant Pool % *** *** *** *** *** *** *** *** *** *** *** *** *** ***
0998 Claims Assistance and Examining
Total Applications # *** *** *** *** *** *** *** *** *** *** *** *** *** ***

176
Table B9: SELECTIONS FOR INTERNAL COMPETITIVE PROMOTIONS FOR MAJOR OCCUPATIONS - Permanent Workforce - by Disability - SEP - FY2014
All VA TOTAL Total by Disability Status Detail for Targeted Disabilities
[04,05]No
Disability
[01]Not
Identified
[06-98]ReportableDisability
TotalTargetedDisability
[16,17,18]Hearing
[21,23,25]Vision
[28,30,32-38]Missing
Extremities
[64-69]Partial
Paralysis
[71-79]CompleteParalysis
[82]Epilepsy
[90]Severe
IntellectualDisability
[91]PsychiatricDisability
[92]Dwarfism
Received % *** *** *** *** *** *** *** *** *** *** *** *** *** ***
Qualified # *** *** *** *** *** *** *** *** *** *** *** *** *** ***
% *** *** *** *** *** *** *** *** *** *** *** *** *** ***
Selected # 142 86 9 47 5 0 0 0 1 0 2 0 2 0
% 100.00% 60.56% 06.34% 33.10% 03.52% 00.00% 00.00% 00.00% 00.70% 00.00% 01.41% 00.00% 01.41% 00.00%
Relevant Applicant Pool % *** *** *** *** *** *** *** *** *** *** *** *** *** ***
1101 General Business and Industry
Total Applications Received
# *** *** *** *** *** *** *** *** *** *** *** *** *** ***
% *** *** *** *** *** *** *** *** *** *** *** *** *** ***
Qualified # *** *** *** *** *** *** *** *** *** *** *** *** *** ***
% *** *** *** *** *** *** *** *** *** *** *** *** *** ***
Selected # 53 46 2 5 1 0 0 0 0 0 1 0 0 0
% 100.00% 86.79% 03.77% 09.43% 01.89% 00.00% 00.00% 00.00% 00.00% 00.00% 01.89% 00.00% 00.00% 00.00%
Relevant Applicant Pool % *** *** *** *** *** *** *** *** *** *** *** *** *** ***
1165 Loan Specialist
Total Applications Received
# *** *** *** *** *** *** *** *** *** *** *** *** *** ***
% *** *** *** *** *** *** *** *** *** *** *** *** *** ***
Qualified # *** *** *** *** *** *** *** *** *** *** *** *** *** ***
% *** *** *** *** *** *** *** *** *** *** *** *** *** ***
Selected # 17 15 0 2 0 0 0 0 0 0 0 0 0 0
% 100.00% 88.24% 00.00% 11.76% 00.00% 00.00% 00.00% 00.00% 00.00% 00.00% 00.00% 00.00% 00.00% 00.00%
Relevant Applicant Pool % *** *** *** *** *** *** *** *** *** *** *** *** *** ***
1171 Appraising
Total Applications Received
# *** *** *** *** *** *** *** *** *** *** *** *** *** ***
% *** *** *** *** *** *** *** *** *** *** *** *** *** ***
Qualified # *** *** *** *** *** *** *** *** *** *** *** *** *** ***
% *** *** *** *** *** *** *** *** *** *** *** *** *** ***

177
Table B9: SELECTIONS FOR INTERNAL COMPETITIVE PROMOTIONS FOR MAJOR OCCUPATIONS - Permanent Workforce - by Disability - SEP - FY2014
All VA TOTAL Total by Disability Status Detail for Targeted Disabilities
[04,05]No
Disability
[01]Not
Identified
[06-98]ReportableDisability
TotalTargetedDisability
[16,17,18]Hearing
[21,23,25]Vision
[28,30,32-38]Missing
Extremities
[64-69]Partial
Paralysis
[71-79]CompleteParalysis
[82]Epilepsy
[90]Severe
IntellectualDisability
[91]PsychiatricDisability
[92]Dwarfism
Selected # 14 9 3 2 0 0 0 0 0 0 0 0 0 0
% 100.00% 64.29% 21.43% 14.29% 00.00% 00.00% 00.00% 00.00% 00.00% 00.00% 00.00% 00.00% 00.00% 00.00%
Relevant Applicant Pool % *** *** *** *** *** *** *** *** *** *** *** *** *** ***
1630 Cemetery Administration
Total Applications Received
# *** *** *** *** *** *** *** *** *** *** *** *** *** ***
% *** *** *** *** *** *** *** *** *** *** *** *** *** ***
Qualified # *** *** *** *** *** *** *** *** *** *** *** *** *** ***
% *** *** *** *** *** *** *** *** *** *** *** *** *** ***
Selected # 20 12 1 7 1 0 0 0 0 0 0 0 1 0
% 100.00% 60.00% 05.00% 35.00% 05.00% 00.00% 00.00% 00.00% 00.00% 00.00% 00.00% 00.00% 05.00% 00.00%
Relevant Applicant Pool % *** *** *** *** *** *** *** *** *** *** *** *** *** ***
1811 Criminal Investigating
Total Applications Received
# *** *** *** *** *** *** *** *** *** *** *** *** *** ***
% *** *** *** *** *** *** *** *** *** *** *** *** *** ***
Qualified # *** *** *** *** *** *** *** *** *** *** *** *** *** ***
% *** *** *** *** *** *** *** *** *** *** *** *** *** ***
Selected # 11 9 0 2 0 0 0 0 0 0 0 0 0 0
% 100.00% 81.82% 00.00% 18.18% 00.00% 00.00% 00.00% 00.00% 00.00% 00.00% 00.00% 00.00% 00.00% 00.00%
Relevant Applicant Pool % *** *** *** *** *** *** *** *** *** *** *** *** *** ***
2210 Information Technology Management
Total Applications Received
# *** *** *** *** *** *** *** *** *** *** *** *** *** ***
% *** *** *** *** *** *** *** *** *** *** *** *** *** ***
Qualified # *** *** *** *** *** *** *** *** *** *** *** *** *** ***
% *** *** *** *** *** *** *** *** *** *** *** *** *** ***
Selected # 212 163 8 41 2 0 0 0 0 0 0 0 2 0
% 100.00% 76.89% 03.77% 19.34% 00.94% 00.00% 00.00% 00.00% 00.00% 00.00% 00.00% 00.00% 00.94% 00.00%
Relevant Applicant Pool % *** *** *** *** *** *** *** *** *** *** *** *** *** ***

178
Table B9: SELECTIONS FOR INTERNAL COMPETITIVE PROMOTIONS FOR MAJOR OCCUPATIONS - Permanent Workforce - by Disability - SEP - FY2014
All VA TOTAL Total by Disability Status Detail for Targeted Disabilities
[04,05]No
Disability
[01]Not
Identified
[06-98]ReportableDisability
TotalTargetedDisability
[16,17,18]Hearing
[21,23,25]Vision
[28,30,32-38]Missing
Extremities
[64-69]Partial
Paralysis
[71-79]CompleteParalysis
[82]Epilepsy
[90]Severe
IntellectualDisability
[91]PsychiatricDisability
[92]Dwarfism
4754 Cemetery Caretaking
Total Applications Received
# *** *** *** *** *** *** *** *** *** *** *** *** *** ***
% *** *** *** *** *** *** *** *** *** *** *** *** *** ***
Qualified # *** *** *** *** *** *** *** *** *** *** *** *** *** ***
% *** *** *** *** *** *** *** *** *** *** *** *** *** ***
Selected # 65 37 2 26 6 0 0 0 0 0 0 0 6 0
% 100.00% 56.92% 03.08% 40.00% 09.23% 00.00% 00.00% 00.00% 00.00% 00.00% 00.00% 00.00% 09.23% 00.00%
Relevant Applicant Pool % *** *** *** *** *** *** *** *** *** *** *** *** *** ***Data shown includes full-time, part-time, and intermittent permanent employees in a pay status and excluding medical and Manila residents.This fixed list of major occupations was identified by the Administration EEO Office.

179
Table B9: SELECTIONS FOR INTERNAL COMPETITIVE PROMOTIONS FOR MAJOR OCCUPATIONS - Temporary Workforce - by Disability - SEP - FY2014
All VA TOTAL Total by Disability Status Detail for Targeted Disabilities
[04,05]No
Disability
[01]Not
Identified
[06-98]ReportableDisability
TotalTargetedDisability
[16,17,18]Hearing
[21,23,25]Vision
[28,30,32-38]Missing
Extremities
[64-69]Partial
Paralysis
[71-79]CompleteParalysis
[82]Epilepsy
[90]Severe
IntellectualDisability
[91]PsychiatricDisability
[92]Dwarfism
0083 Police
Total Applications Received
# *** *** *** *** *** *** *** *** *** *** *** *** *** ***
% *** *** *** *** *** *** *** *** *** *** *** *** *** ***
Qualified # *** *** *** *** *** *** *** *** *** *** *** *** *** ***
% *** *** *** *** *** *** *** *** *** *** *** *** *** ***
Selected # 0 0 0 0 0 0 0 0 0 0 0 0 0 0
% 00.00% 00.00% 00.00% 00.00% 00.00% 00.00% 00.00% 00.00% 00.00% 00.00% 00.00% 00.00% 00.00% 00.00%
Relevant Applicant Pool % *** *** *** *** *** *** *** *** *** *** *** *** *** ***
0101 Social Science
Total Applications Received
# *** *** *** *** *** *** *** *** *** *** *** *** *** ***
% *** *** *** *** *** *** *** *** *** *** *** *** *** ***
Qualified # *** *** *** *** *** *** *** *** *** *** *** *** *** ***
% *** *** *** *** *** *** *** *** *** *** *** *** *** ***
Selected # 0 0 0 0 0 0 0 0 0 0 0 0 0 0
% 00.00% 00.00% 00.00% 00.00% 00.00% 00.00% 00.00% 00.00% 00.00% 00.00% 00.00% 00.00% 00.00% 00.00%
Relevant Applicant Pool % *** *** *** *** *** *** *** *** *** *** *** *** *** ***
0201 Human Resources Management
Total Applications Received
# *** *** *** *** *** *** *** *** *** *** *** *** *** ***
% *** *** *** *** *** *** *** *** *** *** *** *** *** ***
Qualified # *** *** *** *** *** *** *** *** *** *** *** *** *** ***
% *** *** *** *** *** *** *** *** *** *** *** *** *** ***
Selected # 0 0 0 0 0 0 0 0 0 0 0 0 0 0
% 00.00% 00.00% 00.00% 00.00% 00.00% 00.00% 00.00% 00.00% 00.00% 00.00% 00.00% 00.00% 00.00% 00.00%
Relevant Applicant Pool % *** *** *** *** *** *** *** *** *** *** *** *** *** ***
0260 Equal Employment Opportunity
Total Applications Received
# *** *** *** *** *** *** *** *** *** *** *** *** *** ***
% *** *** *** *** *** *** *** *** *** *** *** *** *** ***

180
Table B9: SELECTIONS FOR INTERNAL COMPETITIVE PROMOTIONS FOR MAJOR OCCUPATIONS - Temporary Workforce - by Disability - SEP - FY2014
All VA TOTAL Total by Disability Status Detail for Targeted Disabilities
[04,05]No
Disability
[01]Not
Identified
[06-98]ReportableDisability
TotalTargetedDisability
[16,17,18]Hearing
[21,23,25]Vision
[28,30,32-38]Missing
Extremities
[64-69]Partial
Paralysis
[71-79]CompleteParalysis
[82]Epilepsy
[90]Severe
IntellectualDisability
[91]PsychiatricDisability
[92]Dwarfism
Qualified # *** *** *** *** *** *** *** *** *** *** *** *** *** ***
% *** *** *** *** *** *** *** *** *** *** *** *** *** ***
Selected # 0 0 0 0 0 0 0 0 0 0 0 0 0 0
% 00.00% 00.00% 00.00% 00.00% 00.00% 00.00% 00.00% 00.00% 00.00% 00.00% 00.00% 00.00% 00.00% 00.00%
Relevant Applicant Pool % *** *** *** *** *** *** *** *** *** *** *** *** *** ***
0301 Miscellaneous Administration and Program
Total Applications Received
# *** *** *** *** *** *** *** *** *** *** *** *** *** ***
% *** *** *** *** *** *** *** *** *** *** *** *** *** ***
Qualified # *** *** *** *** *** *** *** *** *** *** *** *** *** ***
% *** *** *** *** *** *** *** *** *** *** *** *** *** ***
Selected # 3 1 0 2 0 0 0 0 0 0 0 0 0 0
% 100.00% 33.33% 00.00% 66.67% 00.00% 00.00% 00.00% 00.00% 00.00% 00.00% 00.00% 00.00% 00.00% 00.00%
Relevant Applicant Pool % *** *** *** *** *** *** *** *** *** *** *** *** *** ***
0340 Program Management
Total Applications Received
# *** *** *** *** *** *** *** *** *** *** *** *** *** ***
% *** *** *** *** *** *** *** *** *** *** *** *** *** ***
Qualified # *** *** *** *** *** *** *** *** *** *** *** *** *** ***
% *** *** *** *** *** *** *** *** *** *** *** *** *** ***
Selected # 3 2 0 1 0 0 0 0 0 0 0 0 0 0
% 100.00% 66.67% 00.00% 33.33% 00.00% 00.00% 00.00% 00.00% 00.00% 00.00% 00.00% 00.00% 00.00% 00.00%
Relevant Applicant Pool % *** *** *** *** *** *** *** *** *** *** *** *** *** ***
0343 Management and Program Analysis
Total Applications Received
# *** *** *** *** *** *** *** *** *** *** *** *** *** ***
% *** *** *** *** *** *** *** *** *** *** *** *** *** ***
Qualified # *** *** *** *** *** *** *** *** *** *** *** *** *** ***
% *** *** *** *** *** *** *** *** *** *** *** *** *** ***
Selected # 0 0 0 0 0 0 0 0 0 0 0 0 0 0

181
Table B9: SELECTIONS FOR INTERNAL COMPETITIVE PROMOTIONS FOR MAJOR OCCUPATIONS - Temporary Workforce - by Disability - SEP - FY2014
All VA TOTAL Total by Disability Status Detail for Targeted Disabilities
[04,05]No
Disability
[01]Not
Identified
[06-98]ReportableDisability
TotalTargetedDisability
[16,17,18]Hearing
[21,23,25]Vision
[28,30,32-38]Missing
Extremities
[64-69]Partial
Paralysis
[71-79]CompleteParalysis
[82]Epilepsy
[90]Severe
IntellectualDisability
[91]PsychiatricDisability
[92]Dwarfism
% 00.00% 00.00% 00.00% 00.00% 00.00% 00.00% 00.00% 00.00% 00.00% 00.00% 00.00% 00.00% 00.00% 00.00%
Relevant Applicant Pool % *** *** *** *** *** *** *** *** *** *** *** *** *** ***
0501 Financial Administration and Program
Total Applications Received
# *** *** *** *** *** *** *** *** *** *** *** *** *** ***
% *** *** *** *** *** *** *** *** *** *** *** *** *** ***
Qualified # *** *** *** *** *** *** *** *** *** *** *** *** *** ***
% *** *** *** *** *** *** *** *** *** *** *** *** *** ***
Selected # 0 0 0 0 0 0 0 0 0 0 0 0 0 0
% 00.00% 00.00% 00.00% 00.00% 00.00% 00.00% 00.00% 00.00% 00.00% 00.00% 00.00% 00.00% 00.00% 00.00%
Relevant Applicant Pool % *** *** *** *** *** *** *** *** *** *** *** *** *** ***
0511 Auditing
Total Applications Received
# *** *** *** *** *** *** *** *** *** *** *** *** *** ***
% *** *** *** *** *** *** *** *** *** *** *** *** *** ***
Qualified # *** *** *** *** *** *** *** *** *** *** *** *** *** ***
% *** *** *** *** *** *** *** *** *** *** *** *** *** ***
Selected # 0 0 0 0 0 0 0 0 0 0 0 0 0 0
% 00.00% 00.00% 00.00% 00.00% 00.00% 00.00% 00.00% 00.00% 00.00% 00.00% 00.00% 00.00% 00.00% 00.00%
Relevant Applicant Pool % *** *** *** *** *** *** *** *** *** *** *** *** *** ***
0602 Medical Officer
Total Applications Received
# *** *** *** *** *** *** *** *** *** *** *** *** *** ***
% *** *** *** *** *** *** *** *** *** *** *** *** *** ***
Qualified # *** *** *** *** *** *** *** *** *** *** *** *** *** ***
% *** *** *** *** *** *** *** *** *** *** *** *** *** ***
Selected # 0 0 0 0 0 0 0 0 0 0 0 0 0 0
% 00.00% 00.00% 00.00% 00.00% 00.00% 00.00% 00.00% 00.00% 00.00% 00.00% 00.00% 00.00% 00.00% 00.00%
Relevant Applicant Pool % *** *** *** *** *** *** *** *** *** *** *** *** *** ***
0610 Nurse
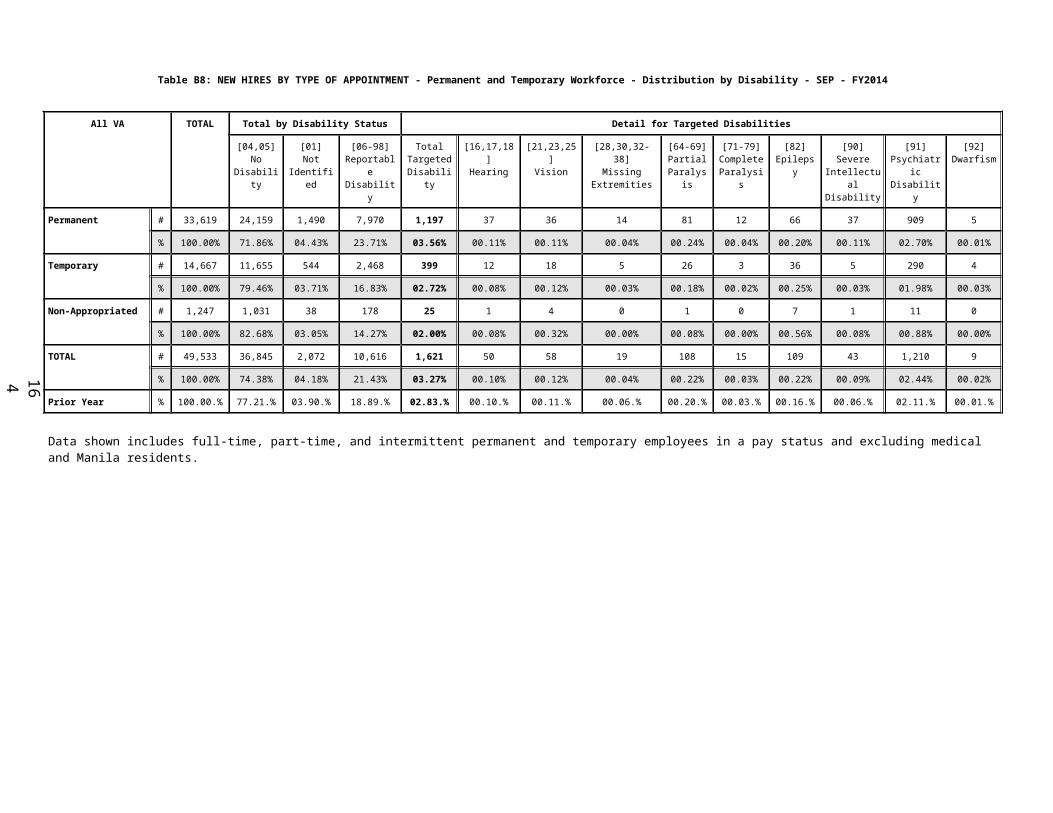
182
Table B9: SELECTIONS FOR INTERNAL COMPETITIVE PROMOTIONS FOR MAJOR OCCUPATIONS - Temporary Workforce - by Disability - SEP - FY2014
All VA TOTAL Total by Disability Status Detail for Targeted Disabilities
[04,05]No
Disability
[01]Not
Identified
[06-98]ReportableDisability
TotalTargetedDisability
[16,17,18]Hearing
[21,23,25]Vision
[28,30,32-38]Missing
Extremities
[64-69]Partial
Paralysis
[71-79]CompleteParalysis
[82]Epilepsy
[90]Severe
IntellectualDisability
[91]PsychiatricDisability
[92]Dwarfism
Total Applications Received
# *** *** *** *** *** *** *** *** *** *** *** *** *** ***
% *** *** *** *** *** *** *** *** *** *** *** *** *** ***
Qualified # *** *** *** *** *** *** *** *** *** *** *** *** *** ***
% *** *** *** *** *** *** *** *** *** *** *** *** *** ***
Selected # 0 0 0 0 0 0 0 0 0 0 0 0 0 0
% 00.00% 00.00% 00.00% 00.00% 00.00% 00.00% 00.00% 00.00% 00.00% 00.00% 00.00% 00.00% 00.00% 00.00%
Relevant Applicant Pool % *** *** *** *** *** *** *** *** *** *** *** *** *** ***
0620 Practical Nurse
Total Applications Received
# *** *** *** *** *** *** *** *** *** *** *** *** *** ***
% *** *** *** *** *** *** *** *** *** *** *** *** *** ***
Qualified # *** *** *** *** *** *** *** *** *** *** *** *** *** ***
% *** *** *** *** *** *** *** *** *** *** *** *** *** ***
Selected # 0 0 0 0 0 0 0 0 0 0 0 0 0 0
% 00.00% 00.00% 00.00% 00.00% 00.00% 00.00% 00.00% 00.00% 00.00% 00.00% 00.00% 00.00% 00.00% 00.00%
Relevant Applicant Pool % *** *** *** *** *** *** *** *** *** *** *** *** *** ***
0621 Nursing Assistant
Total Applications Received
# *** *** *** *** *** *** *** *** *** *** *** *** *** ***
% *** *** *** *** *** *** *** *** *** *** *** *** *** ***
Qualified # *** *** *** *** *** *** *** *** *** *** *** *** *** ***
% *** *** *** *** *** *** *** *** *** *** *** *** *** ***
Selected # 0 0 0 0 0 0 0 0 0 0 0 0 0 0
% 00.00% 00.00% 00.00% 00.00% 00.00% 00.00% 00.00% 00.00% 00.00% 00.00% 00.00% 00.00% 00.00% 00.00%
Relevant Applicant Pool % *** *** *** *** *** *** *** *** *** *** *** *** *** ***
0644 Medical Technologist
Total Applications Received
# *** *** *** *** *** *** *** *** *** *** *** *** *** ***
% *** *** *** *** *** *** *** *** *** *** *** *** *** ***
Qualified # *** *** *** *** *** *** *** *** *** *** *** *** *** ***

183
Table B9: SELECTIONS FOR INTERNAL COMPETITIVE PROMOTIONS FOR MAJOR OCCUPATIONS - Temporary Workforce - by Disability - SEP - FY2014
All VA TOTAL Total by Disability Status Detail for Targeted Disabilities
[04,05]No
Disability
[01]Not
Identified
[06-98]ReportableDisability
TotalTargetedDisability
[16,17,18]Hearing
[21,23,25]Vision
[28,30,32-38]Missing
Extremities
[64-69]Partial
Paralysis
[71-79]CompleteParalysis
[82]Epilepsy
[90]Severe
IntellectualDisability
[91]PsychiatricDisability
[92]Dwarfism
% *** *** *** *** *** *** *** *** *** *** *** *** *** ***
Selected # 0 0 0 0 0 0 0 0 0 0 0 0 0 0
% 00.00% 00.00% 00.00% 00.00% 00.00% 00.00% 00.00% 00.00% 00.00% 00.00% 00.00% 00.00% 00.00% 00.00%
Relevant Applicant Pool % *** *** *** *** *** *** *** *** *** *** *** *** *** ***
0647 Diagnostic Radiologic Technologist
Total Applications Received
# *** *** *** *** *** *** *** *** *** *** *** *** *** ***
% *** *** *** *** *** *** *** *** *** *** *** *** *** ***
Qualified # *** *** *** *** *** *** *** *** *** *** *** *** *** ***
% *** *** *** *** *** *** *** *** *** *** *** *** *** ***
Selected # 0 0 0 0 0 0 0 0 0 0 0 0 0 0
% 00.00% 00.00% 00.00% 00.00% 00.00% 00.00% 00.00% 00.00% 00.00% 00.00% 00.00% 00.00% 00.00% 00.00%
Relevant Applicant Pool % *** *** *** *** *** *** *** *** *** *** *** *** *** ***
0660 Pharmacist
Total Applications Received
# *** *** *** *** *** *** *** *** *** *** *** *** *** ***
% *** *** *** *** *** *** *** *** *** *** *** *** *** ***
Qualified # *** *** *** *** *** *** *** *** *** *** *** *** *** ***
% *** *** *** *** *** *** *** *** *** *** *** *** *** ***
Selected # 0 0 0 0 0 0 0 0 0 0 0 0 0 0
% 00.00% 00.00% 00.00% 00.00% 00.00% 00.00% 00.00% 00.00% 00.00% 00.00% 00.00% 00.00% 00.00% 00.00%
Relevant Applicant Pool % *** *** *** *** *** *** *** *** *** *** *** *** *** ***
0675 Medical Records Technician
Total Applications Received
# *** *** *** *** *** *** *** *** *** *** *** *** *** ***
% *** *** *** *** *** *** *** *** *** *** *** *** *** ***
Qualified # *** *** *** *** *** *** *** *** *** *** *** *** *** ***
% *** *** *** *** *** *** *** *** *** *** *** *** *** ***
Selected # 0 0 0 0 0 0 0 0 0 0 0 0 0 0
% 00.00% 00.00% 00.00% 00.00% 00.00% 00.00% 00.00% 00.00% 00.00% 00.00% 00.00% 00.00% 00.00% 00.00%

184
Table B9: SELECTIONS FOR INTERNAL COMPETITIVE PROMOTIONS FOR MAJOR OCCUPATIONS - Temporary Workforce - by Disability - SEP - FY2014
All VA TOTAL Total by Disability Status Detail for Targeted Disabilities
[04,05]No
Disability
[01]Not
Identified
[06-98]ReportableDisability
TotalTargetedDisability
[16,17,18]Hearing
[21,23,25]Vision
[28,30,32-38]Missing
Extremities
[64-69]Partial
Paralysis
[71-79]CompleteParalysis
[82]Epilepsy
[90]Severe
IntellectualDisability
[91]PsychiatricDisability
[92]Dwarfism
Relevant Applicant Pool % *** *** *** *** *** *** *** *** *** *** *** *** *** ***
0905 General Attorney
Total Applications Received
# *** *** *** *** *** *** *** *** *** *** *** *** *** ***
% *** *** *** *** *** *** *** *** *** *** *** *** *** ***
Qualified # *** *** *** *** *** *** *** *** *** *** *** *** *** ***
% *** *** *** *** *** *** *** *** *** *** *** *** *** ***
Selected # 0 0 0 0 0 0 0 0 0 0 0 0 0 0
% 00.00% 00.00% 00.00% 00.00% 00.00% 00.00% 00.00% 00.00% 00.00% 00.00% 00.00% 00.00% 00.00% 00.00%
Relevant Applicant Pool % *** *** *** *** *** *** *** *** *** *** *** *** *** ***
0986 Legal Assistance
Total Applications Received
# *** *** *** *** *** *** *** *** *** *** *** *** *** ***
% *** *** *** *** *** *** *** *** *** *** *** *** *** ***
Qualified # *** *** *** *** *** *** *** *** *** *** *** *** *** ***
% *** *** *** *** *** *** *** *** *** *** *** *** *** ***
Selected # 0 0 0 0 0 0 0 0 0 0 0 0 0 0
% 00.00% 00.00% 00.00% 00.00% 00.00% 00.00% 00.00% 00.00% 00.00% 00.00% 00.00% 00.00% 00.00% 00.00%
Relevant Applicant Pool % *** *** *** *** *** *** *** *** *** *** *** *** *** ***
0996 Veterans Claims Examining
Total Applications Received
# *** *** *** *** *** *** *** *** *** *** *** *** *** ***
% *** *** *** *** *** *** *** *** *** *** *** *** *** ***
Qualified # *** *** *** *** *** *** *** *** *** *** *** *** *** ***
% *** *** *** *** *** *** *** *** *** *** *** *** *** ***
Selected # 0 0 0 0 0 0 0 0 0 0 0 0 0 0
% 00.00% 00.00% 00.00% 00.00% 00.00% 00.00% 00.00% 00.00% 00.00% 00.00% 00.00% 00.00% 00.00% 00.00%
Relevant Applicant Pool % *** *** *** *** *** *** *** *** *** *** *** *** *** ***
0998 Claims Assistance and Examining
Total Applications # *** *** *** *** *** *** *** *** *** *** *** *** *** ***

185
Table B9: SELECTIONS FOR INTERNAL COMPETITIVE PROMOTIONS FOR MAJOR OCCUPATIONS - Temporary Workforce - by Disability - SEP - FY2014
All VA TOTAL Total by Disability Status Detail for Targeted Disabilities
[04,05]No
Disability
[01]Not
Identified
[06-98]ReportableDisability
TotalTargetedDisability
[16,17,18]Hearing
[21,23,25]Vision
[28,30,32-38]Missing
Extremities
[64-69]Partial
Paralysis
[71-79]CompleteParalysis
[82]Epilepsy
[90]Severe
IntellectualDisability
[91]PsychiatricDisability
[92]Dwarfism
Received % *** *** *** *** *** *** *** *** *** *** *** *** *** ***
Qualified # *** *** *** *** *** *** *** *** *** *** *** *** *** ***
% *** *** *** *** *** *** *** *** *** *** *** *** *** ***
Selected # 0 0 0 0 0 0 0 0 0 0 0 0 0 0
% 00.00% 00.00% 00.00% 00.00% 00.00% 00.00% 00.00% 00.00% 00.00% 00.00% 00.00% 00.00% 00.00% 00.00%
Relevant Applicant Pool % *** *** *** *** *** *** *** *** *** *** *** *** *** ***
1101 General Business and Industry
Total Applications Received
# *** *** *** *** *** *** *** *** *** *** *** *** *** ***
% *** *** *** *** *** *** *** *** *** *** *** *** *** ***
Qualified # *** *** *** *** *** *** *** *** *** *** *** *** *** ***
% *** *** *** *** *** *** *** *** *** *** *** *** *** ***
Selected # 0 0 0 0 0 0 0 0 0 0 0 0 0 0
% 00.00% 00.00% 00.00% 00.00% 00.00% 00.00% 00.00% 00.00% 00.00% 00.00% 00.00% 00.00% 00.00% 00.00%
Relevant Applicant Pool % *** *** *** *** *** *** *** *** *** *** *** *** *** ***
1165 Loan Specialist
Total Applications Received
# *** *** *** *** *** *** *** *** *** *** *** *** *** ***
% *** *** *** *** *** *** *** *** *** *** *** *** *** ***
Qualified # *** *** *** *** *** *** *** *** *** *** *** *** *** ***
% *** *** *** *** *** *** *** *** *** *** *** *** *** ***
Selected # 0 0 0 0 0 0 0 0 0 0 0 0 0 0
% 00.00% 00.00% 00.00% 00.00% 00.00% 00.00% 00.00% 00.00% 00.00% 00.00% 00.00% 00.00% 00.00% 00.00%
Relevant Applicant Pool % *** *** *** *** *** *** *** *** *** *** *** *** *** ***
1171 Appraising
Total Applications Received
# *** *** *** *** *** *** *** *** *** *** *** *** *** ***
% *** *** *** *** *** *** *** *** *** *** *** *** *** ***
Qualified # *** *** *** *** *** *** *** *** *** *** *** *** *** ***
% *** *** *** *** *** *** *** *** *** *** *** *** *** ***

186
Table B9: SELECTIONS FOR INTERNAL COMPETITIVE PROMOTIONS FOR MAJOR OCCUPATIONS - Temporary Workforce - by Disability - SEP - FY2014
All VA TOTAL Total by Disability Status Detail for Targeted Disabilities
[04,05]No
Disability
[01]Not
Identified
[06-98]ReportableDisability
TotalTargetedDisability
[16,17,18]Hearing
[21,23,25]Vision
[28,30,32-38]Missing
Extremities
[64-69]Partial
Paralysis
[71-79]CompleteParalysis
[82]Epilepsy
[90]Severe
IntellectualDisability
[91]PsychiatricDisability
[92]Dwarfism
Selected # 0 0 0 0 0 0 0 0 0 0 0 0 0 0
% 00.00% 00.00% 00.00% 00.00% 00.00% 00.00% 00.00% 00.00% 00.00% 00.00% 00.00% 00.00% 00.00% 00.00%
Relevant Applicant Pool % *** *** *** *** *** *** *** *** *** *** *** *** *** ***
1630 Cemetery Administration
Total Applications Received
# *** *** *** *** *** *** *** *** *** *** *** *** *** ***
% *** *** *** *** *** *** *** *** *** *** *** *** *** ***
Qualified # *** *** *** *** *** *** *** *** *** *** *** *** *** ***
% *** *** *** *** *** *** *** *** *** *** *** *** *** ***
Selected # 0 0 0 0 0 0 0 0 0 0 0 0 0 0
% 00.00% 00.00% 00.00% 00.00% 00.00% 00.00% 00.00% 00.00% 00.00% 00.00% 00.00% 00.00% 00.00% 00.00%
Relevant Applicant Pool % *** *** *** *** *** *** *** *** *** *** *** *** *** ***
1811 Criminal Investigating
Total Applications Received
# *** *** *** *** *** *** *** *** *** *** *** *** *** ***
% *** *** *** *** *** *** *** *** *** *** *** *** *** ***
Qualified # *** *** *** *** *** *** *** *** *** *** *** *** *** ***
% *** *** *** *** *** *** *** *** *** *** *** *** *** ***
Selected # 0 0 0 0 0 0 0 0 0 0 0 0 0 0
% 00.00% 00.00% 00.00% 00.00% 00.00% 00.00% 00.00% 00.00% 00.00% 00.00% 00.00% 00.00% 00.00% 00.00%
Relevant Applicant Pool % *** *** *** *** *** *** *** *** *** *** *** *** *** ***
2210 Information Technology Management
Total Applications Received
# *** *** *** *** *** *** *** *** *** *** *** *** *** ***
% *** *** *** *** *** *** *** *** *** *** *** *** *** ***
Qualified # *** *** *** *** *** *** *** *** *** *** *** *** *** ***
% *** *** *** *** *** *** *** *** *** *** *** *** *** ***
Selected # 0 0 0 0 0 0 0 0 0 0 0 0 0 0
% 00.00% 00.00% 00.00% 00.00% 00.00% 00.00% 00.00% 00.00% 00.00% 00.00% 00.00% 00.00% 00.00% 00.00%
Relevant Applicant Pool % *** *** *** *** *** *** *** *** *** *** *** *** *** ***

187
Table B9: SELECTIONS FOR INTERNAL COMPETITIVE PROMOTIONS FOR MAJOR OCCUPATIONS - Temporary Workforce - by Disability - SEP - FY2014
All VA TOTAL Total by Disability Status Detail for Targeted Disabilities
[04,05]No
Disability
[01]Not
Identified
[06-98]ReportableDisability
TotalTargetedDisability
[16,17,18]Hearing
[21,23,25]Vision
[28,30,32-38]Missing
Extremities
[64-69]Partial
Paralysis
[71-79]CompleteParalysis
[82]Epilepsy
[90]Severe
IntellectualDisability
[91]PsychiatricDisability
[92]Dwarfism
4754 Cemetery Caretaking
Total Applications Received
# *** *** *** *** *** *** *** *** *** *** *** *** *** ***
% *** *** *** *** *** *** *** *** *** *** *** *** *** ***
Qualified # *** *** *** *** *** *** *** *** *** *** *** *** *** ***
% *** *** *** *** *** *** *** *** *** *** *** *** *** ***
Selected # 0 0 0 0 0 0 0 0 0 0 0 0 0 0
% 00.00% 00.00% 00.00% 00.00% 00.00% 00.00% 00.00% 00.00% 00.00% 00.00% 00.00% 00.00% 00.00% 00.00%
Relevant Applicant Pool % *** *** *** *** *** *** *** *** *** *** *** *** *** ***Data shown includes full-time, part-time, and intermittent temporary employees in a pay status and excluding medical and Manila residents.This fixed list of major occupations was identified by the Administration EEO Office.

188
Table A11: INTERNAL SELECTIONS FOR SENIOR LEVEL POSITIONS (GS 13/14, 15, and SES) - Permanent and Temporary Workforce - Distribution by Race/Ethnicity and Sex - SEP - FY2014
All VA TOTAL
EMPLOYEES
RACE/ETHNICITY
Hispanic or Latino
Non-Hispanic or Latino
White Black or African American
Asian Native Hawaiian or Other Pacific
Islander
American Indian or Alaska Native
Two or More Races/Undisclosed
All male female male female male female male female male female male female male female male female
GRADE: GS 13
Total Applications Received
# 3,051 1,707 1,344 337 185 695 544 507 492 86 93 5 1 40 7 37 22
% 100.00% 55.95% 44.05% 11.05% 6.06% 22.78% 17.83% 16.62% 16.13% 2.82% 3.05% 0.16% 0.03% 1.31% 0.23% 1.21% 0.72%
Qualified # 1,312 721 591 136 76 306 273 221 191 29 39 3 1 10 2 16 9
% 100.00% 54.95% 45.05% 10.37% 5.79% 23.32% 20.81% 16.84% 14.56% 2.21% 2.97% 0.23% 0.08% 0.76% 0.15% 1.22% 0.69%
Selected # 163 59 104 11 14 38 57 7 24 1 7 1 0 0 1 1 1
% 100.00% 36.20% 63.80% 6.75% 8.59% 23.31% 34.97% 4.29% 14.72% 0.61% 4.29% 0.61% 0.00% 0.00% 0.61% 0.61% 0.61%
Relevant Pool 28,116 11,465 16,651 694 954 8,275 11,067 1,569 3,136 706 1,179 27 28 169 227 25 60
GRADE: GS 14
Total Applications Received
# 1,903 1,192 711 257 91 572 306 256 254 61 28 1 1 18 11 27 20
% 100.00% 62.64% 37.36% 13.50% 4.78% 30.06% 16.08% 13.45% 13.35% 3.21% 1.47% 0.05% 0.05% 0.95% 0.58% 1.42% 1.05%
Qualified # 926 581 345 116 38 308 166 110 115 31 10 1 0 8 5 7 11
% 100.00% 62.74% 37.26% 12.53% 4.10% 33.26% 17.93% 11.88% 12.42% 3.35% 1.08% 0.11% 0.00% 0.86% 0.54% 0.76% 1.19%
Selected # 75 42 33 6 5 30 18 3 6 1 1 0 0 1 0 1 3
% 100.00% 56.00% 44.00% 8.00% 6.67% 40.00% 24.00% 4.00% 8.00% 1.33% 1.33% 0.00% 0.00% 1.33% 0.00% 1.33% 4.00%
Relevant Pool 19,632 8,992 10,640 477 461 6,862 7,638 995 1,655 519 725 16 14 101 120 22 27
GRADE: GS 15
Total Applications Received
# 236 142 94 21 10 63 35 48 40 6 6 1 0 1 0 2 3
% 100.00% 60.17% 39.83% 8.90% 4.24% 26.69% 14.83% 20.34% 16.95% 2.54% 2.54% 0.42% 0.00% 0.42% 0.00% 0.85% 1.27%
Qualified # 104 67 37 10 2 31 16 24 14 2 5 0 0 0 0 0 0
% 100.00% 64.42% 35.58% 9.62% 1.92% 29.81% 15.38% 23.08% 13.46% 1.92% 4.81% 0.00% 0.00% 0.00% 0.00% 0.00% 0.00%
Selected # 4 2 2 0 0 2 0 0 1 0 1 0 0 0 0 0 0
% 100.00% 50.00% 50.00% 0.00% 0.00% 50.00% 0.00% 0.00% 25.00% 0.00% 25.00% 0.00% 0.00% 0.00% 0.00% 0.00% 0.00%
Relevant Pool 5,891 3,121 2,770 126 106 2,429 1,932 370 582 163 110 2 6 25 28 6 6

189
Table A11: INTERNAL SELECTIONS FOR SENIOR LEVEL POSITIONS (GS 13/14, 15, and SES) - Permanent and Temporary Workforce - Distribution by Race/Ethnicity and Sex - SEP - FY2014
All VA TOTAL
EMPLOYEES
RACE/ETHNICITY
Hispanic or Latino
Non-Hispanic or Latino
White Black or African American
Asian Native Hawaiian or Other Pacific
Islander
American Indian or Alaska Native
Two or More Races/Undisclosed
All male female male female male female male female male female male female male female male female
GRADE: SES
Total Applications Received
# *** *** *** *** *** *** *** *** *** *** *** *** *** *** *** *** ***
% *** *** *** *** *** *** *** *** *** *** *** *** *** *** *** *** ***
Qualified # *** *** *** *** *** *** *** *** *** *** *** *** *** *** *** *** ***
% *** *** *** *** *** *** *** *** *** *** *** *** *** *** *** *** ***
Selected # *** *** *** *** *** *** *** *** *** *** *** *** *** *** *** *** ***
% *** *** *** *** *** *** *** *** *** *** *** *** *** *** *** *** ***
Relevant Pool 1,556 957 599 32 19 770 454 91 95 51 23 1 3 9 5 3 0Data source: OPM's USA Staffing quarterly data file for VA vacancies filtered by "Date Entered Status" field; includes GS 13, 14, and 15 "Internal Merit Promotion" jobs only. "Relevant Pool" data from PAID system; provided as reference only and not for comparative purposes. "Total Application Received" includes volunteered demographic data only.Data shown includes full-time, part-time, and intermittent permanent employees in a pay status and excluding medical and manila residents.Please see Data Definitions for NOA codes and Pay Plans included in this report.*** This data is not available.

190
Table B11: INTERNAL SELECTIONS FOR SENIOR LEVEL POSITIONS (GS 13/14, 15, and SES) - Permanent Workforce - Distribution by Disability - SEP - FY2014
All VA TOTAL Total by Disability Status Detail for Targeted Disabilities
[04,05]No
Disability
[01]Not
Identified
[06-98]ReportableDisability
TotalTargetedDisability
[16,17,18]Hearing
[21,23,25]Vision
[28,30,32-38]Missing
Extremities
[64-69]Partial
Paralysis
[71-79]CompleteParalysis
[82]Epilepsy
[90]Severe
IntellectualDisability
[91]PsychiatricDisability
[92]Dwarfism
GRADE: GS 13/14
Total Applications Received
# *** *** *** *** *** *** *** *** *** *** *** *** *** ***
% *** *** *** *** *** *** *** *** *** *** *** *** *** ***
Qualified # *** *** *** *** *** *** *** *** *** *** *** *** *** ***
% *** *** *** *** *** *** *** *** *** *** *** *** *** ***
Selected # 3,400 3,009 90 301 28 0 1 4 3 1 4 0 15 0
% 100.00% 88.50% 02.65% 08.85% 00.82% 00.00% 00.03% 00.12% 00.09% 00.03% 00.12% 00.00% 00.44% 00.00%
Relevant Pool 47,886 41,267 1,207 5,412 630 29 80 44 95 27 81 0 262 12
GRADE: GS 15
Total Applications Received
# *** *** *** *** *** *** *** *** *** *** *** *** *** ***
% *** *** *** *** *** *** *** *** *** *** *** *** *** ***
Qualified # *** *** *** *** *** *** *** *** *** *** *** *** *** ***
% *** *** *** *** *** *** *** *** *** *** *** *** *** ***
Selected # 236 214 6 16 2 0 0 1 1 0 0 0 0 0
% 100.00% 90.68% 02.54% 06.78% 00.85% 00.00% 00.00% 00.42% 00.42% 00.00% 00.00% 00.00% 00.00% 00.00%
Relevant Pool 6,101 5,322 195 584 44 0 7 6 8 2 2 1 16 2
GRADE: SES
Total Applications Received
# *** *** *** *** *** *** *** *** *** *** *** *** *** ***
% *** *** *** *** *** *** *** *** *** *** *** *** *** ***
Qualified # *** *** *** *** *** *** *** *** *** *** *** *** *** ***
% *** *** *** *** *** *** *** *** *** *** *** *** *** ***
Selected # 30 25 1 4 0 0 0 0 0 0 0 0 0 0
% 100.00% 83.33% 03.33% 13.33% 00.00% 00.00% 00.00% 00.00% 00.00% 00.00% 00.00% 00.00% 00.00% 00.00%
Relevant Pool 24,415 22,593 481 1,341 116 1 9 12 24 13 18 0 38 1Data shown includes full-time, part-time, and intermittent permanent employees in a pay status and excluding medical and manila residents.Please see Data Definitions for NOA codes and Pay Plans included in this report.*** This data is not available.

191
Table B11: INTERNAL SELECTIONS FOR SENIOR LEVEL POSITIONS (GS 13/14, 15, and SES) - Temporary Workforce - Distribution by Disability - SEP - FY2014
All VA TOTAL Total by Disability Status Detail for Targeted Disabilities
[04,05]No
Disability
[01]Not
Identified
[06-98]ReportableDisability
TotalTargetedDisability
[16,17,18]Hearing
[21,23,25]Vision
[28,30,32-38]Missing
Extremities
[64-69]Partial
Paralysis
[71-79]CompleteParalysis
[82]Epilepsy
[90]Severe
IntellectualDisability
[91]PsychiatricDisability
[92]Dwarfism
GRADE: GS 13/14
Total Applications Received
# *** *** *** *** *** *** *** *** *** *** *** *** *** ***
% *** *** *** *** *** *** *** *** *** *** *** *** *** ***
Qualified # *** *** *** *** *** *** *** *** *** *** *** *** *** ***
% *** *** *** *** *** *** *** *** *** *** *** *** *** ***
Selected # 79 70 2 7 1 0 0 0 1 0 0 0 0 0
% 100.00% 88.61% 02.53% 08.86% 01.27% 00.00% 00.00% 00.00% 01.27% 00.00% 00.00% 00.00% 00.00% 00.00%
Relevant Pool 2,241 2,058 50 133 17 0 5 1 1 1 2 0 7 0
GRADE: GS 15
Total Applications Received
# *** *** *** *** *** *** *** *** *** *** *** *** *** ***
% *** *** *** *** *** *** *** *** *** *** *** *** *** ***
Qualified # *** *** *** *** *** *** *** *** *** *** *** *** *** ***
% *** *** *** *** *** *** *** *** *** *** *** *** *** ***
Selected # 10 9 0 1 0 0 0 0 0 0 0 0 0 0
% 100.00% 90.00% 00.00% 10.00% 00.00% 00.00% 00.00% 00.00% 00.00% 00.00% 00.00% 00.00% 00.00% 00.00%
Relevant Pool 234 208 5 21 1 0 0 0 0 0 1 0 0 0
GRADE: SES
Total Applications Received
# *** *** *** *** *** *** *** *** *** *** *** *** *** ***
% *** *** *** *** *** *** *** *** *** *** *** *** *** ***
Qualified # *** *** *** *** *** *** *** *** *** *** *** *** *** ***
% *** *** *** *** *** *** *** *** *** *** *** *** *** ***
Selected # 0 0 0 0 0 0 0 0 0 0 0 0 0 0
% 00.00% 00.00% 00.00% 00.00% 00.00% 00.00% 00.00% 00.00% 00.00% 00.00% 00.00% 00.00% 00.00% 00.00%
Relevant Pool 2,405 2,299 38 68 4 0 0 1 0 1 0 0 2 0Data shown includes full-time, part-time, and intermittent temporary employees in a pay status and excluding medical and manila residents.Please see Data Definitions for NOA codes and Pay Plans included in this report.*** This data is not available.

192
Table A12: Participation in Career Development - by Race/Ethnicity and Sex - SEP - FY2014
All VA
TOTAL RACE/ETHNICITY
Hispanic or LatinoNon-Hispanic or Latino
EMPLOYEES White Black or African American Asian
Native Hawaiian or Other Pacific
IslanderAmerican Indian or Alaska Native
Two or More Races/Undisclosed
All male female male female male female male female male female male female male female male female
NCA Cemetary Intern Program
Slots 14
Relevant Pool %
1,75675.68% 24.32%
8.20% 1.99% 51.14% 13.44% 11.96% 7.63% 1.59% 0.57% 0.85% 0.11% 1.42% 0.40% 0.51% 0.17%
Applied# 400 0
%
Participants
# 14 0 5 0 0 8 4 1 0 0 1 0 0 0 0 0 0
% 100.00% 1.42% 35.71% 0.00% 0.00% 57.14% 28.57% 7.14% 0.00% 0.00% 7.14% 0.00% 0.00% 0.00% 0.00% 0.00% 0.00%
VBA Leadership Enhancement and Development Program
Slots
Relevant Pool
Applied#
%
Participants
# 35 18 17 3 2 10 11 3 3 2 1 0 0 0 0 0 0
% 100.00% 51.43% 48.57% 8.57% 5.71% 28.57% 31.43% 8.57% 8.57% 5.71% 2.86% 0.00% 0.00% 0.00% 0.00% 0.00% 0.00%
VBA Emerging leaders Program
Slots
Relevant Pool
Applied#
%
Participants
# 27 13 14 2 4 8 5 3 4 0 1 0 0 0 0 0 0
% 100.00% 48.15% 51.85% 7.41% 14.81% 29.63% 18.52% 11.11% 14.81% 0.00% 3.70% 0.00% 0.00% 0.00% 0.00% 0.00% 0.00%
VBA Leadership Development Program
Slots
Relevant Pool
Applied#
%
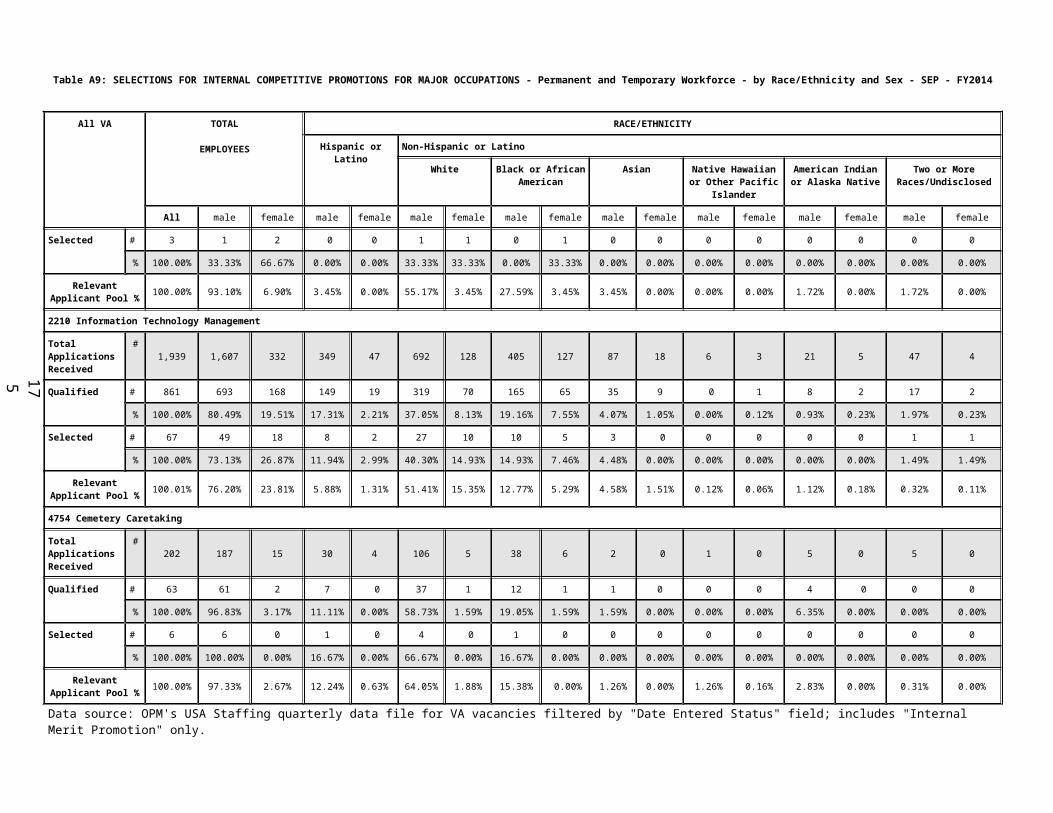
193
Table A12: Participation in Career Development - by Race/Ethnicity and Sex - SEP - FY2014
All VA
TOTAL RACE/ETHNICITY
Hispanic or LatinoNon-Hispanic or Latino
EMPLOYEES White Black or African American Asian
Native Hawaiian or Other Pacific
IslanderAmerican Indian or Alaska Native
Two or More Races/Undisclosed
All male female male female male female male female male female male female male female male female
Participants
# 26 10 16 1 0 5 8 3 7 1 1 0 0 0 0 0 0
% 100.00% 38.46% 61.54% 3.85% 0.00% 19.23% 30.77% 11.54% 26.92% 3.85% 3.85% 0.00% 0.00% 0.00% 0.00% 0.00% 0.00%
VBA Assistant Director Development Program
Slots
Relevant Pool
Applied#
%
Participants
# 11 6 5 2 0 5 3 1 0 0 0 0 0 0 0 0 0
% 100.00% 54.55% 45.45% 18.18% 0.00% 45.45% 27.27% 9.09% 0.00% 0.00% 0.00% 0.00% 0.00% 0.00% 0.00% 0.00% 0.00%
VBA Advanced Management Training
Slots
Relevant Pool
Applied#
%
Participants
# 107 55 52 4 1 39 32 11 19 1 0 0 0 0 0 0 0
% 100.00% 51.40% 48.60% 3.74% 0.93% 36.45% 29.91% 10.28% 17.76% 0.93% 0.00% 0.00% 0.00% 0.00% 0.00% 0.00% 0.00%
VHA Career Development Programs for TCF, GS 5-9
Slots
Relevant Pool % 100 32.6 67.4 2.99 4.49 23.54 49.38 3.11 8.35 2.38 3.36 0.3 0.09 0.33 0.67 0.33 0.59
Applied#
%
Participants
# 204 132 72 8 10 68 24 40 33 11 3 0 1 4 0 1 1% 100 64.71 35.29 3.92 4.9 33.33 11.76 19.61 16.18 5.39 1.47 0 0.49 1.96 0 0.49 0.49
VHA Career Development Programs for GHATP, GS 7-9
Slots
Relevant Pool % 100 32.6 67.4 2.99 4.46 23.53 49.37 3.07 8.35 2.35 3.36 0.03 0.06 0.3 0.65 0.33 0.56

194
Table A12: Participation in Career Development - by Race/Ethnicity and Sex - SEP - FY2014
All VA
TOTAL RACE/ETHNICITY
Hispanic or LatinoNon-Hispanic or Latino
EMPLOYEES White Black or African American Asian
Native Hawaiian or Other Pacific
IslanderAmerican Indian or Alaska Native
Two or More Races/Undisclosed
All male female male female male female male female male female male female male female male female
Applied#
%
Participants
# 45 21 24 1 0 10 11 7 8 3 5 0 0 0 0 0 0
% 100 46.67 53.33 2.22 0 22.22 24.44 15.56 17.78 6.67 11.11 0 0 0 0 0 0
VHA Career Development Programs for Facility LEAD, GS 6-9
Slots
Relevant Pool % 100 30.9 69.1 3.15 4.41 17.79 38.93 8.44 19.1 1.87 4.81 0.1 0.17 0.41 0.83 0 0
Applied#
%
Participants
# 1342 448 894 25 42 273 519 114 288 22 31 3 2 7 9 4 3% 100 33.38 66.62 1.86 3.13 20.34 38.67 8.49 21.46 1.64 2.31 0.22 0.15 0.52 0.67 0.3 0.22
VHA Career Development Programs for VISN LEAD, GS 9-13
Slots
Relevant Pool % 100 45.09 54.91 2.97 3.23 31.74 35.6 3.77 8.08 6.02 7.28 0.08 0.09 0.51 0.63 0 0
Applied#
%
Participants
# 404 132 272 14 16 90 190 14 52 12 9 2 0 0 4 0 1
% 100 32.67 67.33 3.47 3.96 22.28 47.03 3.47 12.87 2.97 2.23 0.5 0 0 0.99 0 0.25

195
Table B12: Participation in Career Development - by Disability - SEP - FY2014
All VA TOTAL
Total by Disability Status Detail for Targeted Disabilities
[04,05] [01] [06-98] Total [16,17,18] [21,23,25] [28,30,32-38] [64-69] [71-79] [82] [90] [91] [92]
No Not Reportable Targeted Hearing Vision Missing Partial Complete Epilepsy Severe Psychiatric Dwarfism
Disability Identified Disability Disability Extremities Paralysis Paralysis Intellectual Disability
Disability
NCA Cemetery Intern Program
Slots 14
Relevant Pool
Applied# *** *** *** *** *** *** *** *** *** *** *** *** *** ***
% 100.00% *** *** *** *** *** *** *** *** *** *** *** *** ***
Participants
# 14 *** *** *** *** *** *** *** *** *** *** *** *** ***
% 100.00% *** *** *** *** *** *** *** *** *** *** *** *** ***
VBA Leadership Enhancement and Development Program
Slots
Relevant Pool
Applied# *** *** *** *** *** *** *** *** *** *** *** *** *** ***
% 100.00% *** *** *** *** *** *** *** *** *** *** *** *** ***
Participants
# 35 *** *** *** *** *** *** *** *** *** *** *** *** ***
% 100.00% *** *** *** *** *** *** *** *** *** *** *** *** ***
VBA Emerging leaders Program
Slots
Relevant Pool
Applied# *** *** *** *** *** *** *** *** *** *** *** *** *** ***
% 100.00% *** *** *** *** *** *** *** *** *** *** *** *** ***
Participants
# 27 *** *** *** *** *** *** *** *** *** *** *** *** ***
% 100.00% *** *** *** *** *** *** *** *** *** *** *** *** ***
VBA Leadership Development Program
Slots
Relevant Pool
Applied# *** *** *** *** *** *** *** *** *** *** *** *** *** ***
% 100.00% *** *** *** *** *** *** *** *** *** *** *** *** ***

196
Table B12: Participation in Career Development - by Disability - SEP - FY2014
All VA TOTAL
Total by Disability Status Detail for Targeted Disabilities
[04,05] [01] [06-98] Total [16,17,18] [21,23,25] [28,30,32-38] [64-69] [71-79] [82] [90] [91] [92]
No Not Reportable Targeted Hearing Vision Missing Partial Complete Epilepsy Severe Psychiatric Dwarfism
Disability Identified Disability Disability Extremities Paralysis Paralysis Intellectual Disability
Disability
Participants
# 26 *** *** *** *** *** *** *** *** *** *** *** *** ***
% 100.00% *** *** *** *** *** *** *** *** *** *** *** *** ***
VBA Assistant Director Development Program
Slots
Relevant Pool
Applied# *** *** *** *** *** *** *** *** *** *** *** *** *** ***
% 100.00% *** *** *** *** *** *** *** *** *** *** *** *** ***
Participants
# 11 *** *** *** *** *** *** *** *** *** *** *** *** ***
% 100.00% *** *** *** *** *** *** *** *** *** *** *** *** ***
VBA Advanced Management Training
Slots
Relevant Pool
Applied# *** *** *** *** *** *** *** *** *** *** *** *** *** ***
% 100.00% *** *** *** *** *** *** *** *** *** *** *** *** ***
Participants
# 107 *** *** *** *** *** *** *** *** *** *** *** *** ***
% 100.00% *** *** *** *** *** *** *** *** *** *** *** *** ***
VHA Career Development Programs for TCF, GS 5-9
Slots
Relevant Pool 100%
Applied# *** *** *** *** *** *** *** *** *** *** *** *** *** ***
% 100.00% *** *** *** *** *** *** *** *** *** *** *** *** ***
Participants
# 204 *** *** *** *** *** *** *** *** *** *** *** *** ***
% 100.00% *** *** *** *** *** *** *** *** *** *** *** *** ***
VHA Career Development Programs for GHATP, GS 7-9
Slots
Relevant Pool
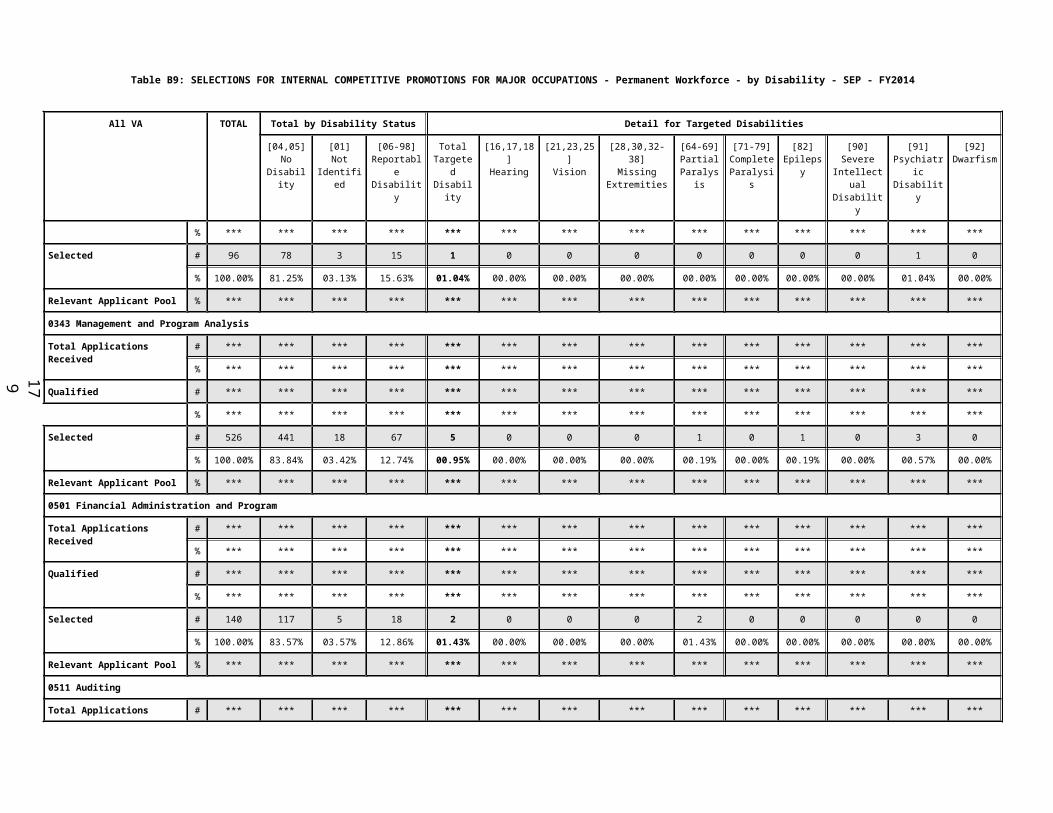
197
Table B12: Participation in Career Development - by Disability - SEP - FY2014
All VA TOTAL
Total by Disability Status Detail for Targeted Disabilities
[04,05] [01] [06-98] Total [16,17,18] [21,23,25] [28,30,32-38] [64-69] [71-79] [82] [90] [91] [92]
No Not Reportable Targeted Hearing Vision Missing Partial Complete Epilepsy Severe Psychiatric Dwarfism
Disability Identified Disability Disability Extremities Paralysis Paralysis Intellectual Disability
Disability
Applied# *** *** *** *** *** *** *** *** *** *** *** *** *** ***
% 100.00% *** *** *** *** *** *** *** *** *** *** *** *** ***
Participants
# 45 *** *** *** *** *** *** *** *** *** *** *** *** ***
% 100.00% *** *** *** *** *** *** *** *** *** *** *** *** ***
VHA Career Development Programs for Facility LEAD, GS 6-9
Slots 14
Relevant Pool
Applied# *** *** *** *** *** *** *** *** *** *** *** *** *** ***
% 100.00% *** *** *** *** *** *** *** *** *** *** *** *** ***
Participants
# 1,342 *** *** *** *** *** *** *** *** *** *** *** *** ***
% 100.00% *** *** *** *** *** *** *** *** *** *** *** *** ***
VHA Career Development Programs for VISN LEAD, GS 9-13
Slots
Relevant Pool
Applied# *** *** *** *** *** *** *** *** *** *** *** *** *** ***
% 100.00% *** *** *** *** *** *** *** *** *** *** *** *** ***
Participants
# 404 *** *** *** *** *** *** *** *** *** *** *** *** ***
% 100.00% *** *** *** *** *** *** *** *** *** *** *** *** ***

198
Table A13: EMPLOYEE RECOGNITION AND AWARDS - Permanent Workforce - by Race/Ethnicity and Sex - SEP - FY2014
All VA TOTAL
EMPLOYEES
RACE/ETHNICITY
Hispanic or Latino Non-Hispanic or Latino
White Black or African American
Asian Native Hawaiian or Other Pacific
Islander
American Indian or Alaska Native
Two or More Races/Undisclosed
All male female male female male female male female male female male female male female male female
Time-off Awards - 1-9 hours
Total Time-off Awards - 1-9 hours
# 17,406 6,948 10,458 679 774 4,115 6,135 1,606 2,425 428 910 19 26 86 152 15 36
% 100.01% 39.92% 60.09% 03.90% 04.45% 23.64% 35.25% 09.23% 13.93% 02.46% 05.23% 00.11% 00.15% 00.49% 00.87% 00.09% 00.21%
Total Hours 107,572 43,162 64,410 3,981 4,417 27,001 39,704 9,096 14,187 2,343 4,759 112 168 533 961 96 214
Average Hours
6.18 6.21 6.16 5.86 5.71 6.56 6.47 5.66 5.85 5.47 5.23 5.89 6.46 6.20 6.32 6.40 5.94
Time-off Awards - 9+ hours
Total Time-off Awards over 9 hours
# 4,462 1,685 2,777 75 99 1,187 1,836 329 670 68 128 5 9 20 27 1 8
% 100.00% 37.75% 62.25% 01.68% 02.22% 26.60% 41.15% 07.37% 15.02% 01.52% 02.87% 00.11% 00.20% 00.45% 00.61% 00.02% 00.18%
Total Hours 83,650 31,342 52,308 1,474 1,743 21,539 33,461 6,619 13,928 1,244 2,293 74 192 376 551 16 140
Average Hours
18.75 18.60 18.84 19.65 17.61 18.15 18.22 20.12 20.79 18.29 17.91 14.80 21.33 18.80 20.41 16.00 17.50
Cash Awards - $100 - $500
Total Cash Awards $500 and under
# 82,817 34,981 47,836 2,659 2,937 21,680 29,382 8,414 12,098 1,509 2,447 118 128 511 705 90 139
% 100.00% 42.24% 57.76% 03.21% 03.55% 26.18% 35.48% 10.16% 14.61% 01.82% 02.95% 00.14% 00.15% 00.62% 00.85% 00.11% 00.17%
Total Amount
25,181,636 10,528,221 14,653,415 784,147 874,516 6,537,313 9,054,934 2,500,821 3,609,714 484,709 820,878 36,362 44,483 156,886 208,063 27,983 40,827
Average Amount
304.06 300.97 306.33 294.90 297.76 301.54 308.18 297.22 298.37 321.21 335.46 308.15 347.52 307.02 295.12 310.92 293.72
Cash Awards - $501+
Total Cash Awards $501 and over
# 156,765 58,580 98,185 4,619 6,005 37,726 62,220 11,457 21,786 3,759 6,471 161 216 713 1,235 145 252
% 100.01% 37.37% 62.64% 02.95% 03.83% 24.07% 39.69% 07.31% 13.90% 02.40% 04.13% 00.10% 00.14% 00.45% 00.79% 00.09% 00.16%
Total Amount
173,302,454 66,265,365 107,037,089 4,729,586 6,174,428 44,529,379 70,078,382 11,387,298 21,911,683 4,514,376 7,097,149 164,573 223,458 789,052 1,289,269 151,101 262,720
Average Amount
1,105.49 1,131.19 1,090.16 1,023.94 1,028.21 1,180.34 1,126.30 993.92 1,005.77 1,200.95 1,096.76 1,022.19 1,034.53 1,106.66 1,043.94 1,042.08 1,042.54
Quality Step Increases (QSIs)

199
Table A13: EMPLOYEE RECOGNITION AND AWARDS - Permanent Workforce - by Race/Ethnicity and Sex - SEP - FY2014
All VA TOTAL
EMPLOYEES
RACE/ETHNICITY
Hispanic or Latino Non-Hispanic or Latino
White Black or African American
Asian Native Hawaiian or Other Pacific
Islander
American Indian or Alaska Native
Two or More Races/Undisclosed
All male female male female male female male female male female male female male female male female
Total QSIs Awarded
# 848 384 464 27 18 277 312 48 98 24 27 2 1 5 8 1 0
% 100.00% 45.29% 54.71% 03.18% 02.12% 32.67% 36.79% 05.66% 11.56% 02.83% 03.18% 00.24% 00.12% 00.59% 00.94% 00.12% 00.00%
Total Benefit *** *** *** *** *** *** *** *** *** *** *** *** *** *** *** *** ***
Average Benefit
*** *** *** *** *** *** *** *** *** *** *** *** *** *** *** *** ***
Data shown includes full-time, part-time, and intermittent permanent employees in a pay status and excluding medical and Manila residents.Please see Data Definitions for NOA codes included in the types recognition and awards.*** This data is not available.

200
Table B13: EMPLOYEE RECOGNITION AND AWARDS - Permanent Workforce - by Disability - SEP - FY2014
All VA TOTAL Total by Disability Status Detail for Targeted Disabilities
[04,05]No
Disability
[01]Not
Identified
[06-98]ReportableDisability
TotalTargetedDisability
[16,17,18]Hearing
[21,23,25]Vision
[28,30,32-38]
MissingExtremities
[64-69]Partial
Paralysis
[71-79]CompleteParalysis
[82]Epilepsy
[90]Severe
IntellectualDisability
[91]PsychiatricDisability
[92]Dwarfism
Time-off Awards - 1-9 hours
Total Time-off Awards - 1-9 hours
# 17,406 14,555 465 2,386 328 24 22 11 38 6 31 9 181 6
% 100.00% 83.62% 02.67% 13.71% 01.88% 00.14% 00.13% 00.06% 00.22% 00.03% 00.18% 00.05% 01.04% 00.03%
Total Hours 107,572 90,009 2,835 14,728 2,012 144 126 76 224 40 186 54 1,118 44
Average Hours 6.18 6.18 6.10 6.17 6.13 6.00 5.73 6.91 5.89 6.67 6.00 6.00 6.18 7.33
Time-off Awards - 9+ hours
Total Time-off Awards over 9 hours
# 4,462 3,827 134 501 47 3 3 2 6 3 11 2 16 1
% 100.00% 85.77% 03.00% 11.23% 01.05% 00.07% 00.07% 00.04% 00.13% 00.07% 00.25% 00.04% 00.36% 00.02%
Total Hours 83,650 71,716 2,550 9,384 926 48 64 64 114 58 200 40 314 24
Average Hours 18.75 18.74 19.03 18.73 19.70 16.00 21.33 32.00 19.00 19.33 18.18 20.00 19.63 24.00
Cash Awards - $100 - $500
Total Cash Awards $500 and under
# 82,817 68,062 2,416 12,339 1,841 118 134 47 155 40 193 113 1,016 25
% 100.00% 82.18% 02.92% 14.90% 02.22% 00.14% 00.16% 00.06% 00.19% 00.05% 00.23% 00.14% 01.23% 00.03%
Total Amount 25,181,636 20,807,155 720,250 3,654,231 542,053 33,990 41,814 15,153 46,991 11,035 57,148 33,530 295,821 6,571
Average Amount 304.06 305.71 298.12 296.15 294.43 288.05 312.04 322.40 303.17 275.88 296.10 296.73 291.16 262.84
Cash Awards - $501+
Total Cash Awards $501 and over
# 156,765 135,982 3,592 17,191 2,324 122 225 107 247 64 233 57 1,223 46
% 100.00% 86.74% 02.29% 10.97% 01.48% 00.08% 00.14% 00.07% 00.16% 00.04% 00.15% 00.04% 00.78% 00.03%
Total Amount 173,302,454 151,431,163 3,894,272 17,977,019 2,373,880 108,946 230,510 120,122 252,478 76,909 242,933 52,938 1,235,713 53,331
Average Amount 1,105.49 1,113.61 1,084.15 1,045.72 1,021.46 893.00 1,024.49 1,122.64 1,022.18 1,201.70 1,042.63 928.74 1,010.39 1,159.37
Quality Step Increases (QSIs)
Total QSIs Awarded
# 848 717 18 113 13 0 0 2 3 1 0 1 6 0
% 100.00% 84.55% 02.12% 13.33% 01.53% 00.00% 00.00% 00.24% 00.35% 00.12% 00.00% 00.12% 00.71% 00.00%
Total Benefit *** *** *** *** *** *** *** *** *** *** *** *** *** ***
Average Benefit *** *** *** *** *** *** *** *** *** *** *** *** *** ***Data shown includes full-time, part-time, and intermittent permanent employees in a pay status and excluding medical and Manila residents.Please see Data Definitions for NOA codes included in the types recognition and awards.

201
*** This data is not available.

202
Table A13: EMPLOYEE RECOGNITION AND AWARDS - Temporary Workforce - by Race/Ethnicity and Sex - SEP - FY2014
All VA TOTAL
EMPLOYEES
RACE/ETHNICITY
Hispanic or Latino
Non-Hispanic or Latino
White Black or African American
Asian Native Hawaiian or Other Pacific Islander
American Indian or Alaska Native
Two or More Races/Undisclosed
All male female male female male female male female male female male female male female male female
Time-off Awards - 1-9 hours
Total Time-off Awards - 1-9 hours
# 341 158 183 19 8 82 102 32 42 18 25 1 0 5 4 1 2
% 100.00% 46.33% 53.67% 05.57% 02.35% 24.05% 29.91% 09.38% 12.32% 05.28% 07.33% 00.29% 00.00% 01.47% 01.17% 00.29% 00.59%
Total Hours 2,156 1,009 1,147 100 48 556 698 205 247 100 128 4 0 36 16 8 10
Average Hours 6.32 6.39 6.27 5.26 6.00 6.78 6.84 6.41 5.88 5.56 5.12 4.00 0.00 7.20 4.00 8.00 5.00
Time-off Awards - 9+ hours
Total Time-off Awards over 9 hours
# 98 32 66 1 0 26 49 3 10 2 6 0 0 0 1 0 0
% 99.99% 32.65% 67.34% 01.02% 00.00% 26.53% 50.00% 03.06% 10.20% 02.04% 06.12% 00.00% 00.00% 00.00% 01.02% 00.00% 00.00%
Total Hours 1,653 584 1,069 16 0 488 773 48 172 32 100 0 0 0 24 0 0
Average Hours 16.87 18.25 16.20 16.00 0.00 18.77 15.78 16.00 17.20 16.00 16.67 0.00 0.00 0.00 24.00 0.00 0.00
Cash Awards - $100 - $500
Total Cash Awards $500 and under
# 2,026 832 1,194 82 63 507 718 158 295 58 89 1 2 20 21 6 6
% 100.01% 41.07% 58.94% 04.05% 03.11% 25.02% 35.44% 07.80% 14.56% 02.86% 04.39% 00.05% 00.10% 00.99% 01.04% 00.30% 00.30%
Total Amount 596,532 249,069 347,463 23,486 19,176 153,493 213,338 45,993 78,193 18,646 29,195 50 750 6,154 5,252 1,247 1,559
Average Amount 294.44 299.36 291.01 286.41 304.38 302.75 297.13 291.09 265.06 321.48 328.03 50.00 375.00 307.70 250.10 207.83 259.83
Cash Awards - $501+
Total Cash Awards $501 and over
# 4,001 1,589 2,412 76 98 1,058 1,622 192 390 224 264 6 5 29 25 4 8
% 99.99% 39.71% 60.28% 01.90% 02.45% 26.44% 40.54% 04.80% 09.75% 05.60% 06.60% 00.15% 00.12% 00.72% 00.62% 00.10% 00.20%
Total Amount 4,950,591 2,079,063 2,871,528 99,333 90,306 1,453,976 2,020,103 183,406 397,997 303,094 324,043 6,812 5,825 29,615 25,276 2,827 7,978
Average Amount 1,237.34 1,308.41 1,190.52 1,307.01 921.49 1,374.27 1,245.44 955.24 1,020.51 1,353.10 1,227.44 1,135.33 1,165.00 1,021.21 1,011.04 706.75 997.25
Quality Step Increases (QSIs)
Total QSIs Awarded
# 8 2 6 0 0 1 3 0 3 1 0 0 0 0 0 0 0
% 100.00% 25.00% 75.00% 00.00% 00.00% 12.50% 37.50% 00.00% 37.50% 12.50% 00.00% 00.00% 00.00% 00.00% 00.00% 00.00% 00.00%
Total Benefit *** *** *** *** *** *** *** *** *** *** *** *** *** *** *** *** ***
Average Benefit *** *** *** *** *** *** *** *** *** *** *** *** *** *** *** *** ***
Data shown includes full-time, part-time, and intermittent temporary employees in a pay status and excluding medical and Manila residents.Please see Data Definitions for NOA codes included in the types recognition and awards.*** This data is not available.
Table B13: EMPLOYEE RECOGNITION AND AWARDS - Temporary Workforce - by Disability - SEP - FY2014

203
All VA TOTAL Total by Disability Status Detail for Targeted Disabilities
[04,05]No
Disability
[01]Not
Identified
[06-98]ReportableDisability
TotalTargetedDisability
[16,17,18]Hearing
[21,23,25]Vision
[28,30,32-38]
MissingExtremities
[64-69]Partial
Paralysis
[71-79]CompleteParalysis
[82]Epilepsy
[90]Severe
IntellectualDisability
[91]PsychiatricDisability
[92]Dwarfism
Time-off Awards - 1-9 hours
Total Time-off Awards - 1-9 hours
# 341 248 11 82 23 2 1 0 1 0 1 1 17 0
% 100.00% 72.73% 03.23% 24.05% 06.74% 00.59% 00.29% 00.00% 00.29% 00.00% 00.29% 00.29% 04.99% 00.00%
Total Hours 2,156 1,578 64 514 148 14 8 0 8 0 4 4 110 0
Average Hours 6.32 6.36 5.82 6.27 6.43 7.00 8.00 0.00 8.00 0.00 4.00 4.00 6.47 0.00
Time-off Awards - 9+ hours
Total Time-off Awards over 9 hours
# 98 84 3 11 3 0 0 0 1 0 0 1 1 0
% 100.00% 85.71% 03.06% 11.22% 03.06% 00.00% 00.00% 00.00% 01.02% 00.00% 00.00% 01.02% 01.02% 00.00%
Total Hours 1,653 1,405 48 200 52 0 0 0 16 0 0 12 24 0
Average Hours 16.87 16.73 16.00 18.18 17.33 0.00 0.00 0.00 16.00 0.00 0.00 12.00 24.00 0.00
Cash Awards - $100 - $500
Total Cash Awards $500 and under
# 2,026 1,536 77 413 124 6 5 1 12 1 7 2 89 1
% 100.00% 75.81% 03.80% 20.38% 06.12% 00.30% 00.25% 00.05% 00.59% 00.05% 00.35% 00.10% 04.39% 00.05%
Total Amount 596,532 456,372 23,330 116,830 33,922 1,958 1,534 500 3,724 153 1,886 454 23,613 100
Average Amount 294.44 297.12 302.99 282.88 273.56 326.33 306.80 500.00 310.33 153.00 269.43 227.00 265.31 100.00
Cash Awards - $501+
Total Cash Awards $501 and over
# 4,001 3,413 94 494 118 1 6 4 6 4 6 1 87 3
% 100.00% 85.30% 02.35% 12.35% 02.95% 00.02% 00.15% 00.10% 00.15% 00.10% 00.15% 00.02% 02.17% 00.07%
Total Amount 4,950,591 4,307,481 105,624 537,486 108,566 900 6,503 3,210 5,050 3,013 7,239 563 79,888 2,200
Average Amount 1,237.34 1,262.08 1,123.66 1,088.03 920.05 900.00 1,083.83 802.50 841.67 753.25 1,206.50 563.00 918.25 733.33
Quality Step Increases (QSIs)
Total QSIs Awarded # 8 6 0 2 1 0 0 0 0 0 0 0 1 0
% 100.00% 75.00% 00.00% 25.00% 12.50% 00.00% 00.00% 00.00% 00.00% 00.00% 00.00% 00.00% 12.50% 00.00%
Total Benefit *** *** *** *** *** *** *** *** *** *** *** *** *** ***
Average Benefit *** *** *** *** *** *** *** *** *** *** *** *** *** ***Data shown includes full-time, part-time, and intermittent temporary employees in a pay status and excluding medical and Manila residents.Please see Data Definitions for NOA codes included in the types recognition and awards.*** This data is not available.

204
Table A14: SEPARATIONS BY TYPE OF SEPARATION - Permanent Workforce - by Race/Ethnicity and Sex - SEP - FY2014
All VA TOTAL
EMPLOYEES
RACE/ETHNICITY
Hispanic or Latino
Non-Hispanic or Latino
White Black or African American
Asian Native Hawaiian or Other Pacific
Islander
American Indian or Alaska Native
Two or More Races/Undisclosed
All male female male female male female male female male female male female male female male female
Voluntary # 26,552 11,744 14,808 746 743 7,737 9,639 2,388 3,237 627 894 39 32 168 214 39 49
% 100.00% 44.23% 55.77% 02.81% 02.80% 29.14% 36.30% 08.99% 12.19% 02.36% 03.37% 00.15% 00.12% 00.63% 00.81% 00.15% 00.18%
Involuntary # 2,699 1,543 1,156 124 74 762 593 579 433 40 35 2 0 26 17 10 4
% 99.98% 57.15% 42.83% 04.59% 02.74% 28.23% 21.97% 21.45% 16.04% 01.48% 01.30% 00.07% 00.00% 00.96% 00.63% 00.37% 00.15%
Total Separations
# 29,251 13,287 15,964 870 817 8,499 10,232 2,967 3,670 667 929 41 32 194 231 49 53
% 100.00% 45.42% 54.58% 02.97% 02.79% 29.06% 34.98% 10.14% 12.55% 02.28% 03.18% 00.14% 00.11% 00.66% 00.79% 00.17% 00.18%
Total Work Force
# 326,561 133,623 192,938 10,435 11,671 80,941 114,158 30,832 49,052 8,655 14,010 443 511 1,918 2,917 399 619
% 100.01% 40.93% 59.08% 03.20% 03.57% 24.79% 34.96% 09.44% 15.02% 02.65% 04.29% 00.14% 00.16% 00.59% 00.89% 00.12% 00.19%Data shown includes full-time, part-time, and intermittent permanent employees in a pay status and excluding medical and Manila residents.Please see Data Definitions for NOA codes included in the types of separations.

205
Table B14: SEPARATIONS BY TYPE OF SEPARATION - Permanent Workforce - by Disability - SEP - FY2014
All VA TOTAL Total by Disability Status Detail for Targeted Disabilities
[04,05]No
Disability
[01]Not
Identified
[06-98]ReportableDisability
TotalTargetedDisability
[16,17,18]Hearing
[21,23,25]Vision
[28,30,32-38]Missing
Extremities
[64-69]Partial
Paralysis
[71-79]CompleteParalysis
[82]Epilepsy
[90]Severe
IntellectualDisability
[91]PsychiatricDisability
[92]Dwarfism
Voluntary # 26,552 21,078 960 4,514 740 38 38 22 73 22 50 22 467 8
% 100.00% 79.38% 03.62% 17.00% 02.79% 00.14% 00.14% 00.08% 00.27% 00.08% 00.19% 00.08% 01.76% 00.03%
Involuntary # 2,699 1,771 136 792 169 0 4 1 8 1 7 6 141 1
% 100.00% 65.62% 05.04% 29.34% 06.26% 00.00% 00.15% 00.04% 00.30% 00.04% 00.26% 00.22% 05.22% 00.04%
Total Separations # 29,251 22,849 1,096 5,306 909 38 42 23 81 23 57 28 608 9
% 100.00% 78.11% 03.75% 18.14% 03.11% 00.13% 00.14% 00.08% 00.28% 00.08% 00.19% 00.10% 02.08% 00.03%
Total Work Force # 326,561 272,252 9,158 45,151 6,783 388 506 216 611 150 600 310 3,920 82
% 100.00% 83.37% 02.80% 13.83% 02.08% 00.12% 00.15% 00.07% 00.19% 00.05% 00.18% 00.09% 01.20% 00.03%Data shown includes WG grades for full-time, part-time, and intermittent permanent employees in a pay status and excluding medical and Manila residents.Please see Data Definitions for NOA codes included in the types of separations.

206
Table A14: SEPARATIONS BY TYPE OF SEPARATION - Temporary Workforce - by Race/Ethnicity and Sex - SEP - FY2014
All VA TOTAL
EMPLOYEES
RACE/ETHNICITY
Hispanic or Latino
Non-Hispanic or Latino
White Black or African American
Asian Native Hawaiian or Other Pacific
Islander
American Indian or Alaska Native
Two or More Races/Undisclosed
All male female male female male female male female male female male female male female male female
Voluntary # 8,921 3,134 5,787 179 276 2,102 3,992 421 821 346 563 14 17 60 94 12 24
% 99.99% 35.13% 64.86% 02.01% 03.09% 23.56% 44.75% 04.72% 09.20% 03.88% 06.31% 00.16% 00.19% 00.67% 01.05% 00.13% 00.27%
Involuntary # 747 364 383 31 18 221 242 91 73 15 38 0 1 4 8 2 3
% 100.01% 48.74% 51.27% 04.15% 02.41% 29.59% 32.40% 12.18% 09.77% 02.01% 05.09% 00.00% 00.13% 00.54% 01.07% 00.27% 00.40%
Total Separations
# 9,668 3,498 6,170 210 294 2,323 4,234 512 894 361 601 14 18 64 102 14 27
% 100.00% 36.17% 63.83% 02.17% 03.04% 24.03% 43.79% 05.30% 09.25% 03.73% 06.22% 00.14% 00.19% 00.66% 01.06% 00.14% 00.28%
Total Work Force
# 20,493 8,085 12,408 491 581 5,042 7,904 1,261 2,195 1,085 1,422 29 38 143 217 34 51
% 100.01% 39.45% 60.56% 02.40% 02.84% 24.60% 38.57% 06.15% 10.71% 05.29% 06.94% 00.14% 00.19% 00.70% 01.06% 00.17% 00.25%Data shown includes full-time, part-time, and intermittent temporary employees in a pay status and excluding medical and Manila residents.Please see Data Definitions for NOA codes included in the types of separations.

207
Table B14: SEPARATIONS BY TYPE OF SEPARATION - Temporary Workforce - by Disability - SEP - FY2014
All VA TOTAL Total by Disability Status Detail for Targeted Disabilities
[04,05]No
Disability
[01]Not
Identified
[06-98]ReportableDisability
TotalTargetedDisability
[16,17,18]Hearing
[21,23,25]Vision
[28,30,32-38]Missing
Extremities
[64-69]Partial
Paralysis
[71-79]CompleteParalysis
[82]Epilepsy
[90]Severe
IntellectualDisability
[91]PsychiatricDisability
[92]Dwarfism
Voluntary # 8,921 7,700 227 994 187 5 14 7 15 4 12 3 127 0
% 100.00% 86.31% 02.54% 11.14% 02.10% 00.06% 00.16% 00.08% 00.17% 00.04% 00.13% 00.03% 01.42% 00.00%
Involuntary # 747 557 32 158 49 1 2 4 2 0 1 0 39 0
% 100.00% 74.56% 04.28% 21.15% 06.56% 00.13% 00.27% 00.54% 00.27% 00.00% 00.13% 00.00% 05.22% 00.00%
Total Separations # 9,668 8,257 259 1,152 236 6 16 11 17 4 13 3 166 0
% 100.00% 85.41% 02.68% 11.92% 02.44% 00.06% 00.17% 00.11% 00.18% 00.04% 00.13% 00.03% 01.72% 00.00%
Total Work Force # 20,493 17,118 605 2,770 509 15 27 11 38 8 43 14 346 7
% 100.00% 83.53% 02.95% 13.52% 02.48% 00.07% 00.13% 00.05% 00.19% 00.04% 00.21% 00.07% 01.69% 00.03%Data shown includes WG grades for full-time, part-time, and intermittent temporary employees in a pay status and excluding medical and Manila residents.Please see Data Definitions for NOA codes included in the types of separations.