executive summary - dfat.gov.au · web viewbe submitted in word format, in plain english that is...
TRANSCRIPT

Review and Analysis of the Demand for Skills in the Solomon Islands Labour Market
Richard Curtain5 December 2013

Table of contents
Executive summary.....................................................................................................................3
Why another report on skills in Solomon Islands?.....................................................................5
Chapter One: Age and employment profile of the population....................................................9
Attachment 1.............................................................................................................................17
Chapter Two: Types of skills in demand: cognitive and social.................................................22
Chapter Three: Types of skills in demand: technical skills.......................................................25
Attachment 3.............................................................................................................................35
Chapter Four: Identifying skill shortages..................................................................................36
Attachment 4.............................................................................................................................42
Chapter Five: Identifying the skills gap....................................................................................44
Attachment 5.............................................................................................................................52
Chapter Six: Measuring the Skill gap.......................................................................................55
Attachment 6.............................................................................................................................62
Chapter Seven: Future skill needs.............................................................................................63
Attachment 7.............................................................................................................................68
Chapter Eight: Opportunities in Australian and New Zealand labour markets.........................70
Attachment 8.............................................................................................................................76
Chapter Nine: Temporary work in Australia and New Zealand................................................79
Chapter Ten: Current demand for skilled migrants in Australia and New Zealand..................83
Chapter Eleven: Recommendations on how to identify skills in demand................................88
Framework for the assessment of skills gaps across countries.................................................91
2 of 103

Executive summary
Context
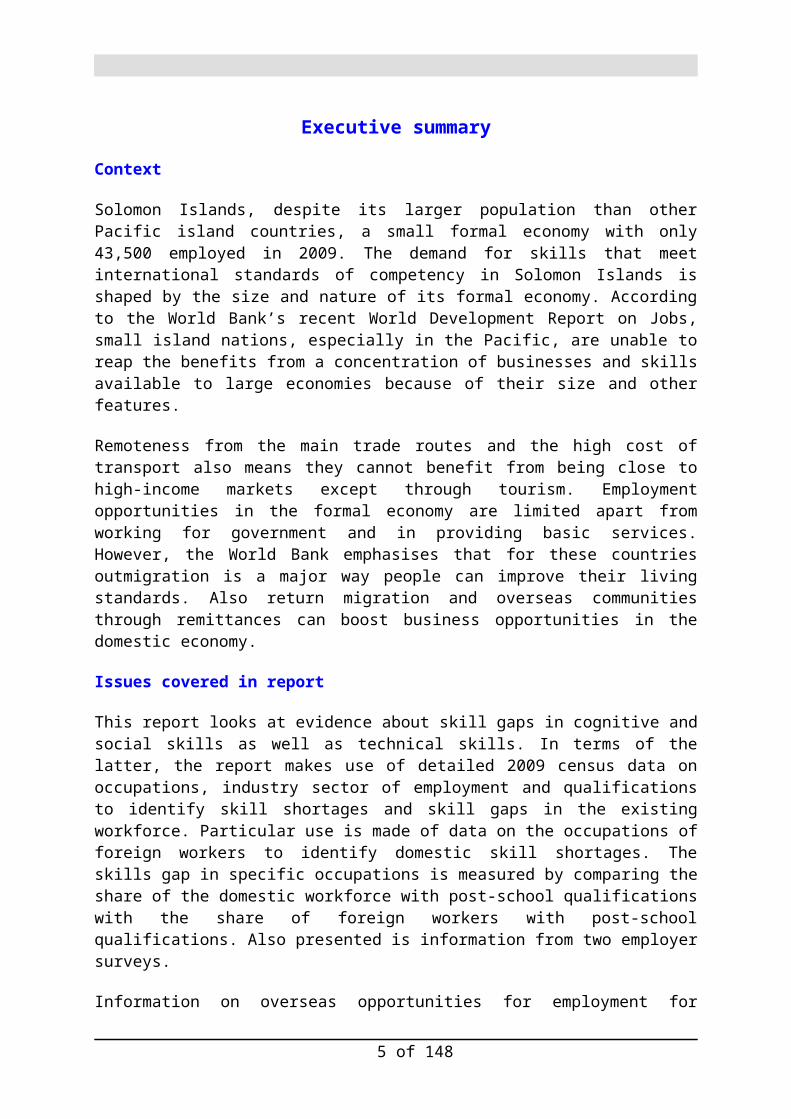
Solomon Islands, despite its larger population than other Pacific island countries, a small formal economy with only 43,500 employed in 2009. The demand for skills that meet international standards of competency in Solomon Islands is shaped by the size and nature of its formal economy. According to the World Bank’s recent World Development Report on Jobs, small island nations, especially in the Pacific, are unable to reap the benefits from a concentration of businesses and skills available to large economies because of their size and other features.
Remoteness from the main trade routes and the high cost of transport also means they cannot benefit from being close to high-income markets except through tourism. Employment opportunities in the formal economy are limited apart from working for government and in providing basic services. However, the World Bank emphasises that for these countries outmigration is a major way people can improve their living standards. Also return migration and overseas communities through remittances can boost business opportunities in the domestic economy.
Issues covered in report
This report looks at evidence about skill gaps in cognitive and social skills as well as technical skills. In terms of the latter, the report makes use of detailed 2009 census data on occupations, industry sector of employment and qualifications to identify skill shortages and skill gaps in the existing workforce. Particular use is made of data on the occupations of foreign workers to identify domestic skill shortages. The skills gap in specific occupations is measured by comparing the share of the domestic workforce with post-school qualifications with the share of foreign workers with post-school qualifications. Also presented is information from two employer surveys.
Information on overseas opportunities for employment for Solomon Islanders is another major focus of this report. This information covers the seasonal work opportunities in New Zealand and Australia. Opportunities for longer-term work in Australia are identified through a close look at the types of jobs Solomon Islands residents in Australia have, based on 2011 census data. Opportunities for skilled work in New Zealand are also highlighted by information on the occupations of migrants from Solomon Islands approved for skilled migrant entry. Other, more general information on opportunities for skilled work for Australia and New Zealand are also presented.
Key findings
The most direct and ‘hard’ measure of domestic skill shortages is a higher proportion of foreign workers in a specific occupation compared with other occupations. The presence of foreign workers is solid evidence that the domestic supply of skills training is inadequate because employers go to considerable expense to import and pay higher wages to these workers. For the occupations up to the technician & associate professional level, higher proportions of foreign workers are to be found, in rank order: machine operators & assemblers, drivers & mobile plant operators, retail & other services managers, physical & engineering science technicians, and metal machinery & related workers.
3 of 103

Skill shortage gaps for specific occupations have been identified by reference to the share of job holders with a post-school qualification in occupations where a post-school qualification is expected, for example, professional & technician occupations.
A specific measure used of the skills gap in an occupation is the difference between the proportion of foreign workers in with a post-school qualification and the proportion of domestic jobholders in that occupation with a post-school qualification. The occupations with the largest skills gap, based on this measure, are: life science & health professionals, extraction & building trades workers, and teachers have the next largest skills gap. Other large skills gaps are evident for retail and other services managers, science and engineering professionals, and physical & engineering science technicians.
The demand for skills to international standard is also shaped by the wage structure. Evidence from the 2006 household income and expenditure survey shows that workers with trade certificates are not paid more than workers without a certificate. Other evidence of shortages suggests that the demand for trade skills of international standard, especially in the construction sector, is low. Skills in demand, as shown in higher wages and the number of foreign workers with post-school qualifications, are more evident for jobs at the professional and technician skill levels. Nevertheless, the small numbers of jobholders in these occupations and the nature of the economy means the long-term demand for these skills is likely to be low.
If the supply of skills training is to be tied to employment outcomes, as a demand-driven training system requires, the domestic job opportunities are relatively few. Job vacancies are likely to be limited to replacement demand, based on current jobholders reaching retirement age or the small number who migrate to work overseas. Any expansion of skills training to international standards in Solomon Islands needs to focus on achieving employment outcomes in neighbouring high-income labour markets.
Short-term seasonal work in Australia and New Zealand has the potential to provide income to low-income households and communities. However, the numbers of those taking part have been low compared with neighbouring countries such as Vanuatu. From the perspective of the demand for skills training, it is low-skilled work in the sense that the skills can be learned relatively quickly on the job. Nevertheless, a reputation as productive workers has a high reward in the form of employer requests for workers to return or for others from their community to come.
Opportunities for skilled work in Australia and New Zealand are explored through the use of data from the 2011 Australian census on the occupations of Solomon Islands residents in Australia. Information on the occupations of skilled migrants from Solomon Islands to New Zealand is also presented More general information on the types of skill shortages in Australia and New Zealand is also provided.
The report concludes with recommendations on how to collect and build up a system of information to identify skills in demand. The recommended approach is a bottom-up, learn by doing approach based on local needs. This is to ensure that trainer providers and employers at are the centre of a system of data collection and feedback. The report closes with a framework showing the types of data and data sources needed to identify skills shortages and skills gaps.
4 of 103
The mismatch between technical skills demanded by the private sector and those supplied by the market [in Solomon Islands] is a concern. Having higher employment numbers alone will not be sufficient to drive the economy; there must also be high labour productivity. Manpower development plans must not be made in isolation from the industrial demand for labour ...1
Why another report on skills in Solomon Islands?
This report, commissioned by the AusAID post in Solomon Islands, is a labour market analysis which focuses on identifying the demand for skills in the Solomon Islands economy. The terms of reference for the report require that the analysis use available information across all industry sectors. The outcomes of the study are to include ‘a complete picture of the Solomon Islands labour market, based on the available research and analysis already undertaken over a number of years. The study is to identify gaps or areas of growth within the labour market that would benefit from an increase in skilled workers, and proposed steps to meet this demand. The study is also to identify gaps in available information where further labour market research is needed and to propose a methodology for undertaking this work.
Terms of Reference
a. analyse labour market demand, skills gaps and shortages across all industries in the Solomon Islands;
b. consider international labour markets in countries such as Australia and New Zealand and the barriers for Solomon Islanders in accessing these markets;
c. to the extent possible, analyse current and planned development activities to extract projections of the likely demand for skilled and qualified labour in the period 2014 – 2020, and the level and number of qualifications needed to meet the trends identified. Such trends should be quantified, specified and disaggregated by gender;
d. identify opportunities for women;e. include annexes providing more detailed break-down of skills gaps and recommended
qualifications; f. specification, scope and proposed methodology for any further analysis should it be
required; g. provide a 2-page Executive Summary that highlights key findings; andh. be submitted in Word format, in plain English that is easily accessible to the non-specialist
reader.
The specific focus of this report is to identify the skill shortages and skill gaps experienced by employers. Particular attention is given to technical skills, usually associated with post-school qualifications below degree level. Skill shortages refer to a situation where employers are not able to recruit people with appropriate skills from the domestic labour market for jobs that they want to fill. Skills gaps refer to a situation where employers regard their workers as not sufficiently skilled to do the work required of them.
1 Speech by Governor Denton Rarawa at launch of the CBSI 2012 Annual Report. Kitano Mendana Hotel, 10 May, 2013, p 3.
5 of 103

Need for this report
Why is a another report necessary? The justification for this report is twofold. Few reports have looked at the demand side of the labour market in Solomon Islands or have done so in only a partial way. The focus of most reports has been on the supply of training and plans for new training arrangements. The second justification for this report is the use for the first time of detailed 2009 census data on occupations and qualifications to provide a comprehensive profile of skill shortages and skill gaps, at a level of detail that has not been presented previously.
How to identify skills needed in the economy
The identification of the demand for skills in an economy has to start with the jobs employers are willing to fund and the services the self-employed are receiving income to provide. This information, in its most comprehensive form, is best sourced from a national census.
Benefits of using census data on occupations and qualification
The census has several advantages for assessing the state of the demand for skills. The first is that it not only covers all the adult population in employment, enabling it to collect data on small groups in the population who would be missed by a national sample survey. These groups include those working in small enterprises and foreign workers.
The second benefit of using the census is its use of a systematic way of classifying the job descriptions into categories of occupations. This means that the census potentially offers the chance to obtain specific detail on up to over 400 occupations. This level of detail is needed to understand what skills an economy needs. The data on job descriptions have to be coded at the base four-digit level so it can be aggregated to broader occupational groupings. However, for various reasons, census data on occupations are sometimes only made available at the two-digit or one-digit level. In the case of the Solomon Islands 2009 census, occupational data are only available at the two-digit level, offering detail for up to 43 occupational groups.
These data, together with information about the qualifications of job holders, provide a rich source of information about the national skills pool. They show changes in the importance and decline of broad occupational groups over time, and the changing value of qualifications to employers. Information on occupations and qualifications, based on a standard system of classifications, also enable comparisons to be made between countries, as a means of setting benchmarks for improvement.
Other data sources on the demand for skills
Between censuses, information on the demand for skills can be accessed from national or sector-wide surveys of enterprises or people in employment. The latter are directed mainly at people in the labour force, in the form of labour force survey. Data on occupations and qualifications can also be collected as part of a survey with another prime purpose such as a household income and expenditure survey.
However, these surveys need to meet several conditions. First, where they focus on individuals, they need to be based on a representative sample of the population in scope, for
6 of 103
example all those working in the formal economy, as defined. Second, the sample needs to be large enough to provide enough useful detail about important occupations and relevant qualifications. Third, the information on people’s work description needs to be coded into a recognised system of occupational classifications such as ISCO.
Fourth, it is highly desirable to collect information on jobs, skills and qualifications directly from enterprises. Employers are the primary decision-makers about what jobs to fund and what skills are needed to perform the tasks bundled together to form a job. Fifth, if data are collected from individuals in employment through a labour force or household income and expenditure survey, then information should also be collected about the individual’s employer, such as number of employees, activities of the enterprise, and location.
Limits of this report
No information was available on the employment outcomes or wage levels of any post-school education & training graduates. Nor was recent information available on wage levels by occupation more generally in the economy. Up-to-date information on wages and occupations will be available from the 2013 household income and expenditure survey which is now in the field (August 2013). Information on occupations from the National Provident Fund is available only up to 2006 as the occupation information has not been collated since then. Information on occupations from the census is only available at the two-digit level and is, therefore, limited to some 40 occupation groups. Information on the occupations of foreign workers from their work visas was not available.
Review of existing reports
This review has consulted 15 reports written since 2007 on aspects of the skills needs of the Solomon Islands economy. These reports are listed in a separate attachment to this report, with an assessment of whether they focus on employer demand for skills, whether the report has a focus on specific occupations and qualifications, whether data are presented on the occupations of foreign workers. Other questions asked relate to the data sources used, such as census data, data on occupations and industry of employment based on the records of the National Provident Fund, an employer survey or a household income and expenditure survey.
Only one report, the 2007 World Bank study on skills in Solomon Islands, covers the national economy with a substantial focus on the demand for skills. However, this study has limitations. No data from the 1999 census on occupations were used, despite the fact that it is available to the three-digit level (up to 116 occupations in ISCO 88). Information is presented in the report on the occupations of contributors to the National Provident Fund in an appendix but no skills-based analysis of these data are provided. The study was also unable to make use of the 2006 household income and expenditure survey results.
The other reports provide a partial picture about the demand for skills in Solomon Islands. Some reports give only limited attention to skills demand in Solomon Islands as they are covering many of the countries in the region. Some reports are based on primary data collection. One survey is limited to a particular industry sector, construction and is focused on one key issue, how to promote the number of women employed in that sector. Other reports are focused on a set of occupations such as health. Reports which provide an overview of the issues related to skills are based on an analysis of secondary data, but often with no additional analysis of available data sources. A potentially important survey of the demand for skills in
7 of 103

the private sector by Solomon Islands Chamber of Commerce and Industry (SICCI) in 2011 only includes a minority of SICCI members, only some 30 or so enterprises.
Outline of the report
Chapter One presents an overview of the age and employment profile of the population. Chapter Two presents information on two of the three broad types of skills in demand: cognitive and social skills. Chapter Three focus in on the broad category of technical skills. Chapter Four reports on surveys of employers about the skill shortages they have. Chapter Five uses information about the qualifications of job holders in professional and associate professional occupations to identify the skills gap in the existing workforce. Chapter Six measures the skill gap in specific occupations by comparing the share of foreign workers with post-school qualifications with the share of Solomon Islands jobholder with post-school qualifications.
Chapter Seven looks at available information on future infrastructure projects to offer a guide to future skill needs. Chapter Eight looks at opportunities for work in Australian and New Zealand labour markets based on the occupations of Solomon Island residents in Australia in 2011 and migrants from Solomon Islands granted a work visa in New Zealand.
Chapter Nine presents data on the temporary work opportunities in Australia and New Zealand. Chapter Ten discusses the current demand for skilled migrants in Australia and New Zealand. Chapter Eleven concludes the report with recommendations about how to best collect and analyse data on the demand for skills relevant to the conditions in Solomon Islands.
8 of 103

Chapter One: Age and employment profile of the population
Age structure of Solomon Islands
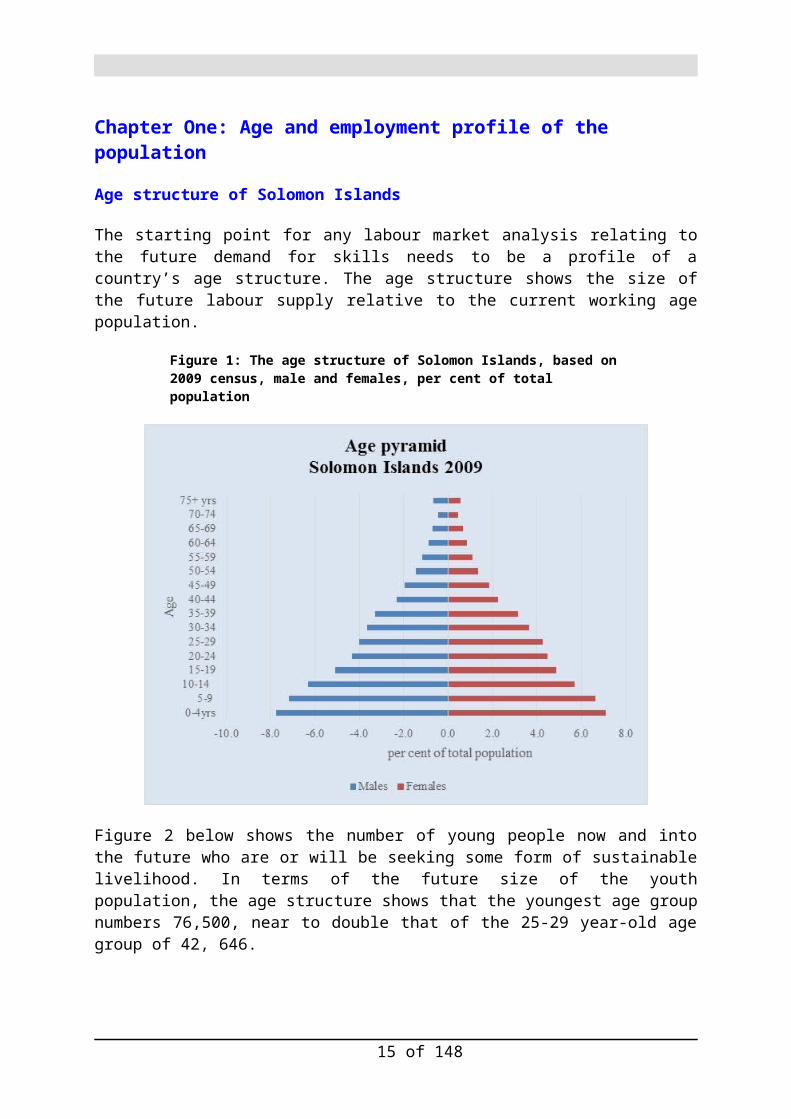
The starting point for any labour market analysis relating to the future demand for skills needs to be a profile of a country’s age structure. The age structure shows the size of the future labour supply relative to the current working age population.
Figure 1: The age structure of Solomon Islands, based on 2009 census, male and females, per cent of total population
Figure 2 below shows the number of young people now and into the future who are or will be seeking some form of sustainable livelihood. In terms of the future size of the youth population, the age structure shows that the youngest age group numbers 76,500, near to double that of the 25-29 year-old age group of 42, 646.
9 of 103

Figure 1: Numbers in the child and youth age groups, Solomon Islands census 2009
76,50071,071
61,892
51,17145,37142,646
37,57233,141
23,63419,709
14,33011,7848,9117,0164,697 6425
0
10,000
20,000
30,000
40,000
50,000
60,000
70,000
80,000
90,000
0-4yrs
5-9yrs
10-14yrs
15 -19
20 -24
25 -29
30 -34
35 -39
40 -44
45 -49
50 -54
55 -59
60 -64
65 -69
70 -74
75+yrs
Youth-dominated age structure: number in each five-year age group
The youth bulge and the pressure for more jobs
The best measure of a youth bulge in the population is the share of young people in the adult population. The youth population can be defined in terms of age narrowly as 15-24 years or more broadly as 15-29 years.
Figure 3: Proportion of young people aged 15-24 years and 15-29 years in the population aged 15 years and above, per cent
32
45
36
52
0 10 20 30 40 50 60
15-24 yrs National
15-29 yrs National
15-24 yrs Honiara
15-29 yrs Honiara
Per cent of population 15 years & above
Youth bulge: Share of youth age groups in adult population, Honiara & Total
Figure 3 shows that near to one-in-three (32 per cent) of the adult population nationally are aged 15-24 years and near to half (45 per cent) of the adult population are aged 15-29 years. The youth age group 15-24 years accounts for over a third (36 per cent) of the adult
10 of 103

population of Honiara. The youth age 15-29 years accounts for over half (52 per cent) of the adult population in Honiara.
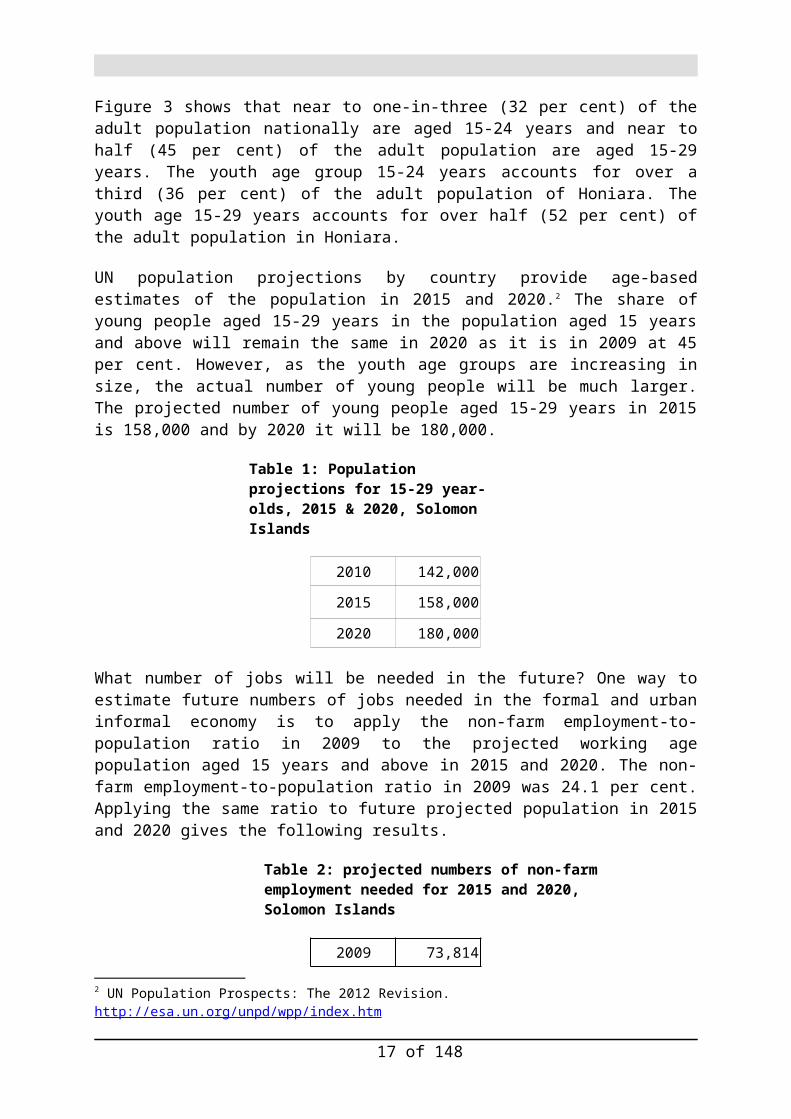
UN population projections by country provide age-based estimates of the population in 2015 and 2020.2 The share of young people aged 15-29 years in the population aged 15 years and above will remain the same in 2020 as it is in 2009 at 45 per cent. However, as the youth age groups are increasing in size, the actual number of young people will be much larger. The projected number of young people aged 15-29 years in 2015 is 158,000 and by 2020 it will be 180,000.
Table 1: Population projections for 15-29 year-olds, 2015 & 2020, Solomon Islands
2010 142,000
2015 158,000
2020 180,000
What number of jobs will be needed in the future? One way to estimate future numbers of jobs needed in the formal and urban informal economy is to apply the non-farm employment-to-population ratio in 2009 to the projected working age population aged 15 years and above in 2015 and 2020. The non-farm employment-to-population ratio in 2009 was 24.1 per cent. Applying the same ratio to future projected population in 2015 and 2020 gives the following results.
Table 2: projected numbers of non-farm employment needed for 2015 and 2020, Solomon Islands
2009 73,814
2015 85,073
2020 96,159
This simple modelling exercise shows that a further 11,000 jobs are needed in 2015 and in 2020, another 11,000 jobs just to maintain the same non-farm employment-to-population ratio of 2009.
Employment structure of Solomon Islands economy
The 2009 census asked what type of work/activity does this person usually do? The reference period was the previous week and the question was asked of the population aged 12 years and above. The responses were collected according to eight employment categories: government or private sector employee, employer to self-employed, voluntary work, unpaid family worker, producing goods for sale and producing goods for own consumption. To give a broader overview of the employment structure of the Solomon Islands, these categories can be grouped into three broader types of economies: formal, informal and subsistence (see Table 3).
2 UN Population Prospects: The 2012 Revision. http://esa.un.org/unpd/wpp/index.htm
11 of 103

The formal economy, consisting of wage employees and employers employs only one-in-five (21 per cent) of the employed population aged 15 years and above (Table 3). Near to two-in-five (37 per cent) are employed in the informal economy, either as self-employed, volunteers, unpaid family workers or producing goods such as cash crops for sale. Just over two-in-five (42 per cent) are mainly producing goods for their own consumption in the subsistence economy. The numbers employed in the formal economy in mid 2009 are broadly consistent with 48,332 NPF contributors at the end of 2012. The later was a 9 per cent increase on the previous year 2011.3
Table 3: Employment profile of population aged 15 years and above, Solomon Islands 2009, numbers & per cent
Formal economy
Informal economy
Subsistence economy Total
43,505 77,763 86,850 208,118
20.9 37.4 41.7 100
The formal economy can be further grouped into government and private sector employees and employers (see Table 4). Just over one-in-three (35 per cent) of the population aged 12 years and over are government employees, three-in-five (62 per cent) are private sector employees and 4 per cent are employers.
Table 4: Type of employment in the formal economy for the population aged 15 years & above, Solomon Islands 2009, numbers & per cent
Government employee
Private sector
employeeEmployer Total
15,126 26,878 1,501 43,505
34.8 61.8 3.5 100.0
Occupations of contributors to the National Provident Fund
More recent data, using information from the National Provident Fund (NPF), are presented below. These data focus on wage employees and employers - those employed in both the public and private sectors of the formal economy. The most stable quarterly figures from the NPF are for the second, third and fourth quarters in 2012 and the first quarter in 2013. The table presents the average for these four quarters.
Data from the 2009 census on employment by specific industry sector is shown in Attachment 1 to this chapter. These data include a number of sectors that are not in the formal economy. These are:
01 Crop and animal production hunting and related service activities
3 Speech by Governor Denton Rarawa at launch of the CBSI 2012 Annual Report. Kitano Mendana Hotel, 10 May, 2013, p 3.
12 of 103
03 Fishing and aquaculture 16 Manufacture of wood and of products of wood and cork except furniture;
manufacture of articles of straw and plaiting materials 98 Undifferentiated goods-producing activities of private households for own use
With the above sectors excluded from the census industry data to focus on the formal economy, a comparison between the census data and the NPF data, sector by sector, shows a reasonable correspondence except for one sector. The total number in the construction sector in the census is 8,070 plus two specialist construction sectors with 283 and 251 respectively. However the NPF data show that only 1,266 people are employed as wage employees in the sector and the SIBEPA survey records 2,788 employees in construction.
Another sector where the figures between total employment in the census and wage employment (NPF) are different is in retail. The census records 7,587 in the retail trade except motor vehicles. The NPF records 3,854 employers and employers. The census, no doubt, includes storekeepers, market stall holders and street sellers as well as those employed as wage employees in the formal economy.
Domestic/personal services is heavily male dominated and suggests that the data refer to security guards employed by established security firms. It is likely that women employed as domestic servants are not members of the NPF. However, both data sets have gaps and consistencies between them, and should be taken as indicative only and not offering definitive results. The key fact taken from the comparison of the two data sources on industry is the lower count for the number of wage employees and employers in the construction sector in the formal economy.
The largest industry sectors in terms of NPF contributors in employment are: education services (10,139), public administration (8,134), logging (6,731), retail trade (3,854), other social services (2,053), agriculture services (1,809), food manufacturing (1,806). Other significant employment sectors are wholesale trade (1,581), religion (1,356), mining (1,295), construction (1,266), domestic/personal services (1,249), hotels (1,204) and health services (1,001).
Female male balance
The industries with the most female employees are: restaurants (72 per cent), food manufacturing (59 per cent), health services (57 per cent) and hotels (56 per cent). The industries where women have below national average presence are as follows: construction (7 per cent), logging (8 per cent), domestic/personal services (9 per cent), water transport (11 per cent), forestry (11 per cent), fishing (11 per cent). The also include: saw milling (11 per cent), mining (13 per cent), tobacco manufacturing (13 per cent), electricity (13 per cent) auto repair services (15 per cent), agriculture & livestock production (17 per cent), information technology (18 per cent), religion (21 per cent), communication services (26 per cent) and wholesale trade (28 per cent).
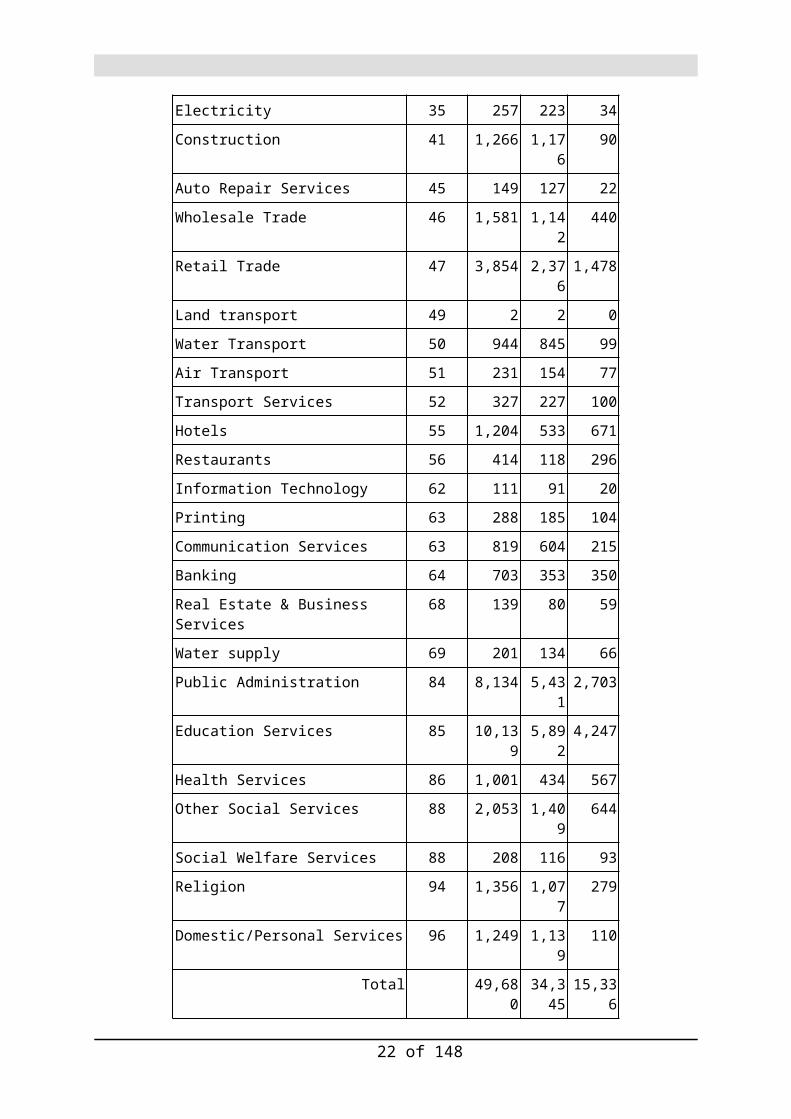
Table 5: Industry wage & salary employment, 2012-2013, average over four quarters, 2012-2013, total, male, female
Industry Industry code Total Male Female
13 of 103

Agriculture Services 01 1,809 1,149 660
Agriculture & Livestock Production 01 46 38 8
Saw Milling 02 214 190 24
Forestry 02 297 266 32
Logging 02 6,731 6,212 519
Fishing 03 603 537 67
Mining 07 1,295 1,133 162
Food Manufacturing 10 1,806 742 1,064
Tobacco Manufacturing 12 174 151 23
Clothing Manufacturing 14 21 6 15
Furniture Manufacturing 31 57 55 2
Other Manufacturing 32 2 2 0
Electricity 35 257 223 34
Construction 41 1,266 1,176 90
Auto Repair Services 45 149 127 22
Wholesale Trade 46 1,581 1,142 440
Retail Trade 47 3,854 2,376 1,478
Land transport 49 2 2 0
Water Transport 50 944 845 99
Air Transport 51 231 154 77
Transport Services 52 327 227 100
Hotels 55 1,204 533 671
Restaurants 56 414 118 296
Information Technology 62 111 91 20
Printing 63 288 185 104
Communication Services 63 819 604 215
Banking 64 703 353 350
Real Estate & Business Services 68 139 80 59
Water supply 69 201 134 66
Public Administration 84 8,134 5,431 2,703
Education Services 85 10,139 5,892 4,247
Health Services 86 1,001 434 567
Other Social Services 88 2,053 1,409 644
Social Welfare Services 88 208 116 93
Religion 94 1,356 1,077 279
Domestic/Personal Services 96 1,249 1,139 110
14 of 103
Total 49,680 34,345 15,336Source: National Provident Fund, Solomon Islands
Focus on specific sectors
The design specification for Skilling Youth in the Pacific Program identifies engineering, manufacturing, construction and maritime industries as a primary focus with education and health sectors a secondary focus. The information on industry sectors from the 2009 census, presented in Table A1.1 to this chapter.
Engineering
The only sector that makes explicit reference to engineering is the civil engineering sector. This sector has 283 employees.
Manufacturing
The data show that manufacturing jobs in the formal economy is 3,650. This calculation excludes the sector ‘manufacture of wood & of products of wood & cork except furniture; manufacture of articles of straw & plaiting materials’ on the assumption that it covers work such as wood carvers in the informal economy. Nearly half of this employment in the formal economy is in food manufacturing which is dominated by work for Sol Tuna which has more than 1,500 workers in the Western Province and Guadalcanal.
The other manufacturing sectors have relatively few employers, ranging from 148 employed in the manufacture of furniture, 142 employed in the manufacture of other non-metallic mineral products, 124 in the manufacture of other transport equipment, 120 in the manufacture of textiles, and 104 in the manufacture of wearing apparel, and 93 in the manufacture of beverages. Other sectors with smaller numbers of employees are 81 working in the manufacture of tobacco products, 76 working in printing & reproduction of recorded media, 53 working in the manufacture of basic metals, and 50 employed in the manufacture of pharmaceuticals, medicinal chemicals & botanical products. The small numbers in employment by sector activity suggest that the enterprises engaged in manufacturing are small, and with this it can be assumed, limited capacity for in-house training.
Construction
It is difficult to know the size of employment in the construction in the formal economy from the available census data, As noted above, the 8,070 recorded for employment in the construction sector needs to be compared with the 1,266 employed as wage employees and NPF contributors. Another reference point is the SIBEPA survey results which number of people employed is 2,788 in 161 companies.4 The NPF contributors are likely to represent the core workforce and the remaining 1,500 or so are likely to be temporary employees or subcontractors who are engaged only for the life of a project.
4 D&C Enterprises Ltd for the Solomon Islands Built Environment Professionals Association (SIBEPA), 2011, Construction Sector Survey Surveyed by D&C Enterprises Ltd on behalf of RSIIP and funded by The RAMSI Development Program, p 10.
15 of 103

The SIBEPA survey notes that the construction industry has a small number of large employers and many small employers. The five largest employers account for 1,021 employees, out of the total 2,746 employees (see Figure 4 below), with the next largest employer with 50 employees.
Figure 4: Five largest employers by employment size in the construction industry in Solomon Islands, November 2011
Maritime industry
The size of employment in the maritime industry is difficult to gauge from the available census data. No employment is recorded for any of the transport sectors: land, water or air. This could be to do with these employees being away from home when the census interviewers called.
The NPF data in Table 5 above show that 944 are employees in water transport. In rank order, this employment size places it in fifteenth position behind hotels with 1,204 employees and health services with 1,001 employees.
16 of 103
Attachment 1
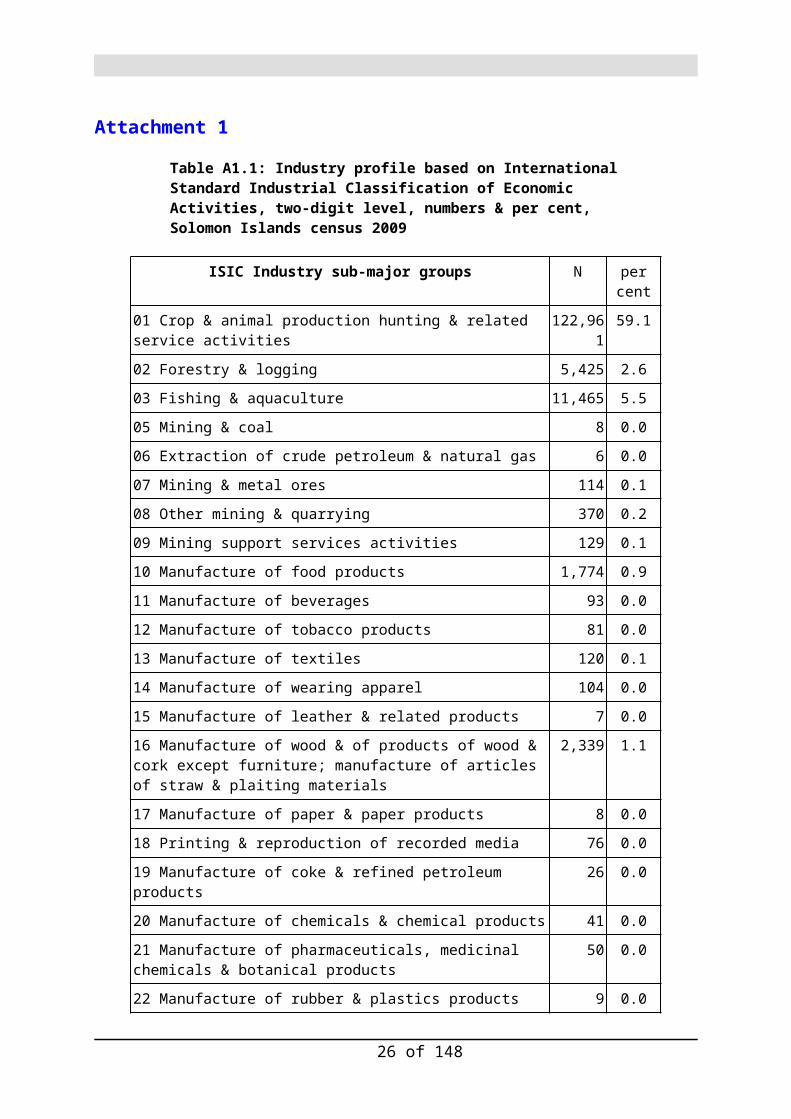
Table A1.1: Industry profile based on International Standard Industrial Classification of Economic Activities, two-digit level, numbers & per cent, Solomon Islands census 2009
ISIC Industry sub-major groups N per cent
01 Crop & animal production hunting & related service activities 122,961 59.1
02 Forestry & logging 5,425 2.6
03 Fishing & aquaculture 11,465 5.5
05 Mining & coal 8 0.0
06 Extraction of crude petroleum & natural gas 6 0.0
07 Mining & metal ores 114 0.1
08 Other mining & quarrying 370 0.2
09 Mining support services activities 129 0.1
10 Manufacture of food products 1,774 0.9
11 Manufacture of beverages 93 0.0
12 Manufacture of tobacco products 81 0.0
13 Manufacture of textiles 120 0.1
14 Manufacture of wearing apparel 104 0.0
15 Manufacture of leather & related products 7 0.0
16 Manufacture of wood & of products of wood & cork except furniture; manufacture of articles of straw & plaiting materials
2,339 1.1
17 Manufacture of paper & paper products 8 0.0
18 Printing & reproduction of recorded media 76 0.0
19 Manufacture of coke & refined petroleum products 26 0.0
20 Manufacture of chemicals & chemical products 41 0.0
21 Manufacture of pharmaceuticals, medicinal chemicals & botanical products
50 0.0
22 Manufacture of rubber & plastics products 9 0.0
23 Manufacture of other non-metallic mineral products 142 0.1
24 Manufacture of basic metals 53 0.0
25 Manufacture of fabricated metal products except machinery & equipment
38 0.0
26 Manufacture of computer electronic & optical products 5 0.0
27 Manufacture of electrical equipment 8 0.0
28 Manufacture of machinery & equipment 43 0.0
29 Manufacture of motor vehicles trailers & semi-trailers 26 0.0
17 of 103

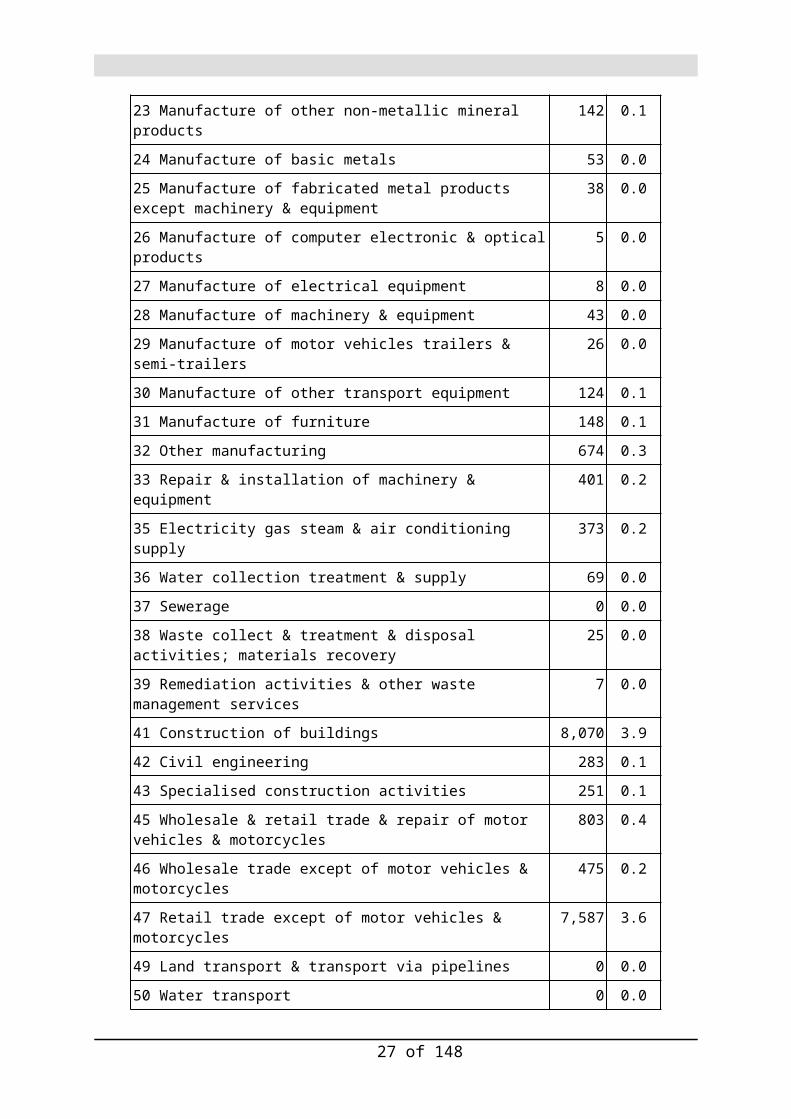
30 Manufacture of other transport equipment 124 0.1
31 Manufacture of furniture 148 0.1
32 Other manufacturing 674 0.3
33 Repair & installation of machinery & equipment 401 0.2
35 Electricity gas steam & air conditioning supply 373 0.2
36 Water collection treatment & supply 69 0.0
37 Sewerage 0 0.0
38 Waste collect & treatment & disposal activities; materials recovery 25 0.0
39 Remediation activities & other waste management services 7 0.0
41 Construction of buildings 8,070 3.9
42 Civil engineering 283 0.1
43 Specialised construction activities 251 0.1
45 Wholesale & retail trade & repair of motor vehicles & motorcycles 803 0.4
46 Wholesale trade except of motor vehicles & motorcycles 475 0.2
47 Retail trade except of motor vehicles & motorcycles 7,587 3.6
49 Land transport & transport via pipelines 0 0.0
50 Water transport 0 0.0
51 Air transport 0 0.0
52 Warehousing & support activities for transportation 0 0.0
53 Postal & courier activities 0 0.0
55 Accommodation 775 0.4
56 Food & beverage services activities 694 0.3
58 Publishing activities 82 0.0
59 Motion picture video & television programme production etc 47 0.0
60 Programming & broadcasting activities 83 0.0
61 Telecommunications 385 0.2
62 Computer programming consultancy & related activities 82 0.0
63 Information services activities 127 0.1
64 Financial services activities except insurance & pension funding 405 0.2
65 Insurance re-insurance & pension funding except compulsory social security
32 0.0
66 Activities to financial services & insurance activities 59 0.0
68 Real estate activities 16 0.0
69 Legal & accounting activities 285 0.1
70 Activities of head offices; management consultancy activities 64 0.0
71 Architectural & engineering activities; technical testing & analysis 93 0.0
18 of 103

72 Scientific research & development 5 0.0
73 Advertising & market research 9 0.0
74 Other professional scientific & technical activities 34 0.0
75 Veterinary activities 1 0.0
77 Rental & leasing activities 6 0.0
78 Employment activities 45 0.0
79 Travel agency, tour operator, reservation services & related acts 45 0.0
80 Security & investigation activities 1,931 0.9
81 Services to buildings & landscape activities 82 0.0
82 Office admin, office support & other business support activities 138 0.1
84 Public Administration & defence 6,926 3.3
85 Education 7,706 3.7
86 Human Health activities 1,907 0.9
87 Residential care activities 13 0.0
88 Social work activities without accommodation 26 0.0
90 Creative arts & entertain activities 135 0.1
91 Libraries archives museums & other cultural activities 78 0.0
92 Gambling & betting activities 123 0.1
93 Sports activities & amusement & recreation activities 190 0.1
94 Activities of members organisations 2,558 1.2
95 Repair of computers & personal & household goods 5 0.0
96 Other personal service activities 181 0.1
97 Activities of households as employees of domestic personnel 1,027 0.5
98 Goods-producing activities of private households for own use 16,026 7.7
99 Activities of extraterritorial organisations & bodies 881 0.4
Total 208,118 100.0
19 of 103
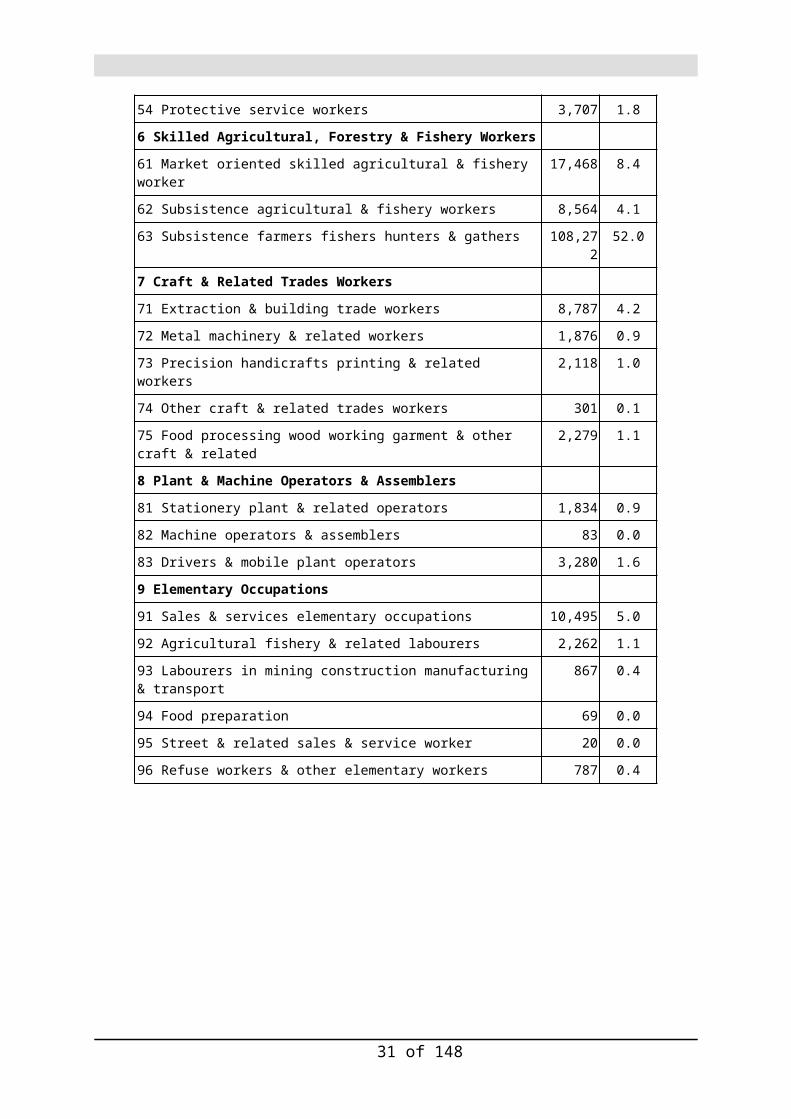
Table A1.2 Classification of sub-major occupation groups, ISCO 88, numbers & per cent, Solomon Islands census 2009
ISCO 88 Sub-major occupation groups N Per cent
1 Managers
11 Legislators & senior officials 988 0.5
12 Corporate managers 747 0.4
13 General Managers 229 0.1
14 Retail & other services manager 341 0.2
2 Professionals
21 Physical mathematical & engineering science professionals 583 0.3
22 Life science & health professionals 1,525 0.7
23 Teaching professionals 7,773 3.7
24 Other professionals 1,744 0.8
25 Information & communications technology professionals 53 0.0
26 Legal social & cultural professionals 1,606 0.8
3 Technicians & Associate Professionals
31 Physical & engineering science technicians 999 0.5
32 Life science & health associate professionals (except nursing) 473 0.2
33 Teaching associate professionals 1,072 0.5
34 Other associate professionals 769 0.4
35 Information & communications technicians 187 0.1
4 Clerical Support Workers
41 Office Clerks 543 0.3
42 Customer service clerks 686 0.3
43 Numerical & material recording clerks 1,363 0.7
44 Other clerical support workers 181 0.1
5 Services and Sales Workers
51 Personal & protective services workers 7,587 3.6
52 Salespersons 5,197 2.5
53 Personal care workers 64 0.0
54 Protective service workers 3,707 1.8
6 Skilled Agricultural, Forestry & Fishery Workers
61 Market oriented skilled agricultural & fishery worker 17,468 8.4
62 Subsistence agricultural & fishery workers 8,564 4.1
63 Subsistence farmers fishers hunters & gathers 108,272 52.0
7 Craft & Related Trades Workers
71 Extraction & building trade workers 8,787 4.2
72 Metal machinery & related workers 1,876 0.9
20 of 103

73 Precision handicrafts printing & related workers 2,118 1.0
74 Other craft & related trades workers 301 0.1
75 Food processing wood working garment & other craft & related 2,279 1.1
8 Plant & Machine Operators & Assemblers
81 Stationery plant & related operators 1,834 0.9
82 Machine operators & assemblers 83 0.0
83 Drivers & mobile plant operators 3,280 1.6
9 Elementary Occupations
91 Sales & services elementary occupations 10,495 5.0
92 Agricultural fishery & related labourers 2,262 1.1
93 Labourers in mining construction manufacturing & transport 867 0.4
94 Food preparation 69 0.0
95 Street & related sales & service worker 20 0.0
96 Refuse workers & other elementary workers 787 0.4
21 of 103
Chapter Two: Types of skills in demand: cognitive and social
Three types of skills can be identified: cognitive (or thinking) skills, social skills and technical skills.5
Cognitive skills refer to the ability to read and write, being able to express oneself verbally, have a good working memory, and being numerate and able to solve simple problems.
Social skills refer to the ability to work with others as part of a team, to be reliable, to show self-discipline and to make the effort to complete the work as expected.
Technical skills refer to the ability to perform certain tasks.
Identifying cognitive skills
Cognitive skills can only be assessed by special surveys such as early grade reading assessments undertaken in Tonga and Vanuatu. The Solomon Islands Standardised Testing and Assessment provides similar information. Surveys of the adult population include the Literacy and Education Experience Survey conducted by the Asia South Pacific Association for Basic and Adult Education (ASPBAE) and the Coalition for Education in Solomon Islands.
The census provides data on a self-assessment of whether literate or not. The 2009 census found an adult literacy rate of 84 per cent. However, the Literacy and Education Experience Survey, referred to above, focused on adults who said they could speak English or Pijin and asked them to do a simple test involving reading, writing and counting. The survey results, based on a random sample of 1,780 adults for two provinces, Renbel and Isabel, showed that having attended school does not assure the attainment of literacy.
The survey found that over 50 per cent of adults who completed primary school were classified as semi-literate. Only a third of adults in Renbel and a quarter in Isabel were rated as literate. Over half in both provinces, 51 and 56 per cent respectively, were rated as semi-literate. Between one-in-six and one-in-five, 15 and 19 per cent respectively, were rated as non-literate.6 Even more telling is the finding that a significant minority of those who completed of secondary school were not rated as literate. Of those who completed secondary school, only two-in-three (65 per cent) were literate and one-in-three (33 per cent) were rated as semi-literate in Renbel Province. In Isabel Province just less than half (45 per cent) of those surveyed were rated as literate and near to half were rated as semi-literate.7
The same picture applies to the results of a similar survey, based on a random sample of 2,200, conducted in Honiara and Malaita in late 2006 and early 2007. This survey showed that only just over one-in-four of those who had completed primary school could be rated as literate. Less than half of those who had completed secondary school were rated as literate.8 5 Box 5.7 ‘How skills are formed and how they are measured’ in World Bank, 2012, World Development Report 2013: Jobs. Washington DC, p 1756 ASPBAE Australia, 2011, ASPBAE Education Experience Survey and Literacy Assessment Renbel and Isabel Provinces, Solomon Islands ASPBAE Australia Ltd and Coalition for Education Solomon Islands (COESI), Canberra, Table 36, p 25. see http://www.campaignforeducation.org/csef/bulletins/sep11/Renbel_and_Isabel_Survey_Report_Apr_20_2011.pdf 7 ASPBAE Australia, 2011, ASPBAE Education Experience Survey and Literacy Assessment Renbel and Isabel Provinces, Solomon Islands. Table 37, p 26. 8 ASPBAE, 2007, Solomon Islands: Summary Report Education Experience Survey Education, Language and
22 of 103
Table 6 below shows that young people are more likely to be literate in Renbel Province with just under half of 15-24 year-olds rated as literate. Nevertheless, two-in-five of this youth age group are rated as semi-literate. For Isabel Province, the proportion of young people who are literate is much lower, with over half rated as semi-literate and one-in-four rated as not literate. These results suggest that despite younger age groups having more recent access to schooling, this schooling seems to be failing many young people.
Table 6: Literacy rating by five year age group, Renbel and Isabel Provinces, 2010
Source: ASPRAE Education experience survey and literacy assessment, Renbel and Isabel Provinces, 2010, p 23.
It is interesting to note that a World Bank multivariate analysis of the determinants of wage differences show that only those employees older than age 24 years with tertiary education have a higher wage compared with those with a primary or secondary education or a vocational certificate.9 In other words, employers in Solomon Islands are only willing to pay higher wages for employees with tertiary education. This analysis is based on 2006 data and so may not be as applicable seven years later.
Identifying social skills
The importance of social skills to employers in Solomon Islands is shown in the answers to a survey question about the skills and qualities most difficult to find in new employees between 15 to 30 years of age. Table 7 shows that employers rate work attitude, communication and experience slightly ahead of education level and technical skills. The survey of employers is based on responses from about a third of the 100 members of the Solomon Islands Chamber of Commerce & Industry.
Table 7: Skills and qualities most difficult to find in new employees between 15 to 30 years of age, Survey of SICCI members, 2012
Experience, p12 . Available at http://www.paddle.usp.ac.fj/collect/paddle/index/assoc/abspae00.dir/doc.pdf 9 See Appendix 14: Determinants of wages among the employed, impact on wages, p 69; Emily Farchy, 2011, Labor Markets In The Pacific Islands, East Asia and Pacific Social Protection, Human Development Department, World Bank, Sydney Regional Office. Model 3 shows that the significant factors in explaining a higher wage rate are being older than 15-24 years, having tertiary education, being a household head and living in an urban area. Both primary and secondary education attainment are not significant and have a negative sign. Having a vocational certificate appears to be positively associated with a higher wage but the association is not statistically significant. The numbers of vocational certificate holders over the age of 24 may not be large enough to have an impact on the results. I am grateful to Brent Taylor for his comments on how to interpret these results.
23 of 103

Skills or qualities Per cent
Work Attitude 15.7
Communication 14.0
Experience 12.0
Educational Level 11.7
Decision Making 11.7
Technical Skills 11.4
Computer & IT 10.8
Analytical Skills 10.8
Foreign Language 2.0
Total 100
These results show the importance of including opportunities to acquire social skills in the design of any technical training program. This includes mandatory periods of structured work placement in workplaces with mentors or supervisors who have themselves the time and understanding of how to impart these social skills. Where the technical training is aimed at meeting the competency standards of Australian or New Zealand workplaces, the work experience needs to be comparable to the performance standards applied in these overseas workplaces.
Conclusion
Social and emotional intelligence is just as important as cognitive and technical skills. So-called non-cognitive social skills, attributes like self-restraint, persistence and self-awareness, may be better predictors of a person's life trajectory than standard academic measures. A 2011 study using data collected on 17,000 British infants followed over fifty years found that a child's level of mental well-being correlated strongly with future success.10
A key element of any skills training program in Solomon Islands has to provide opportunities to acquire these social skills. One way to do this is to provide work placements in high performance workplaces in Solomon Islands, where the number of places will be limited, or in workplaces in the region, especially in Australia or New Zealand.
10 Kahn, J, 2013, ‘Can emotional intelligence be taught?’ New York Times Sunday magazine, 15 September.
24 of 103

Chapter Three: Types of skills in demand: technical skills
The best way to identify the level of technical skills in the formal economy is to use national data on occupation classified according to a skills-based occupation classification system. The census provides a greatly underused source of information on the nature of the demand for skilled jobs in the economy.
As with all data collection exercises, it involves taking the raw description of a person’s job and coding it into a recognised system of classification. The system used in the Pacific island countries and in many other countries is the ILO’s International Standard Classification of Occupations (ISCO). The ISCO is often used by countries without adaptation while some countries use ISCO as a basis for developing their own job classification system. Australia and New Zealand have their own job classification called ANZSCO which is compatible with ISCO. A concordance or ‘cross walk’ is available for an earlier version of ISCO and the Australian Bureau of Statistics (ABS) have stated on their website that a concordance is under development for the most recent version, although this needs to be confirmed by the ABS.
The ISCO is broadly skills-based system of job classification, based on the two defining features of jobs: skill level and skill specialisation. The listing of major civilian occupational groups starts with senior officials and managers at the top, followed by professionals, technicians & associate professionals next etc.
ISCO Major groups
0--Armed forces occupations
1--Managers
2--Professionals
3--Technicians and associate professionals
4--Clerical support workers
5--Service and sales workers
6--Skilled agricultural, forestry and fishery workers
7--Craft and related trades workers
8--Plant and machine operators, and assemblers
9--Elementary occupations
25 of 103
ISCO-08 is a four-level classification system that allows all jobs to be classified into 436 unit groups based on their similarity in terms of the skill level and skill specialisation. These groups form the most detailed level of the classification structure at the four-digit level. These can then be aggregated into 130 minor groups at the three-digit level, 43 sub-major groups at the two-digit level and 10 major groups at the one-digit level.
This system, as its 2012 manual states ‘allows the production of relatively detailed internationally comparable data as well as summary information for only 10 groups at the highest level of aggregation’.11
The senior officials and managerial occupations start with digit 1. Professional occupations start with the digit 2, technical & associate professional occupations with the digit 3, clerical support occupations with the digit 4. Service and sales workers commerce with digit 5. Skilled agricultural, forestry and fishery workers start with digit 6 and trade-related occupations with the digit 7. Plant and machine operators, and assemblers start with digit 8 and elementary occupations start with digit 9.
The latest version is ISCO 08 adopted at the beginning of 2008. However, the Solomon Islands 2009 census uses an earlier version ISCO 88 (adopted in 1988).12 ISCO 88 is essentially the same but with some important changes to reflect the changing nature of work, especially involving computers. The advantage that the use of ISCO 88 in the 2009 census provides is an easier comparison with the occupations in the 1999 census based on ISCO 88.
However, unfortunately the information on jobs from 2009 census has only been released at the two-digit level, unlike the 1999 census which published information on occupations at the three-digit level. This means that information is only available for some 40 occupational groups compared with over 130 occupational groups in 1999 (see Table A3.1 in the attachment to this chapter for information on the numbers of groups at each level of ISCO 08 and ISCO 88).
The fact that the more detailed three-digit occupational groups are not available for the 2009 census is a major gap in our understanding of the nature of the demand for skills in Solomon Islands. It is at this level that occupations are more easily recognised. For example, rather than Science and engineering associate professionals, it is possible to identify as separate occupations such as following relevant occupations.
311 - Civil chemical mechanical & electrical technicians
312 - Construction manufacturing & mining supervisor
313 - Chemical natural gas power processing plant controllers
314 - Agricultural & life science technicians
315 - Air & ships professionals
11 ILO, 2012, International Standard Classification of Occupations: Structure, Group Definitions & Correspondence Tables. ISCO-08 Volume 1. International Labour Organisation, Geneva, p 3.12 The computer scanning of the data on occupation that did not pick up the ISCO 2008 codes correctly so the NSO reverted to using ISCO 88 version. However, some occupation groups from ISCO 08 were used, especially those relating to computer-related jobs.
26 of 103
The raw data on jobs from the census exist. These job descriptions may have been coded to the four-digit level to enable a higher aggregation to the two-digit level. It is recommended that further analysis of these data be commissioned to convert the job descriptions to ISCO 08 and to provide information on occupations at the three and four-digit level. These data can provide an excellent baseline for tracking changes in the demand for skill over time.
Labour market demand
The total number of people aged 15 years and over in employment recorded by the 2009 census is 208,118. However, if the focus narrows to non-farm employment, the number falls to 73,814. Using the education and skills-based occupational classification system ISCO, it is possible to identify the number of occupations that require at least the completion of secondary school education or a post-school qualification. The number of these education or skills-based jobs is 37,251 or half of the total non-farm employment.
Skills profile of the economy
ISCO has four skill levels which are applied to each broad occupation group (see Table 8). These ISCO skill levels provide a guide to the education levels required to the perform work at these skill levels. Skill Level Four is mapped to education attainment of either first stage of tertiary education first degree (medium duration) or second stage of tertiary education leading to an advanced research qualification. Skill level Three is mapped to education attainment of first stage of tertiary education (short or medium duration). Skill Level Two is mapped to three levels of education attainment: post-secondary non-tertiary education, upper secondary and lower secondary education levels. Skill level One is mapped to the primary level of education.
Table 8: Mapping of major ISCO groups to skill levels
For the first ISCO major group of senior officials and managers, the designated skill levels are Three and Four (see the attachment to this chapter for a description of these skill levels). For Professionals, the skill level is Four. For technicians & associate professionals the skill is Three. For clerical support workers, the skill level is Two. Craft and related trades workers are designated as Skill Level Two.
Skills profile of non-farm sector in Solomon Islands
The non-farm sector of the Solomon Islands has a low skill-based occupational profile
27 of 103

focused on the delivery of services. Only one-in-four (26 per cent) occupations are in the top three skill levels. Professionals account for nearly one-in-five (18 per cent) of the non-farm workforce. These are the occupations that in most instances require a post-secondary qualification. The remaining occupations are at Skill Levels Two and One. These Skill Levels are associated with varying levels of education from lower secondary to post-secondary non-tertiary education,
28 of 103

Demand for skills-based occupations
The following table listing the skills-based occupations shows that the demand for skills in the non-farm sector in Solomon Islands is modest. At the senior officials and professional levels, the only occupation that has a large number is that of teachers. The next largest groups at the professional level are Other professionals (mainly business and administrative) and Life science and health professionals (mainly nurses).
At the technician and associate professional level, the occupation groups range is from 1,072 Teaching associate professionals to 187 Information and communications technicians.
Table 9: Numbers in main skill-based occupations, Solomon Islands census 2009Main skill-based occupations ISCO sub-
major groups NMain skill based occupations ISCO sub-
major groups N
1 Legislators, Senior Officials, Managers 32 Life science and health associate professionals (except nursing) 473
11 Legislators and senior officials 988 33 Teaching associate professionals 1,072
12 Corporate managers 747 34 Other associate professionals 769
13 General Managers 229 35 Information and communications technicians 187
14 Retail and other services manager 341 4 Clerical support workers
2 Professionals 41 Office Clerks 543
21 Physical mathematical and engineering science professionals 583 42 Customer service clerks 686
22 Life science and health professionals 1,525 43 Numerical and material recording clerks 1,363
23 Teaching professionals 7,773 44 Other clerical support workers 181
24 Other professionals 1,744 7 Craft and related trades workers
25 Information and communications technology professionals 53 71 Extraction and building trade workers 8,787
26 Legal social and cultural professionals 1,606 72 Metal machinery and related workers 1,876
3 Technicians & Associate Professionals 73 Precision handicrafts printing and related workers 2,118
31 Physical and engineering science technicians 999 74 Other craft and related trades workers 301
75 Food processing wood working garment and other craft and related 2,279
29 of 103

Changes 1999-2009
Table 10: Numbers and proportion employed in non-agricultural occupations, 1999 & 2009 census, Solomon Islands, per cent
Occupation - major groups 1999 2009 1999 2009
1 Legislators, Senior Officials, Managers 2,502 2,305 5.9 3.1
2 Professionals 6,514 13,284 15.4 18.1
3 Technicians & Associate Professionals 3,044 3,500 7.2 4.8
4 Clerical workers 2,301 2,773 5.4 3.8
5 Workers In Services, Shop & Market Sales 7,826 16,555 18.5 22.5
7 Craft & Related Trades Workers 7,327 15,361 17.3 20.9
8 Plant & Machine Operators, Assemblers 5,783 5,197 13.7 7.1
9 Elementary Occupations 6,955 14,500 16.5 19.7
Total 42,252 73,475 100 100
The above table shows that four occupational groups have grown significantly in number, two have grown slightly and the numbers in two occupation groups have fallen. The occupation groups that have doubled their number between 1999 and 2009 are in order of importance:
workers in services, shop & market sales; craft and related trades workers; elementary occupations and the professionals.
The occupations with a relatively small increase in their number are clerical workers and technicians & associate professionals. The two occupation groups that have decreased their number are:
legislators, senior officials, managers and plant & machine operators, and assemblers.
These results show that in the past decade the employment opportunities for clerical staff and technicians and associate professionals are likely to be limited. One factor may be Government Budget pressure on the public sector to limit its growth in employment.
More detail on the changes to occupation numbers over time
At the more detailed two-digit level, it is possible to look at more specific occupation groups. These groups are not always comparable between 1999 and 2009 but Table shows data for professionals, technician and associate professionals, and craft & related trades workers.
The large increase in the number of professionals is due for most part to the increase in the number of teachers. The next largest increase is in engineering and related science professionals. This category includes engineers, and architects. Life science and health
30 of 103
professionals have also increased their number. The occupation group includes nurses. Other professionals includes business professionals such as accountants. It also includes lawyers.
At the technician and associate professional level, the numbers of specific occupation groups have increased slightly or declined, except for teaching associate professionals.13 Life science and health associate professionals have increased their number slightly but physical and engineering science technicians have remained static. The largest subgroup within this latter group are ship controllers and technicians, accounting for 60 per cent of the total number in the physical and engineering science technicians group in 1999. This detail for 1999 cannot be produced for 2009, due to lack of information at the three-digit level, as noted above.
The numbers of ‘Other associate professionals’ who are mainly administrative, finance and customs agents have also remained largely static if ICT technicians are included.
For trades related workers, by far the largest increase in numbers between 1999 and 2009 is extraction and building trade workers. Next in importance are food processing workers (including more than 1,500 workers in the Western Province and Guadalcanal working for Sol Tuna). The precision handicrafts and printing workers refers mainly to producers of traditional handicrafts. Metal & machinery workers have increased over time but not by any magnitude.
In relation to extraction and building trade workers, the 1999 information at the three-digit level shows that most (four out of five or 79 per cent) are building frame workers. These workers are likely to have only basic building skills. One one-in-six (16 per cent) of this occupation group are the more skilled ‘building finishers’. This profile of the skills used in the construction sector is confirmed by data from the 2009 industry classification. These data show that most in the construction are employed in the ‘construction of buildings’ (8,070), with few employed in ‘civil engineering’ (283) and ‘specialised construction activities’ (251).
13 Other teaching associate professionals includes early childhood educators & special needs teachers as well as instructors for diving etc.
31 of 103

Table 11: Numbers of skill-based occupation groups at each ISCO sub-major-major level, 1999 & 2009 census, Solomon Islands
ISCO sub-major groups 1999 2009
2 Professionals
21 Physical mathematical and engineering science professionals 182 583
22 Life science and health professionals 981 1,525
23 Teaching professionals 3,942 7,773
24 Other professionals 1,409 1,744
25 Information and communications technology professionals 53
26 Legal social and cultural professionals 1,606
3 Technicians & Associate Professionals
31 Physical and engineering science technicians 1,073 999
32 Life science and health associate professionals (except nursing) 305 473
33 Teaching associate professionals 26 1,072
34 Other associate professionals 1,119 769
35 Information and communications technicians 187
7 Craft and related trades workers
71 Extraction and building trade workers 3,213 8,787
72 Metal machinery and related workers 1,389 1,876
73 Precision handicrafts and printing & related workers 1,348 2,118
74 Other craft and related trades workers 1,377 301
75 Food processing, wood working, garment and other craft and related 1,077 2,279
Key trends in occupational changes
The trend in occupational changes between 1999 and 2009 appear to be a growth on occupations at the high skill levels and at the low skill levels but with a decline in middle level skills. These trends noted for Solomon Islands also reflect a pattern identified over a thirty-year period for the USA and confirmed by recent evidence from 16 European countries and Australia.14 The pattern in most countries has been for jobs to grow at both ends of the skills spectrum with a decrease in middle-level skills. This is confirmed by a recent analysis of occupational change in 16 European countries over the period 1993-2006. This analysis shows rising employment shares for high-paid professionals and managers as well as for low-paid personal services workers. However, the employment shares of manufacturing and
14 See Levy, F and Murnane, R; 2004, The New Division of Labor: How Computers are Creating the New Job Market. Princeton University Press, Princeton and Oxford; David H. Autor, Frank Levy and Richard J. Murnane ‘The Skill Content of Recent Technological Change: An Empirical Exploration’ Quarterly Journal of Economics, 118(4), November 2003; Goos, M, Manning, A & Salomons, 2010, 'Explaining Job Polarisation in Europe: The Roles of Technology, Globalisation and Institutions', CEP Discussion Paper No 1026, November, Centre for Economic Performance, London School of Economics; and Kelly, R and Lewis, P; 2010, 'The change in Labour Skills in the Australia over the Business Cycle', Australian Bulletin of Labour, Vol 36, No 3, pp 260-277.
32 of 103

routine office workers have fallen.15
Job skills in demand
The US research covering the period 1969 to 1999 has shown that jobs based on ‘expert thinking’ and ‘complex communication’ skills have grown the most. ‘Expert thinking’ refers to the capacity to solve new problems for which there are no routine solutions. ‘Complex communication’ refers to the capacity to observe, listen, connect with, persuade and negotiate. These problem-solving or communication skills are required not only within the professions and by managers. They are also important in the trade and service occupations.
Job skills in decline
In contrast, jobs based on routine thinking tasks are in decline. Since the beginning of the 1980s in the USA, jobs involving basic, repetitive thinking tasks have fallen the most sharply of all jobs. This trend indicates that jobs which apply routine rules or procedures are under severe threat because they can be replaced by software. Alternatively, they can be performed at lower cost in a central location such as call centres in India or the Philippines.
As consumers can themselves now perform routine tasks such as withdrawing money from a machine, many clerical jobs such as bank tellers are no longer needed. Many other examples exist of how face-to-face customer service gives way to consumer-driven use of technology to carry out routine tasks. The new skills required now are more specialised and are limited to a smaller number of more highly skilled people who have to problem solve when the technology fails.
Low-skilled jobs are also growing
Jobs performing routine manual tasks are also under threat because they can be replaced by machines or by redesigned work. However, jobs that require carrying out non-routine physical tasks show a different trend. The work done by sales workers, housekeepers, hotel staff and caterers, personal care workers such as nursing aids, security guards, hairdressers, truck drivers and cleaners will remain essential. This is because these jobs require the ability to recognise and respond to changing situations and differing personal needs. The constant changes to these tasks mean that only humans have the capacity to bring together the different types of information needed to respond.
As leading researchers on these trends summarise these changes:
15 Goos, M, Manning, A & Salomons, A; 2010, p 42.
33 of 103

Computerisation has, therefore, fostered a polarisation of employment, with job growth concentrated in both the highest- and lowest-paid occupations, while jobs in the middle have declined. Surprisingly, overall employment rates have largely been unaffected in states and cities undergoing this rapid polarisation. Rather, as employment in routine jobs has ebbed, employment has risen both in high-wage managerial, professional and technical occupations and in low-wage, in-person service occupations. ...
Demand for highly educated workers who excel in abstract tasks is robust, but the middle of the labor market, where the routine task-intensive jobs lie, is sagging. Workers without college education, therefore, concentrate in manual task-intensive jobs - like food services, cleaning and security - which are numerous but offer low wages, precarious job security and few prospects for upward mobility.16
Prospects for middle-level skills
However, Autor and Dorn note that all middle-education, middle-wage jobs are not likely to disappear completely. Many middle-skill jobs will be automated if they are based mainly or solely on routine tasks. However, some middle-skill jobs with a strong focus on quality of service are based on a mixture of tasks that combine routine or technical tasks with non-routine or flexible tasks. For example, medical associate professional jobs, such as a radiology technician, or a nurse practitioner, are a rapidly growing category of relatively well-paid, middle-skill occupations. These associate professions do not typically require a four-year tertiary degree, but they do require some post-secondary vocational training.
Autor and Dorn conclude that ‘these middle-skill jobs will persist, and potentially grow, because they involve tasks that cannot readily be unbundled without a substantial drop in quality’.
... we predict that the middle-skill jobs that survive will combine routine technical tasks with abstract and manual tasks in which workers have a comparative advantage: interpersonal interaction, adaptability and problem-solving. Along with medical paraprofessionals, this category includes numerous jobs for people in the skilled trades and repair: plumbers; builders; electricians; heating, ventilation and air-conditioning installers; automotive technicians; customer-service representatives; and even clerical workers who are required to do more than type and file.17
Implications
The implications of these changes to occupations are several. Clerical support jobs based on simple, routine tasks will continue to decline because computers are becoming more capable of performing this work. However, jobs based on problem-solving and high-level communication skills will grow the most. Also increasing will be low-skilled service jobs because they are responding to changing personal needs and situations.
16 David Autor & David Dorn, 2013, ‘How Technology Wrecks the Middle Class, New York Times, 25 August, http://opinionator.blogs.nytimes.com/2013/08/24/how-technology-wrecks-the-middle-class/?_r=0 See also David Autor & David Dorn, 2012, ‘The Growth of Low Skill Service Jobs and the Polarization of the U.S. Labor Market’, American Economic Review, forthcoming, http://economics.mit.edu/files/1474 17 See Note above
34 of 103

The number of middle-skill jobs in Solomon Islands except for teachers has declined between 1999 and 2009. Some middle-skill jobs will expand in the future due to their link to new technology. Other job vacancies in middle skill occupations will come from normal job turnover. Many job holders in middle skill occupations will also need to upgrade their skills to enable them to perform the work expected of them.
Opportunities for work in high-income labour markets will follow the same pattern. The need to have recognised skills is a key selection criterion in the immigration entry requirements of New Zealand and Australia. However, without post-school qualifications and relevant work experience, it will be difficult for emigrants to enter the technician/associate professional occupations. Recognised middle-level skills in areas of demand are the best option for entry. However, service-based work will also be a major source of employment in overseas labour markets.
35 of 103

Attachment 3
Table A3.1: International Standard Classification of Occupations, number of groups at each level: major (one-digit level), sub-major (two-digit level), minor (three-digit level), and unit groups (four-digit level)
Source: ILO, 2012, International Standard Classification of Occupations Structure, group definitions and correspondence tables: ISCO-08 Volume 1, Table 3, p 22.
36 of 103

Chapter Four: Identifying skill shortages
Employer identified skill shortages
The most direct evidence of skill shortages is the decision by employers to import workers with the skills they need. Information on the type of skills employers have imported at considerable expense shows that the skills of these workers not available from the domestic labour market. The skill sets employers are seeking, however, may not be only or solely technical skills.
Information on the occupations of foreign workers from the census may be more accurate than data from work visa applications as it has been provided directly by the foreign worker and not the employer. Employers may seek visa approval for an occupation that is different to the actual work they want the foreign worker to do. They may do this in the hope that the occupation they have nominated is more likely not to have domestic applicants and hence to be approved.
Table 12 below shows the occupational profile of the 882 foreign workers who responded to the 2009 census questionnaire. The major skills sets that government and employers are willing to pay to import are: managerial (22 per cent of all foreign workers), professional (17 per cent), craft & related trades (11 per cent) and the skills of technicians & associate professionals (10 per cent). What is surprising is the large proportion of semi-skilled plant & machine operators.
Table 12: Distribution of foreign workers by major occupation grouping, Solomon Islands census 2009, per cent
Major occupation groups, foreign workers Per cent
1 Managers 21.9
2 Professionals 17.2
3 Technicians & Associate Professionals 10.2
4 Clerical Support Workers 1.7
5 Services and Sales Workers 4.4
6 Skilled Agricultural, Forestry & Fishery Workers 4.8
7 Craft & Related Trades Workers 11.0
8 Plant & Machine Operators & Assemblers 25.1
9 Elementary Occupations 3.7
100
N 882
More information about the occupations of foreign workers at the two-digit ISCO level is provided in Table A4.1 in the attachment to this chapter. More detail beyond this level of detail on these occupations is not available as the job descriptions were only coded to the two-digit level. However, information from the coding system ISCO 88 on occupations at the
37 of 103
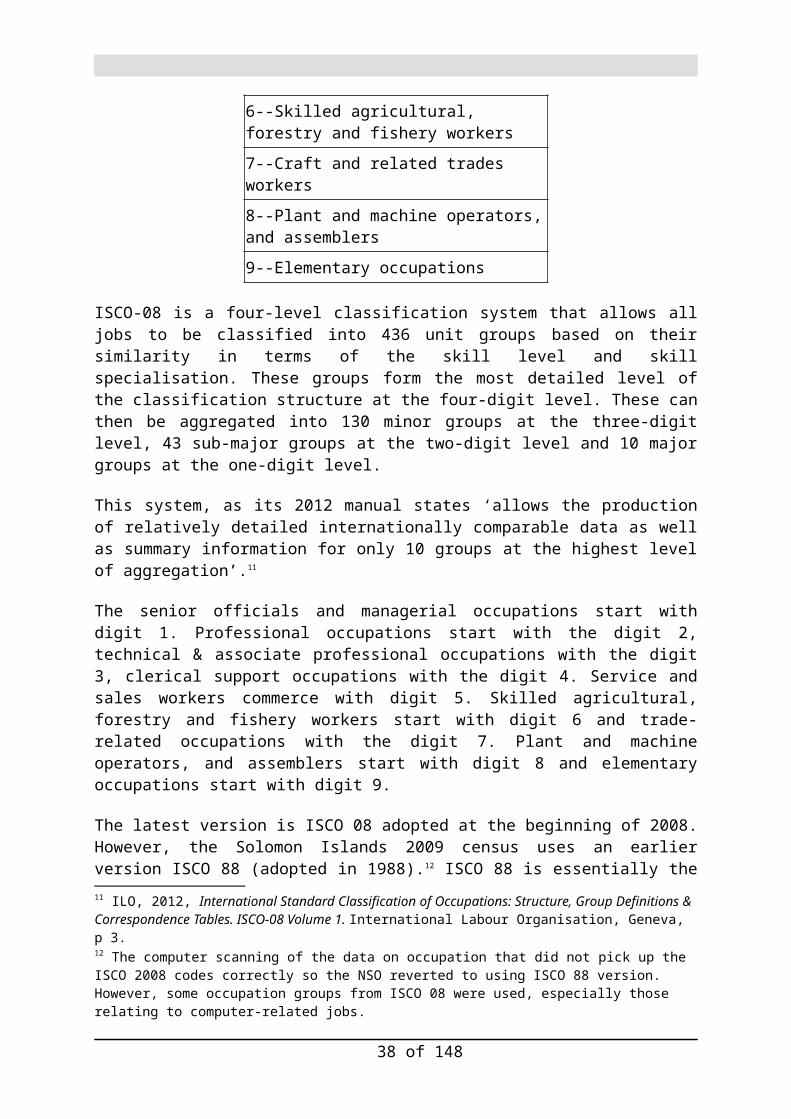
three-digit level gives some idea of what types of occupations are included in this group.
Table A4.2 in the attachment to this chapter shows the occupation groupings with the highest proportion of foreign workers. These are: general managers with 15 per cent of their number who are foreign-born, senior officials (8 per cent), corporate managers (8 per cent), machine operators & assemblers (7 per cent), and drivers & mobile plant operators (6 per cent). Also significant occupations employing foreign workers are: retail & other services managers (5 per cent), physical & engineering science technicians (4 per cent), metal machinery & related workers (4 per cent), physical, mathematical & engineering science professionals (4 per cent), information & communications technology professionals (4 per cent) and other associate professionals (3 per cent).
It is possible to identify from this list where a marked presence of foreign workers suggest that the domestic supply of skills training is inadequate. For the occupations up to the technician & associate professional level, there are:
machine operators & assemblers, drivers & mobile plant operators, retail & other services managers, physical & engineering science technicians, and metal machinery & related workers.
Foreign workers in specific occupations
The design specification for Skilling Youth in the Pacific Program identifies engineering, manufacturing, construction and maritime industries as a primary focus with education and health sectors a secondary focus. Engineering-based occupations are the physical mathematical & engineering science professionals and physical & engineering science technicians.
According to the 2009 census data on foreign workers, there are 22 physical, mathematical & engineering science professionals such as mechanical engineers and 43 physical & engineering science technicians such as mechanical engineering technicians. The trade-related occupations relevant to engineering/manufacturing are metal and machinery workers. The number of foreign workers in this occupational group is 73.
These occupational groups are also relevant to the construction sector. The physical, mathematical & engineering science professionals include civil engineers, architects and surveyors. The technician-level skills include: civil engineering technicians, designers and draughters of building plans. The number of foreign workers in trade-related occupations relevant to this sector is only 18.
There are 24 life science & health professionals and only 4 life science and health associate professionals. There are similarly low numbers for teaching professionals (23) and teaching associate professionals.
Employer identified skills shortages
Two recent surveys provide valuable information about the skill shortages experienced by employers. The first is a survey of employers by the Solomon Islands Chamber of Commerce
38 of 103

and Industry (SICCI). The second survey focuses in on the construction sector and was undertaken for the Solomon Islands Built Environment Professionals Association (SIBEPA).
SICCI commissioned a survey of its members in 2011 and published a report entitled Skills in Demand Report in January 2012. SICCI currently has about 100 members and is targeting an additional 150 in time. Their membership ranges from small and medium enterprises (SMEs) to larger businesses, with about half of its members categorised as SMEs. The 100 SICCI members are said to have about 30,000 employees. However, this is most likely an overestimate, as the overall size of the private sector according to the 2009 census is just on 30,000 employees. However, as noted above, the survey results only represent 30 members, less than a third of the total membership.18 The survey does not report on the employment size of the respondent firms and how their profile compares with the total population of SICCI members. The fact that the survey only has a response rate of 30 per cent means that the survey is not representative of all SCCI employers and may have certain biases such as only covering some large firms.19
Figure 5: Jobs identified by SICCI members as most difficult to fill, Solomon Islands 2011, per cent
The job functions employers find most difficult to fill are: accounting & finance, information technology and construction & engineering. Employers nominated specific technical or other skills they found hard to find. These skill shortages are prominent at the managerial, professional and technician/associate professional levels. The demand for trade skills appear to be much less important.
18 This information is not reported in the write up of the survey results but provided by Mr Jerry Maiki Tengemoamo, CEO of SICCI, 22 August, 2013.19 It is worth noting that a survey conducted by SICCI in 2006 had a response rate of 63 per cent from a total membership then of 73 active members. World Bank, 2007, Study to Support Development of a National Skills Training Plan, Solomon Islands. Human Development Sector Reports, East Asia & Pacific Region, p 5-6.
39 of 103

Table 13: Positions and specific skills employers find hard to fill, Solomon Islands 2011, listed by ISCO skill level
Position Specific Technical/other Skills ISCO
Managerial
Managers & Team Heads Leadership skills 12
Managers & Team Heads People management skills 12
Manager Soft-skills 12
Logistics Manager Communication/Leadership of team 13
Human Resource Manager General Human Resource matters 13
Human Resource Manager Decision-making skills 13
Professional
Engineer- Electrical specialist Automotive manufacturing plants 21
Accountant General accounting 24
Network Administrator Specialising in network connectivity 25
Engineer Mobile Network - Internet protocol 25
Psychologist counsellor Trauma counselling 26
Technicians & Associate professionals
Marine Vessel Captain Marine Engineering 31
Pilots Civil Aviation 31
Technician Formal training required 31
Lending Specialist Corporate banking experiences 33
Trade Analyst Trade and market analysis skill 33
Underwriter, Insurance Some training in team work 33
Clerical Support Worker
Invoicing clerk Skilled in special software 43
Sales worker
Sales Person Interpersonal skills 52
Trades related worker
Gas Fitters Level 1 & 2 gas fitter courses 71
Machinist Specialist Installation, repairs & maintenance 72
Source: SICCI Survey 2012, Figure 12
The SICCI survey asked employers how many people they intended to recruit for what positions in 2011 and 2012. The number of positions has been averaged over the two years. The strongest demand is for positions in accounting & finance and banking & microfinance. Vacancies in management positions and marketing, sales & customer services are also prominent. However, the demand for positions related to construction is not as strong. Also the manufacturing/industrial sector has a particularly low job vacancy rate.
40 of 103

Table 14: Average number of positions to be filled by employers in 2011 and 2012, Solomon Islands 2011
Job Function Total
Accounting & Finance 39.5
Management 23.5
Banking & Microfinance 16.0
Marketing, Sales & Customer Services 12.0
Computers/IT 8.5
Human Resource Management 8.0
Construction & Engineering 7.5
Other 6.0
Manufacturing/Industrial 3.5
Logistics 1.5
Architecture & Design 1.0Source: SICCI Survey 2012, Figures 15 & 16
SIBEPA Survey
Figure 6: Number of business activities undertaken by construction enterprises surveyed, Solomon Islands 2011
A survey in 2011 of 161 enterprises engaged in a range of constructed-related activities revealed that a total of 2,788 people were employed. A little less than half of the enterprises surveyed undertook a range of activities and 86 enterprises specialised in one business activity (see Figure 6). The construction enterprises were asked to say what positions they found most difficult to fill. Near to half of the construction firms surveyed nominated designers as the position they found most difficult to fill. This job title includes architects, draughters and self-taught computer assisted design (CAD) users. Only 121 enterprises responded with 156 nominated positions they found difficult to fill (see Figure 7). These responses, however, need
41 of 103

to be further cross-classified by the size of the enterprise to identify the skill needs of the larger enterprises. It has been noted that only 22 enterprises are big and diverse enough to need the position of site manager. So 17 out of 22 enterprises needing a site manager (77 per cent) shows a much greater skills shortage problem than the initial results suggest.20
Figure 7: What are the most difficult positions to fill? Distribution of responses from 121 construction enterprises, per cent, Solomon Islands 2011
44
2824 22
14 127 5
05
101520253035404550
Per c
ent
Construction positions difficult to fill
Conclusion
This chapter has looked at the direct evidence of skill shortages. Census data on the occupations of foreign workers and the responses of employers to survey questions about positions difficult to fill were used. The broad trend is skill shortages are more evident at the managerial, professional and technician/associate professional levels and less at the trade level, based on the census data on foreign workers and the SICCI survey of some 30 employers. However, the survey of construction enterprises did show that trade level positions are hard to fill, second to designers and draughters. Nevertheless, the actual number of responses from enterprises having trouble filling trade positions was only 34. The following chapter makes use of census data to provide information on skills gaps in the existing workforce.
20 I am grateful to Luke McNamara for highlighting this point to me in a personal communication, 21 August 2013.
42 of 103

Attachment 4
Table A4.1: The number of foreign workers in each occupation group, ISCO 88 sub-major-major groups, Solomon Islands 2009
ISCO 88 sub-major group N ISCO 88 sub-major group N
11 Legislators & senior officials 83 44 Other clerical support workers 1
12 Corporate managers 58 51 Personal & protective services workers 11
13 General Managers 34 52 Salespersons 22
14 Retail & other services manager 18 54 Protective service workers 6
21 Physical mathematical & engineering science professionals 22 61 Market oriented skilled
agricultural & fishery worker 6
22 Life science & health professionals 24 62 Subsistence agricultural & fishery
workers 23
23 Teaching professionals 23 63 Subsistence farmers fishers hunters & gathers 13
24 Other professionals 47 71 Extraction & building trade workers 18
25 Information & communications technology professionals 2 72 Metal machinery & related
workers 73
26 Legal social & cultural professionals 34 74 Other craft & related trades
workers 4
31 Physical & engineering science technicians 43 75 Food processing wood working
garment & other craft & related 2
32 Life science & health associate professionals (except nursing) 4 81 Stationery plant & related
operators 22
33 Teaching associate professionals 19 82 Machine operators & assemblers 6
34 Other associate professionals 23 83 Drivers & mobile plant operators 193
35 Information & communications technicians 1 91 Sales & services elementary
occupations 18
41 Office Clerks 4 92 Agricultural fishery & related labourers 11
42 Customer service clerks 3 93 Labourers in mining construction manufacturing & transport 3
43 Numerical & material recording clerks 7 96 Refuse workers & other
elementary workers 1
43 of 103

Table A4.2: Proportion of foreign workers in each skills-based occupational grouping, Solomon Islands census 2009
ISCO 88 sub-major occupational groupsPer cent N
13 General Managers 14.8 229
11 Legislators and senior officials 8.4 988
12 Corporate managers 7.8 747
82 Machine operators and assemblers 7.2 83
83 Drivers and mobile plant operators 5.9 3,280
14 Retail and other services manager 5.3 341
31 Physical and engineering science technicians 4.3 999
72 Metal machinery and related workers 3.9 1,876
21 Physical mathematical and engineering science professionals 3.8 583
25 Information and communications technology professionals 3.8 53
34 Other associate professionals 3.0 769
24 Other professionals 2.7 1,744
26 Legal social and cultural professionals 2.1 1,606
33 Teaching associate professionals 1.8 1,072
22 Life science and health professionals 1.6 1,525
81 Stationery plant and related operators 1.2 1,834
32 Life science and health associate professionals (except nursing) 0.8 473
41 Office Clerks 0.7 543
75 Food processing wood working garment & other craft related 0.7 2,279
44 Other clerical support workers 0.6 181
35 Information and communications technicians 0.5 187
43 Numerical and material recording clerks 0.5 1,363
42 Customer service clerks 0.4 686
52 Models salespersons and demonstrators 0.4 5,197
23 Teaching professionals 0.3 7,773
71 Extraction and building trade workers 0.6 2,788
74 Other craft and related trades workers 0.2 301
44 of 103

Chapter Five: Identifying the skills gap
The approach used in this report to identifying skills gaps is to make use of information from the census on whether jobholders in specific occupations have post-school qualifications or not. It is not possible given available data nor is it necessary to work out whether the post-school qualification is matched to the occupation as mismatches between qualifications and jobs are common.21
Post-school qualifications are important requirements for most, if not all jobs at the professional and the technician/associate professional levels. Most professions require a post-school qualification. For health professionals, teachers, science & engineering professionals in particular, most of those working in these occupations could be expected to have a post-school qualification.
The challenge is to find a reference point for working out what is the appropriate qualification level expected for a specific occupation group. The next chapter uses two reference points to do this. One is to compare the qualifications of foreign workers with the domestic workforce in an occupation group to identify the skills gap. The second is to look at Australian data on occupations and qualifications. This provides an international measure of the skills gap for specific occupations between Solomon Islanders and the largest labour market in the immediate region.
In this chapter, the initial step is to simply look closely at the share of the Solomon Islands workforce with post-school qualifications in each major occupation and to note what share of each skills-based occupation has post-school qualifications. The second step is to note the education levels of those without a post-school qualification to identify the extent of the skills gap.
Education/skills gap in generic professional occupations
First, the focus is on generic skills-based occupations relevant to a range of sectors. Other skills-based occupation groups, more relevant to specific sectors, are reported in the section on specific industry sectors. Table A5.1 in the attachment to this chapter presents summary information on the proportion of the workforce with post-school qualifications in each of sub-major occupational groupings for professionals, associate professional, clerical support and trade-related work. Table A5.2 in the attachment reports on ten levels of education attainment and the number of job incumbents in each occupational group. The following tables for professional occupations reduce the reported levels of post-school qualifications to one summary statistic. However, the levels of education level below this are given to show the gap between those with a post-school qualification and those without.
The ISCO 88 Other professionals group includes: accountants, personnel and careers professionals, business professionals not elsewhere classified. The largest proportion (43 per cent) of these professionals have a post-school qualification. However, one-in-five (19 per cent) have completed only Form 5 and one-in-ten (12 per cent) have only completed Form 3.
21 Quintini, G, 2011, ‘Right for the job: over-qualified or under-skilled?’ OECD Social, Employment and Migration Working Papers No. 120, Organisation for Cooperation and Development, Paris.
45 of 103

Sub-major occupationLT primary completed
Completed primary
Completed Form 3
Completed Form 5
Completed Form 6 & 7
Post-school qualification Total N
24 Other professionals2.8 10.4 11.7 18.6 11.8 42.8 100 1,744
Information & communications technology professionals include software and applications developers and analysts and database and network professionals. It includes specifically systems analysts, software developers, web and multimedia developers and applications programmers. The largest group (51 per cent) of these professionals have a post-school qualification. One-in-five (19 per cent) have completed only Form 5 and one-in-ten have only completed Form 3.
Sub-major occupationLT primary completed
Completed primary
Completed Form 3
Completed Form 5
Completed Form 6 & 7
Post-school qualification Total N
25 Information & communications technology professionals
0.0 3.8 9.4 18.9 15.1 50.9 100 53
This occupation group based on ISCO 08 includes lawyers, economists and religious professionals. The largest proportion has only completed primary school, with one-in-four with a post-school qualification.
Sub-major occupationLT primary completed
Completed primary
Completed Form 3
Completed Form 5
Completed Form 6 & 7
Post-school qualification Total N
26 Legal, social & cultural professionals 9.8 31.4 15.3 9.3 4.5 26.5 100 1,606
Education/skills gap in the technician and associate professional occupations
Other associate professionals in ISCO 88 includes: insurance representatives, estate agents, travel consultants and organisers, trade brokers, clearing and forwarding agents, employment agents and labour contractors, administrative secretaries and related associate professionals, bookkeepers, customs and border inspectors, government social benefits officials, government licensing officials and police inspectors and detectives. The largest education group, near to one-in-three (32 per cent) have completed primary school only. A mere one-in-six (17 per cent) have post-school qualifications.
Sub-major occupationLT primary completed
Completed primary
Completed Form 3
Completed Form 5
Completed Form 6 & 7
Post-school qualification Total N
34 Other associate professionals 17.3 31.6 16.1 10.4 4.3 16.6 100 769
This occupation group based on ISCO 08 includes Information and communications technology operations technicians, Information and communications technology user support
46 of 103

technicians, Computer network and systems technicians and web technicians. The largest education group, one-in-three (32 per cent) has post-school qualifications, followed by one-in-five (22 per cent) with Form 6 or 7. Close to one-in-five (19 per cent) have only completed Form 5 and one-in-six (16 per cent) have only completed primary school or less.
Sub-major occupationLT primary completed
Completed primary
Completed Form 3
Completed Form 5
Completed Form 6 & 7
Post-school qualification Total N
35 Information and communications technicians 5.9 9.1 8.6 18.7 21.9 31.6 100 187
Qualifications profile of selected industry sectors
Specific industry sectors have been nominated by the design specification for the proposed Skilling Youth in the Pacific program. These are: engineering/manufacturing, construction and maritime as a primary focus with education and health sectors as a secondary focus. Census data on two-digit industry sectors by level of education attainment offers information about the qualifications held by people working in the above sectors.
Construction
The largest industry sector is construction with 8,604 employed. The census divides this industry into three two-digit sectors: construction of buildings, civil engineering and specialised construction activities. The first sector, construction of buildings, with 8,070 in employment has nine (9) per cent of its workforce with a post-school qualification. The civil engineering sector, with only 283 employed has 16 per cent of its workforce with a post-school qualification. The specialised construction activities sector has 251 employed with 16 per cent of its workforce with a post-school qualification.
The following table presents data from the relevant two-digit occupation classifications for the construction industry’s three sectors. Only one-in-three (34 per cent) of physical, mathematical & engineering science professionals have a post-school qualification. The proportion of physical & engineering science technicians with a post-school qualification is lower at a quarter (25 per cent). Only one-in-ten (9 per cent) of extraction and building trade workers have a post-school qualification.
Relevant construction occupations
LT primary completed
Completed primary
Completed Form 3
Completed Form 5
Completed Form 6 & 7
Post school qualification Total N
21 Physical, mathematical & engineering science professionals
9.1 18.4 11.7 16.6 7.0 34.1 100 583
31 Physical & engineering science technicians 10.3 20.9 16.5 16.6 6.4 25.0 100 999
71 Extraction and building trade workers 25.5 38.2 15.9 7.4 1.8 9.0 100 8,787
The shares of qualified employees in construction are confirmed by the SIBEPA construction sector survey. The survey collected data on the number of employees in each job function who are qualified. The results are reported below in Figure 8.
47 of 103

Figure 8: Proportion of employees in specific job functions in the construction sector who are qualified, Solomon Islands 2011, per cent
These results show a low proportion of trades workers who are qualified, compared with directors, managers, admin/finance, procurement, designers and site managers.
In relation to an expected skills profile used below for a large road construction project, a quarter of a civil engineering project’s workforce should be skilled at trade, technician, professional or managerial level. It can be assumed also that all of these skilled workers should have a post-school qualification.
A further breakdown of education level shows that most of the post-school qualifications are vocational certificates or college/no degree. Civil engineering has twelve degree holders (bachelors and master degrees), or 4 per cent of that sectors workforce. The construction of buildings sector has 41 jobholders with a degree or higher, only 0.5 per cent of the workforce in that sector. Only three jobholders in the specialised construction activities sector have a degree.
Construction industry sectors
Some College/
No degree
Bachelors degree
Masters degree
Doctoral degree
Vocat-ional certificate
Other Post school qual
N
41 Construction of buildings 203 34 5 2 474 182 8070
per cent 2.5 0.4 0.1 0.0 5.9 2.3 8.9
42 Civil engineering 26 9 3 0 8 5 283
per cent 9.2 3.2 1.1 0.0 2.8 1.8 16.3
43 Specialised construction activities
25 3 0 0 11 4 251
per cent 10.0 1.2 0.0 0.0 4.4 1.6 15.5
48 of 103

Manufacturing
The largest sector manufacturing in terms of employment is the manufacture of food products, with 1,708 in employment. Most of these are employees of the tuna processing factory, now in 2013 at 1,500 or so. Only 5 per cent have a post-school qualification. The next largest sector is ‘Other manufacturing’ with 674 in employment with 4 per cent with a post school qualification.
However, other manufacturing sectors do have higher proportions with post-school qualifications. These are: manufacture of other non-metallic mineral products; manufacture of pharmaceuticals medicinal chemicals and botanical products; printing and reproduction of recorded media; and manufacture of basic metals with 35, 26, 25, and 23 per cent respectively. The numbers employed in each respective sector are relatively small: 142, 50, 76, and 53 (see Table A in the attachment for specific details of the post-school qualifications of each manufacturing sector).
The two-digit occupation data provide a big picture view of the relevant occupations for manufacturing. The above two occupation groups physical, mathematical & engineering science professionals and physical & engineering science technicians are relevant to the manufacturing, with a third and a quarter of their respective occupation groups with post-school qualifications. Reported below is the education attainment profile of metal machinery and related workers. Only just under one-in-five (18 per cent) have a post-school qualification.
Trade-related occupations relevant to manufacturing
LT primary completed
Completed primary
Completed Form 3
Completed Form 5
Completed Form 6 & 7
Post school qualification
Total N
72 Metal machinery and related workers 12.5 29.9 21.2 12.0 3.5 18.2 100 1,876
Two important sectors that make extensive use of engineering skills are ‘Electricity gas steam and air conditioning supply’ and the ‘Repair and installation of machinery and equipment’. These two sectors have a high proportion of their workforces with post-school qualifications, 24 and 16 per cent respectively.
Industry sector Some College/No degree
Bachelors degree
Masters degree
Doctoral degree
Vocational certificate
Other Post school qual
N
33 Repair & installation of machinery & equipment
31 3 3 0 25 8 401
Per cent 7.7 0.7 0.7 0.0 6.2 2.0 15.5
35 Electricity gas steam & air conditioning supply
64 6 3 4 14 7 373
Per cent 17.2 1.6 0.8 1.1 3.8 1.9 24.4
49 of 103

50 of 103

The relevant education attainment profile for relevant professional and technician level occupations has already been presented above. The relevant trade-level occupation group is metal machinery and related workers. This group includes electrical mechanics and fitters, electronics mechanics and servicers, telegraph and telephone installers and servicers, and electrical line installers, repairers and cable jointers.
The education sector
The education and health sectors have large workforces who also are more likely to have a post-school qualification. In education, some 44 per cent have a post-school qualification, mostly ‘some college, no degree’. It is important to note that the census category is not referring to not having completed a degree but to having a qualification below degree level. However, ‘some college, no degree’ is likely to refer to a qualification below degree level rather than an incomplete degree. The major skills gap in the education sector is in the large proportion of the workforce, over half, who do not have a post-school qualification.
Industry sector Some College/No degree
Bachelors degree
Masters degree
Doctoral degree
Vocational certificate
Other Post school qual
N
85 Education 2,753 389 75 9 136 154 7,706
Per cent 35.7 5.0 1.0 0.1 1.8 2.0 43.6
86 Human Health activities 536 92 25 32 32 43 1,907
Per cent 28.1 4.8 1.3 1.7 1.7 2.3 37.6
Data is not available from the census about the number of primary, secondary and tertiary teachers, as this level of detail is only available at the three-digit level. It is likely that many of the teachers without post-school qualifications are primary teachers. This is confirmed by data from the National Provident Fund (NPF) for 2006 that 84 per cent of those registered with the NPF are primary teachers and only 10 per cent are secondary teachers.
Table 15: Number and distribution of teachers by education level, Solomon Islands, 2006, per cent
Occupation N per cent
Tertiary Teachers 185 3.7
Secondary Education Teachers 491 9.9
Primary Education Teachers 4,164 83.6
Pre-Primary Education Teachers 138 2.8
4,978 100Source: National Provident Fund 2006
The NPF only lists just under 5,000 teachers in 2006 compared with a census count in 2009 of 7,773 recorded as teachers in the occupation data and 7,706 recorded as workforce in the
51 of 103

education sector. The two-digit occupation data from the census also shows there are 1,072 teaching associate professionals. These differences in teacher counts may be due to the exclusion of some teachers from the NPF due to coverage by another scheme. The NPF data may not include teachers in church schools for example. The education level of those working in the education sector is shown in the table below. Most of those working in the sector without a post-school qualification have less than secondary school completed. One-in-four have completed Form 5 and just over one-in-ten (12 per cent) have only completed Form 3. As many as 7 per cent have only completed primary school or less.
Industry sector
Less than primary completed
Completed primary
Completed Form 3
Completed Form 5
Completed Form 6
Completed Form 7
N
85 Education 134 438 926 2009 585 98 7,706
Per cent 1.7 5.7 12.0 26.1 7.6 1.3
The health sector
The proportion in the health sector with a post-school qualification is 38 per cent. The following table provides information on the specific occupations related to health, available from the NPF for 2006. The total for the 2006 NPF is similar to the census data for the sector of 1,907. The largest number are nursing aides who are not likely to have a post-school qualification. However, a range of occupations can be expected to have a post-school qualification: dentists, medical doctors, pharmacists, professional nurses, physiotherapists & occupational therapists, laboratory technicians, life science (malaria) technicians and medical x-ray technicians.
Table 16: Number of jobholders in professional, technician and associate professional occupations related to the health sector, Solomon Islands 2009
Health occupations N Health occupations N
Dentists 20 Medical X-Ray Technicians 37
Medical Doctors 68 Student Nurses 224
Pharmacists 20 Dental Assistants 29
Professional Nurses 508 Health Inspectors 79
Physiotherapists & Occupational Therapists 22 Nursing Aides 651
Laboratory Technicians 19 Pharmaceutical Assistants 13
Life Science (Malaria) 125 Total 1,815
An education profile is available only for these broad occupational groups. Less than half of life science and health professionals (47 per cent) have a post-school qualification. Only a third (33 per cent) of life science and health associate professionals (except nursing) have a post-school qualification.
52 of 103
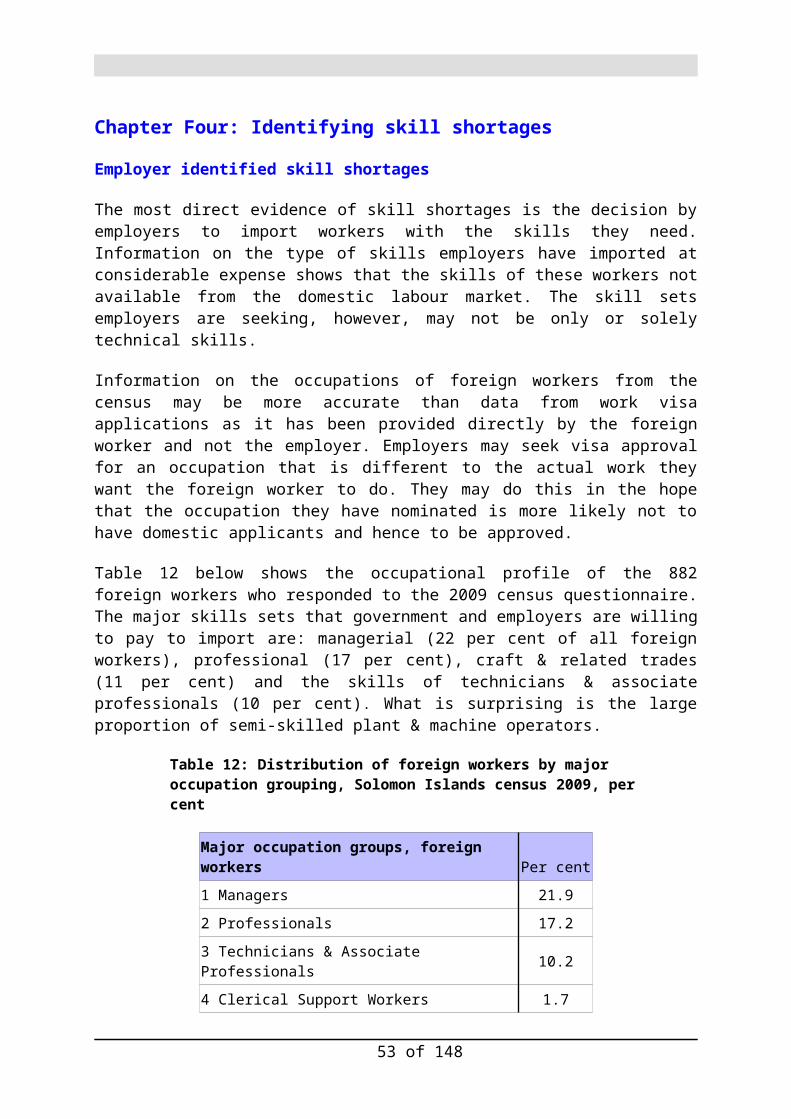
OccupationLT primary completed
Completed primary
Completed Form 3
Completed Form 5
Completed Form 6 & 7
Post school qualification Total N
22 Life science & health professionals 1.6 9.4 17.2 17.5 5.2 46.6 100 1,525
32 Life science & health associate professionals (except nursing)
4.7 13.3 19.9 18.2 8.7 33.2 100 473
Conclusion
This chapter has looked at the education profile of skills-based occupations from professional to technician & associate professional and trade level jobs. The level of education attainment, in most cases, is far below what could be expected, especially at the professional and sub-professional levels. Chapter Six offers a more precise measure of the skills gap by looking at the difference between the difference between foreign and domestic workers in terms of share of post-school qualifications held.
53 of 103

Attachment 5
Table 5.1: Sub-major occupations (ISCO 88) with proportion of jobholders with post-school qualifications, per cent, Solomon Islands 2009
ISCO 88 occupation group Per cent ISCO 88 occupation group Per cent
11 Legislators and senior officials 50 33 Teaching associate professionals 30
12 Corporate managers 45 34 Other associate professionals ie business & administrative 17
13 General Managers 43 35 Information and communications technicians 32
14 Retail and other services manager 29 41 Office Clerks 31
21 Science and engineering professionals 34 42 Customer service clerks 17
22 Life science and health professionals 47 43 Numerical and material recording
clerks 13
23 Teaching professionals 45 44 Other clerical support workers 20
24 Other professionals 43 71 Extraction and building trade workers 9
25 Information and communications technology professionals 51 72 Metal machinery and related
workers 18
26 Legal, social, cultural professionals 27 73 Precision handicrafts printing and
related workers 3
31 Physical and engineering science technicians 25 74 Other craft and related trades
workers 33
32 Life science and health associate professionals (except nursing) 33 75 Food processing wood working
garment and other craft and related 4
54 of 103

Table A5.1: Education profile of skills-based occupations, ISCO 88 sub-major groupings, Solomon Islands census 2009, per cent
Professional & associate professional occupations LT primary
completedCompleted primary
Completed Form 3
Completed Form 5
Completed Form 6 & 7
Completed some College/No degree
Degree & above
Vocational certificate Other
Post school qualification Total N
21 Science & engineering professionals 9.1 18.4 11.7 16.6 7.0 17.3 13.6 3.3 3.1 34.1 100 583
22 Life science & health professionals 1.6 9.4 17.2 17.5 5.2 33.8 11.4 1.4 2.4 46.6 100 1525
23 Teaching professionals 1.3 4.7 11.9 26.7 9.1 37.0 6.0 1.6 1.6 44.6 100 7773
24 Business & admin professionals 2.8 10.4 11.7 18.6 11.8 26.0 15.7 1.1 1.9 42.8 100 1744
25 ICT professionals 0.0 3.8 9.4 18.9 15.1 30.2 18.9 1.9 1.9 50.9 100 53
26 Legal social cultural professionals 9.8 31.4 15.3 9.3 4.5 13.3 11.8 1.4 3.2 26.5 100 1606
31 Physical & engineering science technicians 10.3 20.9 16.5 16.6 6.4 15.1 6.8 3.1 4.2 25.0 100 999
32 Life science & health associate professionals (except nursing)
4.7 13.3 19.9 18.2 8.7 26.0 5.3 1.9 2.1 33.2 100 473
33 Teaching associate professionals 5.3 18.4 17.6 17.2 9.0 20.6 8.3 1.0 2.5 29.9 100 1072
34 Other associate professionals 17.3 31.6 16.1 10.4 4.3 9.1 5.7 1.8 3.6 16.6 100 769
35 Information & communication 5.9 9.1 8.6 18.7 21.9 16.0 12.3 3.2 4.3 31.6 100 187
specialists
Clerical support occupations LT primary completed
Completed primary
Completed Form 3
Completed Form 5
Completed Form 6 & 7
Completed some College/No degree
Degree & above
Vocational certificate Other
Post school qualification Total N
41 Office Clerks 2.6 15.8 20.1 21.4 7.6 21.0 6.6 2.9 2.0 30.6 100 543
42 Customer service clerks 5.5 17.6 17.2 25.5 14.3 12.4 4.2 0.7 2.5 17.3 100 686
43 Numerical and material recording clerks 3.4 18.9 28.9 25.5 8.0 10.6 0.8 1.8 2.1 13.2 100 1363
44 Other clerical support workers 6.1 17.1 17.1 27.6 9.9 12.2 7.2 0.6 2.2 19.9 100 181
Trade-related occupations LT primary completed
Completed primary
Completed Form 3
Completed Form 5
Completed Form 6 & 7
Completed some College/No degree
Degree & above
Vocational certificate Other
Post school qualification Total N
71 Extraction and building trade workers 25.5 38.2 15.9 7.4 1.8 2.6 0.4 6.0 2.2 9.0 100 8787
72 Metal machinery and related workers 12.5 29.9 21.2 12.0 3.5 8.7 1.0 8.5 2.7 18.2 100 1876
73 Precision handicrafts printing and related workers 38.8 39.9 10.9 4.4 1.2 1.1 0.1 1.5 2.0 2.7 100 2118
74 Other craft and related trades workers 5.6 17.6 18.6 18.9 5.6 23.6 4.0 5.0 1.0 32.6 100 301
75 Food processing wood working garment and other craft
27.0 40.5 16.8 6.7 1.8 1.7 0.2 2.3 3.0 4.2 100 2279
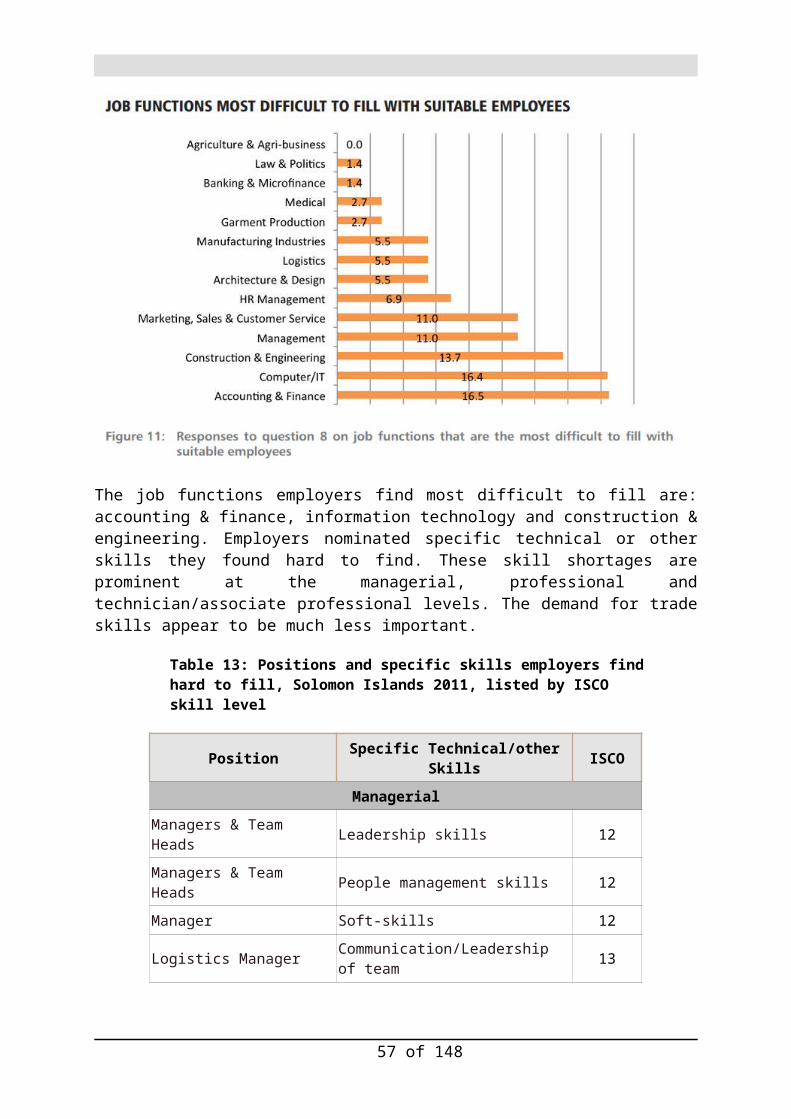
and related

Chapter Six: Measuring the Skill gap
As noted in the introduction to Chapter Five, a useful way to assess the extent to which post-school qualifications are desirable or necessary for specific occupations is to note what proportion of foreign workers in that occupation have a post-school qualification. If Employers at considerable cost to their operations bring in foreign workers with post-school qualifications, then it can be assumed that these qualifications are needed to do the work. Table A6.1 in the attachment to this chapter compares the post-school qualifications profile of foreign workers with that of domestic workers in each major occupation group.
Skill gaps exist for particular occupations where there is a notable difference between the proportion of foreign and domestic workers with post-school qualifications. Figure 9 below list the occupations where the skills gap is greatest. Small numbers of foreign workers have been omitted and a minimum of 18 has been used to give statistical stability to the result.
Figure 9: The difference in proportion of foreign and domestic workers with post-school qualifications, Solomon Islands 2009, per cent
2
17
22
22
23
24
25
30
32
47
49
52
53
62
0 10 20 30 40 50 60 70
12 Corporate managers
31 Physical & engineering science technicians
13 General Managers
11 Legislators & senior officials
33 Teaching associate professionals
81 Stationery plant & related operators
24 Other professionals
21 Science & engineering professionals
14 Retail & other services manager
23 Teaching professionals
34 Other associate professionals
71 Extraction & building trade workers
22 Life science & health professionals
26 Legal, social, & cultural professionals
Per cent
Skills gap: qualifications difference between foreign & domestic workers
The largest skill gaps
Looking at the occupations with the largest skill gaps, Legal, social, & cultural professionals ranks at the top with the largest gap. Data from the NPF 2006 shows which occupations fall within this sub-major grouping and the number of jobholders in each occupation at that time.

Table 17: Number of jobholders in specific occupations, legal, social & religious professionals, National Provident Fund contributors, Solomon Islands 2006
Occupation Male Female Total
Authors, Journalists & Related Workers 15 9 24
Economists 5 1 6
Judges 7 7
Jurists Not Elsewhere Classified 1 1 2
Lawyers 23 11 34
Social Workers 66 61 127
Statisticians 19 3 22
Ministers of Religion 300 8 308
The largest occupation is ministers of religion. It is likely that most Solomon Islands incumbents of this occupation lack post-school qualifications compared with their foreign counterparts. Life science and health professionals are the next largest group with a skills gap. This group consists of dentists, medical doctors, pharmacists, professional nurses, veterinarians, physiotherapists and occupational therapists. The largest occupation is professional nursing and it is most likely that it is this occupation that is underqualified, compared with their foreign counterparts. In Australia, according to the 2011 census, virtually all professional nurses (97 per cent) have a post-school qualification.
Table 18: Number of jobholders in specified occupations, Life science & health professionals, National Provident Fund contributors, Solomon Islands 2006
Occupation Male Female Total
Dentists 13 7 20
Medical Doctors 55 13 68
Pharmacists 8 12 20
Professional Nurses 182 326 508
Veterinarians 3 3
Physiotherapists & Occupational Therapists 15 7 22
The next largest skills gap is for extraction and building trades workers. The largest occupation within this group is carpentry and joinery. Plumbers and pipe fitters are the second largest occupation. These occupations in particular are likely to lack post-school qualifications compared with foreign workers in the same occupations. In Australia, in 2011, three quarters of carpenters and joiners (76 per cent) and plumbers (78 per cent) had a post-school qualification. In Australia, near to two-in-three painting trades workers (65 per cent) and over half of plasterers (54 per cent) have a post-school qualification.
59 of 103

Table 19: Number of jobholders in specified occupations, building trades workers, National Provident Fund contributors, Solomon Islands 2006
Occupation Male Female Total
Carpenters & Joiners 1,801 15 1,816
Painters, Construction 58 1 59
Plasterers & Blocklayers 19 19
Plumbers & pipe Fitters 146 2 148
Structural Metal Preparers & Erectors 8 8
Other associate professionals, the occupation group with the next largest skills gap, refer to people working mainly as police officers & detectives, followed by clerical supervisors, health inspectors and personal secretaries. These occupations are usually found within a large internal labour market such as the police or the civil service. Promotion to positions within an internal labour market is usually based not on external qualifications but in-house training and examinations. However, in Australia and New Zealand, there has been a recent trend away from reliance on internal training to increased use of externally certified qualifications.22 The large skills gap for this occupation group is likely to reflect these two different approaches to recognising skills within internal labour markets.
Table 20: Number of jobholders in specified occupations, other associate professionals, National Provident Fund contributors, Solomon Islands 2006
Occupation Male Female Total
Clerical Supervisors 91 28 119
Health Inspectors 64 15 79
Personal Secretaries 27 63 90
Policemen & Detectives 1,187 85 1,272
Produce Inspectors (Agriculture) 5 1 6
Teaching professionals have the next largest skills gap. The largest number of teachers within this grouping is primary teachers and this group of teachers are least likely to have post-school qualifications. The educational profile of teaching professionals show that only one-in-five have completed Form 5, 12 per cent have completed only Form 3 and 6 per cent have completed primary school only or less (see Table 22). This education profile of teachers, which probably applies to primacy school teachers, may be a large part of the explanation of the poor literacy performance of Solomon Islands schools noted in the World Bank report Skills for Solomon Islands: Opening New Opportunities and the Literacy survey results noted
22 The 2011 Australian census shows that four-out-of-five (78 per cent) police in Australia now have a post-school qualification.
60 of 103
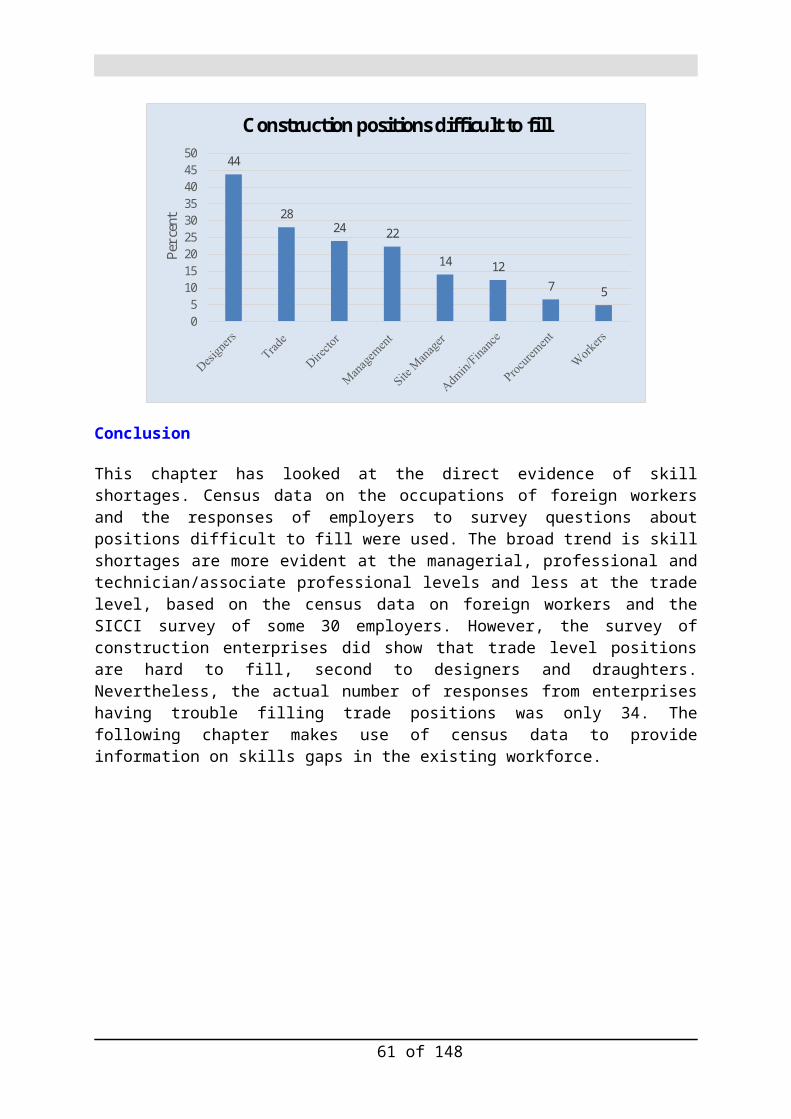
in Chapter Two above.
61 of 103
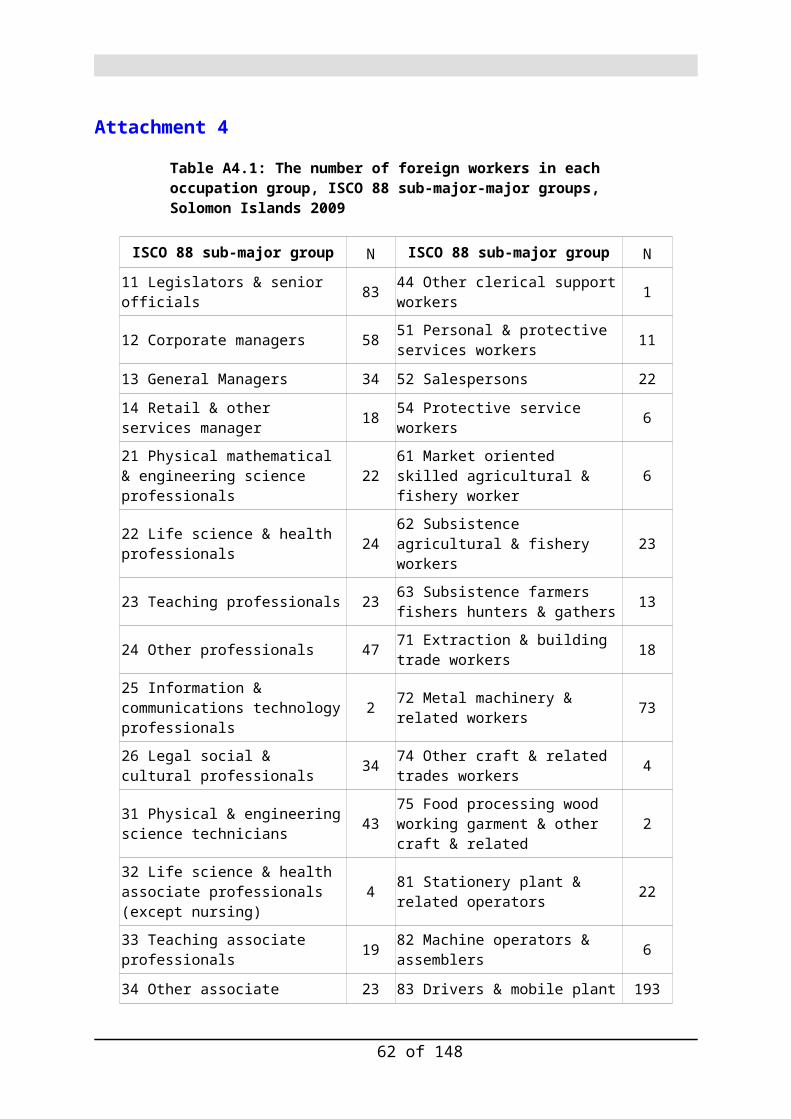
Table 21: Number of jobholders in specified occupations, teaching professionals, National Provident Fund contributors, Solomon Islands 2006
Occupation Male Female Total
Education Advisors 27 11 38
Secondary Education Teachers 317 174 491
Tertiary Teachers 120 65 185
Pre-Primary Education Teachers 49 89 138
Primary Education Teachers 2,426 1,738 4,164Table 22: Education profile of teaching professionals, Solomon Islands census 2009, per cent
Professional & associate professional occupations
LT primary completed
Completed primary
Completed Form 3
Completed Form 5
Completed Form 6 & 7
Post-school quals N
23 Teaching professionals 1.3 4.7 11.9 26.7 9.1 44.6 7,773
Retail and other services managers include mainly managers of catering and lodgings, and managers in wholesale and retail. Solomon Islanders in these positions have a large skill gap compared with their foreign counterparts.
Table 23: Number of jobholders in specified occupations, retail & other services managers, National Provident Fund contributors, Solomon Islands 2006
Occupation Male Female Total
Managers (Catering & Lodging Services) 73 15 88
Managers (Wholesale & Retail Trade) 108 20 128
Working Proprietors (Catering & Lodging) 13 13
Table 24: Number of jobholders in specified occupations, science & engineering professionals, National Provident Fund contributors, Solomon Islands 2006
Occupation Male Female Total
Agronomists & Related Scientists 2 2
Architects 13 1 14
Biologist, Zoologist related Scientists 7 1 8
Chemist 4 4
Civil Engineers 21 21
Electrical Engineers 50 1 51
Geologists 18 18
62 of 103

Mechanical Engineers 218 11 229
Other Engineers 130 8 138
Bacteriologists 9 3 12
Surveyors 349 6 355
Science and engineering professionals include the following occupations in Solomon Islands. Surveyors and engineers are the largest numbers of jobholders (see Table 24). Most or nearly all jobholders in these occupations could be expected to have post-school qualifications. This is confirmed by the fact that all foreign workers is Solomon Islands in these occupations have a post-school qualification. In Australia, 2011 census data for Australia show that 88 per cent of architects, designers, planners and surveyors have a post-school qualification and 94 per cent of engineers do (see Table 25). A serious skills gap exists where Solomon Islands jobholders in these occupations do not have a post-school qualification.
Table 25: Proportion of jobholders in Australia in specified occupations with post-school qualifications, per cent, Australia 2011
Australian occupations ANZSCO Per cent
232 Architects, Designers, Planners and Surveyors 88.2
233 Engineering Professionals 94.3
Source: Australian Census of Population & Housing 2011
The ‘other professionals’ sub-major group refers to accountants, financial and investment advisers, environmental and occupational health and hygiene professionals, personnel and careers professionals and training and staff development professionals. The only relevant occupation noted in the NPF data is accountants and auditors. Most accountants classified as professionals should have a post-school qualification. In Australia, nine-out-ten of professional accounts have a post-school qualification (92 per cent) and company auditors have a similar proportion (86 per cent) with post-school qualifications.
Table 26: Number of accountants & auditors, National Provident Fund contributors, Solomon Islands 2006
Occupation Male Female Total
Accountants & Auditors 253 143 396
Human resource managers may or may not have a post-school qualification, especially if the function is limited in small enterprises to a payroll clerical function. In Australia, three-out-of -four human resource professionals (75 per cent) have a post-school qualification.
Physical & engineering science technicians
Passing over in the above listing in Figure 9 of occupations with skills gaps the remaining occupations of stationery plant & related operators, teaching associate professionals, legislators & senior officials, general and corporate managers, the final occupation with a skills gap of particular relevance to this assignment is physical & engineering science
63 of 103
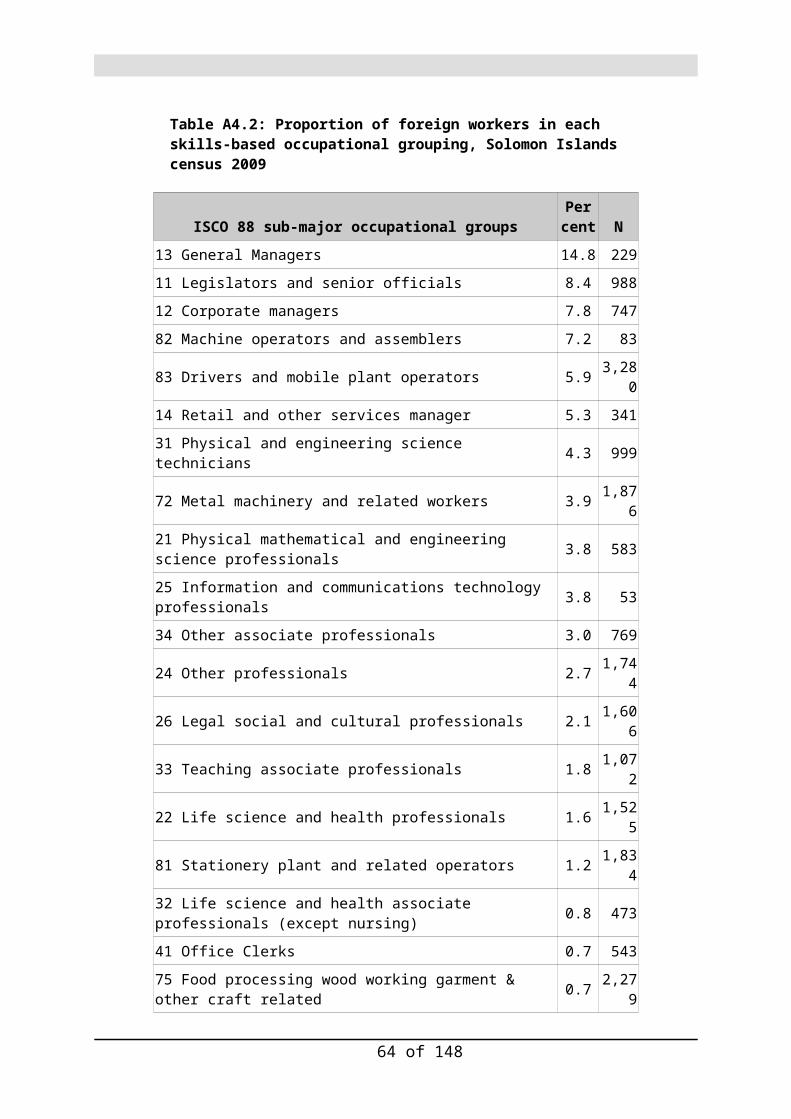
technicians. Details of numbers employed in specific occupations in 2006 that comprise this occupational grouping are shown Table 27 below.
The total number in these technician and associate professional occupations in the NPF listing is 767 compared with 999 in the 2009 census count. So it appears that either the number in this occupation group has increased between 2006 and 2009, or the NPF data do not provide a complete count (one-in-ten NPF contributors had an unknown occupation).
Table 27: Number of jobholders in specified occupations, physical & engineering science technicians, National Provident Fund contributors, Solomon Islands 2006
Occupation Male Female Total
Production Supervisors & General Foreman 46 3 49
Aircraft Pilots & Navigators 36 3 39
Bosuns 30 30
Civil Engineering Technicians 21 2 23
Draughtsman 26 4 30
Other Engineering Technicians 117 8 125
Physical Science Technicians 19 5 24
Ship Deck Officers & Pilots 176 1 177
Ship Engineers (including Shore-based) 44 1 45
Mechanical Engineering Technicians 218 7 225
In total, only a quarter (25 per cent) of Solomon Islanders working as physical and engineering science technicians have a post-school qualification compared with 42 per cent of foreign workers in the same occupation grouping. However, the skills gap is even greater if Australian workers in the same occupations are used as the reference point.
It is not clear which of the above specific occupations from the NPF listing do not have post-school qualifications compared with their foreign counterparts. Table 28 presents Australian data for the similar occupations as a reference point. As many as 85 per cent or more of electrical, electronic and mechanical engineering technicians have a post-school qualification and three quarters (75 per cent) of Civil Engineering Draftspersons and Technicians have a post-school qualification. Nine-out-of-ten marine professionals (88 per cent) have a post-school qualification.
Chapter Seven looks at the future skill needs of the Solomon Islands economy.
64 of 103

Table 28: Proportion of jobholders in Australia in specified occupations with post-school qualifications, per cent, Australia 2011
Australian occupations ANZSCO Per cent
3122 Civil Engineering Draftspersons & Technicians 75.1
3123 Electrical Engineering Draftspersons & Technicians 88.4
3124 Electronic Engineering Draftspersons & Technicians 85.5
3125 Mechanical Engineering Draftspersons & Technicians 86.9
3126 Safety Inspectors 84.5
2312 Marine Transport Professionals 87.9
65 of 103
Attachment 6
Table A6.1: The proportion of foreign and domestic workers with post-school qualifications in each occupational group, Solomon Islands 2009, per cent, (number of foreign workers 18 & over in each occupation)
ISCO 88 sub-major groups Foreign workers with post-school quals
Domestic workers with post-school quals
Difference
11 Legislators & senior officials 72 50 22
12 Corporate managers 47 45 2
13 General Managers 65 43 22
14 Retail & other services manager 61 29 32
21 Science & engineering professionals 64 34 30
22 Life science & health professionals 100 47 53
23 Teaching professionals 91 45 47
24 Other professionals 68 43 25
26 Legal, social, & cultural professionals 88 27 62
31 Physical & engineering science technicians 42 25 17
33 Teaching associate professionals 53 30 23
34 Other associate professionals 65 17 49
52 Models salespersons & demonstrators 41 5 36
54 Protective service workers 50 5 45
71 Extraction & building trade workers 61 9 52
72 Metal machinery & related workers 10 18 -9
81 Stationery plant & related operators 27 3 24
83 Drivers & mobile plant operators 5 5 0
91 Sales & services elementary occupations 39 2 37
66 of 103
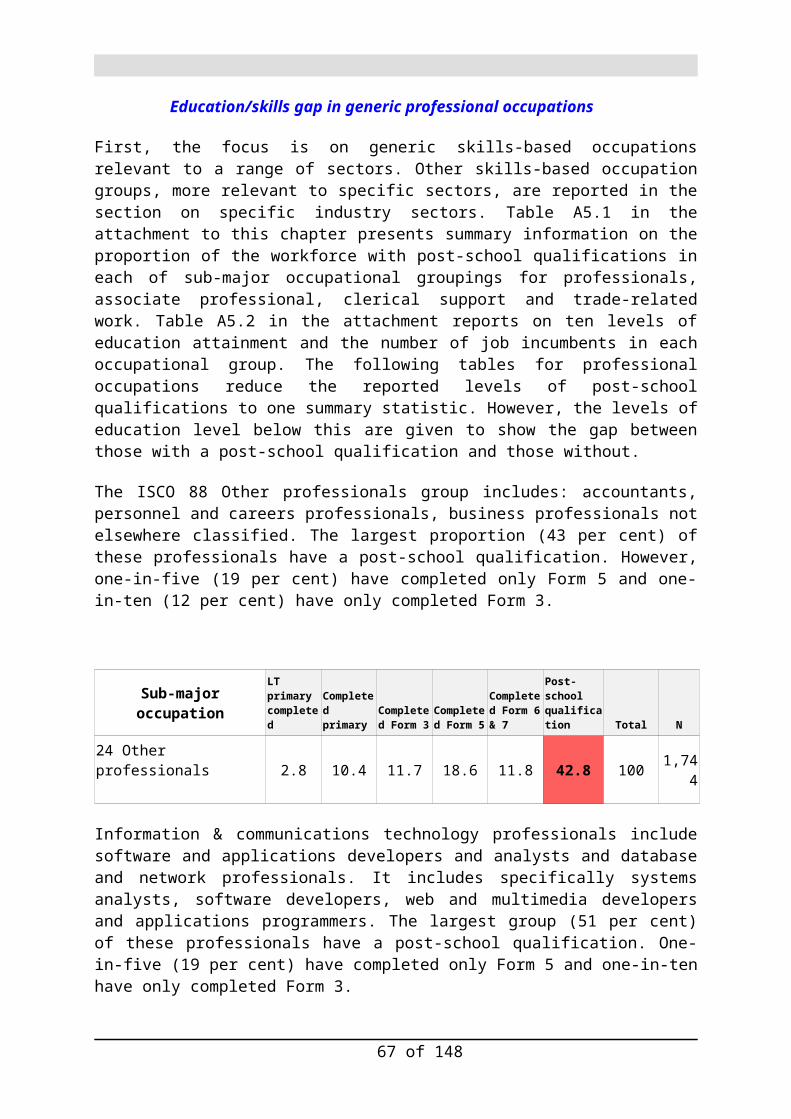
Chapter Seven: Future skill needs
The issue of how to forecast future demand for skills is a complex one. It is not possible simply to take past trends and project them into the future. Sector forecasts of workers with specific technical skills was popular in the 1960s and 1970s but were rejected in the 1980s due to the rigidity of the method used.
Manpower planning generally assumed a fixed relationship between labor and outputs, implicitly ruling out technological change. It also emphasised technical skills to the detriment of cognitive and social skills. And it was slow to adapt to rapid changes in the world of work...23
The OECD’s major review of TVET in 2010 called Learning for Jobs noted that:
...the shape of future labour market needs is inevitably misty. The challenge is to identify what can reasonably be predicted some years into the future, and what cannot.24
The World Bank concludes its note on the limitations of manpower planning with this comment: ‘...perhaps the most valuable lesson from East Asian countries is that skills-development systems need to grow organically from below while being coordinated and fostered from above’.25
Forecasting the skill needs of the Solomon Islands economy cannot be based on a projection of past trends. One guide to the future is the age structure of the workforce.
Future skill shortages due to replacement demand
The age structure of the non-farm occupation profile can help identify which occupations have a larger share of older workers who will need to be replaced on retirement.
23 World Bank, 2012, World Development Report 2013: Jobs. Washington DC, Box 5.8, p 17724 OECD, 2010. Learning for Jobs: Synthesis Report of the OECD Reviews of Vocational Education & Training. p 57. 25 See Note 39.
67 of 103

Table 29: Older age profile of the skills-based occupations, Solomon Islands census 2009, per cent of each occupation group
Skill-based occupations
Older workers
Total N
50-59 60 plus total
per cent per cent per cent
11 Legislators and senior officials 988 24.5 10.7 35.2
12 Corporate managers 747 19.3 3.7 23.0
13 General Managers 229 18.8 7.4 26.2
14 Retail and other services manager 341 16.1 5.6 21.7
21 Physical mathematical and engineering science professionals 583 9.6 3.9 13.6
22 Life science and health professionals 1,525 11.0 1.9 12.9
23 Teaching professionals 7,773 7.4 2.0 9.5
24 Other professionals 1,744 12.0 2.8 14.8
25 Information and communications technology professionals 53 3.8 1.9 5.7
26 Legal social and cultural professionals 1,606 16.9 10.5 27.4
31 Physical and engineering science technicians 999 9.1 3.7 12.8
32 Life science and health associate professionals (except nursing) 473 10.1 2.7 12.9
33 Teaching associate professionals 1,072 14.9 3.7 18.7
34 Other associate professionals 769 15.3 8.2 23.5
35 Information and communications technicians 187 7.5 1.1 8.6
71 Extraction and building trade workers 8,787 9.5 6.3 15.8
72 Metal machinery and related workers 1,876 7.8 2.3 10.2
74 Other craft and related trades workers 301 7.6 2.3 10.0
75 Food processing wood working garment and other craft and related 2,279 8.2 3.8 12.0
Private sector growth prospects 2009
The private sector opportunities for growth were identified in a Discussion Note (October 2010) entitled: ‘Solomon Islands Growth Prospects Constraints and Policy Priorities’. This Discussion Note identified five sectors. Table A7.1 in the attachment to this chapter lists these sectors and updates the information on employment implications where possible.
68 of 103

The World Bank notes that of the 9 per cent growth expected in 2011, 3 per cent was expected to come from logging, another 2 per cent from Goldridge Mining in 2011 with more contribution in 2012. Another factor is the recovery in government spending which has been in large part funded by donors. The World Bank notes that these factors alone will not generate sustainable long-term growth.26 Export growth has been achieved on the back of exploiting the limited and exhaustible resources of timber and gold. The Central Bank Governor notes, in his speech launching the CBSI Annual Report, that the country has to not only diversify its export base. Solomon Islands also has to ‘fast track the implementations of import substitution options for costly imported items such as fuel and food items’.27
Public sector growth
Government funding in core service delivery for health, greater than 10 per cent of recurrent expenditure, and education, greater than 22 per cent.
According to the Central Bank Governor in his speech launching his Bank’s Annual Report, ‘public expenditure by both the government and donors is expected in 2013 to continue to be a major driver behind some of the economic activities anticipated for 2013’. 28
Future infrastructure investment
In an economy where the private sector is focused on serving the needs of a small domestic market and the the tourist trade is low, government and donor investment in infrastructure provide the best guide to the future demand for skills. The Solomon Islands Central Bank Governor has noted in May 2013 the number of ‘big ticket’ infrastructure projects which are heading for completion or are on the pipeline. These projects are the Munda International Airport, the submarine cable, Noro port development, Tina hydro, the Savo geothermal project, the Honiara ports development, and the Kukum highway.29
However, an estimate of the skills needed for a particular infrastructure project can only be worked out from more detailed discussions with the parties directly responsible for the project. In many cases, these will be the enterprises awarded the contracts to build or supply the infrastructure. In other cases, it will be the government agency charged with implementing an energy, water or environmental protection initiative.
Future opportunities for skills formation in Solomon Islands also require a change in government policy to maximise the skills transfer opportunities. One way this could be done is for government to stipulate in a request for tenders that opportunities for skills transfer be provided such as the employment of apprentices. Another way could be for government to specify the ‘green jobs’ and competencies needed to implement its policy statements on energy and responses to climate change.
26 Bulman, T and McNicol, A, 2011, The Solomon Islands Growth Agenda: Turning today’s resource-driven boom into a stronger economy and better living standards, 16 December27 Speech by Governor Denton Rarawa at launch of the CBSI 2012 Annual Report. Kitano Mendana Hotel, 10 May, 2013, p2. 28 Speech by Governor Denton Rarawa at launch of the CBSI 2012 Annual Report. Kitano Mendana Hotel, 10 May, 2013, p 3.29 Speech by Governor Denton Rarawa at launch of the CBSI 2012 Annual Report. Kitano Mendana Hotel, 10 May, 2013, p 5.
69 of 103

The following list of priority infrastructure projects includes current or ongoing projects (categorised as O=ongoing), two committed projects (C=committed), and 19 proposed projects (P=proposed). These projects represent expenditure of SBD $684m in 2013, $570m 2014, $482 in 2015, $403m in 2016, $344m in 2017, $278 in 2017, $238m in 2019 and $162m in 2020.
It is possible to estimate the skill needs of road and related construction. Using the following skills profile for a USD $25 million road project of three (3) managers, eight (8) professional staff, fifteen (15) technicians, twenty five (25) skilled staff and 150 unskilled (ie can acquire skills on the job). The skilled employees would include auto mechanics, heavy equipment mechanics and operators, form work carpenters, steel fixers, welders, pipe layers, secretarial and administrative assistants. The technician level skills include survey and laboratory technicians.
Many of these skills will be imported as enterprises have a core of skilled personnel. However, if a procurement requirement for skills transfer is adopted, such as that used in the
70 of 103
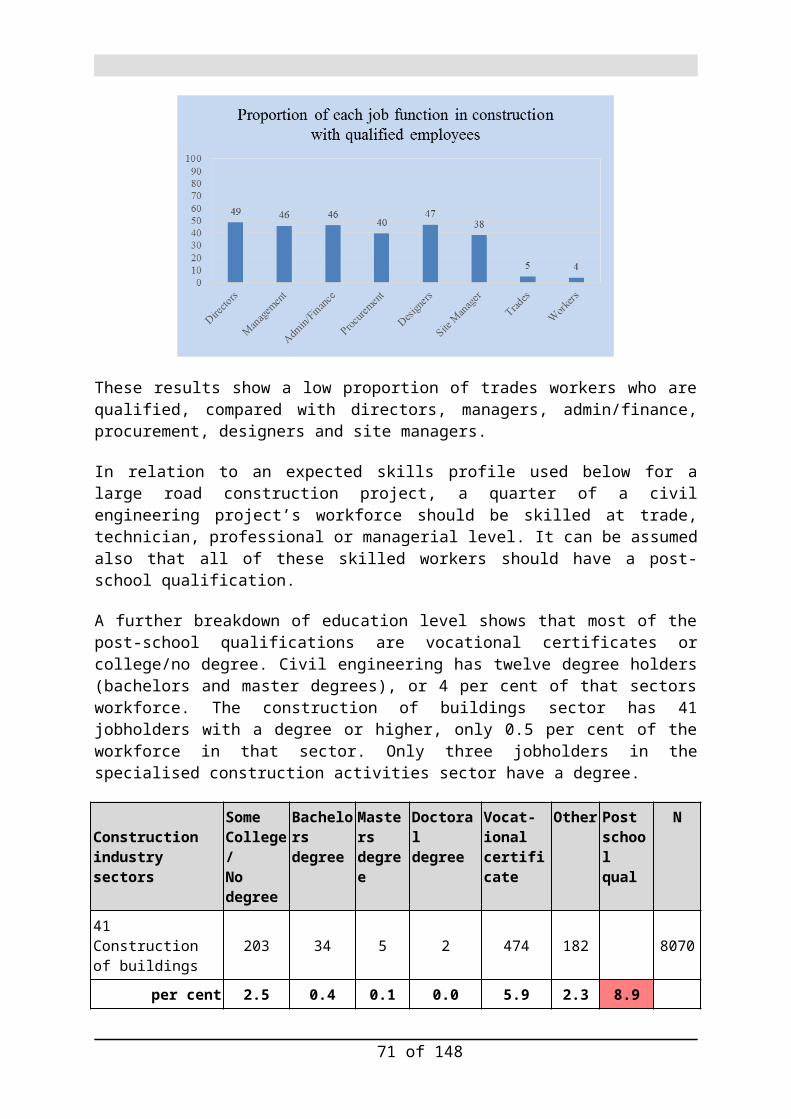
UK, it would be possible to identify the specific skills opportunities for each contract. If the procurement requirement of one apprentice for each USD $1 million was adopted, this would produce 25 training places for a USD $25 million road or related construction project.
On the basis of the current, committed and proposed expenditure of USD$184 million between 2013 and 2020, some 184 on-the-job skills training positions could be created. Skills requirements are often defined by regulatory standards. So future skills training will need to incorporate a close understanding of the proposed National Building Code and a Road Design Standard which includes climate proofing.30 Skills training on the use of the revised building code and road design standards will be needed for government staff responsible for inspection and enforcement as well as for enterprises.
Table 30: Skills needs of current, committed and proposed road and related construction projects, 2013-2020, Solomon Islands, number of persons
Type of project CostSkills required
Managerial Professional Technical Skilled Low skilled
Basis for estimate USD $25 m 3 8 15 25 150
Road/Airfield USD $109 m 13 35 66 109 655
Port USD 75 m 9 24 45 75 450
Total 22 59 111 184 1,105
Conclusion
Most large infrastructure projects import skilled workers. However, these projects also offer major opportunities for skills transfer domestic workers. These workers will need appropriate ‘front-end’ skills training, akin to apprentice off-the-job training, to enable them to learn better what to do and how to it on-the-job. In other words, predicting the future demand for skills, sourced from domestic sources, has to start with a government policy to create these opportunities. One way to do this is to include in tender specifications a requirement for enterprises to take on workers in training.
30 See Lal, P.N. and Thurairajah, V. 2011. ‘Making informed adaptation choices: A case study of climate proofing road infrastructure in the Solomon Islands’. A background case study, Lal, P.N. 2011, Climate Change Adaptation in the Pacific: Making Informed Choices, prepared for the Australian Department of Climate Change and Energy Efficiency (DCCEE), the International Union for Conservation of Nature, Suva, Fiji. See also ADB, 2011, Guidelines for Climate Proofing Investment in the Transport Sector: Road Infrastructure Projects. Manila, Asian Development Bank.
71 of 103

Attachment 7
Table A7.1: Potential growth sectors identified by the World Bank’s ‘Solomon Islands Growth Prospects: Constraints and Policy Priorities’, Discussion Note, October 2010
Potential growth sectors 2009
Employment impact Information on prospects 2014-2020 -
1. MINERALS In this sector, gold, and in particular the rehabilitation of the Gold Ridge mine, is the most promising medium- term prospect. Gold Ridge could potentially offset a large share of the export losses from logging, but over a limited period.
If the financing and regulatory issues are resolved, the Gold Ridge mine could, from 2010, be producing and exporting 135,000 ounces each year until 2013 and 124,000 ounces for four years annually beyond that. Small alluvial mining could also benefit from 'downstream' effects of the pit mining. Local employment could rise from 180 to 400 if mining commences.The job-generating effect will be modest, perhaps 400 local jobs on Guadalcanal. This includes the 180 already employed refurbishing the mine as well as 220 assumed new employees.
Start of production at Gold ridge has been a key driver of growth to 2013. Mining exports grew in 2012.
2. TUNA FISHERIES Despite constraints over revamping management and production at the Soltai plant, this sector continues to make a significant contribution to exports. Its value is around 25 percent of log exports, and ranks as the second major export.
There is an opportunity to expand value adding through increased loining. Exports could exceed US$40 million and more than 1000 new jobs could be created. This could happen through revived and expanded activity at Soltai and through new entry by a foreign investor
Fisheries exports grew in 2012.
3. PLANTATION FORESTRY Plantation forestry, both large scale commercial and village scale, offers a long term, sustainable but partial, restoration of earnings and jobs from depleted forest resources. But even under favourable conditions these activities might replace less than 10 percent of recent annual export earnings from extractive logging by 2013.
Little net gain in large scale commercial forestry jobs above 2008 levels of 500-600; unknown expansion at village level.
Logging has been a key driver of growth - logging grew in 2012 and in 2013 is expected to remain at the same level as 2012. Sawn timber exports have doubled in the last five years. Need to focus more on the value-adding processing of timber, as in Fiji & Vanuatu
72 of 103

4. TOURISM Recreational tourism remains disappointingly low. Visitor spending and room occupancy are currently driven by personnel associated with donor assistance. Without resolution of the airline access problem to outer islands, resort tourism and related regional incomes may grow only slowly.
Available proxy data suggest that hotel and restaurant contribution to GDP is only two percent. Until constraints are addressed, tourism contribution to GDP will remain at these low levels.By 2013 there are likely to an additional 490 rooms in Honiara; Additional 110 rooms in resorts outside Honiara with occupancy rates increased by 10-15% in regional areas.Visitor numbers Î24 300 by 2012, (14,251 now) recreational share to 35% (20% 2009).Approximately 1.5 additional staff per additional room, 735 Honiara, 165 elsewhere.
Government has a target of 50,000 visitors by 2015, up from 24,000 arrivals in 2012.
5. PLANTATION AGRICULTURE Limited value adding capacity for copra along with the RIPEL dispute, and marketing and quality deficiencies for cocoa, are holding back growth.
1300 additional jobs associated with coconuts/copra, 600 with cocoa, minimal jobs associated with crushing mill
Good copra, coffee, fisheries production contributing too. Farmers in 2012 produce 5,000 tons of cocoa. Ministry of Agriculture has a target of 20,000 tons by 2020.
6. PALM OIL PLANTATIONS Output has the potential to increase substantially from the existing GPPOL plantation, out growing and the development of a new plantation on Malaita, providing land issues can be resolved and world oil prices recover somewhat from their recent decreases.
2000 Temporary jobs planting Malaita with further 2000 permanent jobs if full development, GPPOL adds 500 jobs by 2013.
Palm oil has shown a year-on-year improvement in the first four months of 2013 and is expected to remain so for the rest of 2013.
73 of 103

Chapter Eight: Opportunities in Australian and New Zealand labour markets
Solomon Island residents in Australia
The focus of the following analysis of overseas work opportunities for Solomon Islanders focuses mainly on Australia because it has the largest labour market in the region with the most job vacancies. In addition, recent census data are available on the occupations and industries of employment of Solomon Islanders resident in Australia.
The estimated population of Solomon Islanders resident in Australia in 2011 is 2,140. The estimated population over the age of 15 years is 1,930. This is a tiny fraction of the estimated 6.0 million residents in Australia in mid 2011 who were born overseas.31 Solomon Islanders resident in Australia are a slightly lower proportion of their total population compared with the other Melanesian countries. Fiji dominates the Melanesian migrant flow to Australia with 7.4 per cent of its resident population in Australia. Papua New Guinea has 0.54 per cent of its resident population in Australia, Vanuatu has 0.44 per cent and Solomon Islands has 0.39 per cent.
Table 31: Industry of employment for Solomon Islanders resident in Australia, 2011
Industry of Employment Male Female Total
1. Agriculture, Forestry & Fishing 5.7 1.3 3.3
2. Mining 2.1 1.7 1.9
3. Manufacturing 13.5 5.2 8.9
4. Electricity, Gas, Water & Waste Services 2.1 1.0
5. Construction 14.3 6.6
6. Wholesale Trade 3.6 3.7 3.5
7. Retail Trade 4.8 12.0 8.4
8. Accommodation & Food Services 4.5 8.4 6.4
9. Transport, Postal & Warehousing 6.7 2.8 4.5
10. Information, Media & Telecommunications 1.0 0.4
11. Financial & Insurance Services 2.6 2.4 2.4
12. Rental, Hiring & Real Estate Services 1.4 0.7
13. Professional, Scientific & Technical Services 13.3 5.4 8.9
14. Administrative & Support Services 0.0 4.5 2.3
15. Public Administration & Safety 13.3 8.4 10.4
16. Education & Training 3.8 12.3 8.0
17. Health Care & Social Assistance 6.7 30.8 18.8
31 Australian Bureau of Statistics, 2012, ‘Australia's Population By Country Of Birth’ 3412.0 - Migration, Australia, 2010-11, released 15 August.
74 of 103

19. Other Services 6.4 1.3 3.6
Total 100.0 100.0 100.0
N 421 465 910
Table 31 above shows in the industries Solomon Islands resident in Australia are employed. The first fact worth noting is that more women than men have jobs. The top five sectors employing women are: health care & social assistance, education & training, retail trade, public administration & safety, and accommodation & food services. The top five sectors for men are: construction, manufacturing, public administration & safety, professional, scientific & technical services and health care & social assistance.
Figure 10 shows the income distribution of Solomon Island residents in paid work in Australia (see also Table A8.1). It includes both part-time and full-time work. The incomes earned vary great from the 18 per cent in the top two income brackets to the same proportion in the both two brackets. The largest proportion earn between $20,000 and $32,000 a year, followed by those who earn between $32,000 and $42,000 a year.
Figure 10: Income distribution of Solomon Island residents in paid work in Australia, per cent
9
9
10
16
13
9
12
5
9
9
0 2 4 6 8 10 12 14 16 18
$1-$199 ($1-$10,399)
$200-$299 ($10,400-$15,599)
$300-$399 ($15,600-$20,799)
$400-$599 ($20,800-$31,199)
$600-$799 ($31,200-$41,599)
$800-$999 ($41,600-$51,999)
$1,000-$1,249 ($52,000-$64,999)
$1,250-$1,499 ($65,000-$77,999)
$1,500-$1,999 ($78,000-$103,999)
$2,000 or more ($104,000 or more)
Per cent
Inco
me
per w
eek
& y
ear
Income distribution of Solomon Islanders in paid work in Australia
The large differences in income earned for men and women are shown in Figure A8.1 in the Attachment to this chapter. These differences no doubt reflect the fact that women are more likely to be part-time workers. Women who are income earners are more concentrated in the $20,000 to $42,000 bracket while the male earners are more evenly distributed across all income brackets.
Figure 11 shows the top ten jobs held by Solomon Islands men resident in Australia in 2011. Registered Nurses is the most important job for men, followed by crop farm workers, sales assistants, aged & disabled carers, and storepersons. For women, the most important
75 of 103

occupation is also registered nurses, followed by aged and disabled carers, commercial cleaners, primary school teachers, and crop farm workers. In terms of broad skill and education levels, the only professional level positions in the top ten jobs for both men and women are: registered nurses, electrical engineer, and primary school teacher. Other positions that are likely to require a post-school qualification are: aged and disabled carers and nursing support and personal care workers, and accounting clerks.
Figure 11: Top ten jobs held by men from Solomon Islands resident in Australia, 2011, per cent of all jobs held
129
64
33
33
22
0 2 4 6 8 10 12 14
Registered NursesCrop Farm Workers
Sales Assistants (General)Aged and Disabled Carers
StorepersonsCommercial Cleaners
ElectriciansElectrical Engineers
Retail ManagersNursing Support and Personal Care Workers
per cent
Top ten jobs held by men from Solomon Islands resident in Australia 2011
Figure 12: Figure 11: Top ten jobs held by women from Solomon Islands resident in Australia, 2011, per cent of all jobs held
1510
75
55
433
3
0 2 4 6 8 10 12 14 16
Registered NursesAged and Disabled Carers
Commercial CleanersPrimary School Teachers
Crop Farm WorkersSales Assistants (General)
Nursing Support and Personal Care WorkersGeneral Clerks
Accounting ClerksKitchenhands
Per cent
Top ten jobs held by women from Solomon Islands resident in Australia 2011
Figure 13 groups the jobs held by Solomon Island residents in Australia into broad skills and education based categories. What is evident is the large concentration of jobs at both ends of the skills spectrum: professionals and labourers. Many are also in clerical and personal support (aged & disabled carers, nursing support & personal carers) jobs. It is notable that
76 of 103
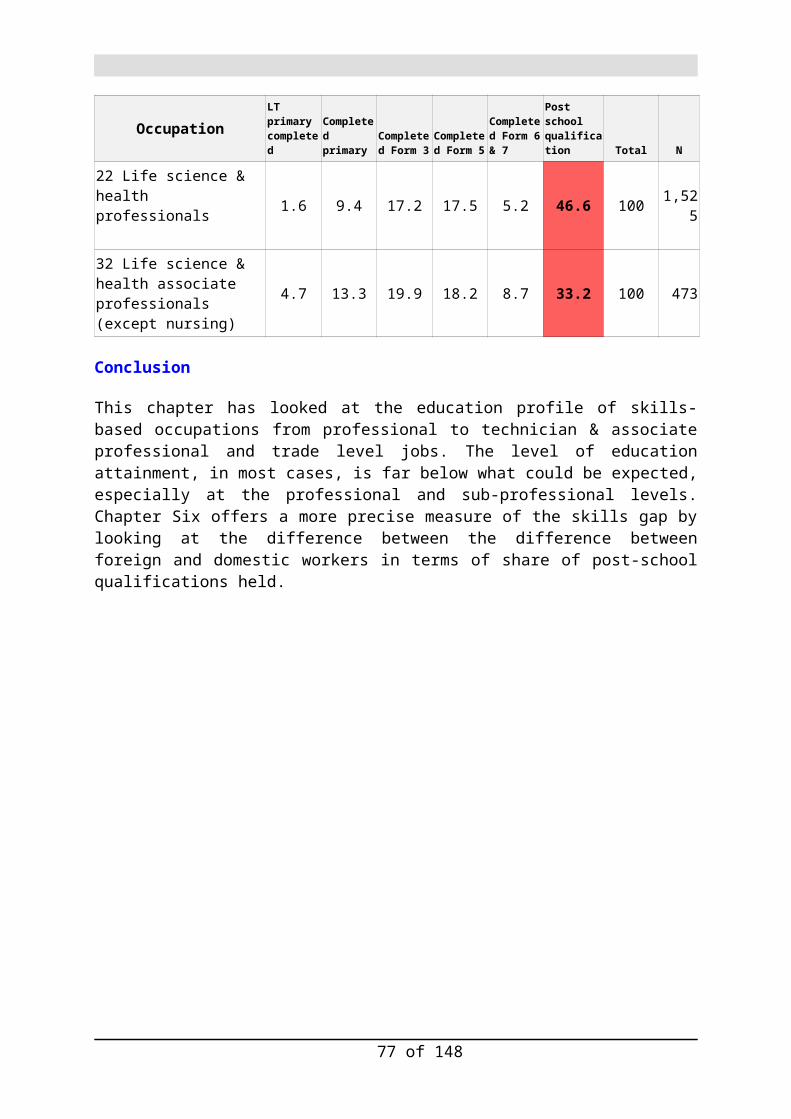
Solomon Islands resident in Australia hold few jobs at the technician or associate professional levels.
There is evidence that Solomon Island residents may be overqualified for some of the jobs they hold. A more detailed look at the large number of Solomon Islands residents who are aged and disabled carers shows that half have a diploma or higher qualification and 30 per cent have a certificate and the remainder with no post-school qualification. In contrast, for the nursing support and personal care workers, 60 per cent have a certificate only, 10 per cent have a post-graduate degree and 30 per cent do not have a post-school qualification.
Figure 13: Type of job held by Solomon Island residents in Australia, 2011, per cent
527
15
1112
57
225
0 5 10 15 20 25 30
ManagerialProfessional
Associate professionalTrade
ClericalPersonal support workersPersonal service workers
SalesMachine operators
Labourers
Per cent
Broad type of job held by Solomon Island residents in Australia
Figure 14: Type of job held by men & women Solomon Islands residents in Australia 2011, per cent
626
210
777
64
27
327
11
1616
39
024
0 5 10 15 20 25 30
ManagerialProfessional
Associate professionalTrade
ClericalPersonal support workersPersonal service workers
SalesMachine operators
Labourers
Type of jobs held by men & women, Solomon Islands residents in Australia 2011
Male Female
77 of 103

In terms of jobs held by men compared with women, the share of professional jobs is virtually the same (see Figure 14). Men are more likely to have trade-related work and women are more likely to have clerical, personal support work, and to a lesser extent sales work. It is notable that few are in technician or associate professional jobs and few are working in trades jobs.
Skilled migrants from Solomon Islands to New Zealand
Immigration New Zealand provides data on the occupation of migrants who were approved to work in New Zealand for the last five years. Between July 2008 and July 2012, 2,195 Solomon Islands applied to work in New Zealand. Most of these approved applications (86 per cent) were for the Recognised Seasonal Employer (RSE) Scheme. Of the remainder 146 were granted a work visa because they were the partner of a worker or a student. No job offer was required and no information on the person’s occupation was recorded. It is interesting to note that 42 per cent of these applicants were men.
The number of skilled migrants from Solomon Islands between July 2008 and December 2012 was 70. Most of these approved applications (58) were made from within New Zealand and most (90 per cent) had a job offer. The twelve offshore applications had no job offer and only four were in the essential skills category, three were classified as minister/missionary or pastor and the remainder were classified as general with no information recorded about their occupation.
Information on the occupations of 48 skilled migrants to Solomon Islands over nearly a five year period is presented in Table A8.2. Data on the occupations of 13 skilled migrants from Solomon Islands who were already resident in New Zealand for the period July 2008 to February 2013 are presented in Table A8.3. Figure 15 combines and summarises the data on occupations of skilled migrants from Solomon Islands to New Zealand over the last five years.
Figure 15: The type of job held by skilled migrants from Solomon Islands to New Zealand, July 2008 to February 2013, per cent
78 of 103

13
33
18
13
11
11
0 5 10 15 20 25 30 35
Managers
Professionals
Technicians & Trades
Community Personal Service
Clerical Administrative
Labourers
per cent
Type of jobs held by skilled migrants from Solomon Islands to New Zealand
79 of 103

Figure 15 can be compared with Figure 13 for Australia. Each is based on a different base population. Figure 13 refers to Solomon Island residents in Australia and Figure 15 refers to approved skilled migrants from Solomon Islands to New Zealand, many of whom may have been already resident in New Zealand. Solomon Islands working in Australia are concentrated in professional occupations and in labouring work, with others in clerical and personal care work. The pattern for New Zealand is somewhat different. The profile is much more skills based, with one-in-three in the professions, just under one-in-twenty are in technician and trades work and around one-in-ten are in community or personal service jobs or clerical work. Given that skills are a key criterion for entry, it is understandable that few are labourers. If those approved to work because they are accompanying their partners were included, more may have been categorised as labourers or other low skilled jobs.
80 of 103

Attachment 8
Table A8.1: Distribution of earnings, weekly & annual, for Solomon Islands residents in Australia, 2011, per cent
Weekly & annual income Per cent
$1-$199 ($1-$10,399) 9.1
$200-$299 ($10,400-$15,599) 8.8
$300-$399 ($15,600-$20,799) 9.6
$400-$599 ($20,800-$31,199) 15.5
$600-$799 ($31,200-$41,599) 12.7
$800-$999 ($41,600-$51,999) 9.3
$1,000-$1,249 ($52,000-$64,999) 11.5
$1,250-$1,499 ($65,000-$77,999) 5.4
$1,500-$1,999 ($78,000-$103,999) 9.4
$2,000 or more ($104,000 or more) 8.7
Total 100.0
N 1,268
Figure A8.1: income distribution of Solomon Islands resident in Australia, males & females, per cent
81 of 103
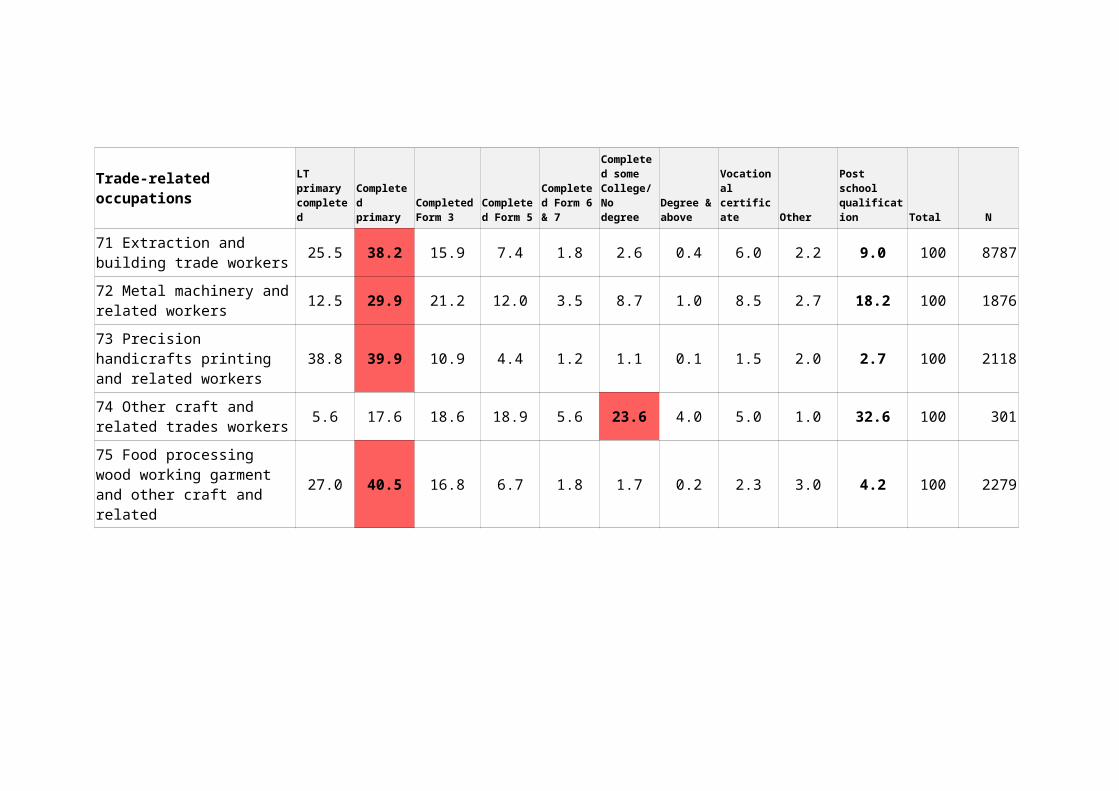
Table A8.2: Occupations of skilled migrants from Solomon Islands to New Zealand, July 2008 to December 2012, male, female & total
Standard Major Group ANZSCO Occupation Description Total Males Females
Managers Dairy Cattle Farmer 7 7
Sports Administrator 1 1
Professionals Hospital Pharmacist 5 2 3
Systems Analyst 2 2
Developer Programmer 2 2
Software Applications Programmers nec 2 2
Minister of Religion 2 2
Technicians & Trades Workers
Motor Mechanic (General) 1 1
Aircraft Maintenance Engineer (Mechanical) 1 1
Electrician (General) 1 1
Electrician (Special Class) 1 1
Light Technician 1 1
Technicians Trades Workers nec 2 2
Community Personal Service Workers
Youth Worker 1 1
Aged or Disabled Carer 5 4 1
Personal Care Assistant 1 1
Clerical Administrative Workers
Contract Administrator 1 1
Program or Project Administrator 3 3
Office Manager 1 1
Clerical Administrative Workers nec 2 2
Labourers Vineyard Worker 3 3
Dairy Cattle Farm Worker 1 1
Electrical or Telecom Trades Assistant 2 2
Total 48 30 18
Source: W3 - Occupations of work applications approved, 1 September 2013, Immigration New Zealand
82 of 103

Table A8.3: Occupations of skilled migrants from Solomon Islands to New Zealand, applying from within New Zealand, July 2008 to February 2013
Standard Major Group Occupation Description Male Female
Professionals Civil Engineer 1
Production or Plant Engineer 1
University Lecturer 1
Hospital Pharmacist 1
Hospital Pharmacist 1
Occupational Therapist 1
Physiotherapist 1
Technicians Anaesthetic Technician 1
Electrical Engineering Technician 1
Trades Workers Fitter (General) 1
Electrician (General) 1
Community & Personal Service Workers
Footballer 1
Clerical and Administrative Workers
Program or Project Administrator 1
Total 8 5
Source: R4- Occupation & region for resident principal applicants, 1 September 2013, Immigration New Zealand
83 of 103

Chapter Nine: Temporary work in Australia and New Zealand
Australia and New Zealand have a strong focus on skills as a basis for migrant entry for work in the medium and long term. However, short-term work and work-based training visas are available. The short-term work visas are available to citizens of Pacific island countries for seasonal work in horticulture. The working holiday visa is generally not available to Pacific island countries.32
In Australia, the Seasonal Workers Program started on 1 July 2012 and is to run until 30 June 2016. The duration of work is from a minimum of 14 weeks to a maximum of seven months. In New Zealand, the duration is a maximum of seven months in any 11-month period.
Occupational work with training visa
Another short-term visa which identify available for is the occupational training visa - now known as Training and Research (Subclass 402) Visa - Occupational Trainee Stream.
This visa allows people to complete workplace-based training in Australia on a temporary basis for a period of up to two years. The training is to provide people with additional or enhanced skills in the nominated occupations, tertiary studies or fields of expertise. The training programs are required to be for a minimum period of 30 hours a week and at least 70 per cent of this training is required to be workplace-based.33
The types of occupational training include:
training or practical experience in the workplace required to obtain registration for employment in an occupation in Australia or in the visa holder’s home country,
a structured workplace training program to enhance existing skills in an eligible occupation, or
structured workplace training to enhance skills and promote capacity building outside Australia.34
Seasonal work in Australia
Australia's Seasonal Worker Program (SWP) consists of an ongoing program in Australia's horticulture sector and a trial of seasonal labour mobility arrangements in the accommodation, aquaculture, cane and cotton sectors in selected locations to June 2015.
32 Eligible countries of origin are Belgium, Canada, Republic of Cyprus, Denmark, Estonia, Finland, France, Germany, Hong Kong, Republic of Ireland, Italy, Japan, Republic of Korea, Malta, Netherlands, Norway, Sweden, Taiwan and United Kingdom. Argentina, Bangladesh, Chile, Indonesia, Malaysia, Thailand, Turkey, the USA and Uruguay. Papua New Guinea has recently signed an MoU with Australia for university graduates only to be eligible for a working holiday visa. However, PNG is not mentioned on the DIAC website as an eligible country http://www.immi.gov.au/visitors/working-holiday/462/33 http://www.immi.gov.au/visas/temporary-visa/402/occupational-trainee/ 34 http://www.immi.gov.au/visas/temporary-visa/402/occupational-trainee/
84 of 103

Seasonal workers can undertake what is considered to be low skilled and unskilled work:
sowing, planting and cultivating agricultural holdings;
flower or vegetable market gardens in connection with the sowing, planting, raising, cultivation, harvesting, picking, packing or treating of horticulture crops, including fruit and vegetables upon farms, orchards and/or plantations;
clearing, fencing, trenching, draining or otherwise preparing or treating land for the sowing, raising, harvesting or treating of horticulture crops, including fruit and vegetables; and
viticulture activities to prepare land for planting of wine grape vines, and the pruning, growing treating, picking, harvesting and forwarding of wine grapes.35
A three year trial of seasonal workers in accommodation, aquaculture, cotton and cane sectors is also taking place in selected locations across Australia. The relevant occupations and locations are listed on the program’s website.36 Solomon Islands, along with another of other countries has a low take up to date compared with Tonga and Vanuatu (see Table 32). Tonga dominates the pilot scheme and the new seasonal worker program.
Table 32: Country of origin for workers on Australia’s Pilot scheme and Seasonal Worker Program, numbers and per cent
CountryPilot Feb 2009-30
June 2012Per cent
SWP (1 June 2012 30 June 2013)
Per cent Total Per cent
Tonga 1,331 81.5 1,199 81.4 2,530 81.5
Vanuatu 117 7.2 119 8.1 236 7.6
Papua New Guinea 82 5.0 26 1.8 108 3.5
Kiribati 52 3.2 34 2.3 86 2.8
Samoa 39 2.4 22 1.5 61 2.0
Solomon Islands 0 0.0 42 2.9 42 1.4
Timor-Leste 12 0.7 21 1.4 33 1.1
Nauru 0 0.0 10 0.7 10 0.3
Tuvalu 0 0.0 0 0.0 0 0.0
Totals 1,633 100.0 1,473 100.0 3,106 100.0
In terms of the available number of places, 74 per cent have been filled in 2013, 91 per cent (1,454) of horticulture places and 5 per cent (19) of trial places. This high take up rate for 35 http://deewr.gov.au/types-jobs-seasonal-workers36 http://deewr.gov.au/seasonal-worker-program-accommodation-trial http://deewr.gov.au/seasonal-worker-program-aquaculture-trial http://deewr.gov.au/seasonal-worker-program-cotton-trial http://deewr.gov.au/seasonal-worker-program-cane-trial
85 of 103

horticulture suggests that, despite the increase in the number of places from 1,600 to 2,000 in the second year of the program, there may be few opportunities for late comers to increase their numbers in this part of the program. The above data on participation in the program suggests that there is a major ‘first mover’ advantage to the countries that were able to mobilise large intakes from the very beginning. This is confirmed by data from the longer established Recognised Seasonal Employer (RSE) in New Zealand. The focus of the RSE is solely on work involving planting, maintaining, harvesting and packing crops in the horticulture and viticulture industries.
Table 33: Share of employment for Solomon Islands & Vanuatu in Recognised Seasonal Employer (RSE) scheme in New Zealand, 2007-08 to 2012-13, per cent of total RSE employment
07/08 08/09 09/10 10/11 11/12 12/13
Solomon Islands 5.3 4.6 4.1 3.6 5.8 5.7
Vanuatu 37.9 34.3 34.4 33.2 34.4 37.9
Total RSE 4,486 6,821 6,216 7,091 7,009 7,456
Solomon Island’s numbers in employment in the RSE have increased from 238 in 2007-08 to 423 in 2012-13, with a dip to 256 in 2009-10 and 252 in 2010-11. However, more important is the relative share of total employment.
Table 33 shows that Solomon Islands’ share of jobs on the RSE has varied from 3.6 to 5.8 per cent and has remained under 6 per cent for the six years of the scheme. Vanuatu on the other hand, has the largest share of employment, ahead of Tonga’s 21 per cent in 2012-13. Vanuatu started with a high share of total employment on the scheme and has varied only within a band of 33 to 38 per cent.
First mover advantage
What is the first mover advantage? Employers make an initial investment in training up new workers. This means they are likely to have a preference for returning workers so they can get a better return on their initial investment in training. A 2011 survey of RSE employers confirms this. In terms of early productivity, 61 percent of employers rated their returning Pacific RSE workers as ‘excellent – all hit the ground running’ and a further 34 percent rated these workers as ‘good – most need very little training’.37
Of those employers who employed both new and returning Pacific RSE workers, 86 percent believe that their returning workers are ‘much more productive’ (47 percent) or ‘somewhat more productive’ (39 percent) than their new workers this year. Some 90 percent of employers who employed both new and returning Pacific RSE workers reported that returning workers helped with the training of new workers.38
37 RSE Monitoring: Key Findings from the 2011 Employers Survey, Prepared by Research New Zealand for the Labour and Immigration Research Centre, Department of Labour, Government of New Zealand, pp 5-6.38 RSE Monitoring: Key Findings from the 2011 Employers Survey, Prepared by Research New Zealand for the Labour and Immigration Research Centre, Department of Labour, Government of New Zealand, pp 5-6.
86 of 103
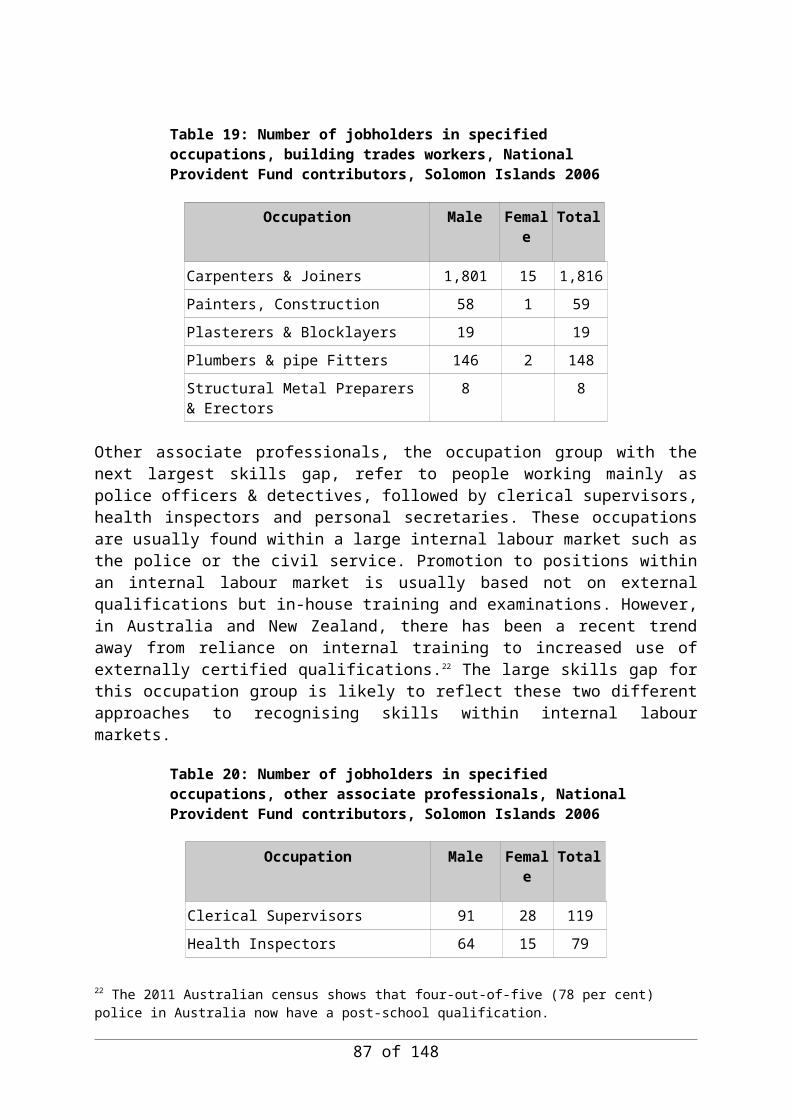
The success of Vanuatu in accessing the RSE stems from being part of the pilot before RSE was introduced. Seasonal Solutions (SSCO), an employer co-operative in Otago, decided after after the pilot that they would stay with workers from Vanuatu and have done since then. Because of the SSCO endorsement of Vanuatu workers, other employers and regions also wanted to try out workers from Vanuatu. Their reputation for being reliable and happy workers is said to have driven their success. In an employer-driven scheme, early information about the performance and reputation of workers has had a lasting impact.
Nevertheless, feedback from New Zealand indicates that workers from Solomon Islands have a good reputation as hard workers with few pastoral care related issues. Numbers from Solomon Islands are likely to increase in New Zealand as employers extend their areas of cultivation. They have the potential to replace workers from Vanuatu if the latter’s pastoral care issues increase.
Another factor may be the cost of air travel. For New Zealand employers, the lack of a direct flight from Honiara to New Zealand puts Solomon Islands at a major cost disadvantage compared to Vanuatu where a direct flight is available. Many other RSE sending countries have direct flights into New Zealand. However, this cost disadvantage applies to Tonga for work in Australia as there are no direct flights. So other factors shape recruitment patterns.
Implications for how recruitment is managed
This evidence suggests that building direct relationships with employers is crucial. Solomon Islands government does not have a liaison officer in New Zealand who, among other duties, can visit employers to promote the value of recruiting workers from their country. The Solomon Islands Government manages the selection of seasonal worker candidates through an agent model. Vanuatu also has an agent model. To recruit from an agent, Australian employers must pay the agent to select a short-list of candidates and for the service of completing visa application forms etc. Tonga and other countries such as Kiribati have a work-ready pool arrangement that provides a free service to employers. The agent model presents challenges to partner countries because governments have to make sure its agents are informed about the requirements of the program, represent their country well when engaging with Australian employers, and in overseeing their activities. If the agent model is to succeed, it needs to offer a professional service over and above what a government run work-ready pool can offer to employers.39
Also important is the need for the Government to gather information about the skills and education levels of the job seekers to make it easier for employers to recruit directly as an alternative to costly use of agents. This information needs also to be used to work out where government needs to fill gaps through training and education to ensure that workers have the levels of basic literacy and understanding of their rights and obligations to work overseas.
39 Information provided by Susannah Smith, Director, Seasonal Worker Program Migration, Department of Education, Employment and Workplace Relations, Government of Australia
87 of 103

Chapter Ten: Current demand for skilled migrants in Australia and New Zealand
Manpower Group has some 3,800 offices in over 80 countries and territories. The company conducts an annual survey of employers hiring intentions by asking them about whether they are having difficulty filling talent; and what jobs are most difficult to fill and why. A survey of employers in Australia and New Zealand in the first quarter of 2012 revealed that half are having difficulty filling jobs.40
The jobs Australian employers are having the greatest difficulty in filling are: skilled trades workers, engineers, sales representatives, accounting & finance staff, IT staff, management, technicians, drivers, mechanics, and chefs/cooks. For the seventh consecutive year of the survey, employers report that skilled trades positions are the most difficult type of vacancy across Australia.41 The list for New Zealand is similar: engineers, sales representatives, skilled trades workers, IT staff, technicians, accounting & finance staff, management/executives, chefs/cooks marketing, public relations/communications staff, and drivers.42 One-in-five New Zealand employers and one-in-four Australian employers report that they are willing to look outside their own region and country for suitable workers.43
Skilled migration to Australia and New Zealand
The United States lacks a permanent resident skilled migration category; instead it admits up to one million low-skilled migrants per year. Australia, New Zealand, and Canada, by contrast, have over the last decade given priority to migrants with skills-in-demand.44
In the decade since 2000, there has been extraordinary growth in skilled migration to New Zealand and Australia, through both permanent and temporary entry. Between 2004/05 and 2008/09, Australia selected 358,151 permanent General Skilled Migration migrants, including dependants. In 2009/10 Australia allocated 59 per cent of its permanent migration places to skilled applicants, 33 per cent to Family Category entrants, and 8 per cent to Humanitarian Category entrants, out of a programme total of 182,450.
New Zealand had a planned overall intake of 45,000-50,000 people, including secondary applicants, across the: Skilled/Business Category: (60 per cent); Family (Partner and Dependent Child); Category: (21 per cent); Family (Parent, Adult Child and Adult Sibling) Category: (11 per cent); and the International/Humanitarian Category: (8 per cent). The top five professions of skilled migrants to Australia in the period 2004 to 2009 were accounting (32 per cent), computing (23 per cent), architecture/building (9 per cent), engineering (9 per cent), and nursing (5 per cent). The major trades of skilled migrants were chefs/bakers (30 per cent of trade arrivals), engineering (14 per cent), building excluding plumbing (14 per cent), electrical (12 per cent), and hairdressing (12 per cent).
40 ManpowerGroup, 2012 Talent Shortage Survey Australia and New Zealand, pp 13 & 17. 41 See Note 36, p 13.42 See Note 36. p 17.43 See Note 36, p 15 & 19. 44 Hawthorne, L; 2011, Competing for Skills: Migration policies and trends in New Zealand and Australia. Department of Labour PO Box 3705 Wellington New Zealand p xiii. The following information on the differences between Australia and New Zealand is drawn from the Hawthorne report.
88 of 103

For New Zealand, computing and education were the major occupations for skilled migrant professionals, both constituting 18 per cent of all professionally qualified skilled migrants), followed by registered nurses (17 per cent), architects and engineers (15 per cent), business, human resource, and marketing professionals (15 per cent), and health professionals (9 per cent).45
Occupational demand is a key determinant of migrant selection in both countries. There has been a rising points threshold for skilled category selection to both countries. From 2004/05 to 2008/09, 58 per cent of Australia's 457 temporary visa arrivals were working in professional fields (compared with 66 per cent of permanent general skilled migrant arrivals). Seventeen per cent were in the trades, 13 per cent were associate professionals, and 10 per cent were managers and administrators. Just 2 per cent possessed lower level skills, despite the pressures of the mining boom and the existence of select low- skilled schemes (such as the recruitment of abattoir workers).
The primary General/Essential Skills groups entering New Zealand from 2004/05 to 2008/09 were clerical, sales and service workers (21 per cent), followed by 19 per cent in professional occupations, 15 per cent in the trades, 11 per cent who were managers and administrators, 11 per cent who were associate professionals, and 8 per cent who were labourers. The major professions in 2008/09 were health and life sciences, including nursing (8,999), and teachers and lecturers (4,163). Two groups dominated the 19,791 trades total that year: mechanic and fabrication engineering (6,299) and automotive, mechanical, and building workers.
An important new trend is a greater rôle for employer selection in both countries. According to the Hawthorne report: ‘Employers in both countries have come to exert extraordinary influence on permanent as well as temporary entry flows’.46 Australian employers in selecting migrants for temporary work visas are emphasising people with high-level English language ability. They are also seeking people from comparable high-quality education systems, and want applicants who can fit into the workplace at speed. New Zealand's temporary skills entry stream (General/Essential Skills Category) has long allowed employers to assess the suitability of applicants for permanent skilled migrant status. Australia's priority ranking system is moving in the same direction.47
Australia and New Zealand publish skills shortages lists. New Zealand’s Immediate Skills List has over 70 occupations listed. Australian Immigration lists over 440 occupations eligible for the General Skilled Migration visas and 126 of these are middle-level occupations.
New Zealand short-term employment prospects
New Zealand’s Ministry of Business, Innovation & Employment has produced in June 2013 ‘Short-term Employment Prospects: 2013 – 2016. The key relevant points for Solomon Islands are:
Employment in New Zealand is expected to increase gradually, growing by 1.3 per cent (or 28,400) between 2013 and 2014 year to March, by 2.3 per cent (or 52,300) between 2014 and 2015 year to March and by 2.1 per cent (or 49,500) between 2015 and 2016 year
45 See Note 40, p xv. 46 See Note 40, p 157. 47 See Note 40, p 157.
89 of 103

to March The unemployment rate is expected to trend down slowly, falling to 6.0 per cent by March
quarter 2014 down to 5.7 per cent by March quarter 2015 and decline below 5 per cent by March quarter 2016
Strong employment growth is expected in the construction and utilities industries over the next three years while the prospects for employment in other industries vary over time.
Growth in demand for employment in highly skilled jobs (that is, managers and professionals across a number of areas) will be consistently high over the forecast period, accounting for about 50 per cent of the overall employment growth.
Opportunities for lower-skilled workers are expected to account for about 35 per cent of the employment growth over the period. The food processing, retailing, accommodation, agriculture and construction industries should create most of these opportunities.
Employment growth will be strongest mainly in the Auckland and Canterbury regions
The global economic outlook in June 2013 is much better than six months earlier with lower downside risk. The uncertainty and concerns that the Eurozone may fall into recession have diminished. The prospects for growth in the USA have strengthened while weakening somewhat in Australia and China. This could dampen New Zealand’s export demand and returns, although the Canterbury rebuild after the Christchurch earthquake will provide a strong growth stimulus for the economy.48
Recent Migration Trends Key Indicators Report: June 2013
The same Ministry has also produced Migration Trends Key Indicators Report: June 2013. This report notes that permanent and long-term migration to New Zealand had a net gain of 7,900 in the year to June 2013 year compared with a net loss of 3,200 in the year to June 2012 year. The net gain was mainly due to fewer New Zealand citizen departures to Australia.
Other key points include information that in 2012-2013, 38,961 people were approved for residence in New Zealand, down 4 percent compared with 40,448 in 2011-2012. The top source countries were China (15 per cent) followed by the United Kingdom and India (13 per cent each). This is the first time in the last 10 years that China has been the top source country for residence approvals.
Skilled Migrant Category approvals (18,156 people) accounted for just under half of all residence approvals in 2012-2013. The number of Skilled Migrant Category approvals was down 4 per cent, though the decline was more modest than in previous years. In 2012-2013, 94 per cent of Skilled Migrant Category principal migrants were approved with a job or job offer in skilled employment compared with 92 percent in 2011/12.
India was the top source country of Skilled Migrant Category principal applicants in 2012-2013 and increased 5 per cent from 2011-2012. The increase from India is mainly due to former Indian international students who transition to temporary work and then to permanent residence.
The number of people approved for a temporary work visa in 2012-2013 increased 5 percent from the previous year due to increases in the number of working holidaymakers, ‘study to
48 Ministry of Business, Innovation & Employment, 2013, ‘Short-term Employment Prospects: 2013 – 2016, Government of New Zealand, June, pp 1-2.
90 of 103

work’ visa holders, horticulture and viticulture seasonal workers, and Essential Skills workers. Essential Skills temporary workers approved in 2012-2013 increased 2 per cent from the previous year. In 2012-2013, 4,733 people were approved for a work visa under Essential Skills for a job offer in the Canterbury region, an increase of 40 percent from 2011/12. This follows a 34 percent increase in the previous year as the number of Essential Skills workers rebounded from a low in 2010/11 due to the February 2011 Christchurch earthquake.49
Work opportunities in Australia and New Zealand
Australia and New Zealand publish skills shortages lists. New Zealand’s Immediate Skills List has over 70 occupations listed. Australian Immigration lists over 440 occupations eligible for the General Skilled Migration visas and 126 of these are middle-level occupations (see Tables A10.1 & A10,2).
Maritime work
Existing maritime workforce
There are opportunities for Solomon Islanders to work as seafarers on foreign-owned vessels in the region with appropriate training. These opportunities are shown by Tonga’s example. The Tonga’s Maritime training institute has had manning contracts with three shipping companies. Oceangas Australia Pty Ltd, which operates LPG Gas tankers in the Pacific employed 23 Tongans plus a trainee. Inco Ships Australia Pty Ltd operates conventional bulk carriers, complex self-unloading bulk cargo ships, as well as fully automated powder cement carriers. Inco Ships also operate crewing recruitment agencies in Sydney and Manila and offers crew supply services on a lump sum basis for any type of vessel. The company employed 43 Tongans in 2009. Pacific International Lines (PIL) from Singapore employed 14 Tongan crew in 2009.
The deep sea fishing industry and the rôle of observers
A significant opportunity for work on foreign vessels is the Observer Programs of the Western and Central Pacific Fisheries Commission (WCPFC) and the Forum Fisheries Agency. Observers are placed on board tuna fishing vessels across the region to report on fishing catches and methods.50 Often they travel with the fishing vessels, being away at sea for weeks or months at a time, to gather independent information about what is happening at sea. They make notes of how much fish is caught, what type of fish are caught, what methods are used to catch fish, and whether they observed any breaches to laws and regulations. This information is then fed back into central databases so regional agencies and national governments can keep track of what fishing vessels are doing and whether fishing laws and regulations are being implemented. Debriefers meet observers when they come back to port to check their data and provide feedback. They also discuss any issues observers have such as relations with the crew and payment of relevant salary and allowances.
49 Ministry of Business, Innovation and Employment, 2013, Migration Trends Key Indicators Report: June 2013, Government of New Zealand, August, pp 2-3.50 The following description is taken from the Observer Program, Pacific Islands Forum Fisheries Agency http://www.ffa.int/system/files/2 per cent20MINUTE per cent20BRIEFS_Observers_regional per cent20factsheet.pdf
91 of 103

Observers are placed on deep sea fishing vessels, including US, Japanese, Korean and Taiwanese vessels. Fishing vessels are obliged to provide observers with a bed and food for the time they are on-board the ship. Observers earn approximately USD $30-50 a day. In 2011, some 469 observers spent an average of 106 days at sea and 2.8 average number of trips at sea. The Forum Fisheries Agency Observers Programme recommends a minimum of 100 seadays per observer. Costs on board a vessel are low. The Observer Programme has developed a career pathway from base observer to senior observer, then debriefer, trainer, and coordinator. Observers need maritime training on how to live and work on a vessel at sea, how to take part in firefighting drills, navigation, basic first aid and sea safety training. They also need good basic skills in literacy and numeracy because the major function of an observer to know how to fill in all the rather complex reporting forms.
In November, 2012, the Government Tonga entered into a Memorandum of Understanding (MOU) with the Pacific Islands Forum Fisheries Agency. This agreement is to provide fisheries observer services to the US purse-seine tuna fleet operating in the Western and Central Pacific Ocean.51 For these services, the Tongan Division of Fisheries' observer programme has been paid US$77,125 to coordinate 25 observer placements on US-flagged vessels over the next twelve months. This funding is to employ and train the observers as well as developing the national infrastructure needed to support this capacity expansion. The potential to make more use of Solomon Islands observers on foreign vessels depends on whether the government allows foreign fishing vessels access to Tongan waters and how many vessels granted access require observers.
Other maritime opportunities for work
Information on opportunities to work as seafarers on overseas ships is not available. Like access to seasonal work in Australia and New Zealand, these opportunities are strongly influenced by the ‘first mover’ advantage. The countries with a particular advantage have have long-established maritime training facilities and close links to specific shipping companies, as Kiribati and Tuvalu have to German shippers, for example. However, even these advantages based on reputation and links cannot overcome emerging cost differentials for recruitment. The high travel costs from the Pacific often results in preference being given to higher wage countries such as the Philippines and the Ukraine.
51 Tongan Ministerial Visit to FFA (Forum Fisheries Agency), Honiara, Solomon Island, Press Release for Consideration - Tongan Ministerial Visit. http://www.tongafish.gov.to/
92 of 103

Chapter Eleven: Recommendations on how to identify skills in demand
We do not simply want to train people for white collar jobs. We need technical experts who can convert our resources into goods and services that meet the demands of our population.52
Identifying skills in demand has to be at the centre of a demand-focused training system. Much criticism has been made of supply-driven training systems. As ADB report Skilling the Pacific notes:
The demand, or employer, side is under-represented in the planning and direction of TVET systems. Similarly, communities tend not to be involved in identifying training needs for the informal sector. As a result, training operates in isolation and is supply driven ...
A mental shift is needed. TVET should not be viewed as synonymous with education. TVET is providing service and should be demand, not supply, oriented.53
The World Bank’s guide to workforce development notes:
We assert that a "learn-to-do and do-to-learn" approach is essential in the search for better outcomes in workforce development. It minimises what some writers have referred to as the risk of ‘borrowing’ policies that may have worked in one context and applying them in another with little adaptation or consideration of local conditions ... [This] approach reinforces the notion that, in a field of still evolving knowledge, successful reforms will require intentional learning by national policy makers through systematic efforts to build domestic capacity for policy design and implementation.54
Setting up a labour market information system is a complex undertaking that needs a clear focus if it is to deliver a close link between the supply of and demand for skills.
Interventions on the supply side of skills training alone cannot by themselves deliver the labour market outcomes wanted. These include giving TVET providers more resources, restructuring their operations and applying more top-down management controls. The supply-side changes also include setting up a national qualifications framework and trainer accreditation system. Training systems cannot reform themselves or build new capacity if left to their own supply-side focus.
Only pressure or 'demand' from end-user groups such as employers, students, parents and government can 'pull' better performance out of the system. Use of demand-side pressure on service providers has the best chance of working in cases where the means and outcomes are 52 Speech by Governor Denton Rarawa at launch of the CBSI 2012 Annual Report. Kitano Mendana Hotel, 10 May, 2013, p 5. 53 ADB, 2009, Skilling the Pacific: Technical and Vocational Education and Training in the Pacific. Asian Development Bank, Manila, p 125 & 128. 54 World Bank, 2013, What Matters for Workforce Development: A Framework and Tool for Analysis. SABER Working Paper Series, Number 6, April, p 17.
93 of 103

clearly understood and measurable at the point of delivery.55
Evidence on the nature and extent of demand for skills is needed to ensure that a balance is reached between the supply and demand for skills. An unexpected strong demand for skills, particularly in the short-term, could overwhelm the supply of training and start to undermine capacity. Demanders of services may seek more or better services but fail to help with the longer-term investments needed to build sustainable capacity for training providers.
Staff within the supplying organisations may became demoralised and opt out, in an effort to escape any blame. Service providers, for their part, could lose balance. They could either try to expand too fast or attempt to do too many things and in the process, lose coherence and capacity. Or too much latitude could be given to the service provider and the organisation may lapse back into self-serving behaviour. Persistent imbalances between demand and supply could undermine the overall performance of the service provider.56
Evidence of the demand for skills for whom?
The chapter on skills forecasting started with a comment on how top-down, centralised planning models of the demand for skills are no longer regarded by policy makers as necessary or useful. The current view of the World Bank and others is that: ‘... skills-development systems need to grow organically from below while being coordinated and fostered from above’.57
Three approaches to collecting evidence of skills in demand
A key issue in developing appropriate indicators is to know their purpose. Three approaches to the use of data on skills can be identified: planned, incremental and emergent.58 The use of data on skills for planning purposes enables a government agency to allocate and coordinate resources to the training providers. This focus shapes what data are collected and by whom. This top-down management approach assumes that system-wide objectives can be clearly defined, targets can be set to meet these objectives and that training capacity can be easily shifted to meet the targets. The senior managers in the coordinating agency assume they can control and manage the process directly and that the training providers can and will respond to what is asked for.
A planned, top-down approach to the delivery of training is needed to some extent, if only to compete for funds within the government’s budget process. However, a sole reliance on a top-down approach requires that a number of supporting conditions hold. These include a widely shared consensus about policy and direction; the resources to pay for the support systems; and clear and achievable objectives.59 Also needed are good activity-based accounting systems to track unit costs, outputs and outcomes.
55 Heather Baser and Peter Morgan, 2008, Capacity, Change and Performance Study Report. Discussion Paper No 59B, April, European Centre for Development Policy Management, p 68. 56 See Note 62, p 69-70. 57 World Bank, 2012, World Development Report 2013: Jobs. Washington DC, Box 5.8, p 17758 The following discussion of these approaches and the use of indicators draws heavily on Heather Baser and Peter Morgan, 2008, Capacity, Change and Performance Study Report. Discussion Paper No 59B, April, European Centre for Development Policy Management, pp 68-8059 See Note 62, p 77.
94 of 103
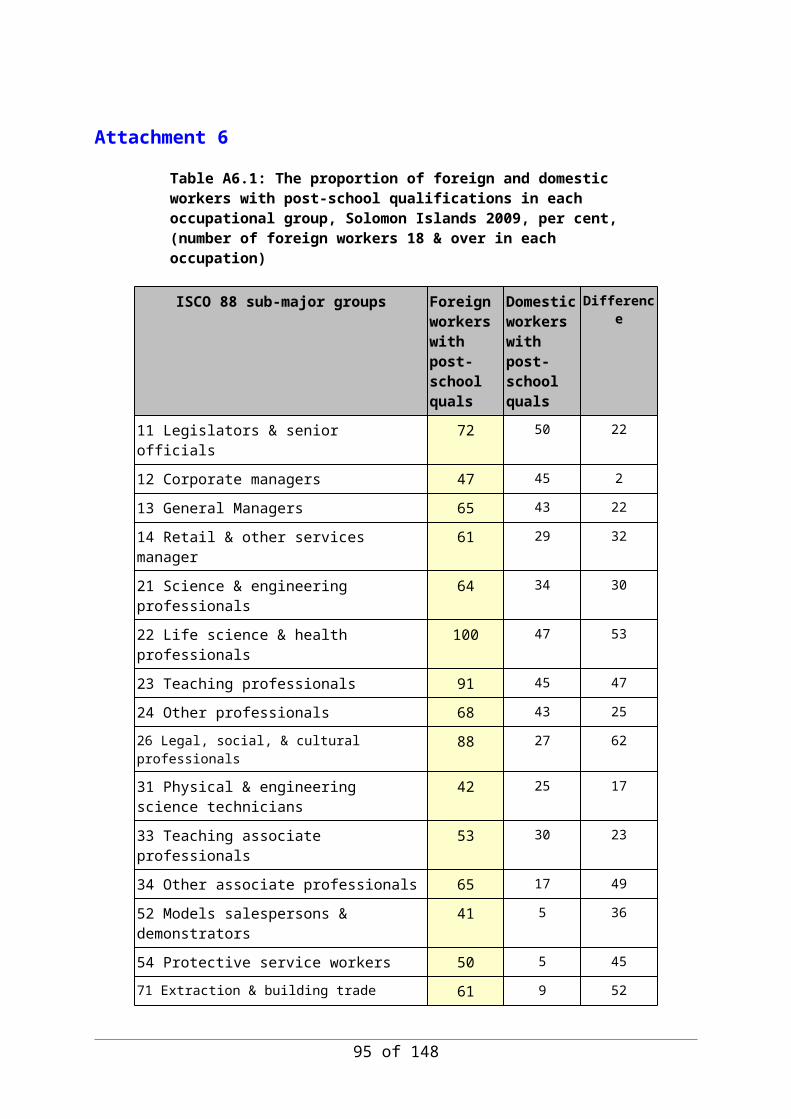
A second approach to the use of data on skills in demand can be termed incremental. This approach is based on the principles of adaptiveness and flexibility in implementation. Strategies can still have pre-set objectives and goals, but they function more as guidelines than as actual fixed targets. This approach works best in situations where conditions are unstable and the choice of strategy is difficult to clarify. Senior managers in the coordinating agency may be uncertain about a number of factors affecting the capacity and performance of the service providers, such as institutional constraints or staff commitment. Evidence of the operation of the service providers to learn what works under different conditions. This allows a more responsive system to be developed through trial and error. This is especially important where there are conflicting interests and attitudes on the part of service providers.60
The third approach to the use of evidence of the demand for skills to produce a demand response training system can be called emergent. As discussed above, a planned change relies on good system-wide data, prediction, goal-setting, hierarchical structures and top-down strategy. An incremental approach relies on information which enables adaptiveness, learning and adjustment. The emergent approach is better suited to situations where the behaviour of service providers is difficult to manage in a top-down fashion. In these situations, the driving forces for change are relationships, interactions and local energy.
A directive, top-down approach has real limitations because often there are too many unknowns. The best starting point for achieving a close link between training providers and employer needs is likely to be at the local area or community level. This is where face-to-face relationships and trust are the most robust and where changes can be more easily achieved through the efforts of individuals.
Growing the skills system from below
Forming a group of interested parties, which may involve senior teachers from a secondary school, training providers and employers at a local level, can make the most of a shared sense of meaning or values and a collective identity. A local group also offers those involved a good sense of a manageable area of joint activity. The group will also need some basic rules of conduct, some resources to track performance, and a protected space that allows for some freedom of action.
The focus of this approach is on a bottom-up coordination by nurturing relationships and then waiting for results and capabilities to emerge. The usual top-down mechanisms of clear objectives, explicit strategies, scheduled activities, and targets are not applied. The aim is to use indicators to develop local capacity to coordinate training to maximise employment outcomes, making good use of community cohesion and energy.
The emergent approach to the use of evidence on skills in demand is to make them part of a process of fostering local level coordination. This evidence could produce variable results as the participants take time to develop the skills needed to sort out problems. The emergent approach is not good at getting a set of tasks done in a short period of time. The approach is likely to fit uneasily with donors and senior managers in government who want to see more control, direction and accountability for results.
60 See Note 62, p 78.
95 of 103

Operating at different levels
In practice, evidence on skills in demand is needed at different levels of activity. Data on skills in demand are needed to assist with the central allocation of funds on the basis of clear criteria and objectives. Information on skills in demand is also needed by a central agency to respond to the differences in capacity between training providers and to move each in the desired direction to meet the skills needs of employers. Finally, data should be collected and used at the local level to enable effective connections to be made between supply and demand. These data should be about employer skill needs and the labour market outcomes of TVET graduates.
Framework for the assessment of skills gaps across countries
The following framework for the assessment of skills gaps and qualification across countries is based on the use of two core concepts. The first is the use of skill-based occupation classifications, as defined by ISCO. The second is the use of the indicator of post-school education attainment of job holders in skills based occupations. These concepts can be applied using census data to identify skill shortages by detailing the specific occupations of foreign workers. Skills gaps can be identified by comparing the post-school qualification rate of the national workforce in specific occupations with the post-school qualification rate of foreign workers in the same occupations.
These concepts can also be used as the organising framework for other data collection and data analysis exercises to update and provide more detailed or more up to date information where it is needed. The census results have particular advantages in terms of their coverage and capacity to look at small numbers in important occupations and seek out more information about sex, age, location, and levels of education attainment of the job holders in those occupations. But the census is an expensive means of data collection. Also, as the census takes place once every five to ten years, the information may soon be out of date as the value of census data on occupations also depends on careful attention to the coding of job descriptions to produce reliable occupational classifications. This is harder to do for the large dataset that a census collects for a country the size of Solomon Islands, compared with a smaller national sample of the population.
The same concepts of skill-based occupation classifications and post-school education attainment can be used to organise other data collection and data analysis to build on and provide more detail for the baseline census data. The following framework for collecting and analysing data to identify skill shortages and skill gaps starts with the data that is easy to access and analyse, then it gives attention to the analysis of secondary data from national surveys. The third level of focus is on the direct collection of relevant information on the demand for skills not available from existing administrative and national surveys. The types of data that can be collected, their sources and specific information that can be collected are outlined in the table below.
Making use of existing administration records & national population surveys
The available data sources that can be utilised to identify skill shortages are administrative records on the work visa applications for foreign workers and job advertisements. Also available are likely to be national infrastructure plans which identify current and future large
96 of 103
construction projects. Official national population surveys based on random samples are another valuable source of information on occupation and qualifications, and wage rates by occupation. Two types of surveys that will provide these data are the Household Income & Expenditure Survey and the Labour Force Survey. The latter is likely to be more common than the former. The information on jobs has to be coded to ISCO and released at the two-digit level given the size of the sample.
Wage data by occupation and qualification even at this level should be able to show whether those in trade occupations with a post-school qualification have higher wage rates. This is to test whether enterprises are also trapped in a cycle of low wages and low skills. This is a rational response of employers to little prospects for growth in low income markets. The effect is that employers see little need to lift the quality of the goods and services they are providing. Employees, without an incentive of higher pay for skills attained, also may see little value in investing in skills training.
New data collection is also needed
Survey of enterprisesKey issues to cover
Current job vacanciesLonger term skill shortages and workforce skill gapsWages rates by occupationOccupations of foreign workers, if anyRecent employment growth/declineExpectations of jobs growth, decline, stability for next three monthsWillingness to provide work placements or experience with themRelations with TVET providersSuggestions for better relations with providers
Graduate destination surveyKey issues to cover
Current employment statusDescription of job & industryWagesPrevious jobs, wagesMatch of qualification field of study to jobAssessment of training receivedOpen-ended responses re skills used on job, & needed on job
Suggestions for improvement to skills training
Two forms of data are also needed to find out directly from employers as to whether they are experiencing skill shortages and workforce skill gaps. The issues to be covered in a survey of enterprises are outlined below. Another important form of data collection is to find out whether recent TVET graduates are in paid work and whether this work is matched to the skills they have been training in. A graduate destination survey is also a valuable vehicle for getting graduates’ own assessment
97 of 103
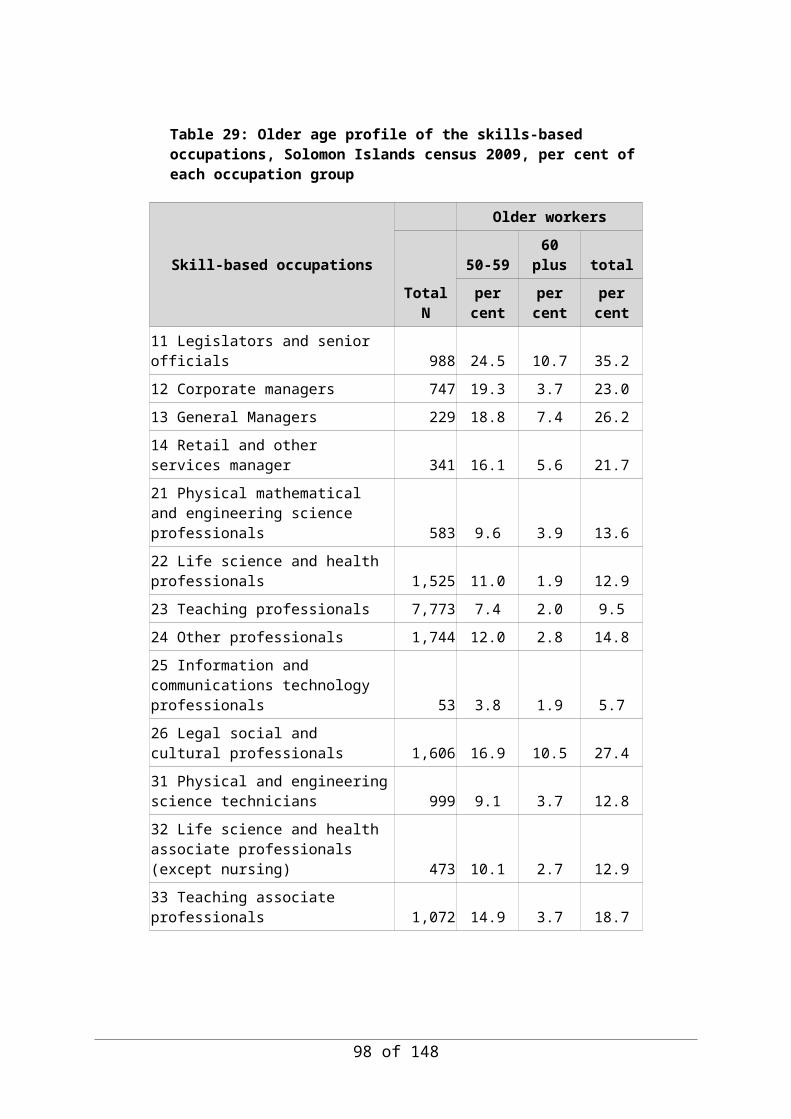
of a range of aspects of the training they received. The survey of enterprises should be undertaken on a yearly basis. TVET providers should undertake graduate destination surveys for each training program they deliver. However, a larger scale national graduate destination survey on a three-yearly basis will be needed to cross check the information the smaller program-level surveys have provided. This survey is also valuable for collecting more comprehensive data on graduates’ labour market experiences and their assessments of the value of their training and its relevance to their current job or other activities they are involved in.
98 of 103

Type of data Sources What type of data Input neededCollect & analyse data from existing admin records or national survey data
Work visa approvals Immigration or Labour Dept
Occupation of foreign worker & name of employer
ISCO template for collecting information on occupations
Job advertisementsNewspapers Occupation, qualification & work
experience requiredRequires use of ISCO to code jobs descriptionsGovernment
gazette
Current & planned major employment generating projects
National infrastructure plan
Employment numbers by skill level for each project
Information about use of foreign workers & opportunities for skills transfer to national workforce
National Provident Fund data on contributorsSolomon Islands, Vanuatu, Kiribati & Tuvalu
Data on occupations & industry if coded to these categories
May need active encouragement to code occupations in particular
Household Income & Expenditure Survey National Statistics Office
Wage data by occupation & qualification Requires use of ISCO
Labour Force Survey National Statistics Office
Wage data by occupation & qualification, study field, size of employer, match between qualification study field of study & occupation
Requires use of ISCO
Skill shortages lists in Australia & NZAust & NZ Immigration website
Information on specific occupations in demand
Need to convert ANZSCO to ISCO
Collect & analyse new dataDatabase of enterprise contact details & employee no
Survey of enterprises
Graduate destination survey
Survey of enterprises
Richard Curtain, 18 Nov 2013 99 of 103

Richard Curtain, 18 Nov 2013 100 of 103

Table A10.1: Consolidated Sponsored Occupation List Schedule 2, Skilled Migration Visa, Australia, July 2012
Selected Australian Middle-skill Occupations in demand
Agricultural Technician Fisheries Officer Primary Products Inspectors not elsewhere classified
Apparel Cutter Floor Finisher Print Finisher
Arborist Florist Printing Machinist
Architectural Draftsperson Furniture Finisher Quarantine Officer
Baker Gardener (General) Roof Tiler
Blacksmith Gas or Petroleum Operator Safety Inspector
Bricklayer Graphic Pre-press Trades Worker Sail Maker
Broadcast Transmitter Operator Hairdresser Saw Maker & Repairer
Building & Engineering Technicians Hardware Technician School Laboratory TechnicianBuilding Associate ICT Customer Support Officer Screen Printer
Building Inspector ICT Support Technicians Shoemaker
Butcher or Smallgoods Maker Landscape Gardener Signwriter
Cabinetmaker Life Science Technician Small Offset Printer
Cabler (Data andTelecommunications) Light Technician Sound Technician
Camera Operator (Film, TV or Video) Maintenance Planner Surveying or Spatial ScienceTechnician
Chef Make Up Artist Telecommunications Cable Jointer
Chemistry Technician Meat Inspector Telecommunications LinesworkerClothing Patternmaker Mechanical Engineering Technician Telecommunications TechnicianClothing Trades Workers not elsewhere classified
Mechanical EngineeringDraftsperson Television Equipment Operator
Communications Operator Medical Laboratory Technician Textile, Clothing & FootwearMechanic
Construction Estimator Metal Casting Trades Worker Toolmaker
Cook Metal Fitters & Machinists nec Vehicle Body Builder
Diver Musical Instrument Maker orRepairer Vehicle Painter
Dressmaker or Tailor Nurseryperson Vehicle Trimmer
Earth Science Technician Optical Dispenser Veterinary Nurse
Electronic Engineering Draftsperson Optical Mechanic Wall & Floor Tiler
Electronic Engineering Technician Panelbeater Web Administrator
Electroplater Pastry cook Wood MachinistEngraver Picture Framer Wood TurnerFire Protection EquipmentTechnician Power Generation Plant Operator
Richard Curtain, 5 December 2013 101 of 103

Table A10.2: Selected middle-level occupations and required work standards for visa applicants with an offer of work, from the 'Immediate Skill Shortage List', effective 5 December 2011, Immigration New Zealand
OccupationGroup Middle-level occupations
Required standard for work visa applicants with an offer of employment
Agriculture andForestry
Arborist Trade Certificate AND/OR National Certificate in Horticulture Arboriculture Level 4 AND a minimum of two years’ relevant experience
Construction Construction Project Manager (Foreman) (Roading and Infrastructure)
At least five years’ experience in building or maintaining roads & Staff management experience & appropriate drivers licence
Construction Surveying Technician (Spatial Science Technician/HydrographicTechnician)
National Certificate in Surveying (HydrographicSurveying) Level 4
Construction Surveying Technician (Spatial Science Technician/Land Surveyor'sTechnician)
Bachelor or Diploma of Surveying& two years’ relevant work experience
Engineering Civil Engineering Draughtsperson Electrical Engineering Draughtsperson Electronic Engineering Draughtsperson Mechanical Engineering Draughtsperson
National Diploma in Engineering Level 6OR equivalent
Recreation, Hospitality and Tourism
Café and Restaurant Manager (including Bar Manager)
National Certificate in Hospitality (OperationsSupervision) Level 4, & a minimum of four years’ combined experience in hospitality establishments with a minimum of two years at supervisory level or higher
Trades Baker National Certificate in Baking (Craft Baking) (Level4) OR National Certificate in Baking (Inshore/Franchise) (Level 4)
Trades Electronic Equipment Trades Worker National Diploma in Engineering (Electrotechnology) (Level 6) AND New Zealand registration with the Electrical Workers Registration Board
Trades Motor Mechanic (General) (Automotive Technician)
National Certificate in Motor Industry (Automotive Electrical and Mechanical Engineering) (Level 4) with strand in Light Vehicle OR National Certificate in Motor Industry(Automotive Engineering) (Level 4) OR NZ Trade Certificate in Automotive Engineering OR NZ Trade Certificate in Motor Mechanics AND three years' relevant experience
Trades Motor Mechanic (General) (Automotive Air Conditioning Technician)
National Certificate in Motor Industry (Automotive Specialist Engineering) (Level 4) with strand in Heating, Ventilation and Air Conditioning OR National Certificate in Motor Industry (Automotive Air Conditioning) (Level 4) AND three years' relevant experience
Trades Motorcycle Mechanic National Certificate in Motor Industry (Automotive Electrical and Mechanical Engineering) (Level 4) with strand in Motorcycle OR National Certificate in Motor Industry (Motorcycle Engineering) (Level 4), OR NZ Trade Certificate in Motorcycle Engineering AND at least three years' experience
Trades Scaffolder (Advanced) National Certificate in Scaffolding (Level 4) with strands in Advanced Scaffolding and at least five years’ experience since obtaining the Level 4 Certificate
Transport Truck Driver (General) NZ recognised Full Class 5 Driver Licence and three years’ experience driving heavy combination vehicles with a gross combined weight of more than 25,000kg
Richard Curtain, 5 December 2013 102 of 103
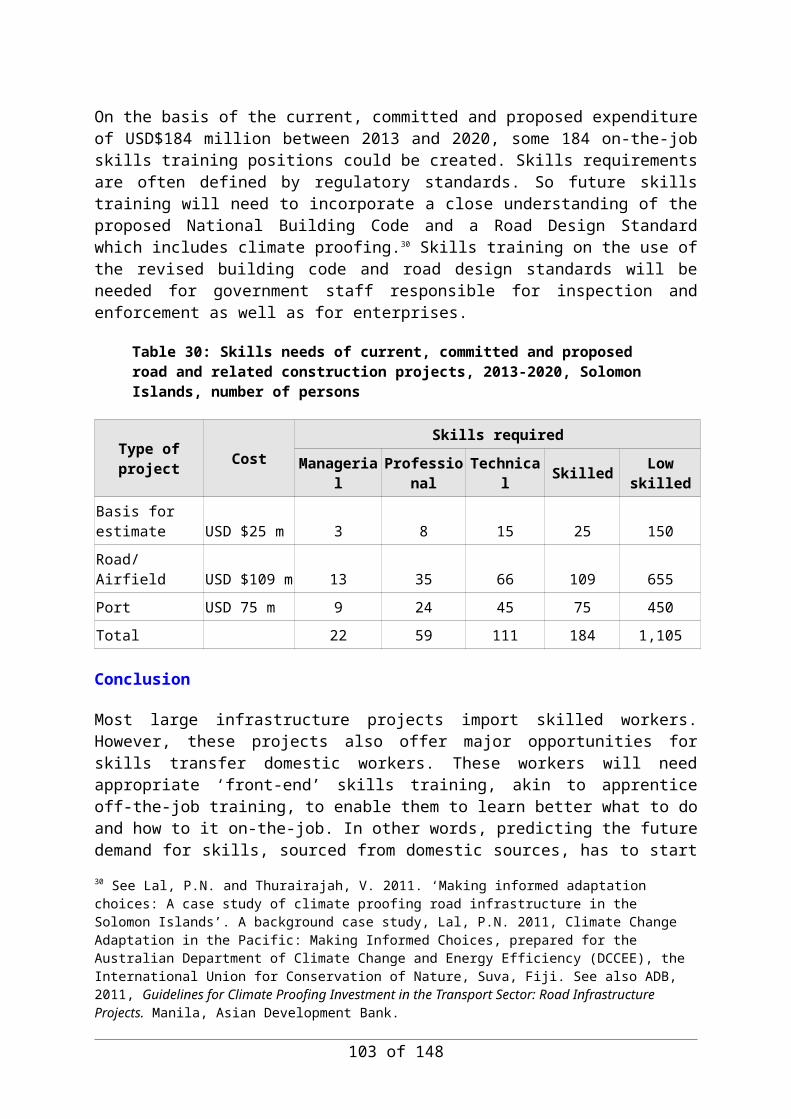
Richard Curtain, 5 December 2013 103 of 103