executive summary - bruegel
TRANSCRIPT

Alicia García-Herrero
(alicia.garcia-herrero@
bruegel.org) is a Senior
Fellow at Bruegel and a non-
resident Research Fellow at
Real Instituto Elcano
JUNYU TAN is an economist
at Natixis
Executive summary
• After decades of increasing globalisation on every front, from trade –
pushed further by the growing role of value chains – to technology, movement of
people and investment, there now seems to be a turn towards slower globalisation if not
deglobalisation, at least in some areas.
• Deglobalisation is not a new concept but rather a megatrend which has been
seen before, for example right before the First World War. Signs of deglobalisation,
measured by decelerating trade and investment, and smaller global value chains, started
to appear already in 2008. But this trend seems to have accelerated because of the United
States’ push to contain China in the context of the strategic competition between the
two. Such containment is apparent not only in bilateral trade and investment flows but
also in technology. COVID-19 has been a second very important factor contributing to
deglobalisation. The most obvious impact has been in movement of people.
• However, the trend towards deglobalisation is much less evident for
finance, with the exception of foreign direct investment, though increasing attempts by
the US and China to decouple particular types of financial flows are emerging, including
the delisting of Chinese companies from US stock exchanges and the imposition of sanc-
tions for transactions with certain Chinese companies and individuals. Overall, it is too
early to confirm the depth and the sustainability of the current wave of deglobalisation,
but an increasing number of signals suggest a trend of deglobalisation is underway.
Recommended citation
García-Herrero, A. and J. Tan (2020) ‘Deglobalisation in the context of United States-China
decoupling’, Policy Contribution 2020/21, Bruegel
Policy Contribution Issue n˚21 | December 2020 Deglobalisation in the
context of United States-China decoupling
Alicia García-Herrero and Junyu Tan

2 Policy Contribution | Issue n˚21 | December 2020
1 Is the current phase of globalisation over? Most economic historians consider the century before the first world war as the first phase
of modern globalisation. It was marked by sharp increases in trade, movement of people and
capital flows. Global trade grew by an unprecedented rate of almost 4 percent per year for
nearly a century, a development attributed to technological progress – which greatly reduced
transaction costs, such as transportation and communication – and also to the easing of
government restrictions, including import tariffs. In addition, movement of people between
continents ballooned, driven by working-class Europeans migrating to the Americas. Against
this backdrop, capital flows also boomed, as capital looked for profitable projects overseas.
However, the first world war interrupted the globalisation wave. The global political order
was turned upside down with the demise of the gold standard and increased protectionism
to protect domestic economies. Globalisation only resurged after the second world war.
The renewed wave of globalisation was built on the pillars of newly created international
organisations designed to ensure economic cooperation between countries. A high point
was the signing in 1947 of the General Agreement on Tariffs and Trade (GATT), which led to
a series of agreements that lowered tariffs and eliminated other existing restrictions on trade.
Since then, trade and foreign direct investment have grown steadily, as have international
mobility, technological exchanges and capital flows. But with the 2007-2008 global financial
crisis this super-cycle of growing exchanges reached its peak. Since then, global trade has
greatly reduced, as have global investment flows. In other words, deglobalisation may be
happening.
What is meant by deglobalisation should be clarified. Among the many definitions that
can be found, we opt for a narrow view, related to economic factors, in particular a reduced
number of exchanges, whether trade, investment, technology or movement of people. It
should be noted that deglobalisation does not equate to economic decoupling, which refers
to two specific economies reducing their economic linkages and, thus, their interdependence.
Nevertheless, we consider if and how fast decoupling is happening between the US and
China, given their increasing strategic competition (García-Herrero, 2018). We also consider
how decoupling and deglobalisation interact.
Meanwhile, the economic literature does not offer a clear consensus on the pros and
cons of globalisation. The traditional argument in favour of globalisation, since Adam Smith,
has been heightened competition and efficiency gains from specialisation. More recently,
globalisation has been associated with higher economic growth and poverty reduction. Khan
and Riskin (2001) found that poverty reduction in China could be attributed to the opening
up of its economy, for example. Other positive effects include economies of scale and scope
that can lead potentially to reductions in costs and prices (Intriligator, 2003; Rogoff, 2003). In
addition, Tomohara and Taki (2011) proposed that globalisation leads local employers to pay
higher wages as foreign companies are given market access.
Since 2008, the economic literature on globalisation has been less favourable. Hillebrand
(2010), for example, argued that protectionism may improve income equality in some
countries, although he still thought that a retreat from globalisation would lead to profoundly
negative implications for the global economy. Even before the global financial crisis,
the economic bedrock of globalisation, namely the link between trade and growth, was
challenged. Rodriguez and Rodrik (1999) argued that the empirics of the trade and growth
relationship are far from settled. Rodrik (2011) pushed the concept of the “globalisation
paradox” by which globalisation will not be able to coexist with democracy and national
self-determination. In other words, excessive government power would cause protectionism,
while excessive market freedom would cause economic instability. The globalisation paradox
seems to have become more visible lately based on the increasing number of trade disputes
and government responses to severe shocks, including COVID-19. A few studies have
attempted to measure the degree to which a deglobalisation process might be taking place,

3 Policy Contribution | Issue n˚20 | November 2020
although most focus on trade (García-Herrero, 2018). Antràs (2020) found little systematic
evidence to indicate that the world economy has entered an era of deglobalisation, but
acknowledges that globalisation is continuing at a much slower pace.
To determine in which phase of globalisation or deglobalisation we are, this Policy
Contribution evaluates key aspects of exchanges, namely trade, global value chains (section
2), technology (section 3), movement of people (section 4), and financial flows (section 5).
The available data points to a slowdown in the globalisation process insofar as interlinkages
are growing less rapidly. This is particularly the case for trade and investment. While it is still
too early to assess how permanent the process is, it seems important to measure the speed
of the process for the different types of exchange (trade, technology, people and capital).
Meanwhile, the sudden turn from engagement to strategic competition between the United
States and China raises the question of the extent to which the two economies are decoupling,
which feeds into the deglobalisation process we find in the data, starting from 2008.
2 Deglobalisation in trade was seemingly underway before the trade war
A slowing of global trade flows has been evident since the global financial crisis. This is no-
ticeable in trade in goods, in both value and volume, and also in relation to trade in services
and the integration of global value chains.
The movement of merchandise declined sharply during the 2008 global financial crisis,
but the general expectation was that trade would thereafter continue to grow at rates similar
to those prior to the crisis. But this has not been the case. Figure 1 shows that global trade
value grew by an average of 2.7 percent from 2009 to 2018, a much lower rate than the 12.6
percent average growth before the global financial crisis (GFC). The decline is also evident
in trade volumes, for which the growth rate has even turned negative (Figure 2). The global
services trade, meanwhile, collapsed in 2008 and has not returned to the pre-GFC level,
notwithstanding some mild recovery (Figure 3).
Figure 1: Global GDP and trade growth (year-on-year, %)
Source: Bruegel based on UNCTAD.
-30
-20
-10
0
10
20
30
2000
2001
2002
2003
2004
2005
2006
2007
2008
2009
2010
2011
2012
2013
2014
2015
2016
2017
2018
2019
Global trade value
Global nominal GDP

4 Policy Contribution | Issue n˚21 | December 2020
Figure 2: Global trade volumes (year-on-year, %)
Source: Bruegel based on UNCTAD, Bloomberg.
Figure 3: Growth of global trade in services (year-on-year, %)
Source: Bruegel based on UNCTAD.
The degree of integration of global value chains (GVC) has also declined since the GFC.
If this integration is measured by the value of intermediate goods that are either imported
to be re-exported, or are exported to other countries for them to re-export, there has been a
net decline since 2008 (Figure 4). The decline has been much more significant for Germany,
Europe’s exporting powerhouse, than for the US and China (Figure 5). The EU remains the
world region most integrated into GVCs, but the decline in its participation is happening
faster than for other regions, and is in line with EU’s declining share of manufacturing exports
at the global level.
Figure 4: World global value chain participation (%)
Source: Bruegel based on UNCTAD-Eora, Natixis. Note: Estimated data for 2016-2018. GVC participation is defined as the sum of imports of intermediates and exports of intermediates that are then used in the importing countries' exports, as a share of total exports.
-15
-10
-5
0
5
10
15
2000
2001
2002
2003
2004
2005
2006
2007
2008
2009
2010
2011
2012
2013
2014
2015
2016
2017
2018
-30
-20
-10
0
10
20
30
2006
2007
2008
2009
2010
2011
2012
2013
2014
2015
2016
2017
2018
2019
40
42
44
46
48
50
52
2000
2001
2002
2003
2004
2005
2006
2007
2008
2009
2010
2011
2012
2013
2014
2015
2016
2017
2018

5 Policy Contribution | Issue n˚20 | November 2020
Figure 5: GVC participation, selected economies (%)
Source: Bruegel based on UNCTAD-Eora, Natixis. Note: Estimated data for 2016-2018. See note to Figure 4 for definition of GVC participation.
Amid these changes, the World Trade Organisation (WTO) has been weakened as the
facilitator of global trade flows. Its appellate body, which arbitrates in disputes, has been func-
tioning poorly, resulting partly from the greater heterogeneity of the WTO as more emerging
countries have joined the club, and partly from the lengthy process involved in settling trade
disputes. But more important have been the increasing confrontations on trade between the
US and China. President Trump’s profound disdain for multilateralism and China’s state-led
system are not compatible with the liberal nature of the global trading system and might have
weakened the WTO’s foundations. China has also been hit by US sanctions, which are being
targeted against countries beyond Cuba, Iran and Russia. US sanctions against China are a
further push towards their decoupling in trade, and also in terms of technology and invest-
ment flows. In other words, US-China decoupling is reinforcing the post-GFC deglobalisation
trend, at least in terms of trade and global value chains.
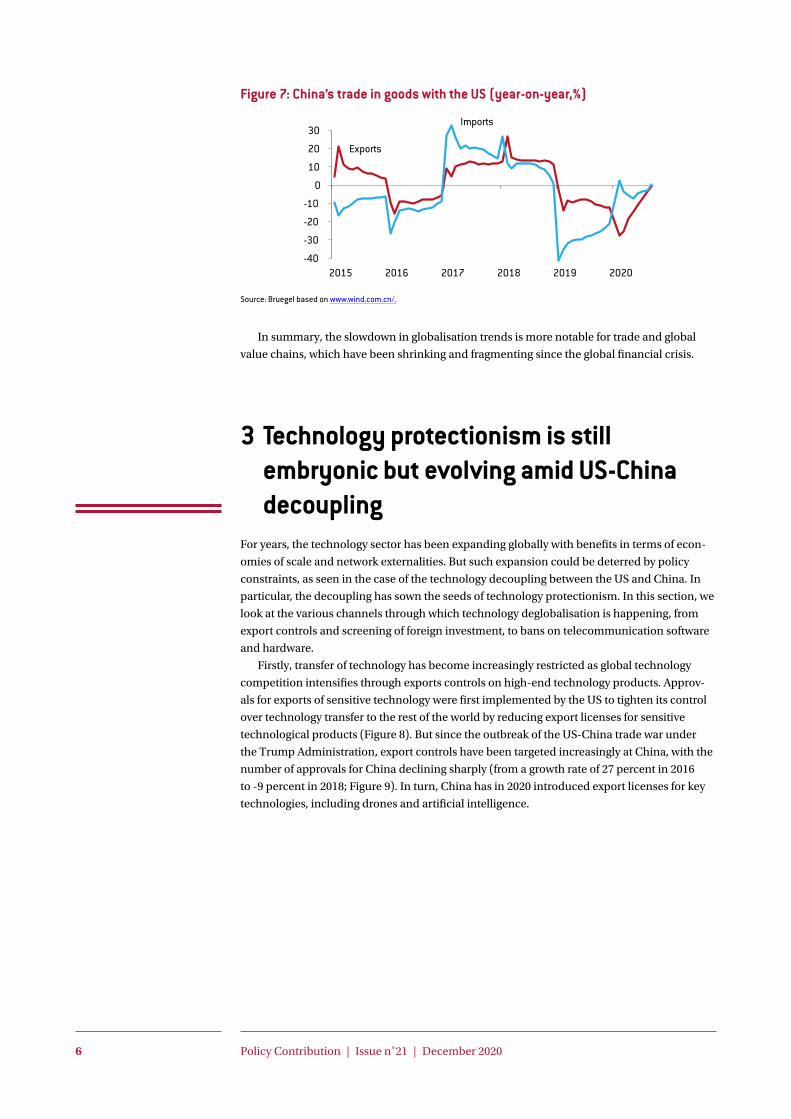
The deglobalisation trend has clearly accelerated since 2019, ending in a collapse in trade
flows at the peak of the COVID-19 pandemic (Figure 6). One of the reasons for the decel-
eration in trade before the pandemic was the US-China trade war and, consequently, the
reduced trade flows between them, after a series of tit-for-tat protectionist measures (Figure
7). While the pandemic is an exceptional event and the immediate impact of the collapse in
production and demand from the lockdowns should be temporary and a recovery is under-
way, there is no expectation of a rapid rise in trade flows. Economies will grow below potential
for the foreseeable future, which will reduce external demand globally. In addition, shifts in
supply chains as firms re-shore production to reduce perceived vulnerabilities from foreign
inputs, could also affect global trade volumes permanently.
Figure 6: Global trade and exports (year-on-year, %)
Source: Bruegel based on Natixis and OECD. Note: the red line shows the Natixis Global Trade Indicator of growth in global trade in goods. The OECD indicator = three-month moving average.
-2.5-2.0-1.5-1.0-0.500.51.01.52.02.5
10
20
30
40
50
60
70
EU US China Global
2014 2018
Chg in level (right scale)
-20-15-10
-505
101520
Global trade indicator
OECD trade growth indicator
2000
2001
2002
2003
2004
2005
2006
2007
2008
2009
2010
2011
2012
2013
2014
2015
2016
2017
2018
2019
2020
6 Policy Contribution | Issue n˚21 | December 2020
Figure 7: China’s trade in goods with the US (year-on-year,%)
Source: Bruegel based on www.wind.com.cn/.
In summary, the slowdown in globalisation trends is more notable for trade and global
value chains, which have been shrinking and fragmenting since the global financial crisis.
3 Technology protectionism is still embryonic but evolving amid US-China decoupling
For years, the technology sector has been expanding globally with benefits in terms of econ-
omies of scale and network externalities. But such expansion could be deterred by policy
constraints, as seen in the case of the technology decoupling between the US and China. In
particular, the decoupling has sown the seeds of technology protectionism. In this section, we
look at the various channels through which technology deglobalisation is happening, from
export controls and screening of foreign investment, to bans on telecommunication software
and hardware.
Firstly, transfer of technology has become increasingly restricted as global technology
competition intensifies through exports controls on high-end technology products. Approv-
als for exports of sensitive technology were first implemented by the US to tighten its control
over technology transfer to the rest of the world by reducing export licenses for sensitive
technological products (Figure 8). But since the outbreak of the US-China trade war under
the Trump Administration, export controls have been targeted increasingly at China, with the
number of approvals for China declining sharply (from a growth rate of 27 percent in 2016
to -9 percent in 2018; Figure 9). In turn, China has in 2020 introduced export licenses for key
technologies, including drones and artificial intelligence.
-40
-30
-20
-10
0
10
20
30
2015 2016 2017 2018 2019 2020
Exports
Imports

7 Policy Contribution | Issue n˚20 | November 2020
Figure 8: Approved US licenses for tangible items, software and technology (000s)
Source: Bruegel based on US Department of Commerce.
Figure 9: Approved US licenses for tangible items, software and technology exports to China (000s)
Source: Bruegel based on US Department of Commerce.
Beyond trade, the free flow of investment has also been limited, especially in relation to
technology, because of increased investment screening. This is particularly the case for the
US, after the granting of increased powers by Trump to the Committee on Foreign Invest-
ment in the United States (CFIUS), with the intent to block an increasing amount of Chinese
mergers and acquisitions in US, especially in the high-end industrial sector. The EU has fol-
lowed and set up its own investment screening process in April 2020, pointing to technology
protectionism globally, and especially aimed at China’s move up the technology ladder. These
moves show the unease in the west about China’s increasing engagement in technological
innovation. Western measures will only serve to drive technological decoupling.
More specifically for US-China competition, the US has introduced the so-called “entity
list”1, which effectively forbids US companies from conducting business with the Chinese
companies on the list. The US Bureau of Industry and Security published such a list of entities
deemed risky to US national security as early as 1997, but the number of names on the list has
expanded quickly since 2019, with the addition of Huawei and some of its affiliates and more
Chinese corporations.
In September 2020, China announced the release its own identity list in retaliation,
though the names of targeted companies have not been made public at time of writing2. The
grounds for listing targeted entities have been made public, including the taking of discrim-
inatory measures against Chinese businesses on non-commercial grounds. Interestingly,
the announced consequences of being on China’s entity list are not sanctions, as is the case
with the US identity list, but are rather being blocked entirely from trade and investment
with China. All in all, technology decoupling may eventually reinforce trade decoupling
1 See https://www.bis.doc.gov/index.php/policy-guidance/lists-of-parties-of-concern/entity-list.
2 See http://english.mofcom.gov.cn/article/policyrelease/questions/202009/20200903002580.shtml.
-15-10-505101520253035
23242526272829303132
2014 2015 2016 2017 2018
Year on year % (right scale)
Year on year % (right scale)
-15-10-5051015202530
0
1
2
3
4
5
2014 2015 2016 2018
-15-10-505101520253035
23242526272829303132
2014 2015 2016 2017 2018
Year on year % (right scale)
Year on year % (right scale)
-15-10-5051015202530
0
1
2
3
4
5
2014 2015 2016 2018

8 Policy Contribution | Issue n˚21 | December 2020
as the web of sanctions and prohibitions expands, and this is particularly the case for high
value-added products with a large share of technology components. It goes without saying
that trade decoupling between the world’s two largest economies will foster deglobalisation
of trade and, possibly, investment. One particular sector for which the impact of technology
decoupling might be most serious is the semiconductor industry, as has become apparent
with the US ban on sourcing semiconductors from Huawei, which affects not only American
producers but also Taiwanese producers, among others. In September 2020, the US entity list,
in addition to Huawei, added the largest producer of semiconductors in China (SMIC).
Another stumbling block in the US-China technology decoupling, which has spilled over
to the rest of the world, is 5G technology. Since the US banned Huawei from providing 5G
platforms in the US, other countries have followed, including the United Kingdom. The conse-
quences of this move are still to be fully evaluated, but it looks like the world will end up with
two different 5G ecosystems and with two different sets of interoperable standards.
In addition to conflicts over hardware, the US containment of Chinese technological
expansion is moving into software. In early August 2020, the White House published executive
orders targeting Chinese-owned social media platforms TikTok3 and WeChat4. The measures
threaten penalties against US residents or companies that engage in any transactions with
these firms. This is equivalent to the great firewall set up by China much earlier to prevent its
internet users accessing online services including Google and Facebook. But as the US follows
China’s lead, the internet and thus the exchange of global information will become increas-
ingly divided. The two ecosystems in terms of hardware and standards may be replicated in
terms of software.
Beyond hardware and software, the next battle will clearly be the cloud and data storage.
China’s restrictions on data storage outside of China have been enforced since 2017, when
China’s Internet Security Law was first implemented. To address this, foreign companies, such
as Apple, now store Chinese user data in China through partnerships with local companies.
Such regulation in China will apply to any business from the US and will push China to speed
up the development of its own ecosystem in this technology. In other words, upgrading of the
Chinese technology industry has become more urgent than ever, and China is prepared to
pay the financial costs associated with supporting these industries.
4 International mobilityThe decline in global trade in services (Figure 3) is particularly evident in travel services,
which underwent negative growth in 2019 (Figure 10).Nevertheless, movement of people up
to 2019 was growing in the form of longer-term migration, though at a slower pace (Figure
11). The sustainability of this might be called into question by increased restrictions on labour
mobility driven by immigration controls. For example, denials of visas to enter the US have
increased rapidly, a trend that is especially evident for Asian countries including China and
India (Figure 12). The US-China decoupling has compounded the effect by moving into the
area of international exchange of people. The US is reported to have revoked visas for a large
number of Chinese students and researchers, citing potential security risks5. As such, decou-
pling between the US and China in terms of exchange of people is becoming a reality and is a
factor in terms of deglobalisation of international mobility.
3 See https://www.whitehouse.gov/presidential-actions/executive-order-addressing-threat-posed-tiktok/.
4 See https://www.whitehouse.gov/presidential-actions/executive-order-addressing-threat-posed-wechat/.
5 See for example Humeyra Pamuk, ‘U.S. revokes more than 1,000 visas of Chinese nationals, citing military
links’, Reuters, 9 September 2020, available at https://www.reuters.com/article/us-usa-china-visas-students-
idUSKBN26039D.

9 Policy Contribution | Issue n˚20 | November 2020
Short-term movements have also been growing. However, what was long perceived as
a boom in international mobility, until COVID-19 struck, is actually somewhat inaccurate.
Some of the flows of people had started to decelerate before COVID-19 and the number
of short-term visitor arrivals slowed down markedly after 2017 (Figure 13). Of course, the
number of international flights collapsed in 2020 because of global COVID-19-related
restrictions on mobility (Figure 14). Trends beyond the pandemic could mean international
mobility does not return to previous levels. Concerns about the impact of travel on health and
the environment are likely to redefine the tourism industry. This is even more the case for
business travel.
Figure 10: Growth of global trade in travel services (year-on-year, %)
Source: UNCTAD.
Figure 11: International migrant stock (millions)
Source: United Nations.
Figure 12: US visa refusal rates, tourists and business travellers, selected countries
Source: US State Department.
40
-30
-20
-10
0
10
20
30
2011 2012 2013 2014 2015 2016 2017 2018 2019
0.00.20.40.60.81.01.21.41.61.82.0
0
50
100
150
200
250
300
1990 1995 2000 2005 2010 2015 2019
Annual growth rate (right scale)
0%
5%
10%
15%
20%
25%
30%
China India Vietnam Italy Brazil Mexico
2017 2018

10 Policy Contribution | Issue n˚21 | December 2020
Figure 13: International tourist arrivals (billions)
Source: Bruegel based on UNWTO.
Figure 14: International flight passengers (year-on-year, %)
Source: Bruegel based on Airports Council International.
5 Financial deglobalisation is less pronounced but still noticeable
Increasingly, there are some early signs of financial deglobalisation. This has become more
noticeable as the confrontation between the US and China has moved beyond trade with a
growing number of conflicts in the financial sector. In this section, we examine globalisation
trends through the lenses of foreign direct investment, portfolio investment and cross-border
lending.
The decline in cross-border capital flows is particularly evident in foreign direct invest-
ment (FDI), the most stable and possibly the most productive type of capital flow. Both
inward (Figure 15) and outward FDI (Figure 16) flows as a share of global nominal GDP
have been declining since the global financial crisis. This is especially true for outward FDI,
which halved from 2.7 percent in 2008 to only 1.2 percent in 2018. This follows the trends of
the decline in global trade and the fragmentation of global value chains, and could possibly
be a consequence of those. While there was a noticeable recovery in outward FDI in 2019,
preliminary data for 2020 points to a collapse in mergers and acquisitions, which is likely
to be negative for FDI flows. It is hard to know whether FDI is no longer growing because of
lack of demand, or because of constraints that make it harder for investors to operate. In any
case, the differences in investment returns among recipient countries are such that the much
-6.0
-4.0
-2.0
0.0
2.0
4.0
6.0
8.0
0.0
0.2
0.4
0.6
0.8
1.0
1.2
1.4
1.6
2005 2006 2007 2008 2009 2010 2011 2012 2013 2014 2015 2016 2017 2018 2019
Year on year % (right scale)
-120
-100
-80
-60
-40
-20
0
20 2019 2020
JAN FEB MAR APR MAY JUN JUL AUG SEP OCT NOV DEC JAN FEB MAR APR MAY

11 Policy Contribution | Issue n˚20 | November 2020
reduced levels of FDI currently could be seen as a critical sign of fragmentation of global
capital markets.
Figure 15: World inward FDI flow (% of global GDP)
Source: UNCTAD.
Figure 16: World outward FDI flow (% of global GDP)
Source: UNCTAD.
The decline in FDI flows is even more noticeable in the China–US relationship. US FDI
flows into China peaked in 2002 after China’s entry into the WTO (Figure 17). Chinese FDI
into the US grew until 2016 (Figure 18) even though global FDI flows have been stagnating
since 2007. The collapse since 2017 could result from US constraints imposed by the Commit-
tee on Foreign Investment in the United States, which goes beyond specific technology cases,
or from increased costs of doing business because of the worsening US-China relationship.
Figure 17: US FDI flow to China (% of GDP)
Source: Bruegel based on UNCTAD and www.wind.com.cn/.
0.0
0.5
1.0
1.5
2.0
2.5
3.0
3.5
4.0
2000
2001
2002
2003
2004
2005
2006
2007
2008
2009
2010
2011
2012
2013
2014
2015
2016
2017
2018
2019
0.0
0.5
1.0
1.5
2.0
2.5
3.0
3.5
4.0
2000
2001
2002
2003
2004
2005
2006
2007
2008
2009
2010
2011
2012
2013
2014
2015
2016
2017
2018
2019
0.000.020.040.060.080.100.120.140.160.18
2003 2004 2005 2006 2007 2008 2009 2010 2011 2012 2013 2014 2015 2016 2017 2018

12 Policy Contribution | Issue n˚21 | December 2020
Figure 18: Chinese FDI flow to the US (% of GDP)
Source: Bruegel based on UNCTAD and www.wind.com.cn/.
A less-pronounced trend than for FDI is also observable for portfolio flows. Portfolio flows
into emerging markets have also slowed down globally since the European sovereign crisis in
2010 (Figure 19). The rebound of portfolio inflows after the initial COVID-19 shock has been
milder than after the GFC (Figure 20). All in all, it is hard to talk of financial deglobalisation for
portfolio flows yet, although it is interesting to look into the specific case of China and the US.
Figure 19: Total portfolio flows in emerging markets, share of GDP (%)
Source: Bruegel based on IIF, UNCTAD.
Figure 20: Total portfolio flows in emerging markets ($ billions)
Source: IIF. Note: to August 2020.
Deceleration in bilateral portfolio flows has been more notable between the US and
China, at least in terms of holding of safe assets, than in relation to emerging markets. The US
and China have been slowly but steadily downsizing their holdings of each other’s financial
0.00
0.20
0.40
0.60
0.80
1.00
1.20
1.40
1.60
1.80
2.00
2000
2001
2002
2003
2004
2005
2006
2007
2008
2009
2010
2011
2012
2013
2014
2015
2016
2017
2018
2019
-100
0
100
200
300
400
500
-0.5
0.0
0.5
1.0
1.5
2.0
2.5
Amount ($bns, right scale)
2019
2006
2007
2008
2009
2010
2011
2012
2013
2014
2015
2016
2017
2018
-100-80-60-40-20
020406080
100
2019 20202010 2011 2012 2013 2014 2015 2016 2017 2018

13 Policy Contribution | Issue n˚20 | November 2020
assets (Figures 21 and 23). Beyond the numbers, there is evidence of government attempts
to decouple further. For example, the US State Department has asked universities to divest
their holdings of specific Chinese assets, mainly related to Xinjiang or China’s military-related
companies6. That said, these moves have so far stayed bilateral and have not been followed by
other countries. In fact, total foreign holdings of both Chinese bonds and US treasuries have
increasing (Figures 22 and 24), which is understandable given the economic importance of
these two economies.
Figure 21: US holdings of Chinese long-term securities ($ billions)
Source: Treasury International Capital. Note: to April 2020.
Figure 22: Chinese bonds, foreign ownership (trillion renminbi)
Source: Bruegel based on China Central Depository & Clearing, Shanghai Clearing House, CEIC. Note: data as of October 2020.
Figure 23: Chinese holdings of US Treasuries ($ trillions)
Source: Treasury International Capital.
6 See https://www.state.gov/letter-from-under-secretary-keith-krach-to-the-governing-boards-of-american-
universities/.
0
50
100
150
200
250
300
350
400
450
2019 20202012 2013 2014 2015 2016 2017 2018
0.0
0.5
1.0
1.5
2.0
2.5
3.0
3.5
0
500
1000
1500
2000
2500
3000
3500
16 17 18 19 20
% (right scale)
0.8
0.9
1.0
1.1
1.2
1.3
1.4
2019 20202012 2013 2014 2015 2016 2017 2018

14 Policy Contribution | Issue n˚21 | December 2020
Figure 24: Total foreign holdings of US Treasuries ($ trillions)
Source: Treasury International Capital.
Cross-border bank lending meanwhile has not returned to the 2008 peak level, either in
dollar terms or as a share of nominal GDP, notwithstanding a gradual recovery after the GFC
(Figure 25). There is a shift towards more lending into emerging markets, which comes at the
cost of less lending flowing into developed markets (Figure 26). It is thus hard to argue that
there is a deglobalisation trend in cross-border bank lending. Rather, its nature is changing
with an increase in emerging market flows.
Figure 25: Global cross-border lending, total claims ($ trillions)
Source: Bruegel based on BIS, UNCTAD.
Figure 26: Cross-border lending, total claims ($ trillions)
Source: BIS.
0,8
1,8
2,8
3,8
4,8
5,8
6,8
12ge
n
12ju
l
13ge
n
13ju
l
14ge
n
14ju
l
15ge
n
15ju
l
16ge
n
16ju
l
17ge
n
17ju
l
18ge
n
18ju
l
19ge
n
19ju
l
20ge
n
20ju
l
0
5
10
15
20
25
30
35
40
0
5
10
15
20
25
30
35
40
2000
2001
2002
2003
2004
2005
2006
2007
2008
2009
2010
2011
2012
2013
2014
2015
2016
2017
2018
2019
2020
Total
Emerging market
0
10
20
30
40
50
60
0
5
10
15
20
25
30
35
40
2000
2001
2002
2003
2004
2005
2006
2007
2008
2009
2010
2011
2012
2013
2014
2015
2016
2017
2018
2019
% of global GDP (right scale)
0
5
10
15
20
25
30
35
40
0
5
10
15
20
25
30
35
40
2000
2001
2002
2003
2004
2005
2006
2007
2008
2009
2010
2011
2012
2013
2014
2015
2016
2017
2018
2019
2020
Total
Emerging market
0
10
20
30
40
50
60
0
5
10
15
20
25
30
35
40
2000
2001
2002
2003
2004
2005
2006
2007
2008
2009
2010
2011
2012
2013
2014
2015
2016
2017
2018
2019
% of global GDP (right scale)

15 Policy Contribution | Issue n˚20 | November 2020
In line with the reduction in cross-border lending, cross-border financing has become
more difficult. For example, Chinese technology firms listed in the US have opted for sec-
ondary listings to avoid the risk of delisting from the US stock market. This has been done by
Alibaba Group, JD.com and NetEase Inc, which have opted for secondary listings in Hong
Kong. The Chinese government has meanwhile adopted policies to encourage the domestic
funding of technology companies, including the launch in 2019 of the Science and Technol-
ogy Innovation Board (SSE STAR Market) . Based in Shanghai, the STAR Market has the objec-
tive of supporting promising technology start-ups in their equity financing, helping avoid US
equity markets. China has also been increasingly selective in its choice of foreign banks in the
arrangement of its sovereign issuance overseas. For example, HSBC was absent from an offer-
ing of China’s US-dollar denominated bonds in October this year, possibly due to geopolitics .
Since the renminbi has not yet become an international currency, China can use its sheer size
in financial deals in screening market participants.
The deglobalisation trend is less pronounced than in other areas for financial flows, with
the exception of FDI which is more closely linked to trade and the real economy. Neverthe-
less, the financial decoupling between the US and China is increasingly evident and is not
only limited to FDI, though less FDI is significant. If the world returns to capital controls,
there will be greater dislocation of global savings and, ultimately, lower potential growth.
6 ConclusionsAfter decades of increasing globalisation in every aspect, from trade – pushed further by the
growing role of value chains – to technology, movement of people, and investment, it seems
the trend has turned towards deglobalisation, or at least slower globalisation. Deglobalisation
is not a new concept but rather a megatrend which has been seen before, right before the First
World War. The slowing of the globalisation process, after decades of growing globalisation
since the reform of the international financial architecture after the Second World War, ap-
pears to have started in 2008, at least for trade, global value chains and foreign direct invest-
ment. The deceleration in trade and FDI globally has been fuelled recently by the strategic
competition between the US and China, which is pushing them to decouple from one anoth-
er, not only in terms of trade and FDI but, most notably, in technology. COVID-19 has been a
second very important factor pushing deglobalisation. Beyond trade and FDI, movement of
people has been an obvious victim of COVID-19.
The deglobalisation of trade is happening in terms of value and volume of gross trade and
in terms of the importance of global value chains. In other words, there are signs of a reduc-
tion in the exchange of intermediate goods between countries as a way to exploit comparative
advantage and specialisation gains. These trends should not surprise us given the increasingly
protectionist policies of a number of governments, notably the US, and the related weakening
of multilateralism, as clearly exemplified by the decline of the WTO.
Beyond trade, technology decoupling between the US and China is seen in reduced
approvals for export licenses, limits on use of hardware (through sanctions and the impo-
sition of lists of companies with which US and other companies cannot trade) and outright
bans on software. FDI flows are also shrinking, especially between US and China. FDI
screening is one obvious factor hampering FDI flows. International flows of people started to
decelerate in 2018, with much sharper declines in the wake of COVID-19. Finally, the trend
towards deglobalisation is much less evident for finance, with the exception of FDI, though
increasing attempts to decouple particular types of financial flows are emerging, including
pressure to delist Chinese companies from US stock exchanges and the imposition of sanc-
tions for transactions with certain Chinese companies and individuals. However, it is too early
to confirm the depth and the sustainability of this new trend towards slower globalisation, if
not deglobalisation, which may be happening in more domains that we are fully aware.

16 Policy Contribution | Issue n˚21 | December 2020
ReferencesAntràs, P. (2020) ‘De-Globalisation? Global Value Chains in the Post-COVID-19 Age’, mimeo, available at
https://scholar.harvard.edu/antras/publications/de-globalisation-global-value-chains-post-covid-
19-age
García-Herrero, A. (2018) ‘US Tariffs Aim to Contain China’s Technological Rise’, Bruegel Blog, 10 April
Hillebrand, E.E. (2010) ‘Deglobalization scenarios: who wins? Who loses?’ Global Economy Journal,
10(2): 1-21
Intriligator, M. (2003) ‘Globalization of the World Economy: Potential Benefits and Costs and a Net
Assessment’, Policy Brief No 33, The Milken Institute
Khan, A.R. and C. Riskin (2001) Inequality and Poverty in China in the Age of Globalization, Oxford
University Press
Rodriguez, F. and D. Rodrik (1999) ‘Trade Policy and Economic Growth: A Skeptic’s Guide to Cross-
National Evidence’, NBER Working Paper WP/99/7081, National Bureau of Economic Research
Rodrik, D. (2011) The globalization paradox: democracy and the future of the world economy, WW Norton
& Company
Rogoff, K. (2003) ‘Globalization and global disinflation’, Federal Reserve Bank of Kansas City Economic
Review, 88(4): 45-80
Tomohara, A. and S. Takii (2011) ‘Does globalization benefit developing countries? Effects of FDI on local
wages’, Journal of Policy Modeling 33(3): 511-521