exec summ layout best
TRANSCRIPT
1
IOWA CONCENTRATED ANIMAL FEEDING OPERATIONS
AIR QUALITY STUDY
Final Report
Iowa State University and The University of Iowa Study Group
February 2002
2
Table of Contents
Acknowledgements 3Foreward 4Chapter 1: Executive Summary 5Chapter 2: Industry Structure and Trends in Iowa 17Chapter 3: Air Quality Issues 35Chapter 4: Emissions and Community Exposures from CAFOs 45Chapter 5: Fate and Transport of Air Pollutants from CAFOs 86Chapter 6: Adverse Health Effects
6.1 Toxicology 1016.2 Animal Health Effects 1156.3 Human Health Effects 121
Chapter 7: Social and Community Impacts 147Chapter 8: Exposure Limits Related to Air Quality and Risk Assessment 164Chapter 9: Relevant Laws, Regulations and Decisions 184Chapter 10: Emission Control Systems 202Attachments 213Glossary 216
3
Acknowledgements
The University of Iowa-Iowa State University CAFO study group thanks Governor Tom Vilsack andDirector Jeffrey Vonk for giving us the opportunity to bring scientific discourse to this issue of suchgreat importance to Iowans. The Chairs would like to acknowledge the tremendous effort of the studygroup in completing this task. Co-chairs Gerald Miller, Gary Osweiler and Peter Thorne are specificallycommended for their hard work and diligence. A huge debt of gratitude is owed to Dr. Carol Hodnewho served as both a co-author and as the coordinator for the study group. Technical, design andeditorial assistance was provided by Leslie Loveless, Kathryn Andrews, Patti O’Neill, Angela Rieck-Hinz, Kathey Testin, Susan Thompson, and Julia Venzke. We also wish to thank Bryan Bunton of theDepartment of Natural Resources for providing data on odor complaints in Iowa. Lastly, we thank ourexternal peer review group for providing insightful comments in a very short time frame. Participantsfrom the University of Iowa acknowledge the support of the Environmental Health Sciences ResearchCenter which is funded by the National Institute of Environmental Health Sciences (NIH Grant P30ES05605).
4
Foreword
In June, 2001, Governor Tom Vilsack asked the Presidents of Iowa State University and of TheUniversity of Iowa to assist the Iowa Department of Natural Resources and the EnvironmentalProtection Commission with addressing public health and environmental concerns arising from airemissions from concentrated animal feeding operations (CAFOs). With the concurrence of bothpresidents, Iowa Department of Natural Resources Director Jeffrey Vonk charged the College of PublicHealth at the University of Iowa and the College of Agriculture at Iowa State University to recommendstandards for air quality and address other issues regarding CAFOs.
The Colleges of Agriculture and Public Health assembled teams of faculty with appropriate expertise tocomplete a comprehensive review of available scientific information to address five questions asked byDirector Vonk. At ISU, faculty from the College of Veterinary Medicine also made importantcontributions to this effort. The ISU team was led by administrators from both of these colleges. AtThe University of Iowa, the Environmental Health Sciences Research Center, sponsored by theNational Institute for Environmental Health Sciences, assembled a team composed of faculty from theColleges of Public Health, Engineering and Medicine. Together, these faculty delved into existingresearch literature, developed a ten-chapter report on the various aspects of these issues and, through aseries of meetings, developed responses to Director Vonk’s five questions in the form of an ExecutiveSummary. This Executive Summary describes the consensus reached by the study group. Individualchapters are the products and views of the chapter authors. Independent national and internationalscientists, with appropriate expertise, reviewed and commented on both the Executive Summary and thefull report.
The report is based upon the best science available to ensure that rural ambient air is as free of risk aspossible in order to protect health and the quality of life at the highest possible level. These science-based recommendations were generated with the goal of providing helpful guidance to the IowaDepartment of Natural Resources and the Environmental Protection Commission. It is hoped that thereport will provide a sound basis for the development of appropriate administrative rules that willpromote confidence in agricultural production and the quality of life in rural Iowa.
James A. Merchant, M.D., Dr.P.H. Richard F. Ross, D.V.M, Ph.D.Dean Former DeanCollege of Public Health College of AgricultureThe University of Iowa Iowa State University
February 7, 2002
5
CHAPTER 1 Executive Summary
Introduction
In mid-June of 2001, Governor Tom Vilsack requested that the faculty of the two universities addressthe public health and environmental impacts of concentrated animal feeding operations (CAFOs, alsoreferred to as Concentrated Feeding Operations or CFOs). In response to this request, Richard Ross,PhD, DVM, Dean of the College of Agriculture at Iowa State University and James Merchant, MD,DrPH, Dean of the College of Public Health at The University of Iowa, were asked by the Departmentof Natural Resources Director Jeffrey Vonk to provide guidance “regarding the impacts of air
quality surrounding CFOs on Iowans and recommended methods for reducing and/or
minimizing emissions. Specifically, I am asking your advice and recommendations on how the
Department of Natural Resources should address this critically important public policy issue.”
Director Vonk asked five questions. Through a series of discussions and meetings, a combined studygroup of faculty and consultants (See Attachment 1) was identified, conflict of interest andconfidentiality statements were signed by all faculty and consultants, definitions were discussed andagreed upon, a comprehensive report outline was developed and agreed upon and individual teams offaculty agreed to write each of the 10 chapters that constitute the full report. A technical and policyworkshop was held in Des Moines on December 18 and 19, 2001, at which time chapter presentationswere made and discussions were held regarding the series of five questions asked by Director Vonk.Groups were assigned to summarize the responses to these five questions in this Executive Summary.Peer review of this Executive Summary and the full report was considered to be vital to the validity andintegrity of the report. This peer review, completed by national and international scientists who areexperts in the areas addressed by the report (See Attachment 2), was completed in January, 2002. Theirreview comments, as well as comments from members of the combined study group, were discussed atmeetings on January 8, 24 and 29 and were useful in completing the final report for submission to theIowa Department of Natural Resources (IDNR). An agreed-upon glossary, which defines the manytechnical terms used in this report, is found in Attachment 3.
Response to Question 1
There are two questions contained in Question 1. The first is:
Based on analysis of peer-reviewed, duplicated, legitimate, published scientific research, is there direct evidenceof harm to humans by emissions, byproducts, toxic waste, or infectious agents produced by CFOs?
There is now an extensive literature documenting acute and chronic respiratory diseases and dysfunctionamong workers, especially swine and poultry workers, from exposures to complex mixtures ofparticulates, gases and vapors within CAFO units. Common complaints among workers include sinusitis,chronic bronchitis, inflamed mucous membranes of the nose, irritation of the nose and throat,headaches, muscle aches and pains. Asthma and acute (cross-shift) declines in lung function are
6
documented among CAFO workers, even though workers with pre-existing asthma usually selectthemselves out of such employment because of increased asthma severity. Progressive declines in lungfunction over years are documented among CAFO workers. Those workers with increased acutedeclines in lung function, which are often accompanied by chest tightness and wheezing (asthma-likesyndrome), have been found to have more rapid declines in lung function over time. Very highexposures to hydrogen sulfide, which occurs during pit agitation, may result in death from asphyxia andrespiratory arrest; those who survive such high dose exposures often develop reactive airways distresssyndrome (RADS), bronchiolitis obliterans and severe respiratory impairment. It is therefore concludedthat there is direct evidence of harm to humans from occupational exposures within CAFOs (SeeChapter 6.3.2).
However, one cannot directly extrapolate occupational health risks observed among workers insideCAFOs to community health risks that may arise from CAFO emissions. While the discharge ofairborne particulates and gases/vapors from CAFOs and manure handling clearly occur, the aerosols atthe point source differ from ambient exposures as they move downwind, both in composition and inconcentration. The populations at risk (workers) within CAFO units and within the community(community residents) also differ significantly. CAFO workers are generally a healthy population (thosefit enough to work), while community residents include children, the elderly, and those with preexistingimpairments. Regulatory agencies recognize the need for lower exposure limits to compensate forincreased susceptibility among community residents, to allow for uncertainty factors fromepidemiological study findings (and for species to species differences when animal data is used) toestablish community ambient exposure limits.
The second part of the first question is:
What human research is there to confirm the existence of disease and exactly what are the specific chemical,bacterial, or aromatic causes of such diseases?
Published, controlled studies of odor experienced by community residents living in proximity to CAFOsare limited to two studies in North Carolina and one in Iowa. The first North Carolina study reportedmore negative mood states (tension, depression, anger, reduced vigor, fatigue and confusion) amongthose exposed to CAFO odor compared with control subjects. The second North Carolina studyreported increased symptoms of headache, runny nose, sore throat, excessive coughing, diarrhea,burning eyes and reduced quality of life measures among community residents living in proximity to aswine CAFO compared with rural residents not living in proximity to livestock operations. The Iowastudy found increases in several symptom clusters, mainly eye and upper respiratory symptoms, amongthose living within two miles of a swine CAFO compared with rural residents living near minimallivestock production. These studies are limited in size and scope, did not make specific environmentalexposure or odor measurements, and are subject to recall bias. They are notable in that they arecontrolled studies that report eye and respiratory symptoms associated with concentrated livestockexposures that are similar to more prevalent and severe symptoms experienced by CAFO workers whoare exposed at much higher concentrations of mixed emissions (See Chapter 6.3.3).
Also relevant in responding to this question are many experimental and epidemiological studies of non-CAFO populations exposed to low concentrations of individual chemical components of CAFOemissions, particularly hydrogen sulfide, ammonia and endotoxin. These studies document respiratorysymptoms associated with low levels of these individual exposures. Because at least two of these
7
chemicals (hydrogen sulfide and ammonia) are found in CAFO emissions that contribute to ambientcommunity exposures, these experimental and community exposure studies are relevant to this question(See Chapter 6.3.1). Both the Environmental Protection Agency (EPA) and the Agency for ToxicSubstance and Disease Registry (ATSDR)1 have recommended ambient exposure limits for ammoniaand hydrogen sulfide based on these studies.
It is concluded that no specific disease(s) per se among community residents can be confirmed to arisefrom a specific chemical, bacteria or aromatic cause. However, the findings of the limited communitystudies of concentrated livestock exposures are consistent with adverse health effects observed in otherexperimental and epidemiological studies of some specific chemicals (ammonia and hydrogen sulfide)known to be components of CAFO air emissions. It is, therefore, also concluded that CAFO airemissions may constitute a public health hazard2 and that precautions should be taken to minimize bothspecific chemical exposures (hydrogen sulfide and ammonia) and mixed exposures (including odor)arising from CAFOs.
Response to Question 2
Question 2: Based on an analysis of peer-reviewed, duplicated, legitimate, and published scientific research,what specific substances, including aromatic compounds, do you believe require regulatory action to protect thepublic?
By consensus of the entire study group, the following substances should be considered for regulatoryaction: (1) hydrogen sulfide; (2) ammonia; and (3) odors. The justification for regulatory action of thesesubstances is based on our assessment of the scientific literature, (See Chapters 2.0-8.0),recommendations by pertinent federal agencies, and review of regulations established in other states(See Chapter 9.0).
Hydrogen sulfide and ammonia are recognized degradation products of animal manure and urine (SeeChapter 3.4 in the full report). Both of these gases have been measured in the general vicinity oflivestock operations at concentrations of potential health concern for rural residents, under prolongedexposure (See Chapter 8.0).
The World Health Organization lists hydrogen sulfide as a toxic hazard in many environments, andrecommends specific exposure limits. The ATSDR lists hydrogen sulfide and ammonia on its registry oftoxic substances1 under its federal mandate to protect the public health according to the ComprehensiveEnvironmental Response, Compensation, and Liability Act, [42 U.S.C. 9604 et seq] as amended by theSuperfund Amendments and Reauthorization Act [pub. 99-499]. Furthermore, the ATSDR haspublished Minimum Risk Levels (MRL’s) for these substances to protect the public’s health.1 The EPAhistorically evaluates scientific information regarding environmental contaminants and the potentialthreats for human health hazards. Based on a standardized risk assessment process, the EPA identifieshydrogen sulfide and ammonia as potentially hazardous substances.3 A detailed description of theprocess and justification used by the EPA and ATSDR to include ammonia and hydrogen sulfide ashazardous substances is provided in detail in Chapter 8.7.
1 Agency for Toxic Substances and Disease Registry, Minimal Risk Levels for Hazardous Substances (MRL’s), http://www.atsdr.cdc.gov/
mrls.html2 hazard: the potential for radiation, a chemical or other pollutant to cause human illness or injury3 Environmental Protection Agency, Integrated Risk Information System, www.cpa.gov/iris/subst.html
8
Minnesota and Nebraska have established air quality standards for hydrogen sulfide based on publichealth concerns. California and Minnesota regulate ambient concentrations of hydrogen sulfide basedupon nuisance and human health effects. Minnesota is in the process of setting standards for ammoniaambient exposures. Monitoring of ammonia ambient exposures is taking place in Missouri. Theregulatory actions taken by other states in setting standards are described in Chapter 9.0.
Odors have been a major concern of residents in the vicinity of CAFOs (see Chapter 3.4, 4.0, 6.8 and
8.0). Colorado, Missouri, and North Carolina have recognized the need to promulgate odor regulations.Details of the processes of odor regulations for these states are presented in Chapter 9.0.
Response to Question 3
residence or public use area. The U.S. EPA has determined that simultaneous exposure of twosubstances such as hydrogen sulfide and ammonia (both pulmonary irritants) results in an additiveeffect. Thus, in order to protect against the adverse effects of such binary mixtures the exposure limitfor each should be reduced accordingly. While emissions from CAFOs fluctuate over time, they producechronic rather than acute exposures. Rather than representing single doses, these exposures are recurringand may persist for days with each episode.
The study group reached consensus that measurements for hydrogen sulfide and ammonia should betaken at the CAFO property line and residence or public use area. Measurements for odor should betaken at a residence or public use area and one proposal includes measurements at the CAFO propertyline. The study group recommends that measurements for hydrogen sulfide and ammonia should betime weighted rather that instantaneous to allow for atmospheric variability.
With current animal production practices, stored manure must be removed and land-applied. Duringthese times hydrogen sulfide, ammonia and odor levels at or near production facilities may besignificantly higher than during normal conditions. Therefore, it is also recommended that provisionsbe made for allowable times to exceed the established standards to allow for proper manure applicationto land. Notification must be given to the Iowa DNR and nearby residents, at least 48 hours in advancewhen the operation expects to exceed the standards
The study group provides the following recommendations on the regulation of hydrogen sulfide,ammonia, and odor from CAFOs:
Hydrogen SulfideIt is recommended that hydrogen sulfide, measured at the CAFO property line, not exceed 70 parts perbillion (ppb) for a 1-hour time-weighted average (TWA) period. In addition, the concentration at aresidence or public use area shall not exceed 15 ppb, measured in the same manner as the property line
Question 3: Based on an analysis of peer-reviewed, duplicated, legitimate, and published scientific research,what would you recommend as Iowa or National consensus standards for any proposed substances to be regulatedas emissions from CFOs?
The study group recommends that ambient air quality standards be developed to regulate theconcentration of hydrogen sulfide, ammonia and odor. There has been considerable discussion on whatstandard levels should be established for each pollutant as well as where the measurement should takeplace. Some states measure concentration at the property line of the source while others measure at the
9
measurement. It is recommended that each CAFO have up to seven days (with 48 hour notice) eachcalendar year when they are allowed to exceed the concentration for hydrogen sulfide.
AmmoniaIt is recommended that ammonia, measured at the CAFO property line, not exceed 500 ppb for a 1-hour TWA period. In addition, the concentration at a residence or public use area shall not exceed 150ppb, measured in the same manner as the property line measurement. It is recommended that eachCAFO have up to seven days (with 48 hour notice) each calendar year when they are allowed to exceedthe concentration for ammonia.
OdorThe study group was unable to reach consensus on the regulation of odors. Thus, the following twoopinions for odor are presented:
Opinion 1:It is recommended that odor, measured at the residence or public use area, shall not exceed7:1 dilutions with an exceedence defined as two excessive measurements separated by 4hours, in any day. It is recommended that each CAFO have up to seven days (with 48 hournotice) each calendar year when they are allowed to exceed the concentration for odor. Atthe CAFO property line, odor shall not exceed a 15:1 dilution, with an exceedence defined asone excessive two-hour time averaged sample, in any day. It is recommended that eachCAFO have up to 14 days (with 48 hour notice) each calendar year when they are allowed toexceed the property line concentration for odor. Exceedence of a CAFO ambient air qualitystandard should result in regulatory action similar to that which would be required inregulatory action exceedence of a National Ambient Air Quality Standard. The IDNRshould be granted the power to develop an implementation plan to reduce the emissions thatled to the violation.
Opinion 2:Odor recommendations are more difficult to establish because studies relating healthimpacts to odor exposure have not measured odor concentrations. However, odorconcentrations related to annoyance impacts have been established. Measurements for odorshould be taken at a residence or public use area. Using sampling events at the source, thefrequency, duration, and concentration of exposure to odor at the residence can be modeledusing tools currently available, thereby avoiding extensive monitoring.
Polls indicate that residents are willing to tolerate nuisance odors for only up to a reasonableamount of time (see Iowa Rural Life Poll, Chapter 7 in the full report). Thus, the reportedodor concentration represents tolerable continuous exposure, above which, concentrationsare tolerated only in relation to their frequency and duration. An odor concentration of 7:1dilutions at a residence is a tolerable odor providing it is not exceeded for periods thatextend beyond that considered reasonable.
10
Response to Question 4
Question 4: What do you think should be done to address any other emerging issues with respect to industrialCFOs in Iowa?
There are other important emerging issues surrounding the intensification of livestock production thatextend beyond concerns over air emissions. These include concerns about water quality, the health ofCAFO workers, socioeconomic impacts in rural communities, and the emergence of microorganismsresistant to antibiotics used in human and veterinary medicine. There are also concerns about theemission of greenhouse gases from CAFO sites. The effects of siting large CAFOs in or nearcommunities should be recognized and used in making informed decisions on permitting facilities.There is a need to evaluate plans for controlling livestock epidemics and for proper disposal of carcassesin the event of an outbreak. Recent events in Europe associated with foot and mouth disease, plusrenewed concerns over agricultural bioterrorism highlight this need. Lastly, the study group makesrecommendations regarding the formation of a science advisory panel to advise the IDNR onagricultural and environmental health issues. Each of these issues is further described below.
Some issues discussed in this section may be outside the purview of the IDNR, but all are congruentwith science-based conclusions in the body of the report. Some are appropriately addressed by otherstate or federal agencies, and some can only be addressed through a combination of related publicpolicies.
Water Quality
Water quality is a major issue concerning CAFOs. Concerns include: 1) leakage or rupture of lagoons(both lined and unlined); and 2) runoff from agricultural fields where animal waste has been improperlyapplied. Nonpoint discharges may result in surface runoff with high concentrations of ammonia,biochemical oxygen demand (BOD), total and fecal coliform bacteria, total suspended solids, andphosphorus which can cause low dissolved oxygen in streams. Ecosystem impacts may include fish kills,changes in the natural food webs, algae growth, and losses of biological diversity in stream habitat. Boththe structure and function of aquatic ecosystems can be impaired. Impacts may include increased costfor drinking water treatment of surface water supplies, reduced harvest of fish and shellfish, closedbathing beaches due to fecal coliforms, and loss of aesthetic beauty of Iowa’s waterways.
Recently, Iowa has experienced an increase in the number of CAFOs as well as a greater density ofanimals per operation. Many larger operations are not self-sufficient in grain production and purchasefeed from other sources. Therefore, applicators must follow additional application guidelines establishedby legislation and rules. While some study group members believe manure should never be applied tofrozen ground or steep slopes, others recommend that manure application on steep slopes and frozenground follow guidelines established by USDA Natural Resources Conservation Service “Iowa NutrientManagement Standard 590”. In addition, large producers are required to file manure management planswith the IDNR.
Study group members reached consensus that as operations become more numerous and concentratedon limited land bases, there is an increased risk for deterioration of water quality. All members believethat if producers do not follow their manure management plans, the chance for runoff of nutrients andbacteria is increased. In addition, some members felt more strongly on this issue, stating that it is notpossible to apply manure at high areal loading rates without runoff of nutrients and bacteria because
11
one cannot foresee intense rainfall events. One cannot assume that manure can always be safely appliedto land without a potential for runoff. These members feel the present system of CAFO productiondisposes of too much manure in too small an area exposed to uncontrolled meteorological conditions torealistically expect acceptable water quality.
Wastes that are stored in lagoons or earthen waste storage structures have a potential for spills and/orgroundwater contamination if existing standards are not met. National Pollutant Discharge EliminationSystem (NPDES) permits are required for large (>1000 animal units) open feedlots which allowdischarge only in the event of a 25-year, 24-hour storm. Totally roofed CAFOs are not allowed todischarge into surface waters, and therefore do not require NPDES permits. This is in contrast to smallIowa towns, all of which are required to have NPDES permits and meet effluent dischargerequirements.
Occupational Health
The occupational health problems for those who work inside CAFOs have been well recognized since1977. At least 25 percent of workers in swine CAFOs have been reported to have current respiratoryhealth problems. Recommended maximum exposure levels designed to protect worker health have beendefined (See Chapter 6.3). It is apparent that current Occupational Safety and Health Administration(OSHA) limits are not protective of CAFO worker health because a number of hazardous contaminantsare not regulated. Importantly, OSHA has not promulgated any Permissible Exposure Limits specificallyto protect the health of livestock production workers.
There are several important regulatory problems that have interfered with the protection of workers inCAFOs. Most of the large livestock and poultry producers have not been regulated by OSHA, eventhough they may have more than 10 employees and are subject to OSHA regulations. The specializationof livestock production has led to increased cumulative exposure, as workers may spend as much as 70hours per week in these buildings. There is a need to establish exposure standards that protect workersfor these extended work schedules. There is enough information to protect workers’ health ifrecognized workplace management procedures are adopted. It is recommended that the livestock-producing industries institute comprehensive worker health protection programs.
Antibiotic Resistance
Antibiotic resistance is a health threat of great concern. Recent documents from the World HealthOrganization (2000), the Centers for Disease Control, and other health agencies have placed a highpriority on the understanding and control of antibiotic resistance (Interagency Task Force OnAntimicrobial Resistance, 2000; Tenover and Hughes, 1995). It is clear that certain antibiotic usepractices in human medicine have contributed to resistance. Agricultural antibiotic use practices havealso been targeted as contributing to this serious problem (Witte, 1998). In particular, the subtherapeuticuse of antibiotics in food producing animals has been identified by public health officials as the keyfactor in the development of resistance among foodborne pathogens (Gorbach, 2001).
Antibiotic resistant organisms or the resistance genes responsible can be spread from agriculturalsettings into human populations through a variety of mechanisms. Ingestion of contaminated foodproducts, especially animal-derived foods including meat and dairy products, has been linked to spreadof antibiotic resistant organisms (Mead et al., 1999). Direct contact between colonized or infectedanimals and farm workers has also been associated with the acquisition of resistant organisms inhumans (Levy et al, 1976).
12
Various studies have demonstrated that continued use of antibiotics in feedstuffs provides conditionsfavorable to the selection of resistant strains of bacteria in food animals and their environment (Chee-Sanford et al., 2001; Zahn, Anhalt, & Boyd, 2001). Yet the threats for emergence of resistant strains ofbacteria through subtherapeutic use of antibiotics in livestock applies wherever these practices occur;the threat is not restricted to CAFOs. Selection pressure may be enhanced by: (1) the long-term use ofantibiotics in animals having endemic subclinical infections; (2) poor environmental hygiene; and (3)management practices that allow for the introduction of naïve, susceptible animals or the movement ofcarrier animals into a naïve herd. This latter practice allows for the continuous passage of resistantbacteria among susceptible animals. Over the past decade, increasing numbers of organisms isolatedfrom food animals or meat products demonstrate resistance to antibiotics including penicillins,tetracycline, sulfamethoxazole, streptomycin and other compounds (Aarestrup et al, 1998; Centers forDisease Control and Prevention, 1999; Molbak et al, 1999; Smith et al., 1999; Threlfall et al., 1996;White et al., 2001).
Antibiotics are critically important in human and veterinary medicine, and in the current context, foodanimal production. Organisms resistant to all classes of available antimicrobial agents have beenidentified in human medicine and the incidence of community acquired highly drug resistant organismsis increasing (Neu, 1992). No new classes of antimicrobial agents will be available in the foreseeablefuture. It is critical that the appropriate state and federal agencies and the research community in theUnited States take a leading role in defining the risks associated with different antibiotic use practicesand develop strategies to improve our antibiotic stewardship both in human and agricultural settings(American Medical Association, 2001).
Greenhouse Gas Emissions
Regarding air pollution, air permits are not required for emissions from CAFOs, so there is not a goodmethod to quantify their inputs. However, emissions of particulate matter, sulfur compounds, andnitrogen oxides are believed to be a very minor portion of Iowa’s total emissions. CAFO emissions ofthese pollutants are small compared to emissions from stationary sources (power plants and industry)and mobile sources (automobiles and truck diesel). Greenhouse gas emissions from CAFOs aresignificant for methane. On a radiative basis (greenhouse gas impacts), methane is about 10-15% of thetotal greenhouse gas produced in Iowa, and methane from manure management is about 25% of thetotal (approximately 3% of total greenhouse gas estimated in Ney et al., 1996). The Iowa GreenhouseGas Action Plan calls for capture of methane at large feed lots (Ney et al., 1996). Nitrous oxideemissions from manure management at CAFOs is a small contribution, and the emissions of carbondioxide from CAFOs are a negligible portion of the state’s CO
2 emissions.
Community and Socioeconomic Impacts
A number of important community and socioeconomic issues have developed with the emergence ofCAFOs, as described in Chapter 7. Research has explored some of these issues, and posed and evaluatedalternatives, including some alternatives for livestock production. To a significant extent, these issues aretied to overall changes in agriculture and rural life in America. Importantly, these issues are complex andgenerally outside the purview of the IDNR.
These issues include the concern about increased concentration of control of livestock supply chains,lack of public price discovery, and loss of family farmers’ control of production. Another concern isdecline in local economic activity and increases in purchases of some animal production inputs from
13
outside the local area, as CAFOs increase in size and number. This is a complex issue since we mustestimate what purchases would have been made had the structure remained the same. Of equalimportance is the fact that decision-making on questions that matter at the local level are increasinglymore centralized with the growth of corporate CAFOs.
Devaluation of property near hog CAFOs and related legal challenges are documented. Studies inMichigan, North Carolina, and Missouri found that the value of real estate close to CAFOs tended tofall. These and other data show that CAFOs are defined by present and potential neighbors as at least anuisance.
Studies showing a decline in neighborliness, or community social capital, have been conducted in Iowa,North Carolina, Minnesota, and Missouri. This decline was measured by diminished opportunities tosocialize, lack of trust, increased community conflict, and related variables in communities whereCAFOs are concentrated.
A more diverse livestock sector that was able to remain competitive and responded to increasinglydifferentiated consumer preferences would likely result in greater environmental (Donham, 2000), social(Wright, et al., 2001), and economic sustainability of rural areas than one dominated by large-scaleCAFOs. Policies that encourage more diverse livestock/crop farms, particularly those using sustainableproduction systems, could also reduce the regulatory burden of the IDNR and other agencies.
The most clearly recognizable socioeconomic issue for CAFOs that impinges on the IDNR’sresponsibilities is what CAFOs may do to aquatic, wildlife, and aesthetic qualities of living in Iowa, aswell as tourism in Iowa. If air and water quality is compromised, the interest of persons and businessesconsidering relocation to Iowa will be lessened. A compromised environment could have an economicimpact on tourism by keeping Iowa a low priority destination for visitors as well as driving fishing andhunting activity away from Iowa and toward less challenged environments.
Livestock Epidemic and Disposal Issues
The current state plan for Foot and Mouth Disease (FMD) in Iowa is multi-agency and is called the Footand Mouth Disease Response and Recovery Plan. As part of its responsibilities in the state plan, theIDNR has developed the FMD Carcass Disposal Plan. Burial and composting are given high prioritycompared to burning, in order to reduce air pollution consequences. However, the potential impacts ofa FMD epidemic like that of last year in the United Kingdom and Europe should be evaluated to assessif the current plans are sufficient for isolation of pathogens and destruction of carcasses. In addition,these plans should be evaluated for other pathogens, including bioterrorist introduction of anthrax andother potential agents of agricultural bioterrorism.
Formation of a Science Advisory Panel
collaboration and planning in a prospective manner. The partnership of the IDNR and otherappropriate state agencies with a continuing advisory group of specialists in the sciences germane to
To enhance the effectiveness of responses to emerging issues, the study group recommends formationof a science advisory panel to contract with the IDNR on agricultural and environmental issues. TheUniversity of Iowa and Iowa State University participants have found the current review of scientificliterature on CAFOs and the ensuing discussions to be very useful. University faculty could continue in amore general role as a scientific advisory panel. This would provide the opportunity to develop closer
14
Response to Question 5
Question 5: Finally, I am seeking your recommendations regarding available methods of reducing or minimizingthe emissions from CFOs and the impact of those emissions on the ambient air surrounding sites.
Emissions from CAFOs originate from three primary sources: (1) air emissions from housing units; (2)air emissions from manure storage facilities, and (3) air emissions during and following land applicationevents. Documented emission reduction strategies exist for all three of these sources. Some of thedocumented strategies are more effective than others and some are more economical than others,however, economical strategies exist for dealing with emissions from all three sources.
Housing Unit Air EmissionsHousing unit air emissions ultimately are carried out with the ventilation air exhausted from buildings.Emissions originate from the feeding floor itself, where deposited manure and urine decomposeanaerobically resulting in airborne gases and particulates from dried fecal material. In addition, emissionsoriginate from under-floor manure storage in slatted systems and from bedding pack in deep-beddedsystems. Studies have shown that, in slatted-floor housing systems, the emission contribution from thefeeding floor itself can exceed 60 percent of the total with the remaining contribution from the under-floor storage compartment. Use of smooth cleanable surfaces along with frequent and completescraping, and/or frequent flushing of the feeding floor with minimal air exchange between the housingair and the under-floor slurry, is a good strategy for reducing housing unit emissions.
If housing unit emissions are post-processed, (i.e., exhaust ventilation air is treated), additional strategiesexist. Scrubbing the ventilation air with biofilters, where the exhausted air is passed through a bed ofgas-scrubbing microorganisms, has been shown to reduce ammonia and odor emissions by more than90 percent. However, effective use of biofilter technology requires simultaneous use of powerventilation. Biofilters are difficult to implement under high ventilation rate situations typical of Iowasummers and, of course, are not useful in naturally ventilated housing systems.
Gases and odors adhere to dust particles. Natural biomass filters such as corn stalks and chopped-strawhave been used to capture a portion of the larger dust particles emitted with ventilation air. Theevidence on this strategy is still being documented but research to date indicates that about 60 percentof the odor can be reduced using this technique.
Tree barriers are being evaluated for effectiveness in reducing odor and particulates and enhancingmixing and dilution. However, the impact on a large scale relative to livestock or poultry production sitesis unknown. Tree barriers surrounding production sites have high aesthetic value.
agricultural, environmental, and public health issues would strengthen Iowa’s ability to plan forprevention or remediation of emerging problems in a thoughtful and positive manner with sufficientlead-time to engage the needed resources and evaluation. A science advisory panel could suggest areasfor needed research to better resolve or control the factors related to emerging issues. The panel couldrecommend consultants, establish standard operating procedures for resolving questions, and beprepared with the necessary background, literature resources and ongoing discussion to support science-based advice as needed by the IDNR or other agencies in Iowa.
15
The best method for minimizing odors from anaerobic lagoons is to simply practice good management.It is most important to use adequate dilution water and load at or below design capacity. There has beenmuch discussion recently about the use of anaerobic digesters which can significantly reduce storageodors and generate energy in the form of methane gas.
Air Emissions from Land Applied ManureEmissions during land application of livestock and poultry manure can be intense if the manure issurface-applied. The majority of total emissions, roughly 80 percent, occur during the first six hoursafter land application. To significantly reduce emissions of gases and odors during land application,injection or immediate coverage (within 1 hour) is required. Odor reduction is, in turn, dependent uponthe degree of soil coverage. Poorly injected manure slurry with little soil coverage is only marginal ineffectiveness in reducing gas and odor emissions. To take full benefit of the natural odor absorptioncapacity of soils, the slurry must be completely covered. The evidence is clear that 85-90 percentemission reduction is possible with complete soil coverage compared to surface application whencoverage is delayed for more than 3-6 hours.
Policy Strategies for Long-Term Viability of the Livestock Industry in Iowa
Emission of gases and particulates from livestock and poultry systems is an inevitable outcomerequiring special attention. Strategies for emission reduction for all stages of production have beenoutlined, with most being economically feasible. The strategies outlined previously are documentedtechniques that have gained fairly widespread acceptance with scientists and engineers working in thisarea.
A few strategies have been discussed for years. They lack the scientific evidence to document theirspecific benefits, but nevertheless deserve discussion. The study group is unanimous in the belief that along-term strategy of better facility siting, setbacks, and landscape considerations, in addition to theimplementation of available odor and gas reducing technologies, will benefit both the producer andresidents in the community. The study group strongly urges that the following topics receive carefulconsideration.
Statewide Spatial PlanningFacilities built today, under current siting and setback practices, have a lifetime of roughly 15 years. Inthe long-term, guidelines should be established based on siting and spatial planning considerations thatrequire siting of new and replaced facilities in accordance with a statewide spatial plan. Some areas ofthe state are currently over-populated with facilities. A statewide spatial plan, based for example on
Storage Unit Air EmissionsOutside manure storage systems can be a source of additional gas emissions. Regardless of whether thestorage system is formed concrete, steel-lined, or earthen basin, these open exposures to the atmospherecan result in high emission rates. Emission rates are highly influenced by weather conditions. The mosteffective and economically feasible strategy for reducing emissions from outside storage units (notincluding anaerobic lagoons) is accomplished by covering the entire surface area of the storage unit.Research has been conducted on many covering materials, ranging from expensive impermeable covers,to relatively inexpensive chopped-straw covers with a maintained minimum depth of coverage.Inexpensive, chopped-straw cover, with a maintained minimum depth is as effective in reducingemissions as the more expensive covers. However, the key to success with this strategy is maintenanceof a minimum depth of straw.
16
landscape changes such as strategically placed tree lines will positively impact producer/communityrelationships. This is a researchable area and one that holds promise as a natural, aesthetically pleasingstrategy for producers to implement.
Conclusion to Executive Summary
The consensus responses summarized in this Executive Summary provide a science-based summary ofthis inquiry from the Iowa Department of Natural Resources. The study group recognizes theimportance of livestock production and the vital role it plays in the livelihoods of Iowa producers andsuppliers and the state’s economy. It is, therefore, critically important that science-based policies bedeveloped to sustain livestock production. It is equally vital that such policies protect the public’s health,sustain and enhance the communities in which livestock production takes place, and protect andenhance the environment and Iowa’s natural resources through sound production practices,environmental controls and the development of a long-range, sustainable, community health andenvironmentally conscious spatial plan for CAFOS.
animal units per acre, would help guide and distribute animals in a manner that takes full advantage ofIowa’s soil/nutrient capabilities and minimizes the impacts of air emissions on the community.
Local Siting GuidelinesThe study group feels strongly that current siting guidelines are outdated and not reflective of thechanging demographics in rural Iowa. Current siting guidelines use a simple distance and size regulationfor new facilities. The study group feels that this method of siting is not conducive to the long-termviability of the livestock and poultry industries in Iowa. A strategy that takes into account proposedfacility size and type, distance and orientation to surrounding neighbors, local weather patterns, odorcontrol measures, existing recreational and public-use facilities, and other existing production facilities ina community would provide better placement guidance of facilities and contribute positively to spatialplanning considerations. Siting models that utilize the above mentioned inputs have been developed, arecurrently being calibrated, and should be used in community-wide applications.
Aesthetic Considerations for Livestock and Poultry Production SitesEvidence exists in the literature that foliage (primarily trees) will enhance mixing and capture some ofthe odor-producing gases and particulates emitted from livestock and poultry production facilities.Currently, research projects are being planned, and some have already been conducted, to test the use ofstrategically placed tree barriers around production sites. Although evidence documenting odor, gas, andparticulate-capture-percentages on a production-size scale is limited, the study group feels strongly that
17
References
Aarestrup FM, Bager F, Jensen NE, Madsen M, Meyling A, Wegener HC. Surveillance of antimicrobial resistance inbacteria isolated from food animals to antimicrobial growth promoters and related therapeutic agents inDenmark. APMIS 106:606-622 (1998).
American Medical Association, Resolutions of the 2001 Annual Meeting of the AMA House of Delegates: 508.Antimicrobial Use and Resistance. http://www.ama-assn.org/ama/pub/category/6692.html.
Centers for Disease Control and Prevention. National antimicrobial resistance monitoring system. Enteric bacteria1999 annual report (1999).
Chee-Sanford, JC, Aminov, RI, Krapac, IJ, Garrigues-JeanJean, N, Mackie, RI. Occurrence and diversity of tetracy-cline resistance genes in lagoons and groundwater underlying two swine production facilities. Applied andEnviron Microbiol 67:1494-1502 (2001).
Donham KJ. The concentration of swine production: Effects on swine health, productivity, human health, and theenvironment. Veterinary Clin North Am: Food Anim Pract 16:559-597 (2000).
Gorbach SL. Antimicrobial use in animal feed–time to stop. N Engl J Med 345:606-622 (2001).Interagency Task Force on Antimicrobial Resistance. A public health action plan to combat antimicrobial resistance.
Part I: Domestic Issues http://www.cdcgov/drugresistance/actionplan/aractionplan.pdf (2000).Levy S B, FitzGerald GB, Macone AB. Changes in intestinal flora of farm personnel after introduction of a tetracy-
cline-supplemented feed on a farm. N Engl J Med 295:583-8 (1976).Mead PS, Slutsker L, Dietz V, McCaig LF, Bresee JS, Shapiro C, Griffin PM, Tauxe RV. Food-related illness and
death in the United States. Emerg Infect Dis 5:607-625 (1999).Molbak K, Baggesen DL, Aarestrup FM, Ebbesen JM, Engberg J, Frydendahl K, Gerner-Smidt P, Petersen AM,
Wegener HC. An Outbreak of multidrug-resistant, quinolone-resistant salmonella enterica serotypetyphimurium DT104. N Engl J Med 341:1420-1425 (1999).
Ney RA, Schnoor JL, Foster NSJ, Forkenbrock DJ, Iowa greenhouse gas action plan. Iowa City, IA: Center forGlobal and Regional Environmental Research, University of Iowa (1996).
Smith KE, Besser JM, Hedberg CW, Leano FT, Bender JB, Wicklund JH, Johnson BP, Moore KA, Osterholm MT.Quinolone-resistant Campylobacter jejuni infections in Minnesota, 1992- 1998. Investigation Team. N EnglJ Med 340:1525-1532 (1999).
Tenover FC, Hughes JM. WHO Scientific Working Group on monitoring and management of bacterial resistanceto antimicrobial agents. Emerg Infect Dis 1:37 (1995).
Threlfall EJ, Frost JA, Ward LR, Rowe B. Increasing spectrum of resistance in multiresistant Salmonella typhimurium[letter]. Lancet 347:1053-1054 (1996).
White DG, Zhao S, Dusler R, Ayers S, Friedman S, Chen S, McDermott PF, McDermott S, Wagner DD, Meng J. Theisolation of antibiotic-resistant Salmonella from retail ground meats. N Eng J Med 345(19):1147-1154(2001).
Witte W. Medical consequences of antibiotic use in agriculture. Science 279:996-997 (1998).World Health Organization. Overcoming antimicrobial resistance. WHO/CDS/2000.2 (2000).Wright W, Flora CB, Kremer KS, Goudy W, Hinrichs C, Lasley P, Maney A, Kroma M, Brown H, Pigg K, Durgan B,
Coleman J, Elias Morse D. Technical work paper on social and community impacts. Prepared for theGeneric Environmental Impact Statement on Animal Agriculture and the Minnesota Environmental Qual-ity Board (2001).
Zahn, JA, Anhalt J, Boyd E. Evidence for transfer of tylosin and tylosin-resistant bacteria in air from swine produc-tion facilities using sub-therapeutic concentrations of tylan in feed. J Anim Sci 79, Suppl. 1:189 (2001).
18
Chapter 2. Industry Structure and Trends in Iowa
Stewart Melvin Professor, Department of Agricultural and Biosystems Engineering
Iowa State University
John Mabry Professor, Department of Animal Science and Director
Iowa Pork Industry Center
Wendy Powers Assistant Professor, Department of Animal Science
Iowa State University
James Kliebenstein Professor, Department of Economics
Iowa State University
Kelley Donham Professor, Department of Occupational and Environmental Health
University of Iowa
Carol Hodne Postdoctoral Research Fellow
Environmental Health Sciences Research Institute University of Iowa

19
Abstract
Animal production trends in the United States and Iowa are reviewed to illustrate the changes in the animal industry over the past 50 years. Total production from the major industries are presented along with the changes in numbers of producers and average size of production units. Rapid consolidation of the industry is evident in both poultry and swine production systems in Iowa. Cattle numbers continue to decrease in the state.
20
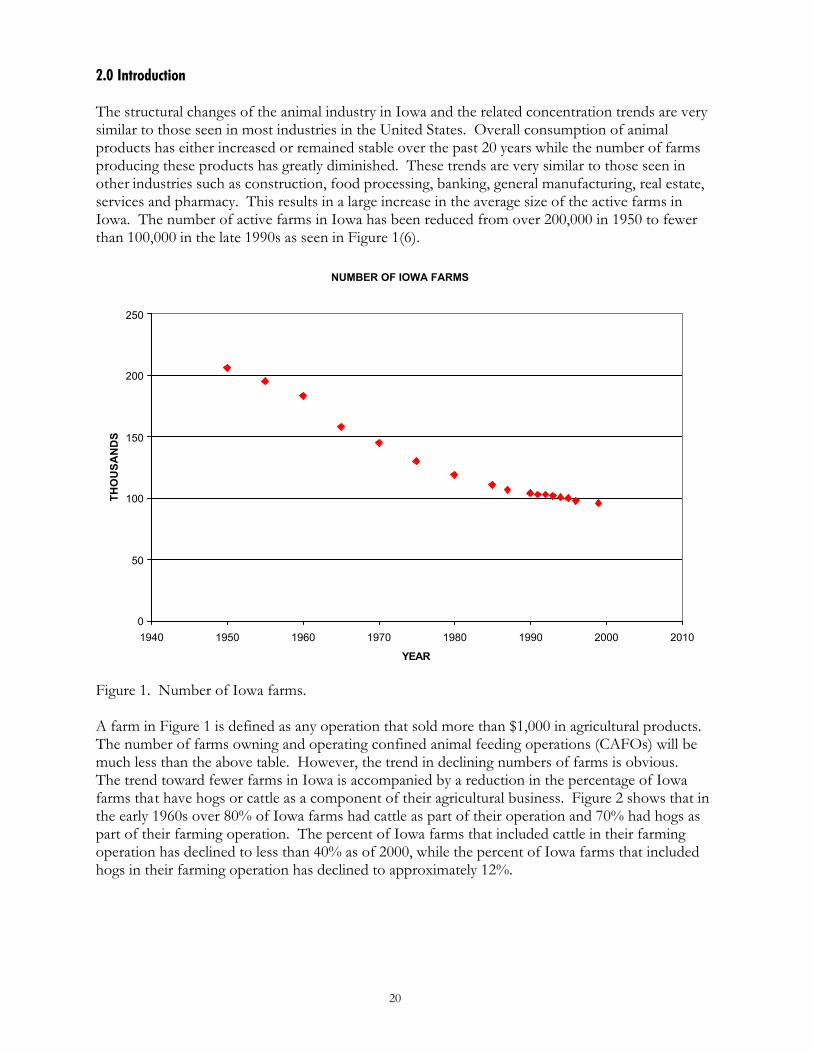
2.0 Introduction The structural changes of the animal industry in Iowa and the related concentration trends are very similar to those seen in most industries in the United States. Overall consumption of animal products has either increased or remained stable over the past 20 years while the number of farms producing these products has greatly diminished. These trends are very similar to those seen in other industries such as construction, food processing, banking, general manufacturing, real estate, services and pharmacy. This results in a large increase in the average size of the active farms in Iowa. The number of active farms in Iowa has been reduced from over 200,000 in 1950 to fewer than 100,000 in the late 1990s as seen in Figure 1(6).
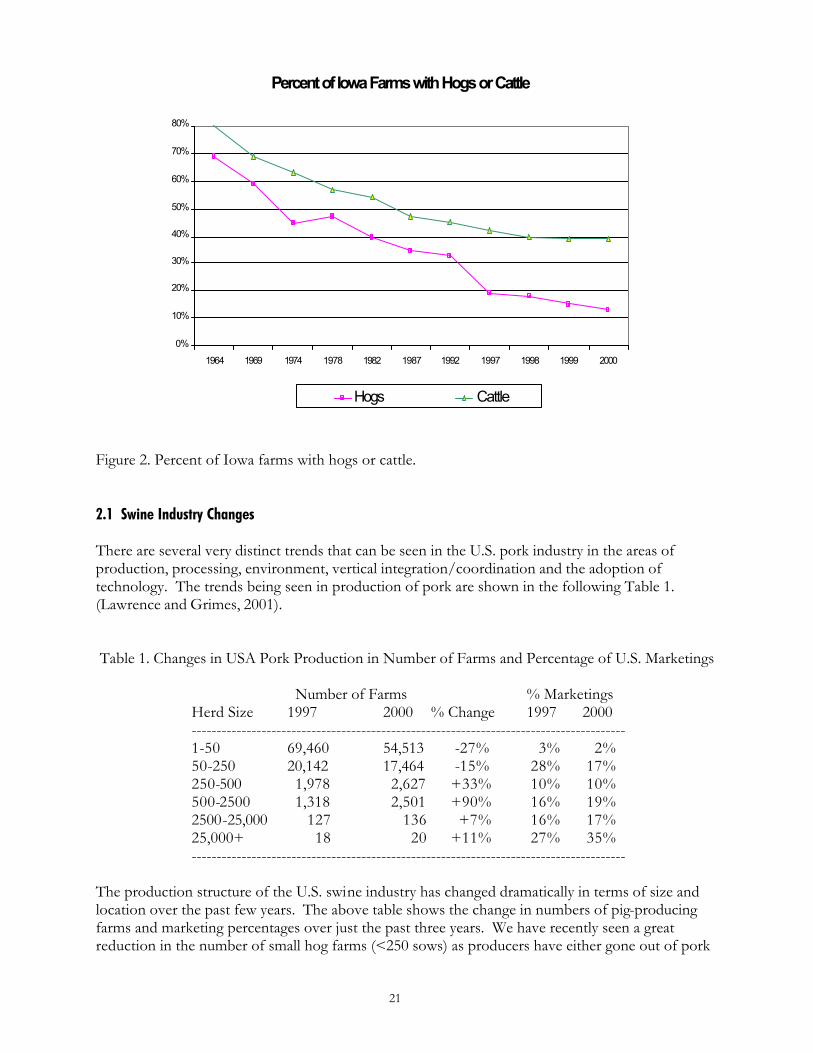
Figure 1. Number of Iowa farms. A farm in Figure 1 is defined as any operation that sold more than $1,000 in agricultural products. The number of farms owning and operating confined animal feeding operations (CAFOs) will be much less than the above table. However, the trend in declining numbers of farms is obvious. The trend toward fewer farms in Iowa is accompanied by a reduction in the percentage of Iowa farms that have hogs or cattle as a component of their agricultural business. Figure 2 shows that in the early 1960s over 80% of Iowa farms had cattle as part of their operation and 70% had hogs as part of their farming operation. The percent of Iowa farms that included cattle in their farming operation has declined to less than 40% as of 2000, while the percent of Iowa farms that included hogs in their farming operation has declined to approximately 12%.
NUMBER OF IOWA FARMS
0
50
100
150
200
250
1940 1950 1960 1970 1980 1990 2000 2010
YEAR
TH
OU
SA
ND
S
21
Figure 2. Percent of Iowa farms with hogs or cattle. 2.1 Swine Industry Changes There are several very distinct trends that can be seen in the U.S. pork industry in the areas of production, processing, environment, vertical integration/coordination and the adoption of technology. The trends being seen in production of pork are shown in the following Table 1. (Lawrence and Grimes, 2001). Table 1. Changes in USA Pork Production in Number of Farms and Percentage of U.S. Marketings
Number of Farms % Marketings Herd Size 1997 2000 % Change 1997 2000 --------------------------------------------------------------------------------------- 1-50 69,460 54,513 -27% 3% 2% 50-250 20,142 17,464 -15% 28% 17% 250-500 1,978 2,627 +33% 10% 10% 500-2500 1,318 2,501 +90% 16% 19% 2500-25,000 127 136 +7% 16% 17% 25,000+ 18 20 +11% 27% 35% ---------------------------------------------------------------------------------------
The production structure of the U.S. swine industry has changed dramatically in terms of size and location over the past few years. The above table shows the change in numbers of pig-producing farms and marketing percentages over just the past three years. We have recently seen a great reduction in the number of small hog farms (<250 sows) as producers have either gone out of pork
Percent of Iowa Farms with Hogs or Cattle
0%
10%
20%
30%
40%
50%
60%
70%
80%
1964 1969 1974 1978 1982 1987 1992 1997 1998 1999 2000
Hogs Cattle
22
production or have increased their herd size to function under the new terms of commodity pork production. The percentage of pigs marketed by this small producer type has decreased from 31% of all pigs marketed in 1997 to only 19% of pigs marketed in 2000. This dropout from production of the smaller farms has been largely picked up by expansion within the corporate pig production segment (greater than 25,000 sows) as the percent of marketing accounted for by this segment has grown by 8%. The mid-level swine production segment has picked up the rest of the fallout from the small producer. Interestingly, the increase in farm numbers (at 250+ sows) coincides with the minimum farm size to implement a weekly farrowing schedule, one of the most basic management technologies. And the herd size that has seen the greatest increase in size (500+ sows) coincides with the minimum herd size needed to market pigs in lot sizes that fit semi-trailer delivery, the most preferred method of delivery by packers (7). One reason for the increased herd sizes is the greater potential for profit. The following table shows the profitability by herd size recently reported in the United States by Lawrence and Grimes (2001). Table 2. Profitability by herd size (number of sows) in the U.S. (2000). Herd Size Net Profit Breakeven Net Loss ---------------------------------------------------------------------------------------------------- 1-50 50% 30% 20% 50-250 70% 20% 10% 250-500 78% 13% 9% 500-2500 77% 12% 11% 2500-25,000 90% 5% 5% 25,000+ 95% 5% 0% ---------------------------------------------------------------------------------------------------- This table shows the percentage of farms that reported a profit for the year 2000. It is clear that a higher percentage of smaller farms were in the breakeven or net loss return categories when compared to larger farms. The reasons for this are many, but do include those mentioned earlier. Very simply, larger farms are more consistently making a profit when compared to smaller farms.
23
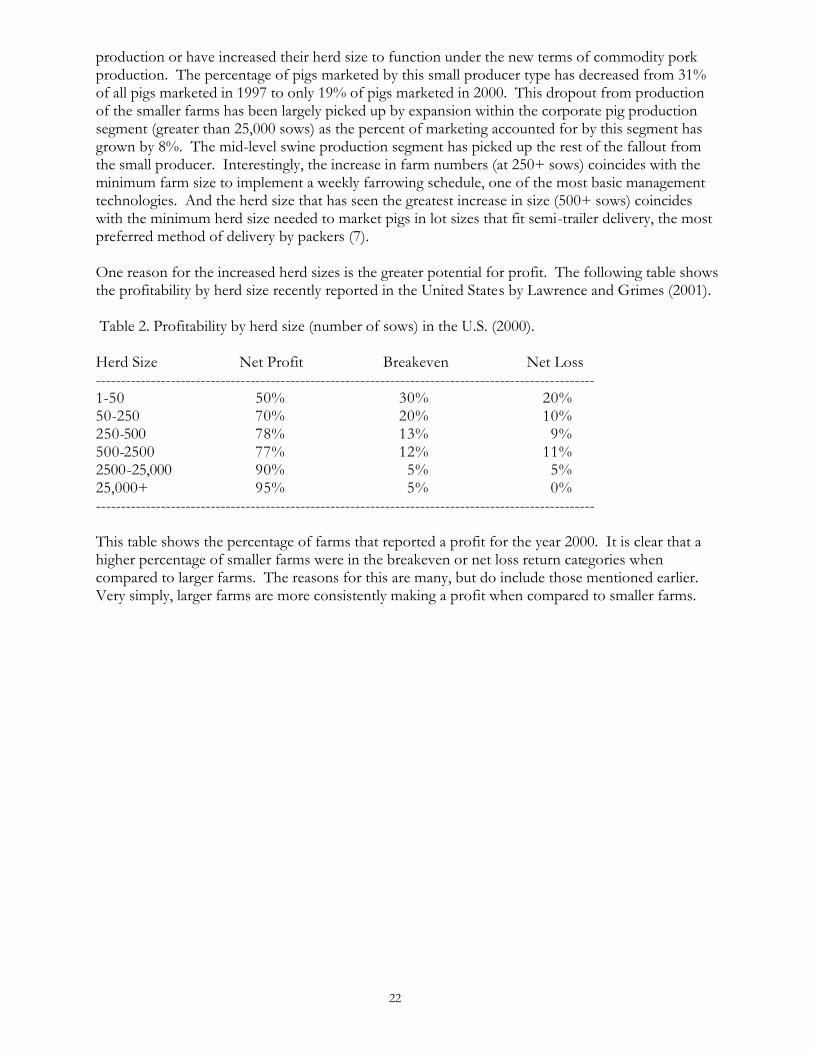
Figure 3 shows the number of swine in Iowa has stayed fairly constant in the past 20 years. However, while the numbers of pigs in Iowa have been somewhat stable, the proportion of hogs that are breeding sows versus market swine has changed markedly, as shown in Figures 4 and 5.
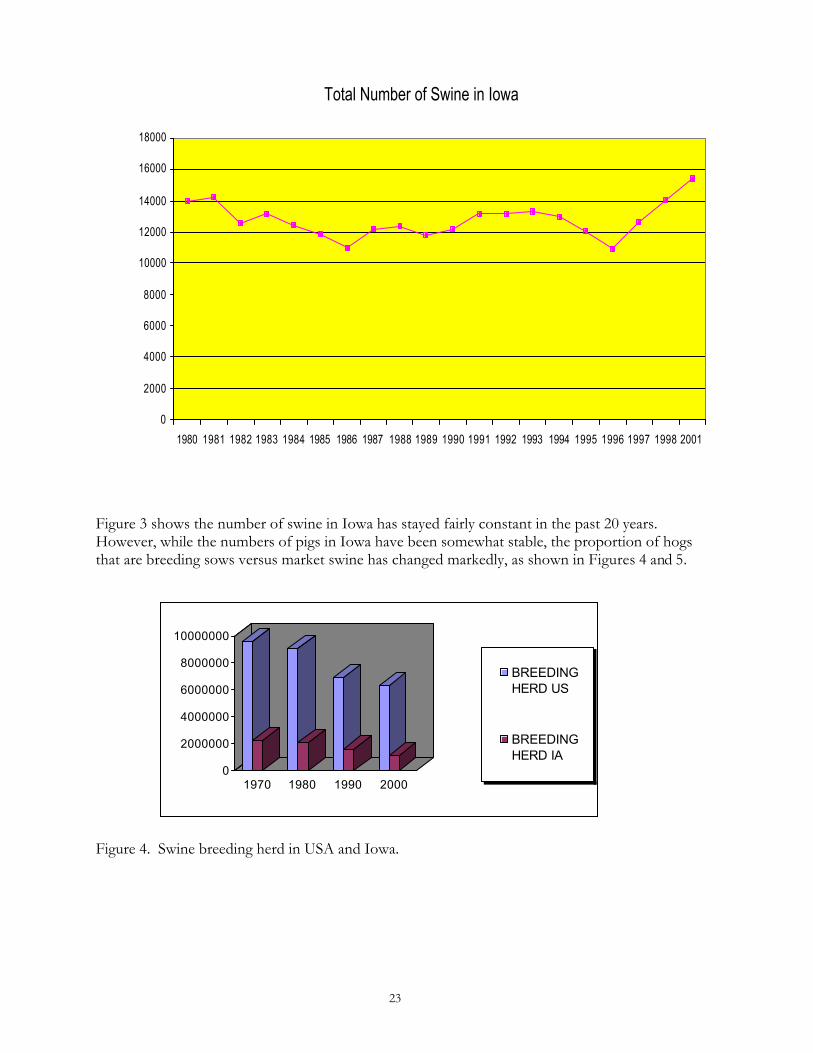
Figure 4. Swine breeding herd in USA and Iowa.
Total Number of Swine in Iowa
0
2000
4000
6000
8000
10000
12000
14000
16000
18000
1980 1981 1982 1983 1984 1985 1986 1987 1988 1989 1990 1991 1992 1993 1994 1995 1996 1997 1998 2001
0
2000000
4000000
6000000
8000000
10000000
1970 1980 1990 2000
BREEDINGHERD US
BREEDINGHERD IA
24
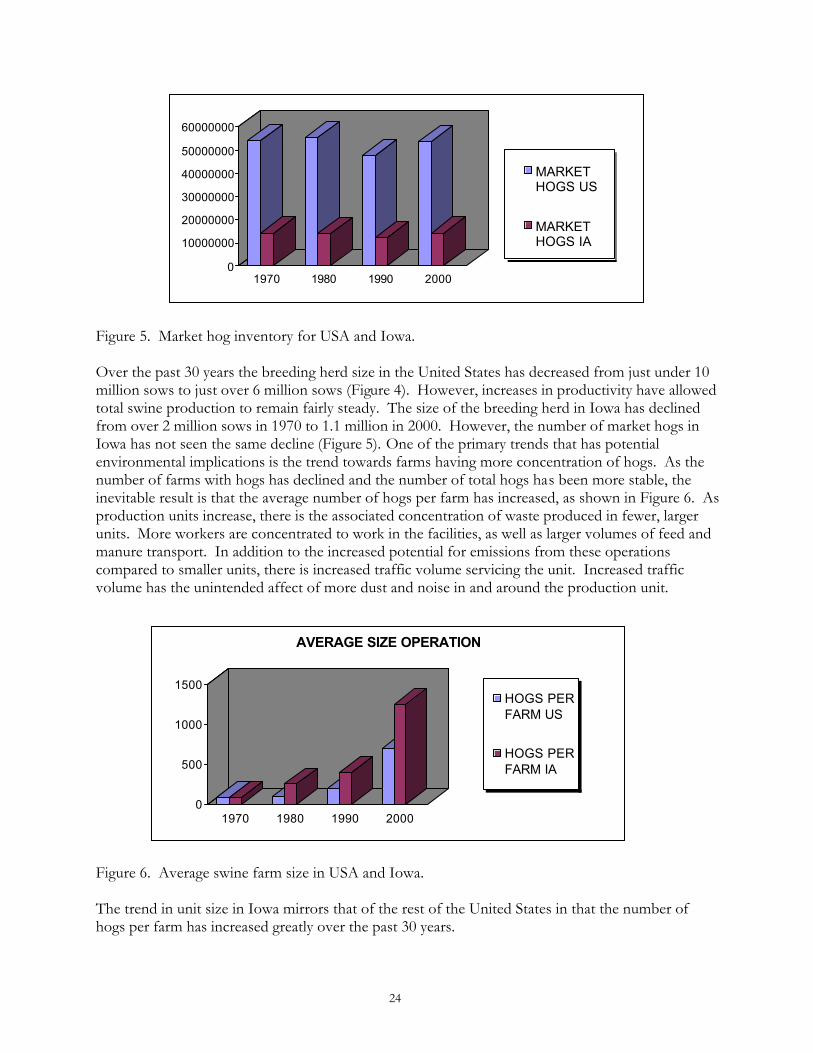
Figure 5. Market hog inventory for USA and Iowa. Over the past 30 years the breeding herd size in the United States has decreased from just under 10 million sows to just over 6 million sows (Figure 4). However, increases in productivity have allowed total swine production to remain fairly steady. The size of the breeding herd in Iowa has declined from over 2 million sows in 1970 to 1.1 million in 2000. However, the number of market hogs in Iowa has not seen the same decline (Figure 5). One of the primary trends that has potential environmental implications is the trend towards farms having more concentration of hogs. As the number of farms with hogs has declined and the number of total hogs has been more stable, the inevitable result is that the average number of hogs per farm has increased, as shown in Figure 6. As production units increase, there is the associated concentration of waste produced in fewer, larger units. More workers are concentrated to work in the facilities, as well as larger volumes of feed and manure transport. In addition to the increased potential for emissions from these operations compared to smaller units, there is increased traffic volume servicing the unit. Increased traffic volume has the unintended affect of more dust and noise in and around the production unit.
Figure 6. Average swine farm size in USA and Iowa. The trend in unit size in Iowa mirrors that of the rest of the United States in that the number of hogs per farm has increased greatly over the past 30 years.
0
10000000
20000000
30000000
40000000
50000000
60000000
1970 1980 1990 2000
MARKETHOGS US
MARKETHOGS IA
0
500
1000
1500
1970 1980 1990 2000
AVERAGE SIZE OPERATION
HOGS PERFARM US
HOGS PERFARM IA
25
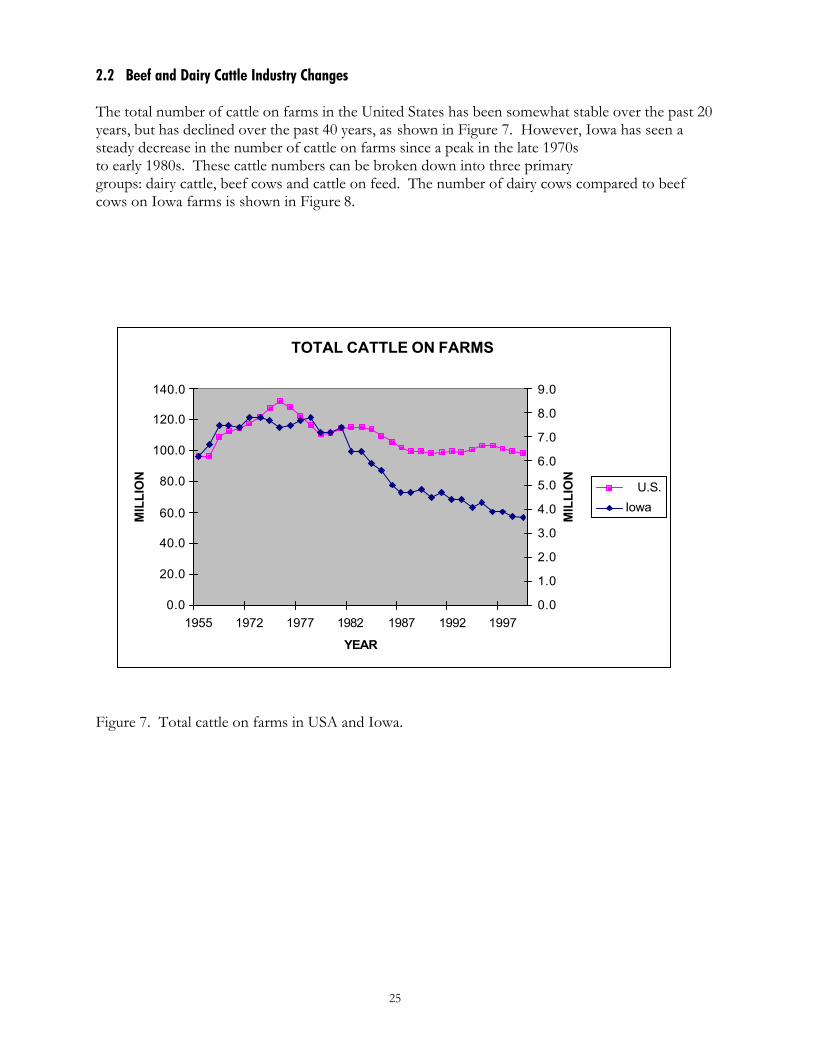
2.2 Beef and Dairy Cattle Industry Changes The total number of cattle on farms in the United States has been somewhat stable over the past 20 years, but has declined over the past 40 years, as shown in Figure 7. However, Iowa has seen a steady decrease in the number of cattle on farms since a peak in the late 1970s to early 1980s. These cattle numbers can be broken down into three primary groups: dairy cattle, beef cows and cattle on feed. The number of dairy cows compared to beef cows on Iowa farms is shown in Figure 8. Figure 7. Total cattle on farms in USA and Iowa.
TOTAL CATTLE ON FARMS
0.0
20.0
40.0
60.0
80.0
100.0
120.0
140.0
1955 1972 1977 1982 1987 1992 1997
YEAR
MIL
LIO
N
0.0
1.0
2.0
3.0
4.0
5.0
6.0
7.0
8.0
9.0
MIL
LIO
N
U.S.
Iowa
26
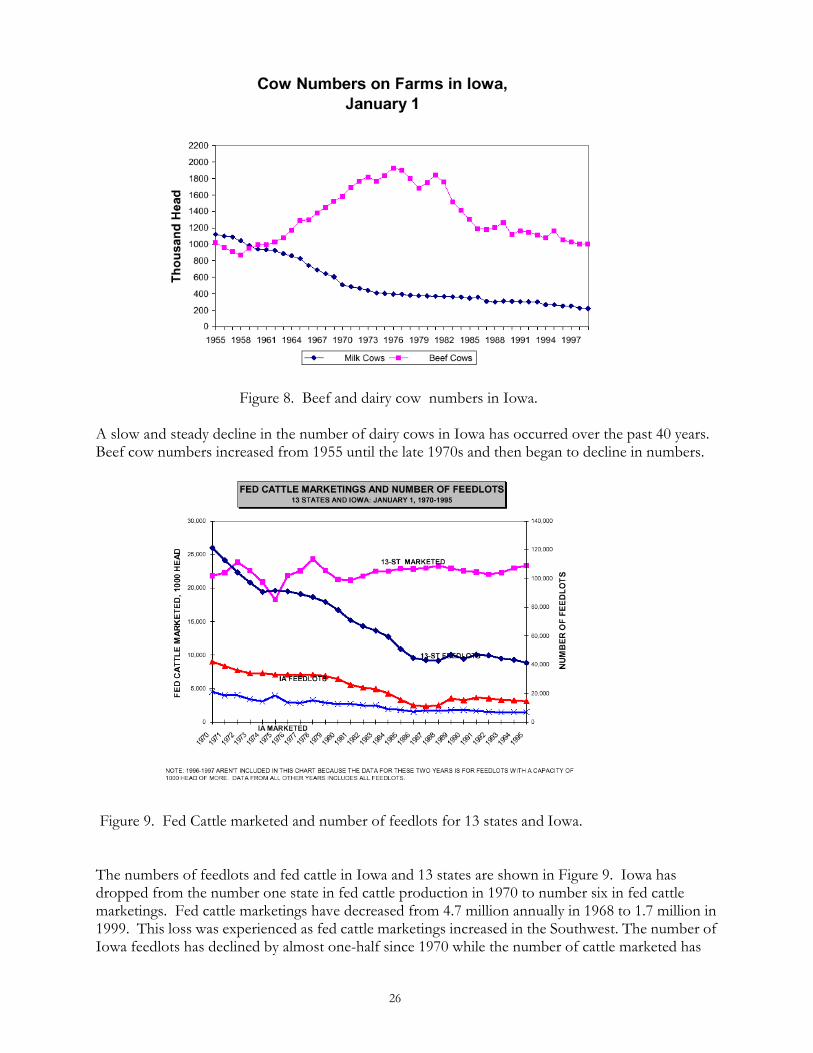
Figure 8. Beef and dairy cow numbers in Iowa. A slow and steady decline in the number of dairy cows in Iowa has occurred over the past 40 years. Beef cow numbers increased from 1955 until the late 1970s and then began to decline in numbers.
Figure 9. Fed Cattle marketed and number of feedlots for 13 states and Iowa. The numbers of feedlots and fed cattle in Iowa and 13 states are shown in Figure 9. Iowa has dropped from the number one state in fed cattle production in 1970 to number six in fed cattle marketings. Fed cattle marketings have decreased from 4.7 million annually in 1968 to 1.7 million in 1999. This loss was experienced as fed cattle marketings increased in the Southwest. The number of Iowa feedlots has declined by almost one-half since 1970 while the number of cattle marketed has
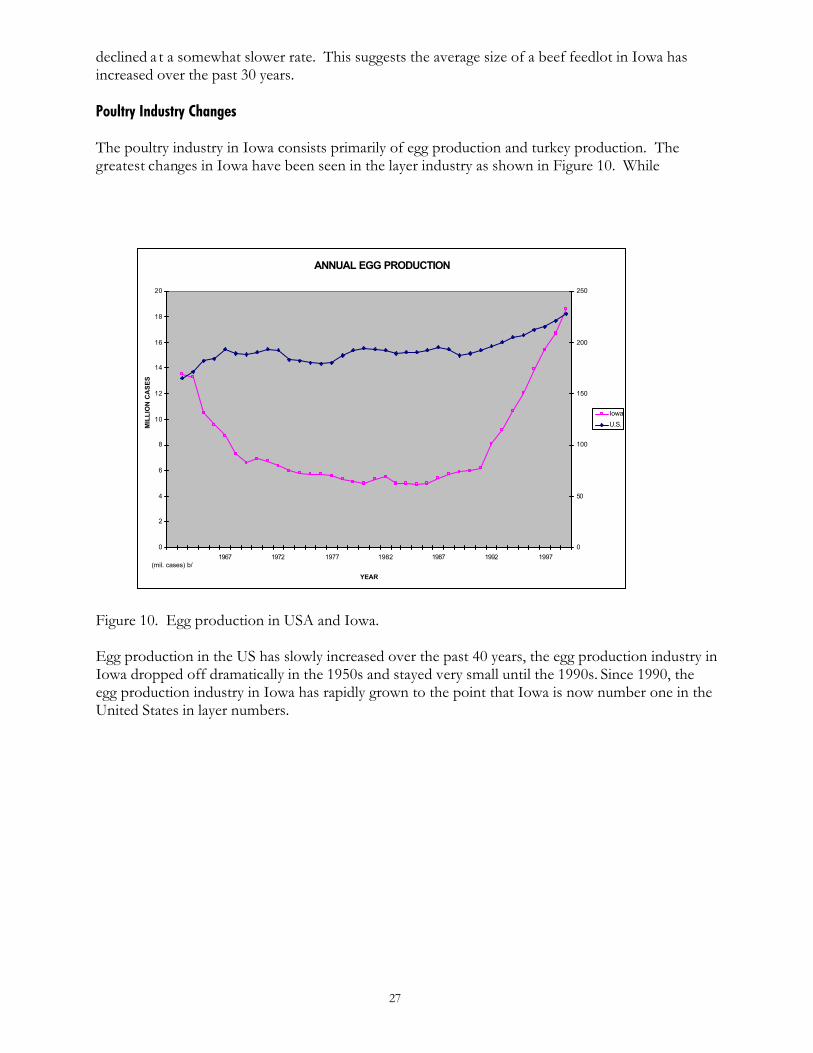
27
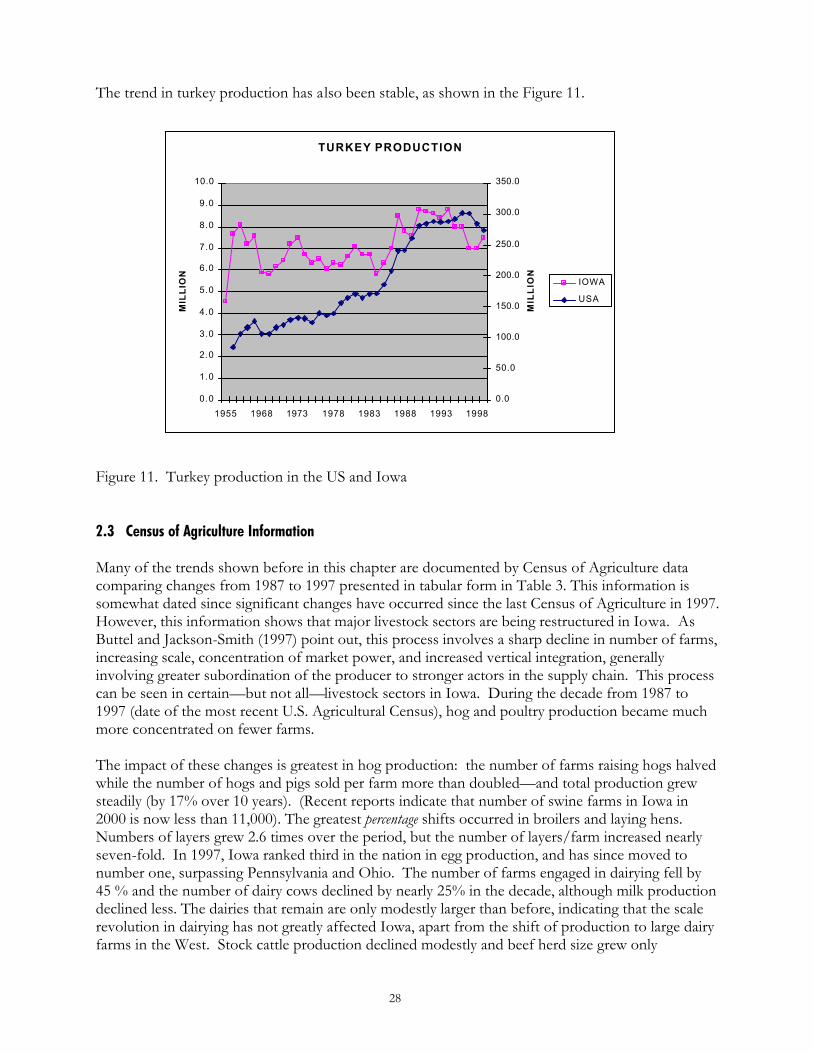
declined a t a somewhat slower rate. This suggests the average size of a beef feedlot in Iowa has increased over the past 30 years. Poultry Industry Changes The poultry industry in Iowa consists primarily of egg production and turkey production. The greatest changes in Iowa have been seen in the layer industry as shown in Figure 10. While
Figure 10. Egg production in USA and Iowa. Egg production in the US has slowly increased over the past 40 years, the egg production industry in Iowa dropped off dramatically in the 1950s and stayed very small until the 1990s. Since 1990, the egg production industry in Iowa has rapidly grown to the point that Iowa is now number one in the United States in layer numbers.
ANNUAL EGG PRODUCTION
0
2
4
6
8
10
12
14
16
18
20
(mil. cases) b/
1967 1972 1977 1982 1987 1992 1997
YEAR
MIL
LIO
N C
AS
ES
0
50
100
150
200
250
Iowa
U.S.
28
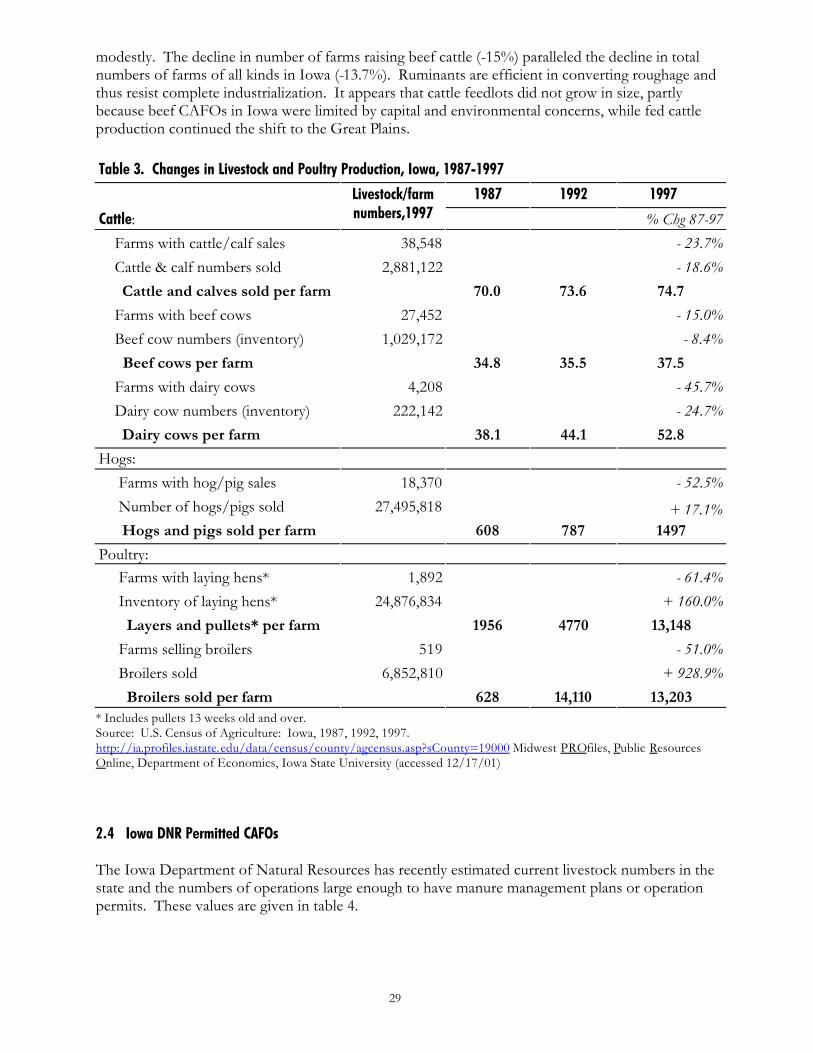
The trend in turkey production has also been stable, as shown in the Figure 11.
Figure 11. Turkey production in the US and Iowa 2.3 Census of Agriculture Information Many of the trends shown before in this chapter are documented by Census of Agriculture data comparing changes from 1987 to 1997 presented in tabular form in Table 3. This information is somewhat dated since significant changes have occurred since the last Census of Agriculture in 1997. However, this information shows that major livestock sectors are being restructured in Iowa. As Buttel and Jackson-Smith (1997) point out, this process involves a sharp decline in number of farms, increasing scale, concentration of market power, and increased vertical integration, generally involving greater subordination of the producer to stronger actors in the supply chain. This process can be seen in certain—but not all—livestock sectors in Iowa. During the decade from 1987 to 1997 (date of the most recent U.S. Agricultural Census), hog and poultry production became much more concentrated on fewer farms. The impact of these changes is greatest in hog production: the number of farms raising hogs halved while the number of hogs and pigs sold per farm more than doubled—and total production grew steadily (by 17% over 10 years). (Recent reports indicate that number of swine farms in Iowa in 2000 is now less than 11,000). The greatest percentage shifts occurred in broilers and laying hens. Numbers of layers grew 2.6 times over the period, but the number of layers/farm increased nearly seven-fold. In 1997, Iowa ranked third in the nation in egg production, and has since moved to number one, surpassing Pennsylvania and Ohio. The number of farms engaged in dairying fell by 45 % and the number of dairy cows declined by nearly 25% in the decade, although milk production declined less. The dairies that remain are only modestly larger than before, indicating that the scale revolution in dairying has not greatly affected Iowa, apart from the shift of production to large dairy farms in the West. Stock cattle production declined modestly and beef herd size grew only
TURKEY PRODUCTION
0.0
1.0
2.0
3.0
4.0
5.0
6.0
7.0
8.0
9.0
10.0
1955 1968 1973 1978 1983 1988 1993 1998
MIL
LIO
N
0.0
50.0
100.0
150.0
200.0
250.0
300.0
350.0
MIL
LIO
N
IOWA
USA
29
modestly. The decline in number of farms raising beef cattle (-15%) paralleled the decline in total numbers of farms of all kinds in Iowa (-13.7%). Ruminants are efficient in converting roughage and thus resist complete industrialization. It appears that cattle feedlots did not grow in size, partly because beef CAFOs in Iowa were limited by capital and environmental concerns, while fed cattle production continued the shift to the Great Plains. Table 3. Changes in Livestock and Poultry Production, Iowa, 1987-1997 1987 1992 1997
Cattle: Livestock/farm numbers,1997 % Chg 87-97
Farms with cattle/calf sales 38,548 - 23.7% Cattle & calf numbers sold 2,881,122 - 18.6% Cattle and calves sold per farm 70.0 73.6 74.7 Farms with beef cows 27,452 - 15.0% Beef cow numbers (inventory) 1,029,172 - 8.4% Beef cows per farm 34.8 35.5 37.5 Farms with dairy cows 4,208 - 45.7% Dairy cow numbers (inventory) 222,142 - 24.7% Dairy cows per farm 38.1 44.1 52.8 Hogs: Farms with hog/pig sales 18,370 - 52.5% Number of hogs/pigs sold 27,495,818 + 17.1% Hogs and pigs sold per farm 608 787 1497 Poultry: Farms with laying hens* 1,892 - 61.4% Inventory of laying hens* 24,876,834 + 160.0% Layers and pullets* per farm 1956 4770 13,148 Farms selling broilers 519 - 51.0% Broilers sold 6,852,810 + 928.9% Broilers sold per farm 628 14,110 13,203 * Includes pullets 13 weeks old and over. Source: U.S. Census of Agriculture: Iowa, 1987, 1992, 1997. http://ia.profiles.iastate.edu/data/census/county/agcensus.asp?sCounty=19000 Midwest PROfiles, Public Resources Online, Department of Economics, Iowa State University (accessed 12/17/01) 2.4 Iowa DNR Permitted CAFOs The Iowa Department of Natural Resources has recently estimated current livestock numbers in the state and the numbers of operations large enough to have manure management plans or operation permits. These values are given in table 4.
30
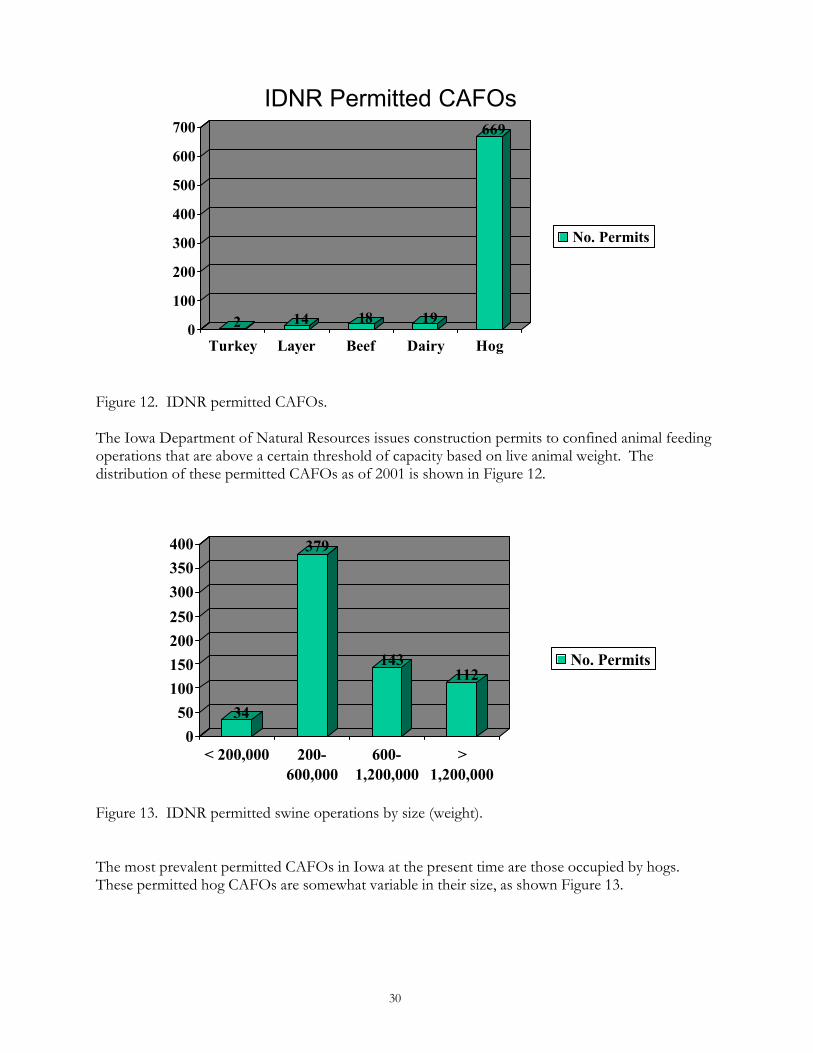
Figure 12. IDNR permitted CAFOs. The Iowa Department of Natural Resources issues construction permits to confined animal feeding operations that are above a certain threshold of capacity based on live animal weight. The distribution of these permitted CAFOs as of 2001 is shown in Figure 12.
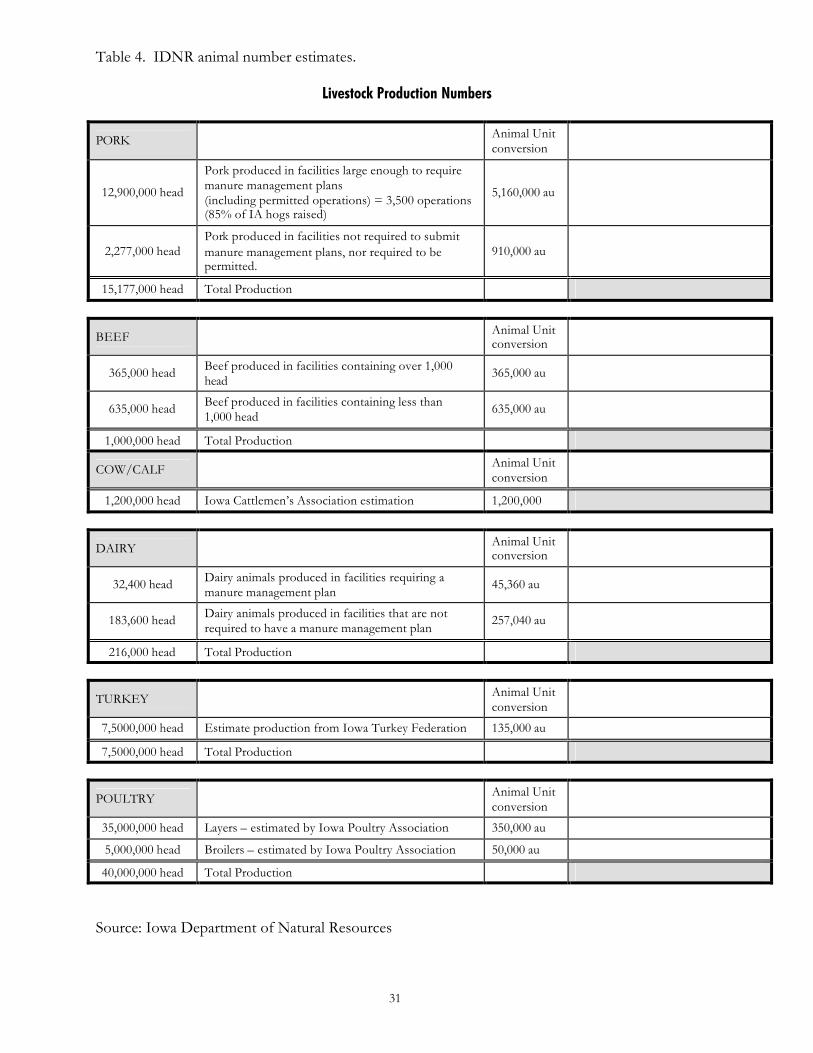
Figure 13. IDNR permitted swine operations by size (weight). The most prevalent permitted CAFOs in Iowa at the present time are those occupied by hogs. These permitted hog CAFOs are somewhat variable in their size, as shown Figure 13.
IDNR Permitted CAFOs
2 14 18 19
669
0
100
200
300
400
500
600
700
Turkey Layer Beef Dairy Hog
No. Permits
34
379
143112
050
100150200250
300350400
< 200,000 200-600,000
600-1,200,000
>1,200,000
No. Permits
31
Table 4. IDNR animal number estimates.
Livestock Production Numbers
PORK Animal Unit conversion
12,900,000 head
Pork produced in facilities large enough to require manure management plans (including permitted operations) = 3,500 operations (85% of IA hogs raised)
5,160,000 au
2,277,000 head Pork produced in facilities not required to submit manure management plans, nor required to be permitted.
910,000 au
15,177,000 head Total Production
BEEF Animal Unit conversion
365,000 head Beef produced in facilities containing over 1,000 head 365,000 au
635,000 head Beef produced in facilities containing less than 1,000 head 635,000 au
1,000,000 head Total Production
COW/CALF Animal Unit conversion
1,200,000 head Iowa Cattlemen’s Association estimation 1,200,000
DAIRY Animal Unit conversion
32,400 head Dairy animals produced in facilities requiring a manure management plan 45,360 au
183,600 head Dairy animals produced in facilities that are not required to have a manure management plan 257,040 au
216,000 head Total Production
TURKEY Animal Unit conversion
7,5000,000 head Estimate production from Iowa Turkey Federation 135,000 au
7,5000,000 head Total Production
POULTRY Animal Unit conversion
35,000,000 head Layers – estimated by Iowa Poultry Association 350,000 au
5,000,000 head Broilers – estimated by Iowa Poultry Association 50,000 au
40,000,000 head Total Production
Source: Iowa Department of Natural Resources
32
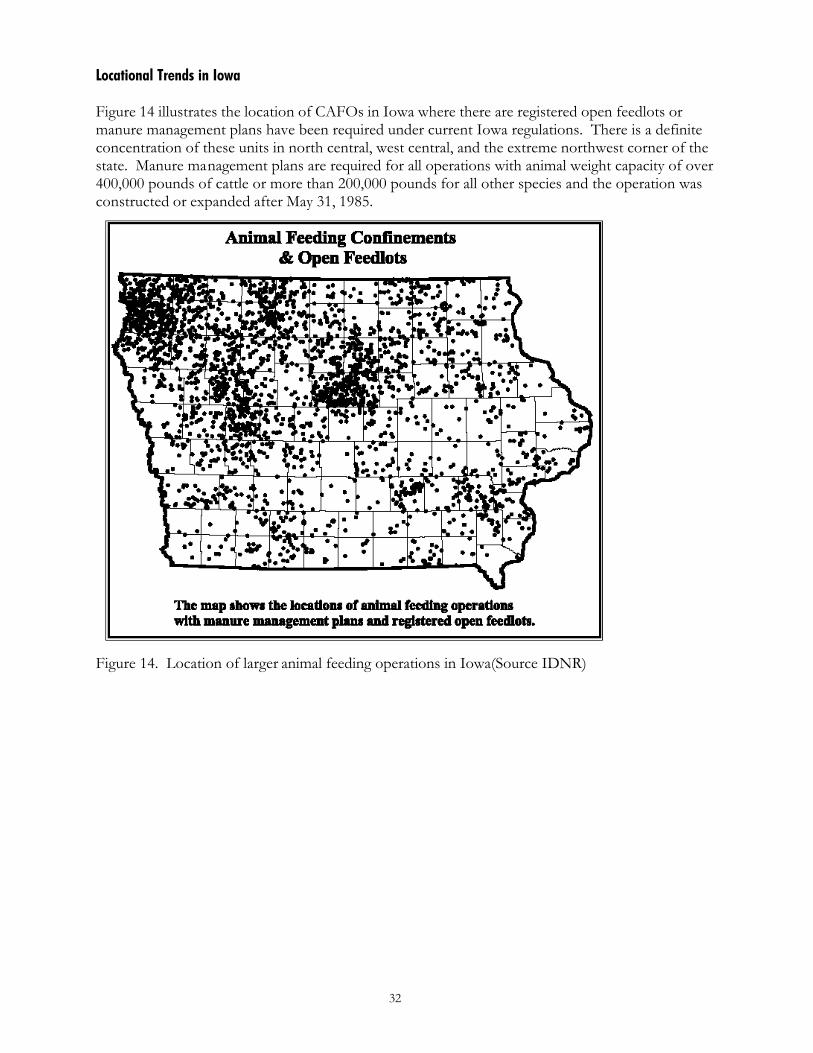
Locational Trends in Iowa Figure 14 illustrates the location of CAFOs in Iowa where there are registered open feedlots or manure management plans have been required under current Iowa regulations. There is a definite concentration of these units in north central, west central, and the extreme northwest corner of the state. Manure management plans are required for all operations with animal weight capacity of over 400,000 pounds of cattle or more than 200,000 pounds for all other species and the operation was constructed or expanded after May 31, 1985.
Figure 14. Location of larger animal feeding operations in Iowa(Source IDNR)
33
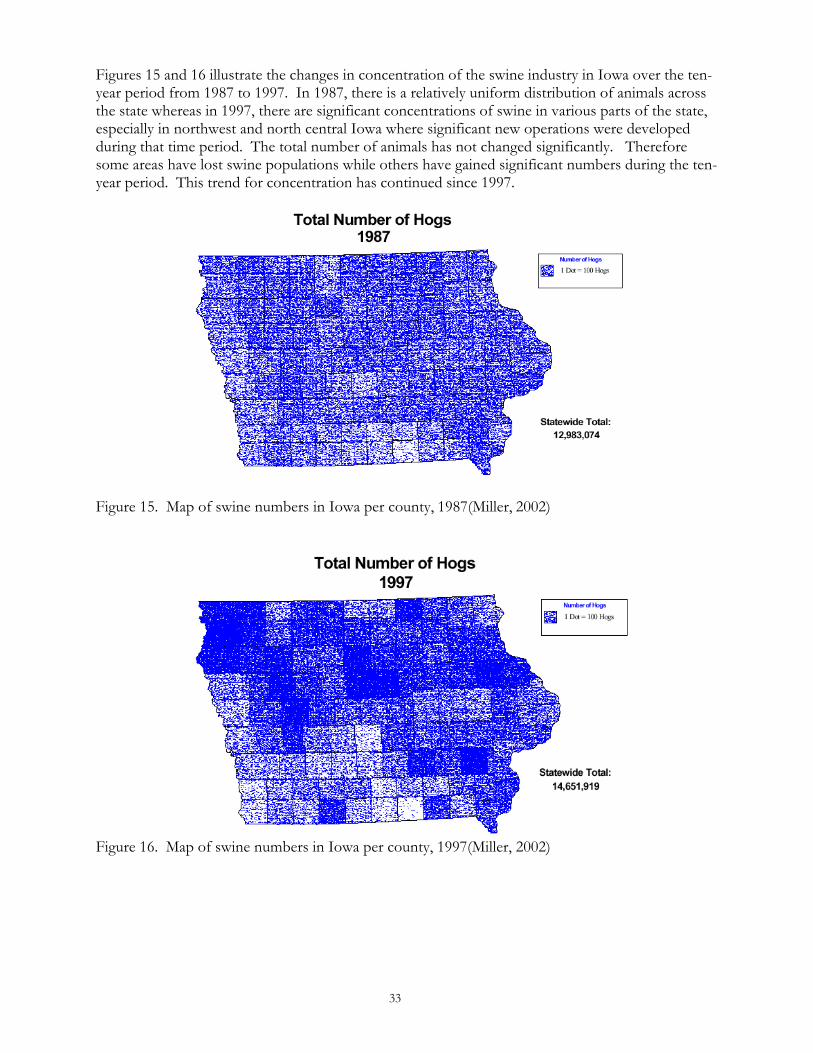
Figures 15 and 16 illustrate the changes in concentration of the swine industry in Iowa over the ten-year period from 1987 to 1997. In 1987, there is a relatively uniform distribution of animals across the state whereas in 1997, there are significant concentrations of swine in various parts of the state, especially in northwest and north central Iowa where significant new operations were developed during that time period. The total number of animals has not changed significantly. Therefore some areas have lost swine populations while others have gained significant numbers during the ten-year period. This trend for concentration has continued since 1997.
Figure 15. Map of swine numbers in Iowa per county, 1987(Miller, 2002)
Figure 16. Map of swine numbers in Iowa per county, 1997(Miller, 2002)
34
Conclusions It is obvious that animal agriculture in the United States and in Iowa has changed over the past years and will continue to change. There is an increased awareness of environmental and other problems associated with current production systems. This awareness is leading to a rethinking of our current approach to animal production. Changing consumer preferences and lifestyles offer new options and alternatives for animal production. Policies are needed to protect both producer and consumer from being adversely affected. Many forces impact the livestock industry. The bottom line is that profitability and sustainability are needed. Over time the industry had fewer and larger farms with a higher level of specialization. Access to information is becoming more vital for effective management decisions such as technology adoption. These decisions can be odor management or a host of other production/management issues. Collaborative efforts are increasing. These efforts involve all industry stakeholders, input suppliers, producers, processors, retailers, and policy makers. Information access is increasingly important and cuts across all stakeholders. Among other issues it aids in establishing workable and effective policy decisions. Animal production is an important part of the Iowa economy but this production needs to be conducted in environmentally sound and sustainable systems to provide the best quality product to consumers while protecting the environment. Iowa can and should remain a leader in production of high quality, environmentally sound animal products. Odors and emissions from CAFOs have been of concern in Iowa for many years. However, the concentration of animals into larger, more concentrated units has increased the visibility of the potential problems resulting from these major structural changes. The remainder of this report addresses the potential community health impacts of CAFOs. References
1. Buttel, F. H., & Jackson-Smith, D. B. (1997). Livestock expansion in Wisconsin: Farmers’ views on the benefits and costs of large-scale livestock production. PATS Research Report #2. Madison, WI: University of Wisconsin.
2. Duffy, Michael. 2001. Agricultural Economist. Personal Communication. December. 3. http://www.econ.iastate.edu/faculty/lawrence/Acrobat/Staffppr343FNL.pdf 4. http://www.econ.iastate.edu/faculty/lawrence/BeefStat/frames.html 5. http://www.econ.iastate.edu/faculty/lawrence/PorkStat/porkstat.htm 6. http://www.econ.iastate.edu/outreach/agriculture/periodicals/chartbook/Chartbook2/frames.html 7. Lawrence, John D. and Glenn Grimes. 2001. Production and marketing characteristics of U.S. pork producers,
2000. Staff Paper No. 343. Department of Agricultural Economics, Iowa State University. August 2001. 8. Maybry, John. 2001.Pork Industry Center Director. Personal Communication. December. 9. Miller, Gerald. 2002. Personal Communication. January.
35
Chapter 3.0 Air Quality Issues
Peter S. Thorne, Ph.D. Professor, Department of Occupational and Environmental Health
The University of Iowa This chapter will describe the agents that emanate from livestock facilities, waste storages and manure application sites associated with livestock production. This will include those agents of concern within barns and air contaminants beyond the barn. These may be on the farm in the vicinity of CAFOs or off the farm at locations or in communities adjacent to CAFOs. This chapter will also briefly describe the measurement approaches and the sources of data for these compounds. The toxic properties of these agents, their emission rates and the concentrations at which they appear are presented in subsequent chapters. 3.1 Sources of data Air quality data for CAFOs are quite limited. There are relatively few monitoring programs for large-scale livestock production compared to other industries that are regulated. This is further complicated by the fact that the air emissions from CAFOs include a wide array of toxicants including gases, vapors, odoriferous compounds, particulates, and bioaerosols. There are no federally mandated monitoring programs in the United States and only a small number of states have instituted their own monitoring (see Chapter 9). Efforts to institute local controls have generally focused on siting, set backs and zoning rather than compliance with standards for hazardous air pollutants. In Europe, the situation is different. For instance, the Netherlands has established programs based on manure handling practices and for control of emissions from CAFOs. Initially these covered only intensive livestock producers, but now these regulations will extend to all farms. The European Union has issued a number of directives designed to limit emissions of ammonia, methane and odors. The majority of the monitoring and exposure data available has come from academic researchers interested in characterizing the emissions either for studies of occupational and community health or for studies to address emission rates and efficacy of control approaches. Recently, citizens and citizen groups have begun setting up their own hydrogen sulfide monitoring as a means to provide exposure data to the debate over CAFOs. The swine industry has not engaged in monitoring of air emissions in the United States except when required by court settlements or regulatory action. 3.2 Particulate Matter Particulate matter associated with CAFOs is composed of fecal matter, feed materials, skin cells, and the products of microbial action on feces and feed (Table 3-1). Components of feed include plant proteins, starches and carbohydrates; feed additives such as vitamins, minerals, amino acids and other supplements; and antibiotics. The most common approaches to measurement of particulate matter emissions are gravimetric sampling, nephelometry, or particle counting. •Gravimetric sampling is performed by pre-weighing specialized air sampling filters using a precision microbalance, sampling in the test environment by pulling a measured amount of air through the filter, and then post-weighing the filters and correcting the weight gain for the change in the blanks. This corrected weight change is then divided by the volume of air that was pulled through the filter
36
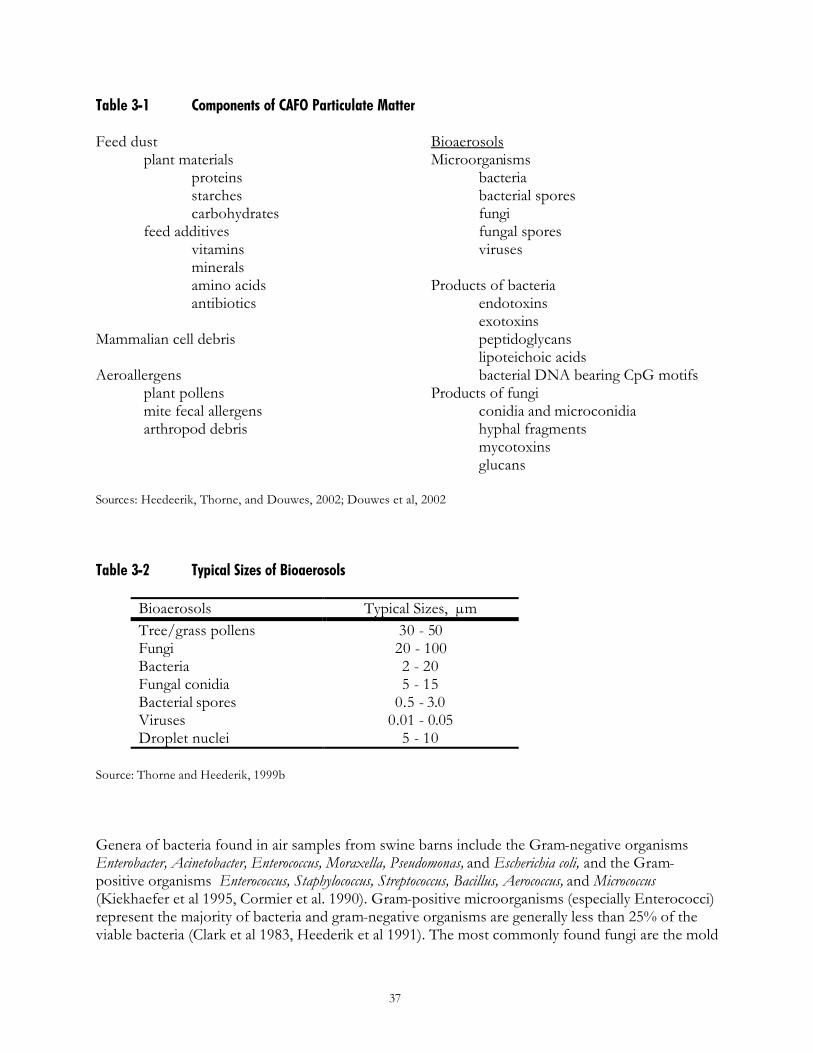
to determine the airborne dust concentration in mg per cubic meter of air. Different fractions of dust can be selectively sampled by changing the design of the air sampling device and the airflow rate through the device. When dust is inhaled by humans or animals, a higher proportion of small particles than large particles will travel deep into the lung and be deposited. Thus, environmental health professionals often choose to collect fractions of the total suspended particulates (TSP) to gain more insight into the potential for toxic effects on the lung. Two such categories of smaller fractions are the inhalable dust fraction (50% of particulate mass less than 100 micron [µm]) and the respirable dust fraction (50% of particulate mass less than 3.5 µm). These terms are widely applied in the occupational health literature. Environmental health specialists who study community ambient air pollution more commonly measure two other fractions of particulate matter. These are called PM10 and PM2.5. PM10 refers to particulate matter less than 10 µm in diameter and PM2.5 is less than 2.5 µm in diameter. In general, finer particulate fractions contain a higher proportion of anthropogenic dust and lower levels of wind blown soil and plant pollens. Since lung problems associated with CAFOs include airway disease, it is important to consider inhalable particulate fraction and PM10. While gravimetric sampling methods contribute the lion’s share of the data on particulate matter concentrations, light scattering and particle counting devices are important as well. These latter methods provide real-time monitoring data and size-specific particle counting necessary for understanding pulmonary deposition and lung burdens. Bioaerosols are a major component of the particulate matter from CAFOs. Bioaerosols are simply particles of biological origin that are suspended in air. These include bacteria, fungi, fungal and bacterial spores, viruses, mammalian cell debris, products of microorganisms, pollens, and aeroallergens (Table 3-1). Bacterial and fungal bioaerosols may be of infectious or non-infectious species. Bacterial products or components exist as bioaerosols and include endotoxins, exotoxins, peptidoglycans, lipoteichoic acids, and bacterial DNA bearing CpG motifs. Fungal products or components of note include conidia and microconidia, hyphal fragments, mycotoxins and glucans. Settings with very high bioaerosol concentrations include swine, poultry, and dairy confinement buildings; grain and feed mills, grain loading terminals, mushroom production facilities, composting facilities, and sawmills. Typical aerosol sizes for these bioaerosols in indicated in Table 3-2.
37
Table 3-1 Components of CAFO Particulate Matter Feed dust
plant materials proteins starches carbohydrates
feed additives vitamins minerals amino acids antibiotics
Mammalian cell debris Aeroallergens plant pollens mite fecal allergens arthropod debris
Bioaerosols Microorganisms
bacteria bacterial spores fungi fungal spores viruses
Products of bacteria endotoxins exotoxins peptidoglycans lipoteichoic acids bacterial DNA bearing CpG motifs
Products of fungi conidia and microconidia hyphal fragments mycotoxins glucans
Sources: Heedeerik, Thorne, and Douwes, 2002; Douwes et al, 2002 Table 3-2 Typical Sizes of Bioaerosols
Bioaerosols Typical Sizes, µm Tree/grass pollens 30 - 50 Fungi 20 - 100 Bacteria 2 - 20 Fungal conidia 5 - 15 Bacterial spores 0.5 - 3.0 Viruses 0.01 - 0.05 Droplet nuclei 5 - 10
Source: Thorne and Heederik, 1999b Genera of bacteria found in air samples from swine barns include the Gram-negative organisms Enterobacter, Acinetobacter, Enterococcus, Moraxella, Pseudomonas, and Escherichia coli, and the Gram-positive organisms Enterococcus, Staphylococcus, Streptococcus, Bacillus, Aerococcus, and Micrococcus (Kiekhaefer et al 1995, Cormier et al. 1990). Gram-positive microorganisms (especially Enterococci) represent the majority of bacteria and gram-negative organisms are generally less than 25% of the viable bacteria (Clark et al 1983, Heederik et al 1991). The most commonly found fungi are the mold
38
genera Aspergillus, Scopulariopsis, Penicillium, Geotrichum, Mucor, and Fusarium. Yeasts found in swine environments include Candida, Cryptococcus, Toruopsis, Trichosporon, Rhodotorula, and Hansenula. However, variations in housing conditions and feed ingredients can impact the gastric flora of the animals. The concentrations of non-culturable aerobic and anaerobic organisms in the particulate matter in swine barns is known to be 10 to 100-fold higher than the culturable organisms (Lange et al 1997b, Heederik et al 2002). However, the bacterial genera represented in these bioaerosols have not been adequately studied. Much research has been conducted on methodology for assessment of bioaerosol concentrations in the agricultural environment. This body of work has been recently reviewed (Heederik et al 2002). Methods for assessment of culturable organisms rely on collecting bioaerosols using jet-to-agar samplers or using liquid impingers with dilution plating onto agar (Thorne and Heederik 1999a). Cultures are then allowed to grow in incubators and are enumerated to determine airborne concentrations. Individual colonies may be sub-cultured and identified. Impinger collection fluids may be cultured on a variety of media to quantify mesophilic bacteria, thermophilic bacteria, fungi and selective microbial groups (Thorne et al 1992, Kiekhaefer et al 1995, Cormier et al 1990, Lange et al 1997a, Kullman et al 1998). Since many of the airborne organisms are not culturable, it is necessary to employ non-culture based methods. These include use of direct count methods with DNA staining and epifluorescence microscopy, fluorescent in situ hybridization, and PCR techniques (Thorne et al 1992, Lange et al 1997b, Kullman et al 1998). Significant advances have arisen in the past few years in PCR-based techniques and these will advance the science of bioaerosol sampling in and around swine barns (Heederik et al 2002). Endotoxin is a lipopolysaccharide (LPS) component of the outer cell wall of Gram-negative bacteria. Since Gm- organisms are ubiquitous in the environment, so is endotoxin. Endotoxin is a potent inflammatory agent that produces systemic effects and lung obstruction, even at low levels of exposure. Livestock confinement units present some of the highest concentrations seen anywhere. The concentration of endotoxin is best determined from liquid impingers or air sampling filters (Duchaine et al 2001) and analyzed using the Limulus amebocyte lysate (LAL) assay (Thorne et al 1997, Douwes et al 1995). The LAL bioassay is based on the exquisite sensitivity of an enzymatic clotting cascade in amebocytes taken from the hemolymph of horseshoe crabs (Limulus polyphemus) and related species (Thorne 2000). Samples are typically extracted in sterile, pyrogen-free water with 0.05% Tween-20 with continuous shaking. Extracts are centrifuged and supernatants are analyzed using the kinetic chromogenic LAL assay. To provide the highest quality analysis, a twelve-point calibration curve of standard endotoxin from E. coli 0111:B4 and four-point endotoxin determination for samples is performed (Thorne 2000). Assay reagent blank wells serve as reference and control. Quality assurance spiking assays are performed to assess matrix interference or enhancement. A number of studies have demonstrated refinements for use of this assay for agricultural environments (Thorne et al 1997, Douwes et al 1995, Gordon et al 1992, Hollander et al 1993, Duchaine et al 2001). Four studies have reported comparisons of endotoxin assay between laboratories (Thorne et al 1997, Reynolds et al 2001, Chun et al 2000, Chun et al 2001). ? (1-3)-glucans are cell wall components of fungi that have been associated with lung inflammation, although at exposure levels well above the levels of endotoxin required for comparable effects (Roy et al 1999). Studies of the past five years have provided evidence that glucans may also be important immunomodulators (Rylander et al 1999, Fogelmark et al 1997). ß(1? 3)-glucans are glucose
39
polymers with variable molecular weight and degree of branching that may appear in triple helix, single helix or random coil structures (Williams 1994). ß(1? 3)-glucans originate from a variety of sources, including fungi, bacteria, and plants (Stone and Clarke 1992). They are water insoluble structural cell wall components of these organisms, but may also be found in extracellular secretions of microbial origin. Glucans may account for up to 60% of the dry weight of the cell wall of fungi, of which the major part is ß(1? 3)-glucan (Klis 1994). There are currently three principal methods in use for the assay of ? (1-3)-glucans (Heederik et al 2001). Two are based upon the bioactivity of this molecule in the factor G-mediated Limulus coagulation pathway. These methods are extremely expensive and not feasible for large field studies. A polyclonal antibody-based immunoassay for ? (1-3)-glucans that is totally independent of the horseshoe crab hemolymph has also been developed (Douwes et al 1996). One laboratory in the Unites States has recently produced several monoclonal antibodies for glucans directed specifically against branched ? (1-3, 1-6)-glucans and ? (1-3)-glucans. This should facilitate future toxicology and exposure assessment studies for glucans. 3.3 Gases and Vapors Hazardous gases and vapors are emitted from swine barns, lagoons, manure storage piles and from sites of manure land application. These compounds arise from the urine and feces, but especially from microbial degradation of liquid manure in storage or as manure compost. Table 3-3 lists volatile organic compounds; vapors and gases; and odoriferous volatile fatty acids, phenolic compounds and nitrogen-containing compounds. Many of these agents are sensory and respiratory irritants. In combination, they are associated with nasal, sinus, and eye irritation; coughing; wheezing; dyspnea and feelings of malaise (Schenker et al 1998). While there a re real time monitors available for some (e.g. Jerome meters for hydrogen sulfide) most compounds are determined using GC-MS or HPLC-MS methods on air samples collected in impermeable bags or by extraction or purging from collection media. Some vapors, such as ammonia, exist at significant concentrations in both the vapor phase as well as adsorbed to particulate matter. For quantification of these compounds, it is necessary to assay for both the solid and vapor phase. This can be accomplished with annular or honeycomb denuders that collect the vapor phase by reaction with citric acid and the particulate phase by analysis of material deposited on air sampling filters. Of the multitude of compounds in this mixture, those most commonly measured are ammonia, hydrogen sulfide and methane.
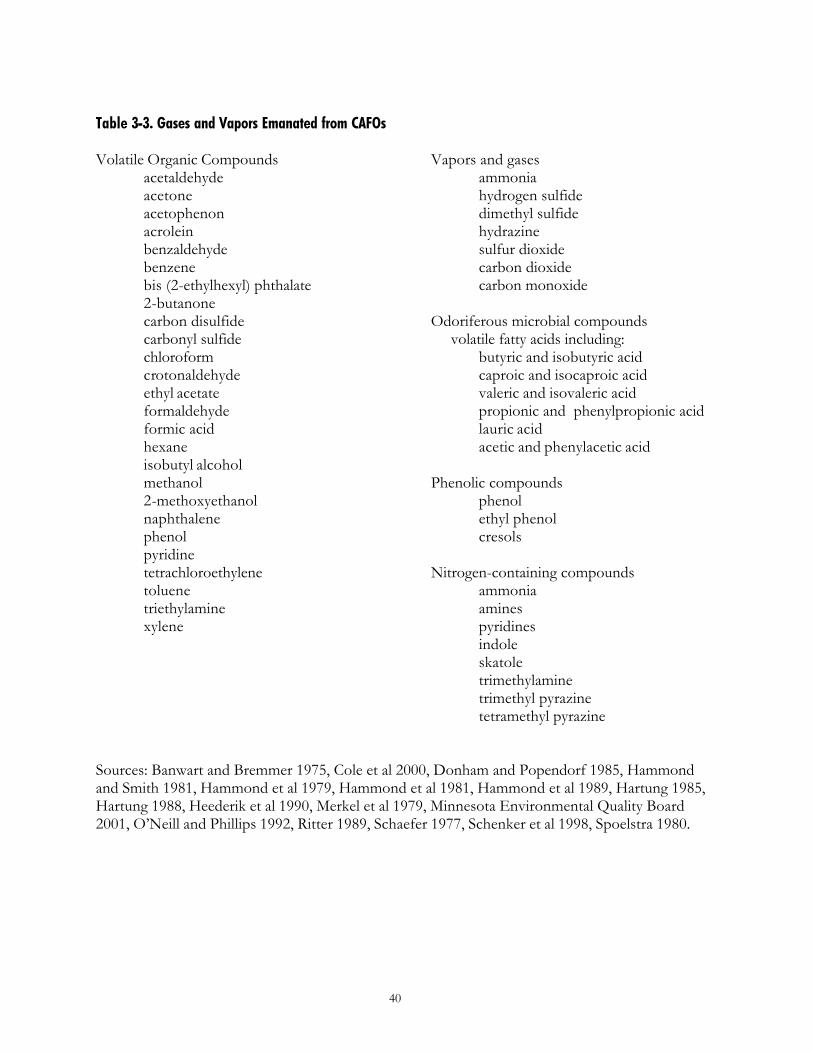
40
Table 3-3. Gases and Vapors Emanated from CAFOs Volatile Organic Compounds
acetaldehyde acetone acetophenon acrolein benzaldehyde benzene bis (2-ethylhexyl) phthalate 2-butanone carbon disulfide carbonyl sulfide chloroform crotonaldehyde ethyl acetate formaldehyde formic acid hexane isobutyl alcohol methanol 2-methoxyethanol naphthalene phenol pyridine tetrachloroethylene toluene triethylamine xylene
Vapors and gases ammonia hydrogen sulfide dimethyl sulfide hydrazine sulfur dioxide carbon dioxide carbon monoxide
Odoriferous microbial compounds volatile fatty acids including:
butyric and isobutyric acid caproic and isocaproic acid valeric and isovaleric acid
propionic and phenylpropionic acid lauric acid acetic and phenylacetic acid Phenolic compounds phenol
ethyl phenol cresols Nitrogen-containing compounds
ammonia amines pyridines indole skatole trimethylamine trimethyl pyrazine tetramethyl pyrazine
Sources: Banwart and Bremmer 1975, Cole et al 2000, Donham and Popendorf 1985, Hammond and Smith 1981, Hammond et al 1979, Hammond et al 1981, Hammond et al 1989, Hartung 1985, Hartung 1988, Heederik et al 1990, Merkel et al 1979, Minnesota Environmental Quality Board 2001, O’Neill and Phillips 1992, Ritter 1989, Schaefer 1977, Schenker et al 1998, Spoelstra 1980.
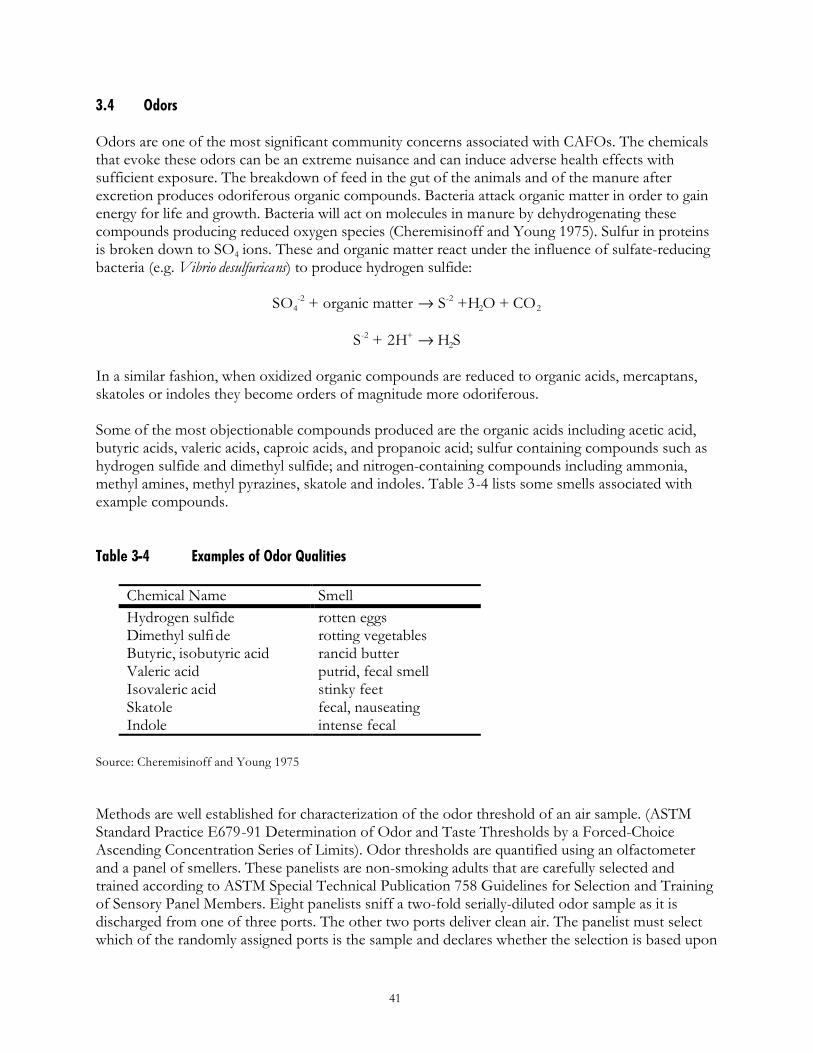
41
3.4 Odors Odors are one of the most significant community concerns associated with CAFOs. The chemicals that evoke these odors can be an extreme nuisance and can induce adverse health effects with sufficient exposure. The breakdown of feed in the gut of the animals and of the manure after excretion produces odoriferous organic compounds. Bacteria attack organic matter in order to gain energy for life and growth. Bacteria will act on molecules in manure by dehydrogenating these compounds producing reduced oxygen species (Cheremisinoff and Young 1975). Sulfur in proteins is broken down to SO4 ions. These and organic matter react under the influence of sulfate-reducing bacteria (e.g. Vibrio desulfuricans) to produce hydrogen sulfide:
SO4-2 + organic matter → S-2 +H2O + CO2
S-2 + 2H+ → H2S
In a similar fashion, when oxidized organic compounds are reduced to organic acids, mercaptans, skatoles or indoles they become orders of magnitude more odoriferous. Some of the most objectionable compounds produced are the organic acids including acetic acid, butyric acids, valeric acids, caproic acids, and propanoic acid; sulfur containing compounds such as hydrogen sulfide and dimethyl sulfide; and nitrogen-containing compounds including ammonia, methyl amines, methyl pyrazines, skatole and indoles. Table 3-4 lists some smells associated with example compounds. Table 3-4 Examples of Odor Qualities
Chemical Name Smell Hydrogen sulfide rotten eggs Dimethyl sulfi de rotting vegetables Butyric, isobutyric acid rancid butter Valeric acid putrid, fecal smell Isovaleric acid stinky feet Skatole fecal, nauseating Indole intense fecal
Source: Cheremisinoff and Young 1975 Methods are well established for characterization of the odor threshold of an air sample. (ASTM Standard Practice E679-91 Determination of Odor and Taste Thresholds by a Forced-Choice Ascending Concentration Series of Limits). Odor thresholds are quantified using an olfactometer and a panel of smellers. These panelists are non-smoking adults that are carefully selected and trained according to ASTM Special Technical Publication 758 Guidelines for Selection and Training of Sensory Panel Members. Eight panelists sniff a two-fold serially-diluted odor sample as it is discharged from one of three ports. The other two ports deliver clean air. The panelist must select which of the randomly assigned ports is the sample and declares whether the selection is based upon
42
recognition, detection, or a guess. The panel then samples the odor at a two-fold higher concentration. Analysis of results from the panel utilizes the triangular forced-choice method in an ascending concentration series. 3.5 Environmental Pollution: Acidifying Emissions and Greenhouse Gases It is recognized that ammonia emissions from the livestock sector contribute significantly to eutrophication and acidification of the environment. Acidification can put stress on species diversity in the natural environment. Reduction of ammonia emissions requires injection of liquid manure into soil and elimination of surface application. Covering of manure storages and livestock housing that controls emissions are also beneficial. CAFOs are known sources of greenhouse gases such as methane and nitrous oxide. These gases may contribute to global climate change and are the subject of national and international air pollution control strategies. Methane is produced during the digestive process by ruminants while nitrous oxide arises primarily from the microbial degradation of manure. 3.6 Summary Potentially hazardous air pollutants arise from CAFOs and their associated manure storages and land application sites. These air emissions include coarse and fine particulates, bioaerosols, endotoxins, hydrogen sulfide, ammonia, volatile organic compounds, odoriferous microbial organic compounds, and greenhouse gases. While methods are established for monitoring concentrations of all these compounds, little monitoring has been done in the vicinity of CAFOs. However, occupational health studies have characterized exposures within animal houses. Quantifying odors has relied on olfactometry which uses panels of human subjects to determine odor thresholds. In addition to direct effects on humans, greenhouse gas emissions and volatilization and environmental deposition of ammonia are air quality concerns from CAFOs. 3.7 Literature Cited Banwart WL, Bremmer JM. Identification of sulfur gases evolved from animal manures. J Environ Qual 4:363-366;
1975. Cheremisinoff PN and Young RA. Industrial Odor Technology Assessment. Ann Arbor Science, Ann Arbor, MI 1975. Chun DT, Chew V, Bartlett K, Gordon T, Jacobs RR, Larsson B-M, Larsson L, Lewis DM, Liesivuori J, Michel O,
Milton DK, Rylander R, Thorne PS, White EM, Brown ME. Preliminary report on the results of the second phase of a round-robin endotoxin assay study using cotton dust. Appl Occup Environ Hyg 15(1):152-157, 2000.
Chun DTW, Chew V, Bartlett K, Gordon T, Jacobs RR, Larsson B-M, Larsson L, Lewis DM, Liesivuori J, Michel O, Milton DK, Rylander R, Thorne PS, White EM, Brown ME. A round robin endotoxin assay study using cotton dust. Appl. Occup Envir Hyg, in press, 2001.
Clark S, Rylander R, Larsson L. Airborne bacteria, endotoxin and fiungi in dust in poultry and swine confinemtn buildings. Am Ind Hyg Assoc J 44:537-554; 1983.
Cole D, Todd L, Wing S. Concentrated swine feeding iperations and public health: a review of occupational and community health effects. Environ Health Perspec 108:685-699; 2000.
Cormier Y, Tremblay G, Meriaux A, Brochu G, Lavoie J. Airborne microbial contents in two types of swine confinement buildings in quebec. Am Ind Hyg Assoc J 51:304-309; 1990.
Donham KJ, Popendorf WJ. Ambient levels of selected gases inside swine confinement buildings Am Ind Hyg Assoc J 46:658-661; 1985.
43
Douwes J, Doekes G, Montijn R, Heederik D and Brunekreef B. Measurement of ß (1→3)-glucans in occupational and home environments with an inhibition enzyme immunoassay. Appl Environ Microbiol 62, 3176-3182, 1996.
Douwes J, Thorne PS, Pearce N, Heederik D. Biological agents – recognition. In: Perkins JL, editor. Modern Industrial Hygiene Vol II, Biological Aspects, Chapter 8, ACGIH, Cincinnati, OH, 2002.
Douwes J, Versloot P, Hollander A, Heederik D, Doekes G. Influence of various dust sampling and extraction methods on the measurement of airborne endotoxin. Appl Environ Microbiol 61:1763-1769, 1995.
Duchaine C, Thorne PS, Meriaux A, Grimard Y, Whitten P, Cormien Y. Comparison of endotoxin exposure assessment by bioaerosol impinger and filter sampling methods. Appl. Envir. Microbiol 2001.
Fogelmark B, Sjöstrand M, Rylander R. Pulmonary inflammation induced by repeated inhalations of ß(1 →3)-D-glucan and endotoxin. Int J Exp Path 75:85-90, 1994.
Gordon T, Galdanes K, Brosseau L. Comparison of sampling media for endotoxin contaminated aerosols. Appl Occup Environ Hyg 7:427-436, 1992.
Hammond E, Fedler C, Junk G. Identification of dust-borne odors in swine confinement facilities. Trans ASAE 22:1186-1192;1979.
Hammond EG, Fedler C, Smith RJ. Analysis of particle-borne swine house odors. Agric Environ 6:395-401; 1981. Hammond EG, Heppner C, Smith R. Odors of swine waste lagoons. Agric Ecosyst Environ 25:103-110; 1989. Hammond EG, Smith RJ. Survey of some molecularly dispersed odorous constituents in swine-house air. Iowa State J
Research 55:393-399; 1981. Hartung J. Chromatographic analysis of volatile fatty acids and phenolic/indolic compounds in pig house dust after
ethanolic extraction. Environ Technol Lett 6:21-30; 1985. Hartung J. Tentative calculations of gaseous emissions from pig houses by way of the exhaust air. In: Volatile emissions
from livestock Farming and Sewage Operations, Neilsen VC, Voorberg JH, L’Hermite P, eds. Elsevier Applied Sciences, New York, pp. 54-58, 1988.
Heederik D, Brouwer R, Biersteker K, Boleij JSM. Relationship of airborne endotoxin and bacteria levels in pig farms with the lung function and respiratory s ymptoms of farmers. Int Arch Occup Environ Health 62:595-601; 1991.
Heederik D, Thorne PS, Douwes J. Biological agents - monitoring and evaluation of bioaerosol exposure. In: Perkins JL, editor. Modern Industrial Hygiene Vol II, Biological Aspects, Chapter 9, ACGIH, Cincinnati, OH, 2002.
Heederik D, vanZwieten R, Brouwer R. Across-shift lung function changes among pig farmers. Am J Industr Med 17:57-58; 1990.
Hollander A, Heederik D, Versloot P, Douwes J. Inhibition and Enhancement in the Analysis of Airborne Endotoxin Levels in Various Occupational Environments. Am Ind Hyg Assoc J 54:647-653, 1993.
Kiekhaefer MS, Donham KJ, Whitten P, Thorne PS. Cross seasonal studies of airborne microbial populations and environment in swine buildings: Implications for worker and animal health. Ann Agric Environ Med 2:37-44, 1995.
Kiekhaefer MS, Donham KJ, Whitten P, Thorne PS. Cross seasonal studies of airborne microbial populations and environment in swine buildings: Implications for worker and animal health. Ann Agric Environ Med 2:37-44, 1995.
Klis FM. Review: Cell wall assembly in Yeast. Yeast 10:851-869, 1994. Kullman GJ, Thorne PS, Waldron PF, Marx JJ, Ault B, Lewis DM, Siegel PD, Olenchock SA, Merchant JA. Organic
dust exposures from work in dairy barns. Am Ind Hyg Assoc J 59:403-413, 1998. Lange JL, Thorne PS, Kullman GJ. Determinants of viable bioaerosol concentrations in dairy barns. Ann Agric Environ
Med 4:187-194, 1997. Lange JL, Thorne PS, Lynch N. Application of flow cytometry and fluorescent in situ hybridization for assessment of
exposures to airborne bacteria. Appl Environ Microbiol 63:1557-1563, 1997. Merkel JA, Hazen TE, Miner JR. Identification of gases in a swine cvonfinement atmosphere. Trans Aqm Soc Aagric
Eng 12:310-313; 1969. Minnesota Environmental Quality Board, Final Technical Work Paper for Air Quality and Odor Impacts, St. Paul, MN,
pp. 1-65, March 2001. O’Neill DH, Phillips VR. A review of the control of odor nuisance from livestock buildings: 3 properties of the odorous
substances which have been identified in livestock wastes in the air around them. J Agric Eng Research 53:23-50; 1992.
Reynolds SJ, Thorne PS, Donham KJ, Croteau EA, Kelly KM, Milton DK, Lewis D, Whitmer M, Heederik D, Douwes J, Connaughton I, Koch S, Malmberg P, Larsson B-M, Interlaboratory comparison of endotoxin assays using agricultural dusts. Am Ind Hyg Assoc J, 2001 in press.
Ritter W. Odor control of livestock wastes: state-of-the-art in North America. J Agric Eng Research 42:51-62; 1989. Roy CJ, O'Neill ME, Thorne PS. The influence of (1→3)ß -D glucan on endotoxin-induced acute pulmonary
inflammation. Toxicologist, 48:133, 1999.
44
Rylander R, Persson K, Goto H, Yuasa K, Tanaka S. Airborne ß-1,3-glucan may be related to symptoms in sick buildings. Indoor Environ 1:263-267, 1992.
Schaefer J. Sampling, characterization and analysis of malodors. Agric Environ 3:121-127; 1977. Schenker M, Christiani D, Cormier Y, et al. Respiratory Health Hazards in Agriculture. Am J Resp Crit Care Med Suppl
158(Part 2):S1-S76, 1998. Spoelstra S. Origin of objectionable odorous components in piggery wastes and the possibility of applying indicator
components for studying odor development. Agric Environ 5:241-260; 1980. Stone, BA, Clarke AE. Chemistry and biology of (1 →3)-ß-glucans. La Trobe University Press, Victoria Australia, 1992. Thorne PS, Heederik D. Assessment methods for bioaerosols. In: Salthammer T, editor. Organic Indoor Air Pollutants -
Occurrence, Measurement, Evaluation. Weinheim, Germany: Wiley/VCH, 85-103, 1999a. Thorne PS, Heederik D. Indoor bioaerosols - sources and characteristics. In: Salthammer T, editor. Organic Indoor Air
Pollutants - Occurrence, Measurement, Evaluation. Weinheim, Germany: Wiley/VCH, 275-288, 1999b. Thorne PS, Kiekhaefer MS, Whitten P, Donham KJ. Comparison of bioaerosol sampling methods in barns housing
swine. Appl Environ Microbiol 58:2543-2551, 1992. Thorne PS, Reynolds SJ, Milton DK, Bloebaum PD, Zhang X, Whitten P, Burmeister LF. Field evaluation of endotoxin
air sampling assay methods. Am Ind Hyg Assoc J 58:792-799, 1997. Thorne PS. Inhalation toxicology models of endotoxin and bioaerosol-induced inflammation. Toxicology 152:13-23,
2000. Williams DL. (1 →3)- ß -D-glucans. In: Organic dusts: exposure, effects, and prevention. Rylander R, Jacobs RR (Eds).
Lewis Publishers, pp 83-85, 1994.
45
Chapter 4. Emissions and Community Exposures from CAFOs
Steven J. Hoff, PhD, PE Associate Professor
Department of Agricultural and Biosystems Engineering Iowa State University
Keri C. Hornbuckle, PhD
Associate Professor Department of Civil and Environmental Engineering
University of Iowa
Peter S. Thorne, PhD Professor
College of Public Health University of Iowa
Dwaine S. Bundy, PhD, PE
Professor Department of Agricultural and Biosystems Engineering
Iowa State University
Patrick T. O’Shaughnessy, PhD Assistant Professor
College of Public Health University of Iowa
46
Abstract This chapter is a review of research and peer-reviewed literature on the emission rates and emission models for dispersion of gases from CAFOs. Emissions originate from the housing ventilation air, manure storage units, and during land application of manure. Refereed publications were sought that identified ammonia, methane, hydrogen sulfide, particulate, bioaerosol, and volatile organic compound (VOCs, including “odor”) emission from swine, dairy/cattle, and poultry production systems. The vast majority of published data is related to ammonia emission, and where available, the remaining components were cited and reported. A lack of data exists that reports downwind concentration of gases and particulates from CAFOs as a function of facility type and emission rate. Dispersion models predict the relationship between concentrations at a receptor and emissions from a source. Appropriate dispersion models for use in predicting concentrations of compounds are reviewed, with reference to current and peer-reviewed literature reports. Dispersion models are generally found to poorly predict absolute concentrations, but are adequate for predicting trends and the expected relationship between reduced emissions and reduced downwind concentrations. A series of tables is provided at the end of this chapter summarizing the reported emission rates of the above-mentioned components for swine, dairy/cattle, and poultry production systems. An overall summary of reported emission ranges for ammonia, from refereed publications, for ventilation air and manure storages is given below:
Species Source Ammonia Units Swine VA 5-311 g/AU-day
ST 0.3-144 g/m2-day Dairy/Cattle VA 6-43 g/AU-day
ST 0.3-18 g/m2-day Poultry VA 14-300 g/AU-day
ST (litter) 3-5 g/m2-day VA=ventilation air, ST=storage, AU=animal unit (500 kg)
47
4.0. Introduction This chapter summarizes published and refereed research data on gas and particulate emissions from swine, beef cattle, dairy cow, and poultry production systems. Emission refers to the rate at which gases or particulates are being emitted from either the housing unit, manure storage unit, or during land application events. This is in contrast to concentration-only measurements. Emission rates are determined by multiplying the concentration of a component by the volumetric rate at which a component at a given concentration is being emitted. This chapter reports published data, using units reported from each publication. At the end of this chapter, published emission rates are summarized into a table using common units. Research findings are organized by species, individual gases/particulates, and by the particular source, whether building, storage, or land application unit. Each species section is concluded with a summary of research results on published source emission levels versus downwind concentration. At the conclusion of all species-specific discussion, a section describing gas and particulate dispersion models is present. Concluding this chapter is a discussion on how different states address odor emissions and complaints. The terminology used in this chapter is defined below: Animal Unit: Many emission quantities published are based on a per animal unit (AU) basis. Unless
otherwise noted, one AU is equivalent to 500 kg body weight (1,100 lbs). Bioaerosol: Includes the sub-class of viable particulates that has an associated biological
component. Housing Unit: Any facility used to house livestock or poultry incorporating either a mechanical or
natural ventilation system for providing fresh-air exchange. Inhalable: The class of particulates or bioaerosols having a mean aerodynamic diameter at or below
100 um (micrometers). Land Application Unit: The process of applying animal manure to the soil. Manure Storage Unit: Any structure used to store manure, including long-term storage inside the
housing unit. Includes above- and below-ground structures. mg, ug, ng: Respectively, milligrams (10-3), micrograms (10 -6), and nanograms (10 -9). Particulate: Includes the class of both inert and viable aerosols. Includes total, inhalable, and
respirable fractions. ppm, ppb: Respectively, parts per million and parts per billion. Respirable: The class of particulates or bioaerosols having a mean aerodynamic diameter at or
below 5 um. Published emission data is presented in this chapter using original units reported from each citation. Where possible, emission rates from housing unit ventilation air were converted to grams of component per animal unit per day (g/AU-day) and presented in parenthesis after the cited levels. For reported manure storage emission rates, the published levels, where possible, were converted to grams of component per square meter of storage area per day (g/m2-day)
.
48
4.1. Swine System Emissions 4.1.1. Housing Unit Emissions Ammonia Aarnink et al. (1995) studied the ammonia emission patterns of nursery and finishing pigs raised on partially slatted flooring. They found that for nursery pigs, an average increase of 16 mg NH3/pig-day was measured and this increased to 85 mg NH3/pig-day for finishing pigs. The overall average ammonia emission measured was between 0.70 and 1.20 g NH3/pig-day for nursery pigs (19-33 g NH3/AU-day) and between 5.7 and 5.9 g NH3/pig-day for finishing pigs (42-43 g NH3/AU-day). They found an increase in ammonia emission during the summer months for nursery pigs due to higher ventilation rates but this same trend was not found for finishing pigs. They also found that removing the under-floor stored slurry reduced the ammonia emission by about 20 percent for a period of 10 hours, after which time the ammonia emission regained the pre-removal emission level. Demmers et al. (1999) investigated the exhausted concentrations and emission rates of ammonia from mechanically ventilated swine buildings. They reported ammonia concentrations in a swine finishing house between 12 and 30 mg NH3/m3 with an average ammonia emission rate of 46.9 kg NH3/AU-yr (160 g NH3/AU-day). Burton and Beauchamp (1986) studied the relationship between outside temperature, ventilation system response, in-house ammonia concentration, and the resulting emission of ammonia from the housing unit. They showed very clearly the inverse relationship of in-house ammonia concentration with outside temperature and the direct relationship of ammonia emission from the housing unit with outside temperature. This trend was attributed to the increased ventilation rates required during the summer to control inside climate temperatures for the housed animals. They summarized results over a one-year period and reported the monthly averages. February had the highest in-house concentration at 15 mg NH3-N/liter corresponding to the lowest emission rate at 0.9 kg NH3-N/day. August had the lowest in-house concentration of 4 mg NH3-N/liter and, correspondingly, the highest emission rate of 3.2 kg NH3-N/day, on average. Ni et al. (2000) investigated the exhausted concentrations and emission rates of ammonia in and from a deep-pit swine finishing building with and without the presence of animals and with pits that were roughly half full (130 cm depth, 240 cm depth capacity). They investigated the gas release rates with and without the effect of heating the building through unit space heaters. Without the presence of animals, they measured ammonia concentrations between 6 and 15 ppm with emission rates between 40 and 58 mg NH3/m2-h (5-8 g NH3/AU-day). When the buildings were re-stocked with pigs, exhaust air concentrations of ammonia were on average 15.2 ppm with corresponding emission rates of 233 mg NH3/m2-h (40-50 g NH3/AU-day). Groot Koerkamp et al. (1998) conducted an extensive study of ammonia emissions from swine housing facilities. They investigated both indoor ammonia levels and with simultaneous measurements of building ventilation rates, reported the resulting emission rate. In general, ammonia concentrations varied between 5 and 18 ppm, with average emission rates between 649 and 3751 mg NH3/AU-h (16-90 g NH3/AU-day). A more complete listing of the ammonia emission rates recorded as a function of maturity level and flooring is given below:
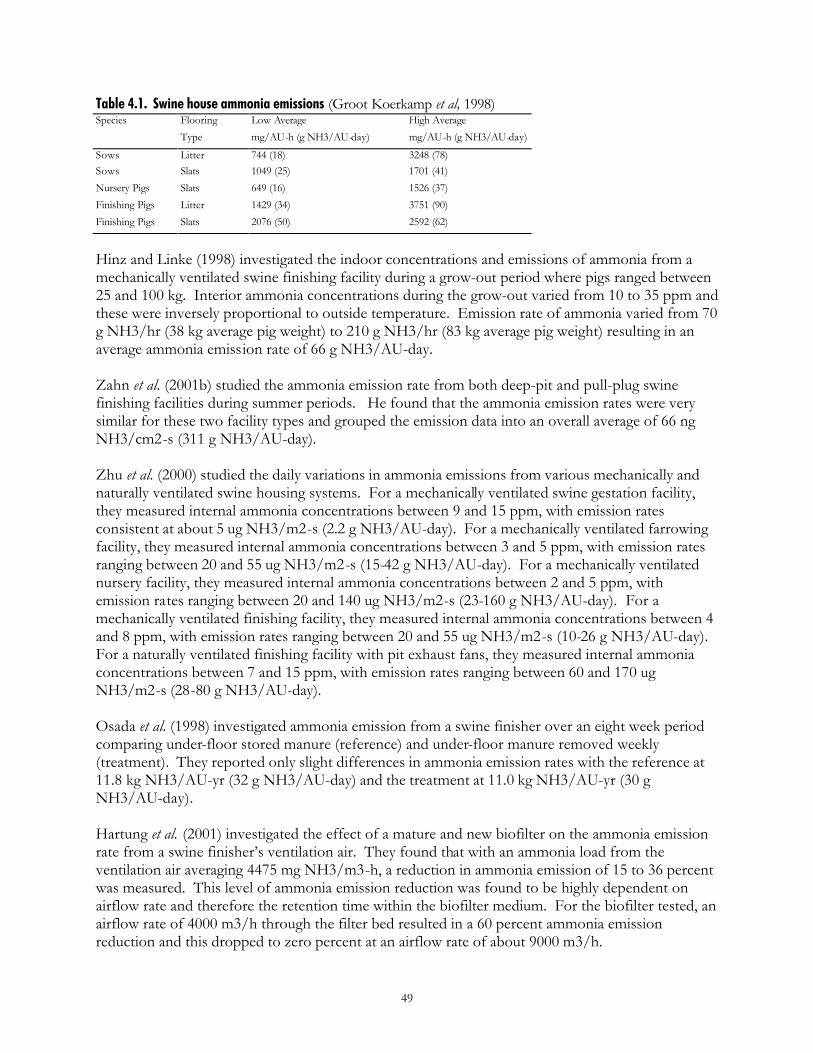
49
Table 4.1. Swine house ammonia emissions (Groot Koerkamp et al, 1998) Species Flooring Low Average High Average Type mg/AU-h (g NH3/AU-day) mg/AU-h (g NH3/AU-day)
Sows Litter 744 (18) 3248 (78) Sows Slats 1049 (25) 1701 (41) Nursery Pigs Slats 649 (16) 1526 (37) Finishing Pigs Litter 1429 (34) 3751 (90) Finishing Pigs Slats 2076 (50) 2592 (62)
Hinz and Linke (1998) investigated the indoor concentrations and emissions of ammonia from a mechanically ventilated swine finishing facility during a grow-out period where pigs ranged between 25 and 100 kg. Interior ammonia concentrations during the grow-out varied from 10 to 35 ppm and these were inversely proportional to outside temperature. Emission rate of ammonia varied from 70 g NH3/hr (38 kg average pig weight) to 210 g NH3/hr (83 kg average pig weight) resulting in an average ammonia emission rate of 66 g NH3/AU-day. Zahn et al. (2001b) studied the ammonia emission rate from both deep-pit and pull-plug swine finishing facilities during summer periods. He found that the ammonia emission rates were very similar for these two facility types and grouped the emission data into an overall average of 66 ng NH3/cm2-s (311 g NH3/AU-day). Zhu et al. (2000) studied the daily variations in ammonia emissions from various mechanically and naturally ventilated swine housing systems. For a mechanically ventilated swine gestation facility, they measured internal ammonia concentrations between 9 and 15 ppm, with emission rates consistent at about 5 ug NH3/m2-s (2.2 g NH3/AU-day). For a mechanically ventilated farrowing facility, they measured internal ammonia concentrations between 3 and 5 ppm, with emission rates ranging between 20 and 55 ug NH3/m2-s (15-42 g NH3/AU-day). For a mechanically ventilated nursery facility, they measured internal ammonia concentrations between 2 and 5 ppm, with emission rates ranging between 20 and 140 ug NH3/m2-s (23-160 g NH3/AU-day). For a mechanically ventilated finishing facility, they measured internal ammonia concentrations between 4 and 8 ppm, with emission rates ranging between 20 and 55 ug NH3/m2-s (10-26 g NH3/AU-day). For a naturally ventilated finishing facility with pit exhaust fans, they measured internal ammonia concentrations between 7 and 15 ppm, with emission rates ranging between 60 and 170 ug NH3/m2-s (28-80 g NH3/AU-day). Osada et al. (1998) investigated ammonia emission from a swine finisher over an eight week period comparing under-floor stored manure (reference) and under-floor manure removed weekly (treatment). They reported only slight differences in ammonia emission rates with the reference at 11.8 kg NH3/AU-yr (32 g NH3/AU-day) and the treatment at 11.0 kg NH3/AU-yr (30 g NH3/AU-day). Hartung et al. (2001) investigated the effect of a mature and new biofilter on the ammonia emission rate from a swine finisher’s ventilation air. They found that with an ammonia load from the ventilation air averaging 4475 mg NH3/m3-h, a reduction in ammonia emission of 15 to 36 percent was measured. This level of ammonia emission reduction was found to be highly dependent on airflow rate and therefore the retention time within the biofilter medium. For the biofilter tested, an airflow rate of 4000 m3/h through the filter bed resulted in a 60 percent ammonia emission reduction and this dropped to zero percent at an airflow rate of about 9000 m3/h.
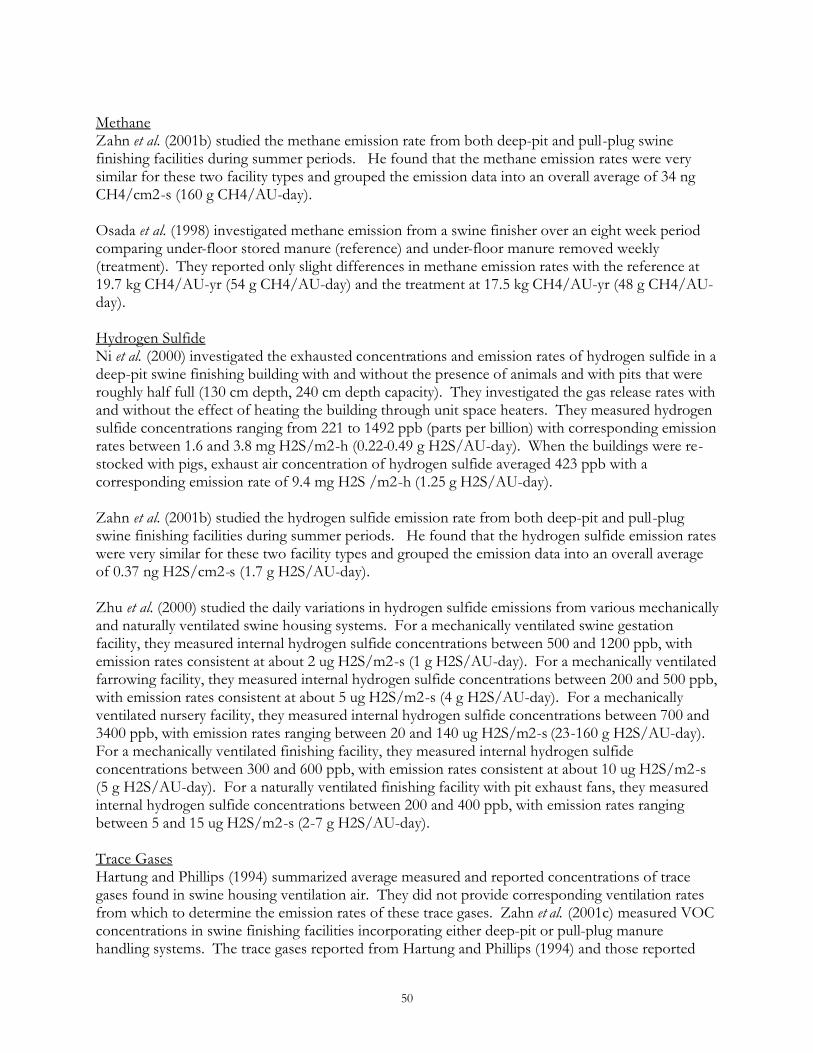
50
Methane Zahn et al. (2001b) studied the methane emission rate from both deep-pit and pull-plug swine finishing facilities during summer periods. He found that the methane emission rates were very similar for these two facility types and grouped the emission data into an overall average of 34 ng CH4/cm2-s (160 g CH4/AU-day). Osada et al. (1998) investigated methane emission from a swine finisher over an eight week period comparing under-floor stored manure (reference) and under-floor manure removed weekly (treatment). They reported only slight differences in methane emission rates with the reference at 19.7 kg CH4/AU-yr (54 g CH4/AU-day) and the treatment at 17.5 kg CH4/AU-yr (48 g CH4/AU-day). Hydrogen Sulfide Ni et al. (2000) investigated the exhausted concentrations and emission rates of hydrogen sulfide in a deep-pit swine finishing building with and without the presence of animals and with pits that were roughly half full (130 cm depth, 240 cm depth capacity). They investigated the gas release rates with and without the effect of heating the building through unit space heaters. They measured hydrogen sulfide concentrations ranging from 221 to 1492 ppb (parts per billion) with corresponding emission rates between 1.6 and 3.8 mg H2S/m2-h (0.22-0.49 g H2S/AU-day). When the buildings were re-stocked with pigs, exhaust air concentration of hydrogen sulfide averaged 423 ppb with a corresponding emission rate of 9.4 mg H2S /m2-h (1.25 g H2S/AU-day). Zahn et al. (2001b) studied the hydrogen sulfide emission rate from both deep-pit and pull-plug swine finishing facilities during summer periods. He found that the hydrogen sulfide emission rates were very similar for these two facility types and grouped the emission data into an overall average of 0.37 ng H2S/cm2-s (1.7 g H2S/AU-day). Zhu et al. (2000) studied the daily variations in hydrogen sulfide emissions from various mechanically and naturally ventilated swine housing systems. For a mechanically ventilated swine gestation facility, they measured internal hydrogen sulfide concentrations between 500 and 1200 ppb, with emission rates consistent at about 2 ug H2S/m2-s (1 g H2S/AU-day). For a mechanically ventilated farrowing facility, they measured internal hydrogen sulfide concentrations between 200 and 500 ppb, with emission rates consistent at about 5 ug H2S/m2-s (4 g H2S/AU-day). For a mechanically ventilated nursery facility, they measured internal hydrogen sulfide concentrations between 700 and 3400 ppb, with emission rates ranging between 20 and 140 ug H2S/m2-s (23-160 g H2S/AU-day). For a mechanically ventilated finishing facility, they measured internal hydrogen sulfide concentrations between 300 and 600 ppb, with emission rates consistent at about 10 ug H2S/m2-s (5 g H2S/AU-day). For a naturally ventilated finishing facility with pit exhaust fans, they measured internal hydrogen sulfide concentrations between 200 and 400 ppb, with emission rates ranging between 5 and 15 ug H2S/m2-s (2-7 g H2S/AU-day). Trace Gases Hartung and Phillips (1994) summarized average measured and reported concentrations of trace gases found in swine housing ventilation air. They did not provide corresponding ventilation rates from which to determine the emission rates of these trace gases. Zahn et al. (2001c) measured VOC concentrations in swine finishing facilities incorporating either deep-pit or pull-plug manure handling systems. The trace gases reported from Hartung and Phillips (1994) and those reported
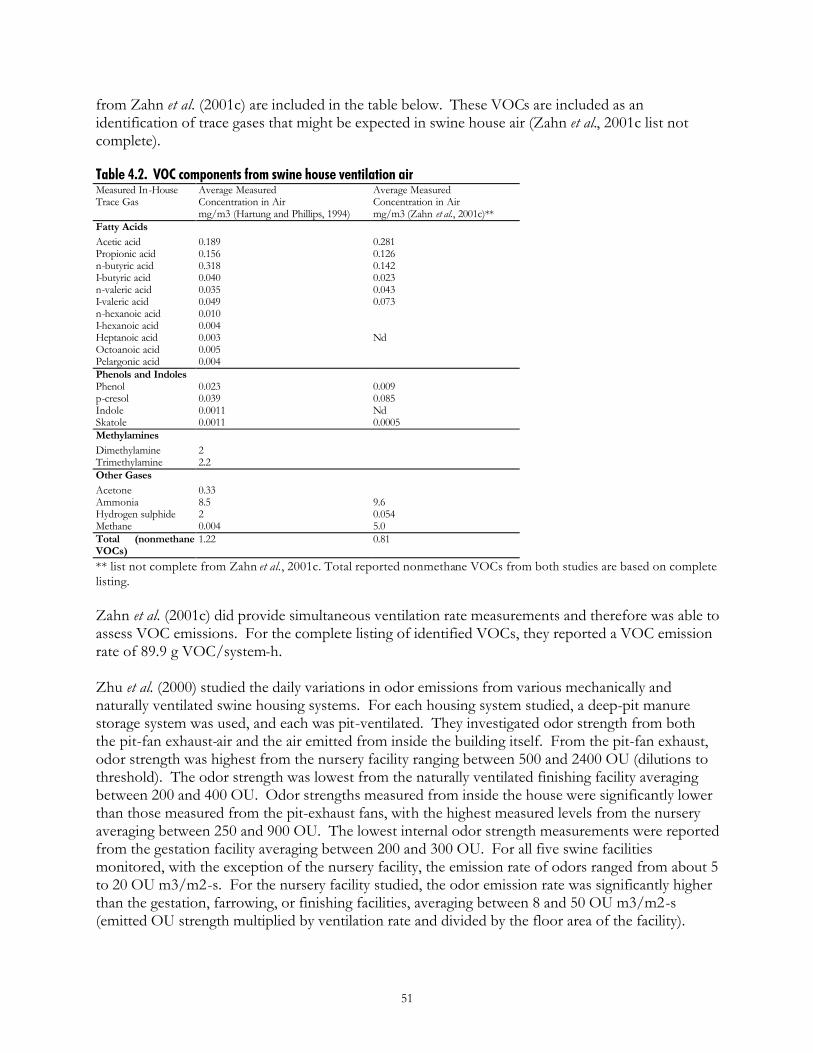
51
from Zahn et al. (2001c) are included in the table below. These VOCs are included as an identification of trace gases that might be expected in swine house air (Zahn et al., 2001c list not complete). Table 4.2. VOC components from swine house ventilation air Measured In-House Average Measured Average Measured Trace Gas Concentration in Air Concentration in Air mg/m3 (Hartung and Phillips, 1994) mg/m3 (Zahn et al., 2001c)** Fatty Acids Acetic acid 0.189 0.281 Propionic acid 0.156 0.126 n-butyric acid 0.318 0.142 I-butyric acid 0.040 0.023 n-valeric acid 0.035 0.043 I-valeric acid 0.049 0.073 n-hexanoic acid 0.010 I-hexanoic acid 0.004 Heptanoic acid 0.003 Nd Octoanoic acid 0.005 Pelargonic acid 0.004 Phenols and Indoles Phenol 0.023 0.009 p-cresol 0.039 0.085 Indole 0.0011 Nd Skatole 0.0011 0.0005 Methylamines Dimethylamine 2 Trimethylamine 2.2 Other Gases Acetone 0.33 Ammonia 8.5 9.6 Hydrogen sulphide 2 0.054 Methane 0.004 5.0 Total (nonmethane VOCs)
1.22 0.81
** list not complete from Zahn et al., 2001c. Total reported nonmethane VOCs from both studies are based on complete listing. Zahn et al. (2001c) did provide simultaneous ventilation rate measurements and therefore was able to assess VOC emissions. For the complete listing of identified VOCs, they reported a VOC emission rate of 89.9 g VOC/system-h. Zhu et al. (2000) studied the daily variations in odor emissions from various mechanically and naturally ventilated swine housing systems. For each housing system studied, a deep-pit manure storage system was used, and each was pit-ventilated. They investigated odor strength from both the pit-fan exhaust-air and the air emitted from inside the building itself. From the pit-fan exhaust, odor strength was highest from the nursery facility ranging between 500 and 2400 OU (dilutions to threshold). The odor strength was lowest from the naturally ventilated finishing facility averaging between 200 and 400 OU. Odor strengths measured from inside the house were significantly lower than those measured from the pit-exhaust fans, with the highest measured levels from the nursery averaging between 250 and 900 OU. The lowest internal odor strength measurements were reported from the gestation facility averaging between 200 and 300 OU. For all five swine facilities monitored, with the exception of the nursery facility, the emission rate of odors ranged from about 5 to 20 OU m3/m2-s. For the nursery facility studied, the odor emission rate was significantly higher than the gestation, farrowing, or finishing facilities, averaging between 8 and 50 OU m3/m2-s (emitted OU strength multiplied by ventilation rate and divided by the floor area of the facility).
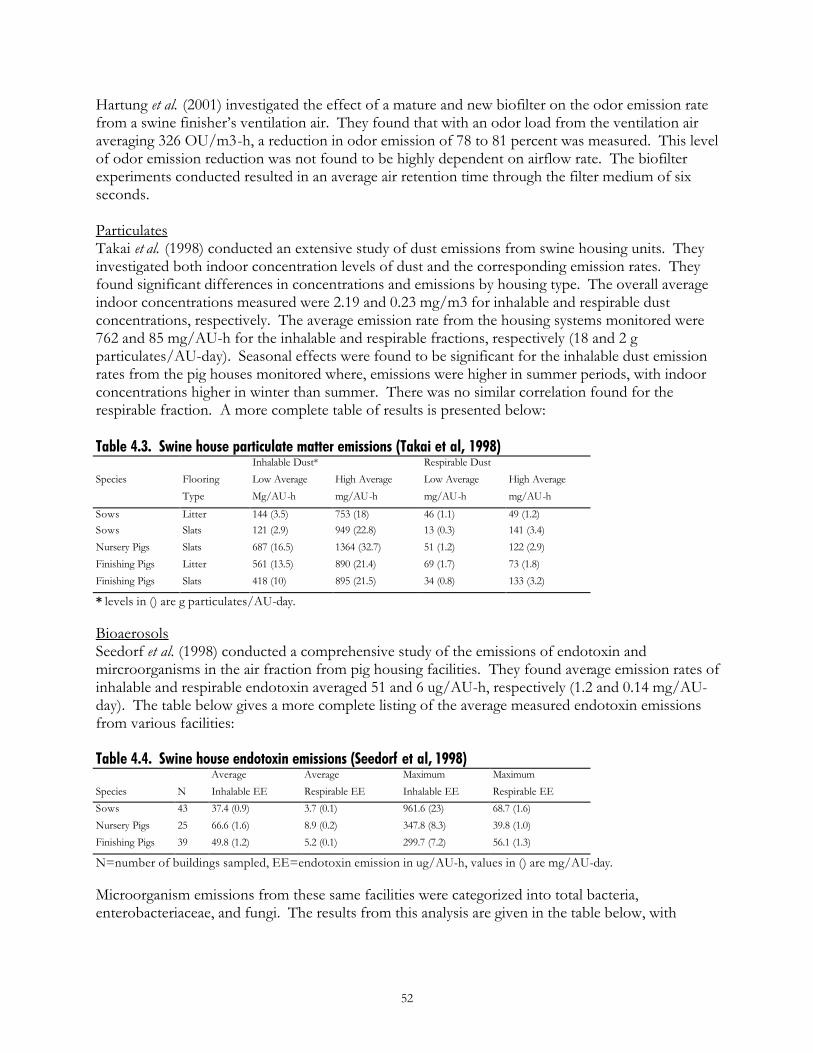
52
Hartung et al. (2001) investigated the effect of a mature and new biofilter on the odor emission rate from a swine finisher’s ventilation air. They found that with an odor load from the ventilation air averaging 326 OU/m3-h, a reduction in odor emission of 78 to 81 percent was measured. This level of odor emission reduction was not found to be highly dependent on airflow rate. The biofilter experiments conducted resulted in an average air retention time through the filter medium of six seconds. Particulates Takai et al. (1998) conducted an extensive study of dust emissions from swine housing units. They investigated both indoor concentration levels of dust and the corresponding emission rates. They found significant differences in concentrations and emissions by housing type. The overall average indoor concentrations measured were 2.19 and 0.23 mg/m3 for inhalable and respirable dust concentrations, respectively. The average emission rate from the housing systems monitored were 762 and 85 mg/AU-h for the inhalable and respirable fractions, respectively (18 and 2 g particulates/AU-day). Seasonal effects were found to be significant for the inhalable dust emission rates from the pig houses monitored where, emissions were higher in summer periods, with indoor concentrations higher in winter than summer. There was no similar correlation found for the respirable fraction. A more complete table of results is presented below: Table 4.3. Swine house particulate matter emissions (Takai et al, 1998) Inhalable Dust* Respirable Dust Species Flooring Low Average High Average Low Average High Average Type Mg/AU-h mg/AU-h mg/AU-h mg/AU-h
Sows Litter 144 (3.5) 753 (18) 46 (1.1) 49 (1.2) Sows Slats 121 (2.9) 949 (22.8) 13 (0.3) 141 (3.4) Nursery Pigs Slats 687 (16.5) 1364 (32.7) 51 (1.2) 122 (2.9) Finishing Pigs Litter 561 (13.5) 890 (21.4) 69 (1.7) 73 (1.8) Finishing Pigs Slats 418 (10) 895 (21.5) 34 (0.8) 133 (3.2)
* levels in () are g particulates/AU-day. Bioaerosols Seedorf et al. (1998) conducted a comprehensive study of the emissions of endotoxin and mircroorganisms in the air fraction from pig housing facilities. They found average emission rates of inhalable and respirable endotoxin averaged 51 and 6 ug/AU-h, respectively (1.2 and 0.14 mg/AU-day). The table below gives a more complete listing of the average measured endotoxin emissions from various facilities:
Table 4.4. Swine house endotoxin emissions (Seedorf et al, 1998) Average Average Maximum Maximum Species N Inhalable EE Respirable EE Inhalable EE Respirable EE Sows 43 37.4 (0.9) 3.7 (0.1) 961.6 (23) 68.7 (1.6) Nursery Pigs 25 66.6 (1.6) 8.9 (0.2) 347.8 (8.3) 39.8 (1.0) Finishing Pigs 39 49.8 (1.2) 5.2 (0.1) 299.7 (7.2) 56.1 (1.3)
N=number of buildings sampled, EE=endotoxin emission in ug/AU-h, values in () are mg/AU-day. Microorganism emissions from these same facilities were categorized into total bacteria, enterobacteriaceae, and fungi. The results from this analysis are given in the table below, with
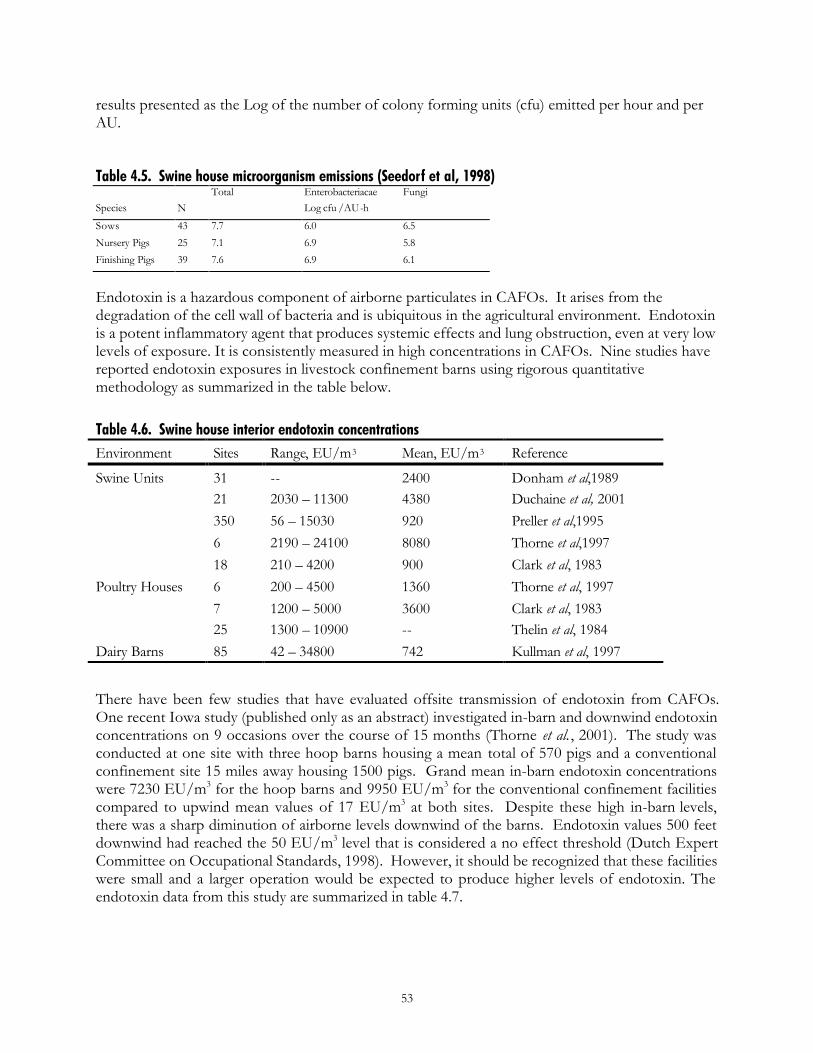
53
results presented as the Log of the number of colony forming units (cfu) emitted per hour and per AU.
Table 4.5. Swine house microorganism emissions (Seedorf et al, 1998) Total Enterobacteriacae Fungi Species N Log cfu /AU-h
Sows 43 7.7 6.0 6.5 Nursery Pigs 25 7.1 6.9 5.8 Finishing Pigs 39 7.6 6.9 6.1
Endotoxin is a hazardous component of airborne particulates in CAFOs. It arises from the degradation of the cell wall of bacteria and is ubiquitous in the agricultural environment. Endotoxin is a potent inflammatory agent that produces systemic effects and lung obstruction, even at very low levels of exposure. It is consistently measured in high concentrations in CAFOs. Nine studies have reported endotoxin exposures in livestock confinement barns using rigorous quantitative methodology as summarized in the table below. Table 4.6. Swine house interior endotoxin concentrations Environment Sites Range, EU/m3 Mean, EU/m3 Reference
Swine Units 31 -- 2400 Donham et al,1989 21 2030 – 11300 4380 Duchaine et al, 2001 350 56 – 15030 920 Preller et al,1995 6 2190 – 24100 8080 Thorne et al,1997 18 210 – 4200 900 Clark et al, 1983 Poultry Houses 6 200 – 4500 1360 Thorne et al, 1997 7 1200 – 5000 3600 Clark et al, 1983 25 1300 – 10900 -- Thelin et al, 1984 Dairy Barns 85 42 – 34800 742 Kullman et al, 1997
There have been few studies that have evaluated offsite transmission of endotoxin from CAFOs. One recent Iowa study (published only as an abstract) investigated in-barn and downwind endotoxin concentrations on 9 occasions over the course of 15 months (Thorne et al., 2001). The study was conducted at one site with three hoop barns housing a mean total of 570 pigs and a conventional confinement site 15 miles away housing 1500 pigs. Grand mean in-barn endotoxin concentrations were 7230 EU/m3 for the hoop barns and 9950 EU/m3 for the conventional confinement facilities compared to upwind mean values of 17 EU/m3 at both sites. Despite these high in-barn levels, there was a sharp diminution of airborne levels downwind of the barns. Endotoxin values 500 feet downwind had reached the 50 EU/m3 level that is considered a no effect threshold (Dutch Expert Committee on Occupational Standards, 1998). However, it should be recognized that these facilities were small and a larger operation would be expected to produce higher levels of endotoxin. The endotoxin data from this study are summarized in table 4.7.
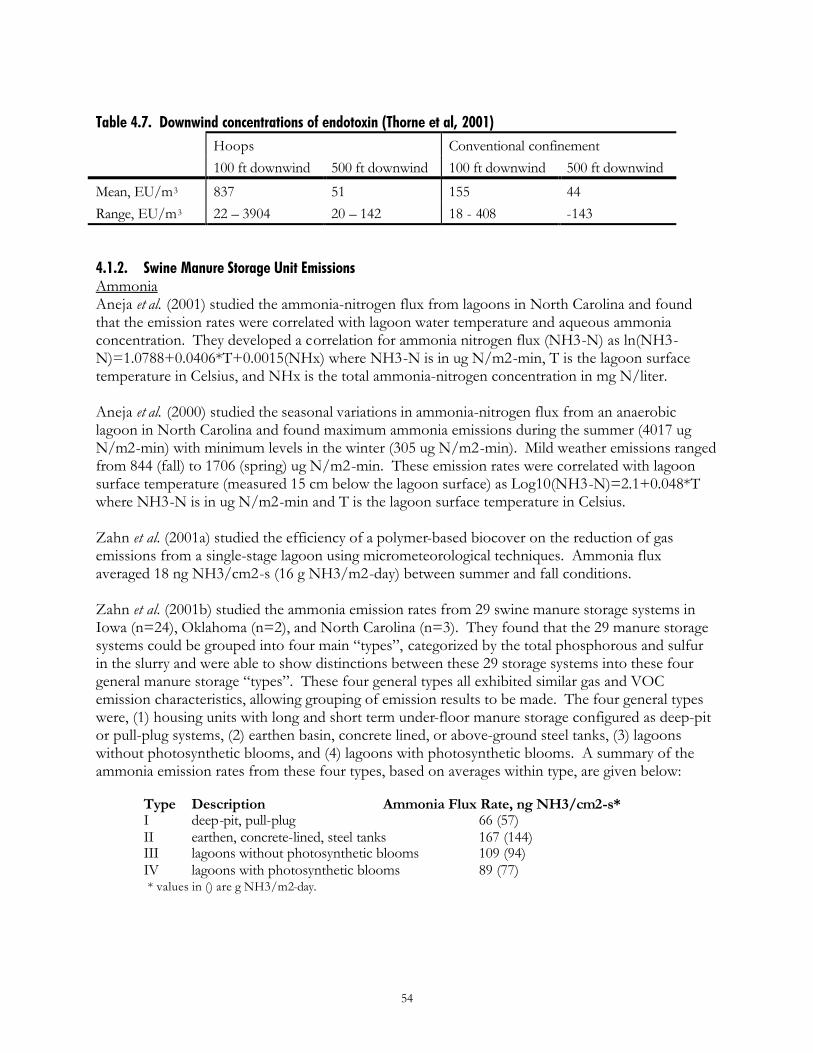
54
Table 4.7. Downwind concentrations of endotoxin (Thorne et al, 2001) Hoops Conventional confinement 100 ft downwind 500 ft downwind 100 ft downwind 500 ft downwind
Mean, EU/m3 837 51 155 44 Range, EU/m3 22 – 3904 20 – 142 18 - 408 -143 4.1.2. Swine Manure Storage Unit Emissions Ammonia Aneja et al. (2001) studied the ammonia-nitrogen flux from lagoons in North Carolina and found that the emission rates were correlated with lagoon water temperature and aqueous ammonia concentration. They developed a correlation for ammonia nitrogen flux (NH3-N) as ln(NH3-N)=1.0788+0.0406*T+0.0015(NHx) where NH3-N is in ug N/m2-min, T is the lagoon surface temperature in Celsius, and NHx is the total ammonia-nitrogen concentration in mg N/liter. Aneja et al. (2000) studied the seasonal variations in ammonia-nitrogen flux from an anaerobic lagoon in North Carolina and found maximum ammonia emissions during the summer (4017 ug N/m2-min) with minimum levels in the winter (305 ug N/m2-min). Mild weather emissions ranged from 844 (fall) to 1706 (spring) ug N/m2-min. These emission rates were correlated with lagoon surface temperature (measured 15 cm below the lagoon surface) as Log10(NH3-N)=2.1+0.048*T where NH3-N is in ug N/m2-min and T is the lagoon surface temperature in Celsius. Zahn et al. (2001a) studied the efficiency of a polymer-based biocover on the reduction of gas emissions from a single-stage lagoon using micrometeorological techniques. Ammonia flux averaged 18 ng NH3/cm2-s (16 g NH3/m2-day) between summer and fall conditions. Zahn et al. (2001b) studied the ammonia emission rates from 29 swine manure storage systems in Iowa (n=24), Oklahoma (n=2), and North Carolina (n=3). They found that the 29 manure storage systems could be grouped into four main “types”, categorized by the total phosphorous and sulfur in the slurry and were able to show distinctions between these 29 storage systems into these four general manure storage “types”. These four general types all exhibited similar gas and VOC emission characteristics, allowing grouping of emission results to be made. The four general types were, (1) housing units with long and short term under-floor manure storage configured as deep-pit or pull-plug systems, (2) earthen basin, concrete lined, or above-ground steel tanks, (3) lagoons without photosynthetic blooms, and (4) lagoons with photosynthetic blooms. A summary of the ammonia emission rates from these four types, based on averages within type, are given below:
Type Description Ammonia Flux Rate, ng NH3/cm2-s* I deep-pit, pull-plug 66 (57) II earthen, concrete-lined, steel tanks 167 (144) III lagoons without photosynthetic blooms 109 (94) IV lagoons with photosynthetic blooms 89 (77) * values in () are g NH3/m2-day.
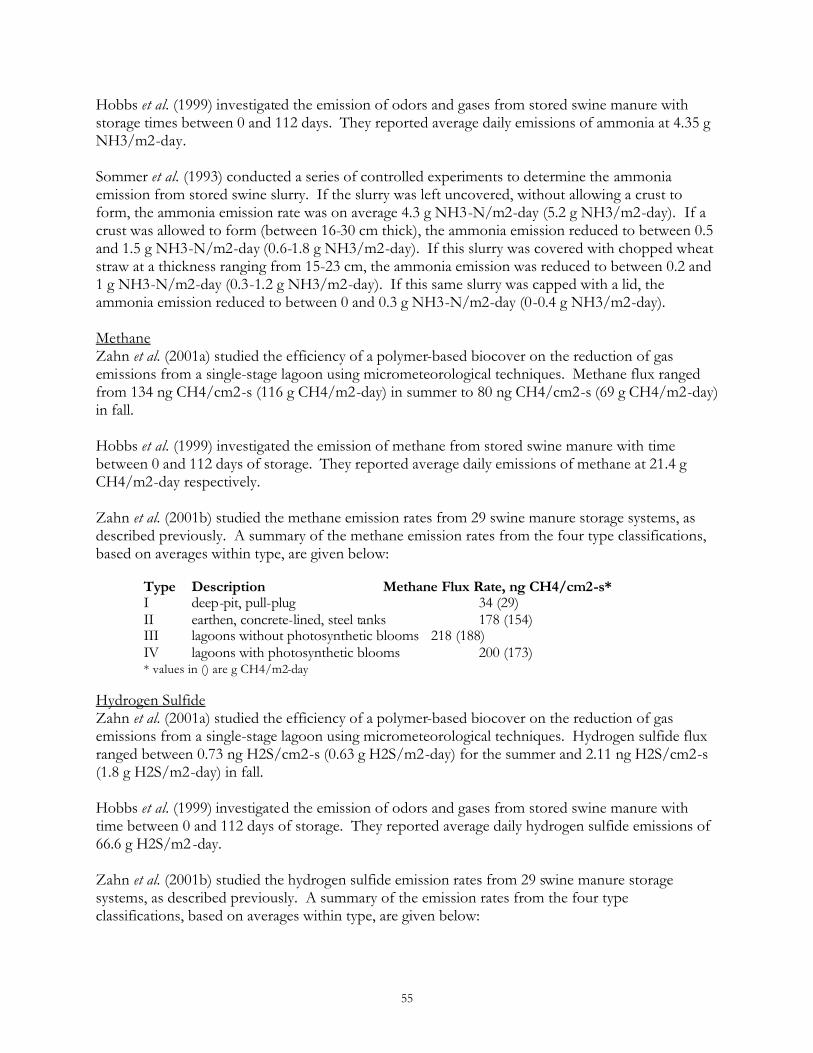
55
Hobbs et al. (1999) investigated the emission of odors and gases from stored swine manure with storage times between 0 and 112 days. They reported average daily emissions of ammonia at 4.35 g NH3/m2-day. Sommer et al. (1993) conducted a series of controlled experiments to determine the ammonia emission from stored swine slurry. If the slurry was left uncovered, without allowing a crust to form, the ammonia emission rate was on average 4.3 g NH3-N/m2-day (5.2 g NH3/m2-day). If a crust was allowed to form (between 16-30 cm thick), the ammonia emission reduced to between 0.5 and 1.5 g NH3-N/m2-day (0.6-1.8 g NH3/m2-day). If this slurry was covered with chopped wheat straw at a thickness ranging from 15-23 cm, the ammonia emission was reduced to between 0.2 and 1 g NH3-N/m2-day (0.3-1.2 g NH3/m2-day). If this same slurry was capped with a lid, the ammonia emission reduced to between 0 and 0.3 g NH3-N/m2-day (0-0.4 g NH3/m2-day). Methane Zahn et al. (2001a) studied the efficiency of a polymer-based biocover on the reduction of gas emissions from a single-stage lagoon using micrometeorological techniques. Methane flux ranged from 134 ng CH4/cm2-s (116 g CH4/m2-day) in summer to 80 ng CH4/cm2-s (69 g CH4/m2-day) in fall. Hobbs et al. (1999) investigated the emission of methane from stored swine manure with time between 0 and 112 days of storage. They reported average daily emissions of methane at 21.4 g CH4/m2-day respectively. Zahn et al. (2001b) studied the methane emission rates from 29 swine manure storage systems, as described previously. A summary of the methane emission rates from the four type classifications, based on averages within type, are given below:
Type Description Methane Flux Rate, ng CH4/cm2-s* I deep-pit, pull-plug 34 (29) II earthen, concrete-lined, steel tanks 178 (154) III lagoons without photosynthetic blooms 218 (188) IV lagoons with photosynthetic blooms 200 (173)
* values in () are g CH4/m2-day Hydrogen Sulfide Zahn et al. (2001a) studied the efficiency of a polymer-based biocover on the reduction of gas emissions from a single-stage lagoon using micrometeorological techniques. Hydrogen sulfide flux ranged between 0.73 ng H2S/cm2-s (0.63 g H2S/m2-day) for the summer and 2.11 ng H2S/cm2-s (1.8 g H2S/m2-day) in fall. Hobbs et al. (1999) investigated the emission of odors and gases from stored swine manure with time between 0 and 112 days of storage. They reported average daily hydrogen sulfide emissions of 66.6 g H2S/m2-day. Zahn et al. (2001b) studied the hydrogen sulfide emission rates from 29 swine manure storage systems, as described previously. A summary of the emission rates from the four type classifications, based on averages within type, are given below:
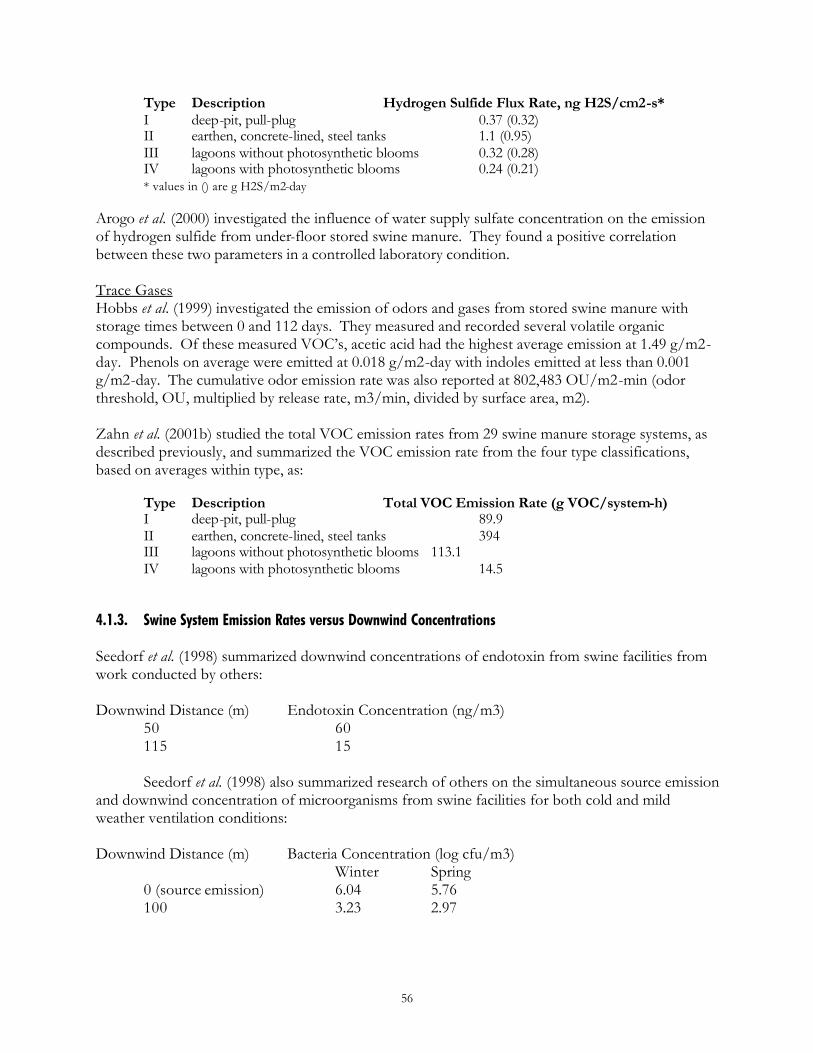
56
Type Description Hydrogen Sulfide Flux Rate, ng H2S/cm2-s* I deep-pit, pull-plug 0.37 (0.32) II earthen, concrete-lined, steel tanks 1.1 (0.95) III lagoons without photosynthetic blooms 0.32 (0.28) IV lagoons with photosynthetic blooms 0.24 (0.21)
* values in () are g H2S/m2-day
Arogo et al. (2000) investigated the influence of water supply sulfate concentration on the emission of hydrogen sulfide from under-floor stored swine manure. They found a positive correlation between these two parameters in a controlled laboratory condition. Trace Gases Hobbs et al. (1999) investigated the emission of odors and gases from stored swine manure with storage times between 0 and 112 days. They measured and recorded several volatile organic compounds. Of these measured VOC’s, acetic acid had the highest average emission at 1.49 g/m2-day. Phenols on average were emitted at 0.018 g/m2-day with indoles emitted at less than 0.001 g/m2-day. The cumulative odor emission rate was also reported at 802,483 OU/m2-min (odor threshold, OU, multiplied by release rate, m3/min, divided by surface area, m2). Zahn et al. (2001b) studied the total VOC emission rates from 29 swine manure storage systems, as described previously, and summarized the VOC emission rate from the four type classifications, based on averages within type, as:
Type Description Total VOC Emission Rate (g VOC/system-h) I deep-pit, pull-plug 89.9 II earthen, concrete-lined, steel tanks 394 III lagoons without photosynthetic blooms 113.1 IV lagoons with photosynthetic blooms 14.5
4.1.3. Swine System Emission Rates versus Downwind Concentrations Seedorf et al. (1998) summarized downwind concentrations of endotoxin from swine facilities from work conducted by others:
Downwind Distance (m) Endotoxin Concentration (ng/m3)
50 60 115 15 Seedorf et al. (1998) also summarized research of others on the simultaneous source emission
and downwind concentration of microorganisms from swine facilities for both cold and mild weather ventilation conditions: Downwind Distance (m) Bacteria Concentration (log cfu/m3)
Winter Spring 0 (source emission) 6.04 5.76 100 3.23 2.97
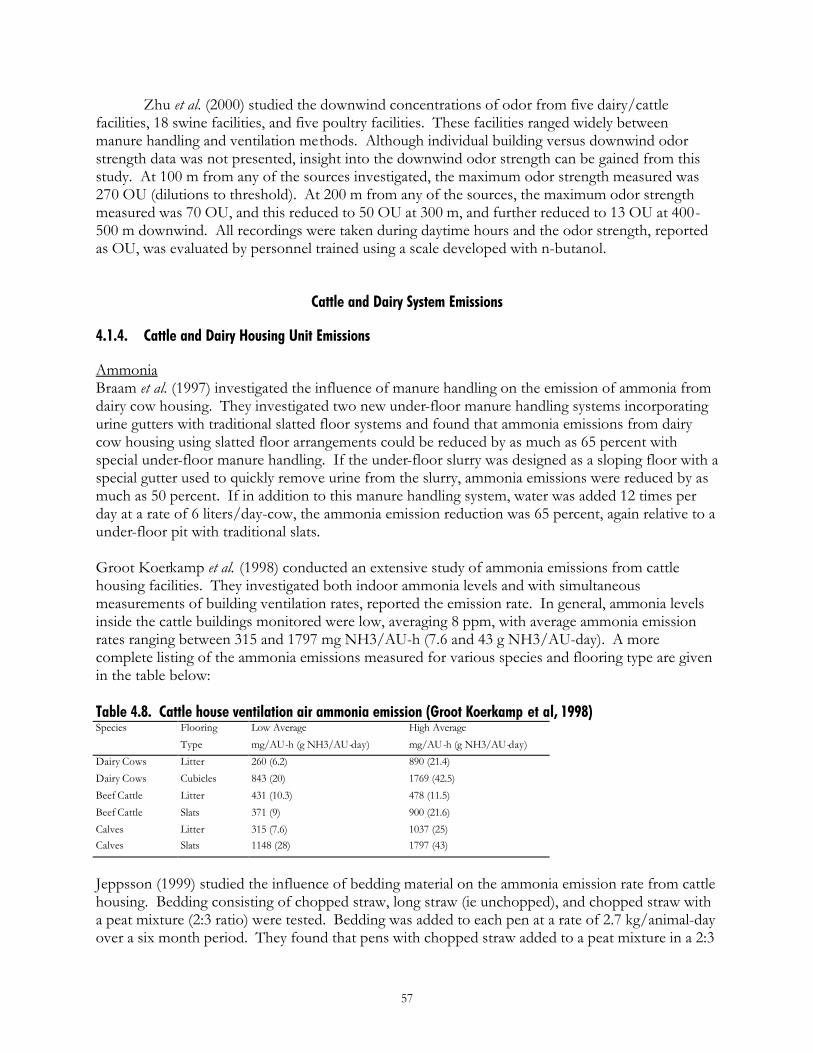
57
Zhu et al. (2000) studied the downwind concentrations of odor from five dairy/cattle facilities, 18 swine facilities, and five poultry facilities. These facilities ranged widely between manure handling and ventilation methods. Although individual building versus downwind odor strength data was not presented, insight into the downwind odor strength can be gained from this study. At 100 m from any of the sources investigated, the maximum odor strength measured was 270 OU (dilutions to threshold). At 200 m from any of the sources, the maximum odor strength measured was 70 OU, and this reduced to 50 OU at 300 m, and further reduced to 13 OU at 400-500 m downwind. All recordings were taken during daytime hours and the odor strength, reported as OU, was evaluated by personnel trained using a scale developed with n-butanol.
Cattle and Dairy System Emissions
4.1.4. Cattle and Dairy Housing Unit Emissions Ammonia Braam et al. (1997) investigated the influence of manure handling on the emission of ammonia from dairy cow housing. They investigated two new under-floor manure handling systems incorporating urine gutters with traditional slatted floor systems and found that ammonia emissions from dairy cow housing using slatted floor arrangements could be reduced by as much as 65 percent with special under-floor manure handling. If the under-floor slurry was designed as a sloping floor with a special gutter used to quickly remove urine from the slurry, ammonia emissions were reduced by as much as 50 percent. If in addition to this manure handling system, water was added 12 times per day at a rate of 6 liters/day-cow, the ammonia emission reduction was 65 percent, again relative to a under-floor pit with traditional slats. Groot Koerkamp et al. (1998) conducted an extensive study of ammonia emissions from cattle housing facilities. They investigated both indoor ammonia levels and with simultaneous measurements of building ventilation rates, reported the emission rate. In general, ammonia levels inside the cattle buildings monitored were low, averaging 8 ppm, with average ammonia emission rates ranging between 315 and 1797 mg NH3/AU-h (7.6 and 43 g NH3/AU-day). A more complete listing of the ammonia emissions measured for various species and flooring type are given in the table below:
Table 4.8. Cattle house ventilation air ammonia emission (Groot Koerkamp et al, 1998) Species Flooring Low Average High Average Type mg/AU-h (g NH3/AU-day) mg/AU-h (g NH3/AU-day) Dairy Cows Litter 260 (6.2) 890 (21.4) Dairy Cows Cubicles 843 (20) 1769 (42.5) Beef Cattle Litter 431 (10.3) 478 (11.5) Beef Cattle Slats 371 (9) 900 (21.6) Calves Litter 315 (7.6) 1037 (25) Calves Slats 1148 (28) 1797 (43)
Jeppsson (1999) studied the influence of bedding material on the ammonia emission rate from cattle housing. Bedding consisting of chopped straw, long straw (ie unchopped), and chopped straw with a peat mixture (2:3 ratio) were tested. Bedding was added to each pen at a rate of 2.7 kg/animal-day over a six month period. They found that pens with chopped straw added to a peat mixture in a 2:3
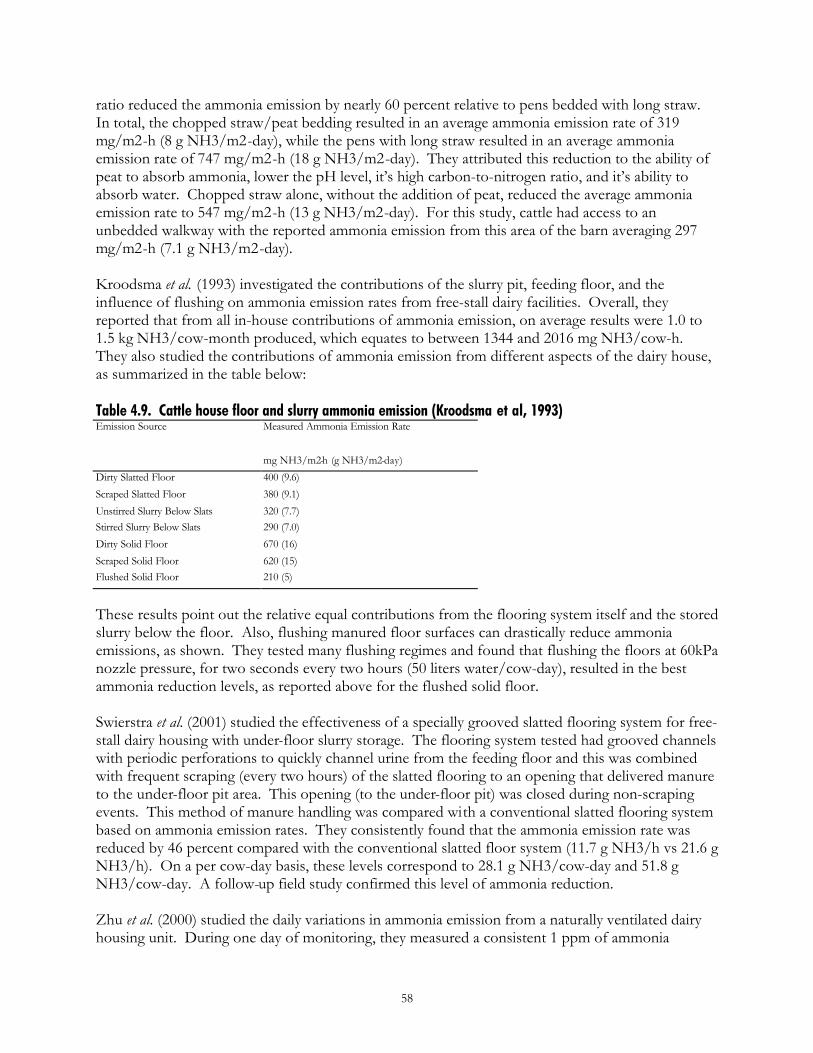
58
ratio reduced the ammonia emission by nearly 60 percent relative to pens bedded with long straw. In total, the chopped straw/peat bedding resulted in an average ammonia emission rate of 319 mg/m2-h (8 g NH3/m2-day), while the pens with long straw resulted in an average ammonia emission rate of 747 mg/m2-h (18 g NH3/m2-day). They attributed this reduction to the ability of peat to absorb ammonia, lower the pH level, it’s high carbon-to-nitrogen ratio, and it’s ability to absorb water. Chopped straw alone, without the addition of peat, reduced the average ammonia emission rate to 547 mg/m2-h (13 g NH3/m2-day). For this study, cattle had access to an unbedded walkway with the reported ammonia emission from this area of the barn averaging 297 mg/m2-h (7.1 g NH3/m2-day). Kroodsma et al. (1993) investigated the contributions of the slurry pit, feeding floor, and the influence of flushing on ammonia emission rates from free-stall dairy facilities. Overall, they reported that from all in-house contributions of ammonia emission, on average results were 1.0 to 1.5 kg NH3/cow-month produced, which equates to between 1344 and 2016 mg NH3/cow-h. They also studied the contributions of ammonia emission from different aspects of the dairy house, as summarized in the table below: Table 4.9. Cattle house floor and slurry ammonia emission (Kroodsma et al, 1993) Emission Source Measured Ammonia Emission Rate mg NH3/m2-h (g NH3/m2-day) Dirty Slatted Floor 400 (9.6) Scraped Slatted Floor 380 (9.1) Unstirred Slurry Below Slats 320 (7.7) Stirred Slurry Below Slats 290 (7.0) Dirty Solid Floor 670 (16) Scraped Solid Floor 620 (15) Flushed Solid Floor 210 (5)
These results point out the relative equal contributions from the flooring system itself and the stored slurry below the floor. Also, flushing manured floor surfaces can drastically reduce ammonia emissions, as shown. They tested many flushing regimes and found that flushing the floors at 60kPa nozzle pressure, for two seconds every two hours (50 liters water/cow-day), resulted in the best ammonia reduction levels, as reported above for the flushed solid floor. Swierstra et al. (2001) studied the effectiveness of a specially grooved slatted flooring system for free-stall dairy housing with under-floor slurry storage. The flooring system tested had grooved channels with periodic perforations to quickly channel urine from the feeding floor and this was combined with frequent scraping (every two hours) of the slatted flooring to an opening that delivered manure to the under-floor pit area. This opening (to the under-floor pit) was closed during non-scraping events. This method of manure handling was compared with a conventional slatted flooring system based on ammonia emission rates. They consistently found that the ammonia emission rate was reduced by 46 percent compared with the conventional slatted floor system (11.7 g NH3/h vs 21.6 g NH3/h). On a per cow-day basis, these levels correspond to 28.1 g NH3/cow-day and 51.8 g NH3/cow-day. A follow-up field study confirmed this level of ammonia reduction. Zhu et al. (2000) studied the daily variations in ammonia emission from a naturally ventilated dairy housing unit. During one day of monitoring, they measured a consistent 1 ppm of ammonia
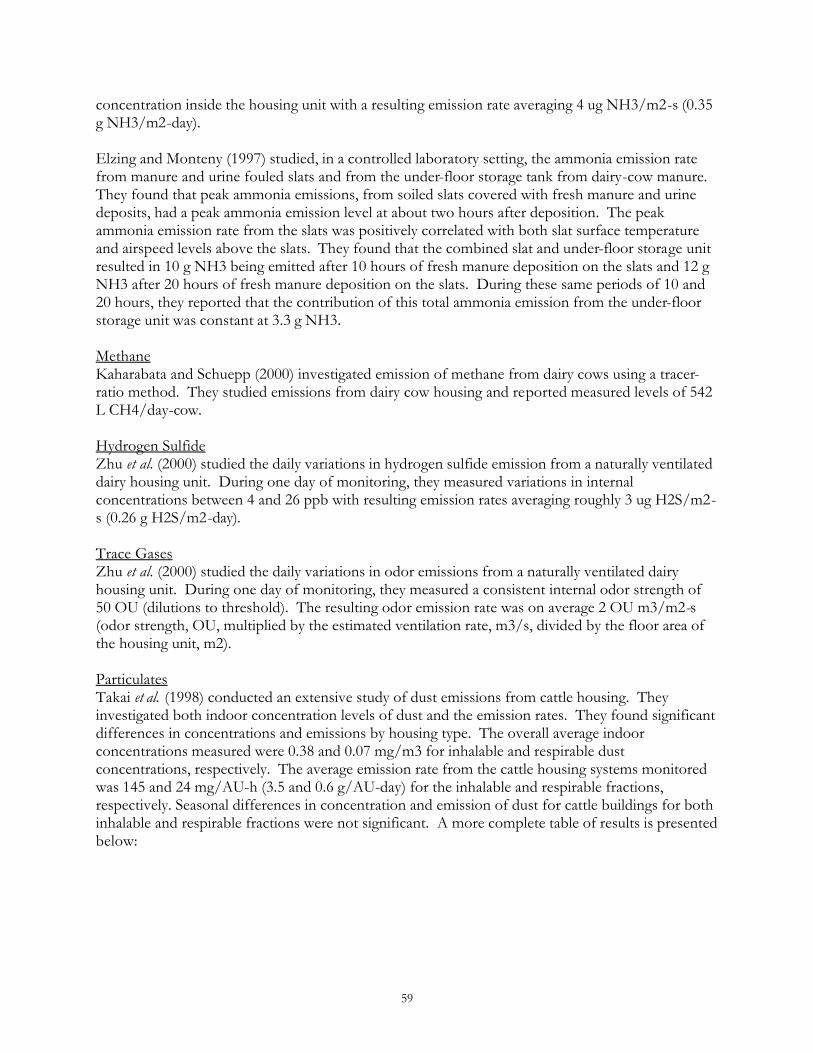
59
concentration inside the housing unit with a resulting emission rate averaging 4 ug NH3/m2-s (0.35 g NH3/m2-day). Elzing and Monteny (1997) studied, in a controlled laboratory setting, the ammonia emission rate from manure and urine fouled slats and from the under-floor storage tank from dairy-cow manure. They found that peak ammonia emissions, from soiled slats covered with fresh manure and urine deposits, had a peak ammonia emission level at about two hours after deposition. The peak ammonia emission rate from the slats was positively correlated with both slat surface temperature and airspeed levels above the slats. They found that the combined slat and under-floor storage unit resulted in 10 g NH3 being emitted after 10 hours of fresh manure deposition on the slats and 12 g NH3 after 20 hours of fresh manure deposition on the slats. During these same periods of 10 and 20 hours, they reported that the contribution of this total ammonia emission from the under-floor storage unit was constant at 3.3 g NH3. Methane Kaharabata and Schuepp (2000) investigated emission of methane from dairy cows using a tracer-ratio method. They studied emissions from dairy cow housing and reported measured levels of 542 L CH4/day-cow. Hydrogen Sulfide Zhu et al. (2000) studied the daily variations in hydrogen sulfide emission from a naturally ventilated dairy housing unit. During one day of monitoring, they measured variations in internal concentrations between 4 and 26 ppb with resulting emission rates averaging roughly 3 ug H2S/m2-s (0.26 g H2S/m2-day). Trace Gases Zhu et al. (2000) studied the daily variations in odor emissions from a naturally ventilated dairy housing unit. During one day of monitoring, they measured a consistent internal odor strength of 50 OU (dilutions to threshold). The resulting odor emission rate was on average 2 OU m3/m2-s (odor strength, OU, multiplied by the estimated ventilation rate, m3/s, divided by the floor area of the housing unit, m2). Particulates Takai et al. (1998) conducted an extensive study of dust emissions from cattle housing. They investigated both indoor concentration levels of dust and the emission rates. They found significant differences in concentrations and emissions by housing type. The overall average indoor concentrations measured were 0.38 and 0.07 mg/m3 for inhalable and respirable dust concentrations, respectively. The average emission rate from the cattle housing systems monitored was 145 and 24 mg/AU-h (3.5 and 0.6 g/AU-day) for the inhalable and respirable fractions, respectively. Seasonal differences in concentration and emission of dust for cattle buildings for both inhalable and respirable fractions were not significant. A more complete table of results is presented below:
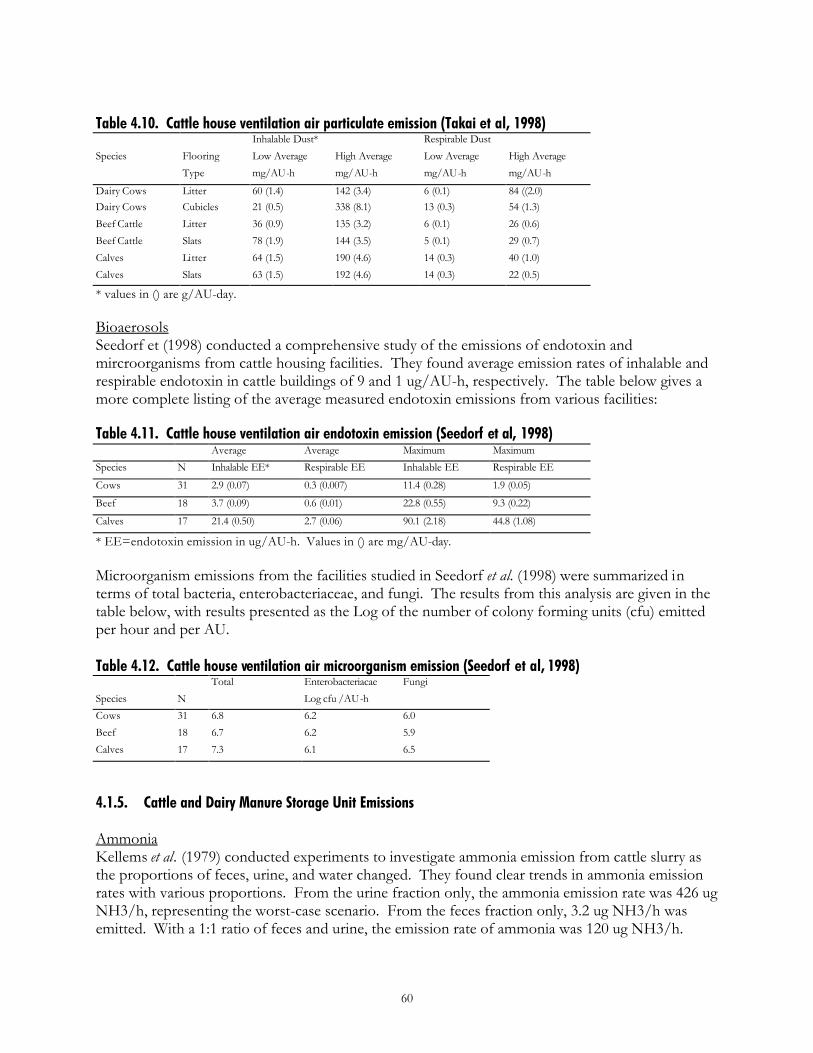
60
Table 4.10. Cattle house ventilation air particulate emission (Takai et al, 1998) Inhalable Dust* Respirable Dust Species Flooring Low Average High Average Low Average High Average Type mg/AU-h mg/AU-h mg/AU-h mg/AU-h
Dairy Cows Litter 60 (1.4) 142 (3.4) 6 (0.1) 84 ((2.0) Dairy Cows Cubicles 21 (0.5) 338 (8.1) 13 (0.3) 54 (1.3) Beef Cattle Litter 36 (0.9) 135 (3.2) 6 (0.1) 26 (0.6) Beef Cattle Slats 78 (1.9) 144 (3.5) 5 (0.1) 29 (0.7) Calves Litter 64 (1.5) 190 (4.6) 14 (0.3) 40 (1.0) Calves Slats 63 (1.5) 192 (4.6) 14 (0.3) 22 (0.5)
* values in () are g/AU-day. Bioaerosols Seedorf et (1998) conducted a comprehensive study of the emissions of endotoxin and mircroorganisms from cattle housing facilities. They found average emission rates of inhalable and respirable endotoxin in cattle buildings of 9 and 1 ug/AU-h, respectively. The table below gives a more complete listing of the average measured endotoxin emissions from various facilities: Table 4.11. Cattle house ventilation air endotoxin emission (Seedorf et al, 1998) Average Average Maximum Maximum Species N Inhalable EE* Respirable EE Inhalable EE Respirable EE
Cows 31 2.9 (0.07) 0.3 (0.007) 11.4 (0.28) 1.9 (0.05)
Beef 18 3.7 (0.09) 0.6 (0.01) 22.8 (0.55) 9.3 (0.22)
Calves 17 21.4 (0.50) 2.7 (0.06) 90.1 (2.18) 44.8 (1.08)
* EE=endotoxin emission in ug/AU-h. Values in () are mg/AU-day.
Microorganism emissions from the facilities studied in Seedorf et al. (1998) were summarized in terms of total bacteria, enterobacteriaceae, and fungi. The results from this analysis are given in the table below, with results presented as the Log of the number of colony forming units (cfu) emitted per hour and per AU.
Table 4.12. Cattle house ventilation air microorganism emission (Seedorf et al, 1998) Total Enterobacteriacae Fungi Species N Log cfu /AU-h Cows 31 6.8 6.2 6.0 Beef 18 6.7 6.2 5.9 Calves 17 7.3 6.1 6.5
4.1.5. Cattle and Dairy Manure Storage Unit Emissions
Ammonia Kellems et al. (1979) conducted experiments to investigate ammonia emission from cattle slurry as the proportions of feces, urine, and water changed. They found clear trends in ammonia emission rates with various proportions. From the urine fraction only, the ammonia emission rate was 426 ug NH3/h, representing the worst-case scenario. From the feces fraction only, 3.2 ug NH3/h was emitted. With a 1:1 ratio of feces and urine, the emission rate of ammonia was 120 ug NH3/h.
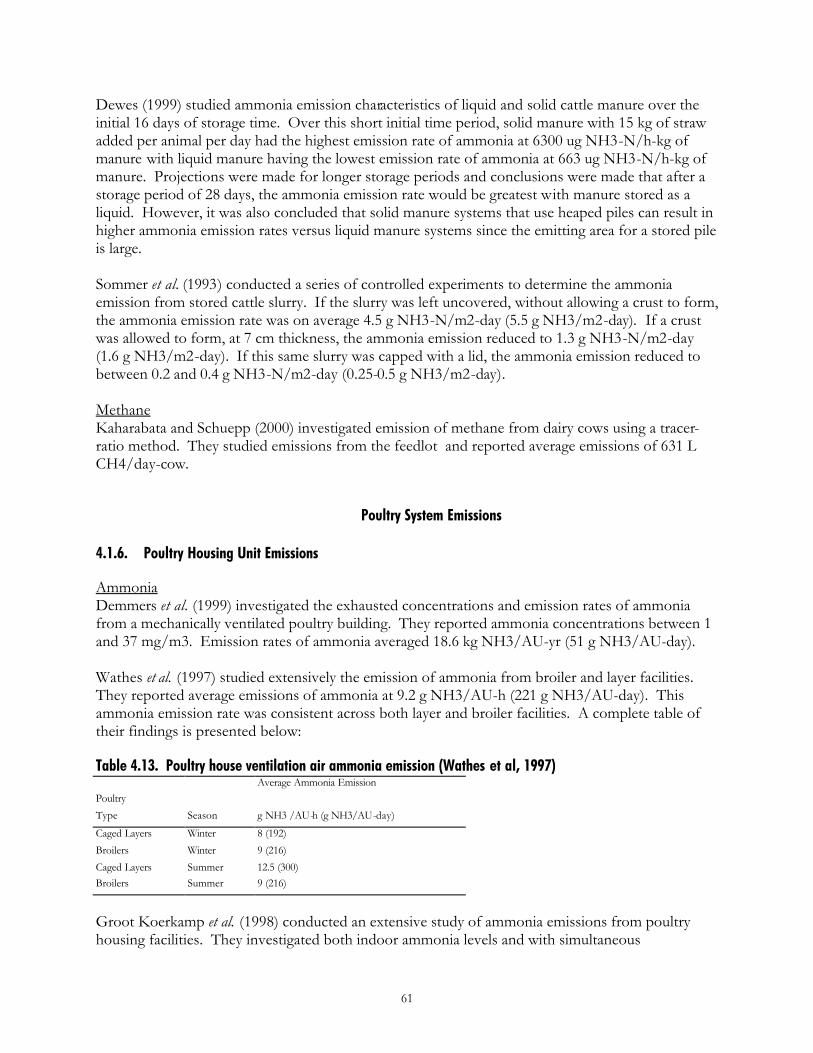
61
Dewes (1999) studied ammonia emission characteristics of liquid and solid cattle manure over the initial 16 days of storage time. Over this short initial time period, solid manure with 15 kg of straw added per animal per day had the highest emission rate of ammonia at 6300 ug NH3-N/h-kg of manure with liquid manure having the lowest emission rate of ammonia at 663 ug NH3-N/h-kg of manure. Projections were made for longer storage periods and conclusions were made that after a storage period of 28 days, the ammonia emission rate would be greatest with manure stored as a liquid. However, it was also concluded that solid manure systems that use heaped piles can result in higher ammonia emission rates versus liquid manure systems since the emitting area for a stored pile is large. Sommer et al. (1993) conducted a series of controlled experiments to determine the ammonia emission from stored cattle slurry. If the slurry was left uncovered, without allowing a crust to form, the ammonia emission rate was on average 4.5 g NH3-N/m2-day (5.5 g NH3/m2-day). If a crust was allowed to form, at 7 cm thickness, the ammonia emission reduced to 1.3 g NH3-N/m2-day (1.6 g NH3/m2-day). If this same slurry was capped with a lid, the ammonia emission reduced to between 0.2 and 0.4 g NH3-N/m2-day (0.25-0.5 g NH3/m2-day). Methane Kaharabata and Schuepp (2000) investigated emission of methane from dairy cows using a tracer-ratio method. They studied emissions from the feedlot and reported average emissions of 631 L CH4/day-cow.
Poultry System Emissions
4.1.6. Poultry Housing Unit Emissions Ammonia Demmers et al. (1999) investigated the exhausted concentrations and emission rates of ammonia from a mechanically ventilated poultry building. They reported ammonia concentrations between 1 and 37 mg/m3. Emission rates of ammonia averaged 18.6 kg NH3/AU-yr (51 g NH3/AU-day). Wathes et al. (1997) studied extensively the emission of ammonia from broiler and layer facilities. They reported average emissions of ammonia at 9.2 g NH3/AU-h (221 g NH3/AU-day). This ammonia emission rate was consistent across both layer and broiler facilities. A complete table of their findings is presented below:
Table 4.13. Poultry house ventilation air ammonia emission (Wathes et al, 1997) Average Ammonia Emission Poultry Type Season g NH3 /AU-h (g NH3/AU-day)
Caged Layers Winter 8 (192) Broilers Winter 9 (216) Caged Layers Summer 12.5 (300) Broilers Summer 9 (216)
Groot Koerkamp et al. (1998) conducted an extensive study of ammonia emissions from poultry housing facilities. They investigated both indoor ammonia levels and with simultaneous
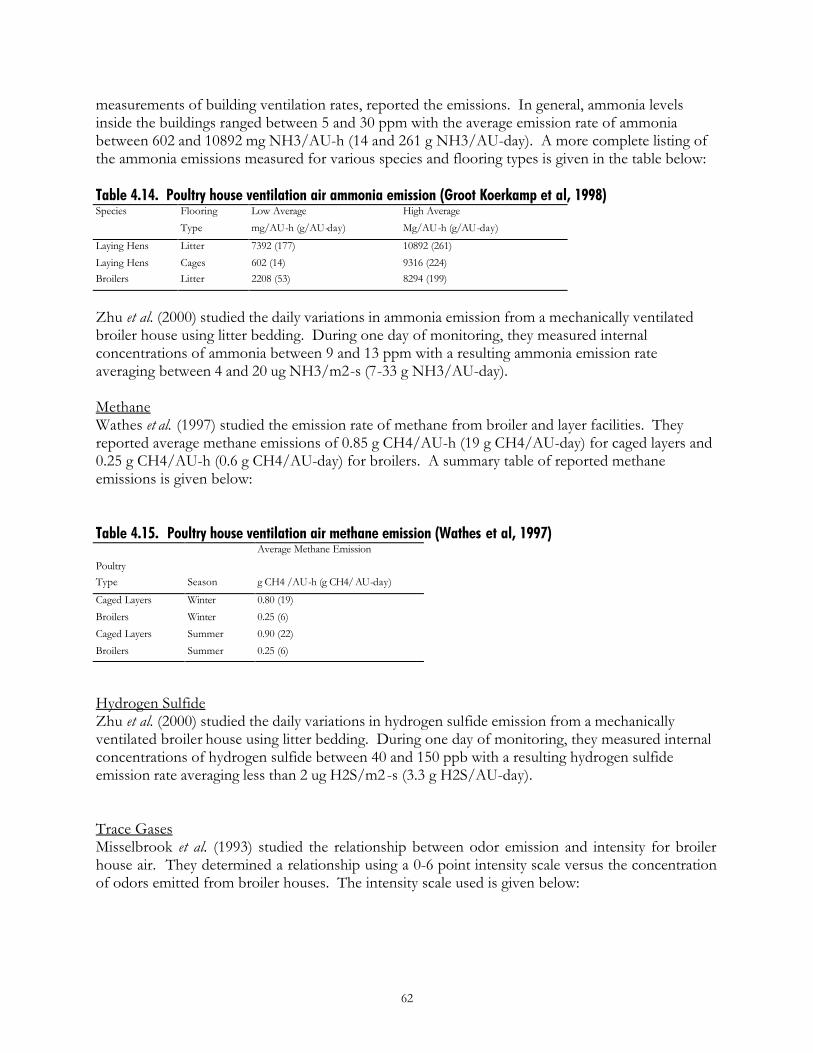
62
measurements of building ventilation rates, reported the emissions. In general, ammonia levels inside the buildings ranged between 5 and 30 ppm with the average emission rate of ammonia between 602 and 10892 mg NH3/AU-h (14 and 261 g NH3/AU-day). A more complete listing of the ammonia emissions measured for various species and flooring types is given in the table below:
Table 4.14. Poultry house ventilation air ammonia emission (Groot Koerkamp et al, 1998) Species Flooring Low Average High Average Type mg/AU-h (g/AU-day) Mg/AU-h (g/AU-day)
Laying Hens Litter 7392 (177) 10892 (261) Laying Hens Cages 602 (14) 9316 (224) Broilers Litter 2208 (53) 8294 (199)
Zhu et al. (2000) studied the daily variations in ammonia emission from a mechanically ventilated broiler house using litter bedding. During one day of monitoring, they measured internal concentrations of ammonia between 9 and 13 ppm with a resulting ammonia emission rate averaging between 4 and 20 ug NH3/m2-s (7-33 g NH3/AU-day). Methane Wathes et al. (1997) studied the emission rate of methane from broiler and layer facilities. They reported average methane emissions of 0.85 g CH4/AU-h (19 g CH4/AU-day) for caged layers and 0.25 g CH4/AU-h (0.6 g CH4/AU-day) for broilers. A summary table of reported methane emissions is given below:
Table 4.15. Poultry house ventilation air methane emission (Wathes et al, 1997) Average Methane Emission Poultry Type Season g CH4 /AU-h (g CH4/ AU-day)
Caged Layers Winter 0.80 (19) Broilers Winter 0.25 (6) Caged Layers Summer 0.90 (22) Broilers Summer 0.25 (6)
Hydrogen Sulfide Zhu et al. (2000) studied the daily variations in hydrogen sulfide emission from a mechanically ventilated broiler house using litter bedding. During one day of monitoring, they measured internal concentrations of hydrogen sulfide between 40 and 150 ppb with a resulting hydrogen sulfide emission rate averaging less than 2 ug H2S/m2 -s (3.3 g H2S/AU-day). Trace Gases Misselbrook et al. (1993) studied the relationship between odor emission and intensity for broiler house air. They determined a relationship using a 0-6 point intensity scale versus the concentration of odors emitted from broiler houses. The intensity scale used is given below:
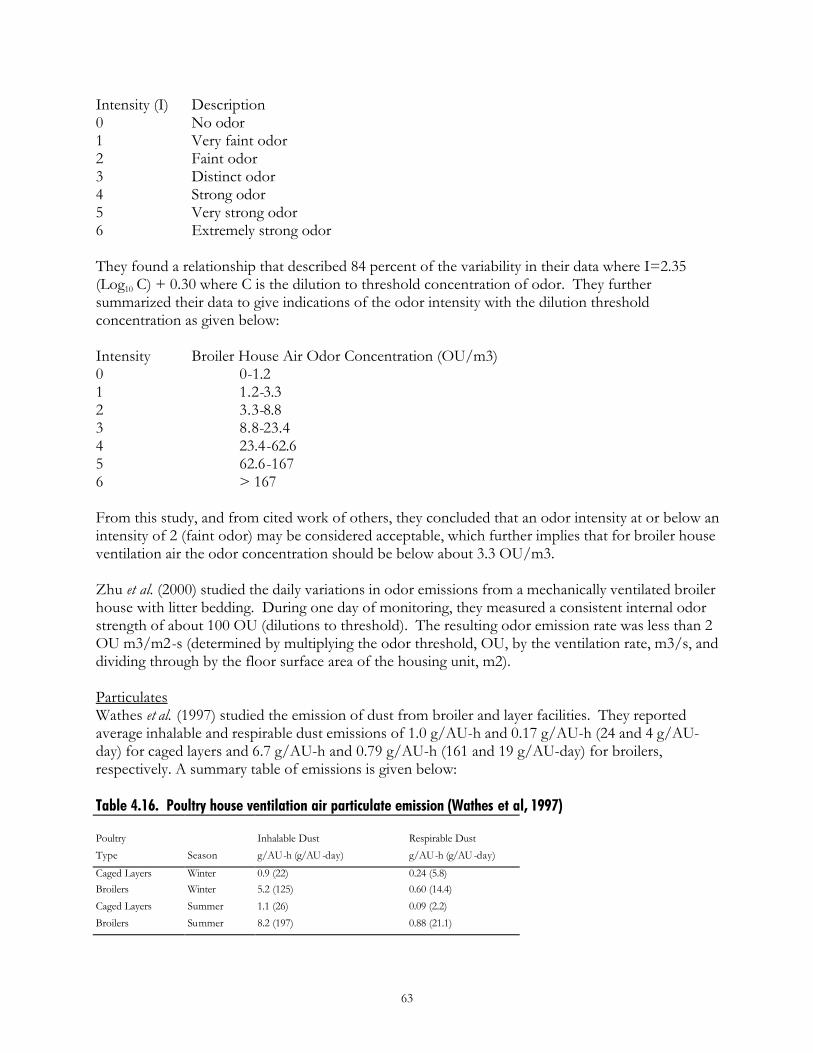
63
Intensity (I) Description 0 No odor 1 Very faint odor 2 Faint odor 3 Distinct odor 4 Strong odor 5 Very strong odor 6 Extremely strong odor They found a relationship that described 84 percent of the variability in their data where I=2.35 (Log10 C) + 0.30 where C is the dilution to threshold concentration of odor. They further summarized their data to give indications of the odor intensity with the dilution threshold concentration as given below: Intensity Broiler House Air Odor Concentration (OU/m3) 0 0-1.2 1 1.2-3.3 2 3.3-8.8 3 8.8-23.4 4 23.4-62.6 5 62.6-167 6 > 167 From this study, and from cited work of others, they concluded that an odor intensity at or below an intensity of 2 (faint odor) may be considered acceptable, which further implies that for broiler house ventilation air the odor concentration should be below about 3.3 OU/m3. Zhu et al. (2000) studied the daily variations in odor emissions from a mechanically ventilated broiler house with litter bedding. During one day of monitoring, they measured a consistent internal odor strength of about 100 OU (dilutions to threshold). The resulting odor emission rate was less than 2 OU m3/m2-s (determined by multiplying the odor threshold, OU, by the ventilation rate, m3/s, and dividing through by the floor surface area of the housing unit, m2). Particulates Wathes et al. (1997) studied the emission of dust from broiler and layer facilities. They reported average inhalable and respirable dust emissions of 1.0 g/AU-h and 0.17 g/AU-h (24 and 4 g/AU-day) for caged layers and 6.7 g/AU-h and 0.79 g/AU-h (161 and 19 g/AU-day) for broilers, respectively. A summary table of emissions is given below:
Table 4.16. Poultry house ventilation air particulate emission (Wathes et al, 1997) Poultry Inhalable Dust Respirable Dust Type Season g/AU-h (g/AU -day) g/AU-h (g/AU -day)
Caged Layers Winter 0.9 (22) 0.24 (5.8) Broilers Winter 5.2 (125) 0.60 (14.4) Caged Layers Summer 1.1 (26) 0.09 (2.2) Broilers Summer 8.2 (197) 0.88 (21.1)
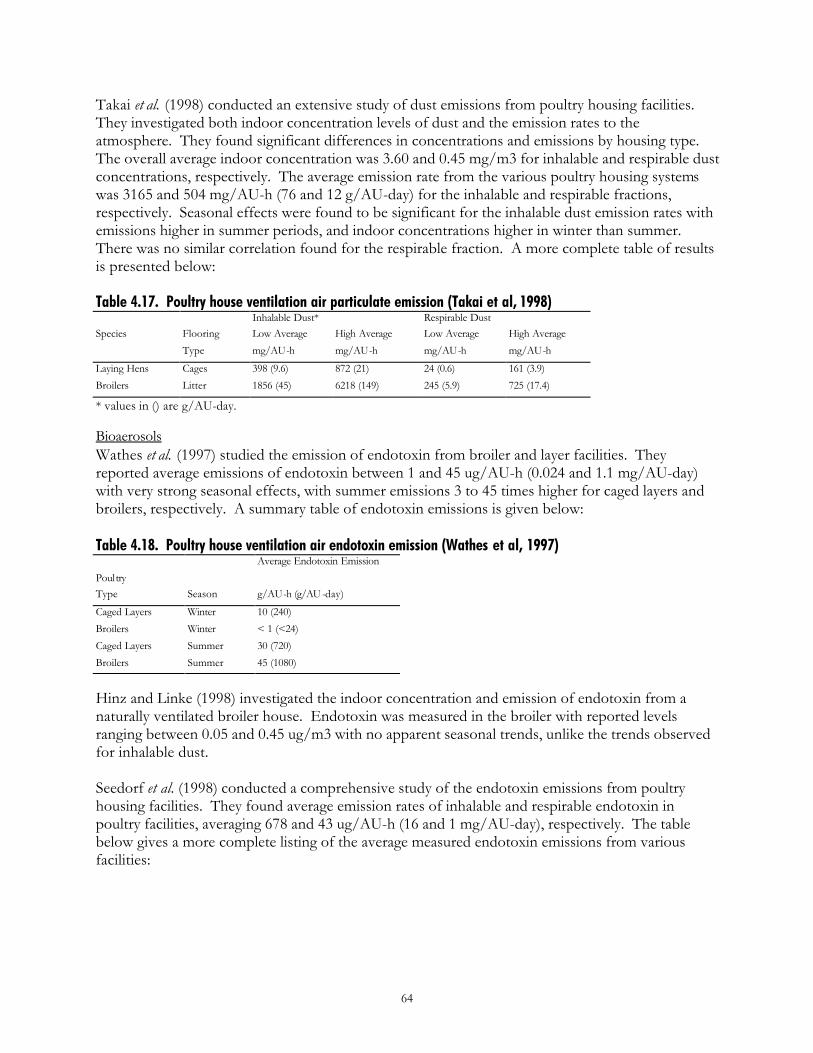
64
Takai et al. (1998) conducted an extensive study of dust emissions from poultry housing facilities. They investigated both indoor concentration levels of dust and the emission rates to the atmosphere. They found significant differences in concentrations and emissions by housing type. The overall average indoor concentration was 3.60 and 0.45 mg/m3 for inhalable and respirable dust concentrations, respectively. The average emission rate from the various poultry housing systems was 3165 and 504 mg/AU-h (76 and 12 g/AU-day) for the inhalable and respirable fractions, respectively. Seasonal effects were found to be significant for the inhalable dust emission rates with emissions higher in summer periods, and indoor concentrations higher in winter than summer. There was no similar correlation found for the respirable fraction. A more complete table of results is presented below:
Table 4.17. Poultry house ventilation air particulate emission (Takai et al, 1998) Inhalable Dust* Respirable Dust Species Flooring Low Average High Average Low Average High Average Type mg/AU-h mg/AU-h mg/AU-h mg/AU-h
Laying Hens Cages 398 (9.6) 872 (21) 24 (0.6) 161 (3.9) Broilers Litter 1856 (45) 6218 (149) 245 (5.9) 725 (17.4)
* values in () are g/AU-day. Bioaerosols Wathes et al. (1997) studied the emission of endotoxin from broiler and layer facilities. They reported average emissions of endotoxin between 1 and 45 ug/AU-h (0.024 and 1.1 mg/AU-day) with very strong seasonal effects, with summer emissions 3 to 45 times higher for caged layers and broilers, respectively. A summary table of endotoxin emissions is given below:
Table 4.18. Poultry house ventilation air endotoxin emission (Wathes et al, 1997) Average Endotoxin Emission Poultry Type Season g/AU-h (g/AU -day)
Caged Layers Winter 10 (240) Broilers Winter < 1 (<24) Caged Layers Summer 30 (720) Broilers Summer 45 (1080)
Hinz and Linke (1998) investigated the indoor concentration and emission of endotoxin from a naturally ventilated broiler house. Endotoxin was measured in the broiler with reported levels ranging between 0.05 and 0.45 ug/m3 with no apparent seasonal trends, unlike the trends observed for inhalable dust. Seedorf et al. (1998) conducted a comprehensive study of the endotoxin emissions from poultry housing facilities. They found average emission rates of inhalable and respirable endotoxin in poultry facilities, averaging 678 and 43 ug/AU-h (16 and 1 mg/AU-day), respectively. The table below gives a more complete listing of the average measured endotoxin emissions from various facilities:
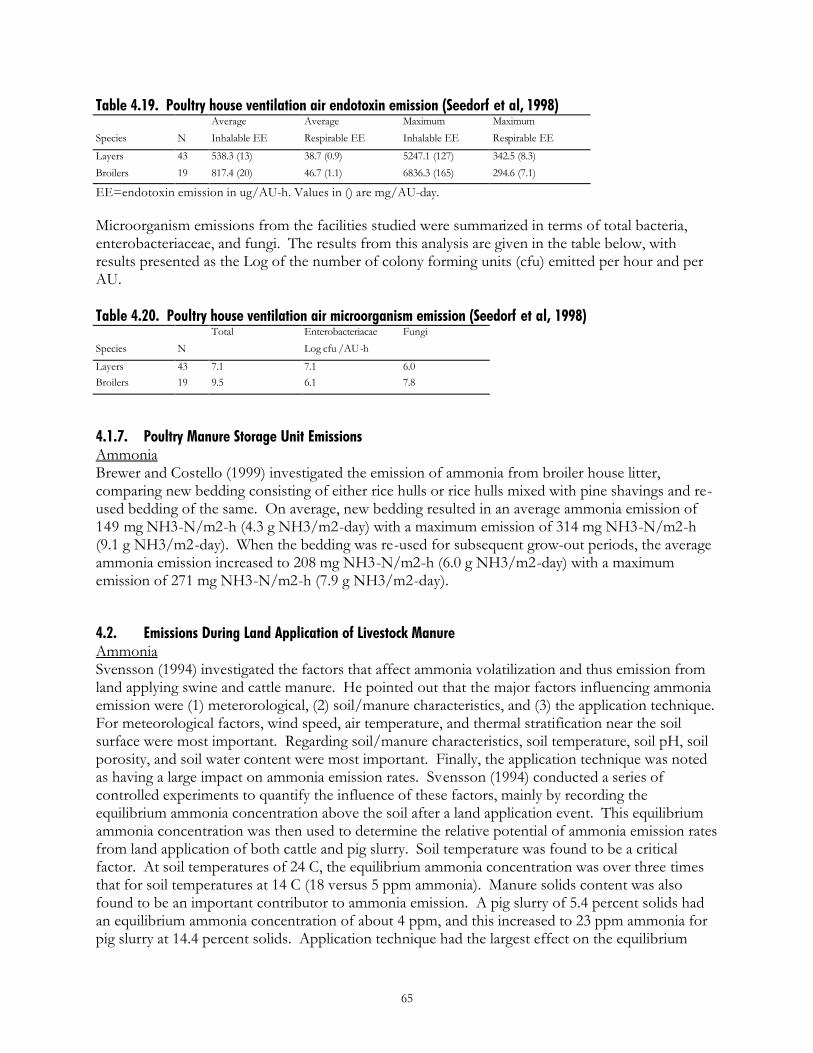
65
Table 4.19. Poultry house ventilation air endotoxin emission (Seedorf et al, 1998) Average Average Maximum Maximum Species N Inhalable EE Respirable EE Inhalable EE Respirable EE
Layers 43 538.3 (13) 38.7 (0.9) 5247.1 (127) 342.5 (8.3) Broilers 19 817.4 (20) 46.7 (1.1) 6836.3 (165) 294.6 (7.1)
EE=endotoxin emission in ug/AU-h. Values in () are mg/AU-day.
Microorganism emissions from the facilities studied were summarized in terms of total bacteria, enterobacteriaceae, and fungi. The results from this analysis are given in the table below, with results presented as the Log of the number of colony forming units (cfu) emitted per hour and per AU.
Table 4.20. Poultry house ventilation air microorganism emission (Seedorf et al, 1998) Total Enterobacteriacae Fungi Species N Log cfu /AU-h
Layers 43 7.1 7.1 6.0 Broilers 19 9.5 6.1 7.8
4.1.7. Poultry Manure Storage Unit Emissions Ammonia Brewer and Costello (1999) investigated the emission of ammonia from broiler house litter, comparing new bedding consisting of either rice hulls or rice hulls mixed with pine shavings and re-used bedding of the same. On average, new bedding resulted in an average ammonia emission of 149 mg NH3-N/m2-h (4.3 g NH3/m2-day) with a maximum emission of 314 mg NH3-N/m2-h (9.1 g NH3/m2-day). When the bedding was re-used for subsequent grow-out periods, the average ammonia emission increased to 208 mg NH3-N/m2-h (6.0 g NH3/m2-day) with a maximum emission of 271 mg NH3-N/m2-h (7.9 g NH3/m2-day). 4.2. Emissions During Land Application of Livestock Manure Ammonia Svensson (1994) investigated the factors that affect ammonia volatilization and thus emission from land applying swine and cattle manure. He pointed out that the major factors influencing ammonia emission were (1) meterorological, (2) soil/manure characteristics, and (3) the application technique. For meteorological factors, wind speed, air temperature, and thermal stratification near the soil surface were most important. Regarding soil/manure characteristics, soil temperature, soil pH, soil porosity, and soil water content were most important. Finally, the application technique was noted as having a large impact on ammonia emission rates. Svensson (1994) conducted a series of controlled experiments to quantify the influence of these factors, mainly by recording the equilibrium ammonia concentration above the soil after a land application event. This equilibrium ammonia concentration was then used to determine the relative potential of ammonia emission rates from land application of both cattle and pig slurry. Soil temperature was found to be a critical factor. At soil temperatures of 24 C, the equilibrium ammonia concentration was over three times that for soil temperatures at 14 C (18 versus 5 ppm ammonia). Manure solids content was also found to be an important contributor to ammonia emission. A pig slurry of 5.4 percent solids had an equilibrium ammonia concentration of about 4 ppm, and this increased to 23 ppm ammonia for pig slurry at 14.4 percent solids. Application technique had the largest effect on the equilibrium
66
ammonia concentration above the soil surface after spreading. If the slurry was injected, the average equilibrium ammonia concentration one hour after land applying was less than 1 ppm. If this same slurry was surface applied with no follow-up coverage, the equilibrium ammonia concentration one hour after land applying rose to 39 ppm. Svensson (1994) further investigated the influence of land application technique using pig urine only. If this “slurry” was broadcast spread with no follow-up cover, ammonia was emitted at about 700 g NH3/hectare-h during the first four hours. If this same slurry was broadcast spread with immediate covering via harrowing, the ammonia emission reduced to about 120 g NH3/hectare-h over the same time period, representing an 83 percent reduction. Clearly, injecting or immediate covering of slurry has a substantial reducing effect on ammonia emission. Trace Gases Misselbrook et al. (1993) studied the relationship between odor emission and intensity for land applied swine manure. They determined a relationship between a 0-6 point intensity scale and the concentration of odors emitted from land applied slurry. Their intensity scale used is given below: Intensity (I) Description 0 No odor 1 Very faint odor 2 Faint odor 3 Distinct odor 4 Strong odor 5 Very strong odor 6 Extremely strong odor They found a relationship that described 68 percent of the variability in their data with I=1.61(Log10 C) + 0.45 where C is the dilution to threshold concentration of odor. They further summarized their data to give indications of the odor intensity with the dilution threshold concentration as given below: Intensity Pig Slurry Odor Concentration (OU/m3) 0 0-1.1 1 1.1-4.5 2 4.5-18.8 3 18.8-78.9 4 78.9-331 5 331-1390 6 > 1390 From this study, and from cited work of others, they concluded that an odor intensity at or below an intensity of 2 (faint odor) may be considered acceptable, which further implies that for pig slurry the odor concentration should be on average below about 4.5 OU/m3. For a barely perceptible odor, indicated by an Intensity level of 1, the odor concentration should be on average below about 1.1 OU/m3. Pain et al. (1991) investigated the concentrations and emissions of odors from land applied pig and cattle slurry. They investigated the emission rates of odors as a function of the land application method, and found odor emission rates (OU/s-m3 of slurry applied) of 8600 if the slurry was
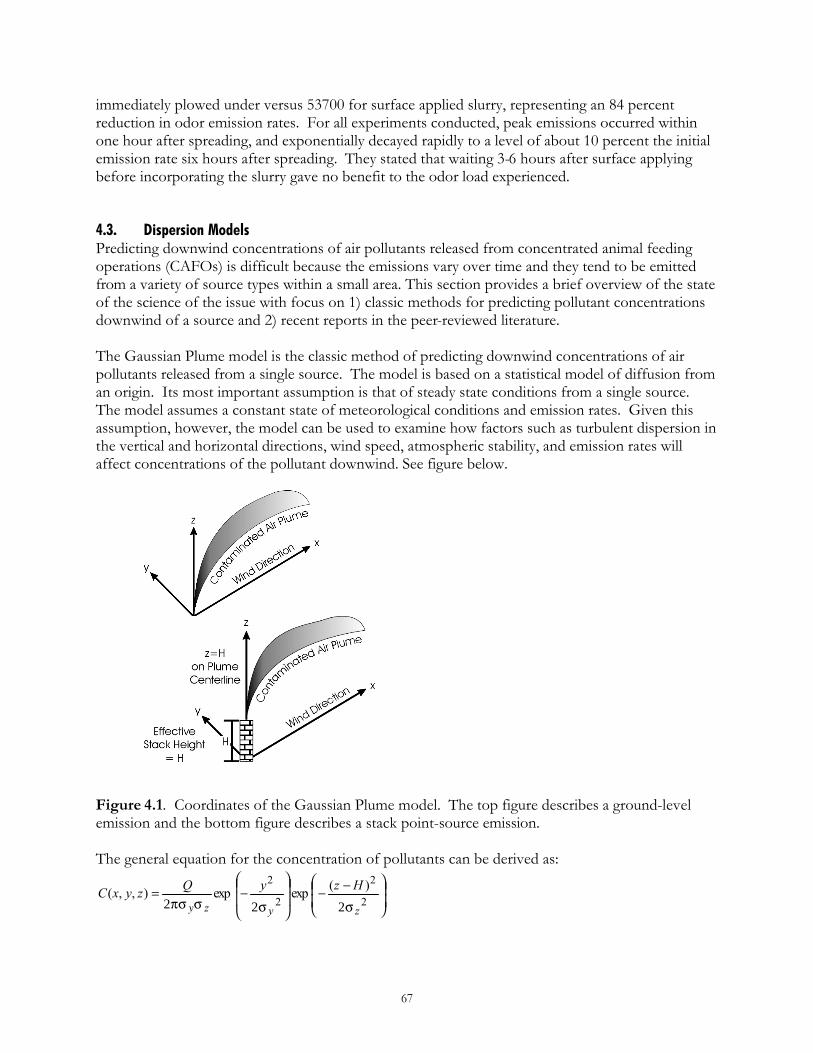
67
immediately plowed under versus 53700 for surface applied slurry, representing an 84 percent reduction in odor emission rates. For all experiments conducted, peak emissions occurred within one hour after spreading, and exponentially decayed rapidly to a level of about 10 percent the initial emission rate six hours after spreading. They stated that waiting 3-6 hours after surface applying before incorporating the slurry gave no benefit to the odor load experienced. 4.3. Dispersion Models Predicting downwind concentrations of air pollutants released from concentrated animal feeding operations (CAFOs) is difficult because the emissions vary over time and they tend to be emitted from a variety of source types within a small area. This section provides a brief overview of the state of the science of the issue with focus on 1) classic methods for predicting pollutant concentrations downwind of a source and 2) recent reports in the peer-reviewed literature. The Gaussian Plume model is the classic method of predicting downwind concentrations of air pollutants released from a single source. The model is based on a statistical model of diffusion from an origin. Its most important assumption is that of steady state conditions from a single source. The model assumes a constant state of meteorological conditions and emission rates. Given this assumption, however, the model can be used to examine how factors such as turbulent dispersion in the vertical and horizontal directions, wind speed, atmospheric stability, and emission rates will affect concentrations of the pollutant downwind. See figure below.
Figure 4.1. Coordinates of the Gaussian Plume model. The top figure describes a ground-level emission and the bottom figure describes a stack point-source emission. The general equation for the concentration of pollutants can be derived as:
−−
−=
2
2
2
2
2σ
)(exp2σ
exp2πσ σ
),,(zyzy
HzyQzyxC
68
where C is the concentration (mass/volume); x is the distance downwind of the source; y is the horizontal distance perpendicular to the x direction; z is altitude; Q is the emission rate (mass/time); σy and σz are the dispersion coefficients in the horizontal and vertical directions, respectively; and H is the effective stack height of the plume. The Gaussian plume model is a reasonable screening level approach for estimating the concentration of pollutants released from a source. It can be modified to incorporate reflection or absorption of the pollutants by the ground and reactions in the atmosphere. This model is useful in examining the effect of atmospheric stability and in estimating the point of maximum downwind concentrations. Use of the Gaussian plume model can be useful in addressing questions about downwind concentrations of air pollutants from CAFOs such as:
• What level of improvement in air concentrations is predicted with a reduction in the emission rate?
• What wind directions and atmospheric stabilities will result in higher concentrations? • What affect would installation of a stack exhaust have on downwind concentrations? • How do meteorological conditions affect the diurnal and seasonal variability of air
concentrations? • What is the relationship between decreasing concentrations and distance from the source?
4.3.1 EPA Dispersion Models There are a number of U.S. EPA approved computer models that are based on the Gaussian plume approach, with specific adaptations for local terrain, non-constant emissions, ground level and small area sources, and atmospheric deposition. As noted above, the Gaussian Plume models are especially useful as screening tools, designed to quickly address basic hypotheses about the relationship between sources and downwind concentrations. Several dispersion models approved by the EPA have been evaluated for their use in association with confinement operations. The Industrial Source Complex Short Term (ISCST3) model is commonly used to model the dispersion from industrial point-sources. This model and two others: the AMS/EPA Regulatory Model (AERMOD), and the non-steady state CALPUFF model were evaluated for their effectiveness in modeling emissions from feedlot facilities (Earth Tech, 2001). The sophistication of the AERMOD and CALPUFF models give them certain advantages such as: flexibility for defining the area source geometry (AERMOD); and a realistic simulation of multi-facility impact assessment (CALPUFF). However, the ISCST3 model was chosen as the best model for evaluation of a single facility primarily because of its ease of use and familiarity. This model has been used in the past for modeling emissions from agricultural sources because, in addition to modeling plumes from tall stacks, it can also account for ground-level sources as would be the case for gases emitted from a manure pit (Gassman, 1992). Modifications to this model have also been made to increase the accuracy of its use for hydrogen sulfide and ammonia by the application of specific dispersion coefficients for these gases (Rege and Tock, 1996). 4.3.2. Livestock System Based Dispersion Models Dispersion models have been used to predict downwind concentrations of ammonia from CAFO facilities. Quinn et al. (2001) tested several atmospheric dispersion models. They predicted air concentrations close (<100 m) to the CAFO source with some success. They tested a
69
computational fluid dynamics (CFD) model linked to a modified diffusion model. The latter approach best reasonably fit the data although it underestimated concentrations for the majority of the points. The modeling was most successful in predicting the decrease in concentration with distance for near (<100m) sites. It should be noted that the success of this study is due, in part, to the design of the study. In this study, ammonia gas was released in known quantity, so the modeling effort benefited from use of a quantitative emission source. Dispersion of odorous compounds has been considered using a modified Gaussian plume model. In one of the earlier papers on this subject, Carney and Dodd (1989) compared a modified Gaussian plume model used for odor dispersion with actual data from a number of sources, including a 450-sow swine facility, and determined that modeling adequately predicted actual plume dispersion. However, Li et al. (1994) found that the Gaussian model was inadequate for odor prediction from a 200-sow facility. The model’s predicted plumes were too wide compared to those in the field and the model’s emission rates were unreasonably high. Furthermore, Heinemann and Wahanik (1998) studied the application of this model to the dispersion of odors from a composting facility and found that instantaneous measurements taken during field samples may differ considerably from model predictions because of the large averaging time used by the model. Gassman (1992) reviewed odor modeling using the Gaussian-plume method and stated that the method was adequate when used on a relative basis for comparing differences between different scenarios, but did not recommend this method for finding absolute odor concentrations. One of the ultimate utilities of odor-dispersion modeling is its use for estimating odor concentrations for the purpose of establishing setback distances and dilution ratios (Jacobson et al., 2001; Zhu et al., 2000b). However, researchers recognize that the use of dispersion models for this purpose will involve considerable field validation, which includes an understanding of the effects of various weather conditions on model accuracy and odor intensity. Previous field validation studies have demonstrated that the INPUFF-2 dispersion model simulated odor intensity in agreement with field odor measurements and may be the best model for the purpose of establishing odor setback distances (Zhu et al., 2000b; Jacobson et al., 2000).
4.3.3 Uncertainties and Recommended Uses of Models for CAFO Emissions The Gaussian plume model and its modifications assume an emission source that is singular or made up of specific single sources: a point source, line source, or homogeneous area sources. Emissions from CAFOs are none of these. Animal operations in Iowa are increasingly compacted, and some facilities include an integration of the animal life-cycle from farrow to finish as well as outside manure storages (See Figure 4.2). There are a variety of potential gas and particulate emission sources. Possible sources may include farrowing/nursery barns, finishing barns, outside storages and fields where manure is applied. When barns are ventilated with single fans, the sources may be modeled as point sources, but outside storage units are clearly more like area sources. Barns with a series of ventilation fans behave as something in between area and point sources. Modeling emission sources from such a variety of source types makes achievement of an accurate prediction difficult. In addition, the emission rates often vary throughout the day, with local climate, and as the need for ventilation changes. For these reasons, Gaussian plume models will not excel at predicting actual pollutant concentrations downwind from a source or sources.
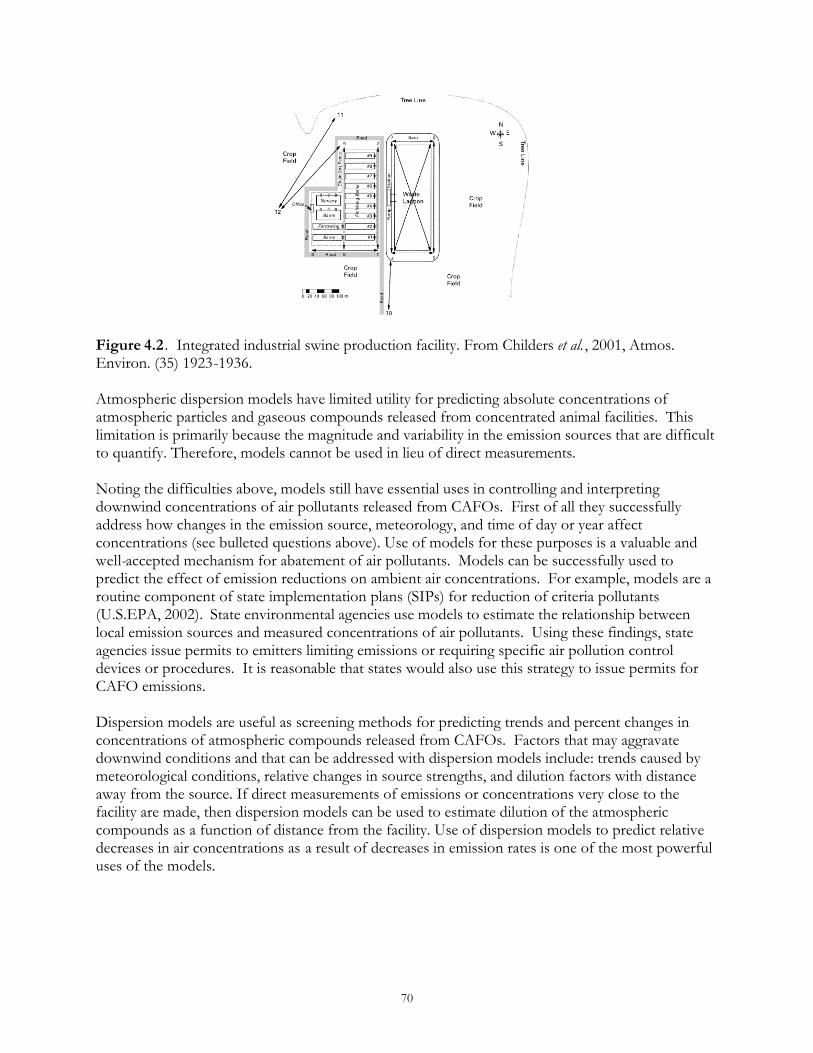
70
Figure 4.2 . Integrated industrial swine production facility. From Childers et al., 2001, Atmos. Environ. (35) 1923-1936. Atmospheric dispersion models have limited utility for predicting absolute concentrations of atmospheric particles and gaseous compounds released from concentrated animal facilities. This limitation is primarily because the magnitude and variability in the emission sources that are difficult to quantify. Therefore, models cannot be used in lieu of direct measurements. Noting the difficulties above, models still have essential uses in controlling and interpreting downwind concentrations of air pollutants released from CAFOs. First of all they successfully address how changes in the emission source, meteorology, and time of day or year affect concentrations (see bulleted questions above). Use of models for these purposes is a valuable and well-accepted mechanism for abatement of air pollutants. Models can be successfully used to predict the effect of emission reductions on ambient air concentrations. For example, models are a routine component of state implementation plans (SIPs) for reduction of criteria pollutants (U.S.EPA, 2002). State environmental agencies use models to estimate the relationship between local emission sources and measured concentrations of air pollutants. Using these findings, state agencies issue permits to emitters limiting emissions or requiring specific air pollution control devices or procedures. It is reasonable that states would also use this strategy to issue permits for CAFO emissions. Dispersion models are useful as screening methods for predicting trends and percent changes in concentrations of atmospheric compounds released from CAFOs. Factors that may aggravate downwind conditions and that can be addressed with dispersion models include: trends caused by meteorological conditions, relative changes in source strengths, and dilution factors with distance away from the source. If direct measurements of emissions or concentrations very close to the facility are made, then dispersion models can be used to estimate dilution of the atmospheric compounds as a function of distance from the facility. Use of dispersion models to predict relative decreases in air concentrations as a result of decreases in emission rates is one of the most powerful uses of the models.
71
4.4. Evaluating Community Exposures to Odor One method for evaluating the influence of CAFOs on surrounding residences is to review odor complaint records and the methods used for evaluating these complaints. Several states have procedures in place for documenting and evaluating odor complaints, as discussed in this section. There is not a consistent method used in addressing odor complaints from animal feeding operations in the United States. Not all states have odor standards to address odor complaints. Some states use an arbitrary odor scale. Some states use dilution-to-threshold for odor evaluation. Others states use hydrogen sulfide as a surrogate method to measure odors. In Iowa, one of the most frequent complaints from livestock operations is odor. Since Iowa has no regulations pertaining to odors, some field offices do not record odor complaints. Between July 1994 to October 2001, Iowa had 306 odor complaints. North Carolina Department of Air Quality (DAQ) started keeping a database for odors in February 1999. North Carolina has reported 415 separate complaints with a follow-up inspection of all complaints. As of December 2001, DAQ in North Carolina confirmed the presence of "objectionable odors" at 6 complainant locations involving 11 farms. Most of the complaints reported in Iowa and North Carolina were from swine facilities. Missouri has a state odor standard for industrial emission which will also be applied to the Class 1A CAFO's beginning January 2002. 4.4.1. Methods of evaluation of complaints Some states do have odor standards or regulations governing odor emissions from industry, livestock or both. The methods on how complaints are addressed ranges from lay observers, to trained observers going to the site from a regulatory agency to simply registering the complaints from an individual. Several states and municipalities have odor standards. The methods used to evaluate odor complaints range from a person to a group of people going to the location of the complaint and observing the source, strength of odor at the location, or measuring a surrogate odorous gas concentrations. There is limited data available on odor complaints from livestock. Methods of evaluation complaint evaluation by states Methods of odor evaluation are not consistent among states. The methods range from no protocol to arbitrary methods, to odor threshold measurement, to using hydrogen sulfide as a surrogate method of measurement. The length of time for evaluation and protocol for evaluation also differs. No protocol Some states do not regulate odors and therefore do not have an approved procedure for evaluating odor complaints. Iowa currently does not have an odor standard; therefore, does not have an adopted protocol for measuring odors. The livestock odor complaints in Iowa basically go unverified, since there are no standards. Within Iowa some municipalities have standards which use the scentometer to evaluate odors.
72
Arbitrary protocol Some states use an arbitrary odor scale to evaluate odor strength with 0 being no odor and a higher number being a very strong odor. North Carolina uses an arbitrary scale of 0 to 5 with 0 being no odor and 5 being very odorous. This method often uses a team approach of more than one person taken to the site for investigation. Average values from the panel are used to evaluate odor strength. Odor Threshold The scentometer made by Barnebey and Sutcliffe is the primary method used when the protocol uses dilution-to threshold techniques for evaluating odors. Table 1 shows (Sweeten, 1990) a list of states that uses this method as a standard. The accepted standard level of odor threshold varies from state to state as shown in the table. Also the location of measurement differs between standards used, i.e., on site, property line, or neighbor’s residence. Hydrogen sulfide Hydrogen sulfide concentrations are sometimes used as a substitute for odor evaluation. This standard is used in both Minnesota and Nebraska. Minnesota has a state hydrogen sulfide standard at 30 ppb not to be exceeded more than twice per 5 days in a 30-minute time period at the property line. Minnesota allows for a time period of 21 days during the year when this standard of 30 ppb is exempt. Nebraska has a similar standard of 100 ppb that cannot be exceeded more than 30 minutes. Both of these states give the counties jurisdiction for siting livestock facilities and the allowable odor level is left up to the county. 4.4.2. Odor Complaint Evaluation Discussion by State Iowa The Iowa Department of Natural Resources (DNR) Compliance and Enforcement Bureau consists of six field offices that are located throughout the state. Each field office is responsible for conducting routine inspections of agricultural facilities and handling complaints from the public in their designated counties. Animal feeding operations, or AFOs, are the source of many types of complaints, including well contamination, waste runoff, improper disposal of dead animals, and many others. Although the field offices receive a variety of complaints, one of the most frequent causes of complaints is odor. Animal feeding operations generate odors from several sources, such as the buildings where animals are housed, waste treatment systems such as lagoons or earthen basins, and the spreading of manure. More specifically, odors can occur from: • stockpiling manure, • untimely disposal of dead animals, • improper compost pile management, • spilling manure on roads or highways, • spreading manure on snow, and • spreading manure without injection.
Citizens that have complaints are encouraged to call the field office in their area. Odor complaints taken at field offices are not referred to the Air Quality Bureau or central offices. Although similar in nature, the complaint forms vary for each field office. Each contains the following information:
• the date the complaint was received,
73
• basic information on the complainant, • basic information on who the complaint is against, • program area (such as wastewater, air, solid waste, etc.), • a statement of the complaint, and • action/resolution. The program area section lists different areas in which to classify the compliant, but varies in content and detail for each form. Some forms list the DNR employee to whom the complaint was referred, and others assign each complaint a complaint number. After a complaint form is filled out, each complaint gets logged in a spreadsheet. Again, although similar in nature, the categories listed in the spreadsheet vary for each field office. Several issues arose while completing this study: • Most odor complaints go unrecorded at the field offices. There is no written protocol
established for receiving and recording incoming odor complaints because the DNR does not regulate odor.
• Many odor complaints are never called in. Once citizens learn that there are no odor regulations, they realize the DNR may not be able help them, so they don’t place the call.
• Citizens may call about odor and an additional problem, and the complaint gets logged under the additional problem.
Odor complaint records involving confined animal feeding operations in the state of Iowa were evaluated from 7/1/94 to the present (10/15/01). There were 306 total complaints, which fell into the following livestock categories: 86.9% swine, 5.6% cattle, 3.9% poultry, 3.6% horse, and <1% ostrich. Several field office staff made the statement that most complaints occur during spring and fall due to manure application. This may also be attributed to the amount of time people spend outdoors. There is a lack of consistency in recording, processing, and responding to odor complaints in Iowa. Since Iowa has no regulations pertaining to odor, some field offices do not record complaints when odor is the primary concern. There is no written protocol established for receiving and recording incoming odor complaints. The complaint form should be standardized for each field office as well as the central offices, and the database system where complaint records finally end up should also be standardized. A well organized complaint system for the state of Iowa would allow simple queries that could quickly determine how many times a facility has been referred, or how many times a certain individual has called in a complaint. Missouri The state of Missouri has an odor standard for industrial emissions using the scentometer. Missouri's odor standard states that no person may cause, permit, or allow the emission of odorous matter in concentrations and frequencies or for durations that odor can be perceived when one (1) volume of odorous air is diluted with seven (7) volumes of odor-free air for two (2) separate trials not less than fifteen (15) minutes apart within the period of one (1) hour. One exception of this standard was livestock production units. Class 1A CAFOs; however, was added to the list of regulated odors. A Class 1A livestock operation has a population of greater than 4,900 head of dairy cows; 17,500 head of finishing hogs; or 210,000 layer hens. Missouri has 20 Class 1A CAFOs. All 1A CAFOs operating on or after January 1, 1999, shall prepare and implement an odor control plan.
74
These plans must be submitted no later than July 1, 2000. After January 1, 2002, no Class 1A Concentrated Animal Feeding Operation (CAFOs) may cause, permit or allow the emission of odorous matter in concentrations and frequencies or for durations that the odor can be perceived when one (1) volume of odorous air is diluted with five and four-tenths (5.4) volumes of odor-free air for two separate trials not less than fifteen minutes apart within the period of one hour. This odor evaluation shall be taken at a site not at the installation and will be used as a screening evaluation. A positive screening evaluation for odor shall require an odor sample to be taken and evaluated by olfactometry. There were no odor complaint charts found for the state of Missouri. North Carolina North Carolina uses an arbitrary scale of 0 to 5 for panel members to evaluate odor complaints on site. Zero is no odor detected. A 5 is considered a very strong odor. Normally, two or more observers go to the complainant site to determine if an odor problem exists. This sometimes requires evaluation during night-time conditions. The Department of Air Quality (DAQ) in North Carolina is maintaining a database of complainants and complaint locations. The DAQ database was begun February 23, 1999. The following information was gathered from the database: • There have been 255 individual complainants/complaint locations listed in their database.
There was a DAQ staff follow-up site visit in each case. • There were 415 separate complaints listed in the database from the above complainants. • As of (December, 2001), DAQ regional inspectors have confirmed the presence of
"objectionable odors" at 6 complainant locations involving 11 farms. • The Director has required the submission of 6 BMPs per regulations for 5 of the 6 complainant
locations. • For those sites where the presence of objectionable odors was confirmed, it took between 7 and
14 visits by DAQ staff to confirm the presence of the objectionable odor in response to a complaint. Each odor determination investigation typically requires 2 or more DAQ staff and most objectionable odor conditions occur outside of normal business hours.
• The odor complaints were greatest in 1999, lesser in 2000 and 2001 (Saunders, 2001). • Most complaints are from smaller units that fall below the required size for odor management
plans (Saunders, 2001). Odor Management Plans are required under DAQ, 2D.1802(d), for swine operations based upon steady state live weight (SSLW). The regulations have the following schedule for submittal. • January 15, 2001, number of farms with SSLW of more than 4 million pounds required to
submit odor management plan response to DAQ;7 farms. • July 15, 2001, number of farms with SSLW of more than 2 million pounds but less than 4
million pounds required to submit odor management plan response to DAQ;78 farms.
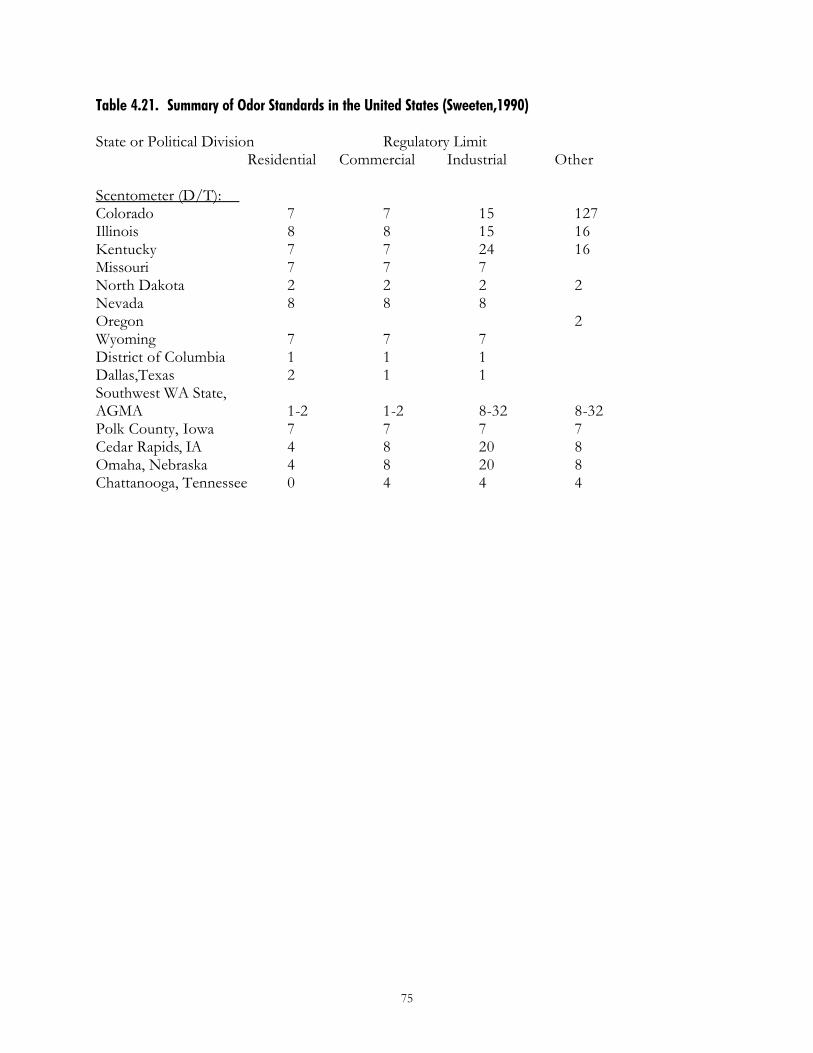
75
Table 4.21. Summary of Odor Standards in the United States (Sweeten,1990) State or Political Division Regulatory Limit Residential Commercial Industrial Other Scentometer (D/T): Colorado 7 7 15 127 Illinois 8 8 15 16 Kentucky 7 7 24 16 Missouri 7 7 7 North Dakota 2 2 2 2 Nevada 8 8 8 Oregon 2 Wyoming 7 7 7 District of Columbia 1 1 1 Dallas,Texas 2 1 1 Southwest WA State, AGMA 1-2 1-2 8-32 8-32 Polk County, Iowa 7 7 7 7 Cedar Rapids, IA 4 8 20 8 Omaha, Nebraska 4 8 20 8 Chattanooga, Tennessee 0 4 4 4
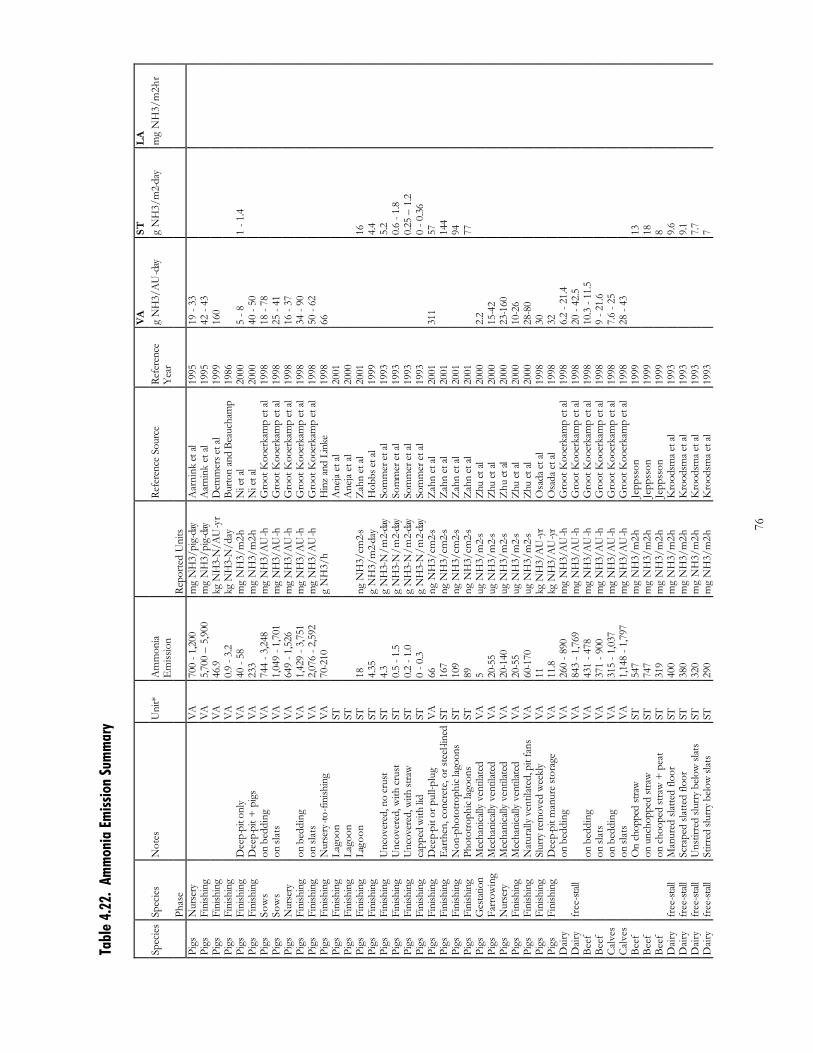
76
Tabl
e 4.
22.
Amm
onia
Em
issio
n Su
mm
ary
VA
ST
LA
Spec
ies
Spec
ies
Not
es
Uni
t*
Am
mon
ia E
miss
ion
Re
fere
nce
Sour
ce
Refe
renc
e Y
ear
g N
H3/
AU
-day
g
NH
3/m
2-da
y m
g N
H3/
m2-h
r
Ph
ase
Re
porte
d U
nits
Pigs
N
urse
ry
V
A
700
- 1,2
00
mg
NH
3/pi
g-da
y A
arni
nk e
t al
1995
19
- 33
Pi
gs
Fini
shin
g
VA
5,
700
– 5,
900
mg
NH
3/pi
g-da
y A
arni
nk e
t al
1995
42
- 43
Pi
gs
Fini
shin
g
VA
46
.9
kg N
H3-
N/A
U-y
r D
emm
ers e
t al
1999
16
0
Pi
gs
Fini
shin
g
VA
0.
9 - 3
.2
kg N
H3-
N/d
ay
Burto
n an
d Be
auch
amp
1986
Pigs
Fi
nish
ing
Dee
p-pi
t onl
y V
A
40 -
58
mg
NH
3/m
2-h
Ni e
t al
2000
5
- 8
1 - 1
.4
Pi
gs
Fini
shin
g D
eep-
pit +
pig
s V
A
233
mg
NH
3/m
2-h
Ni e
t al
2000
40
- 50
Pi
gs
Sow
s on
bed
ding
V
A
744
- 3,2
48
mg
NH
3/A
U-h
G
root
Koo
erka
mp
et a
l 19
98
18 -
78
Pigs
So
ws
on sl
ats
VA
1,
049
- 1,7
01
mg
NH
3/A
U-h
G
root
Koo
erka
mp
et a
l 19
98
25 -
41
Pigs
N
urse
ry
V
A
649
- 1,5
26
mg
NH
3/A
U-h
G
root
Koo
erka
mp
et a
l 19
98
16 -
37
Pigs
Fi
nish
ing
on b
eddi
ng
VA
1,
429
- 3,7
51
mg
NH
3/A
U-h
G
root
Koo
erka
mp
et a
l 19
98
34 -
90
Pigs
Fi
nish
ing
on sl
ats
VA
2,
076
- 2,5
92
mg
NH
3/A
U-h
G
root
Koo
erka
mp
et a
l 19
98
50 -
62
Pigs
Fi
nish
ing
Nur
sery
-to-fi
nish
ing
VA
70
-210
g
NH
3/h
Hin
z an
d Li
nke
1998
66
Pi
gs
Fini
shin
g La
goon
ST
A
neja
et al
20
01
Pi
gs
Fini
shin
g La
goon
ST
A
neja
et al
20
00
Pi
gs
Fini
shin
g La
goon
ST
18
ng
NH
3/cm
2-s
Zah
n et
al
2001
16
Pi
gs
Fini
shin
g
ST
4.35
g
NH
3/m
2-da
y H
obbs
et a
l 19
99
4.
4
Pigs
Fi
nish
ing
Unc
over
ed, n
o cr
ust
ST
4.3
g N
H3-
N/m
2-da
y So
mm
er e
t al
1993
5.2
Pi
gs
Fini
shin
g U
ncov
ered
, with
cru
st
ST
0.5
- 1.5
g
NH
3-N
/m2-
day
Som
mer
et a
l 19
93
0.
6 - 1
.8
Pi
gs
Fini
shin
g U
ncov
ered
, with
stra
w
ST
0.2
- 1.0
g
NH
3-N
/m2-
day
Som
mer
et a
l 19
93
0.
25 –
1.2
Pigs
Fi
nish
ing
capp
ed w
ith li
d ST
0
- 0.3
g
NH
3-N
/m2-
day
Som
mer
et a
l 19
93
0
- 0.3
6
Pigs
Fi
nish
ing
Dee
p-pi
t or p
ull-p
lug
VA
66
ng
NH
3/cm
2-s
Zah
n et
al
2001
31
1 57
Pigs
Fi
nish
ing
Ear
then
, con
cret
e, or
stee
l-line
d ST
16
7 ng
NH
3/cm
2-s
Zah
n et
al
2001
144
Pi
gs
Fini
shin
g N
on-p
hoto
troph
ic la
goon
s ST
10
9 ng
NH
3/cm
2-s
Zah
n et
al
2001
94
Pi
gs
Fini
shin
g Ph
otot
roph
ic la
goon
s ST
89
ng
NH
3/cm
2-s
Zah
n et
al
2001
77
Pi
gs
Ges
tatio
n M
echa
nica
lly v
entil
ated
V
A
5 ug
NH
3/m
2-s
Zhu
et al
20
00
2.2
Pigs
Fa
rrow
ing
Mec
hani
cally
ven
tilat
ed
VA
20
-55
ug N
H3/
m2-
s Zh
u et
al
2000
15
-42
Pigs
N
urse
ry
Mec
hani
cally
ven
tilat
ed
VA
20
-140
ug
NH
3/m
2-s
Zhu
et al
20
00
23-1
60
Pigs
Fi
nish
ing
Mec
hani
cally
ven
tilat
ed
VA
20
-55
ug N
H3/
m2-
s Zh
u et
al
2000
10
-26
Pigs
Fi
nish
ing
Nat
urall
y ven
tilat
ed, p
it fa
ns
VA
60
-170
ug
NH
3/m
2-s
Zhu
et al
20
00
28-8
0
Pi
gs
Fini
shin
g Sl
urry
rem
oved
wee
kly
VA
11
kg
NH
3/A
U-y
r O
sada
et al
19
98
30
Pigs
Fi
nish
ing
Dee
p-pi
t man
ure
stor
age
VA
11
.8
kg N
H3/
AU
-yr
Osa
da e
t al
1998
32
D
airy
on b
eddi
ng
VA
26
0 - 8
90
mg
NH
3/A
U-h
G
root
Koo
erka
mp
et a
l 19
98
6.2
- 21.
4
D
airy
fr
ee-st
all
V
A
843
- 1,7
69
mg
NH
3/A
U-h
G
root
Koo
erka
mp
et a
l 19
98
20 -
42.5
Be
ef
on
bed
ding
V
A
431
- 478
m
g N
H3/
AU
-h
Gro
ot K
ooer
kam
p et
al
1998
10
.3 -
11.5
Be
ef
on
slat
s V
A
371
- 900
m
g N
H3/
AU
-h
Gro
ot K
ooer
kam
p et
al
1998
9
- 21.
6
C
alve
s
on b
eddi
ng
VA
31
5 - 1
,037
m
g N
H3/
AU
-h
Gro
ot K
ooer
kam
p et
al
1998
7.
6 - 2
5
C
alve
s
on sl
ats
VA
1,
148
- 1,7
97
mg
NH
3/A
U-h
G
root
Koo
erka
mp
et a
l 19
98
28 -
43
Beef
On
chop
ped
straw
ST
54
7 m
g N
H3/
m2-h
Je
ppss
on
1999
13
Be
ef
on
unc
hopp
ed st
raw
ST
74
7 m
g N
H3/
m2-h
Je
ppss
on
1999
18
Be
ef
on
cho
oped
stra
w +
pea
t ST
31
9 m
g N
H3/
m2-h
Je
ppss
on
1999
8
Dai
ry
free
-stall
M
anur
ed sl
atte
d flo
or
ST
400
mg
NH
3/m
2-h
Kro
odsm
a et a
l 19
93
9.
6
Dai
ry
free
-stall
Sc
rape
d sla
tted
floor
ST
38
0 m
g N
H3/
m2-h
K
rood
sma e
t al
1993
9.1
D
airy
fr
ee-st
all
Uns
tirre
d slu
rry
belo
w sl
ats
ST
320
mg
NH
3/m
2-h
Kro
odsm
a et a
l 19
93
7.
7
Dai
ry
free
-stall
St
irred
slur
ry b
elow
slat
s ST
29
0 m
g N
H3/
m2-h
K
rood
sma e
t al
1993
7
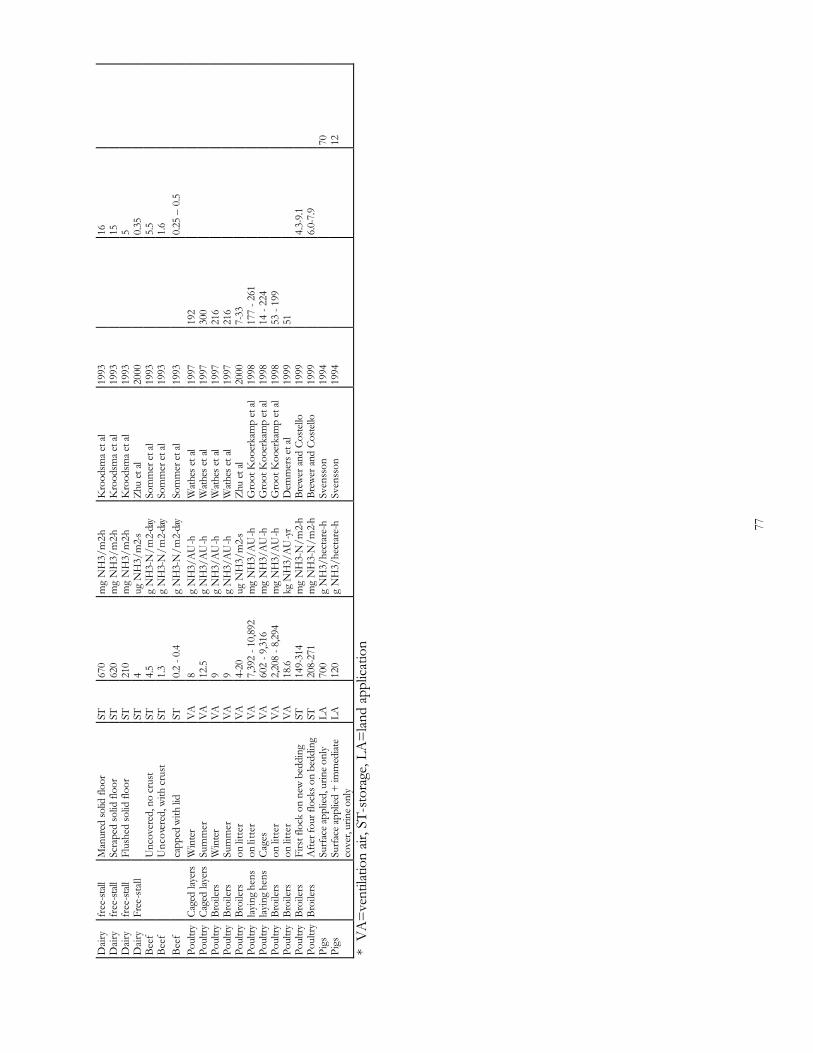
77
Dai
ry
free
-stall
M
anur
ed so
lid fl
oor
ST
670
mg
NH
3/m
2-h
Kro
odsm
a et a
l 19
93
16
Dai
ry
free
-stall
Sc
rape
d so
lid fl
oor
ST
620
mg
NH
3/m
2-h
Kro
odsm
a et a
l 19
93
15
Dai
ry
free
-stall
Fl
ushe
d so
lid fl
oor
ST
210
mg
NH
3/m
2-h
Kro
odsm
a et a
l 19
93
5
D
airy
Fr
ee-s
tall
ST
4
ug N
H3/
m2-
s Zh
u et
al
2000
0.35
Beef
Unc
over
ed, n
o cr
ust
ST
4.5
g N
H3-
N/m
2-da
y So
mm
er e
t al
1993
5.5
Be
ef
U
ncov
ered
, with
cru
st
ST
1.3
g N
H3-
N/m
2-da
y So
mm
er e
t al
1993
1.6
Be
ef
ca
pped
with
lid
ST
0.2
- 0.4
g
NH
3-N
/m2-
day
Som
mer
et a
l 19
93
0.
25 –
0.5
Poul
try
Cage
d lay
ers
Win
ter
VA
8
g N
H3/
AU
-h
Wat
hes e
t al
1997
19
2
Po
ultry
Ca
ged
layer
s Su
mm
er
VA
12
.5
g N
H3/
AU
-h
Wat
hes e
t al
1997
30
0
Po
ultry
Br
oile
rs
Win
ter
VA
9
g N
H3/
AU
-h
Wat
hes e
t al
1997
21
6
Po
ultry
Br
oile
rs
Sum
mer
V
A
9 g
NH
3/A
U-h
W
athe
s et a
l 19
97
216
Poul
try
Broi
lers
on
litte
r V
A
4-20
ug
NH
3/m
2-s
Zhu
et al
20
00
7-33
Po
ultry
la
ying
hen
s on
litte
r V
A
7,39
2 - 1
0,89
2 m
g N
H3/
AU
-h
Gro
ot K
ooer
kam
p et
al
1998
17
7 - 2
61
Poul
try
layi
ng h
ens
Cag
es
VA
60
2 - 9
,316
m
g N
H3/
AU
-h
Gro
ot K
ooer
kam
p et
al
1998
14
- 22
4
Po
ultry
Br
oile
rs
on li
tter
VA
2,
208
- 8,2
94
mg
NH
3/A
U-h
G
root
Koo
erka
mp
et a
l 19
98
53 -
199
Poul
try
Broi
lers
on
litte
r V
A
18.6
kg
NH
3/A
U-y
r D
emm
ers e
t al
1999
51
Po
ultry
Br
oile
rs
Firs
t flo
ck o
n ne
w b
eddi
ng
ST
149-
314
mg
NH
3-N
/m2-
h Br
ewer
and
Cos
tello
19
99
4.
3-9.
1
Poul
try
Broi
lers
A
fter f
our f
lock
s on
bedd
ing
ST
208-
271
mg
NH
3-N
/m2-
h Br
ewer
and
Cos
tello
19
99
6.
0-7.
9
Pigs
Surf
ace a
pplie
d, u
rine o
nly
LA
700
g N
H3/
hect
are-
h Sv
enss
on
1994
70
Pi
gs
Su
rfac
e ap
plied
+ im
med
iate
cove
r, ur
ine o
nly
LA
120
g N
H3/
hect
are-
h Sv
enss
on
1994
12
* V
A=
vent
ilatio
n air
, ST-
stor
age,
LA=
land
appl
icat
ion
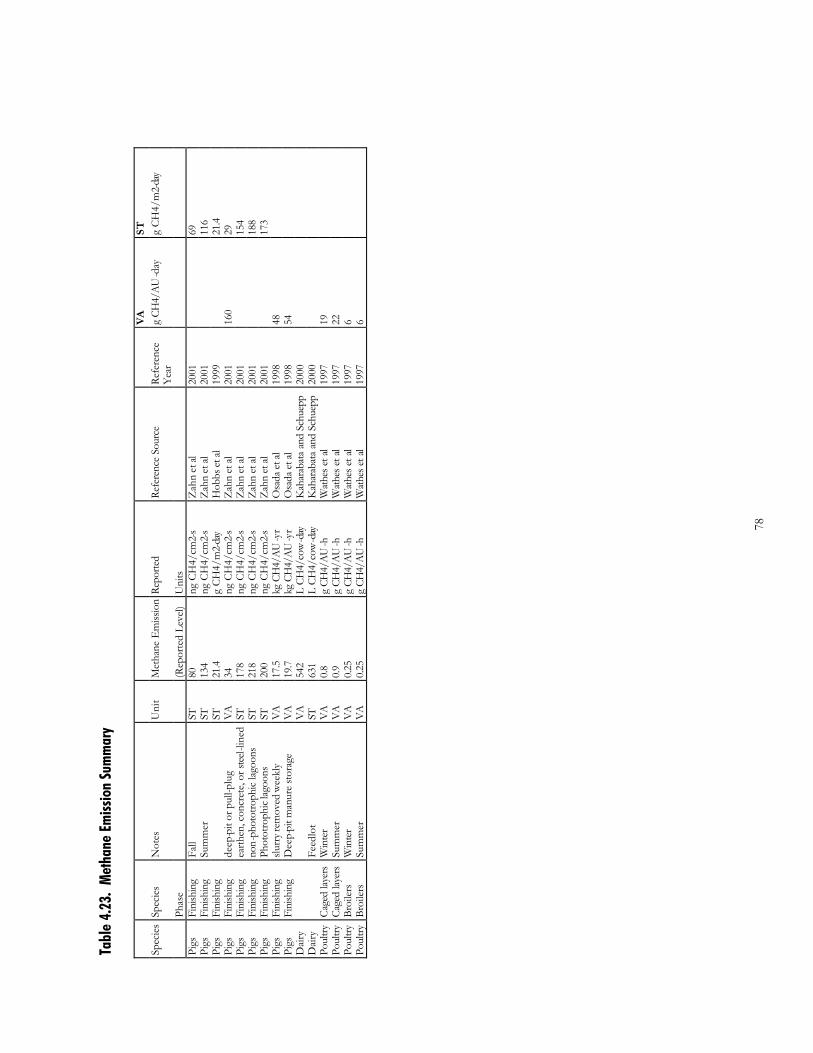
78
Tabl
e 4.
23.
Met
hane
Em
issio
n Su
mm
ary
VA
ST
Spec
ies
Spec
ies
Not
es
Uni
t M
etha
ne E
miss
ion
Repo
rted
Refe
renc
e So
urce
Re
fere
nce
Yea
r g
CH4/
AU
-day
g
CH
4/m
2-da
y
Ph
ase
(Rep
orte
d Le
vel)
Uni
ts
Pigs
Fi
nish
ing
Fall
ST
80
ng C
H4/
cm2-
s Z
ahn
et a
l 20
01
69
Pi
gs
Fini
shin
g Su
mm
er
ST
134
ng C
H4/
cm2-
s Z
ahn
et al
20
01
11
6 Pi
gs
Fini
shin
g
ST
21.4
g
CH
4/m
2-da
y H
obbs
et a
l 19
99
21
.4
Pigs
Fi
nish
ing
deep
-pit
or p
ull-p
lug
VA
34
ng
CH
4/cm
2-s
Zah
n et
al
2001
16
0 29
Pi
gs
Fini
shin
g ea
rthen
, con
cret
e, or
stee
l-lin
ed
ST
178
ng C
H4/
cm2-
s Z
ahn
et al
20
01
15
4 Pi
gs
Fini
shin
g no
n-ph
otot
roph
ic lag
oons
ST
21
8 ng
CH
4/cm
2-s
Zah
n et
al
2001
188
Pigs
Fi
nish
ing
Phot
otro
phic
lago
ons
ST
200
ng C
H4/
cm2-
s Z
ahn
et al
20
01
17
3 Pi
gs
Fini
shin
g slu
rry r
emov
ed w
eekl
y V
A
17.5
kg
CH
4/A
U-y
r O
sada
et a
l 19
98
48
Pi
gs
Fini
shin
g D
eep-
pit m
anur
e st
orag
e V
A
19.7
kg
CH
4/A
U-y
r O
sada
et a
l 19
98
54
D
airy
V
A
542
L CH
4/co
w-d
ay
Kah
arab
ata
and
Schu
epp
2000
D
airy
Feed
lot
ST
631
L CH
4/co
w-d
ay
Kah
arab
ata
and
Schu
epp
2000
Po
ultry
C
aged
laye
rs
Win
ter
VA
0.
8 g
CH4/
AU
-h
Wat
hes e
t al
1997
19
Poul
try
Cage
d lay
ers
Sum
mer
V
A
0.9
g CH
4/A
U-h
W
athe
s et a
l 19
97
22
Po
ultry
Br
oile
rs
Win
ter
VA
0.
25
g CH
4/A
U-h
W
athe
s et a
l 19
97
6
Poul
try
Broi
lers
Su
mm
er
VA
0.
25
g CH
4/A
U-h
W
athe
s et a
l 19
97
6
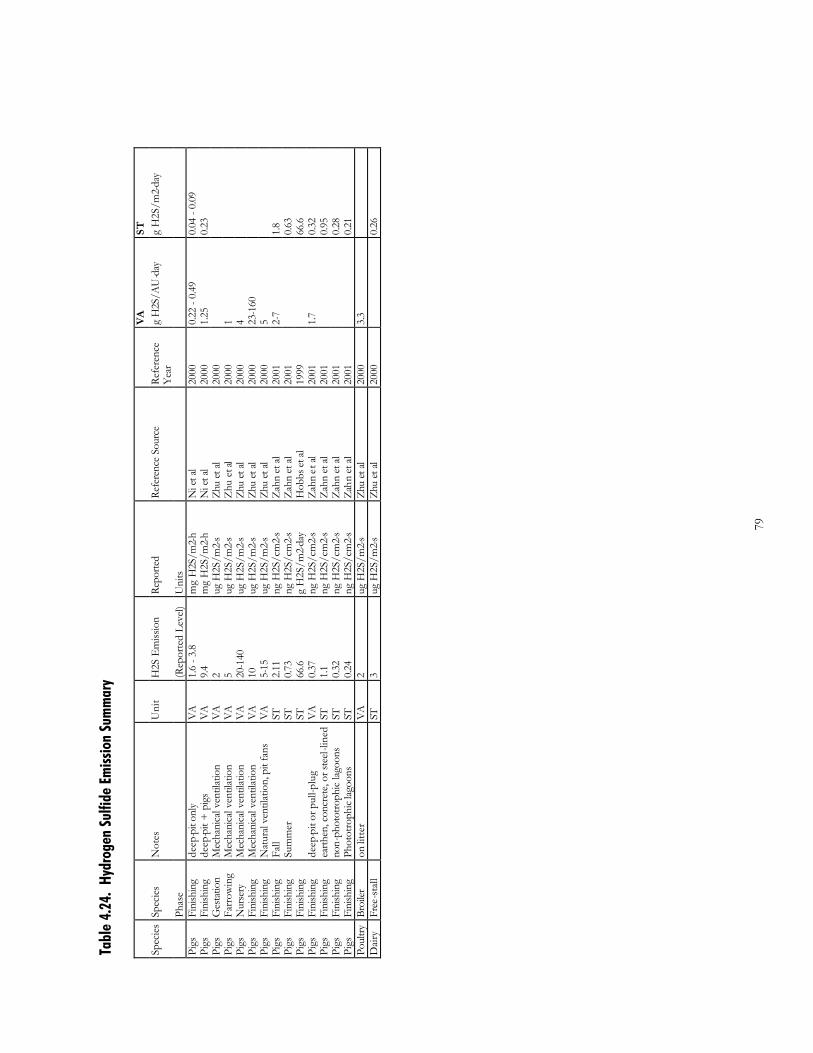
79
Tabl
e 4.
24.
Hydr
ogen
Sul
fide
Emiss
ion
Sum
mar
y
VA
ST
Spec
ies
Spec
ies
Not
es
Uni
t H
2S E
miss
ion
Repo
rted
Refe
renc
e So
urce
Re
fere
nce
Yea
r g
H2S
/AU
-day
g
H2S
/m2-
day
Ph
ase
(Rep
orte
d Le
vel)
Uni
ts
Pigs
Fi
nish
ing
deep
-pit
only
V
A
1.6
- 3.8
m
g H
2S/m
2-h
Ni e
t al
2000
0.
22 -
0.49
0.
04 -
0.09
Pi
gs
Fini
shin
g de
ep-p
it +
pig
s V
A
9.4
mg
H2S
/m2-
h N
i et a
l 20
00
1.25
0.
23
Pigs
G
esta
tion
Mec
hani
cal v
entil
atio
n V
A
2 ug
H2S
/m2-
s Zh
u et
al
2000
Pi
gs
Farr
owin
g M
echa
nica
l ven
tilat
ion
VA
5
ug H
2S/m
2-s
Zhu
et a
l 20
00
1
Pigs
N
urse
ry
Mec
hani
cal v
entil
atio
n V
A
20-1
40
ug H
2S/m
2-s
Zhu
et al
20
00
4
Pigs
Fi
nish
ing
Mec
hani
cal v
entil
atio
n V
A
10
ug H
2S/m
2-s
Zhu
et al
20
00
23-1
60
Pi
gs
Fini
shin
g N
atur
al ve
ntila
tion,
pit
fans
V
A
5-15
ug
H2S
/m2-
s Zh
u et
al
2000
5
Pi
gs
Fini
shin
g Fa
ll ST
2.
11
ng H
2S/c
m2-
s Z
ahn
et al
20
01
2-7
1.8
Pigs
Fi
nish
ing
Sum
mer
ST
0.
73
ng H
2S/c
m2-
s Z
ahn
et al
20
01
0.
63
Pigs
Fi
nish
ing
ST
66
.6
g H
2S/m
2-da
y H
obbs
et a
l 19
99
66
.6
Pigs
Fi
nish
ing
deep
-pit
or p
ull-p
lug
VA
0.
37
ng H
2S/c
m2-
s Z
ahn
et a
l 20
01
1.7
0.32
Pi
gs
Fini
shin
g ea
rthen
, con
cret
e, or
stee
l-lin
ed
ST
1.1
ng H
2S/c
m2-
s Z
ahn
et al
20
01
0.
95
Pigs
Fi
nish
ing
non-
phot
otro
phic
lagoo
ns
ST
0.32
ng
H2S
/cm
2-s
Zah
n et
al
2001
0.28
Pi
gs
Fini
shin
g Ph
otot
roph
ic la
goon
s ST
0.
24
ng H
2S/c
m2-
s Za
hn e
t al
2001
0.21
Po
ultry
Br
oiler
on
litte
r V
A
2 ug
H2S
/m2-
s Zh
u et
al
2000
3.
3
Dai
ry
Free
-sta
ll
ST
3 ug
H2S
/m2-
s Zh
u et
al
2000
0.26
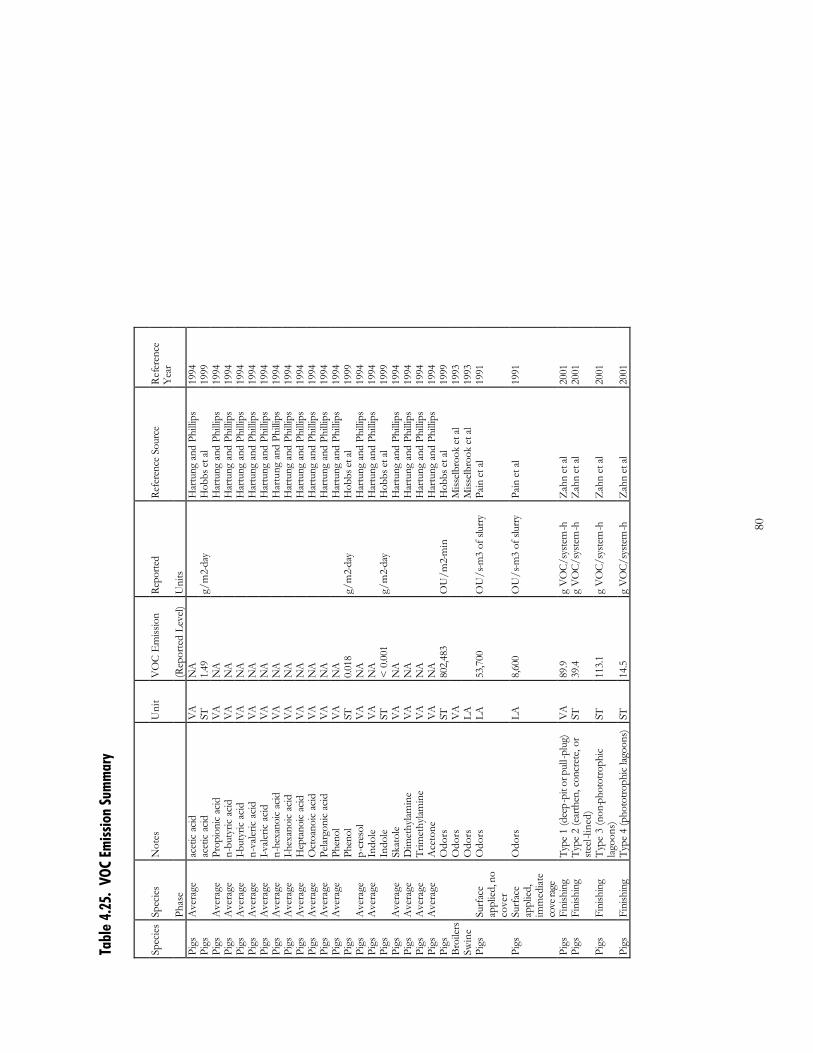
80
Tabl
e 4.
25.
VOC
Emiss
ion
Sum
mar
y
Spec
ies
Spec
ies
Not
es
Uni
t V
OC
Em
issio
n Re
porte
d Re
fere
nce
Sour
ce
Ref
eren
ce
Yea
r
Phas
e
(R
epor
ted
Leve
l) U
nits
Pi
gs
Ave
rage
ac
etic
acid
V
A
NA
Har
tung
and
Phi
llips
19
94
Pigs
acet
ic ac
id
ST
1.49
g/
m2-
day
Hob
bs e
t al
1999
Pi
gs
Ave
rage
Pr
opio
nic
acid
V
A
NA
Har
tung
and
Phi
llips
19
94
Pigs
A
vera
ge
n-bu
tyric
aci
d V
A
NA
Har
tung
and
Phi
llips
19
94
Pigs
A
vera
ge
I-but
yric
aci
d V
A
NA
Har
tung
and
Phi
llips
19
94
Pigs
A
vera
ge
n-va
leric
aci
d V
A
NA
Har
tung
and
Phi
llips
19
94
Pigs
A
vera
ge
I-vale
ric a
cid
VA
N
A
H
artu
ng a
nd P
hilli
ps
1994
Pi
gs
Ave
rage
n-
hexa
noic
acid
V
A
NA
Har
tung
and
Phi
llips
19
94
Pigs
A
vera
ge
I-hex
anoi
c ac
id
VA
N
A
H
artu
ng a
nd P
hilli
ps
1994
Pi
gs
Ave
rage
H
epta
noic
acid
V
A
NA
Har
tung
and
Phi
llips
19
94
Pigs
A
vera
ge
Oct
oano
ic a
cid
VA
N
A
H
artu
ng a
nd P
hilli
ps
1994
Pi
gs
Ave
rage
Pe
largo
nic
acid
V
A
NA
Har
tung
and
Phi
llips
19
94
Pigs
A
vera
ge
Phen
ol
VA
N
A
H
artu
ng a
nd P
hilli
ps
1994
Pi
gs
Ph
enol
ST
0.
018
g/m
2-da
y H
obbs
et a
l 19
99
Pigs
A
vera
ge
p-cr
esol
V
A
NA
Har
tung
and
Phi
llips
19
94
Pigs
A
vera
ge
Indo
le
VA
N
A
H
artu
ng a
nd P
hilli
ps
1994
Pi
gs
In
dole
ST
<
0.0
01
g/m
2-da
y H
obbs
et a
l 19
99
Pigs
A
vera
ge
Skat
ole
VA
N
A
H
artu
ng a
nd P
hilli
ps
1994
Pi
gs
Ave
rage
D
imet
hylam
ine
VA
N
A
H
artu
ng a
nd P
hilli
ps
1994
Pi
gs
Ave
rage
Tr
imet
hylam
ine
VA
N
A
H
artu
ng a
nd P
hilli
ps
1994
Pi
gs
Ave
rage
A
ceto
ne
VA
N
A
H
artu
ng a
nd P
hilli
ps
1994
Pi
gs
O
dors
ST
80
2,48
3 O
U/m
2-m
in
Hob
bs e
t al
1999
Br
oile
rs
Odo
rs
VA
M
isselb
rook
et a
l 19
93
Swin
e
Odo
rs
LA
Miss
elbro
ok e
t al
1993
Pi
gs
Surf
ace
appl
ied,
no
cove
r
Odo
rs
LA
53,7
00
OU
/s-m
3 of
slur
ry
Pain
et a
l 19
91
Pigs
Su
rfac
e ap
plie
d,
imm
ediat
e co
vera
ge
Odo
rs
LA
8,60
0 O
U/s
-m3
of sl
urry
Pa
in e
t al
1991
Pigs
Fi
nish
ing
Type
1 (d
eep-
pit o
r pul
l-plu
g)
VA
89
.9
g V
OC/
syste
m-h
Z
ahn
et al
20
01
Pigs
Fi
nish
ing
Type
2 (e
arth
en, c
oncr
ete,
or
steel
-line
d)
ST
39.4
g
VO
C/sy
stem
-h
Zah
n et
al
2001
Pigs
Fi
nish
ing
Typ
e 3
(non
-pho
totro
phic
lago
ons)
ST
11
3.1
g V
OC/
syste
m-h
Z
ahn
et al
20
01
Pigs
Fi
nish
ing
Type
4 (p
hoto
troph
ic lag
oons
) ST
14
.5
g V
OC/
syste
m-h
Z
ahn
et al
20
01
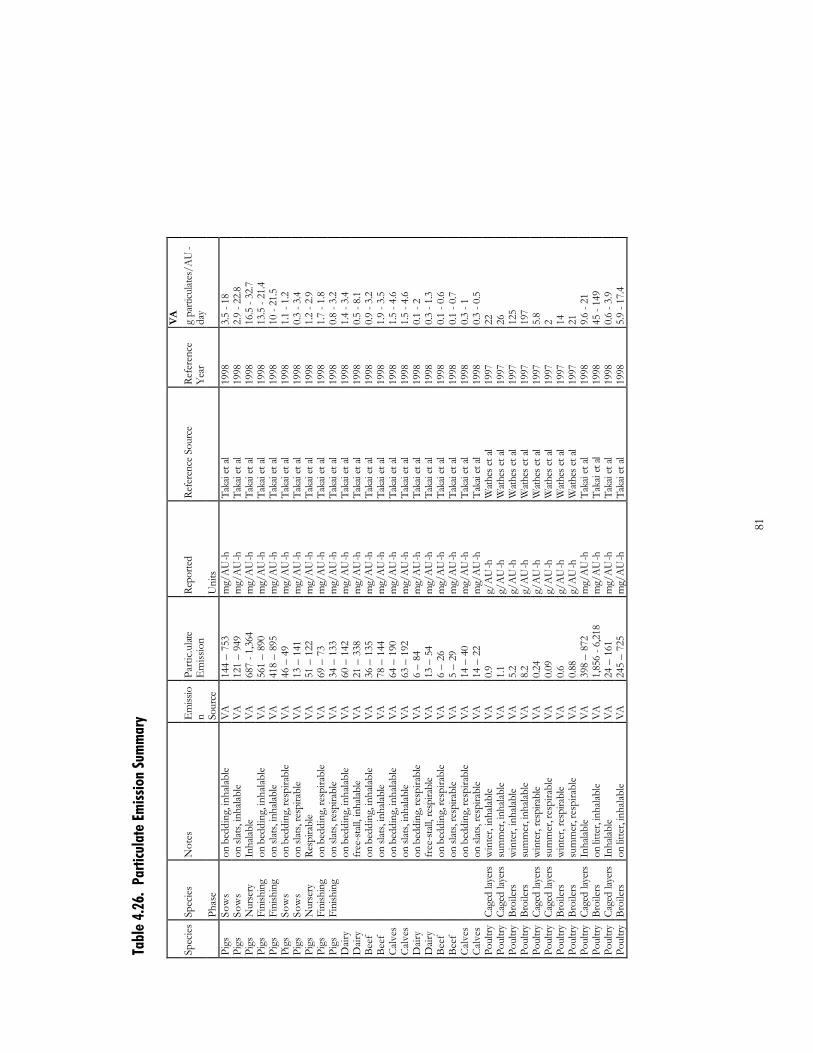
81
Tabl
e 4.
26.
Parti
cula
te E
miss
ion
Sum
mar
y
VA
Spec
ies
Spec
ies
Not
es
Em
issio
n Pa
rtic
.ulat
e E
miss
ion
Repo
rted
Refe
renc
e So
urce
Re
fere
nce
Yea
r g
parti
culat
es/A
U-
day
Ph
ase
So
urce
Uni
ts
Pi
gs
Sow
s on
bed
ding
, inh
alab
le
VA
14
4 –
753
mg/
AU
-h
Taka
i et a
l 19
98
3.5
- 18
Pigs
So
ws
on sl
ats,
inha
lable
V
A
121
– 94
9 m
g/A
U-h
Ta
kai e
t al
1998
2.
9 - 2
2.8
Pigs
N
urse
ry
Inha
lable
V
A
687
- 1,3
64
mg/
AU
-h
Taka
i et a
l 19
98
16.5
- 32
.7
Pigs
Fi
nish
ing
on b
eddi
ng, i
nhal
able
V
A
561
– 89
0 m
g/A
U-h
Ta
kai e
t al
1998
13
.5 -
21.4
Pi
gs
Fini
shin
g on
slat
s, in
halab
le
VA
41
8 –
895
mg/
AU
-h
Taka
i et a
l 19
98
10 -
21.5
Pi
gs
Sow
s on
bed
ding
, res
pira
ble
VA
46
– 4
9 m
g/A
U-h
Ta
kai e
t al
1998
1.
1 - 1
.2
Pigs
So
ws
on sl
ats,
resp
irabl
e V
A
13 –
141
m
g/A
U-h
Ta
kai e
t al
1998
0.
3 - 3
.4
Pigs
N
urse
ry
Resp
irabl
e V
A
51 –
122
m
g/A
U-h
Ta
kai e
t al
1998
1.
2 - 2
.9
Pigs
Fi
nish
ing
on b
eddi
ng, r
espi
rabl
e V
A
69 –
73
mg/
AU
-h
Taka
i et a
l 19
98
1.7
- 1.8
Pi
gs
Fini
shin
g on
slat
s, re
spira
ble
VA
34
– 1
33
mg/
AU
-h
Taka
i et a
l 19
98
0.8
- 3.2
D
airy
on b
eddi
ng, i
nhal
able
V
A
60 –
142
m
g/A
U-h
Ta
kai e
t al
1998
1.
4 - 3
.4
Dai
ry
fr
ee-st
all, i
nhala
ble
VA
21
– 3
38
mg/
AU
-h
Taka
i et a
l 19
98
0.5
- 8.1
Be
ef
on
bed
ding
, inh
alab
le
VA
36
– 1
35
mg/
AU
-h
Taka
i et a
l 19
98
0.9
- 3.2
Be
ef
on
slat
s, in
halab
le
VA
78
– 1
44
mg/
AU
-h
Taka
i et a
l 19
98
1.9
- 3.5
C
alve
s
on b
eddi
ng, i
nhal
able
V
A
64 –
190
m
g/A
U-h
Ta
kai e
t al
1998
1.
5 - 4
.6
Cal
ves
on
slat
s, in
halab
le
VA
63
– 1
92
mg/
AU
-h
Taka
i et a
l 19
98
1.5
- 4.6
D
airy
on b
eddi
ng, r
espi
rabl
e V
A
6 –
84
mg/
AU
-h
Taka
i et a
l 19
98
0.1
- 2
Dai
ry
fr
ee-st
all, r
espi
rabl
e V
A
13 –
54
mg/
AU
-h
Taka
i et a
l 19
98
0.3
- 1.3
Be
ef
on
bed
ding
, res
pira
ble
VA
6
– 26
m
g/A
U-h
Ta
kai e
t al
1998
0.
1 - 0
.6
Beef
on sl
ats,
resp
irabl
e V
A
5 –
29
mg/
AU
-h
Taka
i et a
l 19
98
0.1
- 0.7
C
alve
s
on b
eddi
ng, r
espi
rabl
e V
A
14 –
40
mg/
AU
-h
Taka
i et a
l 19
98
0.3
- 1
Cal
ves
on
slat
s, re
spira
ble
VA
14
– 2
2 m
g/A
U-h
T
akai
et a
l 19
98
0.3
- 0.5
Po
ultry
Ca
ged
layer
s w
inte
r, in
halab
le
VA
0.
9 g/
AU
-h
Wat
hes e
t al
1997
22
Po
ultry
Ca
ged
layer
s su
mm
er, in
halab
le
VA
1.
1 g/
AU
-h
Wat
hes e
t al
1997
26
Po
ultry
Br
oile
rs
win
ter,
inha
lable
V
A
5.2
g/A
U-h
W
athe
s et a
l 19
97
125
Poul
try
Broi
lers
su
mm
er, in
halab
le
VA
8.
2 g/
AU
-h
Wat
hes e
t al
1997
19
7 Po
ultry
Ca
ged
layer
s w
inte
r, re
spira
ble
VA
0.
24
g/A
U-h
W
athe
s et a
l 19
97
5.8
Poul
try
Cage
d lay
ers
sum
mer
, res
pira
ble
VA
0.
09
g/A
U-h
W
athe
s et a
l 19
97
2 Po
ultry
Br
oile
rs
win
ter,
resp
irabl
e V
A
0.6
g/A
U-h
W
athe
s et a
l 19
97
14
Poul
try
Broi
lers
su
mm
er, r
espi
rabl
e V
A
0.88
g/
AU
-h
Wat
hes e
t al
1997
21
Po
ultry
Ca
ged
layer
s In
halab
le
VA
39
8 –
872
mg/
AU
-h
Taka
i et a
l 19
98
9.6
- 21
Poul
try
Broi
lers
on
litte
r, in
halab
le
VA
1,
856
- 6,2
18
mg/
AU
-h
Taka
i et a
l 19
98
45 -
149
Poul
try
Cage
d lay
ers
Inha
lable
V
A
24 –
161
m
g/A
U-h
Ta
kai e
t al
1998
0.
6 - 3
.9
Poul
try
Broi
lers
on
litte
r, in
halab
le
VA
24
5 –
725
mg/
AU
-h
Taka
i et a
l 19
98
5.9
- 17.
4
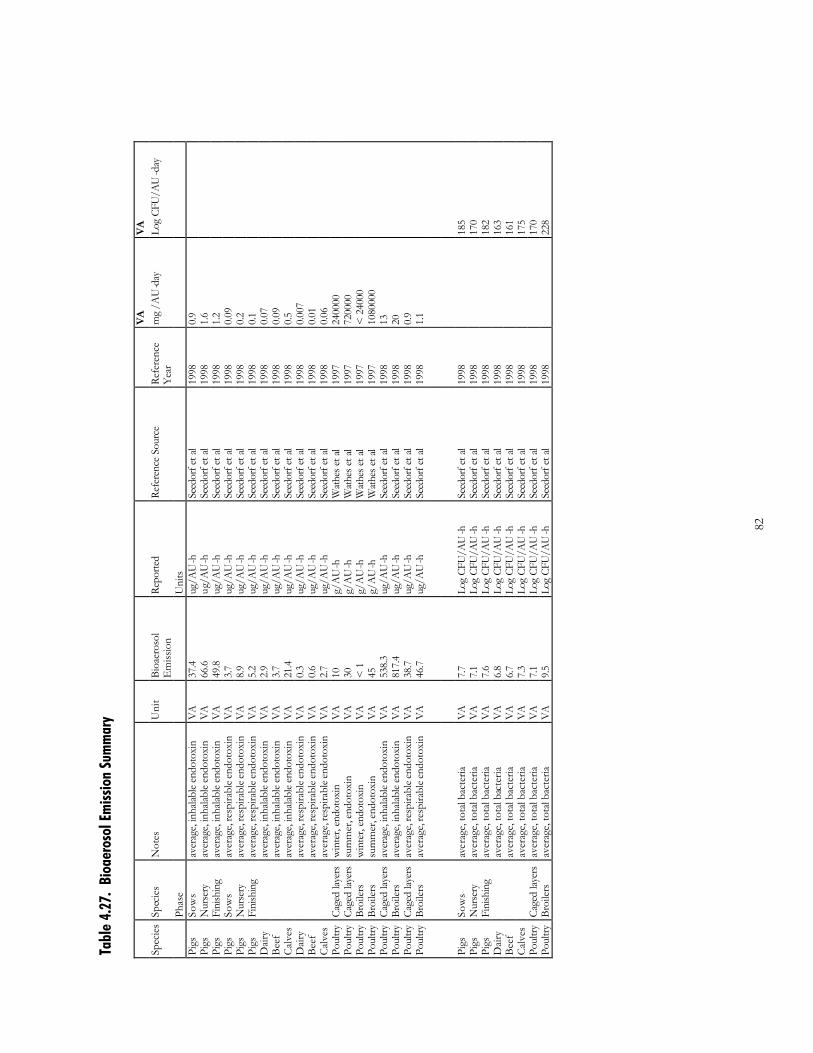
82
Tabl
e 4.
27.
Bioa
eros
ol E
miss
ion
Sum
mar
y
VA
VA
Spec
ies
Spec
ies
Not
es
Uni
t Bi
oaer
osol
E
miss
ion
Repo
rted
Refe
renc
e So
urce
Re
fere
nce
Yea
r m
g /A
U-d
ay
Log
CFU
/AU
-day
Ph
ase
U
nits
Pi
gs
Sow
s av
erag
e, in
halab
le en
doto
xin
VA
37
.4
ug/A
U-h
Se
edor
f et a
l 19
98
0.9
Pi
gs
Nur
sery
av
erag
e, in
halab
le en
doto
xin
VA
66
.6
ug/A
U-h
Se
edor
f et a
l 19
98
1.6
Pi
gs
Fini
shin
g av
erag
e, in
halab
le en
doto
xin
VA
49
.8
ug/A
U-h
Se
edor
f et a
l 19
98
1.2
Pi
gs
Sow
s av
erag
e, re
spira
ble e
ndot
oxin
V
A
3.7
ug/A
U-h
Se
edor
f et a
l 19
98
0.09
Pigs
N
urse
ry
aver
age,
resp
irabl
e end
otox
in
VA
8.
9 ug
/AU
-h
Seed
orf e
t al
1998
0.
2
Pigs
Fi
nish
ing
aver
age,
resp
irabl
e end
otox
in
VA
5.
2 ug
/AU
-h
Seed
orf e
t al
1998
0.
1
Dai
ry
av
erag
e, in
halab
le en
doto
xin
VA
2.
9 ug
/AU
-h
Seed
orf e
t al
1998
0.
07
Be
ef
av
erag
e, in
halab
le en
doto
xin
VA
3.
7 ug
/AU
-h
Seed
orf e
t al
1998
0.
09
C
alve
s
aver
age,
inha
lable
endo
toxi
n V
A
21.4
ug
/AU
-h
Seed
orf e
t al
1998
0.
5
Dai
ry
av
erag
e, re
spira
ble e
ndot
oxin
V
A
0.3
ug/A
U-h
Se
edor
f et a
l 19
98
0.00
7
Beef
aver
age,
resp
irabl
e end
otox
in
VA
0.
6 ug
/AU
-h
Seed
orf e
t al
1998
0.
01
C
alve
s
aver
age,
resp
irabl
e end
otox
in
VA
2.
7 ug
/AU
-h
Seed
orf e
t al
1998
0.
06
Po
ultry
Ca
ged
layer
s w
inte
r, en
doto
xin
VA
10
g/
AU
-h
Wat
hes e
t al
1997
24
0000
Poul
try
Cage
d lay
ers
sum
mer
, end
otox
in
VA
30
g/
AU
-h
Wat
hes e
t al
1997
72
0000
Poul
try
Broi
lers
w
inte
r, en
doto
xin
VA
<
1
g/A
U-h
W
athe
s et a
l 19
97
< 2
4000
Poul
try
Broi
lers
su
mm
er, e
ndot
oxin
V
A
45
g/A
U-h
W
athe
s et a
l 19
97
1080
000
Po
ultry
Ca
ged
layer
s av
erag
e, in
halab
le en
doto
xin
VA
53
8.3
ug/A
U-h
Se
edor
f et a
l 19
98
13
Po
ultry
Br
oile
rs
aver
age,
inha
lable
endo
toxi
n V
A
817.
4 ug
/AU
-h
Seed
orf e
t al
1998
20
Poul
try
Cage
d lay
ers
aver
age,
resp
irabl
e end
otox
in
VA
38
.7
ug/A
U-h
Se
edor
f et a
l 19
98
0.9
Po
ultry
Br
oile
rs
aver
age,
resp
irabl
e end
otox
in
VA
46
.7
ug/A
U-h
Se
edor
f et a
l 19
98
1.1
Pi
gs
Sow
s av
erag
e, to
tal b
acte
ria
VA
7.
7 Lo
g CF
U/A
U-h
Se
edor
f et a
l 19
98
18
5 Pi
gs
Nur
sery
av
erag
e, to
tal b
acte
ria
VA
7.
1 Lo
g CF
U/A
U-h
Se
edor
f et a
l 19
98
17
0 Pi
gs
Fini
shin
g av
erag
e, to
tal b
acte
ria
VA
7.
6 Lo
g CF
U/A
U-h
Se
edor
f et a
l 19
98
18
2 D
airy
aver
age,
tota
l bac
teria
V
A
6.8
Log
CFU
/AU
-h
Seed
orf e
t al
1998
163
Beef
aver
age,
tota
l bac
teria
V
A
6.7
Log
CFU
/AU
-h
Seed
orf e
t al
1998
161
Cal
ves
av
erag
e, to
tal b
acte
ria
VA
7.
3 Lo
g CF
U/A
U-h
Se
edor
f et a
l 19
98
17
5 Po
ultry
Ca
ged
layer
s av
erag
e, to
tal b
acte
ria
VA
7.
1 Lo
g CF
U/A
U-h
Se
edor
f et a
l 19
98
17
0 Po
ultry
Br
oile
rs
aver
age,
tota
l bac
teria
V
A
9.5
Log
CFU
/AU
-h
Seed
orf e
t al
1998
228
83
References Aneja, VP, JP Chauhan, and J.T. Walker. 2000. Characterization of atmospheric ammonia emissions from swine waste
storage and treatment lagoons. Journal of Geophysical Research, 105(D9):11535-11545. Aneja, VP, B. Bunton, J.T. Walker, B.P. Malik. 2001. Measurement and analysis of atmospheric ammonia emissions
from anaerobic lagoons. Atmospheric Environment, 35: 1949-1958. Aarnink, AJA, A Keen, JHM Metz, L. Speelman, MWA Verstegen. 1995. Ammonia emission patterns during the
growing periods of pigs housed on partially slatted floors. J. Agric. Engng. Res, 62:105-116. Arogo, J., RH Zhang, GL Riskowski, DL Day. 2000. Hydrogen sulfide production from stored liquid swine manure: a
laboratory study. Transactions of the ASAE, 43(5): 1241-1245. Braam, CR, MCJ Smits, H Gunnink, D Swierstra. 1997. Ammonia emission from a double-sloped solid floor in a
cubicle house for dairy cows. J. Agric. Engng Res, 68: 375-386. Brewer, SK, TA Costello. 1999. In situ measurement of ammonia volatilization from broiler litter using an enclosed air
chamber. Transactions of the ASAE, 42(5): 1415-1422. Burton, DL and EG Beauchamp. 1986. Nitrogen losses from swine housings. Agricultural Wastes, 15(59-74. Carney PG, Dodd VA. A comparison between predicted and measured values for the dispersion of malodours from
slurry. J Agric Engng Res 1989; 44(1):67-76. Childers, JW, EL Thompson, Jr, DB Harris, DA Kirchgessner, M. Clayton, DF Natschke, WJ Phillips. 2001. Muli-point
concentration measurements around a concentrated swine production facility using open-path FTIR spectrometry. Atmospheric Environment, 35: 1923-1936.
Clark S, Rylander R, Larsson L. Airborne bacteria, endotoxin and fiungi in dust in poultry and swine confinemtn buildings. Am Ind Hyg Assoc J 44:537-554; 1983.
Demmers, TGM, LR Burgess, JL Short, VR Phillips, JA Clark, and CM Wathes. 1999. Ammonia emissions from two mechanically ventilated UK livestock buildings. Atmospheric Environment, 33:217-227.
Dewes, T. 1999. Ammonia emissions during the initial pahse of microbial degradation of solid and liquid cattle manure. Bioresource Technology, 70:245-248.
Donham KJ, Yeggy J, Dague RR. Production rates of toxic gases from liquid swine manure: health implication for workers and animals in swine confinement buildings. Biological Wastes 1988; 24 (3):161-173.
Donham K, Haglind P, Peterson Y, et al. Environmental and health studies of farm workers in swedish swine confinement buildings. Br J Ind Med1989;46:31-37.
Duchaine C, Thorne PS, Meriaux A, Grimard Y, Whitten P, Cormien Y. Comparison of endotoxin exposure assessment by bioaerosol impinger and filter sampling methods. Appl. Envir. Microbiol 2001.
Dutch Expert Committee on Occupational Standards (DECOS). Endotoxins: Health based recommended exposure limit. A report of the Health Council of The Netherlands. Rijswijk: Health Council of the Netherlands, 1998: publication no. 1998/03 WGD.
Earth Tech. Generic Environmental Impact Statement on Animal Agriculture: Air Quality and Odor Impacts. Prepared for the Environmental Quality Board, Saint Paul, Minn., March 2001.
Elzing, A, GJ Monteny. 1997. Ammonia emission in a scale model of a dairy-cow house. Transactions of the ASAE, 40(3): 713-720.
Gassman PW. Simulation of odor transport: A review. ASAE Paper No. 92-4517, St. Joseph, Mich., American Society of Agricultural Engineers 1992.
Groot Koerkamp, PWG, JHM Metz, GH Uenk, VR Phillips, MR Holden, RW Sneath, JL Short, RP White, J. Hartung, J. Seedorf, M. Schroeder, KH Linkert, S. Pedersen, H Takai, JO Johnsen, CM Wathes. 1998. Concentrations and emissions of ammonia in livestock buildings in northern europe. J. Agric. Engng Res, 70: 79-95.
Hartung, E., T. Jungbluth, W. Buscher. 2001. Reduction of ammonia and odor emissions from a piggery with biofilters. Transactions of the ASAE, 44(1): 113-118.
Hartung, J and VR Phillips. 1994. Control of gaseous emissions from livestock buildings and manure stores. J Agric Engng Res, 57:173-189.
Heinemann P, Wahanik D. Modeling the generation and dispersion of odors from mushroom composting facilities. Trans ASAE 1998; 41(2):437-446.
Hinz, T and S. Linke. 1998. A comprehensive experimental study of aerial pollutants in and emissions from livestock buildings. Part 2: Results. J Agric. Engng Res, 70:119-129.
Hobbs, PJ, TH Misselbrook, TR Cumby. 1999. Production and emission of odours and gases from ageing pig waste. J. Agric. Engng Res, 72:291-298.
Iowa County Population, Source: Census Services at Iowa State University. http://www.soc.iastate.edu/census/
84
Jacobson LD, Guo H, Schmidt D, Nicolai RE. Calibrating an odor dispersion model by resident-panelists. Second International Conference on Air Pollution From Agricutural Operations. Des Moines, Iowa, October 9-11, 2000.
Jacobson LD, Guo H, Schmidt DR, and Nicolai RE. Influence of weather conditions on field evaluation of odor dispersions from animal production sites. Proceedings of the Sixth International Livestock Environment Symposium, pp. 679-686. American Society of Agricultural Engineers. 2001 May 21-23, Louisville, KY.
Jeppsson, KH. 1999. Volatilization of ammonia in deep-litter systems with different bedding materials for young cattle. J. Agric. Engng. Res, 73:49-57.
Kaharabata, SK and PH Schuepp. 2000. Estimating methane emissions from dariy cattle housed in a barn and feedlot using atmospheric tracer. Environ. Sci. Technol, 34:3296-3302.
Kellems, RO, JR Miner, DC Church. 1979. Effect of ration, waste composition and length of storage on the volatilization of ammonia, hydrogen sulfide, and odors from cattle waste. J of An Sci, 48(3):436-445.
Kroodsma, W., JWH Huis in ‘t Veld, R. Scholtens. 1993. Ammonia emission and its reduction from cubicle houses by flushing. Livestock Production Sci, 35:293-302.
Kullman GJ, Thorne PS, Waldron PF, Marx JJ, Ault B, Lewis DM, Siegel PD, Olenchock SA, Merchant JA. Organic dust exposures from work in dairy barns. Am Ind Hyg Assoc J 59:403-413, 1998.
Li JD, Bundy DS, Hoff SJ, Liu Q. Field odor measurement and applications of gaussian plume model. ASAE Paper No. 944054. St. Joseph, Mich, American Society of Agricultural Engineers 1994.
Misselbrook, TH, CR Clarkson, BF Pain. 1993. Relationship between concentration and intensity of odours for pig slurry and broiler houses. J Agric Engng Res, 55:163-169.
Ni, JQ, AJ Heber, CA Diehl, TL Lim. 2000. Ammonia, hygrogen sulphide and crbon dioxide release from pig manure in under-floor deep pits. J agric. Engng Res., 77(1):53-66.
Osada, T, HB Rom, P Dahl. 1998. Continuous measurement of nitrous oxide and methane emission in pig units by infrared photoacoustic detect ion. Transactions of the ASAE, 41(4): 1109-1114.
Pain, BF, CR Clarkson, VR Phillips, JV Klarenbeek, TH Misselbrook, M Bruins. 1991. Odour emission arising from application of livestock slurries on land: measurements following spreading using a micrometeorological technique and olfactometry. J Agric Engng Res, 48:101-110.
Preller L, Heederik D, Kromhout H, e.a. Determinants of dust and endotoxin exposure of pig farmers: development of a control strategy using empirical modelling. Ann Occup Hyg 1995;39:545-57.
Quinn, A.D., Wilson, M., Reynolds, M, Couling, S.B., Hoxey, R.P. 2001. Modelling the dispersion of aerial pollutants from agricultural buildings —an evaluation of computational fluid dynamics (CFD). Computers and Electronics in Agriculture, 30: 219 –235.
Rege MA, Tock RW. Estimation of point-source emissions of hydrogen sulfide and ammonia using a modified Pasquill-Gifford approach. Atmos Environ 1996; 30(18):3181-3195.
Rules of Department of natural Resources. Division 10--Air Conservation Commission. Chapter 3--Air Pollution control Rules Specific to the Outstate Missouri Area. February 28, 2001.
Saunders, G. 2001. North Carolina Department of Air Quality. Personal Communication. Seedorf, J., J. Hartung, M. Schroeder, KH Linkert, VR Phillips, MR Holden, RW Sneath, JL Short, RP White, S.
Pedersen, H Takai, JO Johnsen, JHM Metz, PWG Groot Koerkamp, GH Uenk, CM Wathes. 1998. Concentrations and emissions of airborne endotoxins and microorganisms in livestock buildings in northern europe. J. Agric. Engng Res, 70: 97-109.
Sommer, SG, BT Christensen, NE Nielsen, JK Schjorring. 1993. Ammonia volatilization during storage of cattle and pig slurry: effect of surface cover. J of Agric Sci, 121:63-71.
Sweeten, J.M. 1990. Cattle Feedlot Waste Management practices for Water and Air Pollution Control. Texas Agricultural Extension Service, Texas A&M University System. B-1671, 24pp.
Swierstra, D, CR Braam, MC Smits. 2001. Grooved floor system for cattle housing: Ammonia emission reduction and good slip resistance. App Eng in Agric, 17(1): 85-90.
Swine Inventory Data, Source: USDA-NASS, 1997 Census of Agriculture. http://www.usda.gov/nass/sso-rpts.htm Svensson, L. 1994. Ammonia volatilization following application of livestock manure to arable land. J Agric. Engng Res,
58:241-260. Takai, H., S. Pedersen, JO Johnsen, JHM Metz, PWG Groot Koerkamp, GH Uenk, VR Phillips, MR Holden, RW
Sneath, JL Short, RP White, J Hartung, J Seedorf, M Schroeder, KH Linkert, CM Wathes. 1998. Concentratins and emissions of airborne dust in livestock buildings in northern europe. J Agric. Engng. Res, 70: 59-77.
Thelin A, Tegler O, Rylander R. Lung reactions during pultry handling related to dust and bacterial endotoxin levels. Eur J Respir Dis 65:266-71,1989.
85
Thorne PS, Pearce TA, Goodenow B, Bundy D, Beatty AT. Environmental exposures in two types of concentrated animal feeding operations (CAFOs). ATS Intl. Conf, San Francisco, CA, May 18-23, 2001. Am J Respir Crit Care Med 163(5): A844, 2001.
Thorne PS, Reynolds SJ, Milton DK, Bloebaum PD, Zhang X, Whitten P, Burmeister LF. Field evaluation of endotoxin air sampling assay methods. Am Ind Hyg Assoc J 58:792-799, 1997.
U.S. EPA, United States Environmental Protection Agency, Office of Air Quality Planning and Standards, 2002. http://www.epa.gov/oar/oaqps/modeling.html
Update of status of DAQ efforts on 15 NCAC 2D.1802, control of Odors from Animal Operations Using Liquid Animal Waste Management Systems, North Carolina DAQ.
Wathes, CM, MR Holden, RW Sneath, RP White, VR Phillips. Concentrations and emission rates of aerial ammonia, nitrous oxide, methane, carbon dioxide, dust and endotoxin in UK broiler and layer houses. British Poultry Science, 38: 14-28.
Zahn, JA, JL Hatfield, YS Do, AA Dispirito, DA Laird, RL Pfeiffer. 1997. Characterization of volatile organic emissions and wastes from a swine production facility. J Environ. Qual, 26:1687-1696.
Zahn, JA, AE Tungand, BA Roberts, JL Hatfield. 2001a. Abatement of ammonia and hydrogen sulfide emissions from a swine lagoon using a polymer biocover. J. Air & Waste Manage. Assoc, 51:562-573.
Zahn, JA, JL Hatfield, DA Laird, TT Hart, YS Do, AA Dispirito. 2001b. Functional classification of swine manure management systems based on effluent and gas emission characteristics. J Environ. Qual, 30:635-647.
Zahn, JA, AA Dispirito, YS Do, BE Brooks, EE Cooper, JL Hatfield. 2001c. Correlation of human olfactory responses to airborne concentrations of malodorous volatile organic compounds emitted from swine effluent. J Environ. Qual, 30:624-634.
Zhu, J., L Jacobson, D. Schmidt, R. Nicolai. 2000a. Daily variations in odor and gas emissions from animal facilities. App Eng in Agric, 16(2): 153-158.
Zhu, J., L Jacobson, D. Schmidt, R. Nicolai. 2000b. Evaluation of INPUFF-2 model for predicting downwind odors from animal production facilities. App Eng in Agric, 16(2): 159-164.
86
Chapter 5. Fate and Transport of Air Pollutants from CAFOs
Jerald L. Schnoor Professor
Department of Civil and Environmental Engineering The University of Iowa
Peter S. Thorne
Professor Department of Occupational and Environmental Health
The University of Iowa
Wendy Powers Assistant Professor
Department of Animal Science Iowa State University
5.1 Introduction A schematic of the fate and transport of air emissions from Confined Animal Feeding Operations (CAFOs) is given by Figure 1. Many sources contribute to the overall fugitive emissions from such operations: the animals themselves, their manure, manure applied to farm fields nearby, and waste lagoons. Emissions can be as particles or gases, and they may serve as reactants for aerosol formations (micron and submicron size solid and liquid suspensions). Particles emitted from CAFOs that may cause problems include odorants, dusts, animal dander and other allergens. Generally, these are dispersed rapidly in the atmosphere by mixing processes and are deposited to the land surface. Gases are also of concern. These may include odorants, hydrogen sulfide (H2S), ammonia (NH3), methane (CH4) and other trace gas constituents. Some of these persist in the atmosphere for hours or days, and they may be transported hundreds of kilometers (Table 1). Ammonia and sulfur compounds from CAFOs participate in reactions that can form secondary particles and aerosols in the atmosphere. These may limit visibility, cause health effects to sensitive individuals, and be precursors of acid rain at a regional scale. Secondary particles include ammonium sulfate (NH4)2 SO4, ammonium bisulfate (NH4)HSO4, and ammonium nitrate NH4NO3. Large amounts of manure at feedlots can undergo partial anaerobic degradation by bacteria to form gases such as methane (CH4) and nitrous oxide (N2O). These are potent greenhouse gases at a global scale, and they contribute a significant fraction of Iowa’s greenhouse gas emissions to the global atmosphere.
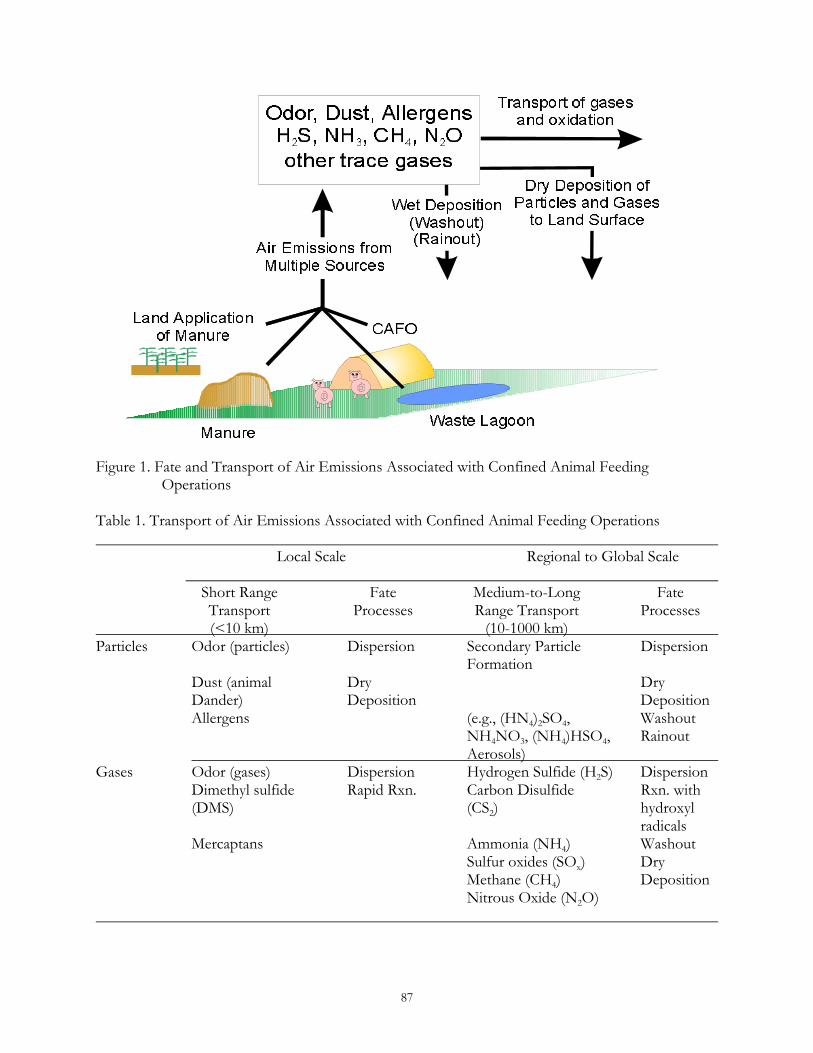
87
Figure 1. Fate and Transport of Air Emissions Associated with Confined Animal Feeding
Operations Table 1. Transport of Air Emissions Associated with Confined Animal Feeding Operations Local Scale Regional to Global Scale Short Range Fate Medium-to-Long Fate Transport Processes Range Transport Processes (<10 km) (10-1000 km) Particles Odor (particles) Dispersion Secondary Particle Dispersion Formation Dust (animal Dry Dry Dander) Deposition Deposition Allergens (e.g., (HN4)2SO4, Washout NH4NO3, (NH4)HSO4, Rainout Aerosols) Gases Odor (gases) Dispersion Hydrogen Sulfide (H2S) Dispersion Dimethyl sulfide Rapid Rxn. Carbon Disulfide Rxn. with (DMS) (CS2) hydroxyl radicals Mercaptans Ammonia (NH4) Washout Sulfur oxides (SOx) Dry Methane (CH4) Deposition Nitrous Oxide (N2O)
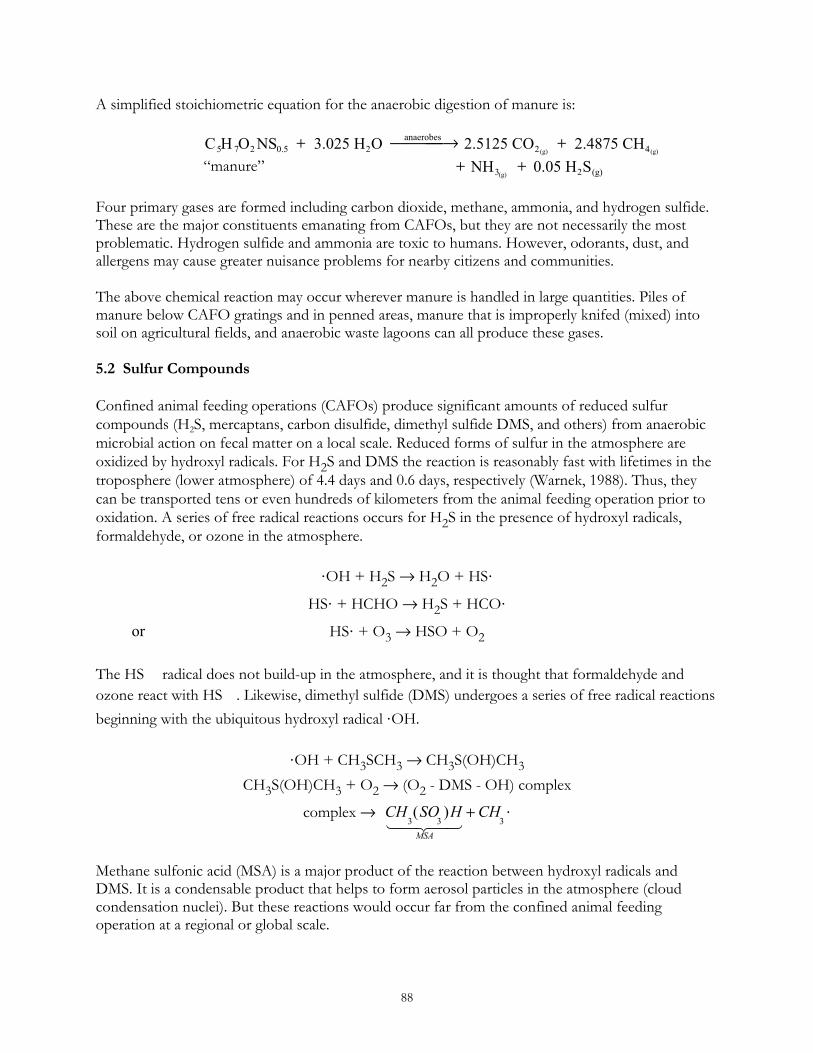
88
A simplified stoichiometric equation for the anaerobic digestion of manure is: C5H 7O2 NS0.5 + 3.025 H2O anaerobes → 2.5125 CO2(g)
+ 2.4875 CH4(g)
“manure” + NH3(g) + 0.05 H2S(g)
Four primary gases are formed including carbon dioxide, methane, ammonia, and hydrogen sulfide. These are the major constituents emanating from CAFOs, but they are not necessarily the most problematic. Hydrogen sulfide and ammonia are toxic to humans. However, odorants, dust, and allergens may cause greater nuisance problems for nearby citizens and communities. The above chemical reaction may occur wherever manure is handled in large quantities. Piles of manure below CAFO gratings and in penned areas, manure that is improperly knifed (mixed) into soil on agricultural fields, and anaerobic waste lagoons can all produce these gases. 5.2 Sulfur Compounds Confined animal feeding operations (CAFOs) produce significant amounts of reduced sulfur compounds (H2S, mercaptans, carbon disulfide, dimethyl sulfide DMS, and others) from anaerobic microbial action on fecal matter on a local scale. Reduced forms of sulfur in the atmosphere are oxidized by hydroxyl radicals. For H2S and DMS the reaction is reasonably fast with lifetimes in the troposphere (lower atmosphere) of 4.4 days and 0.6 days, respectively (Warnek, 1988). Thus, they can be transported tens or even hundreds of kilometers from the animal feeding operation prior to oxidation. A series of free radical reactions occurs for H2S in the presence of hydroxyl radicals, formaldehyde, or ozone in the atmosphere. ⋅OH + H2S → H2O + HS⋅ HS⋅ + HCHO → H2S + HCO⋅ or HS⋅ + O3 → HSO + O2 The HS� radical does not build-up in the atmosphere, and it is thought that formaldehyde and ozone react with HS�. Likewise, dimethyl sulfide (DMS) undergoes a series of free radical reactions beginning with the ubiquitous hydroxyl radical ⋅OH. ⋅OH + CH3SCH3 → CH3S(OH)CH3 CH3S(OH)CH3 + O2 → (O2 - DMS - OH) complex
complex →
CH3(SO
3)H
MSA1 2 4 3 4
+ CH3⋅
Methane sulfonic acid (MSA) is a major product of the reaction between hydroxyl radicals and DMS. It is a condensable product that helps to form aerosol particles in the atmosphere (cloud condensation nuclei). But these reactions would occur far from the confined animal feeding operation at a regional or global scale.
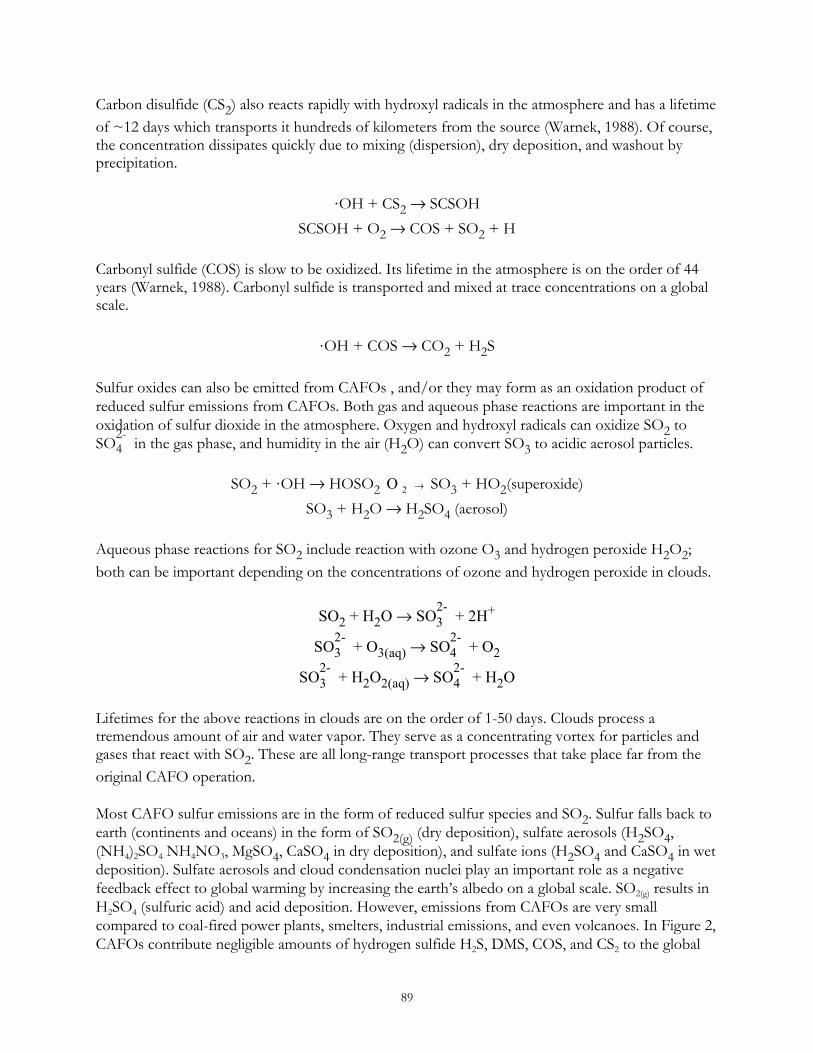
89
Carbon disulfide (CS2) also reacts rapidly with hydroxyl radicals in the atmosphere and has a lifetime of ~12 days which transports it hundreds of kilometers from the source (Warnek, 1988). Of course, the concentration dissipates quickly due to mixing (dispersion), dry deposition, and washout by precipitation. ⋅OH + CS2 → SCSOH SCSOH + O2 → COS + SO2 + H Carbonyl sulfide (COS) is slow to be oxidized. Its lifetime in the atmosphere is on the order of 44 years (Warnek, 1988). Carbonyl sulfide is transported and mixed at trace concentrations on a global scale. ⋅OH + COS → CO2 + H2S Sulfur oxides can also be emitted from CAFOs , and/or they may form as an oxidation product of reduced sulfur emissions from CAFOs. Both gas and aqueous phase reactions are important in the oxidation of sulfur dioxide in the atmosphere. Oxygen and hydroxyl radicals can oxidize SO2 to SO
2-4 in the gas phase, and humidity in the air (H2O) can convert SO3 to acidic aerosol particles.
SO2 + ⋅OH → HOSO2 →2O SO3 + HO2(superoxide) SO3 + H2O → H2SO4 (aerosol) Aqueous phase reactions for SO2 include reaction with ozone O3 and hydrogen peroxide H2O2; both can be important depending on the concentrations of ozone and hydrogen peroxide in clouds. SO2 + H2O → SO2-
3 + 2H+
SO2-3 + O3(aq) → SO2-
4 + O2
SO2-3 + H2O2(aq) → SO2-
4 + H2O Lifetimes for the above reactions in clouds are on the order of 1-50 days. Clouds process a tremendous amount of air and water vapor. They serve as a concentrating vortex for particles and gases that react with SO2. These are all long-range transport processes that take place far from the original CAFO operation. Most CAFO sulfur emissions are in the form of reduced sulfur species and SO2. Sulfur falls back to earth (continents and oceans) in the form of SO2(g) (dry deposition), sulfate aerosols (H2SO4, (NH4)2SO4 NH4NO3, MgSO4, CaSO4 in dry deposition), and sulfate ions (H2SO4 and CaSO4 in wet deposition). Sulfate aerosols and cloud condensation nuclei play an important role as a negative feedback effect to global warming by increasing the earth’s albedo on a global scale. SO2(g) results in H2SO4 (sulfuric acid) and acid deposition. However, emissions from CAFOs are very small compared to coal-fired power plants, smelters, industrial emissions, and even volcanoes. In Figure 2, CAFOs contribute negligible amounts of hydrogen sulfide H2S, DMS, COS, and CS2 to the global
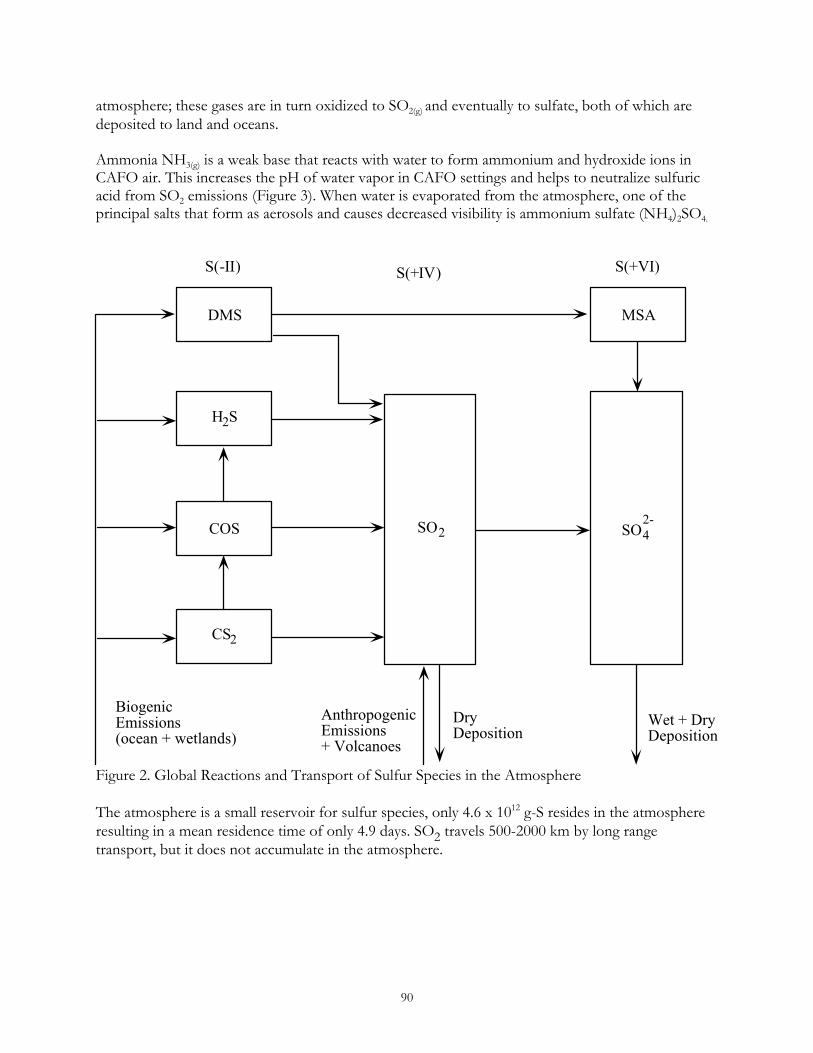
90
atmosphere; these gases are in turn oxidized to SO2(g) and eventually to sulfate, both of which are deposited to land and oceans. Ammonia NH3(g) is a weak base that reacts with water to form ammonium and hydroxide ions in CAFO air. This increases the pH of water vapor in CAFO settings and helps to neutralize sulfuric acid from SO2 emissions (Figure 3). When water is evaporated from the atmosphere, one of the principal salts that form as aerosols and causes decreased visibility is ammonium sulfate (NH4)2SO4.
Figure 2. Global Reactions and Transport of Sulfur Species in the Atmosphere The atmosphere is a small reservoir for sulfur species, only 4.6 x 10¹² g-S resides in the atmosphere resulting in a mean residence time of only 4.9 days. SO2 travels 500-2000 km by long range transport, but it does not accumulate in the atmosphere.
CS2
DMS
H2S
COS
MSA
SO2-4
Biogenic Emissions (ocean + wetlands)
SO2
Wet + Dry Deposition
Dry Deposition
Anthropogenic Emissions + Volcanoes
S(-II) S(+IV) S(+VI)
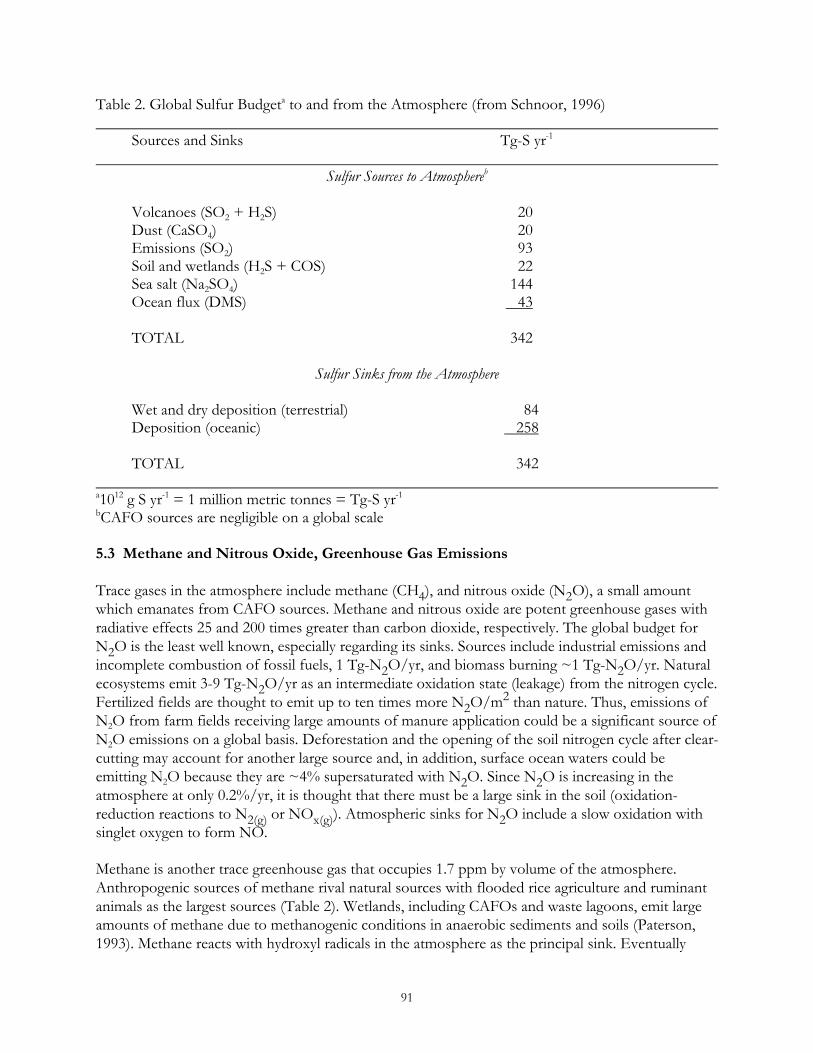
91
Table 2. Global Sulfur Budgeta to and from the Atmosphere (from Schnoor, 1996) Sources and Sinks Tg-S yr-1
Sulfur Sources to Atmosphereb Volcanoes (SO2 + H2S) 20 Dust (CaSO4) 20 Emissions (SO2) 93 Soil and wetlands (H2S + COS) 22 Sea salt (Na2SO4) 144 Ocean flux (DMS) 43 TOTAL 342
Sulfur Sinks from the Atmosphere Wet and dry deposition (terrestrial) 84 Deposition (oceanic) 258 TOTAL 342 a1012 g S yr-1 = 1 million metric tonnes = Tg-S yr-1 bCAFO sources are negligible on a global scale 5.3 Methane and Nitrous Oxide, Greenhouse Gas Emissions Trace gases in the atmosphere include methane (CH4), and nitrous oxide (N2O), a small amount which emanates from CAFO sources. Methane and nitrous oxide are potent greenhouse gases with radiative effects 25 and 200 times greater than carbon dioxide, respectively. The global budget for N2O is the least well known, especially regarding its sinks. Sources include industrial emissions and incomplete combustion of fossil fuels, 1 Tg-N2O/yr, and biomass burning ~1 Tg-N2O/yr. Natural ecosystems emit 3-9 Tg-N2O/yr as an intermediate oxidation state (leakage) from the nitrogen cycle. Fertilized fields are thought to emit up to ten times more N2O/m2 than nature. Thus, emissions of N2O from farm fields receiving large amounts of manure application could be a significant source of N2O emissions on a global basis. Deforestation and the opening of the soil nitrogen cycle after clear-cutting may account for another large source and, in addition, surface ocean waters could be emitting N2O because they are ~4% supersaturated with N2O. Since N2O is increasing in the atmosphere at only 0.2%/yr, it is thought that there must be a large sink in the soil (oxidation-reduction reactions to N2(g) or NOx(g)). Atmospheric sinks for N2O include a slow oxidation with singlet oxygen to form NO. Methane is another trace greenhouse gas that occupies 1.7 ppm by volume of the atmosphere. Anthropogenic sources of methane rival natural sources with flooded rice agriculture and ruminant animals as the largest sources (Table 2). Wetlands, including CAFOs and waste lagoons, emit large amounts of methane due to methanogenic conditions in anaerobic sediments and soils (Paterson, 1993). Methane reacts with hydroxyl radicals in the atmosphere as the principal sink. Eventually
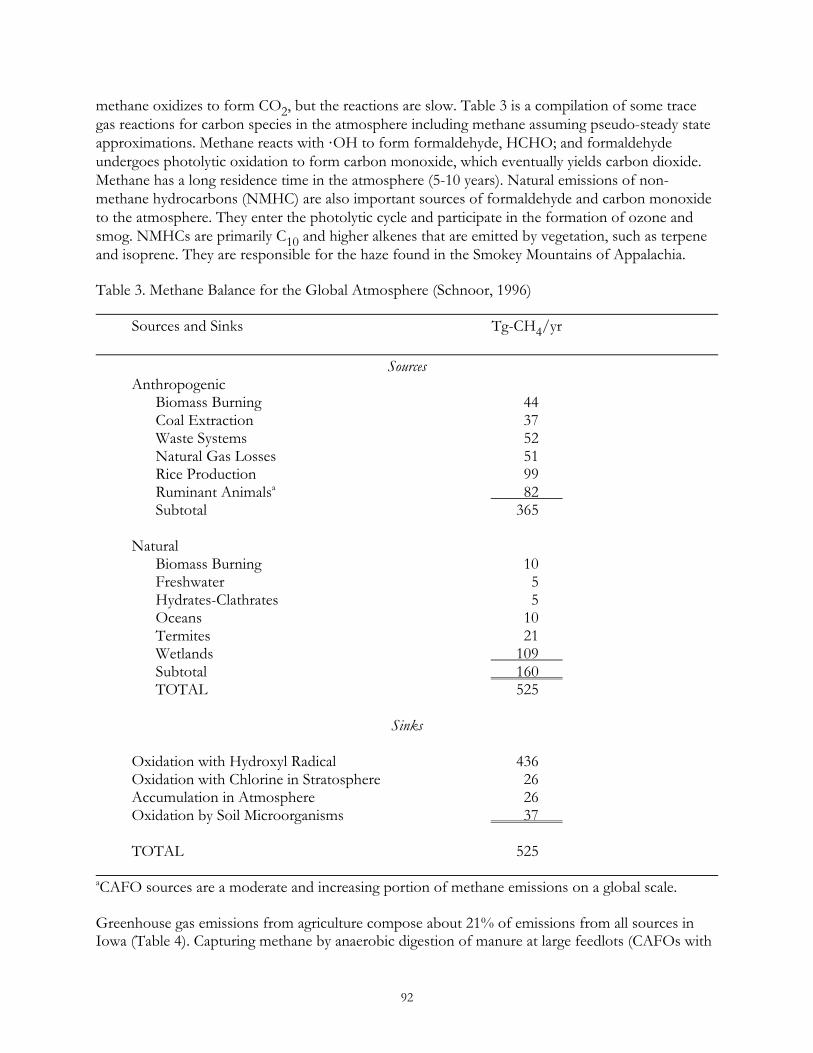
92
methane oxidizes to form CO2, but the reactions are slow. Table 3 is a compilation of some trace gas reactions for carbon species in the atmosphere including methane assuming pseudo-steady state approximations. Methane reacts with ⋅OH to form formaldehyde, HCHO; and formaldehyde undergoes photolytic oxidation to form carbon monoxide, which eventually yields carbon dioxide. Methane has a long residence time in the atmosphere (5-10 years). Natural emissions of non-methane hydrocarbons (NMHC) are also important sources of formaldehyde and carbon monoxide to the atmosphere. They enter the photolytic cycle and participate in the formation of ozone and smog. NMHCs are primarily C10 and higher alkenes that are emitted by vegetation, such as terpene and isoprene. They are responsible for the haze found in the Smokey Mountains of Appalachia. Table 3. Methane Balance for the Global Atmosphere (Schnoor, 1996) Sources and Sinks Tg-CH4/yr
Sources Anthropogenic Biomass Burning 44 Coal Extraction 37 Waste Systems 52 Natural Gas Losses 51 Rice Production 99 Ruminant Animalsa 82 Subtotal 365 Natural Biomass Burning 10 Freshwater 5 Hydrates-Clathrates 5 Oceans 10 Termites 21 Wetlands 109 Subtotal 160 TOTAL 525
Sinks Oxidation with Hydroxyl Radical 436 Oxidation with Chlorine in Stratosphere 26 Accumulation in Atmosphere 26 Oxidation by Soil Microorganisms 37 TOTAL 525 aCAFO sources are a moderate and increasing portion of methane emissions on a global scale. Greenhouse gas emissions from agriculture compose about 21% of emissions from all sources in Iowa (Table 4). Capturing methane by anaerobic digestion of manure at large feedlots (CAFOs with
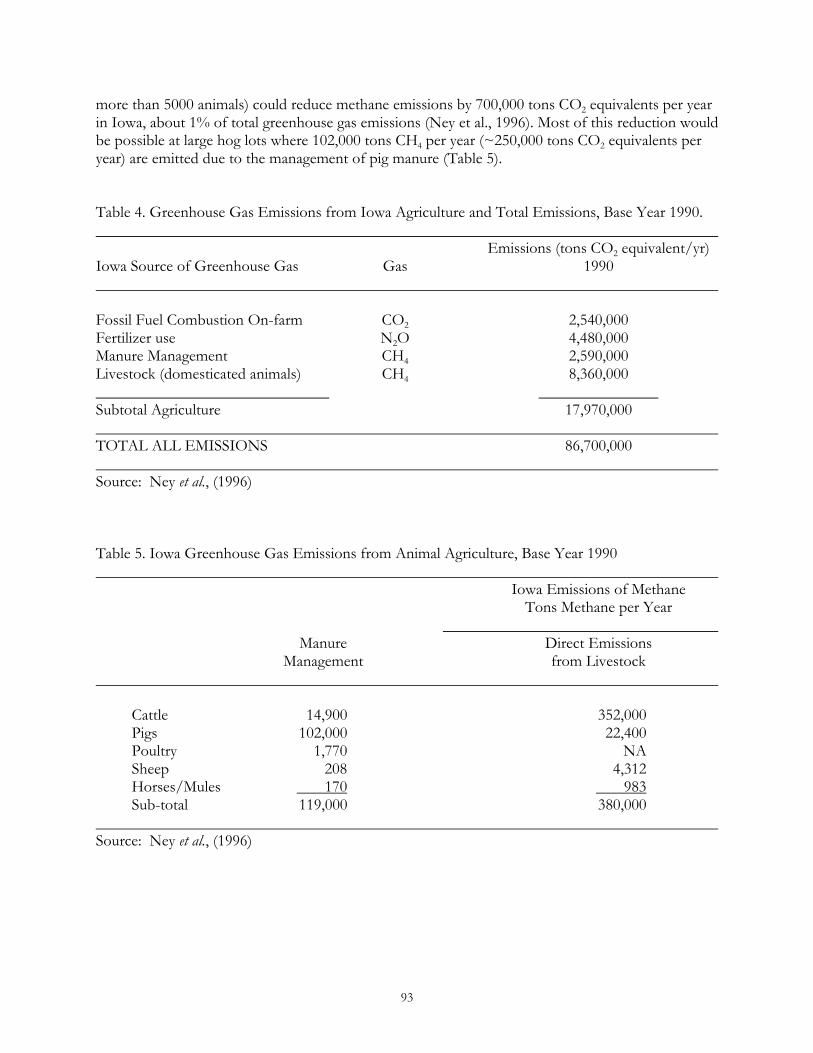
93
more than 5000 animals) could reduce methane emissions by 700,000 tons CO2 equivalents per year in Iowa, about 1% of total greenhouse gas emissions (Ney et al., 1996). Most of this reduction would be possible at large hog lots where 102,000 tons CH4 per year (~250,000 tons CO2 equivalents per year) are emitted due to the management of pig manure (Table 5). Table 4. Greenhouse Gas Emissions from Iowa Agriculture and Total Emissions, Base Year 1990. Emissions (tons CO2 equivalent/yr) Iowa Source of Greenhouse Gas Gas 1990 Fossil Fuel Combustion On-farm CO2 2,540,000 Fertilizer use N2O 4,480,000 Manure Management CH4 2,590,000 Livestock (domesticated animals) CH4 8,360,000 Subtotal Agriculture 17,970,000 TOTAL ALL EMISSIONS 86,700,000 Source: Ney et al., (1996) Table 5. Iowa Greenhouse Gas Emissions from Animal Agriculture, Base Year 1990 Iowa Emissions of Methane Tons Methane per Year Manure Direct Emissions Management from Livestock Cattle 14,900 352,000 Pigs 102,000 22,400 Poultry 1,770 NA Sheep 208 4,312 Horses/Mules 170 983 Sub-total 119,000 380,000 Source: Ney et al., (1996)
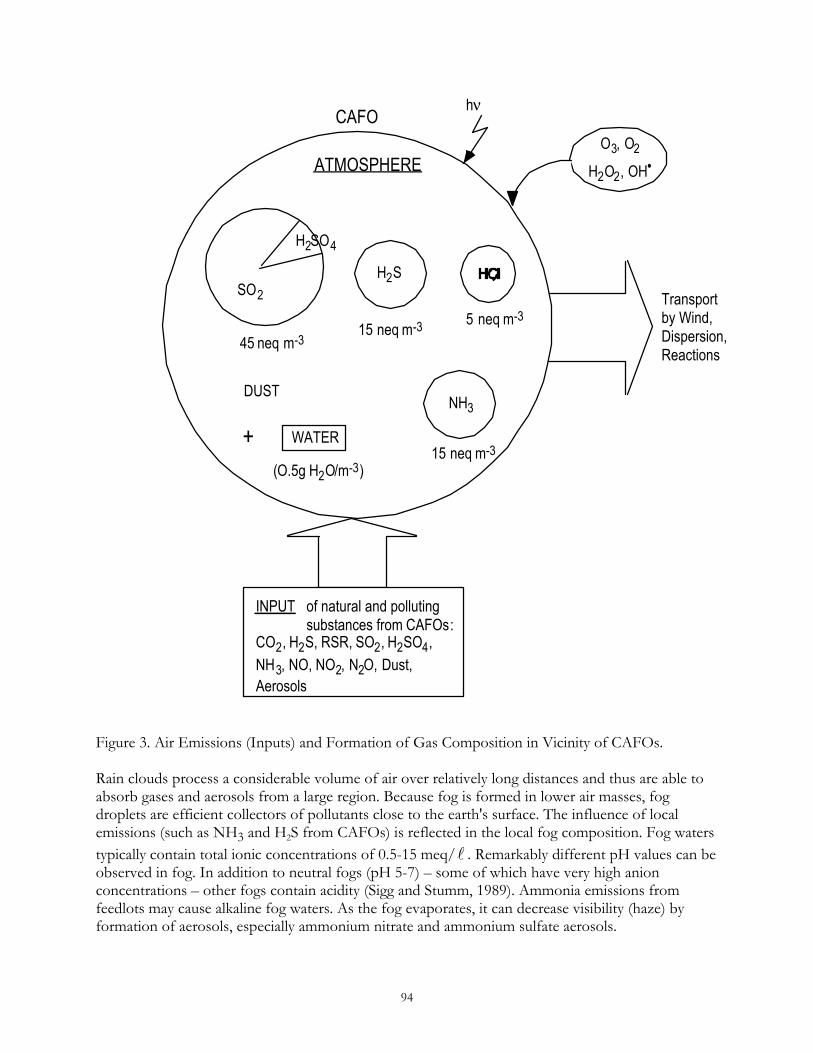
94
Figure 3. Air Emissions (Inputs) and Formation of Gas Composition in Vicinity of CAFOs. Rain clouds process a considerable volume of air over relatively long distances and thus are able to absorb gases and aerosols from a large region. Because fog is formed in lower air masses, fog droplets are efficient collectors of pollutants close to the earth's surface. The influence of local emissions (such as NH3 and H2S from CAFOs) is reflected in the local fog composition. Fog waters typically contain total ionic concentrations of 0.5-15 meq/l . Remarkably different pH values can be observed in fog. In addition to neutral fogs (pH 5-7) – some of which have very high anion concentrations – other fogs contain acidity (Sigg and Stumm, 1989). Ammonia emissions from feedlots may cause alkaline fog waters. As the fog evaporates, it can decrease visibility (haze) by formation of aerosols, especially ammonium nitrate and ammonium sulfate aerosols.
ATMOSPHEREO3, O2
H2O2, OH•
H2SO4
SO2
hνCAFO
45 neq m-35 neq m-3
DUSTNH3
15 neq m-3WATER+
(O.5g H2O/m-3)
15 neq m-3
H2S
INPUT of natural and polluting substances from CAFOs:
CO2, H2S, RSR, SO2, H2SO4,NH3, NO, NO2, N2O, Dust, Aerosols
Transport by Wind, Dispersion, Reactions
95
5.4 Wet and Dry Deposition Wet deposition occurs when pollutants fall to the ground or water surface by rainfall, snowfall, or hail/sleet. Dry deposition is when gases, particles, and aerosols are intercepted by the earth's surface in the absence of precipitation. Wet deposition to the surface of the earth is directly proportional to the concentration of pollutant in the rain, snow, or ice phase. Wet deposition flux is defined by equation (1) below Fwet = ICw (1) where Fwet is the areal wet deposition flux in µg/cm2-s, I is the precipitation rate in cm/s (as liquid H2O), and Cw is the concentration of the pollutant associated with the precipitation in µg/cm3. Wet deposition is measured with a bucket collector and a rain gauge. The rain gauge is placed at the receptor site and provides an accurate measure of precipitation rate, I. The wet bucket collector is open only during the precipitation event, and its contents are analyzed for pollutant concentration, Cw. The concentration of pollutants in wet deposition is due to two important effects with quite different physical mechanisms: • aerosol particle scavenging • gas scavenging Aerosols begin their life cycle after nucleation and formation of a submicron hygroscopic particle, e.g., (NH4)2 SO4, which hydrates and grows very quickly due to condensation of water around the particle. At this stage, it is neither solid nor liquid, but merely a stable aerosol with a density between 1.0-1.1 g/cm3. Mass quantities of air are processed by clouds, creating updrafts which cleanse the air of pollutants. Cloud droplets are very small, on the order of 10 µm in diameter. Typically one million cloud droplets are needed to comprise a 1 mm diameter raindrop. Assuming an average spacing of 1 mm between cloud droplets, condensation of 106 cloud droplets into a 1 mm raindrop would scavenge enough air for a washout ratio of 106.
W = CwCae
(2)
where Cw is the concentration of the pollutant in precipitation water in µg/cm3, Cae is the concentration of the pollutant associated with aerosol droplets in air in µg/cm3, and W is the washout ratio for aerosols, dimensionless (cm3 air/cm3 precipitation). Details of the physics of the scavenging process are beyond the scope of this report, but reference texts include Schwartz and Slinn (1992), and Pruppacher et al. (1983), and Eisenreich (1981). Because clouds process such large quantities of air and pull-up polluted air from the surface, washout is caused predominantly by in-cloud processes. Washout ratios for particles are typically on the order of 105-106. In other words, they are removed rapidly by cloud processes and/or rained-out
96
efficiently. Rainout sometimes refers to below-cloud processes, whereby pollutants are scavenged as raindrops fall through polluted air. Washout for gas scavenging operates by a different mechanism than aerosol particle scavenging. Here, Henry's law is applicable because chemical equilibrium for absorption processes in the atmosphere is on the time scale of one second. Gas scavenging, therefore, is reversible, while aerosol scavenging is an irreversible process. Ammonia is quite efficiently scavenged by washout processes and absorbed into the aqueous phase of water vapor or precipitation where it forms ammonium ions, NH4
+. Hydrogen sulfide is less efficiently scavenged. If we express Henry's constant KH in units of M atm-1, the following equations apply for Henry's law and the washout ratio. Cw = KH patm (3)
W = CwCg
= KHRT (4)
where Cw is the concentration in the water phase (M), patm is the atmospheric partial pressure (atm), W is the washout ratio (dimensionless, i.e., l H2O/ l gas), Cg is the concentration in the gas (mol/l gas) and RT is the universal gas law constant times temperature (24.46 atm/M at 25˚C). Some estimates for washout ratios of ammonia gas and selected pesticides are presented in Table 6. Henry's constants are provided in Schwarzenbach et al. (1993). In general, washout ratios are large for soluble and polar compounds, intermediate for semi-volatiles (such as DDT, dieldrin, dioxin, and PCBs), and low for volatile organic chemicals. Semi-volatile pollutants are an interesting case because these gases can be transported long distances and recycled many times before being deposited in polar regions by a "cold-trap" effect. Although washout ratios of gases by snow are smaller than by rain, there can be appreciable liquid water contained in snow that absorbs gases. Adsorption of gases to snowflake surfaces can also be significant. The washout ratio does not give enough information to calculate the mass of pollutant in a column of air that is actually "washed-out" by rain, but such information is provided in reference texts such as Schnoor (1996). Dry deposition takes place (in the absence of rain) by two pathways. • aerosol and particle deposition • gas deposition There are three resistances to aerosol and gas deposition: 1) aerodynamic resistance, 2) boundary layer resistance, and 3) surface resistance. Aerodynamic resistance involves turbulent mixing and transport from the atmosphere (~ 1 km elevation) to the laminar boundary layer in the quiescent zone above the earth's surface. Boundary resistance refers to the difficulty of pollutant transport through the laminar boundary layer, and surface resistance involves the physical and chemical reactions that may occur at the surface of the receptor (sea surface, vegetation, snow surface, etc.). Dry deposition velocity encompasses the electrical analog of these three resistances in series
97
Vd = 1
ra + rb + rs (5)
where Vd is defined as the dry deposition velocity (cm/s), ra is the aerodynamic resistance, rb is the boundary layer resistance, and rs is the resistance at the surface. Table 6. Estimates of Washout Ratios for Selected Gases, 25˚C (Schnoor, 1996) Henry's Constant Washout Ratio Chemical KH, M-atm-1 W = KHRT* ammonia 63 1,500 aldrin 100 2,450 benzene 0.18 4.4 benzo(a)pyrene 830 20,300 CCl4 0.042 1.0 dioxin 20 490 DDT 105 2,570 dieldrin 89 2,200 di-n-butyl phthalate 780 19,000 methane 0.0015 0.037 naphthalene 2.3 56 parathion 2,630 64,000 trichloroethene 0.093 2.3 toluene 0.15 3.7 2,2',5,5'-PCB 3.5 86 * RT = 24.46 atm/M at 25˚C The deposition velocity is affected by a number of factors including relative humidity, type of aerosol or gas, aerosol particle size, wind velocity profile, type of surface receptor, roughness factor, atmospheric stability, and temperature. Vd increases with wind speed because sheer stress at the surface causes increased vertical turbulence and eddies. A summary of dry deposition measurements and a comparison of collector surfaces are given by Davidson and Wu (1990). For aerosol particles, the deposition velocity is dependent on particle diameter. A minimum deposition velocity (~10-2 cm/s) exists for fine aerosol particles in the size range from 0.1-1.0 µm. Larger particles are deposited much more rapidly. In reality, aerosols change constantly due to changes in relative humidity; they evaporate or condense into water continually. The mass median diameter (MMD) is a measure of the particle size distribution. Milford and Davidson (1985) showed a general power-law correlation for the dependence of Vd on particle size Vd = 0.388 MMD0.76 (6)
98
where Vd is the deposition velocity in cm/s and MMD is the mass median diameter of the particle in µm. Table 5 is a compilation of dry deposition velocities for chemicals of interest from Davidson and Wu (1990). In general, gases that react at the surface (e.g., H2S, SO2, HNO3, HCl, and O3) tend to have slightly higher deposition velocities, on the order of 1.0 cm/s. HNO3 vapor has a very large deposition velocity because there is no surface resistance -- it is immediately absorbed and neutralized by vegetation and/or water. Some gases such as NOx display higher Vd values in daylight because vegetation transpires at that time, and gas exchange through the stomata serves to increase the concentration gradient and the flux at the leaf surface. The receptor surface is critical. Deposition velocities in Table 7 are mostly to natural earth surfaces. Surrogate surfaces tend to underestimate the actual dry deposition because of differences in reactivity at the surface, differences in surface area, and aerodynamic differences around the collector. Natural vegetation and trees are relatively efficient interceptors of gases and particles based on specific surface areas. SO2 dry deposition velocity for a coniferous forest may be several times higher than for an open field or a snow field. Buffer strips of trees around CAFOs could intercept and remove some of the gases and particles by dry deposition.
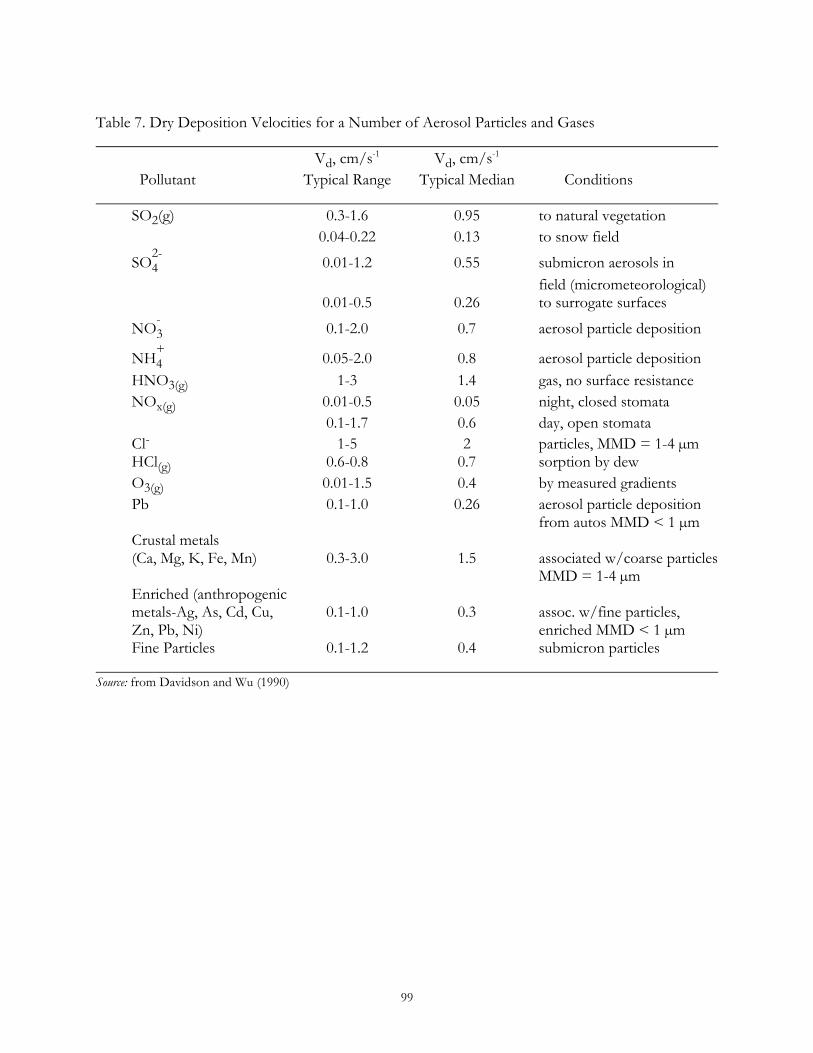
99
Table 7. Dry Deposition Velocities for a Number of Aerosol Particles and Gases Vd, cm/s-1 Vd, cm/s-1
Pollutant Typical Range Typical Median Conditions SO2(g) 0.3-1.6 0.95 to natural vegetation 0.04-0.22 0.13 to snow field
SO2-4 0.01-1.2 0.55 submicron aerosols in
field (micrometeorological) 0.01-0.5 0.26 to surrogate surfaces
NO-3 0.1-2.0 0.7 aerosol particle deposition
NH+4 0.05-2.0 0.8 aerosol particle deposition
HNO3(g) 1-3 1.4 gas, no surface resistance NOx(g) 0.01-0.5 0.05 night, closed stomata 0.1-1.7 0.6 day, open stomata Cl- 1-5 2 particles, MMD = 1-4 µm HCl(g) 0.6-0.8 0.7 sorption by dew O3(g) 0.01-1.5 0.4 by measured gradients Pb 0.1-1.0 0.26 aerosol particle deposition from autos MMD < 1 µm Crustal metals (Ca, Mg, K, Fe, Mn) 0.3-3.0 1.5 associated w/coarse particles MMD = 1-4 µm Enriched (anthropogenic metals-Ag, As, Cd, Cu, 0.1-1.0 0.3 assoc. w/fine particles, Zn, Pb, Ni) enriched MMD < 1 µm Fine Particles 0.1-1.2 0.4 submicron particles Source: from Davidson and Wu (1990)
100
References Davidson CI and Wu YL. Acidic Precipitation - Sources, Deposition, and Canopy Interactions, Vol. 3, S.E.
Lindberg, A.L. page, S.A. Norton, eds., Springer-Verlag, New York (1990), pp. 103-216. Eisenreich SJ. ed., Atmospheric Pollutants in Natural Waters, Ann Arbor Science, Ann Arbor, Michigan
(1981). Milford JB, and Davidson CI. J. Air Pollut. Control Assoc. 35, 1249 (1985). Ney RA, Schnoor JL, Foster NSJ, and Forkenbrock DJ. Iowa Greenhouse Gas Action Plan. A
report for the Iowa Department of Natural Resources, Center for Global and Regional Environmental Research and Public Policy Center, University of Iowa, Iowa City IA (1996).
Paterson KG. Ph.D. Dissertation, The University of Iowa, Iowa City, IA (1993). Pruppacher HR, Semonin RG, and Slinn WGN. eds., Precipitation Scavenging, Dry Deposition, and
resuspension, Vols. 1 and 2. Elsevier, New York (1983). Schnoor JL. Environmental Modeling: Fate of Chemicals in Water, Air and Soil, John Wiley & Sons, New
York, (1996). Schwartz SE, and Slinn WGN. eds., Precipitation Scavenging and Atmosphere-Surface Exchange, Vols. 1, 2,
and 3. Hemisphere Publishing, Washington, D.C. (1992). Schwarzenbach RP, Gschwend PM, and Imboden DM. Environmental Organic Chemistry, John Wiley &
Sons, New York (1993). Sigg L, and Stumm W. Aquatische Chemie, VDF Publishers, Zürich (1989). Warnek P. Chemistry of the Natural Atmosphere, Academic Press, London (1988).
101
6.0 Adverse Health Effects 6.1 Toxicology
Thomas L. Carson, DVM, PhD Department of Veterinary Diagnostic and Production Animal Medicine
College of Veterinary Medicine Iowa State University
Ames, Iowa
Gary D. Osweiler, DVM, PhD Department of Veterinary Diagnostic and Production Animal Medicine
College of Veterinary Medicine Iowa State University
Ames, Iowa
Peter S. Thorne, PhD Department of Occupational and Environmental Health
Institute for Rural and Environmental Health University of Iowa
Iowa City, Iowa
102
6.1 Abstract - Toxicology Valid evaluation of the health effects of airborne substances released from animal production units should be based on the important and well-established toxicological principles of dosage and response. Dosage is the most important factor that determines response to poisons. Toxicity is the quantitative amount of toxicant required to produce a defined effect, but the hazard or risk of toxicosis depends not only on the inherent toxicity of the agent, but on the probability of exposure to the toxicant under conditions of use. Acute, subacute, and chronic toxicity are different chronological quantitations of chemical toxicity and are determined by relative dosage and time of exposure. Many factors can alter animal or human response to toxicants, including those inherent in the toxicant, the organism, the environment and the combinations of these major factors. Toxicological evaluation depends heavily on determination of exposure and evidence for the contribution of interacting factors that can alter toxicity. Quantitative expressions of toxicity and exposure are essential for thorough toxicological evaluation and prognosis. Response to exposure by airborne toxicants is likely to involve the respiratory system because it is a portal of entry. Study of CAFO issues suggests consideration of the mechanisms of injury by volatile agents and particulates, as well as understanding the potential effects of both acute and chronic exposure. Respiratory system effects are manifest in relatively limited ways (bronchoconstriction, pulmonary edema, asthma, carcinogenesis), and careful attention must be given to evidence for cause and effect from among a wide range of insults and levels of exposure. Similar considerations are important for systemic effects that are manifested in other parts of the body. Laboratory animals are often as experimental models of human disease to help establish the mechanism of action and the correlation between exposure levels of airborne toxicants and clinical response. Clinical response to these pollutants depends not only on the concentration of the specific compound, but also the frequency and duration of exposure. Studies of aerial ammonia in laboratory animals have demonstrated dose-effect and duration-effect patterns for damage to the respiratory tract similar to that observed in humans. Acute exposures to moderate concentrations of ammonia irritate the upper respiratory tract. Prolonged or repeated exposures to lower levels of ammonia produce inflammation and lesions of the respiratory tract. Exposures to high concentrations of ammonia result in severe damage to the upper and lower respiratory tract and alveolar capillaries. Controlled studies with hydrogen sulfide in laboratory animals have shown that levels of 500 ppm or greater are likely to be lethal, similar to the response observed in humans. Exposure to sub-lethal levels of hydrogen sulfide have produced progressive effects ranging from increased respiratory rate, to pulmonary edema, to histopathological changes in the nasal cavity and lung tissue. Endotoxins, glucans, and microorganisms maybe important components of bioaerosols associated with animal production units. Inhalation of these compounds have been shown to produce respiratory system effects including airway constriction and obstructive breathing pattern, inflammatory tissue responses, and overt infection of lung tissue.
103
6.1 Toxicology 6.10 Overview of Toxicology Toxicology is the study of poisons, and their effects on living organisms. This includes an understanding of sources of poisons, circumstances of exposure, their effects, diagnosis and treatment and the application of management or educational strategies to prevent poisoning. More than many of the specialties in veterinary medicine, toxicology is based on the important principle of dose and response. Response is dependent not only on presence of a potential toxicant but on the amount of exposure as well.(Osweiler, 1996) With emphasis in this report on accountability of Concentrated Animal Feeding Operations (CAFOs) for substances released from animal production units, there is increasing need to be aware of and apply the dosage and response principle to best estimate the need for regulation or remediation. Determinants of exposure that affect dosage may be more than simply the gross amount of material with access to animals or man. Rather, the effective dosage at a susceptible receptor site determines the ultimate response. Thus, environmental factors that influence exposure, species differences in organisms within an exposure area, vehicle differences that affect absorption, specific drug or chemical interactions that potentiate response, and organ dysfunction that limits elimination may all be factors which influence the ultimate dosage and the outcome of exposure. (Osweiler, 1996) Toxicological Principles Of Evaluation For Cafo Issues A poison or toxicant is any natural or synthetic solid, liquid or gas that when introduced into or applied to the body can interfere with homeostasis of the organism or life processes of cells of the organism by its own inherent qualities, without acting mechanically and irrespective of temperature. For CAFOs, toxicants considered are natural products that would normally be handled by ecological assimilation, but may be locally in unnatural or excessive concentration. Knowledge of the chemical nature and specific effects of toxicants and their combinations is the only certain way to assess hazard from such exposure. Suggestions about potential adverse effects of natural products from livestock waste may be gained from comparative experimental studies, from know effects of substances at high concentrations within CAFOs, and from well-controlled and properly interpreted epidemiological studies. This chapter will review the known biological effects of compounds identified in CAFOs, and will also present evidence gained from epidemiological studies. Toxicological conventions should be followed in assessment of risk to different populations. Toxicity is the quantitative amount or dosage of a poison that will produce a defined effect. For example, the acute lethal dosage of hydrogen sulfide to swine could be described as a concentration in air, e. g. 1,000 parts-per-million or as the equivalent amount on a body weight basis. Toxicity values do not describe the biological effects, but only the quantitative amount (dosage) required to produce a defined effect (e.g. death, respiratory distress, immune suppression, etc). Dosage is the correct terminology for toxicity expressed as amount of toxicant per unit of body weight. Commonly accepted dosage units are mg/kg body weight or moles or micromoles of agent/per kg body weight. In comparative toxicology, relative effects in large and small animals relate dosage to the body surface area, which is approximately equal to (body weight) 2/3. This relationship, and others relevant to interspecies comparisons, should always be considered when comparing laboratory or farm animal toxicity data against risk for humans. Generally, as animals increase in weight, the body surface area increases proportionally less, and this may affect the rate of metabolism, excretion and receptor interaction with toxicants. For many toxicants, larger animals
104
will be poisoned by relatively lower body weight dosages than are smaller mammals. (Eaton and Klaassen, 2001; Osweiler, 1996) From a public health and diagnostic toxicology perspective it is essential to know what exposure level will not cause any adverse health effect. This level is usually referred to as the "no observed adverse effect level” (NOAEL). (Eaton and Klaassen, 2001) Usually a NOAEL in laboratory animals is based on chronic exposures ranging from ninety days to two or more years depending on the species. The inhalation toxicity for gases or aerosols, including particulates, is often expressed as the concentration of material (i.e. the weight of compound per volume or weight of air). The no-effect level is the largest dosage or concentration that does not result in detrimental effects. In industrial hygiene, the concept of protecting human health from exposure is quantified to an assumed normal work day exposure and given a value called the Threshold Limit Value (TLV), which includes a safety factor between exposure allowed and concentrations where adverse effects may be expected. Response to Toxicants Toxicant evaluation is usually classified according to chronological scale that accounts for both dosage and response. Acute toxicity refers to effects of a single dose or multiple doses measured during a twenty-four-hour period. Toxic effects apparent over a period of several days or weeks are classified as subacute. Subchronic toxicity refers to toxic effects that occur between 30 days and ninety days exposure. Chronic effects are those produced by prolonged exposures of three months to a lifetime. Chronic effects are affected by the cumulative tendencies of the toxicant. The ratio of the acute to chronic LD50 dosage is called the chronicity index. (Eaton and Klaassen, 2001) Compounds with strong cumulative properties have larger chronicity index. The potential for individual products from CAFOs to cause cumulative effects should include evaluation of their cumulative potential or chronicity index. Conversely, organisms may develop tolerance for a compound such that repeated exposure increases the size of the dose required to produce lethality. For example, the single dose LD50 of potassium cyanide in rats is 10 mg/kg, while rats given potassium cyanide for ninety days are able to tolerate a dosage of 250 mg/kg without lethality. Toxicity and Risk The concept of risk or hazard is important to toxicology. While toxicity defines the amount of a toxicant that produces specific effects at a known dosage, hazard or risk is the probability of poisoning under the conditions of expected exposure or usage. Compounds of high toxicity may still present low hazard or risk if exposure to the toxicant is limited. CAFO risk evaluation should include estimation of dosage at remote or off site locations, and measurement or estimation of exposure at such locations is essential. Factors discussed in previous chapters relating to dispersion and dilution in the environment are essential in estimating the risk for a compound, even if it is of high inherent toxicity. Moreover, binding of toxicant gases to particulates may either reduce or increase their toxic properties so that risk is a function of all factors and interactions. Factors That Affect Response To Toxicants Many factors inherent in the toxicant, the animal or the environment can alter a toxicity value determined under defined experimental conditions. The toxicity of a compound may vary with the route of exposure. Usual routes of exposure to environmental agents are oral, dermal and inhalation. Gases are absorbed directly through pulmonary membranes, but aerosols including dusts may be deposited in lower airways or lungs if they are in a range between 0.1 and 5.0 um. Systemic retention occurs when macrophages laden with particles gain access to the pulmonary lymphatic
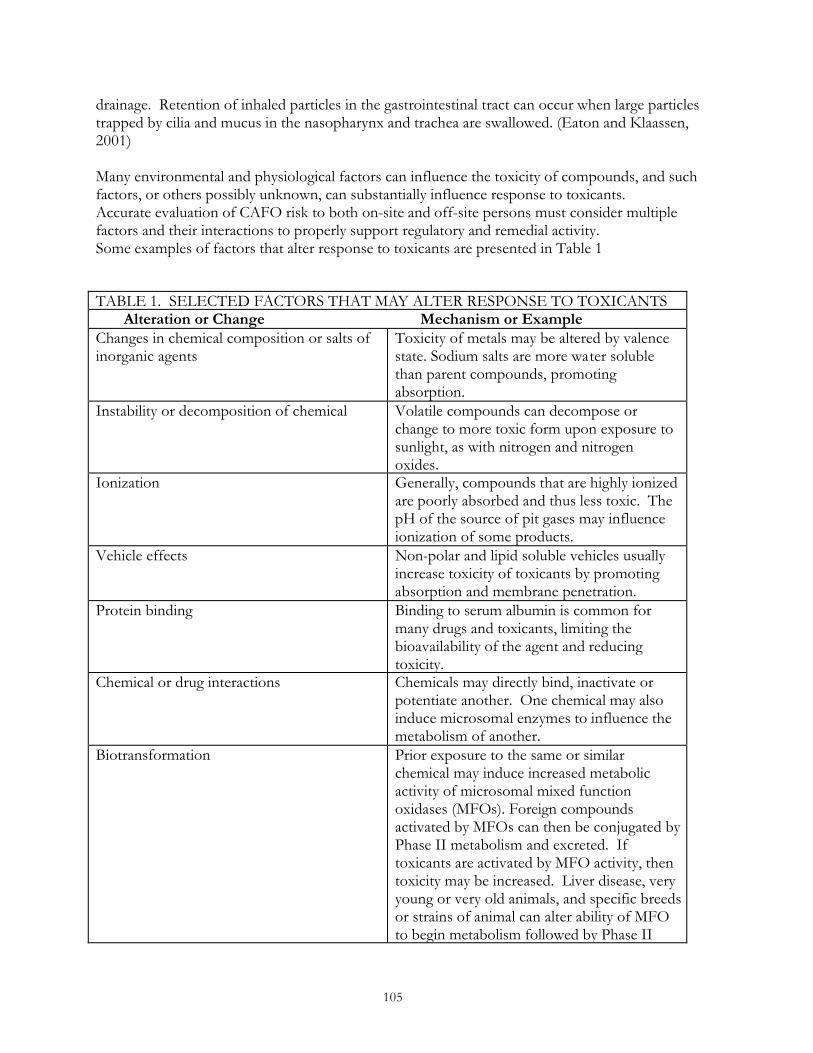
105
drainage. Retention of inhaled particles in the gastrointestinal tract can occur when large particles trapped by cilia and mucus in the nasopharynx and trachea are swallowed. (Eaton and Klaassen, 2001) Many environmental and physiological factors can influence the toxicity of compounds, and such factors, or others possibly unknown, can substantially influence response to toxicants. Accurate evaluation of CAFO risk to both on-site and off-site persons must consider multiple factors and their interactions to properly support regulatory and remedial activity. Some examples of factors that alter response to toxicants are presented in Table 1
TABLE 1. SELECTED FACTORS THAT MAY ALTER RESPONSE TO TOXICANTS Alteration or Change Mechanism or Example Changes in chemical composition or salts of inorganic agents
Toxicity of metals may be altered by valence state. Sodium salts are more water soluble than parent compounds, promoting absorption.
Instability or decomposition of chemical Volatile compounds can decompose or change to more toxic form upon exposure to sunlight, as with nitrogen and nitrogen oxides.
Ionization Generally, compounds that are highly ionized are poorly absorbed and thus less toxic. The pH of the source of pit gases may influence ionization of some products.
Vehicle effects Non-polar and lipid soluble vehicles usually increase toxicity of toxicants by promoting absorption and membrane penetration.
Protein binding Binding to serum albumin is common for many drugs and toxicants, limiting the bioavailability of the agent and reducing toxicity.
Chemical or drug interactions Chemicals may directly bind, inactivate or potentiate another. One chemical may also induce microsomal enzymes to influence the metabolism of another.
Biotransformation Prior exposure to the same or similar chemical may induce increased metabolic activity of microsomal mixed function oxidases (MFOs). Foreign compounds activated by MFOs can then be conjugated by Phase II metabolism and excreted. If toxicants are activated by MFO activity, then toxicity may be increased. Liver disease, very young or very old animals, and specific breeds or strains of animal can alter ability of MFO to begin metabolism followed by Phase II
106
detoxification of foreign compounds. Liver disease Reduced synthesis of conjugating or binding
agents (glutathione, metallothionein), essential proteins and coagulation factors may alter response to absorbed chemicals.
Nutrition and diet Vitamin C and vitamin E can aid in scavenging of free radicals and repair of cellular protective mechanisms.
Respiratory System Response to Injury Response of airways and lung to injury is dose dependent and expressed in chronological terms as acute, subacute or chronic. Response of the respiratory tract to toxicants is manifest in relatively few ways in response to many different chemicals, and a few specific mechanisms of injury are known. (Haschek and Rousseaux, 1998; Witschi, 2001) Mechanisms of Respiratory System Injury Respiratory damage depends on relatively few recognized molecular and cellular mechanisms that account for a wide variety of toxicant exposures. Many recognized effects are related to the oxidative burden imposed on the respiratory tract. (Witschi, 1997) This includes generation of unstable and reactive free radicals that lead to oxidative chain reactions and subsequent cellular damage or destruction. Cellular injury then results in release of microsomes and flavoproteins, neutrophils, moncytes and macrophages that can sustain the conversion of molecular oxygen to reactive oxygen metabolites. Many of these effects are an excessive response to what is a normal respiratory defense mechanism against microorganisms and low- or high-molecular-weight antigenic materials. Immunologic consequences are triggered when foreign materials in the respiratory tract sensitize the lung or airways to further exposure of the same material. (Witshci, 2001). Further consequences of oxidative damage or covalent binding in the pulmonary systems can result from damage and cross linking of DNA with potential subsequent development of carcinogenesis. The consequences of these mechanisms can be acute or chronic respiratory damage and the physiological dysfunction that accompanies each. Acute Respiratory Injury Acute airway damage in the transport passages (nasopharynx, trachea, bronchi, bronchioles) is reflected as bronchoconstriction and/or excess or reduced mucus and ciliary function. (Haschek and Rousseaux, 1998; Witschi, 2001). Response to irritants in nasal passages can cause acute or chronic rhinitis or, at higher concentrations, pause in respiration which develops as a reflex protective mechanism. Autonomic nervous system response to irritants is associated with acute reflex contraction of trachea and bronchi, resulting in decreased airway diameter and increased resistance to air flow. This results in wheezing, coughing, dyspnea and reduced exercise tolerance. This response is most likely triggered by irritant gases with moderate water solubility. Effects of short-term exposure resolve quickly when the irritant gas is no longer present and if no permanent cellular damage has occurred; long-term exposure may lead to chronic effects. Acute lung damage can result in two major effects on lung tissue. Toxic pulmonary edema, which is characterized by alveolar or interstitial fluid accumulation and a thickened alveolar-capillary interface results in reduced oxygen and carbon dioxide exchange. Highly water-soluble irritant gases, including ammonia and hydrogen sulfide, which reach the lung parenchyma can damage cellular membranes
107
and allow fluid leakage leading to pulmonary edema. Inflammatory response and cellular accumulation may accompany the edema and, if severe, result in prolonged changes including fibrogenesis. Acute alveolar endothelial damage and necrosis stimulates Alveolar Type II cell proliferation. These cells are physically thicker than Type I cells, and as immature replacements of Type I cells (alveolar endothelium) markedly reduce oxygen and carbon dioxide exchange (Witschi, 2001). Chronic Respiratory Injury Chronic response to injury may come from excessive and prolonged acute injury or from low-level or subclinical damage. In either event, manifestation is commonly as fibrosis or other chronic inflammatory change, emphysema, asthma or carcinogenesis. Fibrosis is the result of excessive production of collagen in lung parenchyma and can occur at the alveolar, alveolar duct and bronchiolar levels. Type I and III collagen constitute approximately 90 percent of lung collagen. Increases in collagen, especially Type I, increase stiffness of the lung and reduce compliance, with severe fibrosis resulting in reduced vital capacity and reduced exercise tolerance. Emphysema is characterized by “abnormal enlargement of the airspaces distal to the terminal bronchiole, accompanied by destruction of the walls, without obvious fibrosis”. (Snider et al, 1985) Emphysema arises from interference with or lack of alpha1-antiprotease, leading to loss of pulmonary elastin and subsequent alveolar wall breakdown. This leads to reduced alveolar surface and hyperinflation of alveoli and lungs with excessive compliance. Asthma is characterized by increased airway activity with excessive contraction of large airways in response to irritants. Effects may be initiated by exposure to antigens or by chemicals that serve as haptens, with contributing influences by inflammatory cells and cytokines (Barnes et al 1998). Effects are mild to severe dyspnea, which can be acute, recurring and influenced by inhalation of a variety of pollutants (Witschi, 2001). Respiratory carcinogenesis, especially lung cancer in humans is common and associated with environmental, industrial and personal exposures to a variety of chemicals. For most lung cancers, there is likely a dose-response relationship but clinical disease is often manifested later in life after long-term exposure. Animal studies are helpful in definition of mechanisms and in selected dose-response considerations. However, animal studies are important to intepret carefully in the context of significant differences in laboratory animal susceptibility and for the dosages used in experimental studies compared to ambient exposures of human populations (Hahn, 1997; Malkinson, 1998). Systemic Effects of Airborne Toxicants Airborne toxicants can affect systems other than or in addition to the respiratory tract. Lung is an efficient absorption organ and readily transports volatile compounds to the systemic circulation. Neurological and immune system consequences may occur secondary to inhalation exposure. A limited amount of xenobiotic metabolism is possible in lung, so that some bioactivation of toxicants can occur upon first pass pulmonary absorption. Effects of absorbed volatile agents will depend on the eventual target organs and susceptible receptors. These specific effects in target tissues and organs will be discussed in detail in subsequent sections of this chapter.
108
6.1.1 Toxicology of ammonia Experimental studies indicate that the concentration of aerial ammonia which is acutely lethal to laboratory animals is dependent on the duration of the exposure. The lethal concentration of ammonia in rats and mice increases 5-10 times as the duration of exposure decreases from 16 hours to several minutes (Hilado et al. 1977; Kapeghian et al. 1982; Weedon et al. 1940). Exposure frequency also appears to be an important factor in determining lethality. Continuous exposure to 653 ppm of ammonia for 25 days resulted in nearly 64% lethality in rats, whereas intermittent exposure to nearly twice this concentration was tolerated for 42 days (Coon et al. 1970). It also appears that male rats are more sensitive than female rats to the lethal effects of aerial ammonia (Appelman et al. 1982). Studies in laboratory animals have demonstrated dose-effect and duration-effect patterns for damage to the respiratory tract similar to that observed in humans. Acute exposures to moderate concentrations of ammonia (<1000 ppm) irritate the upper respiratory tract, whereas exposures to high concentrations (>4000 ppm) result in severe damage to the upper and lower respiratory tract and alveolar capillaries (Coon et al. 1970; Kapeghian et al. 1982; Mayan and Merilan 1972; Richard et al. 1978a,b; Schaerdel et al. 1983). Prolonged or repeated exposures to lower levels of ammonia (>150 ppm) produce inflammation and lesions of the respiratory tract (Broderson et al. 1976; Coon et al. 1970). No overt symptoms of neurological disorders were reported in guinea pigs or monkeys that were exposed to up to 1105 ppm ammonia for 6 weeks (Coon et al. 1970). However, acute exposure to low levels of ammonia (100 ppm) has been shown to depress free-access wheel running behavior in rodents (Tepper et al. 1985). This may represent avoidance of sensory or upper airway irritation, but these same effects can be seen after injection of ammonium salts. 6.1.2 Toxicology of hydrogen sulfide Controlled studies using dogs, rats, mice, and rabbits exposed acutely to high concentrations of hydrogen sulfide gas for various periods of time have shown that levels of 500 ppm or greater are likely to be lethal, similar to the response observed in humans exposed to high levels (Beck, 1979; Elovaara, 1978; Higuchi and Fukamachi, 1977; Haggard, 1922; Lopez,1987,1988a,1988b,1989; Kage, 1992; Khan, 1990; Prior, 1988, 1990; Savolainen, 1980; Smith and Gosselin, 1964; Tansy,1981). In addition to an increase in respiration rate that was noted in rats exposed to 100-200 ppm hydrogen sulfide for 1 hour (Higachi and Fukamachi, 1977), a number of histological and biochemical changes were noted in the respiratory tissues and fluids of rats acutely exposed to 200, 300 or 400 ppm hydrogen sulfide for 4 hours (Lopez, 1987; Green,1991). Histopathological changes were reported in the nasal cavity of rats exposed to greater than 200 ppm hydrogen sulfide for 4 hours (Lopez, 1988b). Moderate-to-massive pulmonary edema was evident in rats exposed to 375 ppm hydrogen sulfide for 4 hours (Prior, 1990), and slight pulmonary congestion was found in rats exposed to 75 ppm hydrogen sulfide for 1 hour (Kohno, 1991). Significant decreases in numbers of viable pulmonary alveolar macrophages were noted in the lung lavage fluid of rats exposed for 4 hours to 400 ppm hydrogen sulfide (Khan, 1991). The effects of intermediate-duration exposures to hydrogen sulfide have been examined in rats, mice, and pigs. Respiratory effects were not observed in two strains of rats exposed to hydrogen sulfide at concentrations up to 80 ppm 6 hours/day, 5 days/week, for 90 days (CIIT 1983b, CIIT
109
1983c). In contrast to rats, inflammation of the nasal mucosa described as minimal to mild was observed in mice exposed to hydrogen sulfide at 80 ppm (CIIT 1983a). Respiratory effects were not observed at 30.5 ppm. No mortality was noted during 90-day studies in which rats and mice were exposed for 6 hours/day, 5 days/week, to up to 80 ppm hydrogen sulfide (CIIT 1983b, 1983c). (CIIT 1983a). Guinea pigs exposed daily to 20 ppm of hydrogen sulfide for 11 days developed fatigue, somnolence, and dizziness (Haider, 1980). Neurochemical analyses revealed decreased cerebral hemisphere and brain stem total lipids and phospholipids. Lethargy was observed in rats following exposure to 400 ppm of hydrogen sulfide for 4 hours (Lopez, 1988b). Rats were exposed to average concentrations of 100-200, 200-300, 300-400, or 400-500 ppm hydrogen sulfide; at 200-300 ppm, a decreased response rate in a discriminated avoidance task was observed (Higuchi and Fukamachi, 1977). Except at the highest concentrations tested, the response rates and percent avoidances recovered rapidly when ventilation with clean air was provided, although even at 400-500 ppm, they were almost normal the following day. When these same animals were tested for Sidman-type conditioned avoidance response at response-shock intervals of 10 or 30 seconds, an inverse relationship between hydrogen sulfide concentration and response rate was noted; this effect dissipated when exposure stopped (Higuchi and Fukamachi 1977). Excitement was observed when mice were exposed to 100 ppm of hydrogen sulfide for 2 hours at 4-day intervals (Savolainen, 1980). Exposure also resulted in decreased cerebral ribonucleic acid (RNA), decreased orotic acid incorporation into the RNA fraction, and inhibition of cytochrome oxidase. An increase in the glial enzyme marker, 2',3'-cyclic nucleotide-3'-phosphohydrolase, was seen. Neurochemical effects have been reported in other studies. Decreased leucine uptake and acid proteinase activity in the brain were observed in mice exposed to 100 ppm hydrogen sulfide for 2 hours (Elovaara, 1978). Inhibition of brain cytochrome oxidase and a decrease in orotic acid uptake were observed in mice exposed to 100 ppm hydrogen sulfide for up to 4 days (Savolainen, 1980). The intermediate-duration effects of hydrogen sulfide on neurological function were examined by the measurement of motor and sensory nerve conduction velocities of the tail nerve or morphology of the sciatic nerve but, no neurotoxic effects were observed in rats exposed to 50 ppm hydrogen sulfide for 5 days a week, for 25 weeks (Gagnaire, 1986). Neurologic function and neuropathology were evaluated in rats exposed to 0,10.1, 30.5, or 80.0 ppm hydrogen sulfide for 6 hours/day, 5 days/week, for 90 days (CIIT, 1983c). Although absolute brain weights were decreased (5%) in rats exposed to 80 ppm hydrogen sulfide in this study, there were no treatment-related effects on neurological function or neuropathology. In addition, no signs of neurotoxicity were noted in a similar study in which mice and rats were exposed to 0, 10.1, 30.5, or 80.0 ppm hydrogen sulfide for 90 days (CIIT, 1983a, CIIT, 1983b). 6.1.3 Toxicology of bioaerosols Endotoxin The bioaerosol constituent present in swine barns that has been most studied is endotoxin. Endotoxin is a lipopolysaccharide (LPS) component of the outer cell wall of Gram negative (Gm-) bacteria. Endotoxin has been shown in both humans (Schwartz et al 1995, Jagielo et al 1996, Deetz
110
et al 1997) and animals (Schwartz et al 1994, Jagielo et al 1996, Thorne et al 1998, Thorne 2000) to be a potent pro-inflammatory agent through its ability to activate the innate immune system. Endotoxin is an amphipathic molecule consisting of a phospholipid fraction, called lipid A, bound to a polysaccharide. The polysaccharide has two components: the O -antigen and the core polysaccharide (Rietschel et al 1996). In swine CAFOs, endotoxin most likely includes pieces of other membrane materials in association with LPS. The biological activity of endotoxin rests largely with the lipid A fraction. Once inhaled, endotoxin will interact with macrophages or soluble CD14 inducing signal transduction via the TLR-4 receptor (Medzhitov et al 1997, Faure et al 2000, Gao et al 1998). Through multiple transcription factors (Gao et al 1998), the initiation of transcription of several genes coding for inflammatory mediators can trigger the production of pro-inflammatory cytokines. The cytokines most associated with inhalation of endotoxin are Interleukin (IL)-1, tumor necrosis factor (TNF)a, IL-6, IL-8 (humans), and MIP-2 (mice) (Thorne et al 1998, Deetz et al 1997). Recent evidence suggests a regulatory role for IL-10, IL-12 (Shnyra et al 1998), and interferon ? (IFN?) (Kline et al 1998). An aggressive response to endotoxin exposure results in a cascade of events producing airway narrowing and an obstructive breathing pattern (Pauwels et al 1990). Chronic inhalation exposure in mice has been shown to induce airway remodeling and collagen formation (George et al 2001). Glucans Studies of the past five years have provided evidence that glucans may also be important immunomodulators (Rylander 1999, Fogelmark et al 1997). ß(1? 3)-glucans are glucose polymers with variable molecular weight and degree of branching that may appear in triple helix, single helix or random coil structures (Williams 1994). ß(1? 3)-glucans originate from a variety of sources, including fungi, bacteria, and plants (Stone and Clarke 1992). They are water insoluble structural cell wall components of these organisms, but may also be found in extracellular secretions of microbial origin. Glucans may account for up to 60% of the dry weight of the cell wall of fungi, of which the major part is ß(1? 3)-glucan (Klis 1994). Recently it has been suggested that ß(1? 3)-glucans play a role in bioaerosol induced inflammatory responses and resulting respiratory symptoms (Williams 1994, Rylander et al 1992, Fogelmark et al 1994). Microorganisms Infectious microorganisms may present an occupational hazard when inhaled (Thorne 2001, Douwes et al 2002). Fortunately, airborne transmission of zoonotic pathogens at sufficient doses to cause disease appears to be uncommon in CAFOs. The most notable infectious bioaerosol in agricultural occupational environments is Mycobacterium tuberculosis (Schenker et al. 1998). However, this arises from transmission from person-to-person. Tuberculosis occurs with high prevalence among immigrant farm laborers. More germane to CAFOs in Iowa is concern over the emergence of antibiotic resistant pathogenic organisms that may arise under the influence of antibiotics added to feed. Non-infectious microorganisms are a more significant problem in CAFOs by virtue of the enormously high concentrations at which they occur. There has been limited study of the effects of inhaled bacteria and fungi in laboratory animal models of human disease. Most of the studies in the literature have used a lung infection model to study host defense against lung pathogens or to assess the efficacy of antimicrobial therapies. However, a few studies are informative. McCray et al (1999) demonstrated severe inflammation with neutrophilic infiltration to the lungs of mice following 4 hr inhalation exposure to Pseudomonas aeruginosa at a concentration of 3.3 x 10⁸ CFU/m3. This study
111
used bacterial lung burdens that resemble those attainable in CAFOs. The bacteria were cleared from the lungs within 24 hours and the inflammation resolved by 72 hours after exposure. Thorne and Gassman studied the relative potency of inhaled Gram-negative organisms and Gram-positive organisms for lung inflammation in mice (Gassman et al 2000). This study demonstrated that the Gram-negative bacteria: Enterobacter agglomerans and Pseudomonas aeruginosa were orders of magnitude more potent that the Gram-positive organisms: Bacillus magaterium and Micrococcus luteus at initiating inflammation. In this study, markers of inflammation included influx of neutrophils to the lung and increased concentration of interleukin-6 (IL-6) and tumor necrosis factor (TNFa). It was concluded that the endotoxin derived from the Gram-negative organisms was the cell component primarily responsible for the inflammation. Fungi and fungal conidia are also found airborne in CAFOs. Fungi have been studied primarily as allergens and as sources of mycotoxins. There is no reported evidence of animal or human health problems due to mycotoxin delivery arising from inhalation of fungal spores for the common fungi found in CAFOs. Studies of allergen potency for fungi found in CAFOs have focused on human studies rather than on animal models. References - Overview (Osweiler) Barnes PJ, Chung KF, Page, CP. 1998. Inflammatory mediators of asthma: An Update. Pharmacol. Rev 50:575-596. Eaton DL and Klaassen CD. 2001. Principles of Toxicology, in Klassen CD (ed) Casarett and Doull’s Toxicology: The Basic
Science of Poisons. 6th Edition. McGraw-Hill Medical Publishing Division, pp 11-34. Hahn FF. 1997. Carcinogenic responses of the respiratory tract, in Sipes, IG, McQueen, CA, Gandolfi, JA (eds):
Comprehensive Toxicology. Vol 8. Roth, RA (ed) Toxicology of the Respiratory System. Oxford, England: Elsevier, 1997, pp 187-202.
Haschek WM and Rousseaux CG. 1998. Fundamentals of Toxicologic Pathology. Chapter 5: Respiratory System. Academic Press, San Diego, pp 91-126
Malkinson AM. 1998. Molecular comparison of human and mouse pulmonary adenocarcinomas. Exp Lung Res 24:541-555.
Osweiler GD 1996. Toxicology. The National Veterinary Medical Series. Chapter 11: Toxicology of the Respiratory System. Williams Wilkins, Philadelphia, pp. 1-33.
Snider GL, Kleinerman J, Thurlbeck WM, Bengali ZH. The definition emphysema: Report of a national Heart, Lund, and Blood Institute Workshop. Am Rev Respir Dis 132:182-185.
Witschi HP. 1997. Selected Examples of Free-Radical Mediated Lung Injury, in Wallace KB (ed): Free Radical Toxicology. Taylor & Francis, New York, pp 279-294.
Witschi HP and Last JA. 2001. Toxic Responses of the Respiratory System, in Klassen CD (ed) Casarett and Doull’s Toxicology: The Basic Science of Poisons . 6th Edition. McGraw-Hill Medical Publishing Division, pp 515-534.
References - Toxicology of ammonia (Carson) Appelman LM, Ten Berge WF, Reuzel PGJ. 1982. Acute inhalation toxicity study of ammonia in rats with variable
exposure periods. Am Ind Hyg Assoc J 43:662 – 665. Broderson JR, Lindsey JR, Crawford JE. 1976. The role of environmental ammonia in respiratory mycoplasmosis of rats.
Am J Pathol 85:115 – 130. Coon RA, Jones RA, Jenkins LJ, et al. 1970. Animal inhalation studies on ammonia, ethylene glycol, formaldehyde,
dimethylamine, and ethanol. Toxicol Appl Pharmacol 16:646 – 655. Hilado CJ, Casey CJ, Furst A. 1977. Effect of ammonia on Swiss albino mice. J Combust Toxicol 4:385 – 388. Kapeghian JC, Mincer HH, Jones AB, et al. 1982. Acute inhalation toxicity of ammonia in mice. Bull Environ Contam
Toxicol 29:371 – 378. Mayan MH, Merilan CP. 1972. Effects of ammonia inhalation on respiration rate of rabbits. J Anim Sci 34:448 – 452. Richard D, Bonely G, Bondene CL. 1978a. [Effect of continuous inhalation of ammonia in the rat and mouse.] Bull
Europ Physiopath Resp 14:573 – 582 cited in ATSDR, 1990. Toxicological Profile for Ammonia. U.S. Department of Health and Human Services.
112
Richard D, Bonely G, Bondene CL. 1978b. Acute toxicity of ammonia gas in the rabbit by inhalation. C. R. Acad Sci Paris, Ser D 287:375 – 378. cited in ATSDR, 1990. Toxicological Profile for Ammonia. U.S. Department of Health and Human Services.
Schaerdel AD, White WJ, Lang, CM, et al. 1983. Localized and systemic effects of environmental ammonia in rats. Lab Anim Sci 33:40 – 45.
Tepper JS, Weiss B, Wood RW. 1985. Alterations in behavior produced by inhaled ozone or ammonia. Fundam Appl Toxicol 5:1110 – 1118.
Weedon FR Hartzell A, Setterstrom C. 1940. Toxicity of ammonia, chlorine, hydrogen cyanide, hydrogen sulfide, and sulfur dioxide gases V. animals. Cont Boyce Thompson Inst 11:365 – 385.
References -Toxicology of hydrogen sulfide (Carson) Beck JF, Cormier F, Donini JC et al. 1979. The combined toxicity of ethanol and hydrogen sulfide. Toxicol Lett
3(4):311-313. CIIT. 1983a. 90-day vapor inhalation toxicity study of hydrogen sulfide in B6C3F1 mice. Report to the Chemical
Institute of Toxicology, Research Triangle Park, NC, by ToxiGenics, Inc. CIIT docket #42063. CIIT. 1983b. 90-day vapor inhalation toxicity study of hydrogen sulfide in Fischer 344 rats. Report to the Chemical
Institute of Toxicology, Research Triangle Park, NC, by ToxiGenics, Inc. CIIT docket #22063. CIIT. 1983c. 90-day vapor inhalation toxicity study of hydrogen sulfide in Sprague-Dawley rats. Report to the Chemical
Institute of Toxicology, Research Triangle Park, NC, by ToxiGenics, Inc. CIIT docket #32063. Elovaara E, Tossavainen A, Savolainen H. 1978. Effects of subclinical hydrogen sulfide intoxication on mouse brain
metabolism. Exp Neurol 62(1):93-98. Gagnaire F, Simon P, Bonnet P, et al. 1986. The influence of simultaneous exposures to carbon disulfide and hydrogen
sulfide on the peripheral nerve toxicity and metabolism of carbon disulfide in rats. Toxicol Lett 34:175-183. Green FHY, Schurch S, De Sanctis GT, et al. 1991. Effect of hydrogen sulfide exposure on surface properties of lung
surfactant. J Appl Physiol 70(5):1943-1949. Haggard HW, Henderson Y, Charlton TJ. 1922. The influence of hydrogen sulphide upon respiration. Amer J Physiol
61:289 – 297. Haider SS, Hasa M, Islam F. 1980. Effect of air pollutant hydrogen sulfide on the levels of total lipids, phospholipids &
cholesterol in different regions of the guinea pig brain. Indian J Exp Biol 18(4):418-420. Higuchi Y, Fukamachi M. 1977. Behavioral studies on toxicity of hydrogen sulfide by means of conditioned avoidance
response in rats. Folia Pharmacologica Japonica 73(3):307-319. Kage S, Nagata T, Kimura K, et al. 1992. Usefulness of thiosulfate as an indicator of hydrogen sulfide poisoning in
forensic toxicological examination: a study with animals. Japanese Journal of Forensic Toxicology 10(3):223-227.
Khan AA, Schuler MM, Prior MG, et al. 1990. Effects of hydrogen sulfide exposure on lung mitochondrial respiratory chain enzymes in rats. Toxicol Appl Pharmacol 103(3):482-490.
Khan AA, Yopng S, Prior MG, et al. 1991. Cytotoxic effects of hydrogen sulfide on pulmonary alveolar macrophages in rats. J Toxicol Environ Health 33(1):57-64.
Kohno M, Tanaka E, Nakamura T, et al. 1991. Influence of short-term inhalation of hydrogen sulfide in rats. Japanese Journal of Toxicology and Environmental Health 37(2):103-106.
Lopez A, Prior M, Yong S, et al. 1987. Biochemical and cytological alterations in the respiratory tract of rats exposed for 4 hours to hydrogen sulfide. Fundam Appl Toxicol 9:753-762.
Lopez A, Prior M, Lillie LE, et al. 1988a. Histological and ultrastructural alterations in lungs of rats exposed to sub-lethal concentrations of hydrogen sulfide. Vet Pathol 25:376-384.
Lopez A, Prior M, Yong S, et al. 1988b. Nasal lesions in rats exposed to hydrogen sulfide for four hours. Am J Vet Res 49(7):1107-1111.
Lopez A, Prior MG, Reiffenstein RJ, et al. 1989. Peracute toxic effects of inhaled hydrogen sulfide and injected sodium hydrosulfide on the lungs of rats. Fundam Appl Toxicol 12(2):367-373.
Prior MG, Sharma AK, Yong S, et al. 1988. Concentration-time interactions in hydrogen sulphide toxicity in rats. Can J Vet Res 52:375-379.
Prior M, Green F, Lopez A, et al. 1990. Capsaicin pretreatment modifies hydrogen sulphide-induced pulmonary injury in rats. Toxicol Pathol 18(2):279-288.
Savolainen H, Tenhunen R, Elovaara E, et al. 1980. Cumulative biochemical effects of repeated subclinical hydrogen sulfide intoxication in mouse brain. Int Arch Occup Environ Health 46(1):87-92.
Smith RP, Gosselin RE. 1964. The influence of methemoglobinemia on the lethality of some toxic anions: Sulfide. Toxicol Appl Pharmacol 6::584-592.
113
Tansy MF, Kendall FM, Fantasia J, et al. 1981. Acute and subchronic toxicity of rats exposed to vapors of methyl mercaptan and other reduced-sulfur compounds. J Toxicol Environ Health 8(1-2):71-88.
References – Toxicology of Bioaerosols (Thorne) Deetz DC, Jagielo PJ, Thorne PS, Bleuer SA, Quinn TJ, Schwartz DA. The kinetics of grain dust-induced inflammation
of the lower respiratory tract. Am J Respir Crit Care Med 155:254-259, 1997. Faure E, Equils O, Sieling PA, Thomas L Zhang FX, Kirschning CJ, Polentarutti N, Muzio M, Arditi M. Bacterial
lipopolysaccharide activates NF-?B through toll-like receptor 4 (TLR-4) in cultured human epithelial cells. J Biol Chem 275:11058-11063, 2000.
Fogelmark B, Sjöstrand M, Rylander R. Pulmonary inflammation induced by repeated inhalations of ß(1? 3)-D-glucan and endotoxin. Int J Exp Path 75:85-90, 1994.
Fogelmark B, Sjöstrand M, Williams D, Rylander R. Inhalation toxicity of (1? 3)-ß-D-glucan: recent advan ces. Mediators of Inflammation 6:263-265, 1997.
Gao JJ, Filla MB, Fultz MJ, Vogel SN, Russell SW, Murphy WJ. Autocrine/paracrine IFN-a-ß mediates the lipopolysaccharide-induced activation of treanscription factor stat1-a in mouse macrophages:pivotal role of stat1-a in induction of the inducible nitric oxide synthase gene. J Immunol 161:4803-4810, 1998.
Gassman, JM, O’Neill, ME, Phipps, J, Kulhankova, K, Duchaine, C, Thorne, PS. Comparison of the inflammatory potency of bacteria and their cell-wall components in the lung. Toxicology, 54(1): 138 (#651), 2000.
George CLS, Jin H, Wohlford-Lenane CL, O’Neill ME, Phipps JC, O’Shaughnessy PT, Kline JN, Thorne PS, Schwartz DA. Endotoxin responsiveness and subchronic grain dust-induced airway disease. Am J. Physiol Lung Cell Mol Physiol 280:L203-L213, 2001.
Jagielo PJ, Thorne PS, Kern JA, Quinn TJ, Schwartz DA. The role of endotoxin in grain dust induced lung inflammation in mice. Am J Physiol 270:L1052-L1059, 1996.
Jagielo PJ, Thorne PS, Watt JL, Frees KL, Quinn TJ, Schwartz DA. Grain dust and endotoxin inhalation challenges produce inflammatory responses in normal subjects. Chest 110:263-270, 1996.
Kline JN, Waldschmidt TJ, Businga TR, Lemish JE, Weinstock JV, Thorne PS, Krieg AM. Cutting edge: Modulation of airway inflammation by CpG oligodeoxynucleotides in a murine model of asthma. J Immunol 160:2555-2559, 1998.
Klis FM. Review: Cell wall assembly in Yeast. Yeast 10:851-869, 1994. McCray PB, Zabner J, Jia HP, Welsh MJ, Thorne PS. Efficient killing of inhaled bacteria in ?F508 mice: role of airway
surface liquid composition. Am J Physiol 277(Lung Cell. Mol. Physiol. 21):L183-L190, 1999. Medzhitov R, Preston-Hurlburt P, Janeway CR Jr. A human homologue of the Drosophila toll protein signals activation
of adaptive immunity. Nature 388:394, 1997. Pauwels RA, Kips JC, Peleman RA, Van der Straeten ME. The effect of endotoxin inhalation on airway responsiveness
and cellular influx in rats. Am Rev Respir Dis 146:352-357, 1990. Rietschel ET, Brade H, Holst O, Brade L, Muller-Loennies S, Mamat U, Zahringer U, Beckmann F, Seydel U,
Brandenburg K, Ulmer AJ, Mattern T, Heine H, Schletter J, Loppnow H, Schonbeck U, Flad HD, Hauschildt S, Schade UF, Di Padova F, Kusumoto S and Schumann RR. Bacterial endotoxin: Chemical constitution, biological recognition, host response, and immunological detoxification. Curr Topics Microbiol Immunol 216:39-81, 1996.
Rylander R, Persson K, Goto H, Yuasa K, Tanaka S. Airborne ß-1,3-glucan may be related to symptoms in sick buildings. Indoor Environ 1:263-267, 1992.
Rylander R. Indoor air-related effects and airborne (1-3)-ß-D-glucan. Environ Health Perspec 107 Suppl 3:501-503; 1999.
Schwartz DA, Quinn TJ, Thorne PS, Sayeed S, Yi A-K, Krieg AM. CpG motifs in bacterial DNA cause inflammation in the lower respiratory tract. J Clin Invest 100(1):68-73, 1997.
Schwartz DA, Thorne PS, Jagielo PJ, White GE, Bleuer SA, Frees KL. Endotoxin responsiveness and grain dust-induced inflammation in the lower respiratory tract. Am J Physiol 267:L609-617, 1994.
Schwartz DA, Thorne PS, Yagla SJ, Burmeister LF, Olenchock SA, Watt JL, Quinn TJ. The role of endotoxin in grain dust-induced lung disease. Am J Respir Crit Care Med 152:603-8, 1995.
Shnyra A, Brewington R, Alipio A, Amura CR, Morrison DC. Reprogramming of LPS-primed macrophages is controlled by counterbalanced production of IL-10 and IL-12. J Immunol 160:3727-3736, 1998.
Stone, BA, Clarke AE. Chemistry and biology of (1? 3)-ß-glucans. La Trobe University Press, Victoria Australia, 1992. Thorne PS, McCray PB, Howe TS, O'Neill MA. Early-onset inflammatory responses in vivo to adenoviral vectors in the
presence or absence of LPS-induced inflammation. Am J Respir Cell Molec Biol 20:1155-1164, 1998.

114
Thorne PS. Inhalation toxicology models of endotoxin and bioaerosol-induced inflammation. Toxicology 152:13-23, 2000.
Thorne PS. Occupational Toxicology, in Casarett and Doull’s Toxicology: The Basic Science of Poisons 6th Ed. Klaassen CD (ed.) McGraw-Hill, New York, pp 1123-1140, 2001.
Williams DL. (1? 3)- ß -D-glucans. In: Organic dusts: exposure, effects, and prevention. Rylander R, Jacobs RR (Eds). Lewis Publishers, pp 83-85, 1994.
115
Chapter 6.2 Animal Health Effects
Robert E. Holland, DVM, MS
Department of Veterinary Diagnostic and Production Animal Medicine College of Veterinary Medicine, Iowa State University
Thomas L. Carson, DVM, PhD
Department of Veterinary Diagnostic and Production Animal Medicine College of Veterinary Medicine, Iowa State University
Kelley J. Donham, DVM, MS
Department of Occupational and Environmental Health College of Public Health, The University of Iowa
116
Chapter 6.2. Animal Health Effects The preponderance of scientific studies on the effects of air contaminants and emissions on animal health has been conducted in and around swine facilities. Air contaminants can be divided into gases, particulates, bioaerosols, and toxic microbial by-products. Excess ammonia has been associated with lowered average number of pigs weaned, arthritis, porcine stress syndrome, muscle lesions, abscesses, and liver ascarid scars. Particulates (dust) have been related to reduced growth in growing pigs and turbinate pathology. Bioaerosols have been associated with lowered feed efficiency, decreased growth, and increased morbidity and mortality due to respiratory disease and abscesses. There are few scientific studies regarding the health effects and productivity problems of air contaminants on cattle and other livestock. Ammonia and hydrogen sulfide are the two most important inorganic gases affecting the respiratory system of cattle raised in confinement facilities. These gases affect the mucociliary transport and alveolar macrophage functions of the respiratory system lessening its protective responses.
117
6.2.1 Ammonia - Livestock Health Effects At concentrations usually found in livestock facilities (<100 ppm), the primary impact of aerial ammonia is as an irritant of the eye and respiratory membranes; and as a chronic stressor that can affect the course of infectious disease as well as directly influence the growth of healthy young animals (Lillie, 1972; Curtis, 1983). A series of experiments at the University of Illinois measured the effects of various levels of aerial ammonia on young pigs. The rate of gain of young pigs was reduced by 12% during exposure to aerial ammonia at 50 ppm, but no lesions were observed in the respiratory system. At both 100 and 150 ppm aerial ammonia, rate of gain was reduced by 30% and tracheal epithelium and nasal turbinates showed lesions consitent with a tissue irritant (Drummond et al., 1980). Aerial ammonia at 50 and 75 ppm reduced the ability of healthy young pigs to clear bacteria from their lungs (Drummond et al., 1978). At 50 and 100 ppm, aerial ammonia exacerbated nasal turbinate lesions in young pigs infected with Bordetella bronchiseptica, but did not add to the infection-induced reduction in the pig’s growth rate (Drummond et al., 1981a). In another study, 100 ppm aerial ammonia reduced the rate of gain by 32%; while effects of 100 ppm ammonia and concurrent ascarid infection were additive to where the rate of gain was reduced by 61% (Drummond, et al., 1981b). In a study of 28 swine farms in Sweden, a higher incidence of arthritis, porcine stress syndrome lesions, and abscesses had a positive correlation with levels of aerial ammonia in the facilities (Donham, 1991) It has recently been recommended that the maximum long-term ammonia exposure limit for swine should be less than 20 ppm as both pathological data (Hamilton, 1996) and immunological data (Urbain, 1994) suggest that exposure to ammonia concentrations of 10 to 15 ppm reduce resistance to infection (Jones, 1997). British workers utilized operant conditioning techniques giving pigs the choice between ambient ammonia levels of 0, 10, 20, and 40 ppm to demonstrate that pigs have an aversion to atmospheres containing even relatively low levels of ammonia (Jones, 1997). Ammonia has been considered as the most significant air pollutant in cattle barns as its irritating effect on the respiratory epithelium appears to directly reduce the number of ciliated cells and thus decrease the efficiency of mucociliary transport (Marschang, 1973). Ammonia concentrations within cattle facilities varied greatly from 80 to 2001 mg/h per animal depending on the type of housing (concrete floors vs slatted flooring, ventilated vs closed), bedding, age of animals, environmental conditions, waste storage system employed, frequency of cleaning, and ration (Koerkamp et al, 1998; Wathes et al, 1998; Pitcairn et al, 1998; Gurk et al, 1997). At concentrations less than 100 ppm and in a poorly ventilated facility, ammonia appears to affect pulmonary function in cattle. Five mechanisms protect the lungs from invasion of foreign materials: cellular and humoral immunity, mucociliary transport, macrophage function, cough reflex, and nasopharyngeal filtration. Of these defensive mechanisms, mucociliary transport and alveolar macrophage functions are most severely affected by ammonia and possibly hydrogen sulfide (Lillie and Thompson, 1972). In poultry, ammonia is considered the most harmful gas in broiler chicken housing (Carlile, 1984). Ambient ammonia levels of 50 ppm for prolonged periods irritate respiratory airways and predispose chickens to respiratory infections with the added risk of secondary infections; and development of lesions of keratoconjunctivitis of the eye is associated with
118
ambient ammonia levels of 60 ppm (Hauser, 1988). A reduced rate of bacterial clearance from the lungs was measured in turkeys exposed to 40 ppm aerial ammonia (Nagaraja, 1984). Excessive mucous production, matted cilia, and deterioration of normal mucociliary apparatus was found in turkeys exposed to ammonia concentrations as low as 10 ppm for 7 weeks (Nagaraja, 1983). 6.2.2 Hydrogen Sulfide - Livestock Health Effects Hydrogen sulfide is a potentially lethal gas produced by anaerobic bacterial decomposition of protein and other sulfur containing organic matter. This colorless gas with the distinctive odor of rotten eggs is heavier than air and may accumulate in manure pits, holding tanks, and other low areas in a facility. The sources of hydrogen sulfide presenting the greatest hazard in an agricultural setting are liquid manure holding pits which are commonly under slatted floors of livestock facilities. Although most of the continuously produced hydrogen sulfide is retained within the liquid of the pit, the gas is rapidly released into the ambient air when the waste slurry is agitated to suspend solids prior to being pumped out. While the concentration of hydrogen sulfide usually found in closed animal facilities (<10 ppm) is not harmful, the release of this gas from manure slurry agitation may produce concentrations up to 1000 ppm or higher (Lillie, 1972; Carson, 1998; Donham, 2000). Hydrogen sulfide is an irritant gas producing local inflammation of the moist membranes of the eye and respiratory tract. The irritant action of hydrogen sulfide is fairly uniform throughout the respiratory tract, although the deeper pulmonary structures suffer the greatest damage often producing pulmonary edema (Curtis, 1983). Differences between mammalian species susceptibility to toxic concentrations of hydrogen sulfide are small, as demonstrated by the following reported acutely toxic levels of hydrogen sulfide: goat – 900 ppm; guinea pig – 750 ppm; dog – 600 ppm; rat – 500 ppm (Sayer, 1923). However, chickens were found to be less sensitive to hydrogen sulfide than mammals, with exposures of 4,000 ppm not resulting in immediate death (Klentz, 1978). Early experiments examining various levels of acute hydrogen sulfide gas exposure in pigs reported the following associated clinical effects; 50 to 100 ppm - nothing significant; 250 ppm – distress; 500 to 700 ppm – semicomatose; 1000 ppm – intermittent spasms, cyanosis, unconsciousness, convulsions, death (O’Donoghue, 1961). At low levels of hydrogen sulfide exposure, no effect was measured on rate of body weight gain or respiratory tract structure in young pigs breathing air containing 8.5 ppm hydrogen sulfide for 17 days (Curtis, 1975) 6.3.3 Particulates Particulates are derived from two primary sources: pigs and feed. The primary particulate component from the pigs is dried fecal material. After drying fecal material becomes aerosolized by movement of the pigs and air currents. This dust is very fine, and up to 40% is inhalable (Donham, 2000). Dried fecal material is heavily contaminated with microbes and microbial by-products. Animals and workers in nursery and farrowing facilities would be exposed to greater concentrations of fecal dust than would those in finishing facilities where feed dust would predominate (Donham, 2000).
119
6.3.4 Bioaerosols and Endotoxins Air quality, as defined in ventilation parameters, influences the aerosol spread of potential viral and bacterial pathogens that colonize the respiratory epithelium. However, rarely does one find pathogens in the air. They generally are less viable and found in fewer numbers relative to the nonpathogens and saprophytes (Donham, 2000). Bacteria, fungi, and yeast heavily contaminated the atmosphere of swine confinement facilities. Total microbial concentration (cfu per cubic meter) range from 100,000 – 10,000,000 (Donham, 2000). Maximum concentration for swine health is approximately 430,000 (Donham, 2000). Of recent importance is the concentration of endotoxin detected in the atmosphere of confinement facilities. Endotoxin is a phospholipid-polysaccharide macromolecule that comprises the cell wall of Gram-negative bacteria. It is released when the integrity of the cell wall is disturbed. A typical range for endotoxin in the atmosphere of a confined building is 150 -1000 units (Donham, 2000). Maximum concentration for swine health has been approximated at 150 units. Endotoxin is a highly inflammatory substance and is believed to play a major role in respiratory disease of workers (Donham, 2000). References Bickert WB, Herdt TH. 1985. Environmental Aspects of Dairy Calf Housing. Compendium of Continuing
Education for Practicing Veterinarians. 7:S309-S316. Carlile FS. 1984. Ammonia in poultry houses: a literature review. World Poultry Scien ce 40:99 – 113. Carson TL. 1998. Toxic Gases in Current Veterinary Therapy: Food Animal Practice 4. W B Saunders. p. 247-249. Curtis SE. 1983. Environmental Management in Animal Agriculture. Iowa State University Press, Ames, Iowa.
p. 266 – 268. Curtis SE, Anderson CR, Simon J, Jensen AH, Day DL, Kelley KW. 1975. Effects of aerial ammonia, hydrogen
sulfide and swine–house dust on rate of gain and respiratory tract structure in swine. J Anim Sci 41(3):735 – 739.
Donham KJ. 1991. Association of environmental air contaminants with disease and productivity in swine. Am J Vet Res 52:1723-1730
Donham KJ. 2000. The Concentration of Swine Production. Veterinary Clinics of North America: Food Animal Practice. 16:559-597.
Drummond JG, Curtis SE, Simon J. 1978. Effects of atmospheric ammonia on pulmonary bacterial clearance in the young pig. Am J Vet Res. 39:211 – 212.
Drummond JG, Curtis SE, Simon J, Norton HW. 1980. Effects of aerial ammonia on growth and health of young pigs. J Anim Sci 50(6):1085 – 1091.
Drummond JG, Curtis SE, Meyer RC, Simon J, Norton HW. 1981a. Effects of atmospheric ammonia on young pigs experimentally infected with Bordetella bronchiseptica. Am J Vet Res 42(6):963 – 968.
Drummond JG, Curtis SE, Simon J, Norton HW. 1981b. Effects of atmospheric ammonia on young pigs experimentally infected with Ascaris suum. Am J Vet Res 42(6):969 – 974.
Gurk S, Brunsch R, Kaufman O. 1997. Systematic analysis of trace gases in dairy cow housing. Landtechhnik 52: 206-207.
Hamilton TDC, Roe JM, Webster AF. 1996. The synergistic role of gaseous ammonia in the aetiology of Pasterella multocida induced atrophic rhinitis in swine. J Clin Microbiol 43:2185 – 2190.
Hauser RH, Folsch DW. 1988. Methods for measuring atmospheric ammonia in poultry houses: review and approved practices. Journal of Veterinary Medicine 35: 579 – 593.
Jones JB, Wathes CM, Webster AJF.1997. Behavioral responses of pigs to atmospheric ammonia. In Livestock Environment V, vol II, ed. By RW Bottcher and SJ Hoff. American Society of agricultural Engineers, St. Joseph, Michigan. P. 875 – 882.
Klenz RD, Fedde MR. 1978. Hydrogen sulfide: effects on avian respiratory control and intrapulmonary carbon dioxide receptors. Respir Physiol 32(3):355 – 367.
120
Koerkamp PWGG, Metz JHM, Uenk GH, Phillips VR, Holden MR, Sneath RW, Short JL, White RP, Hartung J, Seedorf J, Schroder M, Linkert KH, Pedersen S, Takai H, Johnson JO, Wathes CM. 1998. Concentrations and emissions of ammonia in livestock buildings in Nothern Europe. Journal of Agricultural Engineering Research. 70:79-95.
Lillie RJ. 1972. Air Pollutants Affecting the Performance of Domestic Animals. Agricultural Handbook No. 380. U.S. Department of Agriculture, Washington, D.C.
Lillie LE, Thompson RG 1972. The pulmonary clearance of bacteria by calves and mice. Canadian Journal of Comparative Medicine. 36:121-128.
Marschang F. 1973. [Review: ammonia, losses, and production in large animal stables] Dtsch Tierarztl Wochenschr 80:73 – 120. cited by Bickert WG, Herdt TH. 1985. Environmental aspects of dairy calf housing. The Compendium on Continuing Education 7(5):S309 – S316.
Nagaraja KV. 1983. Scanning electron microscope studies of adverse effects of ammonia on tracheal tissues of turkeys. Am J Vet Res 44:1530-1536.
Nagaraja KV et al. 1984. Effect of ammonia on the quantitative clearance of E. coli from the lungs, air sacs, and livers of turkeys aerosol vaccinated against E. coli. Am J Vet Res 45:392-395.
O’Donoghue JD. 1961. Hydrogen sulphide poisoning in swine. Canadian Journal of Comparative Medicine and Veterinary Science. 25:217 – 219.
Pitcairn CER, Leith ID, Sheppard LJ, Sutton MA, Fowler D, Munro RC, Tang S, Wilson D, Hoek, Erisman JW, Smeulders S, Wisniewski JR, Wisniewski J (eds.) 1998. Proceedings of the First International Nitrogen Conferen ce. Environmental Pollution 102, Suppl 1, 41-48.
Sayers RR, Mitchell CW, Yant WP. 1923. Hydrogen sulfide as an industrial poison. U.S. Bureau of Mines, Department of the Interior. Reports of Investigations, Serial No. 2491. Washington, DC. U.S. Department of the Interior.
Urbain B, Gustin P, Prouvost JF, Ansay M. 1994. Quantitative assessment of aerial ammonia toxicity to the nasal mucosa by the use of the nasal gavage method in pigs. Am J Vet Res 55:1335 – 1340.
Wathes CM, Phillips VR, Holden MR, Sneath RW, Short JL, White RP, Hartung J, Seedorf J, Schroder M, Linkert KH, Pedersen S, Takai H, Johnson JO, Koerkamp PWGG, Uenk GH, Metz JMH, Hinz T, Caspary V, Linke S. 1998. Emissions of aerial pollutants in livestock buildings in Northern Europe: Overview of a multinational project. Journal of Agricultural Engineering Research. 70:3-9.
121
6.3 Human Health Effects
James A. Merchant, MD, DrPH Dean, College of Public Health
Professor, Department of Occupational and Environmental Health University of Iowa
Joel Kline, MD
Associate Professor, Department of Internal Medicine University of Iowa
Kelley J. Donham, DVM
Professor, Department of Occupational and Environmental Health University of Iowa
Dwaine S. Bundy, PhD, PE
Professor, Department of Agricultural and Biosystems Engineering Iowa State University
Carol J. Hodne, PhD
Postdoctoral Research Fellow Environmental Health Sciences Research Center
University of Iowa
122
6.3 Human Health Effects While other public health impacts, which include human exposures to polluted water or antibiotic resistant microorganisms that may arise from CAFOs, are not being addressed in this chapter, occupational exposures to CAFO environments will be reviewed and discussed because of their relevance to human response to CAFO air emissions. The lung contains the largest epithelial surface in the body, consisting of more than 100 square meters of surface area in the average adult male (compared with approximately 2 square meters of skin). The average adult male inhales up to 15 kg of air daily, and children inhale proportionately more for their size. Because of this high surface area and high volume of air exchanged, the lung is capable of absorbing vast quantities of inhaled substances. Defense mechanisms of the lung, including the cough reflex, mucociliary transport, and the innate immune system are efficient at combating inhaled particulate matter and microorganisms. Gases, vapors, and aerosols (of “respirable” size, approximately 1-10 microns in diameter) are readily inhaled and absorbed. Health effects associated with inhalation of toxins and bioaerosols are manifold. Medical problems commonly associated with inhaled agents include respiratory diseases (asthma, hypersensitivity pneumonitis, industrial bronchitis), cardiovascular events (sudden death associated with particulate air pollution), and neuropsychiatric conditions (due to odor as well as delayed effects of toxic inhalations). Most studies of human exposures to airborne agricultural hazards have focused on occupational exposures in agricultural settings. With the rise of large, industrial CAFOs as the preeminent form of livestock production and their associated higher production of gases, vapors, and fumes, these exposures now have the potential to affect larger numbers of individuals, including members of the neighboring community not involved in agriculture or related industrial livestock production. Few studies have directly examined the health effects of proximity or exposure to CAFOs in the community, thus extrapolations must be considered from well-documented effects of these toxins in laboratory settings and occupational exposure studies. Donham and colleagues (1977) first reported that workers in swine confinement facilities described significantly more respiratory symptoms than non-exposed workers; subsequent studies have confirmed this symptomatology and have also documented increased risks of respiratory infections, progressive declines in pulmonary function, and poisoning from hydrogen sulfide in this occupational group. For many reasons, standards for community exposures to the toxic agents released from CAFOs must be stricter than that for occupational exposures. First of all, community members may include subgroups of especially susceptible individuals, for example the elderly, children, and those with pre-existing impairments. Secondly, community members may be exposed continuously to released substances rather than for a workshift or less; this is especially true for those who do not work outside the home, and for pre-school children. Moreover, exposed community members may not have chosen to live in proximity to a CAFO, whereas occupationally exposed individuals have some choice in their employment. Thus, ambient exposure levels arising from CAFOs, including ammonia and hydrogen sulfide, must be significantly lower than occupational levels; notwithstanding, many components of the CAFO environment, e.g. bioaerosols including endotoxins and glucans, have no current recommended or mandated occupational exposure limits.
123
6.3.1 Studies of Adverse Health Effects from Specific Exposures found in CAFO Emissions It is important to examine the literature regarding adverse health effects arising from individual chemicals and mixtures of chemical compounds, often referred to as odorants, exposures known to be components of emissions from CAFOs. The following is a summary of available, published findings from clinical, experimental and epidemiological observations for several categories of these exposures. The concentration of exposure is not always known or measured, but there have been several studies of individual chemical exposures that have documented both concentrations and durations of exposure, some at very low levels. The vast majority of these observations come from occupational, experimental, and non-CAFO community exposures, many of which were made among selected populations of workers or healthy volunteer subjects. Regulatory agencies have used many of these findings, taking into account uncertainty and susceptibility factors, in making their recommendations regarding exposure limits for exposed communities (See Chapter 8.0). 6.3.1.1. Ammonia Ammonia is both a component of animal waste and released in waste treatment processes. Well recognized as a human toxin, the current OSHA PEL for ammonia is a TWA of 50 ppm (also its odor threshold), although ACGIH and NIOSH recommend a lower TWA of 25 ppm. Concentrations of greater than 100 ppm have been regularly reported in poultry confinement operations (Mulhausen et al, 1987). The EPA has found that animal agricultural operations are responsible for almost three fourths of ammonia air pollution in the United States (Harris et al, 2001), although numerous other industries are associated with inhalation exposure to ammonia. EPA has recommended as reference concentration for chronic inhalation of ammonia of 1.4 ppm. ATSDR has recommended a long-term MRL of 300 ppb for community exposures (See Chapter 8.0 for detailed discussion). Water-soluble, ammonia is rapidly absorbed in the upper airways, with the result of damaging upper airway epithelia. Moderate concentrations (50-150 ppm) can lead to severe cough and mucous production; higher concentrations (>150 ppm) may cause scarring of the upper and lower airways (Close et al, 1980; Leduc et al, 1992). A consequence of these inflammatory responses, in some cases, is reactive airways dysfunction syndrome (RADS) and associated persistent airway hyperresponsiveness (Bernstein and Bernstein, 1989; Flury et al, 1983). At higher concentrations, sufficient ammonia may bypass the upper airways to cause lower lung inflammation and pulmonary edema (Close et al, 1980; Sobonya, 1977). Massive exposure to ammonia can be fatal, including in the agricultural sector, a consequence to disruption of tanks of anhydrous ammonia (Sobonya, 1977). These fatalities, as well as the chronic lung disease seen following as little as two minutes of exposure to high concentrations of ammonia gas may result in the development of bronchiolitis obliterans (de la Hoz et al, 1996; Kass et al, 1972; Sobonya, 1977; Walton, 1973), restrictive lung disease (de la Hoz et al, 1996), and bronchiectasis (Leduc et al, 1992). In addition to pulmonary disease, exposure to ammonia also leads to irritation of the eyes, sinuses, and skin. Exposure to 100 ppm ammonia for short (30 second) duration leads to nasal irritation and increases in nasal airway resistance (McLean et al, 1979). When increasing concentrations of ammonia are delivered by spontaneous respiration, severe nasal irritation develops at 134 ppm after 5 minutes; some individuals report symptoms as low as 32 ppm (Keplinger et al, 1973). Clinical sinusitis has been reported following accidental exposure to ammonia as well (Brautbar, 1998). Chemical burns to the skin and eyes are also commonly seen following high-concentration ammonia exposures (Latenser and Loucktong, 2000).
124
Although the most serious adverse effects of ammonia inhalation are usually seen with concentrations of ammonia that have been associated with fatal exposures (in the range of 500 ppm), evidence exists that lower concentrations of ammonia can reach the alveoli and may be adsorbed to respirable particulates, as may be seen in complex bioaerosols such as those found in the agricultural setting resulting in a research-recommended occupational exposure limit of 7 ppm (See Section 6.3.2.2). Similar occupational exposures to ammonia (9 ppm) have been studied among soda ash workers (Holness et al, 1989) who reported increased symptoms of coughing, wheezing, nasal complaints, eye irritation, throat irritation, and skin complaints; however, no changes in lung function were observed when measured over a working shift. It was noted that this was a cross-sectional study of a small population and that selection bias may have therefore occurred. 6.3.1.2. Hydrogen Sulfide Hydrogen sulfide is one of the most important of the gases arising from the storage, handling, and decomposition of animal wastes. Smelling like rotten eggs, this gas that is recognized as both an irritant and an asphyxiant, is a prominent component of odorants released from CAFOs. Current OSHA PEL for H2S are 10 ppm (with STEL of 15 ppm), while NIOSH has recommended a time weighted average occupational exposure limit of 10 ppm. For community exposures, EPA has recommended a reference concentration for long-term exposure of 7 ppb (See Chapter 8.0 for full discussion). Levels as high as 1,000 ppm have been reported (Donham and Gustafson, 1982) following the perturbation of manure lagoons, and levels greater than 100 ppm are considered immediately hazardous to life and health. Exposure to these elevated levels of H2S can cause rapid loss of consciousness, and H2S has been implicated in a number of deaths when encountered in confined environments in agricultural settings. The primary mode of absorption of H2S is through inhalation (Bhambhani et al, 1996a). One particular hazard is that, although the odor threshold is quite low (less than 1 ppm), at levels over 6 ppm the intensity of the smell only modestly increases; above 150 ppm, exposure to hydrogen sulfide may actually reduce the sense of smell, hindering the olfactory detection of high concentrations of the gas and making H2S monitoring equipment mandatory in occupational settings (van Aalst et al, 2000). The toxic effects of hydrogen sulfide are based on its property as a chemical asphyxiant; it binds to the mitochondrial enzyme cytochrome oxidase, blocking oxidative phosphorylation and ATP production. This leads to anerobic metabolism and the development of lactic acidosis (Nichols and Kim, 1982). Experimental exposure studies have been carried out examining the effects of inhalation of low levels of H2S on healthy volunteers (Bhambhani et al 1996a, 1996b, 1997). Inhalation of 5 ppm of H2S by exercising men leads to a significant decrease in the concentration of citrate synthase, a marker of aerobic metabolism, in muscle biopsy tissue, although no increases in lactic acidosis were noted (Bhambani et al, 1996b). Levels of 10 ppm cause no change in physiologic measures of pulmonary function (Bhambani et al, 1996a), but do cause a significant decline in maximal oxygen update (VO2max) and an associated increase in blood lactate in exercising men and women (Bhambani et al, 1997). Jappinen and colleagues (1990) exposed a group of asthmatics (severe asthmatics were eliminated from the study) to 2 ppm of hydrogen sulfide for 30 minutes. Three complained of headache and two were found to have increased airway resistance, but there was no
125
change in other lung function values or associated symptoms. Members of a Mobile Monoriting Team of the Texas Natural Resource Conservation Commission (TNRCC) evaluated hydrogen sulfide concentrations downwind from an oil refinery and reported 0.09 ppm 30-minute averages over a period of five hours (Texas Natural Resources Conservation Commission, 1998). Six staff members reported eye and throat irritation, headache, and nausea. These experimental studies indicate consistent patterns of adverse health effects after short, low concentrations of exposure to hydrogen sulfide. Epidemiological studies of workers exposed to hydrogen sulfide exposure include pulp mill workers who reported increased respiratory symptoms (irritation and cough), as well as increased headache and migraine; it was noted that these workers were also exposed to other sulfur compounds including sulfur dioxide and mercaptans (Partti-Pellinen et al, 1996). Jappinen and colleagues (1990) studied pulp mill workers thought to be exposed to hydrogen sulfide levels usually below a maximum permitted concentration of 10 ppm and reported no significant changes in lung function and airway hyperresponsiveness at the end of the workday, compared with control values. Hessel and colleagues (1997) studied oil and gas workers at undefined, but probably moderately high, exposures to hydrogen sulfide (as some of the workers lost consciousness); nearly third of the workers reported symptoms. Several additional epidemiological studies of community residents exposed to low levels of hydrogen sulfide have been reported. A U.S. Public Health Service study of a general population exposed to levels in excess of 0.3 ppm reported adverse health effects including shortness of breath, eye irritation, nausea, and loss of sleep (United States Public Health Service, 1964). Jaakkola and colleagues (1991) studied chronic community exposure to hydrogen sulfide and TRS (total reduced sulfur) compounds (hydrogen sulfide annual means of 0.006 ppm and daily means of 0.07 ppm) and found that both asthma and chronic bronchitis were slightly more prevalent, that eye and nasal symptoms were found significantly more often, and that these symptoms were dose-related. They concluded that the WHO standard of 0.1 ppm (24 hour average) did not protect against these adverse health effects. Jaakkola and colleagues (1991) also studied the respiratory infection rate among infants exposed to ambient hydrogen sulfide levels of 0.001 ppm, and at half-hour maximal exposures of 0.125 ppm, and reported that exposed infants had higher rates of respiratory infection, but that combined effects of other air pollutants may have been contributing factors. Haahtela and colleagues (1992) studied community residents exposed to peak exposures of hydrogen sulfide of 0.095 ppm (four hour average) and 0.025 and 0.030 ppm over two days of exposure, compared to control days, with four hour exposures ranging between 0.00007 and 0.002 ppm. Cough, throat irritation, and eye symptoms were observed significantly more often during the peak exposure period. The author concluded that the WHO guideline of 0.10 ppm for a 24 hour average did not provide adequate protection from adverse health effects. Rossi and colleagues (1993) studied the occurrence of asthma attacks in relation to air pollution events (hydrogen sulfide levels ranged from the highest 1 hour mean of 0.011 ppm and daily 24 hour means of 0.002 ppm), and reported significant associations between the frequency of asthma attacks at an emergency room and nitrogen sulfides, sulfur dixoxide, total suspended particulates, and hydrogen sulfide. Partti-Pellinin and colleagues (1996) studied a general population exposed to TRS levels of up to 0.1 ppm over a 24-hour period. Based on a self-administered questionnaire, the authors concluded that the exposed community reported more cough, respiratory infections, and headaches than the reference community, and also that headaches, depression, tiredness, and nausea were more often reported on days when the 1 hour or daily mean TRS levels exceeded 0.028 ppm (both communities were exposed to similar levels of sulfur dioxide). These community studies of hydrogen sulfide and TRS
126
exposures are especially useful because they report measured low levels of exposure and associated adverse health effects. However, as is the case with community exposures to CAFOs, these are invariably mixed exposures to hydrogen sulfide and other chemicals, some of which may contribute to the adverse health effects described in these studies. Campagna and colleagues (2001) studied the effects of ambient hydrogen sulfide and TRS levels on hospital visits for respiratory diseases among children and adults in Dakota City and South Sioux City, Nebraska. While peak levels of hydrogen sulfide were as high as 1,375 mean levels over an entire day were much lower. An increase in asthma hospital visits was seen a day following peak TRS exposures among children and an increase in hospital visits for all respiratory disease was seen following peak exposures for both TRS and hydrogen sulfide. Finally, Xu and colleagues (1998) has reported a retrospective epidemiological study of spontaneous abortion among a large cohort of female workers in a petrochemical plant in Beijing, China. Among women exposed only to hydrogen sulfide (concentrations were not reported because of the retrospective nature of the study), a rate of spontaneous abortion of 12.3% was observed and a significant association with hydrogen sulfide exposure was reported (OR, 2.3, CI 1.2-4.4). Chronic low-level exposure is associated with anosmia, the loss of ability to detect odors. At higher levels, hydrogen sulfide exposure causes loss of consciousness, shock, pulmonary edema, coma and death. Survivors of hydrogen sulfide poisoning are reported to commonly have neuropsychiatric defects which may be permanent; a recent study by Kilburn of University of Southern California has demonstrated that even exposure to low concentrations of hydrogen sulfide leads to significant neuropsychologic abnormalities, including impaired balance, visual field performance, color discrimination, hearing, memory, mood, and intellectual function (Kilburn, 1997). These effects may be due to anoxic encephalopathy. 6.3.1.3. Particulates The air in CAFOs is contaminated with high concentrations of particulates, approximately one quarter of which is protein; about one third of suspended dust is considered respirable (< 10 microns in diameter, PM10). Occupational and environmental studies have demonstrated an average of 2-6 mg/m3 dust concentrations, and levels up to 20 mg/m3 may be encountered. National ambient air standards for PM10 are an annual average of 50 mcg/m3 with a 24-hour average of 150 mcg/m3. Of these, particles between 4 and 10 microns are deposited in the airways and smaller particles (< 2.5 microns) progress into and may be absorbed by the terminal bronchiols and alveoli. Particles which settle in the upper airways are associated with asthma and bronchitis; smaller particles may be absorbed and have systemic effects including, in studies of urban air pollution, increased rates of cardiac death. In addition to direct inflammatory response to inhaled allergens, dust can also convey inflammatory and/or irritating gases or chemicals (such as ammonia, hydrogen sulfide, or endotoxin) deeper into the lung, thereby enhancing their toxic effects. Although certain mineral particulates, such as silica dioxide, lead to characteristic pulmonary inflammatory and scarring conditions known as pneumoconioses, even inhalation of seemingly inert dust particles appear to have adverse long-term consequences. In a number of occupational settings, cumulative exposure to dust particles in the respiratory range is one of the most important causes of persistent respiratory symptoms and progressive declines in lung function (Healy et al, 2001; Ulvestad et al, 2001); and this has also been reported in non-occupational settings (Dockery and Pope, 1994; Dockery et al, 1993; Pope et al, 1995, Lippmann et al, 2000).
127
6.3.1.4. Bioaerosols An important component of the environment released from CAFOs is microbiologic in origin. Swine manure contains up to 108 coliform bacteria/gram, and CAFOs contain these organisms in airborne and respirable particles; total organism load may exceed 1010 cfu/m3 at times. Some of the microorganisms that are present in the CAFO environment are human pathogens, creating a potential risk of infection for those exposed to these agents. Dust in CAFOs and other agricultural settings, contains far more than merely viable organisms. Microbial products of medical importance include antigens, glucans, and endotoxins. Exposure to protein antigens derived from plants, animals, and microbes are known to cause a variety of medical problems. Inhalation of thermophilic bacteria, commonly found in moldy hay and other damp locations, leads to a condition known as hypersensitivity pneumonitis, a respira tory condition characterized by granulomatous inflammation of the lung, restrictive physiology, and progressive dyspnea. Associated with detection of antibodies to these organisms in the blood, hypersensitivity pneumonitis (also known as “farmer’s lung” in agricultural settings), is found among agricultural workers and others occupationally exposed to these agents (Skorska et al, 2000). Asthma may also be caused or exacerbated by exposure to conditions common in CAFOs. Atopic asthma is caused, in susceptible individuals, by sensitization to and subsequent inhalation of allergens, agents that can lead to asthma in previously non-sensitized individuals. Those with a previous diagnosis of asthma may have their asthma triggered in a non-specific way by exposure to the dust and irritant-inducing agents arising from the CAFO environment. CAFOs contain, among other compounds, high concentrations of grain dust, dust mites, animal dander, pollen grains, molds and fungal spores, and dried fecal particles, each of which may induce or exacerbate asthma. Proximity to CAFOs, and periodic/seasonal agricultural activities (e.g., agriculture chemical and manure applications), are frequently cited by rural asthma patients as exposures resulting in asthma exacerbation making asthma control more difficult. Endotoxins are lipopolysaccharide complexes that are products of gram-negative bacterial cell walls. Ubiquitous in the environment, they are present in high concentrations in agricultural settings such as grain elevators, feed barns, and CAFOs. Endotoxins are important components of exposures responsible for the adverse health effects following inhalation of organic agricultural dust. Acute effects of endotoxin inhalation include symptoms of cough, chest tightness, and dyspnea and alterations in pulmonary function characterized most typically by a decline in FEV1; over a working shift and overtime; systemic effects include fever, rigors, myalgia, arthralgia, and other “flu-like” symptoms. Although no occupational standards currently exist for endotoxin in the United States, Dutch Expert Committee on Occupational Standards of the National Health Council has proposed a limit of 50 EU/m3 (4.5 ng/m3) over an 8-hour exposure period (Heederik and Douwes, 1997). Kline and colleagues (1999) evaluated the responses of 72 normal, non-smoking, non-atopic, non-asthmatic volunteers who were exposed to graded doses of endotoxin by inhalation in a clinical exposure facility. Each subject first inhaled 0.5 mcg of endotoxin then underwent spirometry prior to inhaling a greater concentration of endotoxin. Cumulative levels of endotoxin inhalation consisted of 0.5, 1.5, 3.5, 6.5, 11.5, 21.5, 41.5 mcg. The protocol was terminated for decline in FEV1 to < 90% of baseline or a total of 41.5 mcg. Among study participants, a wide range of sensitivity to the bronchospastic effects of inhaled endotoxin was found; some individuals demonstrated a 20%
128
decline in FEV1 following inhalation of as little as 1.5 mcg whereas others were resistant to these effects and did not even decline by 10% following inhalation of over 41.5 mcg. In a separate study, asthmatic individuals were found to have an enhanced degree of symptoms and bronchospasm following inhalation challenges compared with normal control subjects (Kline et al, 2000). Other studies have also found that inhalation exposure to endotoxin and endotoxin-containing grain dust leads to the development of bronchospasm and airway inflammatory responses (Blaski et al, 1996; Jagielo et al, 1996; Michel et al, 1989; Michel et al, 1996; Michel et al, 1997; Schwartz et al, 1995a). Most of the reports of community, occupational, and ambient effects due to endotoxin exposure are related to inhaled endotoxin; this is clearly different than the case of patients suffering from gram-negative infections, who are typically exposed to endotoxin via the blood stream. The greatest effect of inhaled endotoxin is on airway inflammation and the induction of bronchial hyperresponsiveness, both characteristic of asthma. Interestingly, some recent studies have demonstrated a protective effect of endotoxin exposure relative to the development of allergic disease. Von Mutius and colleagues (2000) recently reported that environmental endotoxin exposure of farmers’ children protects them from the development of atopy; Gereda and colleagues (2000), in a study of urban homes, found that home levels of endotoxin inversely correlated with likelihood of allergen sensitization in infants. In a similar vein, Gehring and colleagues (2001) found that environmental exposure to endotoxin protected infants from the development of atopic eczema. These effects of endotoxin on early-life development of allergic responsiveness may be due to the deviation away from a Th2-type response to allergens and towards a Th1-type response, however alternate explanations are possible. Exposure of adults, however, (and infants and children in some studies) appears to be clearly detrimental with regards to airway function and asthma. In contrast to the studies showing protective effects of endotoxin on the development of disease among infants, Park and colleagues (2001) reported that infants with at least one asthmatic/allergic parent were placed at increased risk of developing wheezing when their home environment contained higher levels of ambient endotoxin. Douwes and colleagues (2000), in a community study of household dust, found that endotoxin content of dust was associated with increased peak flow variability among asthmatic children. Michel and colleagues (1991) reported that asthmatic patients with higher levels of home endotoxin exposure develop more symptoms and require more intensive treatment than those from homes with lower levels of endotoxin. In a separate study, the same group confirmed that asthma severity correlates with endotoxin exposure (Michel et al, 1992). In a study conducted in Brazil, Rizzo and colleagues (Rizzo et al, 1997) found that endotoxin (but not dust mite) content of dust significantly correlated with symptom scores in asthmatic children. Controlled laboratory studies of endotoxin exposure confirm that inhalation induces airway inflammation and bronchial hyperreactivity. Blaski and colleagues (1996) reported that both normal control subjects and atopic individuals developed airway neutrophilia and reduced airflow following inhalation of 0.4 mcg/kg of endotoxin. Jagielo and colleagues (1996) found that the endotoxin content of grain dust was responsible for its ability to induce inflammation and obstructive airway physiology in normal volunteers. Michel and colleagues (1989) found that endotoxin inhalation by asthmatics resulted in significantly more airflow reduction than in normals. Among asthmatics, the reduction in airflow (Michel et al, 1992) and development of symptoms of chest tightness and dyspnea (Kline et al, 2000) are greater than the difference in development of airway inflammation. Even among non-asthmatics, a significant variability in responsiveness to the effects of inhaled
129
endotoxin can be seen (Kline et al, 1999); this appears to be explained, at least in part, by genetic factors (Arbour et al, 2000). Mycotoxins, beta-glucans, and other components of fungal pathogens appear to have a similar range of toxicity to endotoxins, including both inflammatory and immunostimulatory effects. These compounds, however, have been less well studied in human exposures, and their concentration in CAFOS is unknown (American Thoracic Society, 1998). 6.3.1.5. Volatile Organic Compounds Of the thousands of gases, vapors, particles, and aerosols present in CAFOs, over 24 odorous chemicals, often referred to as odorants, have been identified (Cole et al, 2000). Volatile acids, mercaptans, and amines are particularly odorous even in miniscule concentrations. Ammonia and hydrogen sulfide, as noted above, are also pungently aromatic. Although long recognized as a neighborhood nuisance, recent studies have suggested that odiferous exposures emitted from CAFOs may well have adverse health effects (Schiffman et al, 2000). Odor appears to play a significant role in the recognition of and concern over symptoms in neighbors of hazardous waste sites (Shusterman, 1992; Shusterman et al, 1999). Schiffman and colleagues (1995) from Duke University have reported that indicators of altered mood, assessed using validated scales, are significantly worse in subjects who live in the vicinity of intensive swine operations compared with control subjects. Chen and colleagues (1999) have demonstrated, using odor threshold dilution analysis, that odor intensity in swine buildings is reproducible and measurable. Zahn and colleagues (2001) have analyzed malodorous volatile organic compound components of swine production facility air samples, and have demonstrated, using an artificial swine odor solution, that alterations in the concentrations of these components can be detected by study subjects. No odor studies were found that related the quantitative measurement of odor intensity in the downwind air stream from livestock facilities with adverse health effects among community residents. However, there is an extensive literature relating non-CAFO odors and adverse health effects that are relevant to community exposures to CAFO exposures. Of the hundreds of gases, vapors, particles, and aerosols present in CAFOs, 331 volatile organic compounds (VOCs) and fixed gases were recently characterized by Schiffman and colleagues (2001). These compounds, assessed at the point of emission, included many acids, alcohols, aldehydes, amides, amines, aromatics, esters, ethers, fixed gases, halogenated hydrocarbons, hydrocarbons, ketones, nitriles, other nitrogen-containing compounds, phenols, sulfur-containing compounds, steroids, and other compounds. The authors (Schiffman et al, 2001) further observed that the vast majority of these compounds were found at concentrations below their published irritant or odor thresholds, yet human assessments of the combined odors and their irritant effects were described as “strong” at a distance of 1000 feet. While CAFO odors have long been recognized as a neighborhood nuisance, recent studies have suggested that odiferous exposures emitted from CAFOs may well have adverse health effects (Schiffman, 1997; Schiffman et al, 1995; Thu et al, 1997; Wing and Wolf, 2000). Direct measurement of odorous or other noxious substances were not made in these studies, therefore, a direct linkage to level of exposure could not be reported. A Duke University workshop summarized by experts in
130
assessing the potential health effects of odor from animal operations (Schiffman, Walker, Dalton, Lorig, Raymer, Shusterman and Williams) addressed this issue (Schiffman et al, 2001). They observed that health symptoms have been reported with increasing frequency from low level exposures from manures and biosolids; “the most frequently reported health complaints include eye, nose, and throat irritation, headache, nausea, diarrhea, hoarseness, sore throat, cough, chest tightness, nasal congestion, palpitations, shortness of breath, stress, drowsiness, and alteration in mood”. They further observed that these symptoms usually occurred briefly at the time of exposure, but that hypersensitive individuals, such as asthmatics, could have their condition exacerbated with persisting symptoms. Exactly how odors from CAFOs may result in these symptoms is not well understood. The Duke workshop discussed freeways, or paradigms, by which ambient odors may produce health symptoms (Schiffman et al, 2000). In the first paradigm, the symptoms may occur at levels of exposure that would also be expected to cause irritant effects from combinations of irritants that may be additive or synergistic in their effect. In this paradigm, the adverse health effect typically occurs at a higher level than the concentration at which the odor would first be detected. In the second paradigm, symptoms may occur at odor concentrations below that expected from irritants. The mechanism by which these odorants may cause their adverse effects is not known (Schiffman et al, 2000). Schiffman and colleagues (1995) reported that CAFO odors perceived as unpleasant can impair mood. Shusterman and colleagues (1991) observed increased symptom prevalence and an “odor worry” interaction associated with odor from hazardous waste sites. Schiffman and colleagues (2000) summarized evidence that negative mood, stress, and environmental worry may lead to biochemical and physiological effects with subsequent health outcomes. Other studies suggest that bias concerning odors can alter the response relating to health effects (Dalton et al, 1997). These results provide evidence that both the perceived odor and cognitive expectations about a chemical can significantly affect individual response. Other studies have also demonstrated that ones current cognitive state can bias ancillary characteristics of an odor such as preference or acceptability (Knasko, 1993). Some studies have shown that persons can report experiencing strong odors as an outcome by showing that cognitive factors can lead to reports of odors when none are present (Knasko, 1992; O’Mahoney, 1978). Knasko and colleagues (1990) have also observed that an odorant stimulus is greatly influenced by the environment surrounding the exposure, which can include the social context or the perceiver’s mental state. It is also recognized that those working in an odorous environment may adapt to the odor following long term exposure. Dalton and Wysocki (1996) have advocated for the development of laboratory procedures that combine long-term odor exposure in a naturalistic setting with psychological tests. A third way for paradigm, is when the odorant is a part of a mixture that contains bioactive pollutants such as bioaerosols containing organic dust, endotoxin, glucans, allergens, microorganisms, or other toxins (Schiffman et al, 2000). In this paradigm, the individual is exposed to odors, but the adverse health effect is likely to arise from a non-odorant toxin. Relevant to this paradigm is the study of Reynolds and colleagues (1997) who sampled at 60 meters for hydrogen sulfide, ammonia, endotoxin, and total dust. A reason to sample for dust and ammonia together is that it is now recognized that some ammonia absorbs to respirable dust particles thereby providing a vehicle to transport ammonia and dust-latent toxins, like endotoxin, deep into the lung. To date there has been relatively little research quantifying odorants. Zahn and colleagues (2001) completed a multi-component analysis of malodorous DOCs found in air samples from 29 swine
131
production facilities using a 19-component artificial swine odor solution. The results of this study concluded that this approach can be applied toward estimating perceived odor intensity. Schiffman and colleagues (2001) studied six swine operations in North Carolina. In addition to quantifying the DOCs and fixed gases from these facilities, they used six methods for trained human panel members to assess the intensity of odor at varying distances from swine facilities. Scentometer measurements were made at 12 feet, 750 feet, and 1250 feet from the swine facilities and range from a high of 170 D/T (dilutions to threshold) to a low of 2 D/T. It is recognized that there is great variability between odors arising from CAFOs, and that odorous gases may be transformed through interactions with other gases and particulates between the source and the receptor (Peters and Blackwood, 1977). It is also recognized that there is variability in odor persistence, “persistence factor” defined as the relative time that odorous gases will remain perceptible (Summer, 1971). There is a need to combine quantitative assessments of odors with environmental measurements in well-designed, controlled studies of symptoms and other health outcomes at the community level. 6.3.1.6. Experimental Occupational Exposures among Naïve Subjects Workers in CAFOS are exposed, on a daily basis, to a wide array of gases, vapors, dusts, and other compounds. Thus, it is challenging to identify, in this occupational setting, which specific components of their exposure is responsible for health outcomes. Experimental occupational exposures among normal volunteers have addressed this issue. Two clinical epidemiological studies of normal volunteers in swine CAFOs have been reported, both from Canada. Cormier and colleagues (1997) exposed 7 previously non-exposed, normal subjects to a swine building and found significant respiratory symptoms, declines in lung function, and clear evidence of a marked inflammatory response via analysis of bronchoalveolar lavage (BAL) fluid post exposure. Total dust, endotoxins, and ammonia were measured but no individual exposures, rather a mixed exposure, appeared to be responsible for these adverse health effects. Senthilselvan and colleagues (1997) made similar observations among 20 naive subjects, while also showing that treatment of the swine facility with canola oil significantly reduced symptoms, declines in lung function, airway hyperresponsiveness, and mean dust and endotoxin concentrations. 6.3.2. Occupational Health Effects The first description of health hazards to people working in these CAFO’s was in 1977 (Donham et al, 1977). This early study revealed that over 60 percent of veterinarians working in these facilities experienced one or more respiratory health symptoms. This report led to many subsequent studies in the US, Canada, and Europe (Donham, 1993). In addition to respiratory illnesses, other occupational health problems associated with CAFOs have been documented, including traumatic injuries, noise-induced hearing loss, needle sticks, hydrogen sulfide and carbon monoxide poisonings, and infectious diseases (Donham et al, 1982a; Donham et al, 1982b; Donham, 1985). Workers in confined poultry and dairy operations are also at risk, but most beef operations are in open lots, thus reducing worker respiratory exposures. The increasing industrialization of livestock production will continue to result in more independent producers leaving the industry, or becoming quasi-employees of large-scale producers as contract growers. Furthermore, many minority workers are becoming employees of larger producers, raising potential legal issues of undocumented workers and further need of OSHA regulation of these large operations. In the past, OSHA has been
132
restricted in agriculture because of a federal law that restricts enforcement on farms with ten or fewer employees. Many of the large industrial CAFOs now employ hundreds of workers and these workers will work full shifts in animal confinement buildings in contrast to smaller, independently owned CAFOs where periods of exposure are typically much shorter. This increase in large, industrial CAFOs will, therefore, likely lead to increased cumulative exposure and thus greater risk to adverse health effects. To date, OSHA has not addressed the CAFO issue, in spite of strong evidence of worker health risks. The worker health component of this review is assembled to characterize the range of occupational health hazards associated with large-scale livestock production, but concentrates on health effects from air toxics and a brief discussion on measures needed to decrease health risks among workers. Table 2 lists major categories of hazards and then further classifies diseases or health outcomes within those categories. The order does not necessarily relate to incidence, prevalence, or severity—these are common health risks among all intensive livestock production operations. The vast majority of the research in this area has been with swine production. Therefore, this report will deal largely with swine operations. However, similar exposures and adverse health effect observations have been made among those working in concentrated poultry production (Bar-Sela et al, 1984; Lenhart et al, 1990; Morris et al, 1991). The principal health risks for CAFO workers result from respiratory exposures to a wide range of toxic, irritant, and inflammatory substances emitted into the air. Ammonia, hydrogen sulfide, carbon monoxide, particulate matter, endotoxin, and other bioaerosols have received the majority of research attention. However, infectious diseases, noise, trauma, fires, explosions, electrocutions, thermal stress, poisonings, and drowning are all also important causes of morbidity and mortality (Randolph and Rhodes, 1993). Often overlooked are emotional stress and chronic musculoskeletal pain that can lead to significant impairment and to disability in this workforce. This report will be limited to air toxics and resultant respiratory diseases. 6.3.2.1. Respiratory Diseases Respiratory exposures lead to the most common health hazard among swine farmers and CAFO workers. There are both acute illnesses and chronic respiratory diseases among CAFO workers. The most serious acute hazard is hydrogen sulfide poisoning, which results from sudden exposure to high levels (> 500 ppm) of this gas. This is a confined space entry hazard (areas that are not vented and may trap toxic gases) in CAFOs, with hydrogen sulfide the principle hazard (Donham et al, 1982a; Osbern and Crapo, 1981). Acute respiratory distress syndrome (ARDS), or pulmonary edema, can result in CAFO workers from acute or chronic exposure to hydrogen sulfide (H2S). There have been at least 19 acute deaths in workers resulting from sudden H2S exposure of above 500 ppm secondary to liquid manure agitation. These people may collapse and stop breathing following only a few breaths at this high exposure (hydrogen sulfide is an asphyxiant). Severe pulmonary edema from the irritant properties of hydrogen sulfide and death may result. Longer-term lower exposure may also lead to ARDS during or following an accumulative or multiple period exposure (Donham et al, 1982a). Other respiratory illnesses result from less acutely toxic exposures and lead to non-fatal acute lung insults as well as chronic declines in lung function (Bongers et al, 1987; Choudat et al, 1994; Cormier et al, 1997; Crook et al, 1991; Donham et al, 1984). Respiratory problems associated with this
133
environment are listed in Table 3 by upper respiratory tract, airway, interstitial, and mixed airway and interstitial lung diseases. The pathogenesis of these respiratory diseases is primarily acute and chronic airway inflammation. Classical immunologically mediated asthma and hypersensitivity pneumonitis appear to be uncommon among CAFOs workers (Matson et al, 1983). Acute bronchitis is the most common complaint among CAFOs workers, affecting as many as 70 percent of those exposed. This is an irritant-induced inflammatory condition of the airways. The symptoms of bronchitis are cough and sputum production. Chronic bronchitis is noted by chronic phlegm for two or more years. This condition affects about 25 percent of CAFO workers. Acute and chronic bronchitis may be accompanied by an asthma-like condition, with symptoms of chest tightness, wheezing, difficulty breathing, and shortness of breath (the symptoms most typically reported). Frequent upper respiratory tract conditions include sinusitis and rhinitis. Some studies have referred to these collectively as mucus membrane irritation (MMI) (Rylander, 1994; Rylander et al, 1989). MMI may be attributable to the combination of bioaerosol, endotoxin and ammonia and other irritant exposures (Donham, 1986; Donham et al, 1986a). Sinusitis is often chronic among CAFO workers who may complain of a continual or frequent cold “they just cannot shake,” of a stuffy head, difficulty in breathing through the nose, headache, and/or “popping ears.” These symptoms are a result of a noninfectious, toxic inflammation and swelling of the mucus membranes of the sinus cavities and the Eustachian tubes leading to the middle ear. This is often accompanied by a chronic irritant rhinitis and pharyngitis. Allergic rhinitis (also called hay fever) has rarely been attributed to confinement exposures. Such persons may have a specific allergy to some component of the swine environment. These symptoms are similar to irritant rhinitis, except it usually develops after only brief exposure to the environment and may be accompanied by itchy, watery eyes and possibly acute chest tightness (allergic asthma). Workers with pre-existing allergic rhinitis often self-select themselves out of CAFO work which contributes to a selected, or survivor, population of CAFO workers. An asthma-like syndrome, similar to byssinosis (a condition of workers exposed to cotton and other vegetable textile dusts), has been described among CAFO workers. This condition is characterized by chest tightness, wheezing, and/or cough on return to work after two or more days of work absence, and mild acquired airway hyperresponsiveness. It may occur early in exposure to the CAFO environment and is not an immunologically mediated condition. It was documented in 11 percent of a population-based study of Iowa swine confinement workers (Donham et al, 1990). Occupational asthma includes periodic airway obstruction, chest tightness, wheezing, and dyspnea, does not occur on first exposure, but may develop after weeks to months of CAFO exposure. CAFO workers with pre-existent asthma typically experience severe asthma upon first exposure to animal confinement facilities and select themselves out of these jobs. Occupational asthma may result from repeated exposure to the work environment. It has two basic mechanisms: 1) immunologically mediated or allergic, or 2) chronic irritation. Rarely have there been documented allergic (IgE) mediated causes for CAFO workers’ illnesses. These “susceptible” workers almost always leave the work force early because of severe asthma, and the condition is very difficult to manage among workers who continue to work in the CAFO environment. Non-allergic occupational asthma, asthma-like syndrome, and/or reactive airways disease, has been found to be
134
common (up to 20 percent) of current CAFO workers. This condition may lead to progressive declines in lung function and chronic obstructive pulmonary disease, which is a chronic irreversible condition (Schwartz et al, 1992; Schwartz et al, 1995b). CAFO exposures, dust concentration, endotoxin concentration, and cross-shift decline in lung function (FEV1) have been found to be significant determinants of progressive decline in lung function over time (Reynolds et al, 1996; Schwartz et al, 1995a; Schwartz et al, 1995b; Vogelzang et al, 1998; Vogelzang et al, 2000). Occupational asthma is distinct from organic dust toxic syndrome (ODTS). ODTS results in a flu-like spectrum of symptoms including headache, joint and muscle pain, fever, fatigue and weakness, cough, shortness of breath, and irritation of the airways and the cells lining the small sacs of the lung. ODTS may be clinically mistaken for farmer’s lung, as they have similar acute symptoms, e.g., the delayed onset of severe influenza-like symptoms, following exposure. However, farmer’s lung (hypersensitivity pneumonitis) is seen (now rarely) in mainly dairy farming operations, but has not been documented in swine workers (Rylander, 1994). However, 33 percent (Donham et al, 1990) of swine producers have reported episodes of ODTS, which is an influenza-like illness followed by exposure to a higher than usual dust load, e.g., moving and sorting hogs. A chronic or sub acute condition (a possible variant of ODTS) has been described among swine workers and is characterized by chronic fatigue and possibly persistent mild pulmonary infiltrates (Auger, 1992). However, there are only anecdotal cases observed and no human studies that have been conducted (Donham, 1993); there is some evidence for a persistent pulmonary infiltrate condition from one animal study (Donham and Leininger, 1984). It is recognized that several of these respiratory conditions may occur in an individual CAFO worker, and they may occur at the same time. It is possible, for instance, for an individual CAFO worker to have signs and symptoms of an asthma-like condition, bronchitis, and episodes of ODTS. This produces an interrelated group of conditions (a syndrome) of illness caused by exposure to the swine building environment (Table 1). 6.3.2.2. Control of the Occupational Environment CAFO worker health risks can be significantly reduced through a comprehensive program of environmental monitoring and control through the use of management practices, engineering controls, judicial use of personal protective equipment, and health surveillance. However, such programs are exceedingly rare in today's CAFO industry. There is little to no exposure monitoring except for research purposes, and routine health surveillance in this worker population is rare. Engineering controls are generally implemented if they will benefit hog production, but rarely with worker health as the principal motivation. There is some evidence to suggest that healthy swine confinement workers can usually tolerate exposures to total dust (2.5 mg/m3), respirable dust (0.23 mg/m3), ammonia (7 ppm), endotoxin (100 EU/m3), and micro-organisms/m3.(105) without experiencing significant acute respiratory symptoms (Donham et al, 1986a; Donham et al, 1986b; Donham et al, 1990; Reynolds et al, 1996). However, further studies are needed to confirm these findings and to assess the combined effects of common CAFO exposures, including ammonia, endotoxin, and the use of disinfectants, which together appear to influence respiratory disease outcomes (Preller et al, 1995). It is important to recognize that CAFO workers are a survivor population, meaning that the most severely affected workers have already left the workplace. In addition, there is evidence that workers exposed to inhaled endotoxin develop a tolerance (at least to acute symptoms) to this toxicant.
135
However, long-term exposure may lead to chronic airway obstruction, even in the absence of acute symptoms. Some previously unexposed individuals in the general community population would be expected to react acutely to lower concentrations of CAFO exposures. Management practices and engineering controls can significantly reduce exposures to inhaled toxicants (Senthilselvan et al, 1997). These include frequent facility cleaning (frequent power washing from floor to ceiling, at least every three weeks); addition of extra fat and a urease inhibitor, e.g., microaid, to the feed; self-cleaning flooring; and improved lagoon operation (Mutel et al, 1992). The ventilation system, by itself, cannot necessarily assure a healthful environment. Health surveillance and the management procedures, mentioned above, must also be implemented. Also, the ventilation system must be properly engineered and maintained; very often, higher cool weather exchange ventilation rates are needed; and lower animal density (swine mass per unit of barn volume) may be required. Personal protective equipment should not be considered an effective alternative to good management practices and engineering controls. Without a properly supervised respirator program, it is very difficult to assure that exposed personnel will wear the right respirator and that it fits properly, functions properly, and is worn at the appropriate time. Respirators are not well tolerated, especially for strenuous work in a hot, humid environment. The Occupational Safety and Health Administration (OSHA) requires that if respirators are worn to protect workers, they must be worn at all times, and be fit, maintained, and stored properly through an appropriately supervised respirator program. Respirators are an adjunct to management practices, engineering controls, and health surveillance, especially for specific tasks that result in higher-than-normal exposures or for workers in need of increased protection. Special attention should be given to pregnant women who work in swine confinement facilities. The unborn fetus is susceptible to carbon monoxide and hormonal drugs used in swine production (e.g., oxytocin and prostaglandins). Pregnant women may be at increased risk for spontaneous abortion if they work in swine barns (Donham and Gustafson, 1982). 6.3.2.3. Relationships Between Indoor and External Air Environments One cannot directly extrapolate occupational health risks observed inside CAFOs to community health risks outside swine production. Although there is discharge of airborne particulates and gases/vapors from the swine barns to the exterior environment, the aerosols differ considerably in composition and in the concentration of specific agents. As aerosols and gases/vapors emanate from a point source travel downwind, the aerosols disperse, become less concentrated and adsorbed gases/vapors may be stripped from particles. There may also be photochemical reactions and ground deposition. Volatile organics present in the outdoor air in the vicinity of a swine production facility may arise from outdoor manure storage facilities and manure application, in addition to particulate and gases in air discharged from the confinement facilities. Although there is theoretically a definable dose-response relationship for respiratory diseases by individual compounds, the exposures inside CAFOs are always a complex, mixed exposures and differ in many ways from those outside. Perhaps equally important is the fact that the CAFO and community populations are quite different in terms of susceptibility factors. Some members of the general population, including susceptible children, the elderly, asthmatics, and other susceptible individuals, would be expected to develop responses at much lower doses than healthy workers.
136
Furthermore, individuals living in the vicinity of CAFOs and who may have their quality of life and social and economic conditions affected and feel stress because they have no control over their living conditions. 6.3.2.4. Conclusion The scientific literature is quite clear that workers in swine or poultry CAFOs are at risk to acute and chronic respiratory diseases from concentrated emissions inside CAFOs. There is, however, adequate information to protect workers, if the industry and regulators take steps to do so--including monitoring engineering, administrative, and personal protective equipment. The swine and poultry industry needs to develop and manage exposures to their workers, and OSHA should take action to protect the health and safety of workers under their jurisdiction. 6.3.3. Community-Based Studies Community exposures to environmental contamination, most of which has a risen from industrial and agricultural technology over the last 100 years, are now well-recognized public health problems. Exposures include a vast array of chemicals, noise, and ionizing radiation. Other sources of environmental contamination have arisen from the products of armed conflicts, including the some 250,000 American veterans and their families who were exposed to ionizing radiation during the above ground atomic bomb testing program from 1945 to 1962 (Ellis et al, 1992), those exposed to a variety of environmental agents, in addition to a hostile environment, in the Persian Gulf War (Schwartz et al, 1997) and community residents living in proximity to industrial sites in California (Shusterman et al, 1991). These examples, like community exposures to CAFOs, involve environmental exposures under circumstances in which there is little or no environmental control by the affected community. Ellis has defined community environmental contamination “as a stress that is unique in terms of: 1) its physical characteristics and resultant adaptational dilemmas, 2) the agent or cause of the injury, and 3) the institutional responses to the contamination” (Ellis et al, 1992). Asked by the Centers of Disease Control to assess any adverse health effects of Iowans who served in the Persian Gulf War, The University of Iowa Persian Gulf War Study Group assessed a number of specific and non-specific health outcomes and a number of environmental exposures as well as global exposure to the Persian Gulf War theater among a sample (n=3695) of active and reserve military personnel who served in the war theater and elsewhere during the study period (Schwartz et al, 1997). Significantly higher prevalence of symptoms of depression, posttraumatic stress disorder, chronic fatigue, cognitive dysfunction, bronchitis, asthma, fibromyalgia, alcohol abuse, anxiety, and sexual discomfort were observed. Assessment of health-related quality of life demonstrated diminished mental and physical differences among the PGW as compared with non-PGW military personnel. While significant associations were observed with a number of self-reported environmental exposures during this time period, the exposures and constellation of symptoms did not fit well into an established category of disease or syndrome, but were similar to previous reports of veterans from previous wars thought to arise from the stresses of war. The specific environmental causes of the increased adverse health effects could not ascertained (nor could they be ruled out) from this study and recall bias, to which any such survey is subject, could also not be ruled out as a contributing factor to these associations. Shusterman and colleagues (1991) studied both “environmental worry” and self-perceived environmental odors (especially petrochemical) among 2000 Californians living in proximity to three industrial sites, as well as control sites. Observations found that both “environmental worry” and perceptions regarding odor were associated both
137
independently and interactively with symptom reporting. Recall bias was recognized as a potential confounder for some of these findings. These methodological approaches are relevant to studies of other community environmental exposures, such as those that arise from CAFOs that include both specific environmental agent exposures and more global (odors/mixed exposures) community exposures, arising from a given source(s) of environmental exposures. 6.3.3.1. Community Studies of Concentrated Livestock Exposures Schiffman and colleagues (1995) studied North Carolina residents who lived in the vicinity of intensive swine operations (n=44), and compared with matched control subjects who did not live near such operations (n=44). Using a validated Profile of Mood States (Schiffman et al, 1995) they found more negative mood states among those living in proximity to swine operations. The factors affected included tension, depression, anger, reduced vigor, fatigue, and confusion. Greater total mood disturbance was also reported by those living near swine operations. These authors suggested that a variety of factors may have affected the mood of those exposed to odors and living in proximity to swine facilities. Thu and colleagues (1997) found no difference in the clinical levels of depression or anxiety between Iowans (n=18) living within two miles of a 4,000 sow CAFO and a random sample of demographically similar rural residents (n=18) living near minimal livestock production. However, higher rates of four clusters of symptoms common among CAFO workers and associated with toxic air exposures were observed: (Cluster 1: sputum, cough, shortness of breath, chest tightness, wheezing, p=.02; Cluster 2: nausea, dizziness, weakness, fainting, p=.04; Cluster 3: headaches, plugged ears, p=.06; Cluster 4: runny nose, scra tchy throat, burning eyes, p=.12), whereas other symptoms including muscle aches, hearing problems, skin rash, and fever did not differ between the two groups. The authors drew attention to the similarities between the pattern of symptoms among these community residents and CAFO workers and suggested that a larger population-based study was needed. Wing and Wolf (2000) conducted a population-based study of three rural North Carolina communities, one of which was in the vicinity of a 6,000-head hog operation, one in the vicinity of two intensive cattle operations, and a third area without “liquid waste” livestock operations. A standardized questionnaire was administered by trained interviewers to ascertain health symptoms and indicators of quality of life during the previous 6 months. 155 interviews were completed with a participation rate of 86%. Those living in proximity to the swine operation reported increased rates of headaches, runny nose, sore throat, excessive coughing, diarrhea, and burning eyes compared to rural residents with no livestock operation. Quality of life measures among those living in the vicinity of the swine operation were greatly reduced. The authors were aware of potential recall bias and, therefore, presented the study as a “rural health” study which did not include any questions about hogs, livestock, or odors. They also pointed out that eight symptoms in the miscellaneous category did not differ between the hog and control communities, thereby minimizing the likelihood of significant recall bias. Hodne and her University of Iowa colleagues are currently testing the relative power of aspects of medical models and bio-psychosocial models to assess the mental health consequences of CAFO community exposures. For example, they report greater traumatic cognitions associated with post-traumatic stress disorder among residents of rural areas with many CAFOs and areas with traditional livestock production than among rural residents in areas with very little livestock (Hodne, 2001).
138
They are a lso exploring the types of stress responses in CAFO neighbors that may mediate the relationship between air emissions and odors and physical and mental health outcomes. The three published, peer reviewed studies of community residents exposed to CAFO emissions are limited and should be interpreted with caution because of the relatively small numbers of participants, because they did not report environmental exposure data and likely contain some recall bias. However, they are notable because they were all well designed, controlled studies and because the two of the three that examined respiratory and other symptoms common among CAFO workers found similar symptom patterns (while not as prevalent or severe) as those observed among CAFO workers. Two of the three studies also reported indicators associated with diminished a quality of life among those living in proximity to livestock facilities as compare to community controls. 6.3.4. Conclusion Numerous occupational studies have documented significant increases in respiratory disease and other respiratory adverse health effects, including CAFO-related deaths, acute and chronic respiratory diseases and associated symptoms and acute losses in exposure-related lung function and progressive respiratory impairment, a mong those who work in CAFOs. However, it is recognized that the CAFO workforce is generally healthy, while those in the general community, including children, the elderly, those with chronic impairments such as pre-existing asthma or chronic obstructive pulmonary disease, are expected to be much more susceptible to CAFO exposures. There is experimental and epidemiological evidence that very low levels of exposures to ammonia, hydrogen sulfide, known to be ambient air toxic gases arising from CAFOs, may result in adverse health effects among healthy volunteers and community residents. While limited in number and scope, the currently published, peer reviewed, community-based studies of adverse health affects associated with CAFO exposures find an increased prevalence of similar symptom patterns, especially respiratory symptoms, and similar indicators of reduced quality of life. Taken together with other experimental and epidemiological observations of adverse health effects observed with low levels of exposures to chemical components (ammonia, hydrogen sulfide) of CAFO emissions, these findings support a conclusion that CAFO air emissions constitute a public health hazard, deserving of public health precautions as well as larger, well controlled, population-based studies to more fully ascertain adverse health outcomes and their impact on community health services. References American Thoracic Society. Respiratory health hazards in agriculture. Am J Respir Crit Care Med 158:S1-S76 (1998). Arbour NC, Lorenz E, Schutte BC, Zabner J, Kline JN, Jones M, Frees K, Watt JL, Schwartz DA. TLR4 mutations are
associated with endotoxin hyporesponsiveness in humans. Nat Genet 25(2):187-191 (2000). Auger P. Clinical experience with patients suffering from a chronic fatigue-like syndrome and repetitious upper
respiratory infections in relation to airborne molds. Presentation at Skokloster 3 Workshop, Skokloster Sweden, April 6-9 (1992).
Bar-Sela S, Teichtahl H, Lutsky I. Occupational asthma in poultry workers. J Allergy Clin Immunol 73(2):271-275 (1984). Bernstein IL, Bernstein DI. Reactive airways disease syndrome (RADS) after exposure to toxic ammonia fumes. J
Allergy Clin Immunol 83:173 (1989). Bhambhani Y, Burnham R, Snydmiller G, MacLean I, Lovlin R. Effects of 10-ppm hydrogen sulfide inhalation on
pulmonary function in healthy men and women. J Occup Environ Med 38:1012-1017 (1996a). Bhambhani Y, Burnham R, Snydmiller G, MacLean I, Martin T. Effects of 5 ppm hydrogen sulfide inhalation on
biochemical properties of skeletal muscle in exercising men and women. Am Ind Hyg Assoc J 57:464-468 (1996b).
Bhambhani Y, Burnham R, Snydmiller G, MacLean I. Effects of 10-ppm hydrogen sulfide inhalation in exercising men and women. J Occup Environ Med 39:122-129 (1997).
139
Blaski CA, Clapp WD, Thorne PS, Quinn TJ, Watt JL, Fress KL, Yagla SJ, Schwartz DA. The role of atopy in grain dust-induced airway disease. Am J Respir Crit Care Med 154(2 Pt 1):334-40 (1996).
Bongers P, Houthuijs D, Bremijn B, Brouwer R, Biersteker B. Lung function and respiratory symptoms in pig farmers. Br J Ind Med 44:819-823 (1987).
Brautbar N. Ammonia exposure: a common cause for sinusitis. Toxicol Ind Health 14:891-895 (1998). Campagna D, Kathman S, Inserra SG, Phifer BL, Middleton DC, White MC. Impact of ambient hydrogen sulfide and
total reduced sulfur levels on hospital visits for respiratory diseases among children and adults in Dakota City and South Sioux City, Nebraska. Am J Respir Crit Care Med 163(5):A562 (2001).
Chen Y, Bundy DS, Hoff SJ. Using olfactometry to measure intensity and threshold dilution ratio for evaluating swine odor. J Agric Waste Manag Assoc 49:847-853 (1999).
Choudat D, Goehen M, Korobaeff M, Boulet A, Dewitte J, Martin M. Respiratory symptoms and bronchial reactivity among pig and dairy farmers. Scand J Work Environ Health 20:48-54 (1994).
Close LG, Catlin FI, Cohn AM. Acute and chronic effects of ammonia burns of the respiratory tract. Arch Otolaryngol 106:151-158 (1980).
Cole D, Todd L, Wing S. Concentrated swine feeding operations and public health: a review of occupational and community health effects. Environ Health Perspect 108:685-699 (2000).
Cormier Y, Duchaine C, Israël-Assayag E, Bédard G, Laviolette M, Dosman J. Effects of repeated swine building exposures on normal naïve subjects. Eur Respir J 10:1516-1522 (1997).
Crook B, Robertson J, Travers Glass S, Botheroyd E, Lacey J, Topping M. Airborne dust, ammonia, microorganisms, and antigens in pig confinement houses and the respiratory health of exposed farm workers. Am Ind Hyg Assoc J 52:271-279 (1991).
Dalton P, Wysocki CJ. The nature and duration of adaptation following long-term odor exposure. Perception and Psychophysics 58(5):781-792 (1996).
Dalton P, Wysocki CJ, Brody MJ, Lawley HJ. The influence of cognitive bias on the perceived odor, irritation and health symptoms from chemical exposure. Int Arch Occup Environ Health 69:407-417 (1997).
de la Hoz RE, Schlueter DP, Rom WN. Chronic lung disease secondary to ammonia inhalation injury: a report on three cases. Am J Ind Med 29:209-214 (1996).
Dockery DW, Pope CA. Acute respiratory effects of particulate air pollution. Annu Rev Public Health 15:107-132 (1994).
Dockery DW, Pope CA, Xu X, Spengler JD, Ware JH, Fay ME, Ferris BG, Speizer FE. An association between air pollution and mortality in six US cities. N Engl J Med 329:1753-1759 (1993).
Donham, KJ. Zoonotic diseases of occupational significance in agriculture: A review. Internal Journal of Zoonotics 12:163-191 (1985).
Donham KJ. Hazardous agents in agricultural dusts and methods of evaluation. Am J Ind Med 10:205-220 (1986). Donham KJ. Respiratory disease hazards to workers in livestock and poultry confinement structures. Semin Respir Med
14:49-59 (1993). Donham KJ, Gustafson KE. Human occupational hazards from swine confinement. Annals of the American
Conference of Governmental Industrial Hygienists 2:137-142 (1982). Donham K, Leininger J. Animal studies of potential chronic lung disease of workers in swine confinement buildings.
Am J Vet Res 45:926-931 (1984). Donham KJ, Rubino M, Thedell TD, Kammermeyer, J. Potential health hazards to agricultural workers in swine
confinement buildings. J Occup Med 19:383-387 (1977). Donham KJ, Knapp L, Monson R, Gustafson K. Acute toxic exposure to gases from liquid manure. J Occup Med
24:142-145 (1982a). Donham KJ, Carson T, Adrian BR. Carboxyhemoglobin values in swine relative to carbon monoxide exposure:
Guidelines for monitoring animal and human health hazards in swine-confinement buildings. Am J Vet Res 43:813-816 (1982b).
Donham K, Zavala D, Merchant J. Acute effects of the work environment on pulmonary functions of swine confinement workers. Am J Ind Med 5:367-375 (1984).
Donham K, Scallon L, Popendorf W, Treuhaft M, Roberts R. Characterization of dusts collected from swine confinement buildings. Am Ind Hyg Assoc J 47:404-410 (1986a).
Donham K, Haglind P, Peterson Y, Rylander R. Environmental and health studies in swine confinement buildings. Am J Ind Med 10:289-293 (1986b).
Donham KJ, Merchant J, Lassise D., Popendorf W, Burmeister L. Preventing respiratory disease in swine confinement workers: Intervention through applied epidemiology, education and consultation. Am J Ind Med 18:241-261 (1990).
140
Douwes J, Zuidhof A, Doekes G, van der Zee SC, Wouters I, Boezen MH, Brunekreef B. (1-->3)-beta-D-glucan and endotoxin in house dust and peak flow variability in children. Am J Respir Crit Care Med 162(4 Pt 1):1348-54 (2000).
Ellis P, Greenberg S, Murphy B, Reusser J. Environmentally contaminated families: Therapeutic considerations. Am J Orthopsychiatry 62:44-54 (1992).
Flury KE, Dines DE, Rodarte JR, Rodgers R. Airway obstruction due to inhalation of ammonia. Mayo Clin Proc 58:389-393 (1983).
Gehring U, Bolte G, Borte M, Bischof W, Fahlbusch B, Wichmann HE, Heinrich J. Exposure to endotoxin decreases the risk of atopic eczema in infancy: A cohort study. J Allergy Clin Immunol 108(5):847-854 (2001).
Gereda JE, Leung DY, Thatayatikom A, Streib JE, Price MR, Klinnert MD, Liu AH. Relation between house-dust endotoxin exposure, type 1 T-cell development, and allergen sensitisation in infants at high risk of asthma. Lancet 355(9216):1680-1683 (2000).
Haahtela T, Marttila O, Vilkka V, Jappinen P, Jaakkola JJ. The South Karelia Air Pollution Study: acute health effects of malodorous sulfur air pollutants released by a pulp mill. Am J Public Health 82(4):603-605 (1992).
Harris DB, Shores RC, Jones LG. Ammonia emission factors from swine finishing operations. EPA/600/A-01/037 July 18, 2001 retrieved December 9, 2001 from www.epa.gov/ORD/NRMRL/Pubs/2001/600a01037.htm.
Healy J, Bradley SD, Northage C, Scobbie E. Inhalation exposure in secondary aluminum smelting. Ann Occup Hyg 45:217-225 (2001).
Heederik D, Douwes J. Towards an occupational exposure limit for endotoxins? Ann Agric Environ Med 4:17-19 (1997).
Hessel PA, Herbert FA, Melenka LS, Yoshida K, Nakaza M. Lung health in relation to hydrogen sulfide exposure in oil and gas workers in Alberta, Canada. Am J Ind Med 31(5):554-557 (1997).
Hodne, CJ. Posttraumatic Stress Disorder: Causes, symptoms, and prevention. ICASH Annual Meeting, West Des Moines, Iowa, November 8-9, 2001.
Holness DL, Purdham, JT, Nethercott, JR. Acute and chronic respiratory effects of occupational exposure to ammonia. Am Ind Hyg Assoc J 50(12):646-650 (1989).
Jaakkola JJ, Paunio M, Virtanen M, Heinonen OP. Low-level air pollution and upper respiratory infections in children. Am J Public Health 81(8):1060-1063 (1991).
Jagielo PJ, Thorne PS, Watt JL, Frees KL, Quinn TJ, Schwartz DA. Grain dust and endotoxin inhalation challenges produce similar inflammatory responses in normal subjects. Chest 110(1):263-270 (1996).
Jappinen P, Vikka V, Marttila O, Haahtela T. Exposure to hydrogen sulphide and respiratory function. Br J Ind Med 47:824-828 (1990).
Kass I, Zamel N, Dobry CA, Holzer M. Bronchiectasis following ammonia burns of the respiratory tract. A review of two cases. Chest 62:282-285 (1972).
Keplinger ML, Schadeberg KJ, Goode JW, Calandra JC. Irritation threshold evaluation study with ammonia. In: Report to the Institute of Ammonia Refrigeration, Industrial Bio-Test (Publication No. 663-03161), Northbrook IL (1973).
Kilburn KH. Exposure to reduced sulfur gases impairs neurobehavioral function. South Med J 90:997-1006 (1997). Kline JN, Cowden JD, Hunninghake GW, Schutte BC, Watt JL, Wohlford-Lenane CL, Powers LS, Jones MP, Schwartz
DA. Variable airway responsiveness to inhaled lipopolysaccharide. Am J Respir Crit Care Med 160(1):297-303 (1999).
Kline JN, Jagielo PJ, Watt JL, Schwartz DA. Bronchial hyperreactivity is associated with enhanced grain dust- induced airflow obstruction. J Appl Physiol 89(3):1172-1178 (2000).
Knasko SC, Gilbert AN, Sabini J. Emotional state, physical well-being and performance in the presence of feigned ambient odor. J Appl Soc Psychol 20:1345-1357 (1990).
Knasko SC. Ambient odor’s effect on creativity, mood, and perceived health. Chem Senses 17:27-35 (1992). Knasko SC. Performance, mood, and health during exposure to intermittent odors. Arch Environ Health 48:305-308
(1993). Latenser BA, Loucktong TA. Anhydrous ammonia burns: case presentation and literature review. J Burn Care Rehabil
21:40-42 (2000). Leduc D, Gris P, L’heureaux P, Gevenois PA, De Vuyst P, Yernault JC. Acute and long-term respiratory damage
following inhalation of ammonia. Thorax 47:755-757 (1992). Lenhart SW, Morris PD, Akin RE, Olenchock SA, Service WS, Boone WP. Organic dust, endotoxin, and ammonia
exposures in the North Carolinian poultry processing industry. Appl Occup Environ Hyg 5:611-617 (1990). Lippmann M, Ito K, Nadas A, Burnett RT. Association of particulate matter components with daily mortality and
morbidity in urban populations. Health Effects Institute Research Report 95:5-72 (2000).
141
Matson W, Swanson M, Reed C, Yunginger J. IgE and IgG-immune mechanisms do not mediate occupation-related respiratory or systemic symptoms in hog farmers. J Allergy Clin Immunol 72:299-304 (1983).
McLean JA, Mathews KP, Brayton PR, Solomon ER, Bayne NK. Effects of ammonia on nasal resistance in atopic and non-atopic subjects. Ann Otol Rhinol Laryngol 88:228-234 (1979).
Michel O, Duchateau J, Sergysels R. Effect of inhaled endotoxin on bronchial reactivity in asthmatic and normal subjects. J Appl Physiol 66(3):1059-1064 (1989).
Michel O, Ginanni R, Duchateau J, Vertongen F, Le Bon B, Sergysels R. Domestic endotoxin exposure and clinical severity of asthma. Clin Exp Allergy 21(4):441-448 (1991).
Michel O, Ginanni R, Le Bon B, Content J, Duchateau J, Sergysels R. Inflammatory response to acute inhalation of endotoxin in asthmatic patients. Am Rev Respir Dis 146:352-357 (1992).
Michel O, Kips J, Duchateau J, Vertongen F, Robert L, Collet H, Paulwels R, Sergysels R. Severity of asthma is related to endotoxin in house dust. Am J Respir Crit Care Med 154(6 Pt 1):1641-1646 (1996).
Michel O, Nagy AM, Schroeven M, Duchateau J, Neve J, Fondu P, Sergysels R. Dose-response relationship to inhaled endotoxin in normal subjects. Am J Respir Crit Care Med 156(4 Pt 1):1157-1164 (1997).
Morris PD, Lenhart SW, Service WS. Respiratory symptoms and pulmonary function in chicken catchers in poultry confinement units. Am J Ind Med 19(2):195-204 (1991).
Mulhausen JR, McJilton CE, Redig PT, Janni KA. Aspergillus and other human respiratory disease agents in turkey confinement houses. Am Ind Hyg Assoc J 48:894-899 (1987).
Mutel C, et al swine confinement and respiratory health: A guide to the prevention of job-related health problems for swine producers who work in confinement facilities, 2nd edition, Iowa City, IA: The University of Iowa Institute of Agricultural Medicine and Occupational Health;1992.
Nichols P, Kim JK. Sulfide as an inhibitor and electron donor for the cytochrome c oxidase system. Can J Biochem Cell Biol 60:612-623 (1982).
O’Mahoney M. Smell illusions and suggestion; reports of smells contingent on tones played on radio and television. Chem Senses 3:183-189 (1978).
Osbern L, Crapo R. Dung lung: A report of toxic exposure to liquid manure. Ann Intern Med 95:312-314 (1981). Park JH, Gold DR, Spiegelman DL, Burge HA, Milton DK. House dust endotoxin and wheeze in the first year of life.
Am J Respir Crit Care Med 163(2):322-328 (2001). Partti-Pellinen K, Marttilla O, Vikka V, Jaakkola JJ, Jappinen P, Haahtela T. The South Krelia Air Pollution Study:
Effects of low-level exposure to malodorous sulfur compounds on symptoms. Arch Environ Health 51(4):315-320 (1996).
Peters JA, Blackwood TR. Source Assessment: Beef Cattle Feedlots. EPA-600/2-77-107, US Environmental Protection Agency, Research Triangle Park, North Carolina, June 10, 1977.
Pope CA, Thun MJ, Namboodir MM, Dockery DW, Evans JS, Speizer FE, Heath CW. Particulate air pollution as a predictor of mortality in a prospective study of US adults. Am J Respir Crit Care Med 151:669-674 (1995).
Preller L, Heederik D, Bolejj JSM, Vogelzang PFJ, Tielen MJM. Lung function and chronic respiratory symptoms of pig farmers: focus on exposure to endotoxins and ammonia and use of disinfectants. Occup Environ Med 52:654-660 (1995).
Randolph G, Rhodes S. Injuries to workers in a swine confinement facility. J Occup Med 35:518-529 (1993). Reynolds SJ, Donham KJ, Whitten P, Merchant JA, Burmeister LF, Popendorf WJ. Longitudinal evaluation of dose-
response relationships for environmental exposures and pulmonary function in swine production workers. Am J Ind Med 29:33-40 (1996).
Reynolds S, Donham K, Stookesberry J, Thorne PS, Subramanian P, Thu K, Whitten P. Air quality assessments in the vicinity of swine production facilities. Agricultural Health and Safety: Recent Advances 4:37-45 (1997).
Rizzo MC, Naspitz CK, Fernandez-Caldas E, Lockey RF, Mimica I, Sole D. Endotoxin exposure and symptoms in asthmatic children. Pediatr Allergy Immunol 8:121-126 (1997).
Rossi OV, Kinnula VL, Tienari J, Huhti E. Association of severe asthma attacks with weather, pollen, and air pollutants. Thorax 48(3):244-248 (1993).
Rylander R. Symptoms and mechanisms of inflammation of the lung. Am J Ind Med 25:19-24 (1994). Rylander R, Donham K, Hjort C, Brouwer R, Heederik D. Effects of exposure to dust in swine confinement buildings –
a working group report. Scand J Work Environ Health 15:309-312 (1989). Schiffman SS, Miller EA, Suggs MS, Graham BG. The effect of environmental odors emanating from commercial swine
operations on the mood of nearby residents. Brain Res Bull 37:369-375 (1995). Schiffman S, Walker J, Dalton P, Lorig T, Raymer J, Shusterman D, Williams C. Potential health effects of odor from
animal operations, wastewater treatment, and recycling of byproducts. J Agromed 7:7-81 (2000). Schiffman S, Bennett J, Raymer J. Quantification of odors and odorants from swine operations in North Carolina.
Agricultural and Forest Meterology 108:213-240 (2001).
142
Schwartz DA, Landas SK, Lassise DL, Burmeister LF, Hunninghake GW, Merchant JA. Airway injury in swine confinement workers. Ann Intern Med 116:630-635 (1992).
Schwartz DA, Thorne PS, Yagla SJ, Burmeister LF, Olenchock SA, Watt JL, Quinn TJ. The role of endotoxin in grain dust-induced lung disease. Am J Respir Crit Care Med 152(2):603-608 (1995a).
Schwartz DA, Donham KJ, Olenchock SA, Popendorf WJ, Van Fossen DS, Burmeister LF, Merchant JA. Determinants of longitudinal changes in spirometric function among swine confinement operators and farmers. Am J Respir Crit Care Med 151(1):47-53 (1995b).
Schwartz DA, Quinn TJ, Thorne PS, Sayeed S, Yi A-K, Krieg AM. CpG motifs in bacterial DNA cause inflammation in the lower respiratory tract. J Clin Invest 100(1):68-73 (1997).
Senthilselvan A, Zhang Y, Dosman JA, Barber EM, Holfedl LE, Kirychuk SP, Cormier Y, Hurst TS, Rhode CS. Positive human health effects of dust suppression with canola oil in swine barns. Am J Respir Crit Care Med 156: 410-417 (1997).
Shusterman D. Critical review: the health significance of environmental odor pollution. Arch Environ Health 47:76-87 (1992).
Shusterman D, Lipscomb J, Neutra R, Satin K. Symptom prevalence and odor-worry interaction near hazardous wastes sites. Environ Health Perspect 94:25-30 (1991).
Shusterman D, Lipscomb J, Neutra R, Satin K. Symptom prevalence and odor-worry interaction near hazardous waste sites. Environ Health Perspect 94:25-30 (1999).
Skorska C, Mackiewicz B, Dutkiewicz J. Effects of exposure to flax dust in polish farmers: work-related symptoms and immunologic response to microbial antigens associated with dust. Ann Agric Environ Med 7:111-118 (2000).
Sobonya R. Fatal anhydrous ammonia inhalation. Hum Pathol 8:293-299 (1977). Summer W. Odor pollution of air-cause and control. The Chemical Rubber Company Press, Cleveland, OH, p 310
(1971). Texas Natural Resources Conservation Commission. Memo dated April 20, 1998 from Tim Doty to JoAnn Wiersma:
Real-time gas chromatography and composite sampling, sulfur dioxide, hydrogen sulfide, and impinger sampling. Corpus Christi Mobile Laboratory Trip;January 31-February 6, 1998.
Thu, K, Donham K, Ziegenhorn R, Reynolds S, Thorne PS, Subramanian P, Whitten P, Stookesberry J. A control study of the physical and mental health of residents living near a large-scale swine operation. J Agric Saf Health 3:13-26 (1997).
Ulvestad B, Bakke B, Eduard W, Kongerud J, Lund MB. Cumulative exposure to dust causes accelerated decline in lung function in tunnel workers. Occup Environ Med 58:553-669 (2001).
United States Public Health Service. The air pollution situation in Terre Haute, Indiana with special reference to the hydrogen sulfide incident of May-June, 1964. Cincinnati, OH:US Department of Health, Education, and Welfare, Public Health Service Division of Air Pollution1-28 (1964).
Van Aalst JA, Isakov R, Polk JD, Van Antwerp AD, Yang M, Fratianne RB. Hydrogen sulfide inhalation injury. J Burn Care Rehabil 21:248-253 (2000).
Vogelzang PFJ, van der Gulden JWJ, Folgering H, Kolk JJ, Heederik D, Liesbeth P, Tielen MJM, van Schayck CP. Endotoxin exposure as a major determinant of lung function decline in pig farmers. Am J Respir Crit Care Med 157:15-18 (1998).
Vogelzang PFJ, van der Gulden JWJ, Folgering H, Heederik D, Tielen MJM, van Schayck CP. Longitudinal changes in bronchial responsiveness associated with swine confinement dust exposure. Chest 117:1488-1495 (2000).
Von Mutius E, Braun-Fahrlander C, Schierl R, Riedler J, Ehlermann S, Maisch S, Waser M, Nowak D. Exposure to endotoxin or other bacterial components might protect against the development of atopy. Clin Exp Allergy 30(9):1230-1234 (2000).
Walton M. Industrial ammonia gassing. Br J Ind Med 30:78-86 (1973). Wing S., Wolf S. Intensive livestock operations, health, and quality of life among eastern North Carolina residents.
Environmental Health Persp 108:233-238 (2000). Xu X, Cho SI, Sammel M, You L, Cui S, Huang Y, Ma G, Padungtod C, Pothier L, Niu T, Christiani D, Smith T, Ryan
L, Wang L. Association of petrochemical exposure with spontaneous abortion. Occup Environ Med 55(1):31-36 (1998).
Zahn JA, DiSpirito AA, Do YS, Brooks BE, Cooper EE, Hatfield JL. Correlation of human olfactory responses to airborne concentrations of malodorous volatile organic compounds emitted from swine effluent. J Environ Qual 30:624-634 (2001).
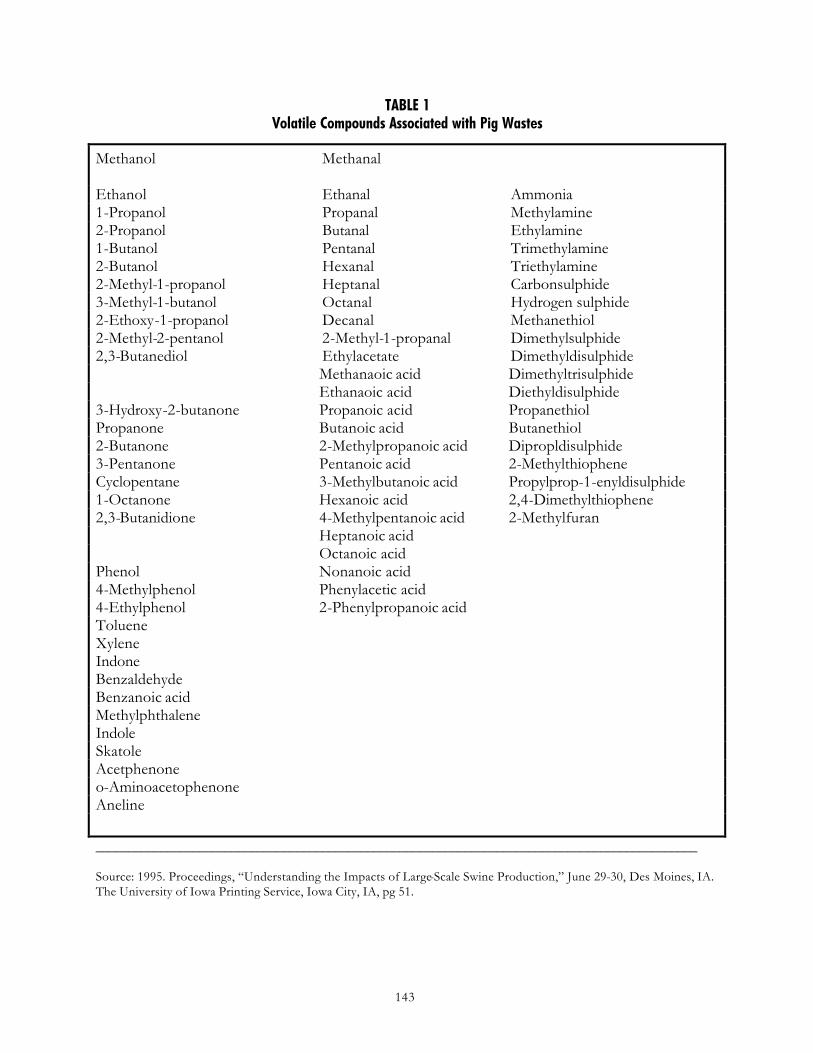
143
TABLE 1 Volatile Compounds Associated with Pig Wastes
Methanol Methanal
Ethanol Ethanal Ammonia 1-Propanol Propanal Methylamine 2-Propanol Butanal Ethylamine 1-Butanol Pentanal Trimethylamine 2-Butanol Hexanal Triethylamine 2-Methyl-1-propanol Heptanal Carbonsulphide 3-Methyl-1-butanol Octanal Hydrogen sulphide 2-Ethoxy-1-propanol Decanal Methanethiol 2-Methyl-2-pentanol 2-Methyl-1-propanal Dimethylsulphide 2,3-Butanediol Ethylacetate Dimethyldisulphide Methanaoic acid Dimethyltrisulphide Ethanaoic acid Diethyldisulphide 3-Hydroxy-2-butanone Propanoic acid Propanethiol Propanone Butanoic acid Butanethiol 2-Butanone 2-Methylpropanoic acid Dipropldisulphide 3-Pentanone Pentanoic acid 2-Methylthiophene Cyclopentane 3-Methylbutanoic acid Propylprop-1-enyldisulphide 1-Octanone Hexanoic acid 2,4-Dimethylthiophene 2,3-Butanidione 4-Methylpentanoic acid 2-Methylfuran Heptanoic acid Octanoic acid Phenol Nonanoic acid 4-Methylphenol Phenylacetic acid 4-Ethylphenol 2-Phenylpropanoic acid Toluene Xylene Indone Benzaldehyde Benzanoic acid Methylphthalene Indole Skatole Acetphenone o-Aminoacetophenone Aneline _____________________________________________________________________________________________
Source: 1995. Proceedings, “Understanding the Impacts of Large-Scale Swine Production,” June 29-30, Des Moines, IA. The University of Iowa Printing Service, Iowa City, IA, pg 51.
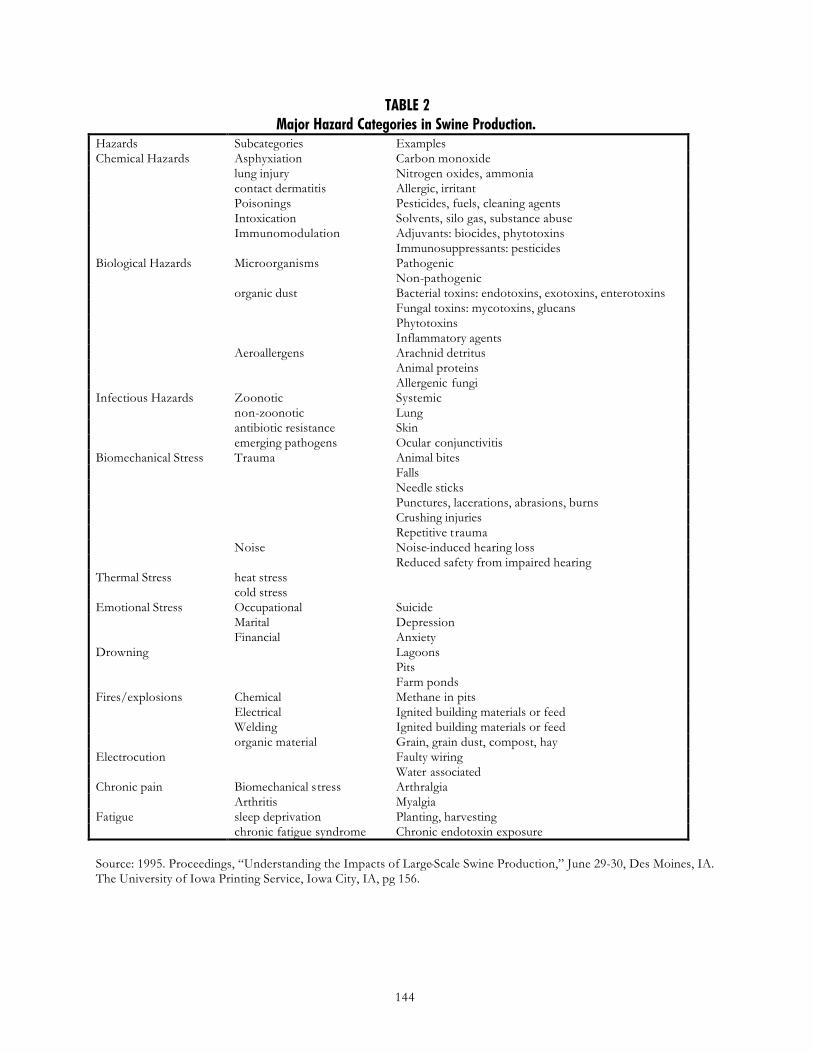
144
TABLE 2 Major Hazard Categories in Swine Production.
Hazards Subcategories Examples Chemical Hazards Asphyxiation Carbon monoxide lung injury Nitrogen oxides, ammonia contact dermatitis Allergic, irritant Poisonings Pesticides, fuels, cleaning agents Intoxication Solvents, silo gas, substance abuse Immunomodulation Adjuvants: biocides, phytotoxins Immunosuppressants: pesticides Biological Hazards Microorganisms Pathogenic Non-pathogenic organic dust Bacterial toxins: endotoxins, exotoxins, enterotoxins Fungal toxins: mycotoxins, glucans Phytotoxins Inflammatory agents Aeroallergens Arachnid detritus Animal proteins Allergenic fungi Infectious Hazards Zoonotic Systemic non-zoonotic Lung antibiotic resistance Skin emerging pathogens Ocular conjunctivitis Biomechanical Stress Trauma Animal bites Falls Needle sticks Punctures, lacerations, abrasions, burns Crushing injuries Repetitive trauma Noise Noise-induced hearing loss Reduced safety from impaired hearing Thermal Stress heat stress cold stress Emotional Stress Occupational Suicide Marital Depression Financial Anxiety Drowning Lagoons Pits Farm ponds Fires/explosions Chemical Methane in pits Electrical Ignited building materials or feed Welding Ignited building materials or feed organic material Grain, grain dust, compost, hay Electrocution Faulty wiring Water associated Chronic pain Biomechanical stress Arthralgia Arthritis Myalgia Fatigue sleep deprivation Planting, harvesting chronic fatigue syndrome Chronic endotoxin exposure Source: 1995. Proceedings, “Understanding the Impacts of Large-Scale Swine Production,” June 29-30, Des Moines, IA. The University of Iowa Printing Service, Iowa City, IA, pg 156.
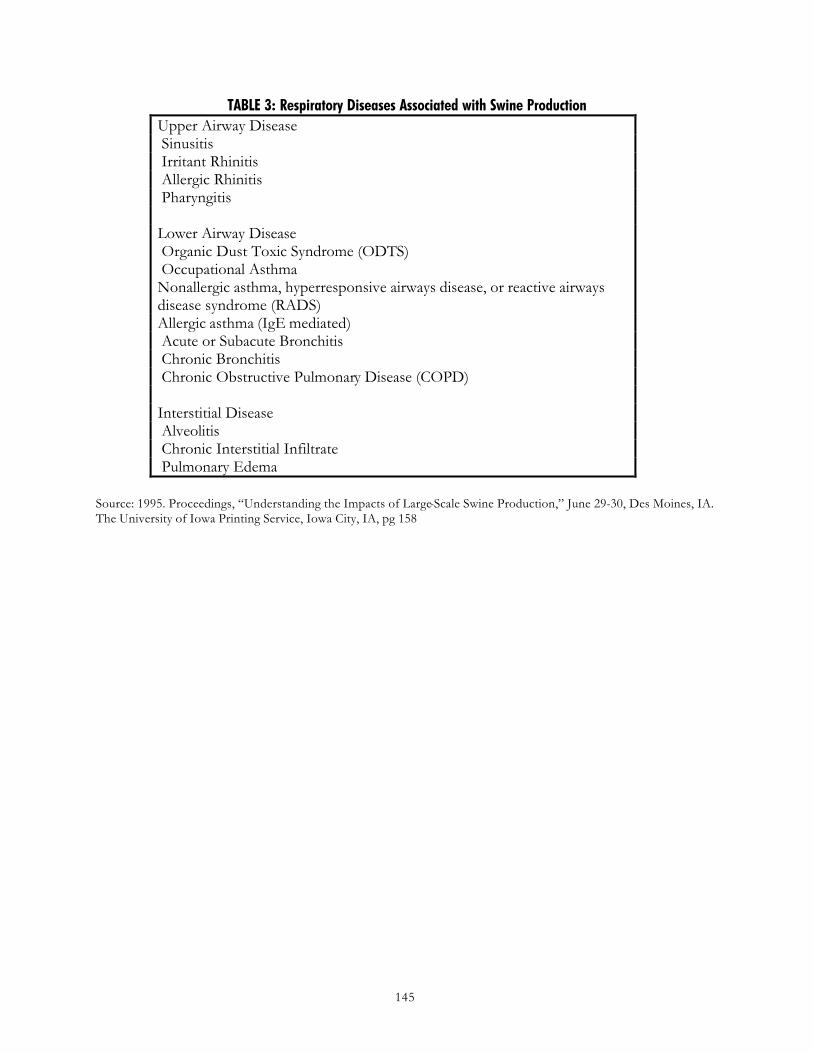
145
TABLE 3: Respiratory Diseases Associated with Swine Production Upper Airway Disease Sinusitis Irritant Rhinitis Allergic Rhinitis Pharyngitis Lower Airway Disease Organic Dust Toxic Syndrome (ODTS) Occupational Asthma Nonallergic asthma, hyperresponsive airways disease, or reactive airways disease syndrome (RADS) Allergic asthma (IgE mediated) Acute or Subacute Bronchitis Chronic Bronchitis Chronic Obstructive Pulmonary Disease (COPD) Interstitial Disease Alveolitis Chronic Interstitial Infiltrate Pulmonary Edema
Source: 1995. Proceedings, “Understanding the Impacts of Large-Scale Swine Production,” June 29-30, Des Moines, IA. The University of Iowa Printing Service, Iowa City, IA, pg 158

147
Chapter 7. Social and Community Impacts
Jan L. Flora (lead co-author)
Professor Department of Sociology
Extension Community Sociologist Iowa State University
Carol J. Hodne
(lead co-author) Postdoctoral Research Fellow
Environmental Health Sciences Research Center University of Iowa
Willis Goudy
University Professor Department of Sociology
Iowa State University
David Osterberg Associate Professor
Department of Occupational and Environmental Health University of Iowa
James Kliebenstein
Professor, Department of Economics Iowa State University
Kendall M. Thu
Assistant Professor Department of Anthropology Northern Illinois University
Shannon P. Marquez Associate Professor
Department of Occupational and Environmental Health University of Iowa
148
Introduction The impacts of Concentrated Animal Feeding Operations (CAFOs) should be judged in terms of their socioeconomic impacts on rural Iowa and its communities as well as their impacts on human and animal health. Regulations and management practices should support socially and economically desirable community outcomes, as well as protect human and animal health. It is the role of government to select from among the regulatory options that contribute to economically viable, socially equitable, and environmentally sound communities (President’s Council on Sustainable Development, 1996). 7.1 Quality of Life and Community Social Capital Quality of life factors are emphasized in recent literature addressing the community impacts of CAFOs. The state of Minnesota recently brought together the scientific and public policy communities to advise state government on how to address several CAFO issues, resulting in a Generic Environmental Impact Statement (GEIS) for animal agriculture. It suggests, “Quality of life is related to perceptions of 1) having alternatives in what one does on a daily or life cycle basis, and 2) being respected by family and communities of interest and place.” (Flora et al., 1999:A24). An important aspect of community quality of life is social capital, which includes mutual trust, reciprocity, and shared norms and identity. In general, communities with greater social capital provide greater quality of life (Flora, 1998; Flora, Sharp, Flora, Newlon, 1997; Sharp, Agnitsch, Ryan, Flora, 2001). Also, social capital emerges as an internal resource in instances of controversies. 7.1.1 Agricultural Structure, Quality of Life, and Economic Vitality Quality of life issues related to the structure and scale of agriculture were examined as early as the 1940's. More than half a century ago, Goldschmidt (1978; originally published in 1946) compared two rural California communities where the structure and size of farms were different, but where total value of farm production was almost identical. In the town where farms were larger and industrialized (with a higher proportion of absentee ownership and employing a higher proportion of farm workers per unit of output) there was greater separation of social classes, i.e. greater social inequality. More decisions about local affairs were made outside the community. This contrasted with the other community where farms were smaller, more likely to be owner operated, and utilized the labor of the operating family with some hired labor. This community had a richer civic and social fabric: residents of all social classes were more involved in community affairs, more community organizations served people of both middle and working class background, and there were more local businesses and more retail activity because more agricultural and consumer purchases were made locally and more income was in the hands of the classes with a greater propensity to spend. MacCannell, in a macro study that included family-farm and industrial-agricultural communities in 98 industrial-farm counties in California, Arizona, Texas, and Florida, found that mean farm size (in acres), gross farm sales, as well as high levels of mechanization “significantly predict declining community conditions not merely at the local agricultural community level, but in the entire county.” (1988, p. 63.) Recent studies, including those in the Midwest, reveal tendencies of economic decline in communities with greater concentration of CAFOs, similar to Goldschmidt’s thesis of greater rural community decline with greater industrialization of agriculture. The econometric analysis conducted by Gomez and Zhang (2000) over a decade revealed the negative impact of swine CAFOs on economic growth in rural Illinois counties, as indicated
149
by sales tax receipts. They found that purchases from small businesses declined as concentration of CAFOs intensified. In a Michigan study, Abeles-Allison and Connor (1990) found that local purchases of supplies for swine production decrease as CAFO concentration increases. Local expenditures per hog were calculated at $67 for the small farms and $46 for the large farms. The difference is largely due to bulk feed purchases from outside the community by the larger farms, but is also related to somewhat greater total expenditures per hog on the smaller farms. Durrenberger and Thu’s (1996) finding that increased food stamp utilization is associated with industrialized hog production in Iowa suggests either that industrial agriculture generates inequalities or that industrial agriculture thrives in counties with greater inequalities Foltz, Jackson-Smith and Chen (2000) examined local purchasing patterns of large and small dairy farms in Wisconsin. They found that the percent of dairy feed purchased locally declined as herd size increased. Stronger indicators of local feed purchasing were the physical nearness to and social attachment to the community. In Minnesota, Chism and Levins (1994) found that local spending was not related to gross sales volume on crop farms. However, local farm-related expenditures fell sharply when the scale of livestock operations increased. Otto, Swenson, and Lawrence (cited in Kliebenstein, 1998) found that local property tax revenues and state revenues in Iowa, calculated on a per sow basis, were as follows:
Table 7.1. Net Benefits And Net Revenues To Local And State Governments From Farrow To Finish Operations, Iowa
Size of operation 150 sows 300 sows 1,200 sows 3,400 sows Net Local Government Benefit per sow
$8.84 $9.35 $10.43 $8.23
Net revenues to State Government per Sow
$16.01 $17.19 $14.59 $12.86
Sum of local and state revenues
$24.85 26.54 $25.02 $21.09
Overall, more moderate-sized farrow-to-finish operations generated more local and state revenues per sow than did small or very large ones. Quality of life issues that relate to agricultural structures are evident in Eastern North Carolina. This region experienced a tremendous growth in the hog industry beginning in the 1980's that includes both contract and corporate production facilities and meatpacking plants. Many citizens there perceive that this ha s left them with a power structure in which the interests of large pork producers dominate those of local residents at all levels of government (McMillan and Schulman, 2001; Thu and Durrenberger, 1994). In North Carolina, Wing, Cole, and Grant (2000) have found patterns of disproportionate siting of corporate CAFOs in rural lower-income and African-American communities. This places residents of these communities at disproportionate risk for health and socioeconomic problems. 7.1.2 Quality of Life, Community Social Capital and Community Conflict Wing and Wolf’s (2000) study of 50-55 individuals from each of three North Carolina rural communities showed that quality of life was greatly diminished among who residents near a
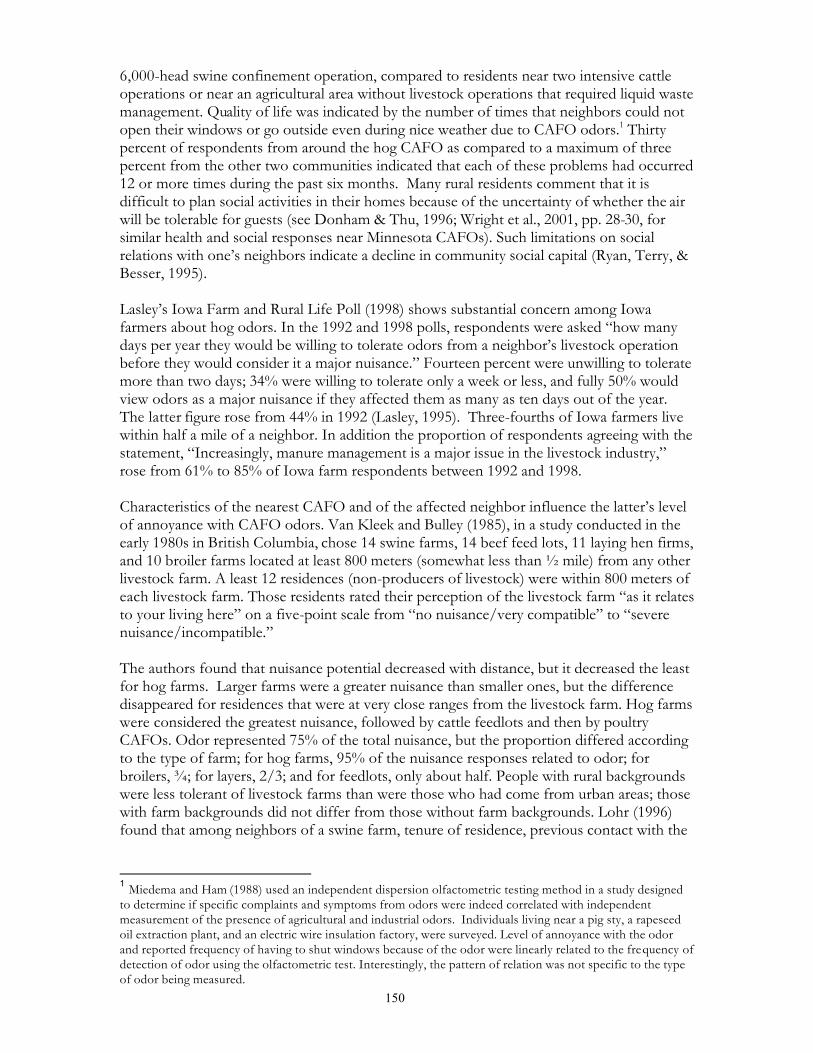
150
6,000-head swine confinement operation, compared to residents near two intensive cattle operations or near an agricultural area without livestock operations that required liquid waste management. Quality of life was indicated by the number of times that neighbors could not open their windows or go outside even during nice weather due to CAFO odors.1 Thirty percent of respondents from around the hog CAFO as compared to a maximum of three percent from the other two communities indicated that each of these problems had occurred 12 or more times during the past six months. Many rural residents comment that it is difficult to plan social activities in their homes because of the uncertainty of whether the air will be tolerable for guests (see Donham & Thu, 1996; Wright et al., 2001, pp. 28-30, for similar health and social responses near Minnesota CAFOs). Such limitations on social relations with one’s neighbors indicate a decline in community social capital (Ryan, Terry, & Besser, 1995). Lasley’s Iowa Farm and Rural Life Poll (1998) shows substantial concern among Iowa farmers about hog odors. In the 1992 and 1998 polls, respondents were asked “how many days per year they would be willing to tolerate odors from a neighbor’s livestock operation before they would consider it a major nuisance.” Fourteen percent were unwilling to tolerate more than two days; 34% were willing to tolerate only a week or less, and fully 50% would view odors as a major nuisance if they affected them as many as ten days out of the year. The latter figure rose from 44% in 1992 (Lasley, 1995). Three-fourths of Iowa farmers live within half a mile of a neighbor. In addition the proportion of respondents agreeing with the statement, “Increasingly, manure management is a major issue in the livestock industry,” rose from 61% to 85% of Iowa farm respondents between 1992 and 1998. Characteristics of the nearest CAFO and of the affected neighbor influence the latter’s level of annoyance with CAFO odors. Van Kleek and Bulley (1985), in a study conducted in the early 1980s in British Columbia, chose 14 swine farms, 14 beef feed lots, 11 laying hen firms, and 10 broiler farms located at least 800 meters (somewhat less than ½ mile) from any other livestock farm. A least 12 residences (non-producers of livestock) were within 800 meters of each livestock farm. Those residents rated their perception of the livestock farm “as it relates to your living here” on a five-point scale from “no nuisance/very compatible” to “severe nuisance/incompatible.” The authors found that nuisance potential decreased with distance, but it decreased the least for hog farms. Larger farms were a greater nuisance than smaller ones, but the difference disappeared for residences that were at very close ranges from the livestock farm. Hog farms were considered the greatest nuisance, followed by cattle feedlots and then by poultry CAFOs. Odor represented 75% of the total nuisance, but the proportion differed according to the type of farm; for hog farms, 95% of the nuisance responses related to odor; for broilers, ¾; for layers, 2/3; and for feedlots, only about half. People with rural backgrounds were less tolerant of livestock farms than were those who had come from urban areas; those with farm backgrounds did not differ from those without farm backgrounds. Lohr (1996) found that among neighbors of a swine farm, tenure of residence, previous contact with the
1 Miedema and Ham (1988) used an independent dispersion olfactometric testing method in a study designed to determine if specific complaints and symptoms from odors were indeed correlated with independent measurement of the presence of agricultural and industrial odors. Individuals living near a pig sty, a rapeseed oil extraction plant, and an electric wire insulation factory, were surveyed. Level of annoyance with the odor and reported frequency of having to shut windows because of the odor were linearly related to the frequency of detection of odor using the olfactometric test. Interestingly, the pattern of relation was not specific to the type of odor being measured.
151
farmer, and economic dependence on farming all negatively correlated with the degree of odor annoyance. Debate continues, in popular and academic circles, on whether CAFO odors are best characterized as primarily nuisances of varying degrees or whether these odors are also linked to negative health outcomes (Thu, 1998). Donham (2000) describes possible non-toxic mechanisms for CAFO odors to generate physical symptoms through complex interactions of the brain and somatic systems. Shusterman (1992) describes some of these mechanisms in his review of the health impacts of environmental odor pollution. The well-researched linkage of physical symptoms to the uncontrollability of various stressors including environmental stressors (e.g., noise) may be applicable to CAFO odors as noted in Chapter 6.3. In addition, the variety of family, neighborhood, and community stressors sometimes associated with CAFOs may also generate stress-induced symptoms and illness. However, these possible linkages have not yet been reported. All sides of CAFO controversies tend to frame their issues and identities in terms of rights and entitlements, as described in McMillan and Schulman’s (2001) research on the hog industry in North Carolina. For example, producers defend their property rights and a right to earn a living from their land, while neighbors defend their right to enjoy their own property. De Lind (1995) documents that in response to local opposition to a corporate CAFO or “hog hotel” in Parma township in Michigan, the Farm Bureau, the Pork Producers Council, and other agricultural interests defended the right of “hog hotels” to exist without regulation by appealing to the right to farm. Constance and Bonanno (1999) document actions of anti-CAFO groups in the Texas Panhandle. They focus on episodes of resistance carried out by local residents and environmental groups who were mainly motivated by human health and property value concerns. Corporate responses to community resistance primarily involved reconstruction of their corporate image as environmentally friendly. A decline in social capital is associated with swine CAFOs, according to rural residents of Iowa, North Carolina, Minnesota, Michigan, and Missouri who describe violations of core rural values of honesty, respect, and reciprocity, as reported in an interdisciplinary workshop held in Iowa on swine CAFOs (Thu et al., 1995, p. 76). For example, CAFO neighbors often consider it a violation of respect when their concerns are labeled as emotional, perceptual, and subjective or are dismissed as invalid or unscientific. Recent findings are presented by Kleiner, Rikoon and Seipel (2000), who found that in two northern Missouri counties where large-scale corporately owned swine CAFOs are dominant, citizens expressed more negative attitudes regarding trust, neighborliness, community division, networks of acquaintanceship, democratic values, and community involvement. The county that was dominated by independently owned swine operations had the most positive attitudes regarding trust, neighborliness, community division and networks of acquaintanceship. The siting of a swine confinement facility in Parma, Michigan in the mid-80s (DeLind 1995, 1998) generated conflict when the firm established a five-unit CAFO with manure lagoons. Neighbors believed the three open-air 42 million gallon lagoons compromised their health and quality of life. Local resistance culminated in the emergence of two grassroots organizations and a four-year litigation process. Consequences of this conflict were anger on the part of residents who believed that their environment and their integrity had been
152
violated, resentment towards public officials, polarization within the community, vandalism, alienation, and verbal threats and physical aggression by both sides. Although the opponents of the CAFO won the battle on the local level (the CAFO went bankrupt), when they were interviewed a few years later, they felt the personal acrimony and divisions in the community resulting from conflict over the smell from the lagoons were too high a price to pay. Wright et al. (2001) reported results from a six-county study in southern Minnesota regarding changes in animal agriculture. Over one hundred producers, community leaders, and others were interviewed, either in roundtable discussions or individually. Three patterns reflect the decline of social capital that resulted from the siting of CAFOs in all six rural communities: 1) widening gaps between farmers who produce livestock within CAFOs and their neighbors, including non-CAFO livestock producers; 2) harassment of vocal opponents of CAFOs; and 3) perceptions by both CAFO supporters and opponents of hostility, neglect or inattention by public institutions that resulted in perpetuation of an adversarial and inequitable community climate. The North Central Regional Center for Rural Development (1999) examined recent, dramatic increases in corporate hog production and meatpacking in a rural Oklahoma county. Social capital indicators measured mutual trust, reciprocity, and shared norms and identity. Individual security was measured in terms of crime, and community conflict was measured in terms of civil court cases. The overall crime rate increased drama tically between 1990 and 1997. Violent crimes increased 378 percent compared to the average 29 percent decrease in violent crimes over the same period in comparison farming-dependent counties with no dramatic changes in animal agriculture. Theft-related crimes also increased in the case county by 64 percent, compared to a decrease of 11 percent in comparison counties. Civil court cases, indicating community conflict, increased in the county by 7 percent, while they decreased 11 percent in comparison counties. This study dramatically reveals the costs to social capital in counties experiencing rapid and dramatic change in the structure of animal agriculture. 7.2 Agricultural Restructuring and Population Trends The primary purpose of this section is to provide background for partially answering Director Vonk’s question 4: “What do you think should be done to address any other emerging issues with respect to industrial CAFOs in Iowa?” It is useful to begin with a discussion of rural population patterns in Iowa since the beginning of WWII. That is followed by an examination of recent changes in the structure of animal agriculture (and crop agriculture insofar as it interacts with animal agriculture) and how public policy relates to those changes. The general trends in livestock and poultry production are presented in Chapter 2. 7.2.1 Rural Population Dynamics since WWII Agricultural restructuring since the initiation of WWII transformed the landscape of rural Iowa. As a result, Iowa’s rural population generally has decreased across the decades. Using a definition of rural as an incorporated place with fewer than 2,500 residents plus those who live on farms or in the open country, Iowa had about 1,454,000 rural residents in 1940 and 1,094,000 in 1990. Although final figures are not available from the 2000 census, it appears that a slight increase occurred in Iowa’s rural population in the 1990s. Major differences have emerged among three sectors—residents of farms, small towns, and the country. The
153
first of these dropped substantially2, the second remained much the same3, and the third grew substantially4 across the decades. Small towns tend to have the oldest age structure of the three types; that is, that have proportionately greater numbers of older and fewer numbers of younger residents than do the farm or country categories. This is because many older residents do not move in later life (or if they do change residences, they move from the countryside to nearby towns) and many high school graduates seek urban-based educational and occupational opportunities. This loss of youth is later magnified as they form families elsewhere. The farm population approaches a pyramidal shape, in part because many older residents move from the farm in later life; some others stay on the farmstead but no longer operate the farm (which may be absorbed into a neighbor’s farm operation). Of the three groups of rural residents, the country population most closely approaches the classical pyramidal age structure. It includes younger residents with children. Country residents often are newcomers to the area; they may have perspectives that differ from those held by long-term residents. It is not easy to categorize country residents because of their more diverse origins and backgrounds. 7.2.2 Restructuring of Livestock Production in the Past Decade Until the past decade or so, the industrialization of farm production had largely bypassed Iowa, with the exception of the fat cattle industry, which had its heydey in Iowa in the 1950s and 1960s (see Table 2.9 in this report). In the 1990s, Iowa hog and poultry (particularly egg) production were transformed (see Chapter 2, Table 3 of this volume). Furthermore, different types of animal production systems may generate different socioeconomic impacts at the level of the farm and community. Farmers, rural residents, and others express concern that increasing CAFO production is having negative impacts on the traditional family farm structure (e.g., Halverson, 2000). Buttel and Jackson-Smith (1997) surveyed 1,100 randomly selected Wisconsin farmers in 1995 and repeated the survey with 1400 farmers in 1999 (Jackson-Smith, et al., 2000) regarding their views toward large-scale livestock production. Only 17 percent of the respondents perceived expansion in the livestock industry as a good initiative, while 45 percent perceived it to be negative. Only 15 percent indicated that non-farm investors should invest in dairying in the local community (Buttel and Jackson-Smith, 1997). Results were similar in 1999. Wisconsin farmers’ views towards livestock expansion were not shaped primarily by concerns about the environment but instead by concerns about farm structure in their state. Farmers’ responses indicated strong support for family-scale operations as opposed to large-scale farms using hired labor-type and to investor-owned dairy operations.5 The authors
2 Number of persons resident on farms has declined across many censuses. Since 1940, when 917,000 lived on farms, Iowa lost at least 120,000 farm people each decade to 1990, when 257,000 were counted, the most recent data available (the 2000 farm population will be released later in 2002). The number of farms in Iowa decreased from about 213,000 farms in 1940 to 91,000 in 1997. 3 Small towns (fewer than 2,500 inhabitants) contained about the same number of residents in 1990 (460,000) as they held in 1940 (471,000). From 1990 to 2000, 464 of the 829 towns with fewer than 2,500 residents in 1990 increased in size. Only among the smallest-sized category—places with fewer than 100 residents in 1990—did a majority of towns decline in population. 4 About 66,000 country residents were counted in 1940 and 377,000 in 1990. In 1990, for the first time, country residents outnumbered farm residents in Iowa. Strong increases among country residents have occurred in each decade for which data are available. Gains among country residents tended to occur across counties regardless of the trends among farm or small-town residents. 5 The Iowa Farm and Rural Life Poll (Lasley 1999) has not asked questions that get as directly to views of the structure of agriculture, but they appear to hold similar views. In the 1999 poll, over half of farmers
154
concluded that the bulk of the farmers who oppose livestock expansion do so because of a strong concern that it would erode the status of family farming in the state. The increasing production of hogs through contract relationships, following that of poultry (Morrison, 1998), is becoming central to socioeconomic, health, and environmental concerns regarding CAFOs. One reason that agribusiness firms contract with producers, or contract with intermediary firms who subsequently contract with producers is to gain greater control over the production process (Welsh 1997), moving decision-making from the farm level to higher levels in the vertical system. Rarely do poultry growers own the birds they raise, and the pork industry appears to be moving in that direction (Morrison, 1998). Among major livestock production systems, cow-calf operations remain the most staunchly controlled at the farm-level. In Kentucky the fulcrum of recent agricultural policy debate has been a proposed joint liability provision within state regulations. This provision would make corporations that retain ownership of animals (integrators) and the growers who raise animals jointly liable for resultant environmental damages or production facility closings. Burmeister (2000) suggests this joint liability provision reflects a societal attempt to control the social risk of changes in animal agriculture. Research on the social/community impacts of different forms of contracting versus spot markets is scarce. For example, there has been no systematic research on animal producers who lose production contracts. Certain contract livestock producers are organizing to gain more regulatory and contractual protection (Hamilton, 1995; Roth, 1995). Whether such protection will generate substantial socioeconomic and environmental benefits to these producers and their communities may be measurable in the future. Contract farming, while seen by some livestock growers as their best available option for remaining in farming, is problematic for others. In 1999, 70 percent of Iowa farmers favored greater regulation of contracts in farming (Lasley, 1999). Other alternatives should be encouraged—particularly ones that are compatible with changes in consumer demands and with environmental quality. A growing proportion of consumers are concerned about sub-therapeutic use of hormones (as discussed in the Executive Summary), humane treatment of animals6, and the health and well being of producers. The socioeconomic, health, and ecological benefits of sustainable methods of agricultural production, including pork production as described by Ikerd (1998), are gaining recognition. For example, Lyson and Barham’s (1998) found evidence of greater sustainability of middle-size, family farm operations over large-scale, corporate farms. They used measures of profitability, decreased
responding strongly agreed with the statement, “There is too much economic power concentrated in a flew large agribusiness firms, and when the “agreed” category, the proportion agreeing rises to nine in ten farmers. The percentage agreeing with the statement, “If things continue as they are now, in a few years farmers will be treated like employees on their own farms,” was only modestly lower (46% and 85%, respectively). 6 In an unpublished survey conducted by the Animal Industry Foundation in 1989 nearly 80 percent of those polled supported current practices of farm animal treatment (cited in Ohlendorf, Jenkins and Tomazic, forthcoming). But in the same survey two-thirds of those polled were in favor of increased regulation of production practices. Following up on this data, Ohlendorf et al. asked more than 2,700 consumers whether they agreed or disagreed with the statement “I would be willing to pay more for meat if it meant more humane treatment of farm animals.” While 23 percent of those surveyed were undecided, one-half of all respondents agreed with the statement. There is no significant variation in agreement with this more pro-animal attitude across economic classes. This is at odds with the prevalent notion that consumer concern is much more different socioeconomic groups would be willing to pay.
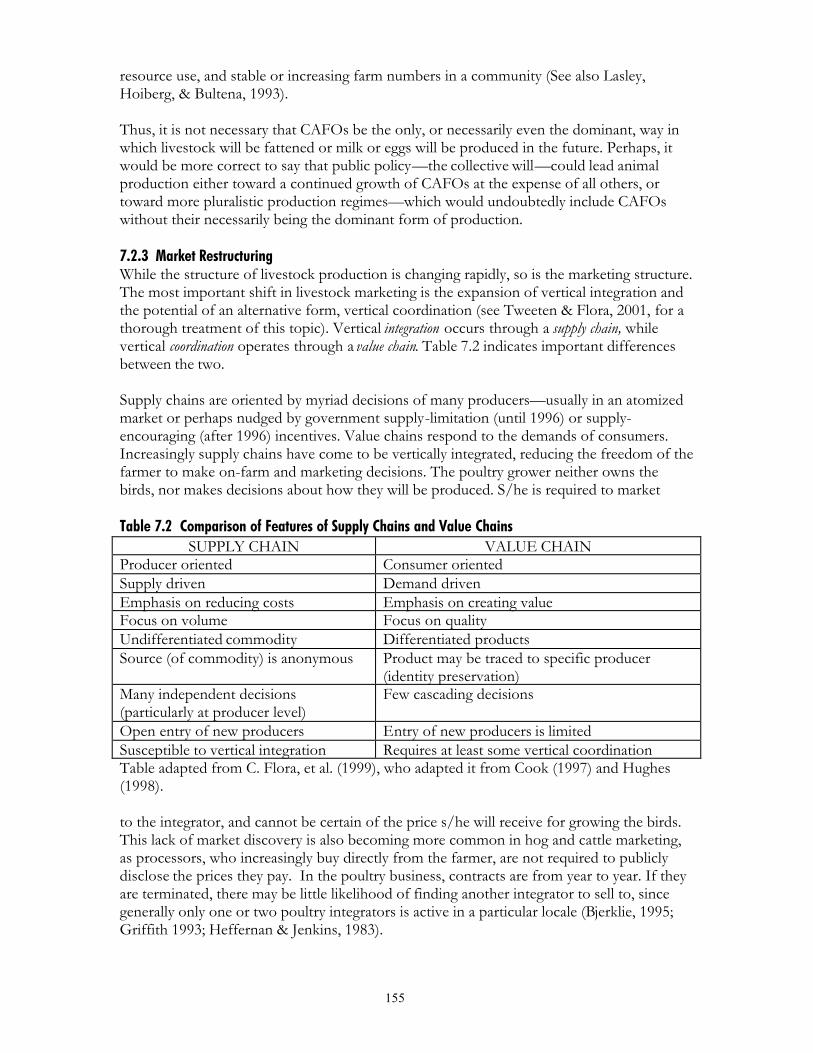
155
resource use, and stable or increasing farm numbers in a community (See also Lasley, Hoiberg, & Bultena, 1993). Thus, it is not necessary that CAFOs be the only, or necessarily even the dominant, way in which livestock will be fattened or milk or eggs will be produced in the future. Perhaps, it would be more correct to say that public policy—the collective will—could lead animal production either toward a continued growth of CAFOs at the expense of all others, or toward more pluralistic production regimes—which would undoubtedly include CAFOs without their necessarily being the dominant form of production. 7.2.3 Market Restructuring While the structure of livestock production is changing rapidly, so is the marketing structure. The most important shift in livestock marketing is the expansion of vertical integration and the potential of an alternative form, vertical coordination (see Tweeten & Flora, 2001, for a thorough treatment of this topic). Vertical integration occurs through a supply chain, while vertical coordination operates through a value chain. Table 7.2 indicates important differences between the two. Supply chains are oriented by myriad decisions of many producers—usually in an atomized market or perhaps nudged by government supply-limitation (until 1996) or supply-encouraging (after 1996) incentives. Value chains respond to the demands of consumers. Increasingly supply chains have come to be vertically integrated, reducing the freedom of the farmer to make on-farm and marketing decisions. The poultry grower neither owns the birds, nor makes decisions about how they will be produced. S/he is required to market Table 7.2 Comparison of Features of Supply Chains and Value Chains
SUPPLY CHAIN VALUE CHAIN Producer oriented Consumer oriented Supply driven Demand driven Emphasis on reducing costs Emphasis on creating value Focus on volume Focus on quality Undifferentiated commodity Differentiated products Source (of commodity) is anonymous Product may be traced to specific producer
(identity preservation) Many independent decisions (particularly at producer level)
Few cascading decisions
Open entry of new producers Entry of new producers is limited Susceptible to vertical integration Requires at least some vertical coordination Table adapted from C. Flora, et al. (1999), who adapted it from Cook (1997) and Hughes (1998). to the integrator, and cannot be certain of the price s/he will receive for growing the birds. This lack of market discovery is also becoming more common in hog and cattle marketing, as processors, who increasingly buy directly from the farmer, are not required to publicly disclose the prices they pay. In the poultry business, contracts are from year to year. If they are terminated, there may be little likelihood of finding another integrator to sell to, since generally only one or two poultry integrators is active in a particular locale (Bjerklie, 1995; Griffith 1993; Heffernan & Jenkins, 1983).
156
The processor has typically controlled vertical integration, but increasingly retailers7 are gaining the balance of power in the food supply chain. Vertical coordination has the potential to be more collaborative and decentralized. Value chains are more amenable to a team approach, since flexibility in production is essential if production is to respond to changing consumer preferences. Farmers have little power under vertical integration, while they may band together to control or share control through vertical coordination. Vertical coordination does not ensure farmer power, but it is certainly amenable to farmers collectively exercising that power—if they are willing to key their production on diverse consumer desires and to devise ways to shorten the supply chain (Tweeten & Flora, 2001). Of course, state and local governments and institutions of higher learning can be helpful with information and linkages, particularly if they address previous constraints to promoting sustainable agricultural practices (Lacy, 1993). At present, hog production—though much more concentrated than it was a decade ago--is much less concentrated than is pork processing.8 Heffernan, Hendrickson, and Gronski, (1999) estimated that in 1998, the fifty largest producers controlled about one half of all marketed hogs, and only one of the top five producers had substantial presence in Iowa. Most states where corporate hog production predominates are states where large numbers of hogs were not produced previously or where farms are smaller and less prosperous. One author argues convincingly that broiler integrators chose to focus on the South precisely because small farmers often were underemployed and desperately needed additional income (Bjerklie, 1995). The degree to which integrated hog contracts in Iowa and other parts of the Midwest are favorable or unfavorable to farmers will depend on the overall vitality of the rural parts of those states. When growers have or perceive they have few other options, they are more likely to sign unfavorable contracts. 7.2.4 Impetus for Alternatives in Production, Processing, and Marketing One means of preserving identity is through shortening the value chain—bringing producer and consumer closer together. Shortening the value chain is important for the development of alternative production systems. Reducing the steps between producer and consumer contributes to quality control. Trust can be substituted for costly inspection systems, and immediate and direct feedback will occur when quality is inadequate. In addition, quality may be redefined in unconventional ways. For instance, the consumer may be willing to forego cuts of meat in uniform and predictable sizes if s/he has assurance that sub-therapeutic hormones are not used, or that animals are treated humanely. If this sounds like each farm family would do its own direct marketing (which often falls to the female partner in a producer family), it does not have to be. A critical piece is socializing the transaction costs involved in identity preservation and quality assurance. This can be accomplished through devising novel collaborative means of marketing and identity preservation that are satisfying to the consumer, but which do not require each producer family to make its own marketing links or to individually organize its own system of quality assurance. Different kinds of producer-controlled or -influenced value chains, such as marketing cooperatives, joint ventures between corporate entities and producer associations, producer-consumer coalitions such as Community Supported Agriculture (CSA) groups 7 Between 1997 and 2000, the market share of the top five food retailers operating in the U.S. rose from 24% to 42%. Hendrickson, et al. (2001) argue that increasingly, market power is shifting from processors to food retail chains. 8 In 1998, the top four pork processors marketed 57% of all hogs in the country. The following year, according to the New York Times, the top six firms processed 75% of all market hogs. In 2001, the largest processor, Smithfield, bought IBP, which had ranked second in 1998 (Heffernan et al., 1999; 16)
157
(Cone & Myhre, 2000), or local marketing cooperatives (Ziegenhorn, 1998) can lift the marketing burden from the shoulders of individual producers. Only with involvement of market (private for-profit firms, including family firms and farms), state (governments at different levels), and civil society (not-for-profit organizations, such as producer organizations, certification entities, etc.) can vertically coordinated value chains compete with vertical integration and supply chains. We often forget just how large a role various levels of government play in subsidizing commodity supply chains and vertically integrated firms within our food system (see North Central Regional Center for Rural Development, 1999: 6-20, for a detailed discussion of the “incentives” used to encourage Seaboard Corporation to build a pork packing plant in Guyman, OK). Which of these factors may influence the future of the livestock industry in Iowa and how might they relate to odor regulation? Clearly, Iowa’s competitive advantage in grain and livestock production is an important element. Some argue that Iowa may regain market share in cattle and hog feeding that has recently been lost to the Great Plains (cattle) and to North Carolina (hogs), given Iowa’s competitive advantage in cheap grains. The 1996 Freedom to Farm Act, by dismantling price supports and the supply management system, encouraged production of corn and soybeans (Harl, 2001). Currently, low grain prices do not encourage farmers to shift to higher value crops, since loan deficiency payments increase as market prices decline. This has encouraged CAFO production in the Midwest where grain is cheap. It has also favored CAFO production over diversified family farming. CAFOs can purchase feed grains at market prices lower than costs to family farmers of feeding their own grain, since market prices have recently been below cost of production for family farmers. Another important factor is the differential contribution of environmental protection to the cost of production by region. All other things equal, the more dense the human population, the greater the cost of environmental protection to the producer—if there are mechanisms for internalizing those costs, rather than their being paid by the society at large. The initial moratorium on building new hog CAFOs in North Carolina and its recent extension suggest that hog odors and water contamination can provide the political impetus for internalizing these costs in heavily populated areas. Should the Environmental Protection Agency increase the amount of land that is required for disposal of manure because of concern about excess phosphorus application, production in Iowa would be favored over North Carolina, although Iowa might be disadvantaged vis-a-vis the Great Plains. Policy makers’ consideration of alternative means of regulating odors must take into account which farmers are disadvantaged by the regulations and what those regulations may mean in terms of encouraging certain desired futures for rural Iowa—and Iowa in general. In this section we have provided evidence that industrialized commodity production and corporate controlled supply chains are not the only alternative. Regulation of odors and other airborne products should take into account various options, and encourage those that are more socially desirable.
158
7.3 Changes in Property Values In the next section we consider changes in animal agriculture as they relate to the final form of community capital - financial capital. Several studies examine effects of nearness to a CAFO on real estate values. Abeles-Allison and Conner (1990) chose eight Michigan hog CAFOs and then examined residential sales within a five-mile square block centered on each CAFO. They analyzed data on 288 sales between 1986 and 1989. For every thousand hogs added in the five-mile area, they found an average drop in sale price of $430 per property. The depression of sale price was much greater when the residential property was less than 1.6 miles away from the respective hog farm. Using state-wide data, they found, for the first half of 1989, that odor complaints were 50 times more likely to be lodged against any particular hog CAFO of over 500 head than against smaller hog operations. Palmquist, Roka, and Vukina (1997) studied residential property values close to hog CAFOs in North Carolina. Controlling for other characteristics of the property, they examined patterns of non-farm home sales prices (n=237) over an 18-month period in 1992 and 1993. They found that nearness to large hog CAFOs and the amount of nearby manure jointly acted as a significant depressor of sales prices of up to nine percent, depending on the number of hogs and their distance from the house. Phillips et al. (1999), suggest that odors cannot be separated from other local effects from CAFOs that could also depress sales prices. These could be noise, dust from trucks, or a general decline in the natural beauty of the area. Hamed, Johnson, and Miller (1999) found that an average vacant parcel within three miles of a CAFO in Missouri lost about 6.6% in value, but if a parcel with a house on it was within 1/10 mile of the CAFO, it lost 88% of its value! Finally, Taff, et al., (1996) examined housing sale prices in two counties of southwestern Minnesota. The measures used to indicate feedlot proximity included distance, total animal units within a defined distance, and whether the home was downwind from any feedlots. Feedlot proximity was associated with higher sales prices. The authors suggest that perhaps workers desired to live close to their work. 7.4 Impact on Social and Health Services While not examined here, studies of broader changes taking place in agriculture link housing, public services, natural resources and land use, and historical and cultural resources to the changing structure of animal agriculture. These changes are also reflected in the examples related specifically to animal agriculture. NCRCRD research in Oklahoma (1999) found that housing rental rates increased nearly 85 percent over seven years in the county where production and meatpacking expansion occurred, compared to a 61 percent increase in comparison counties. At the same time, the influx of new workers resulted in a 47 percent decrease in housing availability. The combined result is overcrowding and shared housing situations, or a commute to neighboring counties with available and more affordable housing. These commuting costs add to the household costs of workers. Of course, the housing industry, among others, benefits from such growth. The same research notes important implications for local educational systems. While total school enrollment increased 12 percent, resulting in construction of a new elementary school, there was a 125 percent increase in the number of bilingual or limited English speaking students. Despite an 81 percent increase in the county school budget between 1990
159
and 1997, both dropout rates and student/teacher ratios increased. Community costs due to increased demand on services, such as court costs from increased criminal and civil cases; law enforcement costs, and applications for public assistance and food stamps were also noted. Other research points to additional costs of large-scale animal production to community resources: impacts on tourism and recreation due to livestock odors (McMillan & Schulman 2001); deterioration of bridges and hard surface roads (Constance 2000); and significant changes in rural landscapes and the number and condition of farm sites (Bowen 2000). In 1990, the minority population accounted for about 4 of every 100 Iowans (4.1%); by 2000, that figure had increased to more than 7 of every 100 (7.4%). The minority population grew by 103,000 while the (white non-Hispanic) majority increased by 47,000 during the 1990s. For the first time, a significant portion of that growth in minority population occurred outside Iowa’s metropolitan areas. These new Iowans were mainly attracted by jobs in meatpacking, and secondarily, in plant nurseries, construction, and certain low-wage service jobs. While we were unable to find data on the extent of employment of immigrants and other minority groups in CAFOs in Iowa, it is clearer that industrial agriculture (packing plants in particular) employs a growing number of new residents who are culturally different from the long-term residents of rural Iowa (see Grey, 1997, 1998). Turnover in packing plant employment and hence in population (rather than presence of minority groups, per se) contributes to a number of social problems and a need for more local services, but it also brings in young, hard working, entrepreneurial (especially immigrant) families, shoring up the base of population pyramids and offering a larger working age population for years to come in certain communities that before the 1990s were aging steadily. Whether long-term residents and leadership in these communities will see these new residents as a gift or as a threat is still to be seen. 7.5 Concluding Remarks Generally, Iowa’s rural areas have had more difficulty holding their populations than have urban sections of the state. With more deaths than births9 and greater out- than in-migration, some of these counties have had problems sustaining their populations. The encouraging news is that the only decade in the 20th century during which Iowa had more people enter than leave was the 1990s; net in-migration totaled about 50,000. Even in that case, however, 43 of Iowa’s 99 counties had more residents leaving than entering in the 1990s. Although there were some major exceptions, rural counties were more frequently listed among those 43 with net out-migration than were urban counties. If this migration turnaround is to be sustained, additional attention needs to be given to issues of quality of life. That means that the physical environment, the quality and diversity of services (particularly health and educational services), and employment opportunities will need attention. If jobs are not available, it is unlikely that others will move to the area unless 9 In 2000, 48 counties had more deaths than births (called net natural decrease) and most were rural; only a few had an incorporated place with at least 10,000 residents. Due to the out-migration of younger people from many rural counties and the tendency of older residents to age in place, a declining proportion of the population is in the reproductive age groups. Hence, in recent decades, the number of counties experiencing net natural decrease has gradually grown. In Iowa as a whole, however, about 100,000 more births than deaths occurred throughout the 1990s.
160
natural and social amenities provide the premium that would attract them. Some Iowa counties have physical environments (e.g., rivers, lakes, open space) that attract residents. At present, many of the people moving to such locales already live in the state. And natural amenities are likely to be magnets only for the somewhat more affluent. On the other hand, urban areas are much more likely to benefit from employment-related moves. But then the characteristics of jobs also are related to the residents that they attract; that is, the types of employment that become available dictate at least in part the characteristics of those who will move to an area. To attract residents to a rural area, then, requires the perception tha t such a move may raise the quality of life through improved employment opportunities, and increasingly, access to amenities—both natural and social. Demographic changes have a number of implications for CAFOs and vice versa. While in the 50 years between 1940 and 1990, the farm population dropped at about twice the rate that the (non-farm) country population increased, many residences remain close to livestock operations (Lasley, 1998). Since it appears that for the past decade the gap between farm population decline and the country population may be closing, hog, and perhaps poultry, CAFO odors will be a growing issue among rural dwellers. A related issue that is suggested by the demographic patterns is the potential conflict that CAFOs and industrial agriculture generate between employment and amenities. Those communities where odors and health problems from CAFOs remain or become an issue may have a more difficult time attracting or holding population that would otherwise come because of rural communities being “a good place to live and raise a family.” The amenity scale may go down not simply because of these problems themselves, but because the odor and health issues generates conflict, reducing social capital and the ability of the community to act collectively to enhance local social and natural amenities. Resolving these questions through alternative livestock production methods may make it easier for communities to encourage employment and to increase amenities. For example, a 2001 informal survey of 13 Iowa State University Extension livestock specialists (Honeyman et al., 2001) documented the existence of at least 2100 hoop structures in Iowa, which, with appropriate management practices, can be more environmentally friendly than CAFOs. In conjunction with appropriate marketing structures, other ecological production regimes, such as use of A-frames and rotational pasturing may be feasible. A final set of demographic issues surrounds the health risks and desires for justice expressed by elderly rural residents residing near CAFOs. They often express concern about being at risk for respiratory problems, as well as concern that antibiotic treatments may fail them when needed. The siting of CAFOs near the rural elderly, who are less likely to move in the later years, seems inequitable to some, as does the decline in quality of life for those who have worked productively for many years, including in support of others in their communities.
161
References Abeles-Allison M, Conner L. An analysis of local benefits and costs of Michigan hog operation experiencing
environmental conflicts. Department of Agricultural Economics, Michigan State University, East Lansing (1990).
Bjerklie S. On the horns of a dilemma: The U.S. meat and poultry industry. In Any way you cut it: Meat processing and small-town America (Stull DD, Broadway MJ, Griffith D, eds). Lawrence, KS: University Press of Kansas 41-60 (1995).
Bowen M. Changing patterns of land use in Vermont's northeastern corner. Annual Meeting of the Association of American Geographers, Pittsburgh PA (2000).
Buttel F, Jackson-Smith D. Livestock expansion in Wisconsin: Farmers’ views on the benefits and costs of large-scale livestock production. PATS Research Report #2. Program on Agriculture and Technology Studies. Madison, WI: University of Wisconsin (1997).
Chism JW, Levins RA. Farm spending and local selling: How do they match up? Minnesota Agricultural Economist 676:1-4 (1994).
Cone CA, Myhre A. Community-supported agriculture: A sustainable alternative to industrial agriculture? Human Organization 59:187-197 (2000).
Constance DH. The community impacts of large-scale chicken production in East Texas - final report. Sam Houston State University, Huntsville TX (2000).
Constance DH, Bonanno A. CAFO controversy in the Texas Panhandle region: The environmental crisis of hog production. Culture & Agriculture 21:14-26 (1999).
Cook ML. Organizational structure and globalization: The case of user-oriented firms. In Strategies and Structures in the Agro-Food Industries (Nilsson J, von Dijk G, eds). Assen, The Netherlands: Van Corcum and Company B.V. (1997).
DeLind LB. Parma, a story of hog hotels and local resistance. In Pigs, profits, and rural communities (Thu K, Durrenberger EP eds). State University of New York Press 23-38 (1998).
DeLind LB. The state, hog hotels, and the “right to farm”: A curious relationship. Agriculture and Human Values, 12:34-44 (1995).
Donham KJ. The concentration of swine production: Effects on swine health, productivity, human health, and the environment. Vet Clin North Am: Food Anim Pract 16:559-597 (2000).
Donham K, Thu K. Relationships of agricultural and economic policy to the health of farm families, livestock, and the environment. JAVMA 202:1084-1091 (1992).
Donham K, Thu KM, eds. Proceedings, Understanding the impacts of larg e-scale swine production. Des Moines, IA, June 29-30, 1995. Iowa City, IA, The University of Iowa Printing Service, 71-97 (1996).
Durrenberger EP, Thu KM. The expansion of large scale hog farming in Iowa: The applicability of Goldschmidt’s findings fifty years later. Human Organization 55:409-415 (1996).
Flora CB et al. Technical working paper on social and community impacts. Prepared for the Generic Environmental Impact Statement on Animal Agriculture and the Minnesota Environmental Quality Board (2001).
Flora CB, Carpenter S, Hinrichs C, Kroma M, Lawrence M, Pigg K, Durgan B, Draeger K. A summary of the literature related to social/community. Prepared for the Minnesota Environmental Quality Board by the University of Minnesota (A)(I):A1-A68 (1999).
Flora JL. Social capital and communities of place. Rural Sociology 63:481-506 (1998). Flora JL, Sharp J, Flora C, Newlon B. Entrepreneurial social infrastructure and locally-initiated economic
development. Sociological Quarterly 38:623-645 (1997). Foltz JD, Jackson-Smith D, Chen L. Do Purchasing Patterns Differ Between Large and Small Dairy Farms?
Econometric Evidence from Three Wisconsin Communities." submitted to Agricultural and Resource Economics Review (2000).
Goldschmidt W. Agribusiness and the rural community. In As You Sow: Three Studies in the Social Consequence of Agribusiness. Montclair, NJ: Allenheld, Osmun, and Co. (1978). [First published as Small Business and the Community: A study in Central Valley of California on effects of scale of farm operations. Report of the Special Committee to Study Problems of American Small Business, United States Senate, December 23, 1946, U.S. Government Printing Office, Washington, D.C., 1946.]
Gomez MI, Zhang L. Impacts of concentration in hog production on economic growth in rural Illinois: An econometric analysis. American Agricultural Association Annual Meeting, Tampa FL (2000).
Grey, MA. Meatpacking in Storm Lake, Iowa: A community in transition. In Thu, KM, Durrenberger P. eds. Pigs, profits, and rural communities. Albany, NY: State University of New York Press 57-70 (1998).
Grey, MA. Storm Lake, Iowa and the meatpacking revolution: Historical and ethnographic perspectives on a community in transition. In S. Stromquist and M. Bergman (eds.), in Unionizing the jungles: Essays
162
on labor and community in the twentieth century meatpacking industry. Iowa City: University of Iowa Press 242-261 (1997).
Griffith, D. The poultry industry in the southeast United States. In his Jones’s minimal: Low-wage labor in the United States. Albany, State University of New York Press 83-112 (1993).
Halverson M. The price we pay for corporate hogs. Minneapolis, MN: Institute for Agriculture and Trade Policy (2000).
Hamed M, Johnson T, Miller K. The impacts of animal feeding operations on rural land values. University of Missouri-Columbia Community Policy Analysis Center Report R-99-02 (1999).
Hamilton N. State regulation of production contracts. Memphis Law Review 25: 1051-1106 (1995). Harl NE. Implications of the new farm bill on the structure of agriculture and the safety of the farming
community. Keynote address, Fall I-CASH Meeting, West Des Moines, Iowa (2001). Heffernan WD, Hendrickson M, Gronski R. Consolidation in the food and agriculture system. Report to the
National Farmers Union, Department of Rural Sociology, University of Missouri (1999). Available online at: http://nfu.org/images/heffernan_1999.pdf. (Accessed 12/17/01).
Heffernan WD, Jenkins Q. Comparing quality of life of poultry and beef producers. Paper presented at the Annuial Meeting of the Rural Sociological Society (1983).
Hendrickson M, Heffernan WD, Howard PH, Heffernan JB. Consolidation in food retailing and dairy: Implications for farmers and consumers in a global food system. National Farmers Union 1-22 (2001). Available online at: http://www.nfu.org/images/heffernan.pdf (Accessed 12/17/01).
Honeyman MS, Kliebenstein J, Harmon J, Iowa Hoop Structures used for Swine: A Survey, ASL-R1780. Swine Research Report AS-646. ISU Extension Service, Ames, IA, 2001.
Hughes J, Ralk M, Michels B. Transform your food supply chain: Releasing value in business. London: International Thomson Business Press (1998).
Ikerd, JE. Sustainable agriculture: An alternative model for future pork producers. In The industrialization of agriculture (Royer JS, Rogers RT eds) Brookfield, VT: Ashgate Publishing Co. 265-291 (1998).
Jackson-Smith D, Moon S, Ostrom M, Barham B. Farming in Wisconsin at the end of the century: Results from the 1999 Wisconsin farm poll, Wisconsin Farm Research Summary, Program on Agricultural Technology Studies, University of Wisconsin-Madison, No. 4, March (2000). Available at http://www.wisc.edu/pats/pdf%20documents/poll99.pdf (accessed 2/1/02).
Kliebenstein JB. Economic and associated social and environmental issues with large-scale livestock production systems. Presented at World Bank workshop on Sustainable Intensification of Agricultural Systems: Linking Policy, Institutions and Technology, Ames, Iowa (1998).
Kleiner AM, Rikoon JS, Seipel M. Pigs, participation, and the democratic process: The impacts of proximity to large-scale swine operations on elements of social capital in Northern Missouri communities. Paper presented at the Annual Meeting of the Rural Sociological Society, Washington DC (2000).
Lacy WB. Can agricultural colleges meet the needs of sustainable agriculture? American Journal of Alternative Agriculture 8:40-45 (1993).
Lasley P. Iowa farm and rural life poll: 1995 summary report. Ames, IA: Pm 1628. Iowa State University Extension 1-16 (1995).
Lasley P. Iowa farm and rural life poll: 1998 summary report. Ames, IA: Iowa State University Extension 1-16 (1998).
Lasley P. Iowa farm and rural life poll: 1999 summary report. PM 1801. Ames, IA: Iowa State University Extension 1-12 (1999).
Lasley, P, Hoiberg, E, Bultena G. Is sustainable agriculture an elixir for rural communities? American Journal of Alternative Agriculture 8:133-139 (1993).
Lohr L. Perceptions of rural air quality: What will the neighbors think? Journal of Agribusiness 14 (1996). Lyson, TA, Barham E. Civil society and agricultural sustainability. Social Science Quarterly 79:554-567 (1998). MacCannell D. Industrial agriculture and rural community degradation. In Swanson LE, ed. Agriculture and
community change in the U.S.: The Congressional research reports (pp. 15-75). Boulder, CO: Westview Press (1988).
McMillan M, Schulman MD. Hogs and citizens: A report from the North Carolina front. In Communities of work (Falk W, Schulman MD, Tickamyer A, eds). Athens OH: University Press (forthcoming) (2001).
Miedema HME, Ham JM. Odor annoyance in residential areas. Atmospheric Environment 22:2501-2507 (1988).
Morrison JM. The poultry industry: A view of the swine industry’s future. In Pigs, profits, and rural communities (Thu KM, Durrenberger P. eds.) Albany, NY: State University of New York Press 145-154 (1998).
North Central Regional Center for Rural Development. Bringing home the bacon? The myth of the role of corporate hog farming in rural revitalization. Report to Kerr Center for Sustainable Agriculture, Poteau, OK 1-67(1999). Available at: http://www.kerrcenter.com/RDPP/hog%20report1.pdf. (Accessed 12/17/01.)
163
Ohlendorf GW, Jenkins QAL, Tomazic TJ. Who cares about farm animal welfare? In The social risks of agriculture: Americans speak out on farming, food, and the environment. Ames, IA: Iowa State University Press, in press.
Palmquist R, Roka F, Vukina T. Hog operations, environmental effects, and residential property values. Land Economics 73:14-24 (1997).
Phillips C, Morse GW, Guess-Murphy S, Welle P. A summary of the literature related to external benefits and costs. Prepared by the University of Minnesota for the Minnesota Environmental Quality Board, Generic Environmental Impact Statement on Animal Agriculture: A Summary of the Literature Related to the Social, Environmental, Economic and Health Effects (1):F1-F90 (1999).
President’s Council on Sustainable Development. Sustainable America: A new consensus for the prosperity, opportunity and a healthy environment for the future. Washington, DC: U.S. Government Printing Office, February (1996).
Roth RI. Redressing unfairness in the new agricultural labor arrangements: An overview of litigation seeking remedies for contract poultry growers. University of Memphis Law Review 25:1207-1232 (1995).
Ryan VD, Terry AL, Besser TL. Rural communities, structural capacity, and the importance of social capital,” Presented at the Rural Sociological Society Meetings, Washington, DC, August 17-20 (1995).
Sharp JS, Agnitsch K, Ryan V, Flora J. Social infrastru cture and community economic development strategies: The case of self-development and industrial recruitment in rural Iowa. Under review (2001).
Shusterman D. Critical review: The health significance of environmental odor pollution. Arch Environ Health 47:76-87 (1992).
Taff S, Tiffany D, Weisberg S. Measured effects of feedlots on residential property values in Minnesota: A report to the legislature. Staff Paper 96-12 (1996).
Thu K. Odor problems from large-scale agriculture: Nuisance or public health problem? Health and Environment Digest 12:57-59 (1998).
Thu KM, Durrenberger EP. Industrial agricultural development: An anthropological review of Iowa’s swine industry. Twentieth Annual National Association of Rural Mental Health Conference (1994).
Thu KM, Durrenberger P. eds. Pigs, profits, and rural communities. Albany, NY: State University of New York Press (1998).
Tweeten, LG, Flora CB. Vertical coordination of agriculture in farming-dependent areas. Task Force Report N. 137. Council for Agricultural Science and Technology, Ames, Iowa 1-40 (2001).
Van Kleek, RJ, Bulley NR. An assessment of separation distance as a tool for reducing farmer/neighbor conflict. Proceedings of the Fifth International Symposium on Agricultural Wastes. American Society of Agricultural Engineers. St. Joseph, MI (1985).
Welsh R. Vertical coordination, producer response, and the locus of control over agricultural production decisions. Rural Sociology 62:491-507 (1997).
Wing S, Cole D, Grant G. Environmental injustice in North Carolina’s hog industry. Environ Health Perspect 108:225-231 (2000).
Wing S, Wolf S. Intensive livestock operations, health, and quality of life among eastern North Carolina residents. Environ Health Perspect 108: 233-238 (2000).
Wright W, Flora CB, Kremer KS, Goudy W, Hinrichs C, Lasley P, Maney A, Kroma M, Brown H, Pigg K, Durgan B, Coleman J, Elias Morse D. Technical work paper on social and community impacts. Prepared for the Generic Environmental Impact Statement on Animal Agriculture and the Minnesota Environmental Quality Board (2001)
Ziegenhorn R. An alternative model: Swine production networks in Iowa. In Pigs, profits, and rural communities (Thu KM, Durrenberger P, eds.), Albany, NY: State University of New York Press 170-182 (1998).
164
Chapter 8. Exposure Limits Related to Air Quality and Risk Assessment
Kelley J. Donham, MS, DVM Professor, Department of Occupational and Environmental Health, College of Public Health
The University of Iowa
Peter S. Thorne, MS, PhD Professor, Department of Occupational and Environmental Health, College of Public Health
The University of Iowa
George M. Breuer, PhD, CIH Adjunct Professor
The University of Iowa
Wendy Powers, MS, PhD Assistant Professor, Department of Animal Science, College of Agriculture
Iowa State University
Shannon Marquez, M Eng, PhD Assistant Professor, Department of Occupational and Environmental Health
College of Public Health, The University of Iowa
Stephen J. Reynolds, PhD, CIH, Professor, Department of Environmental Health
Colorado State University
165
Abstract This chapter reviews the literature with regards to health hazard substances emitted from CAFOs. Furthermore, we reviewed the risk assessment process of pertinent federal agencies in regards to hazardous emissions from CAFOs. Occupational health hazards, for those working in CAFOs, have been long recognized. Research documents that current recommended or legal occupational exposure levels are not sufficient to protect workers. Although the research on occupational exposures of CAFO workers documents the hazardous nature of CAFO emissions at concentrations found inside buildings, the concentration of these hazardous substances are much lower in the ambient air of the community surrounding CAFOs. As occupational exposure limit recommendations are not highly relevant to the community, specific exposure standards are needed to help protect community residents as well as workers. Regarding community standards, the risk assessment processes of the Environmental Protection Agency (EPA), and the Agency for Toxic Substances and Disease Registry (ATSDR) are the most relevant agencies in making recommendations for limits to community exposures. The EPA estimates levels safe for a lifetime exposure and ATSDR list levels for acute, intermediate or chronic levels. For ammonia, the EPA list 144 ppb for lifetime exposures and the ATSDR list 500 ppb for acute and 300 ppb for chronic exposure. For hydrogen sulfide, the EPA lists 0.7 ppb for lifetime exposure, and ATSDR lists 70 ppb for acute and 30 ppb for intermediate exposures. Considering these recommendations made by EPA and ATSDR, concentration recommendations, recommendations made in surrounding states, and consideration of the possible additive or synergistic effect of mixed exposures, hydrogen sulfide, ammonia, and odors should be regulated. The levels that should be considered are as follows: hydrogen sulfide, one hour time-weighted average of no more than 15 ppb at the residence or 70 ppb at the property line; ammonia, one hour time-weighted average of no more than 150 ppb at the residence and no more than 70 ppb at the property line; odors should be no more than a 1:7 dilution at the residence and no more than 1:15 at the property line. 8.1 Introduction This chapter will review the scientific literature on exposure limits for occupational and ambient conditions, relative to CAFOs. Also, the relevance of existing standards for the health protection of workers and community residents will be discussed. Furthermore, the circumstances of mixed exposures will be reviewed. Finally, a risk assessment and recommendations for appropriate standards will be discussed. 8.2 Existing Occupational Health Exposure Limits or Recommendations In the US, there are four sources of recommendations in regards to occupational exposure limits. These include the American Conference of Governmental Industrial Hygienists (ACGIH, 2001 TLV’s for Chemical Substances and Physical Agents & Biological Exposures Indices), the American Industrial Hygiene Association (AIHA, AIHA Press, Fairfax VA, 2001), The National Institute for Occupational Safety and Health (NIOSH, Pocket Guide to Chemical Hazards, 1997) and the Occupational Safety and Health Administration (OSHA, Code of Federal Regulations, Chapter 29). The first two organizations (AIHC and ACGIH) are private professional organizations. The third, (NIOSH) is a governmental educational and research organization. OSHA is the only regulatory and
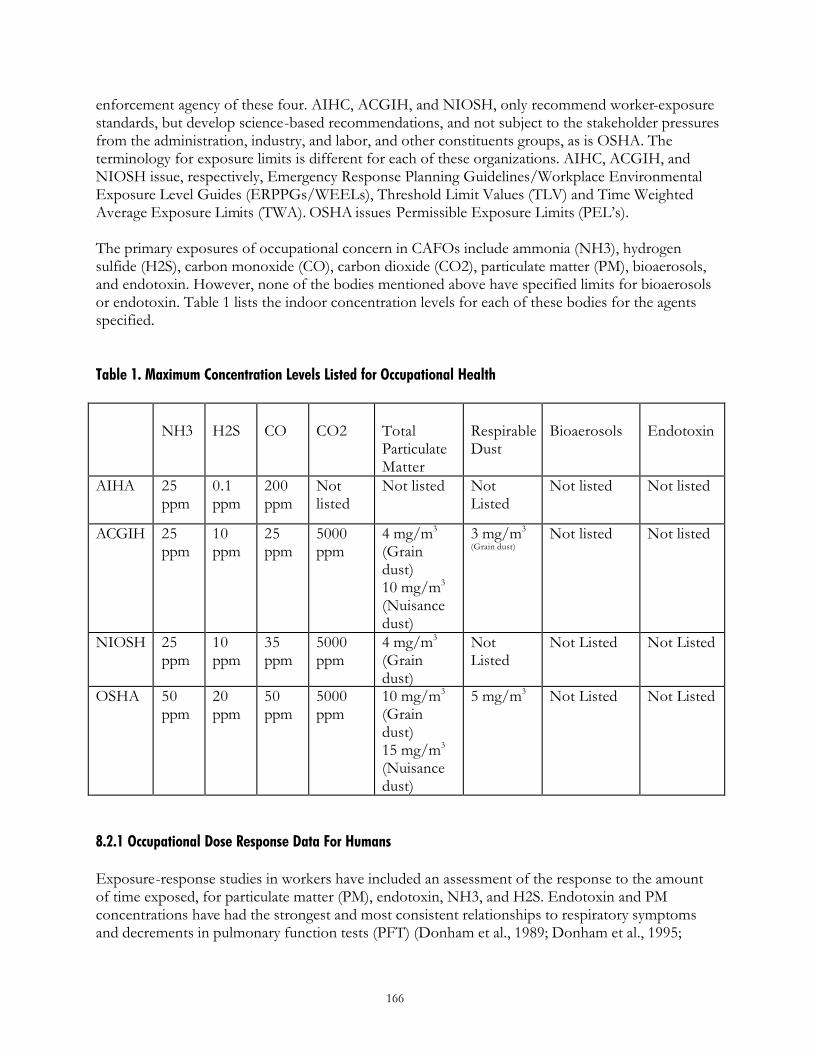
166
enforcement agency of these four. AIHC, ACGIH, and NIOSH, only recommend worker-exposure standards, but develop science-based recommendations, and not subject to the stakeholder pressures from the administration, industry, and labor, and other constituents groups, as is OSHA. The terminology for exposure limits is different for each of these organizations. AIHC, ACGIH, and NIOSH issue, respectively, Emergency Response Planning Guidelines/Workplace Environmental Exposure Level Guides (ERPPGs/WEELs), Threshold Limit Values (TLV) and Time Weighted Average Exposure Limits (TWA). OSHA issues Permissible Exposure Limits (PEL’s). The primary exposures of occupational concern in CAFOs include ammonia (NH3), hydrogen sulfide (H2S), carbon monoxide (CO), carbon dioxide (CO2), particulate matter (PM), bioaerosols, and endotoxin. However, none of the bodies mentioned above have specified limits for bioaerosols or endotoxin. Table 1 lists the indoor concentration levels for each of these bodies for the agents specified.
Table 1. Maximum Concentration Levels Listed for Occupational Health
NH3
H2S
CO
CO2
Total Particulate Matter
Respirable Dust
Bioaerosols
Endotoxin
AIHA 25 ppm
0.1 ppm
200 ppm
Not listed
Not listed Not Listed
Not listed Not listed
ACGIH 25 ppm
10 ppm
25 ppm
5000 ppm
4 mg/m3 (Grain dust) 10 mg/m3 (Nuisance dust)
3 mg/m3
(Grain dust)
Not listed Not listed
NIOSH 25 ppm
10 ppm
35 ppm
5000 ppm
4 mg/m3 (Grain dust)
Not Listed
Not Listed Not Listed
OSHA 50 ppm
20 ppm
50 ppm
5000 ppm
10 mg/m3 (Grain dust) 15 mg/m3 (Nuisance dust)
5 mg/m3 Not Listed Not Listed
8.2.1 Occupational Dose Response Data For Humans Exposure-response studies in workers have included an assessment of the response to the amount of time exposed, for particulate matter (PM), endotoxin, NH3, and H2S. Endotoxin and PM concentrations have had the strongest and most consistent relationships to respiratory symptoms and decrements in pulmonary function tests (PFT) (Donham et al., 1989; Donham et al., 1995;
167
Reynolds et al., 1996). A significant relationship was seen between microbial concentration and bronchitic symptoms (cough and phlegm) (Donham et al., 1989). A weaker relationship of bioaerosol concentrations to tightness of chest and febrile syndromes (flu-like illness with fever) was found (Donham et al., 1989). There was no relationship of bioaerosol to pulmonary function changes. Ammonia did show some relationship to decreased baseline pulmonary function in four different studies (Donham et al., 1989; Donham et al., 1995; Reynolds et al., 1996; Cumro et al., 2001, in press). In one of the studies, the levels of microbes showed a significant dose response relationship to symptoms of hyper-reactive airways (Donham et al., 1989). A study in The Netherlands (Heederik et al., 1991) suggested that both endotoxin and Gram-negative bacteria were related to reductions in pulmonary function, as measured by forced expiratory volume in one second, (FEV1) and forced vital capacity (FVC). Also, significant relationships were shown between symptoms of bronchitis, or Organic Dust Toxic Syndrome (ODTS) to endotoxin or Gram-negative bacteria exposure. 8.2.2 Occupational Exposure Limit Studies There is little scientific doubt that disease symptoms and work-shift declines in pulmonary function are related to several components of the mixture of particulate matter, bioaerosols and gases found inside CAFOs. These components include dust, endotoxin, hydrogen sulfide, and ammonia. However, the most important question in this regard is how much exposure creates a health hazard? Knowledge of the appropriate exposure limits is extremely important for controlling the work environment. Data, which suggest the exposure limits in relation to adverse pulmonary function and symptoms, are found in four dose-response studies (Donham et al., 1989; Donham et al., 1995; Reynolds et al., 1996; and Cumro et al., 2001, in press). The first is a study of workers on 54 pig farms in Sweden (Donham et al., 1989). Several significant correlations were found between respiratory symptoms and PFT and PM, endotoxin, ammonia, and carbon dioxide. Significant relationships were seen between health measures and environmental measures taken at stationary locations in the buildings. More recent data analyses from US studies have corroborated the previous exposure limit study (Donham et al., 1995; Reynolds et al., 1996). A longitudinal study of 208 swine farmers (randomly selected from a stratified sample of all pig producers in Iowa) resulted in consistent evidence of a dose-response relationship of exposure to the dust and gases found in pig buildings and respiratory symptoms, and decreased pulmonary function. Furthermore, multiple regression analyses of the data, provided results consistent with the exposure limits previously mentioned in the Swedish study. The fourth dose-response study mentioned previously was conducted in the poultry industry with 149 poultry production workers (Donham, Leistikow et al., 1989). This study analyzed respiratory symptoms and PFT associated with exposures to PM, endotoxin, and ammonia. Regression analysis was used to determine maximum exposure levels that predicted more than 5% pulmonary function decline with adverse health responses (Donham et al., 2000). These four studies reviewed above are in close agreement in regard to concentration levels of contaminants that represent hazardous exposures to workers in either swine or poultry CAFOs. Table 2, lists the recommended maximum levels from the scientific literature of environmental exposures based on the four studies reviewed above. Recommended maximum exposures for swine
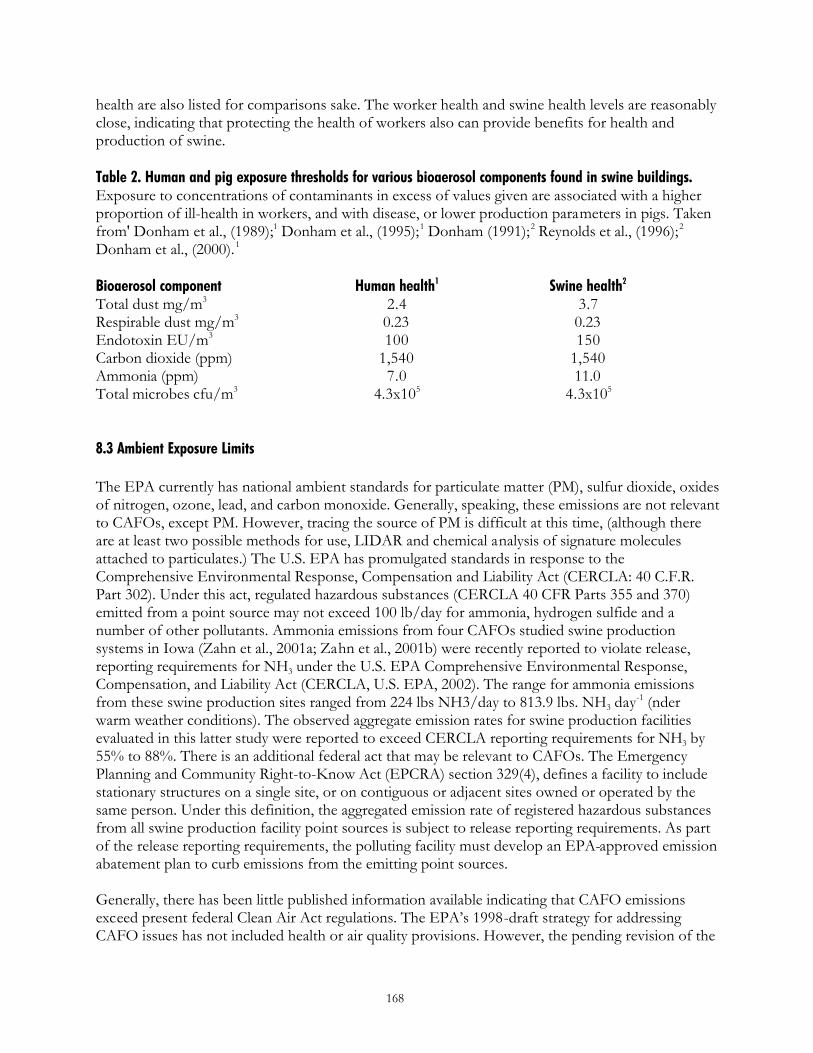
168
health are also listed for comparisons sake. The worker health and swine health levels are reasonably close, indicating that protecting the health of workers also can provide benefits for health and production of swine. Table 2. Human and pig exposure thresholds for various bioaerosol components found in swine buildings. Exposure to concentrations of contaminants in excess of values given are associated with a higher proportion of ill-health in workers, and with disease, or lower production parameters in pigs. Taken from' Donham et al., (1989);1 Donham et al., (1995);1 Donham (1991);2 Reynolds et al., (1996);2 Donham et al., (2000).1
Bioaerosol component Human health1 Swine health2 Total dust mg/m3 2.4 3.7 Respirable dust mg/m3 0.23 0.23 Endotoxin EU/m3 100 150 Carbon dioxide (ppm) 1,540 1,540 Ammonia (ppm) 7.0 11.0 Total microbes cfu/m3 4.3x10⁵ 4.3x10⁵ 8.3 Ambient Exposure Limits The EPA currently has national ambient standards for particulate matter (PM), sulfur dioxide, oxides of nitrogen, ozone, lead, and carbon monoxide. Generally, speaking, these emissions are not relevant to CAFOs, except PM. However, tracing the source of PM is difficult at this time, (although there are at least two possible methods for use, LIDAR and chemical analysis of signature molecules attached to particulates.) The U.S. EPA has promulgated standards in response to the Comprehensive Environmental Response, Compensation and Liability Act (CERCLA: 40 C.F.R. Part 302). Under this act, regulated hazardous substances (CERCLA 40 CFR Parts 355 and 370) emitted from a point source may not exceed 100 lb/day for ammonia, hydrogen sulfide and a number of other pollutants. Ammonia emissions from four CAFOs studied swine production systems in Iowa (Zahn et al., 2001a; Zahn et al., 2001b) were recently reported to violate release, reporting requirements for NH3 under the U.S. EPA Comprehensive Environmental Response, Compensation, and Liability Act (CERCLA, U.S. EPA, 2002). The range for ammonia emissions from these swine production sites ranged from 224 lbs NH3/day to 813.9 lbs. NH3 day-1 (nder warm weather conditions). The observed aggregate emission rates for swine production facilities evaluated in this latter study were reported to exceed CERCLA reporting requirements for NH3 by 55% to 88%. There is an additional federal act that may be relevant to CAFOs. The Emergency Planning and Community Right-to-Know Act (EPCRA) section 329(4), defines a facility to include stationary structures on a single site, or on contiguous or adjacent sites owned or operated by the same person. Under this definition, the aggregated emission rate of registered hazardous substances from all swine production facility point sources is subject to release reporting requirements. As part of the release reporting requirements, the polluting facility must develop an EPA-approved emission abatement plan to curb emissions from the emitting point sources. Generally, there has been little published information available indicating that CAFO emissions exceed present federal Clean Air Act regulations. The EPA’s 1998-draft strategy for addressing CAFO issues has not included health or air quality provisions. However, the pending revision of the
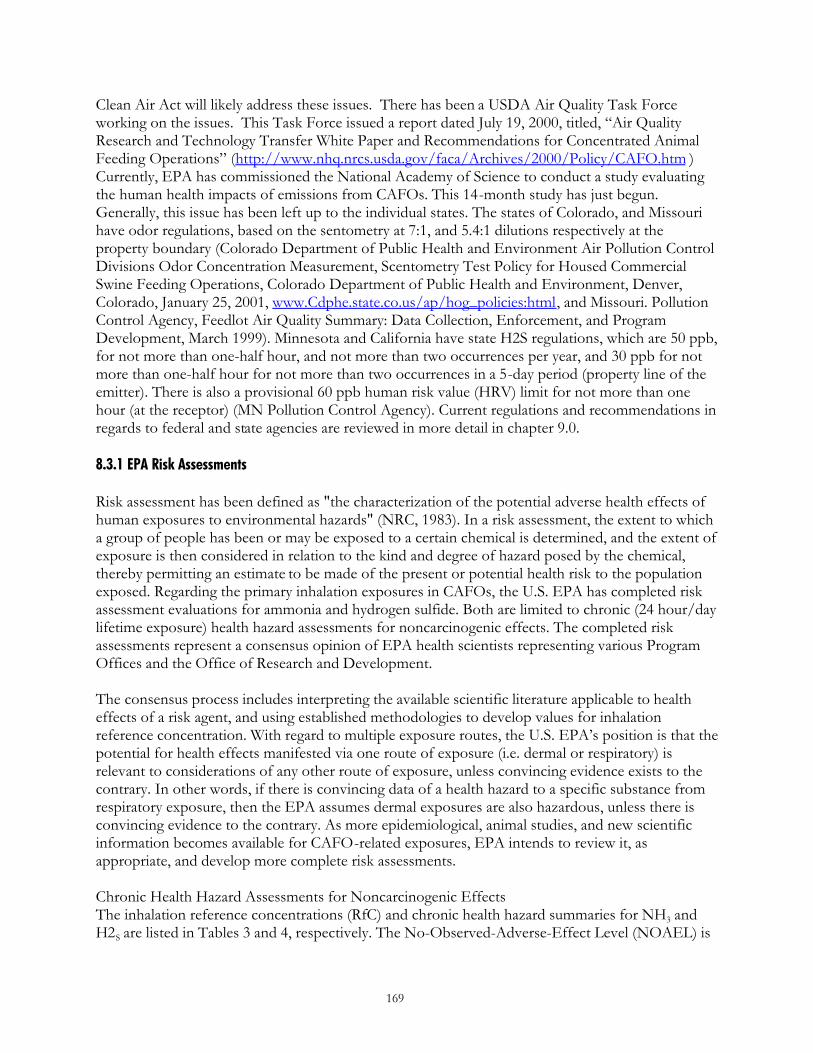
169
Clean Air Act will likely address these issues. There has been a USDA Air Quality Task Force working on the issues. This Task Force issued a report dated July 19, 2000, titled, “Air Quality Research and Technology Transfer White Paper and Recommendations for Concentrated Animal Feeding Operations” (http://www.nhq.nrcs.usda.gov/faca/Archives/2000/Policy/CAFO.htm ) Currently, EPA has commissioned the National Academy of Science to conduct a study evaluating the human health impacts of emissions from CAFOs. This 14-month study has just begun. Generally, this issue has been left up to the individual states. The states of Colorado, and Missouri have odor regulations, based on the sentometry at 7:1, and 5.4:1 dilutions respectively at the property boundary (Colorado Department of Public Health and Environment Air Pollution Control Divisions Odor Concentration Measurement, Scentometry Test Policy for Housed Commercial Swine Feeding Operations, Colorado Department of Public Health and Environment, Denver, Colorado, January 25, 2001, www.Cdphe.state.co.us/ap/hog_policies:html, and Missouri. Pollution Control Agency, Feedlot Air Quality Summary: Data Collection, Enforcement, and Program Development, March 1999). Minnesota and California have state H2S regulations, which are 50 ppb, for not more than one-half hour, and not more than two occurrences per year, and 30 ppb for not more than one-half hour for not more than two occurrences in a 5-day period (property line of the emitter). There is also a provisional 60 ppb human risk value (HRV) limit for not more than one hour (at the receptor) (MN Pollution Control Agency). Current regulations and recommendations in regards to federal and state agencies are reviewed in more detail in chapter 9.0. 8.3.1 EPA Risk Assessments Risk assessment has been defined as "the characterization of the potential adverse health effects of human exposures to environmental hazards" (NRC, 1983). In a risk assessment, the extent to which a group of people has been or may be exposed to a certain chemical is determined, and the extent of exposure is then considered in relation to the kind and degree of hazard posed by the chemical, thereby permitting an estimate to be made of the present or potential health risk to the population exposed. Regarding the primary inhalation exposures in CAFOs, the U.S. EPA has completed risk assessment evaluations for ammonia and hydrogen sulfide. Both are limited to chronic (24 hour/day lifetime exposure) health hazard assessments for noncarcinogenic effects. The completed risk assessments represent a consensus opinion of EPA health scientists representing various Program Offices and the Office of Research and Development. The consensus process includes interpreting the available scientific literature applicable to health effects of a risk agent, and using established methodologies to develop values for inhalation reference concentration. With regard to multiple exposure routes, the U.S. EPA’s position is that the potential for health effects manifested via one route of exposure (i.e. dermal or respiratory) is relevant to considerations of any other route of exposure, unless convincing evidence exists to the contrary. In other words, if there is convincing data of a health hazard to a specific substance from respiratory exposure, then the EPA assumes dermal exposures are also hazardous, unless there is convincing evidence to the contrary. As more epidemiological, animal studies, and new scientific information becomes available for CAFO-related exposures, EPA intends to review it, as appropriate, and develop more complete risk assessments. Chronic Health Hazard Assessments for Noncarcinogenic Effects The inhalation reference concentrations (RfC) and chronic health hazard summaries for NH3 and H2S are listed in Tables 3 and 4, respectively. The No-Observed-Adverse-Effect Level (NOAEL) is
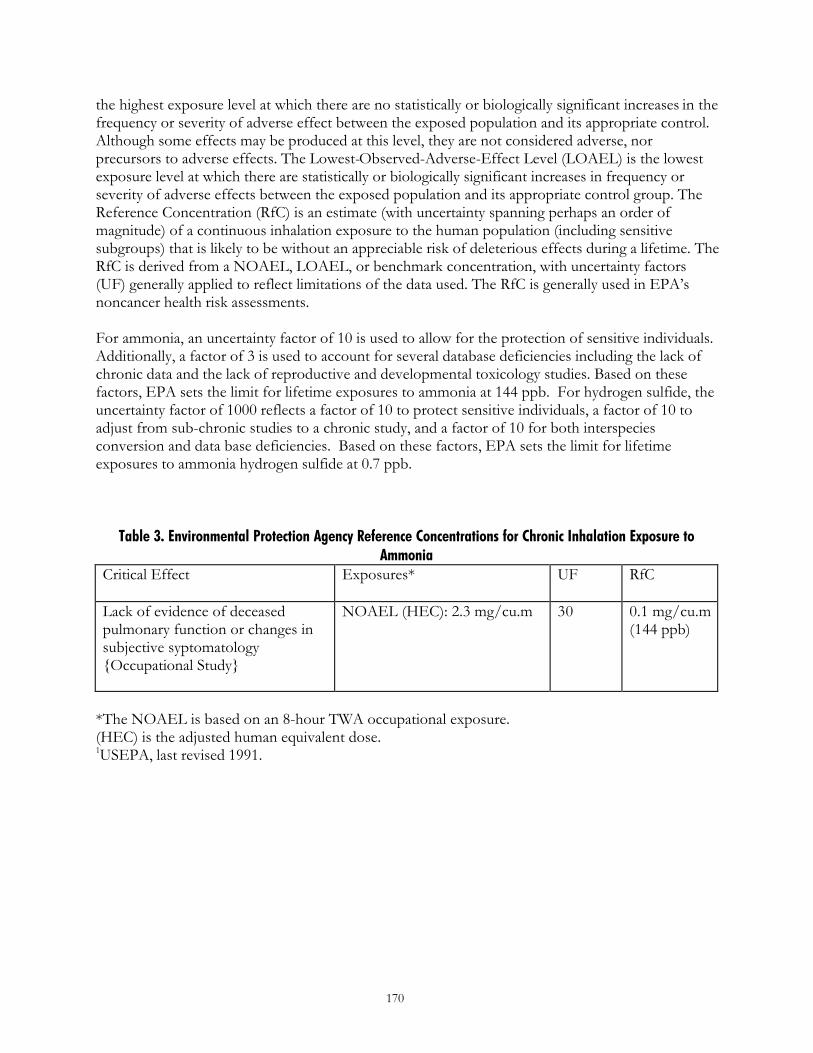
170
the highest exposure level at which there are no statistically or biologically significant increases in the frequency or severity of adverse effect between the exposed population and its appropriate control. Although some effects may be produced at this level, they are not considered adverse, nor precursors to adverse effects. The Lowest-Observed-Adverse-Effect Level (LOAEL) is the lowest exposure level at which there are statistically or biologically significant increases in frequency or severity of adverse effects between the exposed population and its appropriate control group. The Reference Concentration (RfC) is an estimate (with uncertainty spanning perhaps an order of magnitude) of a continuous inhalation exposure to the human population (including sensitive subgroups) that is likely to be without an appreciable risk of deleterious effects during a lifetime. The RfC is derived from a NOAEL, LOAEL, or benchmark concentration, with uncertainty factors (UF) generally applied to reflect limitations of the data used. The RfC is generally used in EPA’s noncancer health risk assessments. For ammonia, an uncertainty factor of 10 is used to allow for the protection of sensitive individuals. Additionally, a factor of 3 is used to account for several database deficiencies including the lack of chronic data and the lack of reproductive and developmental toxicology studies. Based on these factors, EPA sets the limit for lifetime exposures to ammonia at 144 ppb. For hydrogen sulfide, the uncertainty factor of 1000 reflects a factor of 10 to protect sensitive individuals, a factor of 10 to adjust from sub-chronic studies to a chronic study, and a factor of 10 for both interspecies conversion and data base deficiencies. Based on these factors, EPA sets the limit for lifetime exposures to ammonia hydrogen sulfide at 0.7 ppb.
Table 3. Environmental Protection Agency Reference Concentrations for Chronic Inhalation Exposure to Ammonia
Critical Effect
Exposures* UF RfC
Lack of evidence of deceased pulmonary function or changes in subjective syptomatology {Occupational Study}
NOAEL (HEC): 2.3 mg/cu.m 30 0.1 mg/cu.m (144 ppb)
*The NOAEL is based on an 8-hour TWA occupational exposure. (HEC) is the adjusted human equivalent dose. 1USEPA, last revised 1991.
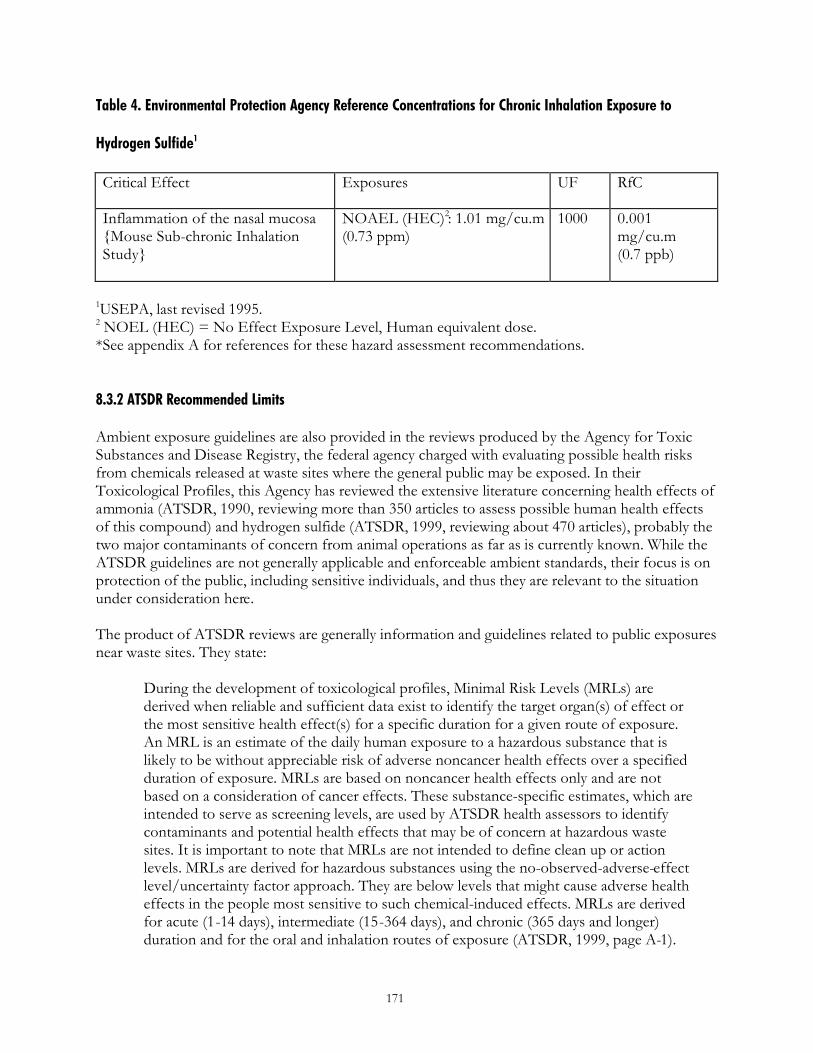
171
Table 4. Environmental Protection Agency Reference Concentrations for Chronic Inhalation Exposure to
Hydrogen Sulfide1
Critical Effect
Exposures UF RfC
Inflammation of the nasal mucosa {Mouse Sub-chronic Inhalation Study}
NOAEL (HEC)2: 1.01 mg/cu.m (0.73 ppm)
1000 0.001 mg/cu.m (0.7 ppb)
1USEPA, last revised 1995. 2 NOEL (HEC) = No Effect Exposure Level, Human equivalent dose. *See appendix A for references for these hazard assessment recommendations.
8.3.2 ATSDR Recommended Limits Ambient exposure guidelines are also provided in the reviews produced by the Agency for Toxic Substances and Disease Registry, the federal agency charged with evaluating possible health risks from chemicals released at waste sites where the general public may be exposed. In their Toxicological Profiles, this Agency has reviewed the extensive literature concerning health effects of ammonia (ATSDR, 1990, reviewing more than 350 articles to assess possible human health effects of this compound) and hydrogen sulfide (ATSDR, 1999, reviewing about 470 articles), probably the two major contaminants of concern from animal operations as far as is currently known. While the ATSDR guidelines are not generally applicable and enforceable ambient standards, their focus is on protection of the public, including sensitive individuals, and thus they are relevant to the situation under consideration here. The product of ATSDR reviews are generally information and guidelines related to public exposures near waste sites. They state:
During the development of toxicological profiles, Minimal Risk Levels (MRLs) are derived when reliable and sufficient data exist to identify the target organ(s) of effect or the most sensitive health effect(s) for a specific duration for a given route of exposure. An MRL is an estimate of the daily human exposure to a hazardous substance that is likely to be without appreciable risk of adverse noncancer health effects over a specified duration of exposure. MRLs are based on noncancer health effects only and are not based on a consideration of cancer effects. These substance-specific estimates, which are intended to serve as screening levels, are used by ATSDR health assessors to identify contaminants and potential health effects that may be of concern at hazardous waste sites. It is important to note that MRLs are not intended to define clean up or action levels. MRLs are derived for hazardous substances using the no-observed-adverse-effect level/uncertainty factor approach. They are below levels that might cause adverse health effects in the people most sensitive to such chemical-induced effects. MRLs are derived for acute (1-14 days), intermediate (15-364 days), and chronic (365 days and longer) duration and for the oral and inhalation routes of exposure (ATSDR, 1999, page A-1).
172
Thus the MRLs are designed to protect sensitive populations. However, as the MRLs are derived for individual contaminants; mixtures of chemicals such as CAFO emissions are potentially more hazardous, but difficult to assess from a health effect standpoint. The situation of mixed exposures is discussed in section 8.3.2. The ATSDR report on ammonia (ATSDR, 1990) establishes a short-term (less than or equal to 14 days) MRL of 500 ppb for inhalation. A long-term (defined as greater than 365 days in this earlier Toxicological Profile) MRL of 300 ppb at the receptor is established. It appears that the 300ppb MRL would be the appropriate comparison value for public exposures beyond the property limits of a CAFO (table 6). Using the occupational 8-hour time-weighted-average recommendation for workplace exposure (nearly 100 times this value), while appropriate for the healthy adult working population, would be inappropriate for continuous exposure of the general public which includes sensitive populations, including infants, the elderly, and those with pre-existing conditions. Observed or estimated CAFO concentrations of 250 ppb are at times uncomfortably close to the long-term ammonia MRL (Subramanian, et al., 1996; Reynolds et al., 1997). Hydrogen sulfide is another major contaminant of concern near confinements. The July 1999 ATSDR "Toxicological Profile for Hydrogen Sulfide" (ATSDR, 1999) derives "an acute inhalation MRL of 70 ppb" and "an intermediate MRL of 30 ppb" (p. 139); these would correspond to the 1-14 day and 15-364 day durations of exposure, respectively, and would be appropriate for those living adjacent to CAFOs (table 6). These MRLs are public health exposure guidelines, much lower than the occupational limit of 10,000 ppb. Generally, there is limited peer-reviewed published literature on community assessments of hydrogen sulfide in the vicinity of CAFOs. There is a non-peer reviewed article by Jacobsen, (1997), for both ammonia and hydrogen sulfide. There have been several studies by the USEPA of continuous monitoring around CAFOs. One of these is a 1999 study in Northern Missouri is available from the EPA (Secrest, C.D., “Field Measurements of Air Pollutants Near Swine Confinement Animal Feeding Operations Using UV DOAS and FTIR,” Office of Regulatory Enforcement, Air Enforcement Division USEPA, MS 2242A, 1200 Pennsylvania Avenue, NW, Washington, DC, 20460). Furthermore, the Minnesota Pollution Control Agency has conducted monitoring of numerous CAFOs. Their report on “Feedlot Air Quality Summary Data Collection, Enforcement, and Program Development (March 1999),” can be seen at http://www.pca.state.mn.us/hot/feedlots.html. These reports indicate that observed off-site concentrations near CAFOs at times may approach or exceed these ATSDR recommended limits. There is a very important point to note, that there is variation in concentrations that can be measured, depending on atmospheric conditions. Stable atmospheres, particularly in the evening are condusive to build up of contaminants in the vicinity of CAFOs. Therefore, it is important that measurement periods take these predicable variations into account. In other words, just measuring during the evening as well as the day is important to obtaining an accurate assessment of actual exposure at the receptor.
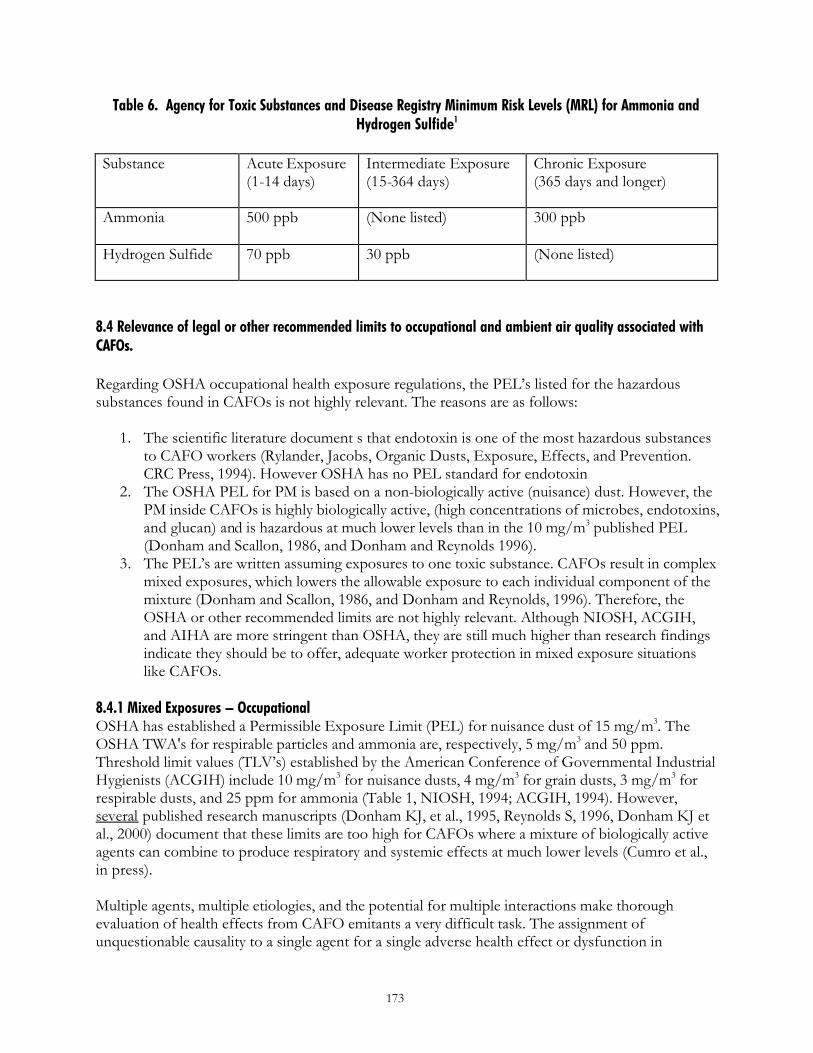
173
Table 6. Agency for Toxic Substances and Disease Registry Minimum Risk Levels (MRL) for Ammonia and Hydrogen Sulfide1
Substance
Acute Exposure (1-14 days)
Intermediate Exposure (15-364 days)
Chronic Exposure (365 days and longer)
Ammonia
500 ppb (None listed) 300 ppb
Hydrogen Sulfide 70 ppb 30 ppb (None listed)
8.4 Relevance of legal or other recommended limits to occupational and ambient air quality associated with CAFOs. Regarding OSHA occupational health exposure regulations, the PEL’s listed for the hazardous substances found in CAFOs is not highly relevant. The reasons are as follows:
1. The scientific literature document s that endotoxin is one of the most hazardous substances to CAFO workers (Rylander, Jacobs, Organic Dusts, Exposure, Effects, and Prevention. CRC Press, 1994). However OSHA has no PEL standard for endotoxin
2. The OSHA PEL for PM is based on a non-biologically active (nuisance) dust. However, the PM inside CAFOs is highly biologically active, (high concentrations of microbes, endotoxins, and glucan) and is hazardous at much lower levels than in the 10 mg/m3 published PEL (Donham and Scallon, 1986, and Donham and Reynolds 1996).
3. The PEL’s are written assuming exposures to one toxic substance. CAFOs result in complex mixed exposures, which lowers the allowable exposure to each individual component of the mixture (Donham and Scallon, 1986, and Donham and Reynolds, 1996). Therefore, the OSHA or other recommended limits are not highly relevant. Although NIOSH, ACGIH, and AIHA are more stringent than OSHA, they are still much higher than research findings indicate they should be to offer, adequate worker protection in mixed exposure situations like CAFOs.
8.4.1 Mixed Exposures – Occupational OSHA has established a Permissible Exposure Limit (PEL) for nuisance dust of 15 mg/m3. The OSHA TWA's for respirable particles and ammonia are, respectively, 5 mg/m3 and 50 ppm. Threshold limit values (TLV’s) established by the American Conference of Governmental Industrial Hygienists (ACGIH) include 10 mg/m3 for nuisance dusts, 4 mg/m3 for grain dusts, 3 mg/m3 for respirable dusts, and 25 ppm for ammonia (Table 1, NIOSH, 1994; ACGIH, 1994). However, several published research manuscripts (Donham KJ, et al., 1995, Reynolds S, 1996, Donham KJ et al., 2000) document that these limits are too high for CAFOs where a mixture of biologically active agents can combine to produce respiratory and systemic effects at much lower levels (Cumro et al., in press). Multiple agents, multiple etiologies, and the potential for multiple interactions make thorough evaluation of health effects from CAFO emitants a very difficult task. The assignment of unquestionable causality to a single agent for a single adverse health effect or dysfunction in
174
confinement workers is unlikely at best. The 2001ACGIH publication for threshold limit values for chemical substances and physical agents states that when mixed exposures are present, and unless other data indicate differently, the effects should be considered additive. For example where C1, C2, and Cn are measured concentrations of hazardous substances, and T1, T2, and Tn, are their respective TLV’s, then the relationship to determine if the level is under legal TLV’s, the relationship is defined mathematically as follows:C1/T1 + C2 /T2 + Cn/Tn = < 1. There may be instances when the effects of two substances are greater than additive, defined as a synergistic interaction. If synergy is present then mixed exposures are even more hazardous than if the effects were merely additive. Such a relationship between NH3 and PM in CAFOs, has been defined by Cumro and Donham, (in press). Data were analyzed from an exposure- response study of 149 poultry CAFO worker. Analysis of this data-set revealed prominent dose-response relationships between increasing PM, NH3, and endotoxin concentrations with corresponding cross-shift declines in worker lung function. Specific threshold concentrations were defined including total dust, 2.4 mg/m3; respirable dust, 0.16 mg/m3; total endotoxin, 100 EU/m3; respirable endotoxin, 0.35 EU/m3; and NH3, 12 ppm (Donham and Cumro, et al., 2000). As health effects to poultry workers from exposure to both dust and ammonia were less than half the published ACGIH TLV’s, investigations were undertaken to study possible interactions between these substances. The results demonstrated that when workers are exposed to both PM and NH3, the adverse effect on pulmonary function is up to 156% greater than the individual effects of these gases (Cumro, et al., in press). Assuming a typical swine CAFO winter concentration of 10 ppm of NH3 and PM of 3.5 mg/m3, and the TLV for grain dust of 4 mg/m3, the correct relationship to determine if exposure limits are exceeded in this situation would be as follows: ([NH3]/TLV of NH3 + [PM]/TLV of PM) x 1.56. An example for a typical swine building would be as follows: (10 ppm / 25 ppm + 3.5 mg/m3 / 4 mg/m3) x 1.56 = 2.0. In other words, a typical building might exceed our recommended limit by two times. Synergy of simultaneous dust and ammonia exposures in a working environment raises the question of redefining exposure limits for organic dust and ammonia when workers are exposed simultaneously to these substances. 8.4.2 Mixed Exposures – The Community Setting The EPA, in fact, treats mixed exposures in the community as additive (as ACGIH treats occupational exposures) unless there is information to indicate otherwise (USEPA 600890066F Methods for Derivation Inhalation Reference Concentrations and Application of Inhalation Dosimetry http://www.epa.gov/cgi-bin/claritgw). Existing data are clear that the community exposure concentrations are much less than in the occupational setting. The logical public health question is do mixed exposures in the community setting also have additive or synergistic health effects? Fundamental toxicologic principles would predict there would be additive or synergistic health effects of mixed exposures in the community, (as there would be in the occupational setting) if the hazardous substances effect the same body tissues or organ(s). In the case of CAFOs, ammonia and hydrogen sulfide both have direct effects on the respiratory system, although ATSDR also warns that hydrogen sulfide is also a broad-spectrum poison. Whether exposure indices for these two respiratory irritants with similar short or intermediate term MRLs can or should be added is not immediately clear but certainly possible. A potential method to establish limits in mixed exposures would be to ratio the concentrations to the appropriate MRLs, with a sum below 1 suggesting no respiratory threat (similar to ACGIH for occupational exposures
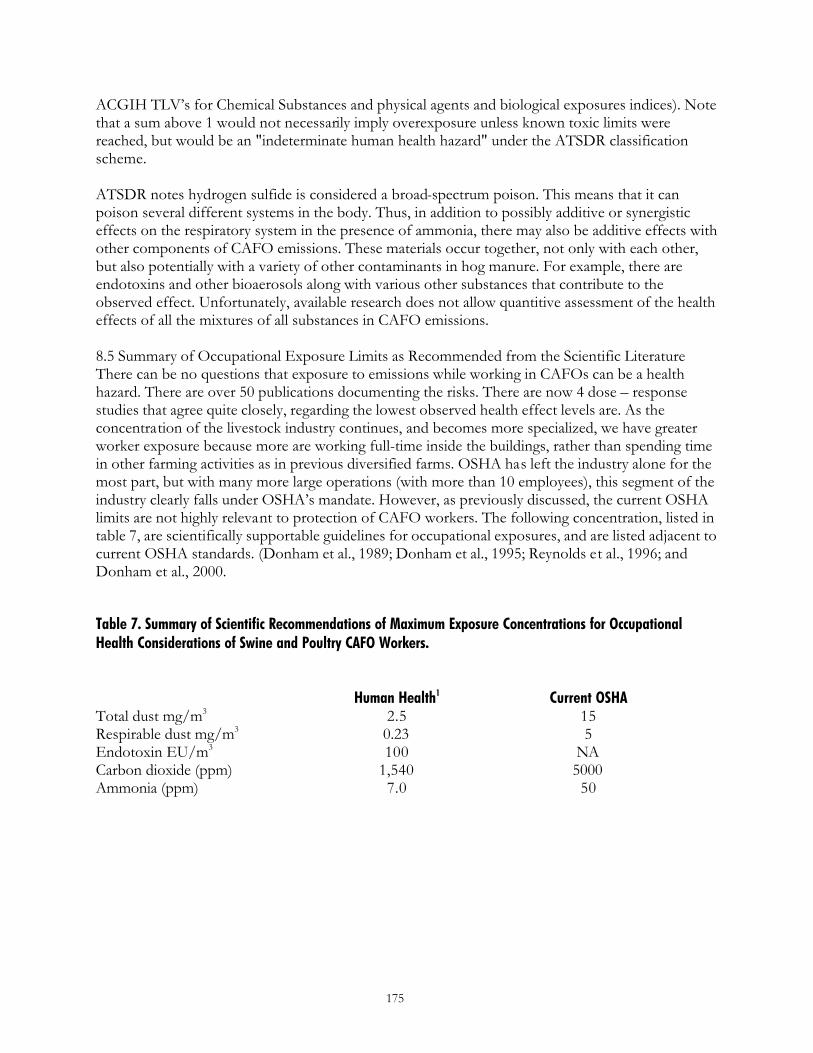
175
ACGIH TLV’s for Chemical Substances and physical agents and biological exposures indices). Note that a sum above 1 would not necessarily imply overexposure unless known toxic limits were reached, but would be an "indeterminate human health hazard" under the ATSDR classification scheme. ATSDR notes hydrogen sulfide is considered a broad-spectrum poison. This means that it can poison several different systems in the body. Thus, in addition to possibly additive or synergistic effects on the respiratory system in the presence of ammonia, there may also be additive effects with other components of CAFO emissions. These materials occur together, not only with each other, but also potentially with a variety of other contaminants in hog manure. For example, there are endotoxins and other bioaerosols along with various other substances that contribute to the observed effect. Unfortunately, available research does not allow quantitive assessment of the health effects of all the mixtures of all substances in CAFO emissions. 8.5 Summary of Occupational Exposure Limits as Recommended from the Scientific Literature There can be no questions that exposure to emissions while working in CAFOs can be a health hazard. There are over 50 publications documenting the risks. There are now 4 dose – response studies that agree quite closely, regarding the lowest observed health effect levels are. As the concentration of the livestock industry continues, and becomes more specialized, we have greater worker exposure because more are working full-time inside the buildings, rather than spending time in other farming activities as in previous diversified farms. OSHA has left the industry alone for the most part, but with many more large operations (with more than 10 employees), this segment of the industry clearly falls under OSHA’s mandate. However, as previously discussed, the current OSHA limits are not highly relevant to protection of CAFO workers. The following concentration, listed in table 7, are scientifically supportable guidelines for occupational exposures, and are listed adjacent to current OSHA standards. (Donham et al., 1989; Donham et al., 1995; Reynolds et al., 1996; and Donham et al., 2000.
Table 7. Summary of Scientific Recommendations of Maximum Exposure Concentrations for Occupational Health Considerations of Swine and Poultry CAFO Workers.
Human Health1 Current OSHA Total dust mg/m3 2.5 15 Respirable dust mg/m3 0.23 5 Endotoxin EU/m3 100 NA Carbon dioxide (ppm) 1,540 5000 Ammonia (ppm) 7.0 50
176
8.6 Summary of Ambiant Exposure Limits as Recommended from Federal Agencies and Regional State Regulations There has been no published literature on dose – response relationships of CAFO emissions and life quality or chronic health effects among community residents. However, several states have adopted emission standards based on the weight of evidence regarding individual chemical exposures (see chapter 9.0) Furthermore, ATSDR and the EPA have made recommendations based on hazard assessment evaluations. Also, consideration for mixed exposures should lower levels set for individual exposures. The following concentrations could be supported for CAFOs, based on the relevant information reviewed above. H2S: 15 ppb at the residence for a one-hour average measure and 70 ppb at the property line. No more that seven exceedences would be allowed, per calendar year (with notice to the residents and DNR). NH3: 150 ppb at the residence and 500 ppb at the property line for a one-hour average measure. There should be no more than 7 exceedences (with notice to residence and DNR), per calendar year. Odor: Odor would not exceed 1:7 dilutions at the receptor, or public use area, No more than 14 exceedences (with notice), per calendar year. An additional consideration could be given to a 1:15 dilution at the property line. Monitoring would be conducted via scentometry. 8.7 Justification for Recommendations of Exposure Limits The concentrations listed in section 8.6 above, are based on a combination of data gained from relevant regulations in other states, and recommendations from made by several public health related agencies, including the World Health Organization, the US Environmental Protection Agency (EPA), and the US Agency for Toxic Substances and Disease Registry (ATSDR). The basis for the regulations promulgated in other states are reported in Chapter 9. The justification for levels recommenced by the EPA and ATSDR are described below. The ATSDR minimal risk levels (MRL’s) were developed in response to the mandate for the agency to list hazardous substances commonly found at listed facilities, the toxicologic profiles of these substances and to ascertain significant human exposures. That mandate is specified in The Comprehensive Environmental Response, Compensations and Liability Act (CERCLA) [42 U.S.C. 9604 et seq.], as amended by the Superfund Amendments and Reauthorization Act (SARA) [Pub. L.99-499]. The ATSDR has adopted a method similar to the EPA to determine the MRL’s for respiratory exposures, or Reference concentrations RfC’s. These levels are estimates of the daily human exposure to a hazardous substance that is not likely to cause adverse (non-cancerous) health effects, over a specified exposure period (acute – 1-14 days, intermediate – 15-364 days, and chronic, greater than 365 days). MRL’s are derived when the ATSDR determines there is sufficient data to determine specific and sensitive health effects for a specific duration. Consistent with principles of public health, the MRL’s are set to protect sensitive individuals, and that there is a safety factor built in as they are set below levels that might cause adverse health effects. The public health protection principle is also used by utilizing uncertainty factors (UF) when less than complete data are available. The MRL’s undergo a rigorous review process, both internal, and external to the agency, are peer
177
reviewed, and are submitted for public comment. As of June 1, 2001, 286 MRLs had been determined, including hydrogen sulfide, and ammonia. The MRL’s can be found on the ATSDR website at www.atsdr.cdc.gov/mrls.html. The ATSDR also publishes, “Toxicologic Profiles,” which reviews the literature on the toxicology and public health significance, and justifications for MRL’s determined for each of the substances for which an MRL is determined (www.atsdr.cdc.gov/toxpro2.html). As mentioned previously, the more detailed methods ATSDR uses for determination of MRL’s are very similar to the EPA methods for setting their risk levels, which are called reference dose concentration guidelines, (RfD’s, for oral exposures, or RfC’s for respiratory exposures). The EPA method is described in detail here to help explain how EPA and the ATSDR develop their exposure guidelines. The EPA Risk Assessment Method, are described in detail in the 416 page document 600890066F, entitled “Methods for Derivation Inhalation Reference Concentrations and Application Dosimetry” (www.epa.gov/cgi-bin/claritgw). The EPA has a long history of evaluating scientific information and in developing benchmark values for regulatory action to protect the public from adverse health effects. The National Academy of Sciences (NAS) has been charged with the evaluation of risk assessment processes performed by federal agencies to assure that regulations are based on best judgment and analysis of available scientific knowledge (Risk Assessment in the Federal Government: Managing the Process, NAS, 1983, and NAS Report on Sciences and Judgment in Risk Assessment, National Research Council, 1994). The NAS recommends that risk assessment should be separate from policy aspects of risk management to help assure recommendations for protection on the publics’ health are not compromised by the political process. Furthermore, NAS defines risk assessment as “characterization of the potential adverse human health effects of exposures to environmental hazards and consists of the following steps:
1. Hazard identification: to determine the cause-health effect linkages of suspected hazardous substances;
2. Dose-response assessment: the estimation of the relation between the magnitude of exposures and the occurrence of the health effects in question;
3. Exposure assessment: determination of the extent of human exposure; 4. Risk characterization: determination of the nature and magnitude of human exposure, along
with attendant uncertainty.
The EPA adopted its reference dose concentration guidelines (RfD’s) and analogous guidelines for respiratory exposures (RfC’s) based on the NAS guidelines, but the method is more rigorously defined and includes guidance for uncertainty factors (UF’s) to help guide extrapolation in instances such as applying animal data to human exposures, and incomplete data (Barnes and Dourson, 1988). The process is a quantitative approach to interpretation of toxicology and epidemiologic data to determine a dose-response estimate, followed by a comparison to exposure estimate to analyze risk characterization. The RfC is defined as: An estimate (with uncertainty spanning perhaps an order of magnitude) of a continuous inhalation exposure to the human population (including sensitive subgroups) that is likely to be without appreciable health risks during a lifetime (24 hours per day for 70 years). The steps to calculating an RfC are as follows:
178
1. Determination of a no-observed-adverse-effect-level (NOAEL), which is the highest dose where no health effects are seen, or threshold level (Klaassen, 1986).
2. Determination of a human equivalent concentration (HEC) of the NOAEL, if the latter is based on animal data.
3. Determination of uncertainty factors (UF) that may include necessary extrapolations from: a. average healthy to sensitive humans b. animal to human data c. sub-chronic to chronic data d. lowest effect level to NOAEL e. incomplete to complete data base
4. Determination of any necessary modifying factors (MF) not addressed by the UF’s, such as adjustments for low sample sizes, or poor exposure characterization.
The RfC determination could be defined by the following notation:
RfC = NOAEL[HEC] / (UF x MF) Usually a subjective confidence level is assigned to the RfC, based on the quality and completeness of the data and the extent of UF’s used. These are issued not to disregard those with medium or low confidence levels, but to indicate that the values may change as more information becomes available. RfC’s with a high confidence level may not expect to change in the future, relative to those with a low confidence level. The EPA’s Integrated Risk Information System (IRIS), lists all the RfC’s established, and discusses the UF’s used in their determination.
References Barnes DG, Dourson M. Reference dose (RfD): Description and use in health risk assessments. Regul Toxicol
Pharmacol 8(4):471-86, 1988. Comprehensive Environmental Response, Compensation, and Liability Act. CERCLA. 2002. United States
Environmental Protection Administration. Washington, DC (http:www.epa.gov/oerrpage/superfund/whatissf/cercla.htm).
Cumro D, Donham K, Reynolds S. Synergistic affects of dust and ammonia on the occupational health affects of poultry production workers. J Agric Med, 2001. (in press).
Donham KJ, Cumro D, Reynolds SJ, Merchant JA. Dose-response relationships between occupational aerosol exposures and cross-shift declines of lung function in poultry workers: recommendations for exposure limits. J Occup Environ Med 42(3):260-269, 2000.
Donham KJ, Haglind P, Peterson Y, Rylander R, Belin L: Environmental and health studies of farm workers in Swedish confinement buildings. Br J Ind Med 46:31-37, 1989.
Donham KJ, Leistikow B, Merchant J, Leonard S. Assessment of U.S. poultry worker respiratory risk. Am J Ind Med 17:73-74, 1989.
Donham KJ, Merchant J, Lassise D, Popendorf WJ, Burmeister L: Preventing respiratory disease in swine confinement workers: Intervention through applied epidemiology, education and consultation. Am J Ind Med 18:241-261, 1990.
Donham KJ, Popendorf WJ: Ambient levels of selected gases inside swine confinement buildings. Am Ind Hyg Assoc J 46:658-660, 1985.
Donham KJ, Reynolds SJ, et al.: “Respiratory dysfunction in swine production facility workers: dose-response relationships of environmental exposures and pulmonary function.” Am J Ind Med 27:405-418, 1995.
Donham KJ, Scallon LJ, Popendorf WJ, et al.: “Characterization of dusts collected from swine confinement buildings.” Am Ind Hyg Assoc J 47(7):404-410, 1986.
Donham KJ. Association of environmental air contaminants with disease and productivity in swine. Am J Vet Res; 52(10):1723-1730, 1991.
179
Heederick D, Brouwer R, Biersteke K, and Boleij. Relationships of airborne endotoxin and bacteria levels in pig farms with lung function and respiratory symptoms of farmers. Int Arch Occup Envrion Health 62:595-601, 1991.
Jacobson L: “No correlation between hydrogen sulfide and odor.” In: Pork News - Environmental Issue, Minnesota Pork Journal, Swine Center, University of Minnesota, St Paul, MN, Nov-Dec, 1997.
R Rylander, RR Jacobs, editors. Organic dusts: exposure, effects, and prevention. Boca Raton, FL: Lewis Publishers, CRC Press: 219-232, 1994.
Reynolds SJ, Donham KJ, Stookesberry J, Thorne PS, Subramanian P, Thu K, Whitten P. Air quality assessments in the vicinity of swine production facilities. J Agromedicine 4:37-45.
Reynolds SJ, Donham KJ, Whitten P, Merchant JA, Burmeister LF, Popendorf WJ. Longitudinal evaluation of dose-response relationships for environmental exposures and pulmonary function in swine production workers. Am J Ind Med 29:33-40, 1996.
Subramanian P, Reynolds SJ, Thorne PS, Donham KJ, Stookesberry J, Thu K. Assessment of airborne ammonia in a swine-farming environment by the fluorimetric enzyme method. Intl J Environ Anal Chem 64:301-312, 1996.
Zahn, J. A., J.L. Hatfield, Y.S. Do, and A.A. DiSpirito, (2001), Functional Classification of Swine Manure Management Systems Based on Solution-Phase Chemical and Gas Emission Characteristics, J Environ Qual 30(3):635-647.
Zahn, J.A., A. E. Tung, B. A. Roberts, and J. L. Hatfield, (2001), Abatement of Ammonia and Hydrogen Sulfide Emissions from a Swine Lagoon using a Polymer Biocover, J Air Waste Management Assoc, 51:562-573.
APPENDIX A Principal and Supporting CAFO Hazard Assessment Studies The principal and supporting studies used for the EPA health risk assessment and inhalation RfC calculation for NH3 include: Anderson DP, Beard CW and Hanson RP. The adverse effects of ammonia on chickens including resistance to infection
with Newcastle disease virus. Avian Dis 8:369-379, 1964. Barrow CS, and Steinhagen WH. NH3 concentrations in the expired air of the rat: Importance to inhalation toxicology.
Toxicol Appl Pharmacol 53:116-121, 1980. Broderson JR, Lindsey JR and Crawford JE. The role of environmental ammonia in respiratory mycoplasmosis of rats.
Am J Pathol 85(1):115-130, 1976. Buckley LA, Jiang XZ, James RA, Morgan KT, and Burrow CS. Respiratory tract lesions induced by sensory irritants at
the RD50 concentration. Toxicol Appl Pharmacol 74:417-429, 1984. Coon RA, Jones RA, Jenkins, Jr LJ and Siegel J. Animal inhalation studies on ammonia, ethylene glycol, formaldehyde,
dimethylamine and ethanol. Toxicol Appl Pharmaco l 16:646-655, 1970. Crapo RO, Morris AH, and Gardner RM. Reference spirometric values using techniques and equipment that meets ATS
recommendations. Am Rev Respir Dis 123:659-664, 1981. Dahlman T. Mucus flow and ciliary activity in the trachea of healthy rats exposed to respiratory irritant gases (SO2, NH3
and HCHO) – a functional and morphologic (light microscopic and electron microscopic) study, with special reference to technique: VIII. The reaction of the tracheal ciliary activity to single exposure to respiratory irritant gases and studies of the pH. Acta Physiol Scand 36 (Suppl 123):93-97, 1956.
Ferguson WS, Koch WC, Webster LB, and Gould JR. Human physiological response and adaptation to ammonia. J Occup Med 19(5):319-326, 1977.
Ferris BG. Epidemiology standardization project. Am Rev Respir Dis 118:11-31, 1978. Flury KE, Dines DE, Rodarte JR, and Rodgers R. Airway obstruction due to inhalation of ammonia. Mayo Clin Proc
58:389-393, 1983. Gamble MR, and Clough G. Ammonia build-up in animal boxes and its effect on rat tracheal epithelium. Lab Anim
10:93-104, 1976. Holness DL, Purdham JT, and Nethercott JR. Acute and chronic respiratory effects of occupational exposure to
ammonia. Am Ind Hyg Assoc J 50(12):646-650, 1989. Hunt RD, and Williams DT. Williams. Spectrometric measurements of ammonia in normal human breath. Am Lab 9:10-
23, 1977. Kane LE, Barrow CS, and Alarie Y. A short-term test to predict acceptable levels of exposure to airborne sensory
irritants. Am Ind Hyg Assoc J 40:207-229, 1979. Lapp NL, and Hyatt RE. Some factors affecting the relationship of maximal expiratory flow to lung volume in health
and disease. Dis Chest 51:475-481, 1967.
180
Larson TV, Covert DS, Frank R, and Charlson RJ. Ammonia in the human airways: Neutralization of inspired acid sulfate aerosols. Science 197:161-163, 1977.
MacEwen JD, Theodore J, and Vernot EH. Human exposure to EEL concentrations of monomethylhydrazine. In: Proc 1st Ann Conf Environmental Toxicology, Wright-Patterson Air Force Base, OH, Sept 9-11, 1970. Aerospace Medical Research Laboratory. (AMRL-TR-70-102, Paper 23). NTIS AD727022. p. 355-363, 1970.
Schaerdel AD, White WJ, Lane CM, Dvorchik BH and Bohner K. Localized and systemic effects of environmental ammonia in rats. Lab Anim Sci 33(1):40-45, 1983.
Schoeb, TR, Davidson MK, and Lindsey JR. Intracage ammonia promotes growth of Mycoplasma pulmonis in the respiratory tract of rats. Infect Immun 38:212-217, 1982.
Silverman L, Whittenberger JL, and Muller J. Physiologic response of man to ammonia in low concentrations. J Ind Hyg Toxicol 31:74-78, 1949.
Stombaugh DP, Teague HS, and Roller WL. Effects of atmospheric ammonia on the pig. J Animal Sci 28:844-847, 1969. U.S. EPA. Health effects assessment for ammonia. Prepared by the Office of Health and Environmental Assessment,
Environmental Criteria and Assessment Office, Cincinnati, OH for the Office of Emergency and Remedial Response, Washington, DC, 1987.
U.S. EPA. Health issue assessment: summary review of health effects associated with ammonia. Office of Health and Environmental Assessment, Environmental Criteria and Assessment Office, Research Triangle Park, NC. EPA/600/8-89-052F, 1989.
Verberk MM. Effects of ammonia in volunteers. Int Arch Occup Environ Health 39:73-81, 1977. Weatherby JH. Chronic toxicity of ammonia fumes by inhalation. Proc Soc Exp Biol Med 81:300-301, 1952. WHO (World Health Organization). Environmental Health Criteria 54: Ammonia. (IPCS International Programme on
Chemical Safety). Geneva, 1986. The principal and supporting studies used for the EPA health risk assessment and inhalation RfC calculation for H2S include: Adelson L and Sunshine I. Fatal hydrogen sulfide intoxication. Report of three cases occurring in a sewer. Arch Pathol
81:375-380, 1966. Ahlborg G. Hydrogen sulfide poisoning in shale oil industry. Arch Ind Hyg Occup Med 3:247-266, 1951. Andrew FD, Renne R and Cannon WC. Reproductive toxicity testing for effects of H2S in rats. In: Pacific Northwest
Laboratory Annual Report for 1979. Prepared for the U.S. Dept of Energy, Richland, WA. Report No. PNL-3300 PTI. 276-278, 1980.
Anonymous. Occupational fatality following exposure to hydrogen sulfide-Nebraska. MMWR, Aug 22, 35(33):533-5, 1986.
Arnold IM, Dufresne R, Alleyne B, and Stuart P. Health implication of occupational exposures to hydrogen sulfide. J Occup Med 27(5):373-376, 1985.
Beauchamp RO, Bus JS, Popp JA, Boreike CJ and Andjelkovich DA. A critical review of the literature on hydrogen sulfide toxicity. CRC Crit Rev Toxicol 13:25-97, 1984.
Burnett W, King E, Grace M, and Hall W. Hydrogen sulfide poisoning: Review of 5 years’ experience. CMA Journal 117:1277-1280, 1977.
Campanaya M, Sanz P, Reig R, et al. Fatal hydrogen sulfide poisoning. Med Lav, May-June. 80(3):251-3, 1989. CIIT (Chemical Industry Institute of Toxicology). 90-Day vapor inhalation toxicity study of hydrogen sulfide in B6C3F1
mice. U.S. EPA OTS Public Files. Fiche No. 0000255-0. Document No. FYI-OTS-0883-0255, 1983a. CIIT (Chemical Industry Institute of Toxicology). 90-Day vapor inhalation toxicity study of hydrogen sulfide in Fischer-
344 rats. U.S. EPA OTS Public Files. Fiche No. 0000255-0. Document No. FYI-OTS-0883-0255, 1983b. CIIT (Chemical Industry Institute of Toxicology). 90-Day vapor inhalation toxicity study of hydrogen sulfide in Sprague-
Dawley rats. U.S. EPA OTS Public Files. Fiche No. 0000255-0. Document No. FYI-OTS-0883-0255, 1983c. Deng JF, and Chang SC. Hydrogen sulfide poisonings in hot-spring reservoir cleaning: Two case reports. Am J Ind Med
11(4):447-51, 1987. Frank R. Acute and chronic respiratory effects of exposure to inhaled toxic agents. Occupational Respiratory Diseases,
JA Merchant, ed. Division of Respiratory Disease Studies, Appalachian Laboratory for Occupational Safety and Health, National Instit for Occup Saf Health, U.S. Dept of Health and Human Services. DHHS (NIOSH) Publ No 86-102. p. 571-605, 1986.
Haggard HW. Toxicology of hydrogen sulfide. J Ind Hyg Toxicol 7(3):113-121, 1925. Hannah RS, and Roth SH. Chronic exposure to low concentrations of hydrogen sulfide produces abnormal growth in
developing cerebral Purkinje cells. Neuroscience Ltrs 122(2):225-228, 1991.
181
Hannah RS, Hayden LJ and Roth SH. Hydrogen sulfide exposure alters the amino acid content in developing rat CNS. Neuroscience Ltr 99(3):323-327, 1989.
Hannah RS, Bennington R, and Roth SH. A relationship between hydrogen sulfide exposure and taurine levels in maternal rats. Proc West Pharmacol Soc 33:177-179, 1990.
Hayden LJ, Goeden H, and Roth SH. Exposure to low levels of hydrogen sulfide elevates circulating glucose in maternal rats. J Toxicol Environ Hlth 31:45-52, 1990a.
Hayden LJ, Goeden H, and Roth SH. Growth and development in the rat during subchronic exposure to low levels of hydrogen sulfide. Toxicol Ind Hlth 6(3-4):389-401, 1990b.
Hua MS and Huang CC. A neuro-behavioral study of a patient with acute hydrogen-sulfide intoxication. J Clin Exper Neuropsychology 10(3):328, 1988.
Hulbert WC, Prior MG, Pieroni P and Florence Z. Hyper responsiveness in rats after 5 weeks exposure to hydrogen sulfide. Clin Invest Med 12(4):B89, 1989.
Jappinen P, Vikka V, Marttila O, and Haahtela T. Exposure to hydrogen sulfide and respiratory function. Br J Ind Med 47:824-828, 1990.
Kerger BD, and Barfield L. Current understanding of hydrogen sulfide toxicity with specific reference to regulatory policies and pulp and paper mill emissions. McClaren/Hart Environmental Engineering, Irvine, CA, 1992.
Kosmider S, Rogala E, and Pacholek A. Electrocardiographic and histochemical studies of the heart muscle in acute experimental hydrogen sulfide poisoning. Arch Immunol Et Ther Exper 15:731-740, 1967.
Lopez A, Prior M, Yong S, Albassam M, and Lillie L. Biochemical and cytological alterations in the respiratory tract of rats exposed for 4 hours to hydrogen sulfide. Fund Appl Toxicol 9:753-762, 1987.
Lopez A, Prior M, Lillie L, Gulayets C, and Atwal O. Histologic and ultra structural alterations in lungs of rats exposed to sub-lethal concentrations of hydrogen sulfide. Vet Pathol 25:376-384, 1988a.
Lopez A, Prior M, Yong S, Albassam M, Lillie L, and Lefebure M. Nasal lesions in rats exposed to hydrogen sulfide for four hours. Am J Vet Res 49(7):1107-1111, 1988b.
McDonald JM, and McIntosh AP. Fatalities from hydrogen sulfide in wells. Arch Ind Hyg And Occup Med 3(5):445-447, 1951.
Milby TH. Hydrogen sulfide intoxication. J Occup Med 4(8):431-437, 1962. NIOSH (National Institute for Occupational Safety and Health). Criteria for a recommended standard-hydrogen sulfide.
U.S. Department of Health and Human Services, Public Health Service. NIOSH Publ No 77-158, 1977. Ohya I, H, Komoriya and Bunai Y. Discoloration of surface of the brain and liver in a case of fatal hydrogen sulfide
intoxication. Res Pract Forensic Med 28(0):119-123, 1985. Osbern LN, and Crapo RO. Dung lung: A report of toxic exposure to liquid manure. Ann Intern Med 95(3):312-314,
1981. Saillenfait A, Bonnet P, and deCeaurriz J. Effects of inhalation exposure to carbon disulfide and its combination with
hydrogen sulfide on embryonal and fetal development in rats. Toxicol Lett 48:57-66, 1989. Spolyar LW. Three men overcome by hydrogen sulfide in starch plant. Ind Health Monthly 11(8): 116-117, 1951. Thoman M. Sewer gas: Hydrogen sulfide intoxication. Clin Toxicol 2(4):383-386, 1969. U.S. EPA. Health Assessment Document for Hydrogen Sulfide. Office of Health and Environmental Assessment,
Environmental Criteria and Assessment Office, Research Triangle Park, NC. EPA/600/8-86/026A. (External Review Draft), 1990.
Wasch HH, Estrin WJ, Yip P, Bowler R, and Cone JE. Prolongation of the P-300 latency associated with hydrogen sulfide exposure. Arch Neurol 46(8):902-4, 1989.
The principal and supporting studies used for the EPA health risk assessment and inhalation RfC calculation for H2S include: Adelson L, and Sunshine I. Fatal hydrogen sulfide intoxication. Report of three cases occurring in a sewer. Arch Pathol
81:375-380, 1966. Ahlborg G. Hydrogen sulfide poisoning in shale oil industry. Arch Ind Hyg Occup Med 3:247-266, 1951. Andrew FD, Renne RA, and Cannon WC. Reproductive toxicity testing for effects of H2S in rats. In: Pacific Northwest
Laboratory Annual Report for 1979. Prepared for the U.S. Department of Energy, Richland, WA. Report No. PNL-3300 PTI. 276-278, 1980.
Anonymous. Occupational fatality following exposure to hydrogen sulfide-Nebraska. MMWR, 35(33): 533-5, Aug 22, 1986.
Arnold IM, Dufresne R, Alleyne B, and Stuart P. Health implication of occupational exposures to hydrogen sulfide. J Occup Med 27(5):373-376, 1985.
182
Beauchamp RO, Bus, JS, Popp JA, Boreiko CJ, and Andjelkovich DA. A critical review of the literature on hydrogen sulfide toxicity. CRC Crit Rev Toxicol 13:25-97, 1984.
Burnett W, King E, Grace M, and Hall W. Hydrogen sulfide poisoning: Review of 5 years' experience. CMA Journal 117:1277-1280, 1977.
Campanaya M, Sanz P, Reig R, et al. Fatal hydrogen sulfide poisoning. Med Lav 80(3):251-3, May-June,1989. CIIT (Chemical Industry Institute of Toxicology). 1983a. 90-Day vapor inhalation toxicity study of hydrogen sulfide in
B6C3F1 mice. U.S. EPA OTS Public Files. Fiche No. 0000255-0. Document No. FYI-OTS-0883-0255. CIIT (Chemical Industry Institute of Toxicology). 1983b. 90-Day vapor inhalation toxicity study of hydrogen sulfide in
Fischer-344 rats. U.S. EPA OTS Public Files. Fiche No. 0000255-0. Document No. FYI-OTS-0883-0255. CIIT (Chemical Industry Institute of Toxicology). 1983c. 90-Day vapor inhalation toxicity study of hydrogen sulfide in
Sprague-Dawley rats. U.S. EPA OTS Public Files. Fiche No. 0000255-0. Document No. FYI-OTS-0883-0255. Deng JF, and Chang SC. Hydrogen sulfide poisonings in hot-spring reservoir cleaning: Two case reports. Am J Ind Med
11(4):447-51, 1987. Frank R. Acute and chronic respiratory effects of exposure to inhaled toxic agents. Occupational Respiratory Diseases,
J.A. Merchant, ed. Division of Respiratory Disease Studies, Appalachian Laboratory for Occupational Safety and Health, National Institute for Occupational Safety and Health, U.S. Department of Health and Human Services. DHHS (NIOSH) Publ. No. 86-102. 571-605, 1986.
Haggard HW. 1925. Toxicology of hydrogen sulfide. J Ind Hyg Toxicol 7(3):113-121, 1925. Hannah RS, and Roth SH. Chronic exposure to low concentrations of hydrogen sulfide produces abnormal growth in
developing cerebral Purkinje cells. Neuroscience Lttrs 122(2):225-228, 1991. Hannah RS, Bennington R, and SH Roth. 1990. A relationship between hydrogen sulfide exposure and taurine levels in
maternal rats. Proc. West Pharmacol Soc 33:177-179. Hannah RS, Hayden LF, and Roth SH. Hydrogen sulfide exposure alters the amino acid content in developing rat CNS.
Neuroscience Lttr 99(3):323-327, 1989. Hayden LJ, Goeden H, and Roth SH. Exposure to low levels of hydrogen sulfide elevates circulating glucose in maternal
rats. J Toxicol Environ Hlth 31:45-52, 1990a. Hayden LJ, Goeden H, and Roth SH. Growth and development in the rat during subchronic exposure to low levels of
hydrogen sulfide. Toxicol Ind Hlth 6(3-4):389-401, 1990b. Hua MS, and Huang CC. A neuro-behavioral study of a patient with acute hydrogen-sulfide intoxication. J Clin Exper
Neuropsychology 10(3):328, 1988. Hulbert WC, Prior MG, Pieroni P, and Florence Z. Hyperresponsiveness in rats after 5 weeks exposure to hydrogen
sulfide. Clin Invest Med 12(4):B89, 1989. Jappinen P, Vikka V, Marttila O, and Haahtela T. Exposure to hydrogen sulfide and respiratory function. Br J Ind Med
47:824-828, 1990. Kerger BD, and Barfield L. Current understanding of hydrogen sulfide toxicity with specific reference to regulatory
policies and pulp and paper mill emissions. McClaren/Hart Environmental Engineering, Irvine, CA, 1992. Kosmider S, Rogala E, and Pacholek A. Electrocardiographic and histochemical studies of the heart muscle in acute
experimental hydrogen sulfide poisoning. Arch Immunol et Ther Exper 15:731-740, 1967. Lopez A, Prior M, Lillie L, Gulayets C, and Atwal O. Histologic and ultrastructural alterations in lungs of rats exposed to
sub-lethal concentrations of hydrogen sulfide. Vet Pathol 25:376-384, 1988a. Lopez A, Prior M, Yong S, Albassam M, and Lillie L. Biochemical and cytological alterations in the respiratory tract of
rats exposed for 4 hours to hydrogen sulfide. Fund Appl Toxicol 9:753-762, 1987. Lopez A, Prior M, Yong S, Albassam M, Lillie L, and Lefebure M. Nasal lesions in rats exposed to hydrogen sulfide for
four hours. Am J Vet Res 49(7):1107-1111, 1988b. McDonald JM, and McIntosh AP. Fatalities from hydrogen sulfide in wells. Arch Ind Hyg Occup Med 3(5):445-447,
1951. Milby TH. Hydrogen sulfide intoxication. J Occup Med 4(8):431-437, 1962. NIOSH (National Institute for Occupational Safety and Health). Criteria for a recommended standard-hydrogen sulfide.
U.S. Department of Health and Human Services, Public Health Service. NIOSH Publ 77-158, 1977. Ohya I, Komoriya H, and Bunai Y. Discoloration of surface of the brain and liver in a case of fatal hydrogen sulfide
intoxication. Res Pract Forensic Med 28(0):119-123, 1985. Osbern LN, and Crapo RO. Dung lung: A report of toxic exposure to liquid manure. Ann Intern Med 95(3):312-314,
1981. Saillenfait A, Bonnet P, and deCeaurriz J. Effects of inhalation exposure to carbon disulfide and its combination with
hydrogen sulfide on embryonal and fetal development in rats. Toxicol Lett 48:57-66, 1989. Spolyar LW. Three men overcome by hydrogen sulfide in starch plant. Ind Health Monthly 11(8):116-117, 1951. Thoman M. Sewer gas: hydrogen sulfide intoxication. Clin Toxicol 2(4):383-386, 1969.
183
U.S. EPA. Health Assessment Document for Hydrogen Sulfide. Office of Health and Environmental Assessment, Environmental Criteria and Assessment Office, Research Triangle Park, NC. EPA/600/8-86/026A. (External Review Draft), 1990.
Wasch HH, Estrin WJ, Yip P, Bowler R, and Cone JE. Prolongation of the P-300 latency associated with hydrogen sulfide exposure. Arch Neurol 46(8):902-4, 1989.
APPENDIX B References for ATSDR Exposure Limit Recommendations ATSDR, Toxicological Profile for Ammonia, TR-90-03, U.S. Department of Health and Human Services, Public Health
Service, Agency for Toxic Substances and Disease Registry, December, 1990. ATSDR, Toxicological Profile for Hydrogen Sulfide, U.S. Department of Health and Human Services, Public Health Service,
Agency for Toxic Substances and Disease Registry, July, 1999.
184
Chapter 9. Relevant Laws, Regulations and Decisions
David Osterberg Associate Professor
Department of Occupational and Environmental Health University of Iowa
Stewart W. Melvin Professor
Department of Agricultural and Biosystems Engineering Iowa State University
185
9.1 Introduction Air emissions and odor from Concentrated Animal Feeding Operations (CAFOs) has become the subject of discussion and government action in a number of states. Sometimes the news media, environmental disasters or the large number of constituent contacts, push legislative changes or administrative action on how CAFOs are sited and managed. Occasionally a new scientific study on the topic changes the tone of the debate. This chapter documents action taken to regulate and manage CAFO air emissions and odor in jurisdictions outside Iowa. It gives examples of the kind of control various levels of government have imposed on the management of these facilities in an attempt to balance economic advantage with public health and welfare. 9.2 Distinguishing the Consequences of Air Emissions: Nuisance or Health Effects Air emissions from animal waste storage systems, buildings and land application of animal waste contain a number of gasses and particles that include hydrogen sulfide, ammonia, methane, particulate matter and bioaerosols. Hydrogen sulfide is an example of a substance that is both a direct toxic health risk and odorous. Furthermore, this odorous substance, as well as other odorous substances, may also cause adverse health symptoms, from an indirect toxic mechanism via interactions with the central and peripheral nervous system. [See Chapter 6] Odorous compounds also decrease the quality of life of neighbors. Hydrogen sulfide, for instance, causes corrosion of metals and damage to plants. When a state or local government acts to reduce air emissions, it might describe this as intervening to protect public health or to enhance the quality of life or the government may say nothing about what motivates its action. The Minnesota Pollution Control Agency (MPCA) places limits on hydrogen sulfide emissions at CAFOs. Minnesota is similar to other states that have recently intervened to reduce air emissions from a type of activity that was formerly thought to be only a local issue.
In the past, the Minnesota Pollution Control Agency (MPCA) has viewed odors as a natural result of animal production that could best be addressed through good land use planning, with the primary responsibility for land use planning at the local level of government (see Minn.R. 7020.0100).1
Just as states have struggled to determine whether state or local regulation is appropriate, they have not found it simple to distinguish the rationale for regulation. It is not simple to say which air emission is a health issue and which a nuisance. Rather there is a continuum from life threatening acute health effects, through acute effects that are not life threatening, to chronic effects that appear after longer exposure, to annoyance smell. Odor or a constituent part of the air emission can have a range of effects. Consider this example. Two Minnesota agencies, the MPCA and the Minnesota Department of Health (MDH) have established values to limit the various adverse effects from hydrogen sulfide emissions from CAFOs. The MDH explains why both agencies have acted.
The MPCA standard for hydrogen sulfide will protect against symptoms of headache, nausea, and maintain a quality of life for Minnesotans. The MDH acute Health Risk Value (HRV) will protect against respiratory effects by ensuring that hydrogen sulfide is included in
186
hazard indexes calculations where hydrogen sulfide is one of many chemicals emitted to air potentially having respiratory impacts.2
9.3 Minnesota GEIS on Animal Agriculture The state of Minnesota has recently brought the scientific and public policy community together to advise state government on how to proceed on several CAFO issues. This extensive process resulted in a Generic Environmental Impact Statement (GEIS) for animal agriculture that was presented at a public hearing on December 10, 2001. Because the technical work papers for the GEIS date from the first half of 2001, this chapter relied heavily on three GEIS Technical Work Papers -- Air Quality and Odor, Role of Government, and Human Health. One finding of the GEIS Technical Work Papers is that air quality has not been the driving force behind government action.
Existing laws and programs have mostly emerged out of a long-standing concern over surface water impacts, which, while valid, have meant that air, groundwater and other emerging issues are not adequately factored into government decision-making.3
Government’s slow involvement with air emissions and odor is substantiated by data presented in 1998 survey on Animal Confinement Policy designed by a National Task Force of 15 Extension Specialists representing all regions of the nation. For only 13 of 48 states did those surveyed answer yes to the following question: Are odor standards imposed as a matter of state government policy or court decisions in your state?4 More than twice as many states regulate discharge to surface water. However, some states like Missouri, which recorded an answer of ‘no’ to the preceding question, now have odor standards. 9.3.1 Iowa We will discuss Iowa CAFOs at length below. However it is informative to see the view of our state from our neighbor to the north. The Minnesota GEIS Technical Work Paper on Air Quality and Odor Impacts investigated regulatory programs in a number of states including Iowa. According to the researchers,
{d}espite having an estimated 3,000 large animal feeding operations that have the capacity for more than 1,000 animal units and receiving many odor complaints from neighbors, the State of Iowa has essentially no program in place for addressing odors or air emissions from animal agriculture facilities.5
This strong language points to the inadequacy of present Iowa rules and regulations. However, two members of this research team, one from the University of Iowa and one from Iowa State University were part of a study group which put the following language into Iowa Administrative Rules of the former Air Quality Commission in 1977 when an odorous substance standard was defined as:
The emission of an odorous substance from an odorous substance source shall constitute a violation of these rules if the emission is of such frequency, duration, quality, and intensity to be harmful or injurious to human health and welfare, or as to unreasonably interfere with the comfortable use and enjoyment of life and property or so as to constitute a nuisance as defined in sections 657.1 and 657.2 of the Code.
187
The former paragraph was part of the state Administrative Code for only a short time. The rule was rescinded in 1984 when the term “odorous substances” was also deleted from the Administrative Rules.*6 While the Minnesota GEIS was our starting point to seek out governmental action on air and odor, we also talked to government officials and staff of non-governmental organizations in pork producing states. We have omitted setback requirements, one type of policy that nearly every state has adopted to reduce the effects of air emissions and odor from CAFOs. We will look at regulations for three constituents of air emissions, hydrogen sulfide, ammonia and odor. We will look at local government activities and we will look at the results of action in the courts. In each category, rather than an exhaustive look we will choose a few jurisdictions to serve as exemplars for the kind of government intervention to control CAFO air emissions. 9.4 Hydrogen Sulfide Standards The Agency for Toxic Substances and Disease Registry (ATSDR) of the US Department of Health and Human Services, lists 24 states with regulations or guidelines for hydrogen sulfide. In this section we will look at three states with regulations especially relevant to CAFOs.7 9.4.1 Minnesota Minnesota is interesting because it addresses air quality issues from animal agriculture in several ways. First, the MPCA maintains a two-component Ambient Air Quality Standard for hydrogen sulfide. 50 parts per billion (ppb) is not to be exceed for ½ hour twice per year and 30 ppb is the ½ hour average not to be exceed more than 2 times in any 5 consecutive days.8 These are emitter property line standards for animal feeding operations over 1000 animal units in size. Second, subsequent to establishing these standards, another Minnesota agency, the MDH, proposed a draft acute Inhalation Health Risk Value (HRV) for hydrogen sulfide of 60 ppb as a 1-hour average and a draft subchronic (3-month average) HRV of 7 ppb.9 These standards are evaluated at the receptor rather than the emitter’s property line. The MDH plans to adopt both HRVs without public hearing in the very near future. In addition, the state addresses air quality issues from CAFOs by requiring each facility with a capacity of 1000 animal units to include an Air Emission Plan in its water quality permit. The many different air emission limits in a single state for only one constituent makes clear the difficulty in describing laws, regulations and decisions relating to CAFO air emissions and odor. Many authors do not make a distinction between air emissions and odor or between health effects and nuisance. In this chapter we will deal with both odor and air emissions and will try to record accurately which a particular law, regulation or decision is being referred to. 9.4.2 Nebraska The Nebraska Department of Environmental Quality (NDEQ) implemented an ambient air quality health-based standard of 100 ppb for total reduced sulfur (TRS) in September 1997 (Revised January 1999). The impetus for this action was industrial emissions in Dakota City, Nebraska and not
* Rule 400--4.5 was published as an adopted and filed rule on 6/16/77. On 6/22/83 the rule was transferred to WAWM as rule 900--23.5. An amendment published 9/12/84 changed the catchwords from "Odorous substances" to "Anaerobic lagoons"; rescinded subrules 23.5(1) and 23.5(2) and renumbered subrules 23.5(3) and 23.5(4) as 23.5(1) and 23.5(2), respectively. Rule 23.5 is still in the Iowa Administrative Code.
188
CAFOs. However, since the revision in 1999, the standard applies to CAFOs. NDEQ prepared an extensive background research paper that focused on low-level exposure to hydrogen sulfide and TRS through inhalation.10
Total Reduced Sulfur (TRS) consists of the total sulfur from the following compounds: hydrogen sulfide (H2S), methyl mercaptan (CH3SH), dimethyl sulfide ((CH3)2S), and dimethyl disulfide (CH3SSCH3) (87). These TRS compounds occur naturally in the environment. H2S makes up the greatest proportion of TRS.11
As part of their research paper, NDEQ surveyed the 49 other states and found 27 states that had standards for H2S or TRS. These states based standards on a variety of issues including, odor or nuisance, welfare effects, and health effects. Standards varied considerably to as low as 0.7 ppb for a yearly average (New York) and 5 ppb averaged over 24 hours (Pennsylvania). Many of the standards were based on nuisance including Minnesota’s 30 ppb and 50 ppb standards. The lowest standard that was reported to be health based was a 10 ppb 8-hour 10 ppb standard (Illinois).12 The authors of the background research paper recommended Nebraska’s present health standard of 100 ppb, averaged over 30 minutes. The authors also recommended a much lower 30-day standard of 10 ppb or 5 ppb (depending on average humidity level in the air) to protect against other effects of sulfur compounds. While the state adopted the 100 ppb health-based standard, it has not yet adopted the lower, welfare standard for TRS. 9.4.3 California The California Ambient Air Quality Standard (CAAQS) for hydrogen sulfide of 30 ppb for one hour was adopted in 1969 and reviewed but not changed in 1980 and 1984. A year 2000 review states the purpose of the standard was to decrease odor annoyance from industry rather than CAFOs. However, the review notes that significant adverse health effects might occur at levels of exposure below the CAAQS.13 More recently, the California Office of Environmental Health Hazard has adopted a chronic reference inhalation standard of H2S at 8 ppb. The three states give three motivations for a sulfurous emission standard. Nebraska has a health-based standard of 100 ppb, averaged over 30 minutes at the receptor. Minnesota’s health standards vary from an acute 60 ppb 30-minute standard to a sub-chronic 7 ppb, 3-month standard measured at the receptor or nearer the source of the emission. The state also has two nuisance-based property line standards of 50 ppb and 30 ppb averaged over 30-minutes. California’s much older 30 ppb for one hour standard is based on nuisance but the state is looking into whether significant adverse health effects might occur at similar levels. The California Office of Environmental Health Hazard has adopted a chronic reference inhalation standard of hydrogen sulfide of 8 ppb.14 Standards for the three states as well as for federal agencies and the World Health Organization are contained in Table 1. 9.5 Ammonia Measurements The ATSDR has published a toxicological profile for ammonia, which contains a list of regulations and advisories from various states. The list of acceptable ambient air concentration levels for Ammonia based on 1988 information, contains standards in place in 11 states.15 (See Appendix and Table 2.) The ammonia standards for the three following jurisdictions are contained in Table 2 at the end of the chapter.
189
9.5.1 Minnesota Besides establishing a Health Risk Value (HRV) for hydrogen sulfide, the Minnesota Department of Health has filed a draft HRV for ammonia as well. This HRV, like the other, will receive final approval in the next few months. Both HRVs are scientifically measured standards that protect the public from adverse health effects. The point of measurement would often be at the receptor but it is possible that the agency will take measurements at the property line as well. A brochure prepared for the public explains that being below the HRV does not necessarily take care of odor problems.
However, keeping emissions at or below the HRV does not necessarily eliminate odors from the agricultural animal operation and may not eliminate health effects from odors.16
9.5.2 Netherlands While The Netherlands is very different from any US state, it is similar in terms of livestock production.17 18 The numbers of livestock animals in The Netherlands are 14 million hogs, 108 million chickens, 4.2 million cattle and 1.4 million sheep. On four times as much land mass Iowa has 15 million hogs, 37.8 million chickens, 3.7 million cattle and 270,000 sheep. In The Netherlands, ammonia emissions from agriculture are responsible for 42% of the acidification attributable to domestic sources. Policies set forth in the 1990s aim to reduce by 70% the ammonia emissions compared to the 1980 benchmark. The European Union is working on a directive to reduce ammonia emissions that is being modeled after the Dutch regulation. Features of the Dutch policy that regulates phosphate, nitrogen and ammonia include a mandated reduction of the pig population by 10%, compulsory minerals accounting and reporting by all intensive livestock farms, a total ban on application of manure in autumn and winter, a ban on application on frozen ground, compulsory use of injection manure application, compulsory covering of manure storage tanks and reservoirs, strict requirements for ammonia emissions from intensive livestock facilities including a requirement that all new livestock housing meet the strict ALARA (as low as reasonably achievable) standards. All facilities will be required to meet ALARA by 2008. Farmers must have adequate manure storage facilities to store their manure from September through February. Methane and nitrous oxide arising from CAFOs are greenhouse gases that may contribute to global climate change. In The Netherlands, agricultural activities account for an estimated 45% of the total methane emissions and 35 to 40% of the N2O emissions. Measures being taken to reduce ammonia emissions should allow The Netherlands to reduce greenhouse gas emissions to levels mandated by the Kyoto Protocol. Thus far, the U.S. has not taken any steps to control emissions of greenhouse gases from livestock production. 9.5.3 Missouri The Missouri Department of Natural Resources has been monitoring a Premium Standard Farm (PSF) concentrated animal feeding operation in northern Missouri since the beginning of 2000.19 Hydrogen sulfide and ammonia concentrations are monitored on a 24-hour basis. The monitor has recorded high concentrations of both ammonia and hydrogen sulfide. Missouri has an ambient air standard for hydrogen sulfide and an ambient acceptable level (AAL) for ammonia of 144 ppb. The Department added a second monitor at another PSF facility late in Fall 2001.20
190
The Missouri Department of Health, the Missouri Department of Natural Resources, the US EPA and the US Agency for Toxic Substances & Disease Registry cooperated in a health evaluation near some of PSF's facilities in the fall of 2001. The health evaluation concentrated on the two pollutants hydrogen sulfide and ammonia. A health evaluation is to determine if a more full-scale health study is needed. The results of the evaluation have not been released.20 In a recent Consent Decree with the US EPA and a citizen’s group, PSF has agreed to continue to monitor for a number of air emissions including ammonia.21 9.6 Odor legislation States can regulate air emissions without referring to a specific chemical constituent. The 1998 national survey of animal confinement policies, referred to above, found thirteen states where odor standards were imposed as a matter of state policy or court decisions.4 We look at three states that require that odor from CAFOs be held below a threshold. In Missouri and Colorado, the threshold is based on a dilution standard. The Colorado dilution standard of 7:1 means that an air sample collected at the emitter property line is diluted with seven volumes of fresh air. If odor can still be detected by using an olfactometer and panel of smellers, there is a violation. (See description in section 3.4) North Carolina has an idiosyncratic method of deciding on an odor violation, which is covered below. Table 3 summarizes the information in this section. 9.6.1 Missouri On January 1, 2002, all very large CAFOs in Missouri must have an odor control plan in place describing measures to be used to control odor emissions (10 CSR 10-3.090, Code of State Regulations). All Class 1A CAFOs, those having more than 7000 animal units must comply (twenty-one facilities in total). This air quality specific program approach dates from 1999. A number of farm organizations went to court alleging the state lacked authority to regulate emissions. The state has prevailed at the County Circuit Court and the Missouri Court of Appeals.22 At this time only 1 of Missouri's 21 Class 1A CAFOs has an approved odor control plan. All the others have not been approved. In general, the disapproved odor control plans lacked specific odor control and reduction strategies. Nearly all of the CAFO owners have appealed the state's disapproval of their plans.20 Missouri uses a dilution threshold as a standard. An instrument called a scentometer is used in the field at a dilution threshold of 5.4:1 to determine if a significant odor is present. If odor is detected, an air sample is taken and sent for further evaluation by an olfactometry panel. If the panel detects the odor at a dilution threshold of 7:1 or greater, or at an intensity greater than a reference standard of 225 ppm of n-butanol, then a violation has occurred. 9.6.2 North Carolina North Carolina CAFOs with liquid waste systems are required to first meet a number of best management practices for things such as dead animal disposal. Besides these management practices requirements, certain swine operations fall under the regulation’s complaint response and odor management program. Compliance with the rules depend on facility size and distance from an occupied residence, business, school, hospital, church, outdoor recreation facility, park, historic property, or childcare center. According to materials gathered in the Minnesota GEIS process, the North Carolina complaint response system is quite involved and seems to be a time consuming process. It consists of the following steps. Complaint response system
191
When a citizen complains to the state, they are asked to log complaints and weather conditions for 30 days on a form provided by the North Carolina Air Quality Division (NCDAQ). Once the logbook is returned to the state, the following formal investigation takes place. a. An inspection is scheduled during weather conditions and time of day similar to when typical
objectionable odor was reported b. Evaluation is made at the location of the residence of the complainants c. An “odor snapshot” is made by regional office investigator (one of 5 rankings) d. The snapshot evaluation is reported to a regional supervisor e. The regional office submits a recommendation to Division Director f. The Division of Air Quality Director makes a final decision whether an objectionable odor
exists. If a determination of Objectionable Odor is made, the NCDAQ will require a Best Management Plan (BMP) of a facility—this is a revision of the original submitted plan. The BMP must be submitted within 90 days. Then ensues a process of plan approval and revision. If the BMP is found to be inadequate, the NCDAQ notifies the operation that it must submit a revised BMP under the same time schedules. Only then can the state order a facility to initiate any specific action.
If the revised plan fails to adequately control, odors, the facility is required to install add-on control equipment and must submit a permit application for this installation within 90 days of receiving notification that their revised BMP was not adequate.24
Thus far only 25 facilities have had an Objectionable Odor determination. Each is currently in the process of providing a BMP to NCDAQ. As of early 2001, none had moved to the final step in the process, the installation of add-on control technology. 9.6.3 Colorado Missouri and North Carolina demonstrate the significant length of time required to decide what action to take to abate odor. A different approach was followed by the state of Colorado where a referendum on the state ballot led to regulations addressing odorous gases and odor emissions from new and existing housed commercial swine feeding operations. The list of rules is extensive. They include, a cover requirement of anaerobic process wastewater lagoons, aerobic lagoon requirements, land waste application setback requirements, and mortality waste handling requirements. Housed commercial swine feeding operations must use technologies to minimize off-site odor emissions from all aspects of the operation (confinement structures, waste treatment facilities, manure management and land application), develop a comprehensive odor management plan and obtain an operating permit. The regulation applies to all CAFOs that contain more than 800,000 pounds of live animal weight. Colorado CAFOs of this size must meet two ambient odor concentration standards, a dilution standard of 7:1 at the facility boundary and a dilution standard of 2:1 at any receptor (building, school or a municipal boundary). “The plans must also identify the odor monitoring that the facility intends to conduct in order to ensure compliance with the odor standards identified above.”25 While the requirements apply to more than 110 individual facilities, there are only eight owners of these facilities. The new regulations have reduced odor complaints substantially according to Phyllis Woodford of the Department of Public Health and the Environment.26
192
9.7 County and Local Action Citizens who are not satisfied with state level governmental action to mitigate the effects of CAFOs have two other venues to protect their rights. They may pursue restrictions at the local government level or they can go to court in a private cause of action. Rural counties have not generally adopted the zoning protection of more urban areas. However this seems to be changing.27 In Missouri, reticence to zoning restrictions in a rural county was overcome by the arrival of large confinement operations. A resident of a township next to Premium Standard Farm’s facility in Missouri, describes the area’s change of view that caused it to adopt zoning.
You’ve got to make plans and provide for the control of the situation before it occurs. Otherwise, by the time you realize you need zoning, its too late, and they’ve set the hook.28
While the eminent arrival of a CAFO might cause citizens to demand more protection from local government, local government is often prevented from playing a part in how CAFOs are regulated. State legislation to regulate animal agriculture has often been passed with the provision that local governments are prevented from intervening. Preemption of local action has been widely discussed in the literature.27 Abdalla and Becker give several examples of the preemption of local government’s abilities to deal with CAFOs. The authors explain resort to preemption laws by agricultural interests as simple economics.
The economics of political influence clearly leads to a general preference for state level regulatory authority by organized interest groups. Monitoring and lobbying at the state level is much less expensive than providing these services at hundreds of local governmental units.29
9.7.1 Iowa In Kuehl v. Cass County (1996) the Iowa Supreme Court held that all agriculture, including an animal feeding operation, is exempt from any county zoning. Before this decision, Humboldt County adopted four ordinances governing “large livestock confinement feeding facilities.” While a district court upheld three of the ordinances, as a proper application of “home rule” authority, the Iowa Supreme Court struck down all the ordinances in their decision in Goodell v. Humboldt County, Iowa in 1998.30 Presently an ordinance from Worth County is proceeding through the courts. This will test whether counties can regulate CAFOs based on public health. Whatever the outcome of the latest case, the Iowa preemption law has made county government reticent to try to regulate the location of CAFOs. 9.7.2 North Carolina A website at the School of Public Health at the University of North Carolina contains reports on six county in the state that have passed ordinances regulating CAFOs. Ordinances required such things as operating permits, closure plans, graduated setback requirements and well testing. The Moore County ordinance for instances, required that confinement buildings and lagoons be set 2 miles from any golf course.31 In 2001, two North Carolina court decisions struck down two county ordinances and put the remainder in jeopardy. The courts found that the General Assembly did not want to impose an unnecessary economic burden on hog production caused by each county passing its own set of rules. Chatham County has appealed the Court of Appeal's decision to the NC Supreme Court. A decision is expected in early 2002.32
193
9.7.3 South Carolina The preemption strategy is not always successful as demonstrated by an attempt in South Carolina to push local government out of the regulatory picture.
What started out as an attempt to adopt state laws that preempt counties from enacting measures to deal with confined animal feeding operations resulted in a measure that provides for considerable regulation of the activity and significant local involvement in the process.33
9.8 State Moratorium on Expansion We have omitted one form of government action to this point. Moratoria have sometimes been adopted to give state officials time to review and update environmental regulations. In April 2001, Governor Jim Hodges of South Carolina imposed a 15-day moratorium on CAFO expansion to give environmental regulators more time to consider permit regulations.34 Short-term limitations on any expansion of CAFOs also have taken place in Kentucky, Missouri and Arkansas.30 In one state the controversy over CAFO expansion has been so contentious that a continuous moratorium on large CAFO expansion has been put in place. North Carolina placed a two-year moratorium on the expansion of CAFOs with lagoon systems, when House Bill 515 passed in 1997. The moratorium has been extended twice and is now due to expire in September 2003.35 Such reaction leads one to speculate whether stricter regulation earlier in the process may have better for the industry in North Carolina. The moratorium originally resulted from a number of lagoon breaks but also from the perception that the original regulation was too lax. It is not even clear that weak legislation, preferred by nearly every industry, is in the best interest of producers in other parts of the nation.
The Mo and Abdalla study found that overall, the stringency of environmental regulation did not appear to impact hog inventory growth.” and “…the amount of staff devoted to animal waste management had an unexpected, but strongly positive relationship to hog inventory growth.36
9.9 Individual Legal Action Local citizens have access to the courts where one can bring a private cause of action under nuisance. However, in many states, state government has attempted to blunt individual legal action through “right to farm” legislation. Hamilton explains the motivation for such statutes.
Most lawyers and farmers have more than a passing familiarity with the legal concept upon which the laws were originally based—existing farm operations should not become nuisances due to the later development of non-agricultural uses in the surrounding area.37
Right to farm legislation has prevented neighbors and environmental groups from using individual nuisance action to require management changes or new locations for CAFOs. DeLind found that successful court action by neighbors against a Michigan swine confinement operation was the impetus for changing the law to give neighbors fewer rights by providing right to farm protection for what she calls hog hotels.38
The official outcome, in other words, undermined both the original set of grassroots concerns and weakened the basis for further local-level action and representation.39
However, courts in several states including Iowa have ruled that right to farm laws give only limited protection from nuisance action. Richardson and Feitshans point to the Bormann case decided in
194
1998 by the Iowa Supreme Court as reducing the effectiveness of this protection for animal agriculture.40 In that case, removing a citizen’s right to nuisance action within a declared agricultural area was found to be a categorical taking of private property for public purposes without just compensation. Thus, the Iowa Legislature had exceeded its authority by authorizing the use of property in such a way as to infringe on the rights of others.41 In addition to limiting nuisance suits, another method of reducing the risk of animal agriculture operations from individual legal action has been the “fee shifting” provision. Hamilton gives the example of a 1995 Iowa law that assesses all costs and expenses of the defense side to the losing plaintiff in a nuisance action against a CAFO. Hamilton finds that “From a legal standpoint there are several reasons why this type of “soft” fee shifting is not a significant threat to most people who would file a nuisance challenge.”42 In the last several months, two Iowa cases have set the stage for an expansion of the Bormann decision to land not in a designated agricultural area. In August 2001, an Iowa district court judge ruled for the first time that an Iowa law that protects CAFOs against nuisance suits is unconstitutional.43 The decision allowed the Gacke case against Pork Xtra, L.L.C. to proceed in a Sioux County, Iowa court.44 In January 2002, Pork Xtra was assessed $100,000 in damages.45 In December 2001, a court in Calhoun County Iowa made a similar determination that the defendants in Kleemeier v. Beazly Group, Inc and Pork Innovations could go forward. The judge found that the defendant’s affirmative defense against nuisance action by neighbors had relied on an unconstitutional statute.46 Actual examples of substantial plaintiff victories from CAFOs under nuisance exist in other states. On September 9, 2001 Buckeye Egg Farm in Ohio, was hit with a judgment of $19.7 million for nuisance violations including fly infestations and odor. According to Feedstuffs, Buckeye, which has barn capacity of 11 million hens and 4 million chicks, is considering bankruptcy protection. Buckeye is the fifth largest commercial egg producer in the U.S.47 Nuisance need not be only a private court action. The Illinois Attorney General is presently prosecuting at least two swine CAFO operations under two counts of state law--air pollution and public nuisance--as well as under a third count of common law nuisance. There are two noteworthy dimensions of these cases. First, the Illinois AG cites considerable case law indicating that technical measures and depictions of odor and emissions are not required to prosecute air pollution and nuisance violations. Indeed, the nuisance statute itself was created, in part, to allow general citizens equitable access to courses of legal action without recourse to expensive technical measurements or scientific assessments. In fact, a ruling by a Ninth Circuit Court Judge in one of these cases, affirmed the evidentiary possibility of neighbors proving their case by experiential testimony. Moreover, the state Illinois Environmental Protection Agency (IEPA) that follows-up on odor complaints, does not conduct technical assessments of odor or emissions. Instead, representatives from the IEPA will respond to neighbor odor complaints by making site visits and carefully documenting the presence or absence of odor with their own sensory judgments. Interestingly, the IEPA has issued warnings to prospective CAFO builders and operators (prior to construction of a CAFO) that just because they receive an approved state operating permit does not preclude action against them for violating the state’s odor and nuisance standard. In fact, there are cases in Illinois where the Illinois Department

195
of Agriculture will issue an approval for construction and operation while the IEPA will issue a simultaneous warning of potential air quality violations against neighbors. It should be noted that the air pollution and nuisance statutes of Illinois are similar, if not identical to those found in other states. Hence the issue becomes not one of statutory authority of the Attorney General to prosecute such cases on behalf of neighbors, but more likely a political decision based upon a weighing of competing interests. More importantly, these statutes and associated case law recognize the evidentiary value of experiential assessments of odor by neighbors. 9.10 Non Regulatory Approaches 9.10.1 North Carolina In July 2000, then North Carolina Attorney General Mike Easley signed an agreement that required Smithfield Foods, by far the state’s largest pork producer, to pay $15 million to fund research and testing on better technologies to treat hog waste. Premium Standard Farms has committed $2.5 million for the same research questions under a similar agreement with Easley who is now Governor. In July 2002, a report is due.
Smithfield-affiliated farmers then have three years to convert their facilities to the recommended technologies. In addition, the agreement requires Smithfield to pay $50 million for environmental improvements such as mapping and closing abandoned waste lagoons in the eastern half of the state.48
The technologies being examined must make substantial reduction in a number of emissions including ammonia, odor, disease vectors and airborne pathogens. Since this is early in the agreement, it is well to withhold judgment on whether or not Smithfield facilities will solve their odor and water emission problems. 9.10.2 Oklahoma Oklahoma is another state in which a livestock producer has signed an agreement with the State Attorney General to change waste treatment systems at facilities.
Seaboard Farms, the state’s largest corporate hog producer, signed an agreement Tuesday (12/04/01) to spend about $3 million to better treat sewage and -–for the first time – control odors scientifically.49
Seaboard agreed to several measures including installing a manure treatment system similar to human waste treatment systems and agreed to share monitoring results with the state. The agreement allowed the company to open a second 25,000-sow facility similar to the one where the new treatment devices will be installed. 9.10.3 Missouri A third case of a settlement of a court case resulted in changes by Premium Standard Farms (PFS) in Missouri. In 1997 Citizens Legal Environmental Action Network (CLEAN) filed suit against PFS for its waste handling procedures. In 1999, the US EPA joined the citizen suit. Settlement of the court case in Missouri has resulted in a civil penalty of $1,000,000. However PSF was allowed to receive credit for payment of $650,000 to the State of Missouri for a previous State Consent Decree. The PSF website describes the settlement as $350,000.50 The payment of civil penalty was small in comparison to what PSF pledged to invest in upgrades to its facilities in Missouri, which has been
196
reported as high as $50M.51 52 Although the PFS agreement is a legal settlement, we treat it in this section because of the requirement that new technologies be introduced and the joining of government entities in citizen suits. 9.11 Role of Research in Public Policy Government does not always wait for research recommendations before taking action. We have referred often to Minnesota’s Animal Agriculture GEIS process for which the state legislature committed $1.4 million beginning in 1998. While the process was underway, in the 2000 legislative session, the ability of the Minnesota Pollution Control Agency (MPCA) to enforce feedlot rules was compromised as follows.
Lacking evidence of an immediate public health threat, the MPCA may not require operators of feedlots under 300 AU to spend more than $3000 without 75% cost-share, and feedlots under 500 AU cannot be required to spend more than $10,000 without cost-share of 75% of the upgrade, or $50,000, whichever is less.53
One reason to expect legislators not to wait for a research process to be complete is the same reason courts side with neighbors who have only their own experience and not exhaustive studies to impart. When legislators heard from their constituents who produced small numbers of livestock, that they did not want to be caught up in regulations for “the big guys” the legislature acted on what they felt was adequate evidence. Our two colleges have been asked to bring science to regulatory decisions. Similarly in Minnesota and Nebraska, regulatory action was based on a survey of the scientific literature on health and welfare effects of pollutant emissions or on a survey of action in other states. However, both researchers and legislators assert that a scientific recommendation need not necessarily have all the answers before regulations can be promulgated. Regulating air quality from CAFOs can be made on the basis of precaution. The Precautionary principle provides a guide to environmental policy that places the burden on the proponents of a potentially harmful activity to prove that their actions do not harm human health or the environment. The principle has been stated in many different places and contexts. The1998 Wingspread Statement, which is a consensus document produced by those attending a conference on the issue at the Wingspread Conference Center in Wisconsin, states in part:
When an activity raises threats of harm to human health or the environment, precautionary measures should be taken even if some cause and effect relationships are not fully established scientifically. In this context the proponent of an activity, rather than the public, should bear the burden of proof.54
The precautionary principle already forms the basis of at least a dozen treaties and international laws including the 1987 Montreal Protocol on Substances that Deplete the Ozone Layer, the 1992 UN Framework Convention on Climate Change and the 2000 Cartagena Protocol on Biosafety.55 56 57 The precautionary principle has often been applied to the introduction of new chemicals into the environment. Kriebel and Tickner assert that science informs policy in many ways. They find that, “A shift from reaction to precaution is entirely consistent with the core values of public health practice.”58
197
A public health approach to marshalling evidence may be different from a strictly hard scientific approach according to Krimsky. He describes this difference by referring to Type I and Type II scientific errors. He maintains that minimizing false positives is the priority of the hard sciences while a public health perspective prefers to err on the side of overstating risks (prefer type II errors).59 Krimsky demonstrates the wide acceptance of some amount of precaution when he quotes an issue of the journal Chemistry & Industry, which states, “For one thing, it is crucial to avoid even inadvertently suggesting that the ‘no evidence of harm’ somehow equals ‘evidence of no harm.”60 However, when considering implementation of precautionary measures, it is imperative that all consequences of such measures be thoroughly evaluated. 9.12 Conclusion Governments have intervened to mediate between CAFOs and their neighbors in a number of ways. This chapter has sought to demonstrate the range of such intervention. States regulate hydrogen sulfide and TRS. Other states have limited the emissions of odor and ammonia. Local governments have sometimes been allowed to intervene to protect citizens against air emissions, but in most cases the state legislature has reserved this role for itself. Both, where states have acted and where they have not, the courts have intervened to give neighbors of CAFOs protection from air emissions and odor. This chapter is designed to demonstrate to the Iowa DNR and to Iowa government in general that there are examples of Laws, Regulations and Decisions designed to regulate air emissions and odor from CAFOs. Appendix: Federal and International Air Quality Standards Federal Standards CAFO effects on water quality have been addressed by a Unified National Strategy developed by the USDA and USEPA in 1999. Air emission effects of CAFOs have not yet found the same level of federal attention. USDA formed an Agricultural Air Quality Task Force, which has been meeting and in July of 2000 drew up a white paper on research and technology transfer.61 Both the USEPA and the Agency for Toxic Substances and Disease Registry (ATSDR) have standards for both H2S and ammonia. These have been cited in Chapter 8. Specifically for Hydrogen Sulfide, acute exposure guideline levels have been printed in the Federal Register for March 15, 2000.62 There are several Proposed Acute Exposure Guideline Levels (AEGLs) applicable to the general population. AEGL-1 is set at 30 ppb for both a 10-minute and 30-minute exposure. AEGL-1 is designed to limit exposure to prevent “discomfort, irritation, or certain asymtomatic, non-sensory effects” which are not disabling. According to the web page of the American Petroleum Council. http://www.api.org/ehs/h2s/FalkeAbstract.htm AEGL-1 has not passed all the various reviews and is still considered a draft while two other AEGLs have been adopted.* * AEGL values were developed for hydrogen sulfide by the National Advisory Committee on Acute Exposure Guideline Levels (NAC/AEGL Committee). These values were published in the Federal Register on March 15, 2000 (U.S. EPA, 2000) for public comment. After reviewing comments, the AEGL values were sent unchanged from the Federal Register Notice to the National Academies for review at their meeting on July 24-25, 2000. Following verbal
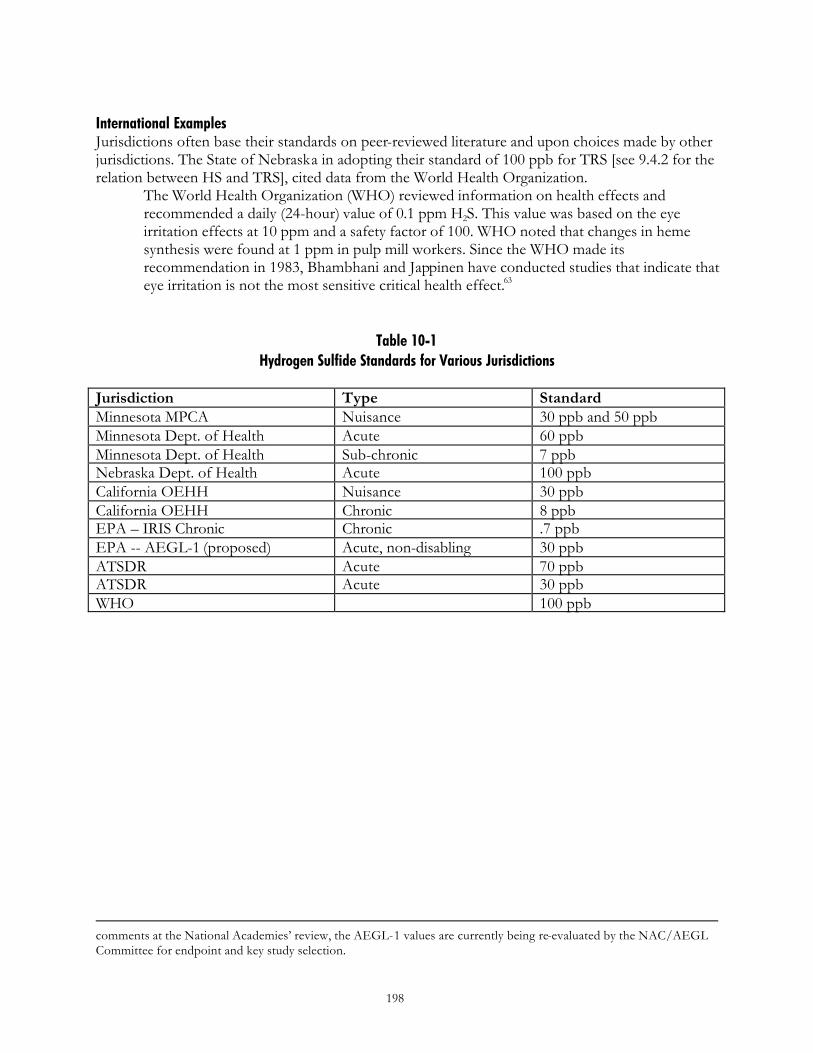
198
International Examples Jurisdictions often base their standards on peer-reviewed literature and upon choices made by other jurisdictions. The State of Nebraska in adopting their standard of 100 ppb for TRS [see 9.4.2 for the relation between HS and TRS], cited data from the World Health Organization.
The World Health Organization (WHO) reviewed information on health effects and recommended a daily (24-hour) value of 0.1 ppm H2S. This value was based on the eye irritation effects at 10 ppm and a safety factor of 100. WHO noted that changes in heme synthesis were found at 1 ppm in pulp mill workers. Since the WHO made its recommendation in 1983, Bhambhani and Jappinen have conducted studies that indicate that eye irritation is not the most sensitive critical health effect.63
Table 10-1 Hydrogen Sulfide Standards for Various Jurisdictions
Jurisdiction Type Standard Minnesota MPCA Nuisance 30 ppb and 50 ppb Minnesota Dept. of Health Acute 60 ppb Minnesota Dept. of Health Sub-chronic 7 ppb Nebraska Dept. of Health Acute 100 ppb California OEHH Nuisance 30 ppb California OEHH Chronic 8 ppb EPA – IRIS Chronic Chronic .7 ppb EPA -- AEGL-1 (proposed) Acute, non-disabling 30 ppb ATSDR Acute 70 ppb ATSDR Acute 30 ppb WHO 100 ppb
comments at the National Academies’ review, the AEGL-1 values are currently being re-evaluated by the NAC/AEGL Committee for endpoint and key study selection.
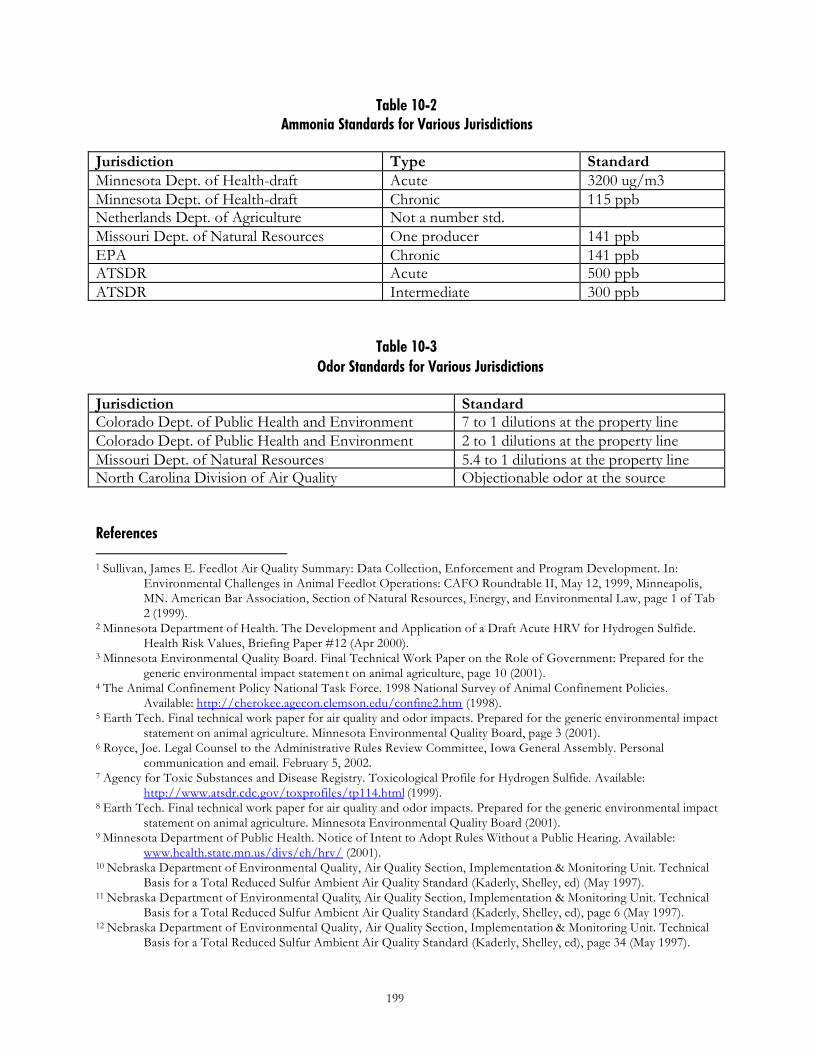
199
Table 10-2 Ammonia Standards for Various Jurisdictions
Jurisdiction Type Standard Minnesota Dept. of Health-draft Acute 3200 ug/m3 Minnesota Dept. of Health-draft Chronic 115 ppb Netherlands Dept. of Agriculture Not a number std. Missouri Dept. of Natural Resources One producer 141 ppb EPA Chronic 141 ppb ATSDR Acute 500 ppb ATSDR Intermediate 300 ppb
Table 10-3 Odor Standards for Various Jurisdictions
Jurisdiction Standard Colorado Dept. of Public Health and Environment 7 to 1 dilutions at the property line Colorado Dept. of Public Health and Environment 2 to 1 dilutions at the property line Missouri Dept. of Natural Resources 5.4 to 1 dilutions at the property line North Carolina Division of Air Quality Objectionable odor at the source References 1 Sullivan, James E. Feedlot Air Quality Summary: Data Collection, Enforcement and Program Development. In:
Environmental Challenges in Animal Feedlot Operations: CAFO Roundtable II, May 12, 1999, Minneapolis, MN. American Bar Association, Section of Natural Resources, Energy, and Environmental Law, page 1 of Tab 2 (1999).
2 Minnesota Department of Health. The Development and Application of a Draft Acute HRV for Hydrogen Sulfide. Health Risk Values, Briefing Paper #12 (Apr 2000).
3 Minnesota Environmental Quality Board. Final Technical Work Paper on the Role of Government: Prepared for the generic environmental impact statement on animal agriculture, page 10 (2001).
4 The Animal Confinement Policy National Task Force. 1998 National Survey of Animal Confinement Policies. Available: http://cherokee.agecon.clemson.edu/confine2.htm (1998).
5 Earth Tech. Final technical work paper for air quality and odor impacts. Prepared for the generic environmental impact statement on animal agriculture. Minnesota Environmental Quality Board, page 3 (2001).
6 Royce, Joe. Legal Counsel to the Administrative Rules Review Committee, Iowa General Assembly. Personal communication and email. February 5, 2002.
7 Agency for Toxic Substances and Disease Registry. Toxicological Profile for Hydrogen Sulfide. Available: http://www.atsdr.cdc.gov/toxprofiles/tp114.html (1999).
8 Earth Tech. Final technical work paper for air quality and odor impacts. Prepared for the generic environmental impact statement on animal agriculture. Minnesota Environmental Quality Board (2001).
9 Minnesota Department of Public Health. Notice of Intent to Adopt Rules Without a Public Hearing. Available: www.health.state.mn.us/divs/eh/hrv/ (2001).
10 Nebraska Department of Environmental Quality, Air Quality Section, Implementation & Monitoring Unit. Technical Basis for a Total Reduced Sulfur Ambient Air Quality Standard (Kaderly, Shelley, ed) (May 1997).
11 Nebraska Department of Environmental Quality, Air Quality Section, Implementation & Monitoring Unit. Technical Basis for a Total Reduced Sulfur Ambient Air Quality Standard (Kaderly, Shelley, ed), page 6 (May 1997).
12 Nebraska Department of Environmental Quality, Air Quality Section, Implementation & Monitoring Unit. Technical Basis for a Total Reduced Sulfur Ambient Air Quality Standard (Kaderly, Shelley, ed), page 34 (May 1997).
200
13 Collins J, Lewis D. Hydrogen Sulfide: Evaluation of Current California Air Quality Standards with Respect to
Protection of Children. California Office of Environmental Health Hazard Assessment, Air Toxicology and Epidemiology Section. Available: http://www.oehha.org/air/pdf/oehhah25.pdf (2000).
14 California Office of Environmental Health Hazard. All Chronic Reference Exposure Levels Adopted by OEHHA as of December 2001. Available: http://www.oehha.org/air/chronicrels/AllChrels.html (2001).
15 Agen cy for Toxic Substances and Disease Registry. Toxicological Profile for Ammonia, CAS#7664-41-7, page 92. Available: http://www.atsdr.cdc.gov/toxprofiles/tp126.html (Dec 1990).
16 Minnesota Department of Health. Air Emissions from Animal Agricultural Operations and Your Health (Sep 2001). 17 Iowa Department of Agriculture and Land Stewardship. Quick Facts on Iowa Agriculture. Available:
http://www2.state.ia.us/agriculture/quickFacts2.htm (2002). 18 Netherlands Department of Agriculture. Manure and the environment: The Dutch approach to reduce the mineral
surplus and ammonia volatilization. Available: www.minlnv.nl (2001). 19 Marbery, Steve. Missouri Odor Study. Feedstuffs 22:7 (2001). 20 Myers, Paul. Missouri Department of Natural Resources, Air Pollution Control Program. Email and telephone
correspondence, January 11, 2002. 21 Citizens Legal Environmental Action Network, Inc. v. Premium Standard Farms, Inc. Case No. 97-6073-CV-SJ-6,
Consent Decree, United States District Court Western District of Missouri, page 15 (2001). 22 Marbery, Steve. Court Backs Air Rules. Feedstuffs 22:7 (2001). 23 Meyers, Paul. Air Pollution Control. Phone conversation on November 13, 2001. 24 Earth Tech. Final technical work paper for air quality and odor impacts. Prepared for the generic environmental
impact statement on animal agriculture. Minnesota Environmental Quality Board, page 72 (2001). 25 Earth Tech. Final technical work paper for air quality and odor impacts. Prepared for the generic environmental
impact statement on animal agriculture. Minnesota Environmental Quality Board, page 73 (2001). 26 Woodford, Phyllis. Environmental Planner Colorado Dept. of Public Health & Environment. Phone conversation on
December 10, 2001 and email on January 14, 2002. 27 Horne, James E. Rural Communities and CAFOs: New Ideas for Resolving Conflict. Kerr Center for Sustainable
Agriculture (2000). Available: www.kerrcenter.com 28 Barrette, Michael. Hog-tied by feedlots. Zoning News, page 4 (Oct 1996). 29 Minnesota Environmental Quality Board. Final Technical Work Paper on the Role of Government: Prepared for the
generic environmental impact statement on animal agriculture, page 29 (2001). 30 Chapin A, Boulind C, Moore A. Controlling Odor and Gaseous Emission Problems from Industrial Swine Facilities:
A Handbook for All Interested Parties. Yale Environmental Protection Clinic (1998). 31 Okun, Melva. Moore County Ordinance Regulating New and Expanding Intensive Swine Operations, Effective
September 21, 1998. North Carolina Association of Local Health Directors. Available: http://checc.sph.unc.edu/rooms/library/docs/hogs/Moore.htm (1999).
32 Whittle, Daniel. On the Hog Front, key engagements loom for N.C. The News and Observer, November 12, 2001. 33 DeLind LB. The state, hog hotels, and the "right to farm": A curious relationship. Agriculture and Human Values,
page 32 (1995). 34 Center for Rural Affairs. Corporate Farming Notes. Available:
http://www.cfra.org/newsletter/corporate_farming_notes.htm (Jun 2001). 35 Center for Rural Affairs. Corporate Farming Notes. Available
http://www.cfra.org/newsletter/corporate_farming_notes.htm (Oct 2001). 36 Minnesota Environmental Quality Board. Final Technical Work Paper on the Role of Government: Prepared for the
generic environmental impact statement on animal agriculture, page 16 (2001). 37 Hamilton ND. Right-to-farm laws reconsidered: Ten reasons why legislative efforts to resolve agricultural nuisances
may be ineffective. Drake Journal of Agricultural Law 3(1):104 (1998). 38 DeLind LB. The state, hog hotels, and the "right to farm": A curious relationship. Agriculture and Human Values
(1995). 39 DeLind LB. The state, hog hotels, and the "right to farm": A curious relationship. Agriculture and Human Values,
page 34 (1995). 40 Richardson JJ, Feitshans TA. Nuisance revisited after Buchanan and Bormann. Drake Journal of Agricultural Law
5(C1):133 (2000). 41 Legislative Service Bureau of the Iowa General Assembly. Legislative Guide to State Regulation of Animal Feeding
Operations. Available www.legis.state.ia.us/Central/LSB/Guides/animal.htm (2000). 42 Hamilton ND. Right-to-farm laws reconsidered: Ten reasons why legislative efforts to resolve agricultural nuisances
may be ineffective. Drake Journal of Agricultural Law 3(1):111 (1998).
201
43 Iowa Civil Liberties Union. Judge rules nuisance immunity statute unconstitutional: Suit against hog confinement can
proceed, News Release, August 3, 2001. 44 Gacke v. Pork Xtra, L.L.C. Case No. LACV 019489, Ruling on Motion to Strike Defendant’s Immunity Defense,
Iowa District Court in and for Sioux County (2001). 45 Perkins, J and Beeman, P. Hog-lot foes lobby lawmakers. Des Moines Register, January 16, 2002. 46 Kleemeier v. Beazly Group, Inc and Pork Innovations, Inc. Case No. LACV 500316, Ruling on Plaintiffs’ Motion to
Strike & Motion for Adjudication of Law Points, Iowa District Court for Calhoun County (2002). 47 Feedstuffs, page 16, September 17, 2001. 48 Taylor DA. From pigsties to hog heaven. Environmental Health Perspectives, page A328 (2001). 49 Hinton M. Hog producer, state reach sewage agreement. Daily Oklahoman, December 5, 2001. 50 Premium Standard Farms. Premium Standard Farms Settles Environmental Claims, 11/20/2001. Available:
http://www.psfarms.com/press_releases.asp. 51 Bell B Jr. Neighbors say settlement with hog farm isn't enough. St. Louis Post-Dispatch, December 27, 2001. 52 Beeman, Perry. Hog operation agrees to settle pollution suit: Missouri case could influence action in Iowa. Des
Moines Register, December 9, 2001. 53 Minnesota Environmental Quality Board. Final Technical Work Paper on the Role of Government: Prepared for the
generic environmental impact statement on animal agriculture, page 8 (2001). 54 Raffensperger C, Schettler T, Meyers N. Precaution: Belief, Regulatory System, and Overarching Principle. Int J
Occup Environ Health 6(4):267 (2000). 55 Hileman Bette. Precautionary Principle: As defined recently, the principle provides a new guide to U.S. environmental
policy. Chemical & Engineering News, page 16, February, 9, 1998. 56 Kriebel D, Tickner J. Reenergizing Public Health Though Precaution. Am J Public Health 91(9):1351 (2001). 57 Pollan M. Precautionary Principle. New York Times Sunday Magazine, December 9, 2001. 58 Kriebel D, Tickner J. Reenergizing Public Health Though Precaution. Am J Public Health 91(9):1354 (2001). 59 Krimsky S. Hormonal Chaos: The Scientific and Social Origins of the Environmental Endocrine Hypothesis.
Baltimore, Maryland: Johns Hopkins University Press, page 192 (2000). 60 Krimsky S. Hormonal Chaos: The Scientific and Social Origins of the Environmental Endocrine Hypothesis.
Baltimore, Maryland: Johns Hopkins University Press, page 167-168 (2000). 61 USDA Agricultural Air Quality Task Force. Air Quality Research and Technology Transfer White Paper and
Recommendations for Concentrated Animal Feeding Operations. Washington, DC (2000). 62 Federal Register/Vol. 65, No. 51/Wednesday, March 15, 2000/ Notices/Page 14194. 63 Nebraska Department of Environmental Quality. Technical Basis for a Total Reduced Sulfur Ambient Air Quality
Standard, page 37 (1997).
202
Chapter 10. Emission Control Systems
Jeffery Lorimor, Associate Professor Department of Agricultural and Biosystems Engineering
Iowa State University
Steven Hoff, Associate Professor Dept. of Ag & Biosystems Engineering
Iowa State University Ames, IA
Patrick O’Shaughnessy, Assistant Professor
Dept. of Occupational and Environmental Health University of Iowa
Iowa City, IA
203
Chapter 10 Emission Control Systems Abstract Emissions odors, gases, and dust from livestock production facilities arise primarily from three sources; buildings, manure storages, and land application (1). Emissions from buildings and storages form a baseline emission level. Eliminating emissions from one of the sources will likely not eliminate emissions entirely. Control technologies often address only one of the three sources. Many of the technologies reduce emissions; none eliminate them. Emissions from buildings can be reduced by inhibiting contaminant generation, or by treating the air as it leaves the building. Frequent manure removal is one of the best ways of reducing contaminant generation within the building. Frequent removal requires outdoor storage. Other methods include the use of bedding, oil sprinkling, chemical additives, and diet manipulation. Treating the air leaving a building can be done with washing walls or biofilters. Natural or manmade windbreak walls may be beneficial. There are four types of storages; deep pits, outdoor slurry storage, anaerobic lagoons, and solid stacks. Outdoor storages are the most apparent source of odors. Controls include permeable and impermeable, natural and synthetic covers. They have been shown to be effective when managed properly. Solids separation has not been proven effective to reduce odors. Proper aeration will eliminate odors from outdoor storages, but is expensive in a liquid system. Composting works well for solid manure. Anaerobic digesters reduce odors, but are also not economically feasible. Manure additives are generally not reliable. Emission control during land application is best done by direct injection.
204
General Introduction Buildings, whether they are naturally ventilated (depend on natural breezes for ventilation), or mechanically ventilated (depend on fans for ventilation), buildings must have continuous air movement through them for the health of the animals and workers. Building emissions, along with emissions from the manure storage, form a baseline emission level for a production site (2). Different types of storages are used for confinement systems. Outdoor pits and lagoons have the advantage of removing manure from the buildings more frequently than the “deep pit”, which stores the manure under the building. Because they’re exposed to the wind, outdoor storages may have a greater potential for odor and gas release. Odor and gas releases are reduced during cold weather. Outdoor storages freeze, and building ventilation is reduced. A high percentage of complaints each year occur due to land application of manure (3). Unlike buildings and storages, land application only occurs once or twice a year, and the impact is for short period of time. Air quality impacts involve a combination of intensity and duration. Buildings and storages represent the “baseline” emission levels. Land application can cause short term, more intense emissions. 10.1 Emission Control Strategies from Building Sources Introduction There are two basic approaches to minimizing odor emissions from buildings. The ideal odor control method is to minimize the odor generated in the building. The second option is to capture and treat odor as it is emitted from the building. The first method benefits the people and animals in the building as well as the neighbors. Either method helps minimize effects on neighbors. Minimizing Odors within a Building There are a number of recognized methods of minimizing odors generated within buildings. One of the more popular and effective is simply frequent manure removal. By using anaerobic lagoons so that “dilute” liquid is available to flush the areas where the manure collects frequently. The concept is very similar to human waste management where we flush the stool after each use. Animal facilities that flush once a week have better air quality than those that flush less frequently. Bedded solid manure is thought to release fewer odors than liquid systems (4). Although firm scientific data has not proved it, most people feel that odors from bedded systems are less bothersome than from liquid systems, although dust may be worse from bedded systems than liquid. Sprinkling vegetable oil in very small amounts inside swine buildings has been shown to control dust as well as odor and some gases (5,6,7). Once a day sprinkling at 0.5 ml/ft2 has reduced dust 40-50%, odor up to 60%, and H2S up to 60% (8). No reduction in NH3 was found. A disadvantage is that building surfaces become oily and requires the use of degreasers in cleanup. Chemical additives to reduce manure odors and gases have been popular with producers and vendors for many years. Unfortunately researchers have found it very difficult to prove the
205
effectiveness of the many additives that are available. Of the products tested, relatively few have been shown to significantly reduce odor or gases. The most recent study was done by the National Pork Board (9). It investigated 35 products. Of the 35, none reduced odors at the 95% confidence level. Hydrogen sulfide was reduced at that level by 7 of the products, and 8 products reduced ammonia. Only one product was effective for both gases. These results are typical of studies over the years where given products may work for one gas, but not for anything else. Another reason additives are not recommended is their cost, which can be significant. One application where an additive has been shown to be effective is in the poultry industry. Alum has been shown to reduce ammonia volatilization very significantly during a 42-day incubation of poultry litter (10), and also found to be cost effective due to increased production when it is used. Ozone is a powerful oxidizing agent and germicide that has been investigated for its odor control characteristics. It’s a natural component of air, and has been used to disinfect water supplies for years (11,12). It is being tested in a swine barn where it’s distributed with ventilation air (13,14). Ozone’s disadvantages are that it is very unstable, so it doesn’t last long, and it can be very toxic and corrosive at high levels. OSHA’s exposure limit is 0.1 part per million for an 8-hour exposure (15). Diet manipulation has significant potential for ammonia reduction by reducing nitrogen (protein) in the feed (16,17). This concept is becoming more popular, but must be used with care since production can be significantly effected if protein levels are reduced too far. Capturing and/or Treating Odor Emitted from Buildings There are several ways of treating air before it’s released from a building to lessen its odor and gas emission potential. The following are some methods that have been researched to some degree. Washing walls is a concept that has been tested to reduce dust and odors (18). Water is used to “scrub” air as it leaves buildings similar to systems used in industry. Water recirculates through evaporative pad scrubber as exhaust fans blow air from the building. Such a system requires power ventilation systems (not natural ventilation). Washing Walls used in a swine finisher reduced total dust 20-60%, NH3 33-50%, and reduced odors only slightly. As might be expected, better cleanup was achieved with low airflow rates compared to high rates. Biofilters similar to those used in Europe have been adapted in the US. They use biomass and microorganisms to treat ventilation air as it leaves the building. Design parameters have been tested on a full-scale 750-head sow facility in Minnesota (19,20,21,22). At that facility the biofilter achieved odor and H2S reduction of 80-90%, and NH3 reduction of 50-60%. Weed control and rodent control were the primary problems experienced. A critical element in the use of biofilters is their dependence on power ventilated buildings where fans push the air through the filter. They don’t work on naturally ventilated buildings. A similar system is the biomass filter (23). Although not quite as effective as a biofilter, biomass filters do not depend on microbes to the extent of a biofilter, and they don’t restrict airflow as much. Like a biofilter, power ventilation is required to use a biomass filter. Windbreak walls are a type of wall that has been tested in the Southeast US to deflect exhaust air upward from tunnel ventilated building so it mixes with clean air, which dilutes odors and gases (24).
206
Windbreak walls can be constructed of various materials such as metal, straw, or wood. Without a wall, exhaust air moves along the ground and is not diluted. A Windbreak wall helps to direct barn exhaust air upward for better dispersion/dilution. Natural windbreaks accomplish some of the same things (25). They, however, take some time to establish. Odor reduction not well researched, but thought to be beneficial through mixing, and dispersion. Natural windbreaks are naturally esthetically pleasing. 10.2 Emission Control Strategies from Manure Storages Introduction There are four basic types of storages that require different treatment for air quality preservation. They are deep pits outdoor slurry storage basins or tanks, anaerobic lagoons, and solid manure storage systems. The following briefly defines each type: Deep Pits and Slurry Storage A deep pit is a manure storage area underneath, or in the “basement,” of a livestock production building. The manure storage is not visible from outside the building, and wind does not blow across the storage unit and pick up odors and gases. Manure is typically removed from deep pits only once or twice a year. No extra dilution water is added to the manure. Outdoor slurry storages may be used in place of deep pits. They may be made of earth, concrete, or steel. The earthen storages were popular due to their low cost (less than ½ the cost of the others) until regulations made them unfeasible to construct. Outdoor storages have the advantage of more frequent removal of manure from the building to provide better air quality within the building. Anaerobic Lagoons Anaerobic lagoons are considerably larger than earthen storage since they are designed as treatment method (26). Originally designed as an odor control method, they use microbes to digest manure solids and stabilize the manure (27). To avoid accumulating concentrations of some constituents (particularly ammonia) that are toxic t the microbes, dilution water is added. Earthen construction is used due to the large storage volume needed to accommodate the manure and dilution water. Solid Stacks Solid stacks can result either from using bedding to create solid manure, or from solids separated from liquid streams. Either type should be solid enough to pile up in a stack. Stacks may or may not be composted. They typically compost naturally somewhat, but may become anaerobic if piled too deep, or if the particles are too fine to admit enough oxygen for composting (28). If a stack becomes anaerobic it can be a source of odors and gases like a liquid system. Properly composted solids emit few odors (29). Air Quality Control Technologies Storages are the most “apparent” odor source on many farms. Since many people know that the odors coming from animal farms originate with the manure, it is natural for them to focus on the manure storage facility. The visibility of manure sources can make a difference in both the odor frequency and magnitude of what people smell. Landscaping improves the appearance of production and manure storage facilities and helps hide storages.
207
Covers Synthetic impermeable covers hold gases and odors inside tank. Covers may be either rigid (wooden, concrete, fiberglass), or flexible (plastic). Synthetic plastic covers may either float on the liquid surface, be inflated, or be held above the liquid level by cables. Inflated covers are difficult to protect from high winds, so floating covers are the most common. Gas and odor reductions have been reported from 40 – 90% (2, 30). Biocovers such as straw or cornstalks protect liquid manure from air passing over storage. Even though they are permeable, they still reduce diffusion from liquid surface to gas above (31). Some researchers feel that aerobic action occurs within the cover. In some situations a natural crust will develop which accomplishes the same result as an artificial biocover. Other synthetic permeable covers have been developed such as a geotextile cover for earthen storages, and clay ball covers (Leka rock) on concrete slurry pit The benefits of some of the above covers have been shown to be significant, while others are less successful (31). All covers require additional management, whether it’s extra chopping of straw to avoid plugging lines, or peeling back synthetic covers to provide access for pumpout. The capital cost of covers also reduces their acceptance by producers. Approximate costs of the various types of covers follows: Biocovers (straw) $0.10/sq ft each year $0.40 per head Clay balls (LEKA) $2-5/sq ft every $0.33 - .80* “ “ Geotextile $0.20-$0.40/sq ft every $0.03 - .07 “ “ Plastic cover $1-$2/sq ft every $0.16 – 0.33 “ “ * Assumes 10 year life, 10% annual interest Solids Separation Separating solids from liquid manure reduces the load on anaerobic lagoons, which should help reduce odors from the lagoons. Solids separation is very difficult to accomplish with liquid swine manure. Removal rates may range from 5% 5o 50% (32,33). Although the theory is sound, odor/gas reductions have not been documented due to solids reductions resulting from separating solids (34). Solids separation also creates a second waste stream to manage which may be detrimental to overall air quality if the system is not managed correctly. The cost of solids separation ranges from $10-$20 per1000 lb bodyweight per year making it very expensive. Overall solids separation is not a good alternative for air quality protection in most instances. Aeration Complete aerobic treatment nearly eliminates odors and undesirable gases. Many municipalities and industries use aeration for waste treatment. Continuous aeration can be achieved via floating aerators, fixed aerators, or submerged air lines. Air can be bubbled up through the liquid, whipped into the liquid, or the liquid sprayed up into the air. The disadvantage of aeration (and the reason producers don’t use it) is that it requires very large amounts of energy (electricity) to accomplish the air entrainment necessary (35). The energy cost for aerating liquid manure is estimated to be $20-$40/1,000-lb bodywgt. -year
208
Partial Aeration can reduce odors and gases, although if under designed may actually increase odors. Floating aerators may be used for partial aeration, with the number of units determining the completeness of the aeration. Composting is a method of aerating solid manure. Like liquid aeration, it significantly reduces odors (28). In addition, it is less energy intensive, since periodic mixing can be done relatively cheaply. Bedding in solid manure tends to make the manure “fluffy” so air naturally mixes with it to help maintain aerobic conditions. The mix of gases released is different than anaerobic treatment. Composting costs can vary significantly, but some estimates are $0.20-$0.40/1,000-lb bodywgt per year. Anaerobic Treatment Anaerobic treatment takes place in the absence of oxygen. The most common type is the anaerobic lagoon. Although the general public has a poor opinion of anaerobic lagoons, a properly operating one emits low odors. Lagoon design is based on volatile solids or COD loading, with the objective of keeping the bacterial populations in the lagoon in balance. When they are in balance, odors are minimal. In Iowa, cold weather interferes with balanced, steady state operation, and makes odor control more difficult. Oversized lagoons are sometimes used to reduce concentrations within the lagoon, thus reducing odors. The cost of oversizing lagoons can be expected to be about $200 per 1000 lb bodyweight capital cost for extra earthwork. Anaerobic digesters are very different from anaerobic lagoons. Digesters provide more “intense” treatment. Digesters are heated and the manure is thicker than lagoons. An overloaded condition can cause intense odors and gases. Digesters reduce odors by containing the gas that is produced so that it can be burned, and by stabilizing the liquid before it goes to the open storage tank or lagoon. Anaerobic digesters are misunderstood by the general public. Digesters are complex living organisms that are expensive to install, and require significant additional management. They do reduce odors, BOD/COD, and provide energy as heat, electricity, or both. But they do not reduce the volume or nutrient concentration of the manure significantly. The cost of constructing an anaerobic digestion system is approximately $100/pig, or $500-1,000/dairy cow capital cost. Some of the costs can be offset by the captured energy, but without higher energy prices or large government grants anaerobic digesters are not economically viable (36). Manure Additives Many additives are available to add to pits, lagoons, or animal feed. They work in a variety of different ways. Microbiological additives include digestive deodorants. They may be designed to enhance solids degradation, and may be pH or temperature dependant. One of the main factors that is discouraging about microbiological additives is that to work effectively, they must become the predominate bacteria. Since most bacteria are ubiquitous, if the environment favored the selected bacteria, it would already predominate in the manure (37). Chemical (non microbiological) additives may include several mechanisms for control: pH control chemical oxidation precipitation odor masks or perfumes adsorbents
209
A recently completed study of 35 additives conducted by the National Pork Board found that none of the additives decreased odors at the 95% confidence level, 6 decreased hydrogen sulfide, and 8 reduced ammonia (8). Cost of biological/chemical additives $0.20-$1.00/pig mktd Emission Control from Land Application of Manure Applying manure to cropland returns nutrients to the soil. The manure provides nutrients to the crops that would otherwise have to be purchased as commercial fertilizer. The other reason manure is land applied is because federal law forbids discharging agricultural wastes to waters of the state or nation. Unfortunately, land application can result in very significant odor occurrences. Even though they are not long lasting, odors from land application can be very obnoxious. The best way to reduce odors from land application of liquid manure is direct injection of the manure below the soil surface (38,39). Research has shown that injection that accomplishes good soil cover of the manure results in odor reductions up to 90% compared to broadcast manure. Lack of complete coverage reduces odor control. Broadcasting followed by rapid incorporation also significantly reduces odors compared to broadcasting only (40), but it is not as effective as direct injection. The additional cost to inject manure is typically 1/10th of a cent per gallon more than broadcast. Some of the additional cost is offset by better nitrogen retention. Other methods of reducing odors from land application include dilution with clean water, placement below the crop canopy (the canopy reduces air movement across the manured soil), and other potential treatments. Pretreatments have been shown to reduce odors 80%, and certain specific gases such as hydrogen sulfide up to 90% (41), but pretreatment with additives is unreliable and expensive. Research is being conducted with ozone to remove odors and reduce ammonia and hydrogen sulfide, but results aren’t yet known. It’s known that the technology works, but cost and management requirements haven’t been proved. Solid manure is generally less odorous than liquid, but still deserves some attention. Because it cannot be injected, rapid incorporation of solid manure is the best method to minimize odors. Some of the best odor control results for observing common sense rules that account for wind direction and speed. Watching weather forecast, and not spreading when the wind is blowing towards neighbors can minimize severe odor “events”. Several models have been developed by universities and government agencies, such as EPA’s INPUFF and Minnesota’s OFFSET model (42, 43), to predict odor movement and estimate their effects on neighbors. Summary Table 1 summarizes methods to reduce gas, odor, and dust emissions from animal facilities. Odor and gas emission sources associated with animal production facilities can be broken down into three categories: buildings, storages, and land application. Eliminating emissions from any one of the three will not eliminate emissions entirely. A number of technologies exist that are capable of reducing emissions from all three. Cost, increased management requirements, and lack of economic or regulatory incentives to encourage their use are the primary reasons more producers have not
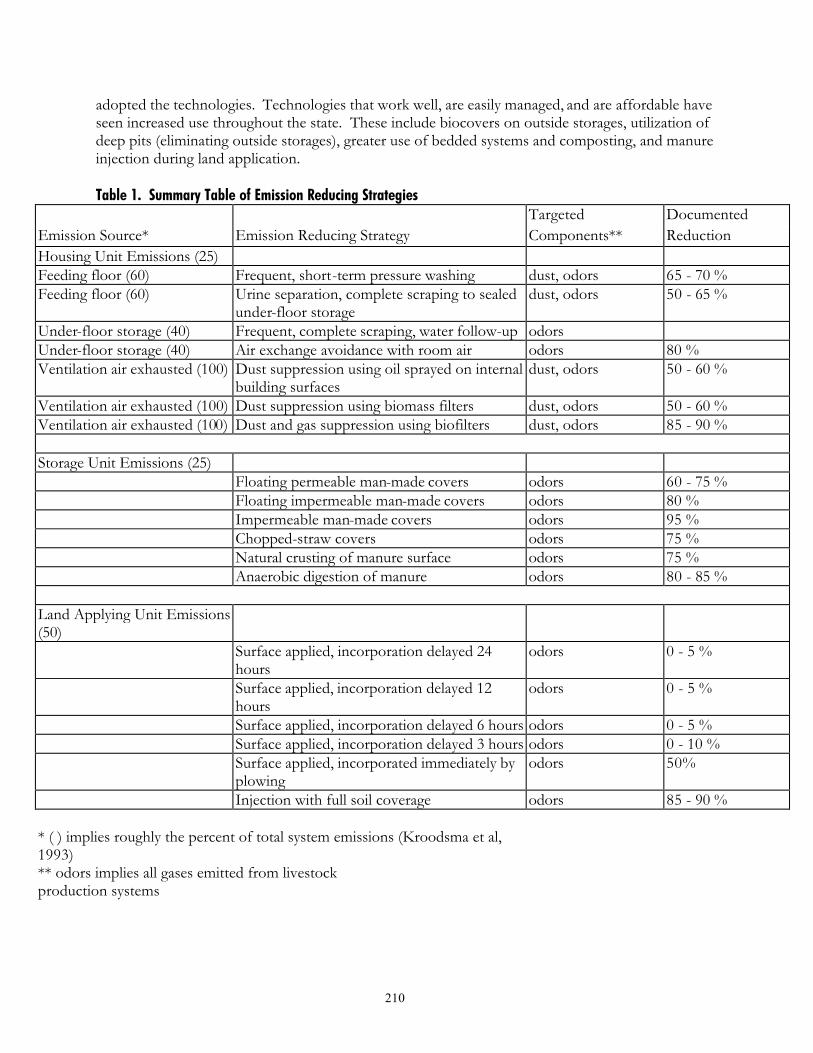
210
adopted the technologies. Technologies that work well, are easily managed, and are affordable have seen increased use throughout the state. These include biocovers on outside storages, utilization of deep pits (eliminating outside storages), greater use of bedded systems and composting, and manure injection during land application. Table 1. Summary Table of Emission Reducing Strategies
Targeted Documented Emission Source* Emission Reducing Strategy Components** Reduction Housing Unit Emissions (25) Feeding floor (60) Frequent, short-term pressure washing dust, odors 65 - 70 % Feeding floor (60) Urine separation, complete scraping to sealed
under-floor storage dust, odors 50 - 65 %
Under-floor storage (40) Frequent, complete scraping, water follow-up odors Under-floor storage (40) Air exchange avoidance with room air odors 80 % Ventilation air exhausted (100) Dust suppression using oil sprayed on internal
building surfaces dust, odors 50 - 60 %
Ventilation air exhausted (100) Dust suppression using biomass filters dust, odors 50 - 60 % Ventilation air exhausted (100) Dust and gas suppression using biofilters dust, odors 85 - 90 % Storage Unit Emissions (25) Floating permeable man-made covers odors 60 - 75 % Floating impermeable man-made covers odors 80 % Impermeable man-made covers odors 95 % Chopped-straw covers odors 75 % Natural crusting of manure surface odors 75 % Anaerobic digestion of manure odors 80 - 85 % Land Applying Unit Emissions (50)
Surface applied, incorporation delayed 24 hours
odors 0 - 5 %
Surface applied, incorporation delayed 12 hours
odors 0 - 5 %
Surface applied, incorporation delayed 6 hours odors 0 - 5 % Surface applied, incorporation delayed 3 hours odors 0 - 10 % Surface applied, incorporated immediately by
plowing odors 50%
Injection with full soil coverage odors 85 - 90 % * ( ) implies roughly the percent of total system emissions (Kroodsma et al, 1993)
** odors implies all gases emitted from livestock production systems
211
References Hardwick, D.C. 1985. Agricultural problems related to odor prevention and control. In Odor Prevention and Control of
Organic Sludge and Livestock Farming. Ed. V.C. Nielson, J.H. Voorburg and P. L’Hermite. Elsevier Applied Science Pub. New York. pp. 21-26.
Jacobson, L, J. Lorimor, J. Bicudo, and D. Schmidt. 2001. Livestock and Poultry Environmental Stewardship Curriculum. Midwest Plan Service, Ames, IA.
Pain, B.F. 1995. Odours from application of livestock wastes to land. In New Knowledge in Livestock Odor, Proceed-ins of International Livestock Odor Conferen ce, Ames, Iowa. 125-126.
Nicks, B., A. Desiron, and B. Canart. 1997. Deep Litter Materials and the Ammonia Emissions in Fattening Pig Houses. In Proceedings of the International Symposium on Ammonia and Odour Control from Animal Production Facilities. (Voermans, J.A.M. and Monteny, G. editors). Research Institute for Pig Husbandry, Rosmalen, Netherlands, 335–342.
Takai, H., F. Moller, M. Iverson, S.E. Jorsa, and V. Bille-Hansen. 1993. Dust control in swine buildings by spraying of rapeseed oil. Fourth Inter. Livestock Environment Symposium, July 6-9. Sponsored by American Society of Agricultural Engineers (ASAE). St. Joseph, MI.
Zhang, Y., A. Tanaka, E.M. Barber, and J.J.R. Feddes. 1996. Effect of frequency and quantity of sprinkling canola oil on dust reduction in swine buildings. Transactions of American Society of Agricultural Engineers 39(3):1077-1081.
Zhang,Y. 1997. Sprinkling Oil to Reduce Dust, Gases, and Odor in Swine Buildings. MidWest Plan Service AED-42. Iowa State University, Ames.
Jacobson, L.D., L.J. Johnston, B. Hetchler, and K.A. Janni. 1998. Odor and gas reduction from sprinkling soybean oil in a pig nursery. ASAE Paper No. 984125. ASAE: St. Joseph, MI.
Goodwin, R. 2001. Manure pit additive comparisons. International Symposium Addressing Animal Production and Environmental Issues. Oct. 3-5, 2001. College of Ag and Life Sciences, North Carolina State University, Research Triangle Park, NC.
Moore, P.A., T.C. Daniel, D.R. Edwards, and D.M. Miller. 1995. Effect of chemical amendments on ammonia volatilization from poultry litter. J. Environ Qual. 24:293-300.
Singer, P.C. 1990. Assessing ozone research needs in water treatment. J. AWWA, 82(10):78-88. Tate, C. 1991. Survey of ozone installations in North America. Journal of American Water Works Association, 82 (12):
40-47. Keener, K.M., R.W. Bottcher, R.D. Munilla, K.E. Parbst, and G.L. Van Wicklen. 1999. Field evaluation of an indoor
ozonation system for odor control. Animal Waste Management Symposium, Raleigh, NC, January 27-28. Bottcher, R.W., K.M. Keener, and R.D. Munilla. 2000. Comparison of odor control mechanisms for wet pad scrubbing,
indoor ozonation, windbreak walls, and biofilters. ASAE Paper No. 004091, ASAE: St. Joseph, MI. OSHA. 1998. Table Z-1 Limits for Air Contaminants - 1910.1000, OSHA Regulations (Standards-29 CFR),
Occupational Safety and Health Administration, U.S. Dept. of Labor, Washington, D.C. Sutton, A. L., J.A. Patterson, O.L. Adeola, B.A. Richert, D.T. Kelly, A.J. Heber, K.B. Kephart, R. Mumma, and E.
Bogus. 1998. Reducing sulfur containing odors through diet manipulation. In Proceedings Animal Production Systems and the Environment 1998a-125-130. Des Moines, Iowa, July 19-22.
Canh, T.T., A.J.A. Aarnink, Z. Mroz, A.W. Jongbloed, J.W. Scharma, and M.W.A.Verstegen. 1998. Influence of electrolyte balance and acidifying calcium salts in the diet of growing-finishing pigs on urinary pH, slurry pH and ammonia volatilisation from slurry. Livestock Production Science 56(1):1-13.
Bottcher, R.W., K.M. Keener, R.D. Munilla, K.E. Parbst, and G.L. Van Wicklen. 1999. Field evaluation of a wet pad scrubber for odor and dust control. Animal Waste Management Symposium, Raleigh, NC, January 27-28.
Nicolai, R.E., and K.A. Janni. 1997. Development of a low-cost biofilter for swine production facilities. ASAE Paper No. 974040. ASAE: St. Joseph, MI.
Nicolai, R.E. and K.A. Janni. 1998a. Comparison of biofilter residence time. ASAE Paper No. 984053. ASAE: St. Joseph, MI.
Nicolai, R.E. and K.A. Janni. 1998b. Biofiltration–technology for odor reduction from swine buildings. In Proc. Animal Production Systems and Environment Conference. Iowa State University, Ames.
Nicolai, R.E. and K.A. Janni. 1998c. Biofiltration–adapation to livestock facilities. In 1998 USC-TRG Conference on Biofiltration. University of Southern California and the Reynolds Group, Tustin, California.
Hoff, S.J., L. Dong, X.W. Li,, D.S. Bundy, and J.D. Harmon, 1997a. Odor removal using biomass filters. Procs. of the 5 th Intl. Symp. on Livestock Environment, Bloomington, MN, May 29-31, 2:101-108.
Bottcher, R.W., K.M. Keener, G.R. Baughman, R.D. Munilla, and K.E. Parbst. 1998. Field and model evaluations of windbreak walls for modifying emissions from tunnel ventilated swine buildings. ASAE Annual International Meeting, ASAE Paper No. 984071, ASAE: Orlando, FL.
212
Miner, J.R. 1995. An executive summary: a review of the literature on the nature and control of odors from pork production facilities. Prepared for the National Pork Producers Council, Des Moines, Iowa.
ASAE. 1999 Design of Anaerobic Lagoons for Animal Waste Management. ASAE Standard EP403.3, July, 1999. St. Joseph, MI.
Powers, W.J., A.C. Wilkie, H.H. Van Horn, and R.A. Nordstedt. 1997. Effects of hydraulic retention time on performance and effluent odor of conventional and fixed-film anaerobic digesters fed dairy manure wastewaters. Transactions of the ASAE 40(5):1449-1455.
NRAES 54, On Farm Composting Handbook, 1992, Northeast Regional Agricultural Engineering Service Publication Schmidt, D.R. and J.R. Bicudo. 2000. Odor and hydrogen sulfide emissions during the composting of caged layer
manure. Paper submitted to Second International Conference on Air Pollution from Agricultural Operations, October 9-11, Des Moines, IA, ASAE: St. Joseph, MI.
Zahn, J.A., A. E. Tung, B. A. Roberts, and J. L. Hatfield. Abatement of Ammonia and Hydrogen Sulfide Emissions from a Swine Lagoon using a Polymer Biocover, Journal of the Air and Waste Management Association, 51:562-573. (2001a).
Jacobson, L. D., D. R. Schmidt, R. E. Nicolai and C. J. Clanton. 1999. Evaluating the Use of Straw and Other Floating Materials to Control Odor and Gases from Pig Manure Storage Units. ASAE paper No. 99-4134, St. Joseph, MI: ASAE
Zhang, R.H. and P.W. Westerman. 1997a. Solid-liquid separation of annual (sic) manure for odor control and nutrient management. Applied Engineering in Agriculture 13(3):385-393.
Chastain, J.P., M.D. Vanotti, and M.M. Wingfield. 1999. Effectiveness of liquid-solid separation for treatment of flushed dairy manure: a case study. ASAE paper 994046. ASAE: St. Joseph, MI.
Westerman, P.W. and J.R. Bicudo. 1998. Tangential flow separation and chemical enhancement to recover swine manure solids and phosphorus. ASAE International Meeting, July 12-16, Orlando, FL, paper no. 98-4114. ASAE: St. Joseph, MI.
Zhang, R.H. and P.W. Westerman. 1997b. Aeration of livestock manure slurry and lagoon liquid for odor control: A review. Applied Engineering in Agriculture 13(2):245-249.
Garrison and Richard. 2001. Final report for the Iowa livestock industry waste characterization and methane recovery information dissemination project. Iowa Department of Natural Resources Contract No. 00-6147-01. IDNR, Des Moines, IA.
Sweeten, J.M. 1991. Odor and dust from livestock feedlots. Texas Agricultural Extension Service. College Station, 1-8. Phillips, V.R., B.F. Pain, J.V. Klarenbeek. 1988. Factors influencing the odour and ammonia emissions during and after
the land spreading of animal slurries. In Volatile Emissions from Livestock Farming and Sewage Operations. V. C. Nielsen, J. H. Voorburg, P.L’Hermite Elsevier Applied Science, London.
Berglund, S. and J.E. Hall. 1987. Sludge and slurry disposal techniques and environmental problems – a review. In Proceedings of volatile emisions from livestock farming and sewage operations workshop. Uppsala, Sweden.
Hanna, H.M., D. Bundy, J.C. Lorimor, S.K. Mickelson, and S.W. Melvin. 1999. Effects of manure application equip-ment on odor, residue cover, and crop. ASAE Paper No. 991062. St. Joseph, MI.
Clanton, C.J., R.E. Nicolai, and D.R. Schmidt, 1999. Chemical additions to swine manure to reduce hydrogen sulfide losses - a laboratory study. ASAE Annual International Meeting, July 18-22, Toronto, Canada, Paper No. 99-4007, ASAE, 2950 Niles Rd., St. Joseph, MI.
Zhu, J., L. D. Jacobson, D. R. Schmidt, R. Nicolai. 2000. Evaluation of INPUFF-2 model for predicting downwind odors from animal production facilities. Applied Engineering in Agriculture. VOL. 16(2): 159-164
Huiqing Guo, Larry D. Jacobson, David R. Schmidt, Richard E. Nicolai, Kevin A. Janni. 2001. Comparison of five models for setback distance determination. ASAE paper 014045. St. Joseph, MI.
213
Attachment 1 Members of the Iowa State University and The University of Iowa Study Group
Deans: Richard F. Ross, Distinguished Professor, Department of Veterinary Microbiology and Preventive
Medicine, College of Veterinary Medicine, and Former Dean, College of Agriculture, Iowa State University
James A. Merchant, Dean and Professor, College of Public Health, University of Iowa (served as co-chair)
Co-chairs: Gerald A. Miller, Associate Dean and Professor, College of Agriculture, Iowa State University Gary D. Osweiler, Director and Professor, Department of Veterinary Diagnostic Laboratory and
Professor of Veterinary Diagnostic and Production Animal Medicine, Iowa State University Peter S. Thorne, Professor, Department of Occupational and Environmental Health, and Director,
Environmental Health Sciences Research Center, University of Iowa Members Dwaine S. Bundy, Professor, Department of Agricultural and Biosystems Engineering, Iowa State
University Tom L. Carson, Professor, Department of Veterinary Diagnostic and Production Animal Medicine,
Iowa State University Kelley J. Donham, Professor, Department of Occupational and Environmental Health, University of
Iowa Jan L. Flora, Professor, Department of Sociology, Extension Community Sociologist, Iowa State
University Willis Goudy, University Professor, Department of Sociology, Iowa State University Carol J. Hodne, Postdoctoral Research Fellow, Environmental Health Sciences Research Center,
University of Iowa Steven J. Hoff, Associate Professor, Department of Agricultural and Biosystems Engineering, Iowa
State University Robert E. Holland, Professor and Chair, Department of Veterinary Diagnostic and Production
Animal Medicine, Iowa State University Keri C. Hornbuckle, Associate Professor, Department of Civil and Environmental Engineering,
University of Iowa James Kliebenstein, Professor, Department of Economics, Iowa State University Joel N. Kline, Associate Professor, Internal Medicine, University of Iowa Jeff C. Lorimor, Associate Professor, Department of Agricultural and Biosystems Engineering, Iowa
State University John W. Mabry, Professor, Department of Animal Science and Director, Iowa Pork Industry Center,
Iowa State University Shannon P. Marquez, Associate Professor, Department of Occupational and Environmental Health,
University of Iowa Stewart W. Melvin, Professor, Department of Agricultural and Biosystems Engineering, Iowa State
University Patrick O’Shaughnessy, Assistant Professor, Department of Occupational and Environmental
Health, University of Iowa David Osterberg, Associate Professor, Department of Occupational and Environmental Health,
University of Iowa Wendy Powers, Assistant Professor, Department of Animal Science, Iowa State University
214
Stephen J. Reynolds, Professor, Department of Environmental Health, Colorado State University Jerald L. Schnoor, Professor, Department of Civil and Environmental Engineering, University of
Iowa Kendall M. Thu, Assistant Professor, Department of Anthropology, Northern Illinois University Patricia L. Winokur, Assistant Professor, Department of Internal Medicine, University of Iowa IDNR Liaison to Iowa State University and University of Iowa Bryan Bunton, Iowa Department of Natural Resources, Environmental Specialist, Air Quality Bureau
215
Attachment 2 Members of the External Peer Review Group
George Breuer, Retired Associate Director, Hygienic Laboratory, University of Iowa Pam Dalton, Monell Chemical Senses Center, Philadelphia, PA Jim Dosman, Director and Professor, Centre for Agricultural Medicine, University of Saskatchewan Dick Heederik, Professor, Institute for Risk Assessment Sciences, Utrecht University, The
Netherlands Torben Sigsgaard, Associate Professor, Institute of Environmental Medicine, University of Aarhus,
Denmark Eileen Wheeler, Associate Professor, Agricultural and Biological Engineering, Pennsylvania State
University James Zahn, National Swine Research and Information Center, USDA-ARS, Ames, Iowa Mike Williams, Animal and Poultry Waste Management Center, North Carolina State University
216
Attachment 3. Glossary of Terms ACGIH - American Conference of Governmental Industrial Hygienists Acidic equivalent1 - pollutants differ in their acidic effect per gram. A pollutant’s effect on acidification is expressed in
acidic equivalents Acidification1 - the process by which a soil becomes increasingly acidic. This can be caused by emissions of sulphur
dioxide, nitrogen dioxide and ammonia. Acid precipitation1 - the mechanisms by which acidity reaches the earth’s surface. These include gaseous and particle
pollutants in dry, occult or wet deposition. Acute toxicity - effects of a single dose or multiple doses measured during a twenty-four-hour period Adverse effect2a - change in morphology, physiology, growth, development or life span of an organism exposed to air
pollution, which results in impairment of functional capacity or impairment of capacity to compensate for additional stress or increase in susceptibility to the harmful effects of other environmental influences
Aeration3 - a process forcing intimate contact between air and a liquid by one or more of the following methods: spraying the liquid in the air; bubbling air through the liquid; agitating the liquid to promote absorption of oxygen through the air liquid interface
Aerobic bacteria3 - bacteria that require free elemental oxygen for their growth. Oxygen in chemical combination will not support aerobic organisms
Aerobic decomposition3 - reduction of the net energy level of organic matter by aerobic microorganisms Aerosols4 - an assembly of liquid or solid particles suspended in a gaseous medium long enough to enable observation
or measurement. Agitation3 - the turbulent mixing of liquids and slurries ALARA principle1 - the “As Low as Reasonably Achievable Principle” according to which rules and regulations are
based on a balanced assessment of available technology, economic costs and environmental interests Ambient5 - surrounding, as in the surrounding environment. The medium surrounding or contacting an organism (e.g., a
person), such as outdoor air, indoor air, water, or soil, through which chemicals or pollutants can be carried and can reach the organism
Anerobic bacteria3 - bacteria not requiring the presence of free or dissolved oxygen. Facultative anaerobes can be active in the presence of dissolved oxygen, but do not require it.
Animal health6 - a state of physical and psychological well-being and of productivity including reproduction Animal unit - many emission quantities published are based on a per animal unit (AU) basis. Unless otherwise noted,
one AU is equivalent to 500 kg body weight (1,100 lbs.) Application regulations1 - regulations governing when and how livestock manure, sewage sludge, compost, black soil
and combinations of the above may be applied on land Appraisal7 - cognitive process of assessing the extent to which a threat, challenge, or loss exists and the availability of
needed coping resources Asphyxia8 - impaired or absent exchange of oxygen and carbon dioxide on a ventilatory basis. Asthma9 - a lung disease with the following characteristics: 1) airway obstruction (or airway narrowing) that is reversible
(but not completely so in some patients) either spontaneously or with treatment; 2) airway inflammation; and 3) airway hyper-responsiveness to a variety of stimuli.
Bacteria1 - A group of universally distributed, rigid, essentially unicellular procaryotic microorganisms. Bacteria usually appear as spheroid, rod-like or curved entities, but occasionally appear as sheets, chains, or branched filaments.
Bioaerosol - includes the sub-class of viable particulates that has an associated biological component Biogas3 - gaseous product of anaerobic digestion that consists primarily of methane and carbon dioxide Bioterrorism10 - the overt or covert dispensing of disease pathogens by individuals, groups, or governments for the
explicit purpose of causing death or disease in humans, animals, or plants. Biological terrorism agents include both living microorganisms (bacteria, protozoa, viruses, and fungi), and toxins (chemicals) produced by microorganisms, plants, or animals.
Blue baby syndrome11 - see Methemoglobinemia Bronchiolitis obliterans - a disease of the airways of the lung that is characterized by fibrosis (scarring) of the small
airways (bronchioles). Known causes include some viral infections, rejection of a transplanted lung, and inhalation of some mineral dusts and irritant fumes.

217
CAFO - Concentrated Animal Feeding Operation; also known as Confined Animal Feeding Operation; generally, a
facility where large numbers of farm animals are confined, fed, and raised, such as dairy and beef cattle feedlots, hog production facilities, and closed poultry houses. EPA has developed a specific regulatory definition of CAFO for the purpose of enforcing the Clean Water Act .2
Chronicity index 12 - ratio of the acute to chronic LD50 dosage Chronic effects - effects produced by prolonged exposures of three months to a lifetime Clean Water Act11 - federal legislation administered by the U.S. EPA that serves as the primary means of protecting and
regulating the surface water quality of the United State. The goal of this legislation is to eliminate the discharge of contaminants into Untied States waters and to achieve a level of water quality capable of supporting propagation of fish and wildlife and water-based recreation
Cognitive7 - relating to thinking processes and related brain functioning Coliform-group bacteria1 - a group of long-living bacteria predominantly inhabiting the intestines of warm blooded
animals, but also found in soil. It includes all aerobic and facultative anaerobic, gram-negative, nonspore-forming bacilli that ferment lactose with production of gas. This group of “total” coliforms include escherichia coli which is considered the typical form of fecal origin. The fecal coliforms are often used as an indicator of the potential presence of pathogenic organisms.
Concentrate feed1 - animal feed containing mineral supplements Concentration7 - the strong trend of monopolization and vertical integration in agricultural production, processing, and
marketing, as well as in the manufacturing of farm inputs Contract feeding7 - a method of livestock production in which companies provide farmers with young animals, feed,
medications, etc. and the farmers provide the building, equipment, and labor, while receiving a set amount per pound or head and absorbing many of the risks of production
Control condition7 - condition in which no treatment occurs, thus allowing comparison of the effects of the experimental treatment
Coping7 - efforts to decrease, tolerate, or master the demands created by stressors; may be adaptive or maladaptive Depression7 - disorder related to brain chemistry and biologic factors that is characterized by sadness, despair, low self-
esteem, low positive affect, sleep disorders, or change in appetite Designated areas1 - areas protected by law, in this case areas vulnerable to leaching Disease13 - any deviation from or interruption of the normal structure or function of the body that has a characteristic
set of symptoms and signs for which there are objective findings (e.g., medical tests, x-rays) and which fits the definition of a specific disease as seen in the International Code of Diseases (ICD-9).
Disposal11 - the discharge, deposit, injection, dumping, spilling, leaking, or placing of any solid waste or hazardous waste into the environment (land, surface water, ground water, and air)
Diversified operations7 - farms that produce a variety of grains and livestock in ways (e.g., crop rotation) that promote environmental sustainability
Dosage - toxicity expressed as amount of toxicant per unity of body weight Emissions - the rate at which gases or particulates leave a surface or ventilated structure. An emission rate is calculated
by multiplying the concentration of a gas (mass or volume basis) by the airflow rate (volume of air per unit time) associated with this concentration
Empowerment7 - enhancement of sense of capability, on individual and social levels, as distinct from power over others
Epidemiology - study of the distribution and determinants of health-related states or events in particular populations; application of this study to the prevention and control of health problems
Escherichia coli, E. coli3 - one of the species of coliform bacteria in the intestinal tract of warm-blooded animals. Its presence is considered indicative of fresh fecal contamination.
Eutrophication1 - excessive concentrations of phosphate and nitrogen enter the environment and upset the balance of water and soil ecosystems and diminish the quality of drinking water
Externalization of costs7 - political and economic processes by which publicly unacceptable (e.g., polluting) aspects of manufacturing or production are directly or indirectly paid by the public, rather than by the manufacturer, such as through hiding or ignoring costs, passing costs along to consumers, or receiving public subsidies
Facultative bacteria11 - bacteria that can grow in the presence, as well as the absence, of oxygen Farm commodities7 - the grain, livestock, fiber, and other materials produced by farmers FEV1 - forced expiratory volume in one second FVC - forced vital capacity Groundwater14 - that portion of the water below the surface of the ground at a pressure equal to or greater than
atmospheric
218
Hazard15 - potential for radiation, a chemical or other pollutant to cause human illness or injury Health2b - health is a state of complete physical, social and mental, and social well-being and not merely the absence of
disease or infirmity Housing unit - any facility used to house livestock or poultry incorporating either a mechanical or natural ventilation
system for providing fresh-air exchange H2S - hydrogen sulfide Impermeable - not permitting fluids to pass through Inhalable - the class of particulates or bioaerosols having a mean aerodynamic diameter at or below 100 um Input standard1 - the maximum amount of minerals per acre that may be deposited on land. The standard
encompasses both the manure produced on the farm and manure or fertilizer inputted at the farmgate. Inputs7 - materials needed for farm production, e.g., seed, fertilizer, pesticides Industrialized agriculture9 - large-scale, highly capitalized farm production that favors corporate production over
family farm production Irritant16 - toxicant that exerts its deleterious effects by causing inflammation of mucous membranes with which they
came into contact. Irritants principally act on the respiratory system and can cause death from asphyxiation due to lung edema. Other mucous membranes that may be affected by irritants are those of the eyes.
Lagoon3 - an earthen facility for the biological treatment of wastewater. It can be aerobic, artificially aerated, anaerobic or facultative depending on the loading rate, design, and type of organisms present.
Land application3 - application of manure, sewage sludge, municipal wastewater, and industrial wastes to land either for disposal or for utilization of the fertilizer nutrients, organic matter, and improvement of soil tilth.
Land application unit - the process of applying animal manure to the soil Laughing gas1 - NO2, forms naturally during nitrification. It is a greenhouse gas. Loss standard1 - the amounts of phosphate and nitrogen that may be released into the environment. When losses
exceed the loss standard, a levy is raised on the difference. Low emission manure application techniques1 - techniques where manure is not spread on the surface but is injected
into the sod or ploughed in to prevent ammonia emission. Low-emission housing1 - livestock housing with a lower ammonia emission than conventional housing Manure3 - the fecal and urinary excretion of livestock and poultry. Often referred to as livestock waste. This material
may also contain bedding, spilled feed, water or soil. It may also include wastes not associated with livestock excreta, such as milking center wastewater, contaminated milk, hair, feathers, or other debris. Manure may be described in different categories as related to solids and moisture content. These categories are related to handling equipment and storage types.
Manure disposal contract1 - contract between a livestock farmer with a manure surplus on his farm and an arable farmer or other user of agricultural land with a manure shortage, or a manure processing establishment
Manure storage unit - any structure used to store manure, including long-term storage inside the housing unit. Includes above- and below-ground structures.
Meteorological17 - pertaining to the atmosphere and its phenomena, especially of its variations of heat and moisture, of its winds, etc.
Methemoglobinemia11 - illness caused by high levels of nitrate in drinking water, above about 45 ppm, which infants are particularly susceptible to.
Methane1 - a gas that is released during the digestive processes of ruminants. Methane is a greenhouse gas Microorganism - a microscopic organism as a bacteria or fungiMinerals accounting system1 - registration of nitrogen and phosphate inputs and outputs on a farm. Input and output
should be balanced although some loss is considered acceptable (loss standard). Minimum risk level (MRL)18 - an estimate of the daily human exposure to a hazardous substance that is likely to be
without appreciable risk of adverse non-cancer health effects over a specified duration of exposure. Multiplier effect7 - the multiplying of economic activities, including at the community level, including that achieved
through raw material production NH3 - ammonia Nitrification3 - the biological oxidation of ammoniacal nitrogen to nitrite and then to nitrate NO2 - nitrogen dioxide
219
Nonpoint source pollution19 - Nonpoint source pollution, unlike pollution from industrial and sewage treatment plants, comes from many diffuse sources. Nonpoint source pollution is caused by rainfall or snowmelt moving over and through the ground. As the runoff moves, it picks up and carries away natural and human-made pollutants, finally depositing them into lakes, rivers, wetlands, coastal waters, and even our underground sources of drinking water. In rural areas these pollutants include bacteria and nutrients from livestock, soil sediments, fertilizers, herbicides, and insecticides.
Nutrient pollution11 - contamination by excessive inputs of nutrient: a primary cause of eutrophication of surface waters, in which excess nutrients, usually nitrogen or phosphorus, stimulate algal growth. Sources of nutrient pollution include runoff from fields and pastures, discharges from septic tanks and feedlots, and emissions from combustion.
Odor threshold3 - the lowest concentration of an odor in air that can be detected by the human olfactory sense Operating costs7 - the costs of farm inputs, labor, credit, energy, etc. OSHA - Occupational Safety and Health Administration Particulate - includes the class of both inert and viable aerosols. Includes total, inhalable, and respirable fractions Parity prices7 - equality in prices for farm commodities in which farmers get a fair return in relation to their costs of
production; historically maintained by government support of farm commodity prices at a level fixed by law and indexed for inflation
PEL - Permissible Exposure Limit Point source pollution - pollution from a particular source Poison - see Toxicant Pollutant11 - a contaminant that adversely alters the physical, chemical, or biological properties of the environment. The
term includes toxic metals, carcinogens, pathogens, oxygen-demanding materials, heat, and all other harmful substances, contaminants, or impurities
Pollution11 - presence of a contaminant to such a degree that the environment (land, water, or air) is not suitable for a particular use
Price support7 - a policy mechanism such as the non-recourse loan that sets a floor under farm commodities and thus requires exporters or processors to pay a minimum price. This is in contrast to an “income support” that involves direct payments from the U. S. Treasury to support farm income but does not directly influence market prices.
Pulmonary8 - relating to the lungs, to the pulmonary artery, or to the aperture leading from the right ventricle into the pulmonary artery
Regulation11 - a requirement or rule passed by an agency or department of federal, state, or local government that is authorized to create and enforce a requirement or rule through an authorizing statute or co nstitutional authority
Resistance - the extent to which a disease or disease-causing organism is unaffected by antibiotics or other medications Respirable - the class of particulates or bioaerosols having a mean aerodynamic diameter at or below 5 um Restructuring (agricultural restructuring)20 - changes in the relationships among ownership, management, and labor
in the agriculture-food system, with particular emphasis on the production component. Restructuring generally involves technological changes (including shifts in levels of specialization/diversification) as cause or effect, and may include changes in vertical and horizontal integration or coordination, in ownership of resources (including tenancy and leasing), in farm/firm size, in geographic location of specific agri-food activities, in composition of the work force, and in levels of concentration at various levels in the supply chain.
Risk assessment - the characterization of the potential adverse health effects of human exposures to environmental hazards
Runoff21 - occurs when input of water exceeds infiltration. Pesticide runoff includes losses from the dissolved and sediment-absorbed pesticide. Though runoff generally results directly in the contamination of surface water, it can also contribute to ground water contamination through recharging ground water by the surface water.
Setback18 - specific distance that a structure or area must be located away, from other defined areas or structures Sinusitis8 - inflammation of the lining membrane of any sinus, especially of one of the sinuses alongside the nose. Siting11 - choosing a location for a facility Social capital - mutual trust, reciprocity, and shared norms and identity that are inherent in relationships between and
among groups Spot market - a market in which buyer and seller come together with no pre-arranged commitment or price with the
expectation of exchanging a good or service. The terms of the transaction are public, and, jointly with other similar transactions of the day, define a market price for that day.
Statistically significant difference - a research finding that is unlikely (usually less likely than 5 percent) to be due to chance
220
STEL - short-term exposure limit Stress7 - emotional, physical, behavioral, and social reactions to stressors Stressor7 - short-term or ongoing conditions, situations, or relationships that cause stress, often involving change,
conflict, or pressure Subacute toxic effects - toxic effects apparent over a period of several days or weeks Subchronic toxicity - toxic effects that occur between 30 days and 90 days exposure Supply chain22 - the chain of transactions and product transformations that take place between the producer and
consumer of a particular commodity. Historically, in agriculture, supply chains have implied openness of entry for new producers, and hence involve mass production of an undifferentiated commodity.
Tolerance - condition in which repeated exposure increases the size of the dose required to produce lethality Toxicity - the quantitative amount or dosage of a poison that will produce a define effect Toxicant - any natural or synthetic solid, liquid or gas that when introduced into or applied to the body can interfere
with homeostasis of the organism or life processes of cells of he organism by its own inherent qualities, without acting mechanically and irrespective of temperature
Trace element1 - chemical elements (such as copper, zinc) present in minute quantities in plant or animal tissues and considered essential to these organisms’ physiological processes. An overdose, however, is harmful for the organism. Non-essential trace elements such as cadmium are harmful even in very low concentrations.
TWA - Time Weighted Average USDA - U. S. Department of Agriculture; federal agency that is responsible for select state and local programs regarding
agricultural production, conservation, and food Value-added agriculture7 - production of farm commodities that are fully or partially processed before being marketed
by farmers (as individuals or in groups, e.g., ethanol cooperatives), thus enhancing the income of farmers and rural communities
Value chain22 - a supply chain characterized at least in part of its links by vertical coordination. Value chains generally involve limited entry at the various levels, or links in the chain, and are focused on providing particular consumer groups with a product that fits their preferences. The emphasis is on quality (or specific qualities), rather than on producing an inexpensive product.
Vertical coordination23 - synchronization of the vertical stages of a production/marketing system Vertical integration24 - coordination of two or more stages in the food chain under ownership via management
directive VOC - volatile organic compound
221
Glossary Credits 1Glossary, Ministry of Agriculture, Nature Management and Fisheries, PO Box 20.401, 2500 EK, the Hague, The
Netherlands. 2aWorld Health Organization, Environmental Health Information, Air Quality Guidelines, Appendix 3, Glossary (1994).
http://www.who.int/environmental_information/Air/Guidelines/ann3.html. 2bWorld Health Organization, Constitution. (1948). Health Promotion Glossary, Section I.: List of Basic Terms; WHO,
1998, Division of Health Promotion, Education and Communications; Health Education and Health Promotion Unit; WHO/HPR/HEP/98.1. http://www.who.int/hpr/archive/docs/glossary.pdf.
3Uniform terminology for rural water management. ASAE S292.5, December 1999. American Society of Agricultural Engineers, AWAE Standards (2000).
4Klaus Willeke K, Baron PA (eds.). Aerosol measurement: Principles, techniques and applications (p. 8). New York: Van Nostrand Reinhold (1993).
5Environmental Defense Fund: Scorecard Glossary, http://www.scorecard.org/about/glossary.tcl . 6Blood DC, Studdert VP; anatomical tables by John Grandage. Saunders comprehensive veterinary dictionary, 2nd
edition. London: WB Saunders (1999). 7Hodne C J. Glossary for farm advocates and health and mental health professionals. Iowa City, IA: Iowa’s Center for
Agricultural Safety and Health; Institute for Agriculture and Trade Policy (2001). 8Spraycar M (ed.). Stedman's medical dictionary 26th ed. (p. 156). Baltimore: Williams and Wilkins (1995). 9National Asthma Education Program, National Institutes of Health. Executive summary: Guidelines for the diagnosis
and management of asthma (p. 1). Publication No. 91-3042A. Bethesda, MD: US Department of Health and Human Services (1991).
10Los Angeles County Department of Health Services - Public Health. "Bioterrorism preparedness and response" (2002). Available at http://www.labt.org, accessed February 4, 2002.
11Wefering F, Zering K. "Glossary," unpublished Internet document, Department of Agricultural and Resource Economics, North Carolina State University, Raleigh.
http://www2.ncsu.edu/unity/lockers/users/k/kzering/glossary.html. 12Easton, DL, Klaassen, CD. Principles of toxicology. In C. D. Klassen (Ed.) Casarett and Doull’s toxicology: The basic
science of poisons. 6th Edition. McGraw-Hill Medical Publishing Division (2001). 13Newman Dorland WA (Ed.). Dorland's illustrated medical dictionary, 28th edition. Philadelphia, PA: WB Saunders
(1994). 14Soil Science Society of America. Internet Glossary of Soil Science Terms, http://www.soils.org/sssagloss/ (1997). 15EPA: http://www.epa.gov/OCEPAterms/hterms.html. 16Hodgson E, Mailman RB, Chambers JE. Dictionary of toxicology (p. 205). New York: Van Nostrand Reinhold
Company, Inc. (1988). 17Webster's new collegiate dictionary (p. 529). Springfield, MA: G & C Merriam Co. (1961). 18Agency for Toxic Substances and Disease Registry, http://www.atsdr.cdc.gov/mrls.html. 19 http://www.epa.gov/owow/nps/qa.html; from EPA’s Polluted brochure EPA-841-F-94-005 (1994). 20National Research Council. Publicly funded agricultural research and the changing structure of U.S. agriculture.
Committee to review the role of publicly funded agricultural research on the structure of U.S. agriculture. Washington, DC: National Academy Press (2001).
21Honeycutt RC, Schabacker DJ (eds.). Mechanisms of pesticide movement into groundwater (p. 5). Boca Raton, FL: CRC Press (1994).
22Adapted from Flora CB, Carpenter S, Hinrichs C, Kroma M, Lawrence M, Pigg K, Durgan B, Draeger K. A summary of the literature related to social/community. Prepared for the Minnesota Environmental Board by the University of Minnesota (A)(1):A1-A68 (1999).
23Tweeten LC, Flora CB. Vertical coordination of agriculture in farming-dependent areas. Task Force Report N. 137. Council for Agricultural Science and Technology, Ames, Iowa 1-40 (2001).
24Martínez S. Vertical coordination in the pork and broiler industries. Agricultural Economics Report No. 777. Economic Research Service, U.S. Department of Agriculture, Washington, D.C. (1999).