exchange bias in ferrimagnetic–antiferromagnetic nanocomposite produced by mechanical attrition
TRANSCRIPT
ARTICLE IN PRESS
Journal of Magnetism and Magnetic Materials 321 (2009) 2269–2275
Contents lists available at ScienceDirect
Journal of Magnetism and Magnetic Materials
0304-88
doi:10.1
� Corr
E-m
journal homepage: www.elsevier.com/locate/jmmm
Exchange bias in ferrimagnetic–antiferromagnetic nanocomposite producedby mechanical attrition
P. Hajra a, S. Basu b, S. Dutta c, P. Brahma d, D. Chakravorty e,�
a Department of Physics, Sammilani Mahavidyalaya, Kolkata 700075, Indiab Department of Physics, National Institute of Technology, Durgapur 713209, Indiac Rammohan College, 102/1 Raja Rammohan Roy Sarani, Kolkata 700009, Indiad Gurudas College, Department of Physics, Kolkata 700054, Indiae DST Unit on Nanoscience, Indian Association for the Cultivation of Science, Kolkata 700032, India
a r t i c l e i n f o
Article history:
Received 24 December 2008
Received in revised form
27 January 2009Available online 5 February 2009
Keywords:
Core–shell
Nanocomposite
Exchange bias
Mechanical attrition
53/$ - see front matter & 2009 Elsevier B.V. A
016/j.jmmm.2009.01.037
esponding author.
ail address: [email protected] (D. Chakravorty
a b s t r a c t
Nanoparticles comprising of magnetite (Fe3O4) core–hematite (a-Fe2O3) shell with mean diameter
around 9 nm were synthesized by mechanical grinding. Zero-field-cooled (ZFC) and field-cooled (FC)
magnetization and hysteresis loop measurements were carried out over the temperature range 5–300 K.
Exchange bias varying from 140 to 10 Oe was observed. This is explained as arising due to
ferrimagnetic–antiferromagnetic coupling at the nanointerfaces between the two phases. Analysis of
data shows a pronounced increase in the effective anisotropy constant as the milling time is increased.
& 2009 Elsevier B.V. All rights reserved.
1. Introduction
Magnetic nanoparticles are of growing interest because of theirpotential application in ultra high-density recording and medicine[1]. Most applications depend on thermal stability of the magneticorder in the nanoparticles. Magnetization reversal in an assemblyof magnetic nanoparticles determines the stability of storedinformation and limits the ultimate storage density. Exchangecoupling (exchange bias) induced at the interface betweenferromagnetic and antiferromagnetic systems can provide anextra source of anisotropy leading to magnetization stability [2].In heterostructures, exchange coupling between a ferromagnetand the antiferromagnet produces a ferromagnetic behavior withgood stability and high anisotropy. In such a structure, theanisotropy may be unidirectional a feature not found in ferro-magnets. This phenomenon is called exchange bias, because thehysteresis loop associated with the ferromagnet/antiferromagnetstructure can be centred about a non-zero magnetic field.
Exchange bias (EB) has been extensively studied in thin filmswith ferromagnet–antiferromagnet (FM–AFM) interfaces [3]. EB
has been studied in nanoparticles (np) of metal (core)–metaloxide (shell) structure of transition metals or their alloys [4,5]. Sofar various experimental methods have been used to synthesize
ll rights reserved.
).
core (FM)–shell (AFM) interface structure to observe exchangebias, e.g. inert-gas-condensation [6], plasma-gas-condensation[7], vapour deposition technique [4,8], etc. These methods areexpensive and not suitable for bulk production. On the other hand,mechanical attrition is an useful technique for making nanos-tructured materials in bulk quantity [9]. Our earlier work hasshown that nanointerface between Fe-based oxides can begenerated by subjecting magnetite powder to mechanical grind-ing [10]. We have now extended this investigation to delineate themagnetic particles of these composites. The latter exhibitexchange bias behavior. The details are reported in this paper.
2. Experimental
Magnetite powder of 99% purity was procured from M/SAldrich Chemicals. The powder taken in steel vials of 80 mlvolume was subjected to grinding operation in a FritschPulverisette 5 Planetary ball Mill under ordinary atmosphere.The phase transformation of the powder was studied by X-raydiffraction by taking out the sample after few hours of milling andrecording the diffraction pattern using a Philips X-ray diffract-ometer (PW1130) consisting of a PW1710 controller. The micro-structures of the samples were investigated by a JEM2010transmission electron microscope. Magnetic measurements werecarried out using a Quantum Design SQUID magnetometer in thetemperature range 5–300 K.
ARTICLE IN PRESS
P. Hajra et al. / Journal of Magnetism and Magnetic Materials 321 (2009) 2269–22752270
3. Structural analysis
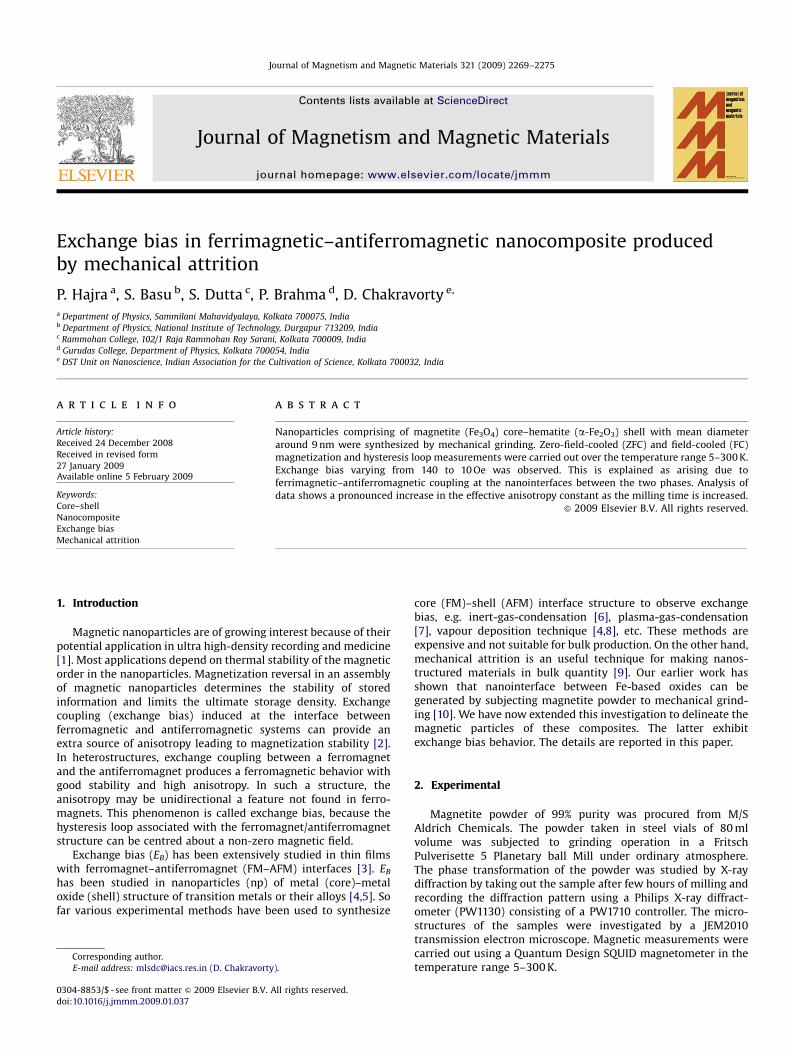
X-ray data analysed by Rietvelt method showed a phasetransformation from Fe3O4 to a-Fe2O3 as the duration of grindingwas increased. The detailed X-ray data were reported earlier [10].The crystalline phases and volume fractions thereof in differentsamples are summarized in Table 1. Fig. 1(a) is a typicaltransmission electron micrograph for a specimen subjected to amilling operation for 6 h. Fig. 1(b) is the electron diffractionpattern obtained from Fig. 1(a). The interplanar spacing deter-mined from the diffraction rings confirmed the presence of Fe3O4
and a-Fe2O3 phases, respectively. Similar results were obtainedfor samples milled for different periods. The particle sizes in thesespecimens were analysed by fitting the histograms of particlesizes (estimated from transmission electronic microscopy) to alognormal distribution function. Table 1 gives the extracted valuesof the median diameter x and geometric standard deviation s fordifferent samples. It can be seen that the mean diameter does notchange much as a function of grinding time. This can berationalized as follows. As the grinding duration is increased theprecursor particles get reduced in size. However, under ambientcondition the reactive surface of Fe3O4 particles become oxidizedto a-Fe2O3. The two processes tend to keep the average particlediameter unchanged. Fig. 1(c) shows the high-resolution electronmicrograph for a specimen subjected to grinding for 6 h. It isevident that there is a core–shell configuration with the coreregion showing a lattice spacing of 0.241 nm. The latter corre-sponds to the plane (2 2 2) of magnetite (Fe3O4) phase. The shellregion shows a lattice spacing of 0.251 nm, which corresponds tothe plane (110) of hematite (a-Fe2O3) phase. The core diameter of
Table 1Summary of parameters extracted from X-ray diffraction data and transmission
electron microscopy.
Grinding
period (h)
X-ray analysis TEM analysis
Phases
present
Volume
fraction
Particle diameter
x (nm)
Geometric standard
deviation (s)
0 Fe3O4 1.0
2 Fe3O4 0.6 8.0 1.6
a-Fe2O3 0.4
6 Fe3O4 0.1 10.0 1.3
a-Fe2O3 0.9
10 Fe3O4 0.05 9.0 1.4
a-Fe2O3 0.95
Fig. 1. (a) Transmission electron micrograph for a specimen subjected to a milling op
resolution electron micrograph for a specimen grinding for 6 h.
the particle concerned is estimated as 10 nm and the shellthickness as 3.3 nm.
The mechanism of shell formation can be explained as follows.a-Fe2O3 phase grows on the surfaces of Fe3O4 particles. Thecloseness of interplanar spacings of Fe3O4 (2 2 2) and a-Fe2O3
(110) planes helps this surface growth because of a low value ofinterfacial energy between the two phases. The shell is made up ofnanosized a-Fe2O3 particles. The diffraction spots (Fig. 1(b))forming rings confirm the presence of these particles. The poresin between the a-Fe2O3 particles ensure diffusion of atmosphericoxygen to bring about the phase transformation even for longgrinding duration.
4. Temperature dependence of low field magnetization
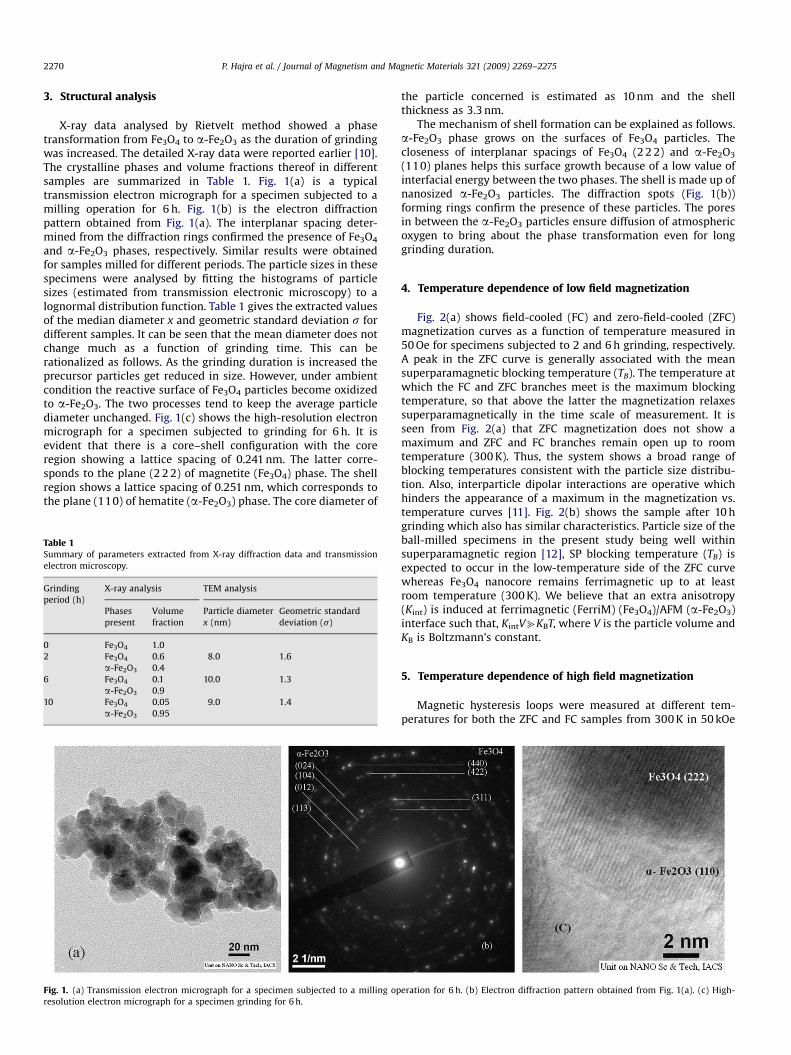
Fig. 2(a) shows field-cooled (FC) and zero-field-cooled (ZFC)magnetization curves as a function of temperature measured in50 Oe for specimens subjected to 2 and 6 h grinding, respectively.A peak in the ZFC curve is generally associated with the meansuperparamagnetic blocking temperature (TB). The temperature atwhich the FC and ZFC branches meet is the maximum blockingtemperature, so that above the latter the magnetization relaxessuperparamagnetically in the time scale of measurement. It isseen from Fig. 2(a) that ZFC magnetization does not show amaximum and ZFC and FC branches remain open up to roomtemperature (300 K). Thus, the system shows a broad range ofblocking temperatures consistent with the particle size distribu-tion. Also, interparticle dipolar interactions are operative whichhinders the appearance of a maximum in the magnetization vs.temperature curves [11]. Fig. 2(b) shows the sample after 10 hgrinding which also has similar characteristics. Particle size of theball-milled specimens in the present study being well withinsuperparamagnetic region [12], SP blocking temperature (TB) isexpected to occur in the low-temperature side of the ZFC curvewhereas Fe3O4 nanocore remains ferrimagnetic up to at leastroom temperature (300 K). We believe that an extra anisotropy(Kint) is induced at ferrimagnetic (FerriM) (Fe3O4)/AFM (a-Fe2O3)interface such that, KintVbKBT, where V is the particle volume andKB is Boltzmann’s constant.
5. Temperature dependence of high field magnetization
Magnetic hysteresis loops were measured at different tem-peratures for both the ZFC and FC samples from 300 K in 50 kOe
eration for 6 h. (b) Electron diffraction pattern obtained from Fig. 1(a). (c) High-
ARTICLE IN PRESS
Fig. 2. (a) Field-cooled (FC) and zero-field-cooled (ZFC) magnetization M (emu/
gm) curves as a function of temperature T(K) measured in 50 Oe for specimens
subjected to 2 and 6 h. (b) Field-cooled (FC) and zero-field-cooled (ZFC)
magnetization M (emu/gm) curves as a function of temperature T(K) measured
in 50 Oe for specimens subjected to milling operation for 10 h.
P. Hajra et al. / Journal of Magnetism and Magnetic Materials 321 (2009) 2269–2275 2271
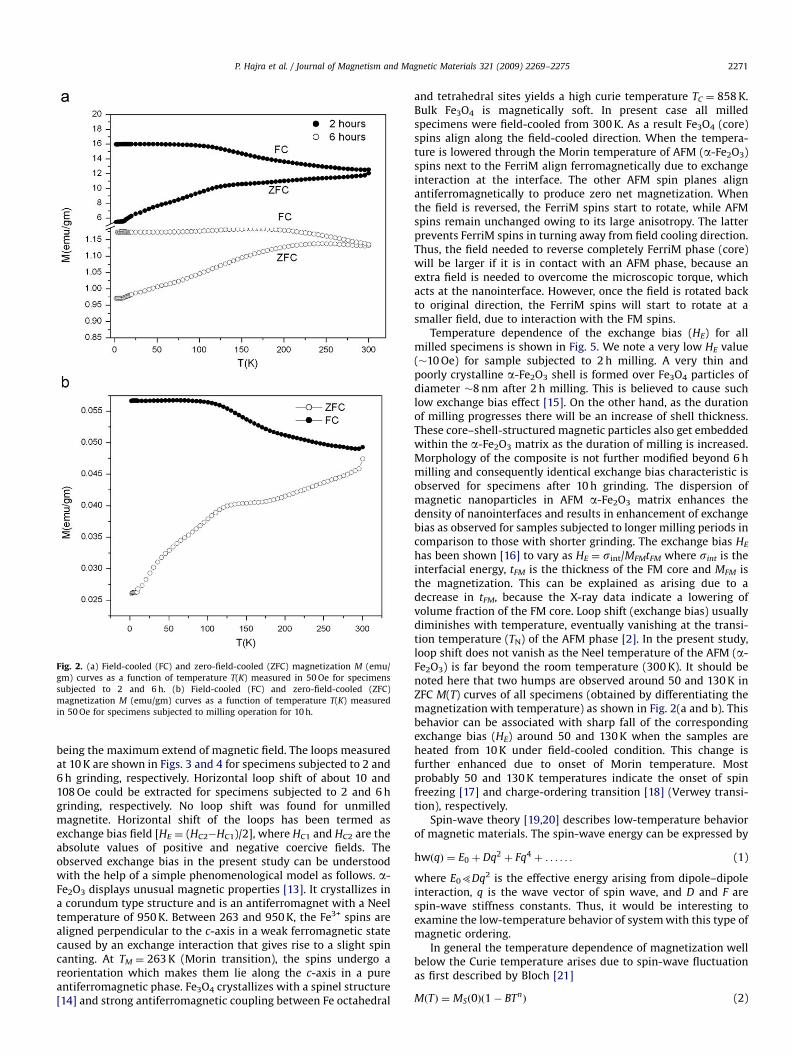
being the maximum extend of magnetic field. The loops measuredat 10 K are shown in Figs. 3 and 4 for specimens subjected to 2 and6 h grinding, respectively. Horizontal loop shift of about 10 and108 Oe could be extracted for specimens subjected to 2 and 6 hgrinding, respectively. No loop shift was found for unmilledmagnetite. Horizontal shift of the loops has been termed asexchange bias field [HE ¼ (HC2�HC1)/2], where HC1 and HC2 are theabsolute values of positive and negative coercive fields. Theobserved exchange bias in the present study can be understoodwith the help of a simple phenomenological model as follows. a-Fe2O3 displays unusual magnetic properties [13]. It crystallizes ina corundum type structure and is an antiferromagnet with a Neeltemperature of 950 K. Between 263 and 950 K, the Fe3+ spins arealigned perpendicular to the c-axis in a weak ferromagnetic statecaused by an exchange interaction that gives rise to a slight spincanting. At TM ¼ 263 K (Morin transition), the spins undergo areorientation which makes them lie along the c-axis in a pureantiferromagnetic phase. Fe3O4 crystallizes with a spinel structure[14] and strong antiferromagnetic coupling between Fe octahedral
and tetrahedral sites yields a high curie temperature TC ¼ 858 K.Bulk Fe3O4 is magnetically soft. In present case all milledspecimens were field-cooled from 300 K. As a result Fe3O4 (core)spins align along the field-cooled direction. When the tempera-ture is lowered through the Morin temperature of AFM (a-Fe2O3)spins next to the FerriM align ferromagnetically due to exchangeinteraction at the interface. The other AFM spin planes alignantiferromagnetically to produce zero net magnetization. Whenthe field is reversed, the FerriM spins start to rotate, while AFMspins remain unchanged owing to its large anisotropy. The latterprevents FerriM spins in turning away from field cooling direction.Thus, the field needed to reverse completely FerriM phase (core)will be larger if it is in contact with an AFM phase, because anextra field is needed to overcome the microscopic torque, whichacts at the nanointerface. However, once the field is rotated backto original direction, the FerriM spins will start to rotate at asmaller field, due to interaction with the FM spins.
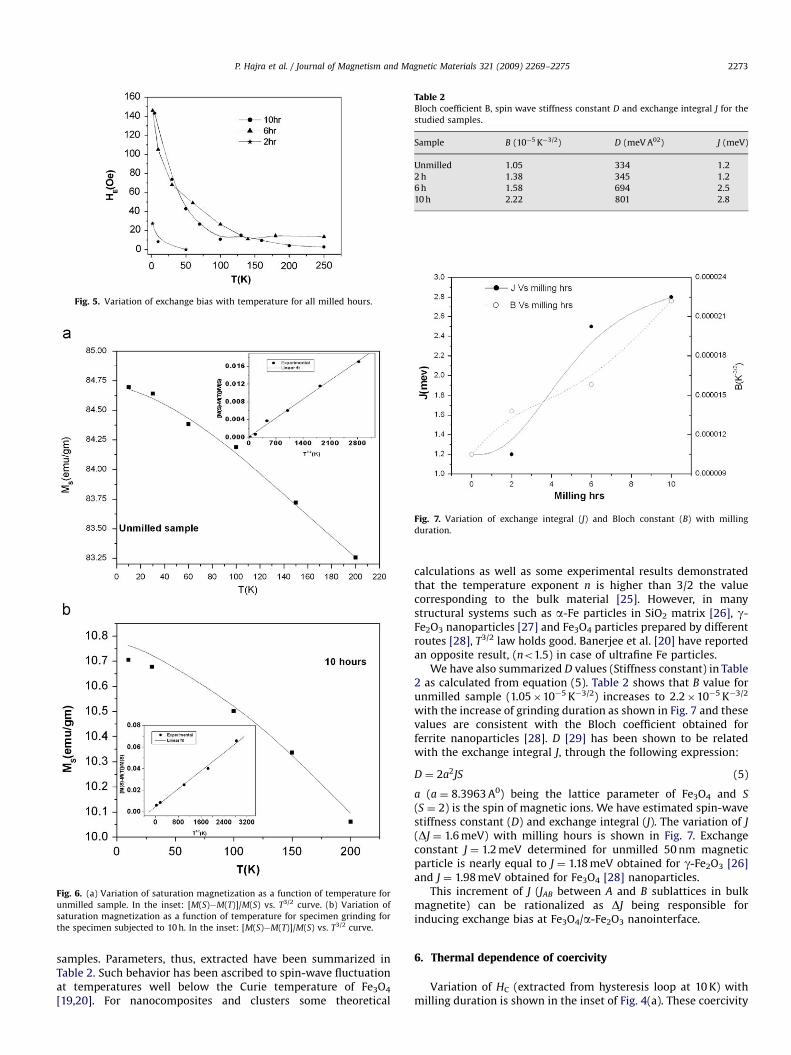
Temperature dependence of the exchange bias (HE) for allmilled specimens is shown in Fig. 5. We note a very low HE value(�10 Oe) for sample subjected to 2 h milling. A very thin andpoorly crystalline a-Fe2O3 shell is formed over Fe3O4 particles ofdiameter �8 nm after 2 h milling. This is believed to cause suchlow exchange bias effect [15]. On the other hand, as the durationof milling progresses there will be an increase of shell thickness.These core–shell-structured magnetic particles also get embeddedwithin the a-Fe2O3 matrix as the duration of milling is increased.Morphology of the composite is not further modified beyond 6 hmilling and consequently identical exchange bias characteristic isobserved for specimens after 10 h grinding. The dispersion ofmagnetic nanoparticles in AFM a-Fe2O3 matrix enhances thedensity of nanointerfaces and results in enhancement of exchangebias as observed for samples subjected to longer milling periods incomparison to those with shorter grinding. The exchange bias HE
has been shown [16] to vary as HE ¼ sint/MFMtFM where sint is theinterfacial energy, tFM is the thickness of the FM core and MFM isthe magnetization. This can be explained as arising due to adecrease in tFM, because the X-ray data indicate a lowering ofvolume fraction of the FM core. Loop shift (exchange bias) usuallydiminishes with temperature, eventually vanishing at the transi-tion temperature (TN) of the AFM phase [2]. In the present study,loop shift does not vanish as the Neel temperature of the AFM (a-Fe2O3) is far beyond the room temperature (300 K). It should benoted here that two humps are observed around 50 and 130 K inZFC M(T) curves of all specimens (obtained by differentiating themagnetization with temperature) as shown in Fig. 2(a and b). Thisbehavior can be associated with sharp fall of the correspondingexchange bias (HE) around 50 and 130 K when the samples areheated from 10 K under field-cooled condition. This change isfurther enhanced due to onset of Morin temperature. Mostprobably 50 and 130 K temperatures indicate the onset of spinfreezing [17] and charge-ordering transition [18] (Verwey transi-tion), respectively.
Spin-wave theory [19,20] describes low-temperature behaviorof magnetic materials. The spin-wave energy can be expressed by
hwðqÞ ¼ E0 þ Dq2 þ Fq4 þ . . . . . . (1)
where E05Dq2 is the effective energy arising from dipole–dipoleinteraction, q is the wave vector of spin wave, and D and F arespin-wave stiffness constants. Thus, it would be interesting toexamine the low-temperature behavior of system with this type ofmagnetic ordering.
In general the temperature dependence of magnetization wellbelow the Curie temperature arises due to spin-wave fluctuationas first described by Bloch [21]
MðTÞ ¼ MSð0Þð1� BTnÞ (2)
ARTICLE IN PRESS
Fig. 3. Magnetization vs. field loop measured at 10 K under ZFC (a) and FC (b) condition for the specimen subjected to 2 h. In the inset: central part of the loop.
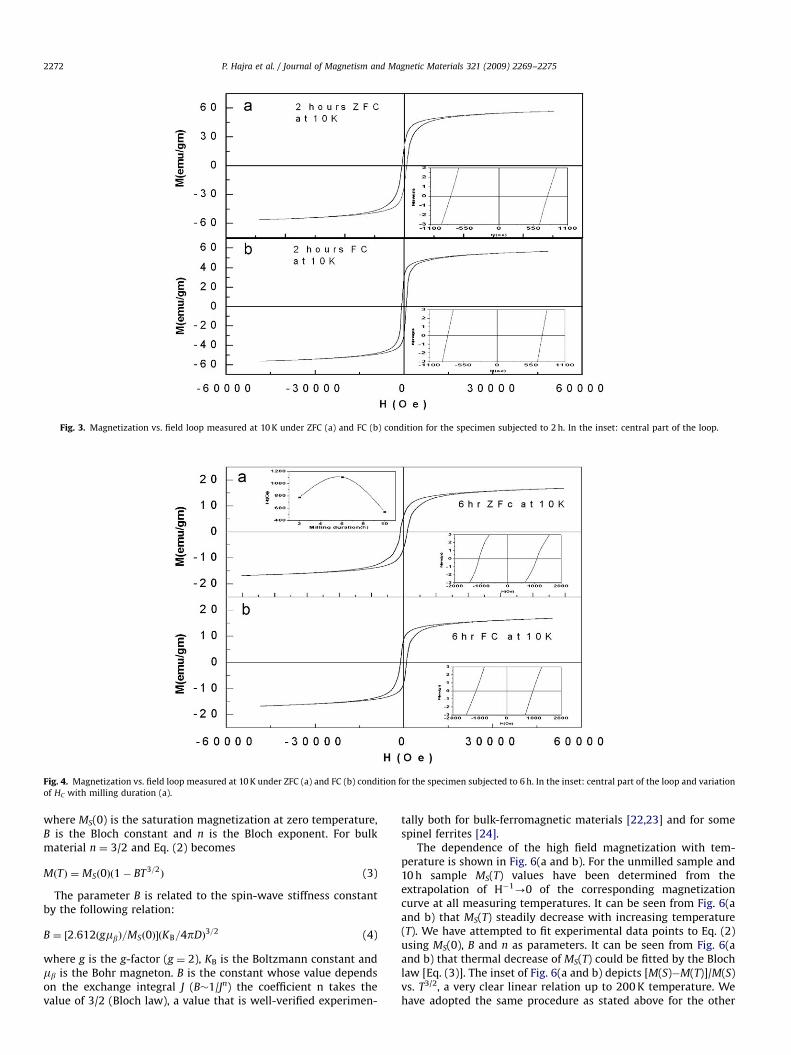
Fig. 4. Magnetization vs. field loop measured at 10 K under ZFC (a) and FC (b) condition for the specimen subjected to 6 h. In the inset: central part of the loop and variation
of HC with milling duration (a).
P. Hajra et al. / Journal of Magnetism and Magnetic Materials 321 (2009) 2269–22752272
where MS(0) is the saturation magnetization at zero temperature,B is the Bloch constant and n is the Bloch exponent. For bulkmaterial n ¼ 3/2 and Eq. (2) becomes
MðTÞ ¼ MSð0Þð1� BT3=2Þ (3)
The parameter B is related to the spin-wave stiffness constantby the following relation:
B ¼ ½2:612ðgmbÞ=MSð0Þ�ðKB=4pDÞ3=2 (4)
where g is the g-factor (g ¼ 2), KB is the Boltzmann constant andmb is the Bohr magneton. B is the constant whose value dependson the exchange integral J (B�1/Jn) the coefficient n takes thevalue of 3/2 (Bloch law), a value that is well-verified experimen-
tally both for bulk-ferromagnetic materials [22,23] and for somespinel ferrites [24].
The dependence of the high field magnetization with tem-perature is shown in Fig. 6(a and b). For the unmilled sample and10 h sample MS(T) values have been determined from theextrapolation of H�1-0 of the corresponding magnetizationcurve at all measuring temperatures. It can be seen from Fig. 6(aand b) that MS(T) steadily decrease with increasing temperature(T). We have attempted to fit experimental data points to Eq. (2)using MS(0), B and n as parameters. It can be seen from Fig. 6(aand b) that thermal decrease of MS(T) could be fitted by the Blochlaw [Eq. (3)]. The inset of Fig. 6(a and b) depicts [M(S)�M(T)]/M(S)vs. T3/2, a very clear linear relation up to 200 K temperature. Wehave adopted the same procedure as stated above for the other
ARTICLE IN PRESS
Fig. 5. Variation of exchange bias with temperature for all milled hours.
Fig. 6. (a) Variation of saturation magnetization as a function of temperature for
unmilled sample. In the inset: [M(S)�M(T)]/M(S) vs. T3/2 curve. (b) Variation of
saturation magnetization as a function of temperature for specimen grinding for
the specimen subjected to 10 h. In the inset: [M(S)�M(T)]/M(S) vs. T3/2 curve.
Table 2Bloch coefficient B, spin wave stiffness constant D and exchange integral J for the
studied samples.
Sample B (10�5 K�3/2) D (meV A02) J (meV)
Unmilled 1.05 334 1.2
2 h 1.38 345 1.2
6 h 1.58 694 2.5
10 h 2.22 801 2.8
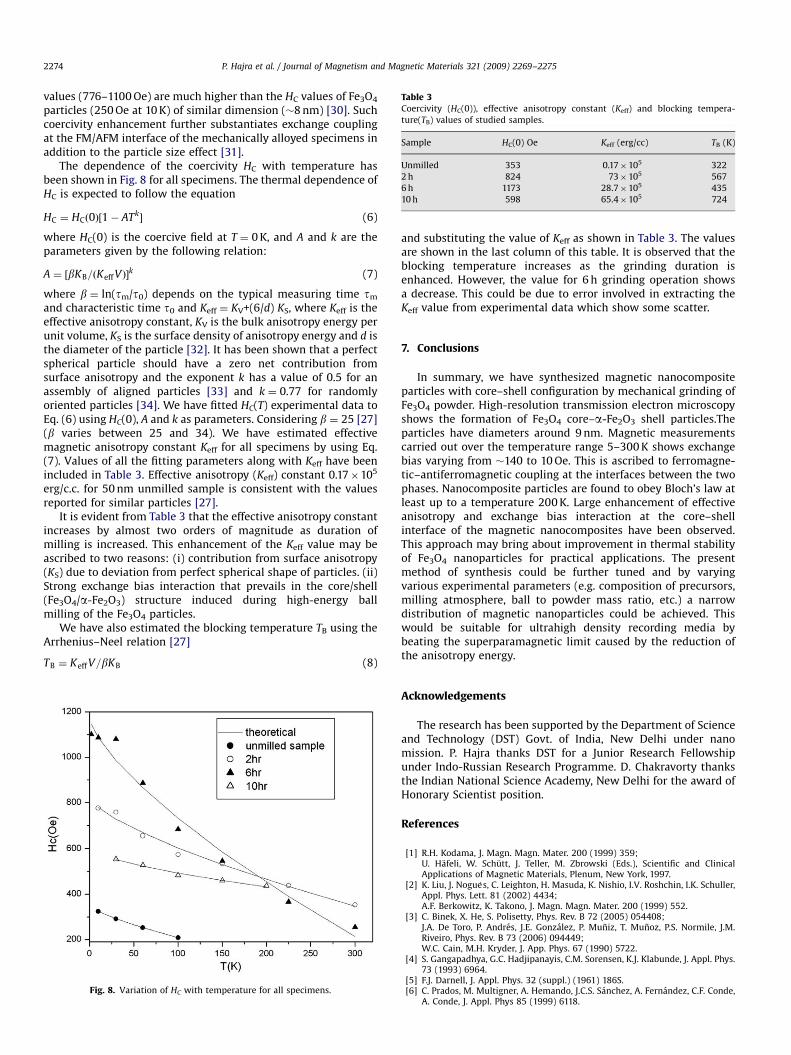
Fig. 7. Variation of exchange integral (J) and Bloch constant (B) with milling
duration.
P. Hajra et al. / Journal of Magnetism and Magnetic Materials 321 (2009) 2269–2275 2273
samples. Parameters, thus, extracted have been summarized inTable 2. Such behavior has been ascribed to spin-wave fluctuationat temperatures well below the Curie temperature of Fe3O4
[19,20]. For nanocomposites and clusters some theoretical
calculations as well as some experimental results demonstratedthat the temperature exponent n is higher than 3/2 the valuecorresponding to the bulk material [25]. However, in manystructural systems such as a-Fe particles in SiO2 matrix [26], g-Fe2O3 nanoparticles [27] and Fe3O4 particles prepared by differentroutes [28], T3/2 law holds good. Banerjee et al. [20] have reportedan opposite result, (no1.5) in case of ultrafine Fe particles.
We have also summarized D values (Stiffness constant) in Table2 as calculated from equation (5). Table 2 shows that B value forunmilled sample (1.05�10�5 K�3/2) increases to 2.2�10�5 K�3/2
with the increase of grinding duration as shown in Fig. 7 and thesevalues are consistent with the Bloch coefficient obtained forferrite nanoparticles [28]. D [29] has been shown to be relatedwith the exchange integral J, through the following expression:
D ¼ 2a2JS (5)
a (a ¼ 8.3963 A0) being the lattice parameter of Fe3O4 and S
(S ¼ 2) is the spin of magnetic ions. We have estimated spin-wavestiffness constant (D) and exchange integral (J). The variation of J
(DJ ¼ 1.6 meV) with milling hours is shown in Fig. 7. Exchangeconstant J ¼ 1.2 meV determined for unmilled 50 nm magneticparticle is nearly equal to J ¼ 1.18 meV obtained for g-Fe2O3 [26]and J ¼ 1.98 meV obtained for Fe3O4 [28] nanoparticles.
This increment of J (JAB between A and B sublattices in bulkmagnetite) can be rationalized as DJ being responsible forinducing exchange bias at Fe3O4/a-Fe2O3 nanointerface.
6. Thermal dependence of coercivity
Variation of HC (extracted from hysteresis loop at 10 K) withmilling duration is shown in the inset of Fig. 4(a). These coercivity
ARTICLE IN PRESS
Table 3Coercivity (HC(0)), effective anisotropy constant (Keff) and blocking tempera-
ture(TB) values of studied samples.
Sample HC(0) Oe Keff (erg/cc) TB (K)
Unmilled 353 0.17�105 322
2 h 824 73�105 567
6 h 1173 28.7�105 435
10 h 598 65.4�105 724
P. Hajra et al. / Journal of Magnetism and Magnetic Materials 321 (2009) 2269–22752274
values (776–1100 Oe) are much higher than the HC values of Fe3O4
particles (250 Oe at 10 K) of similar dimension (�8 nm) [30]. Suchcoercivity enhancement further substantiates exchange couplingat the FM/AFM interface of the mechanically alloyed specimens inaddition to the particle size effect [31].
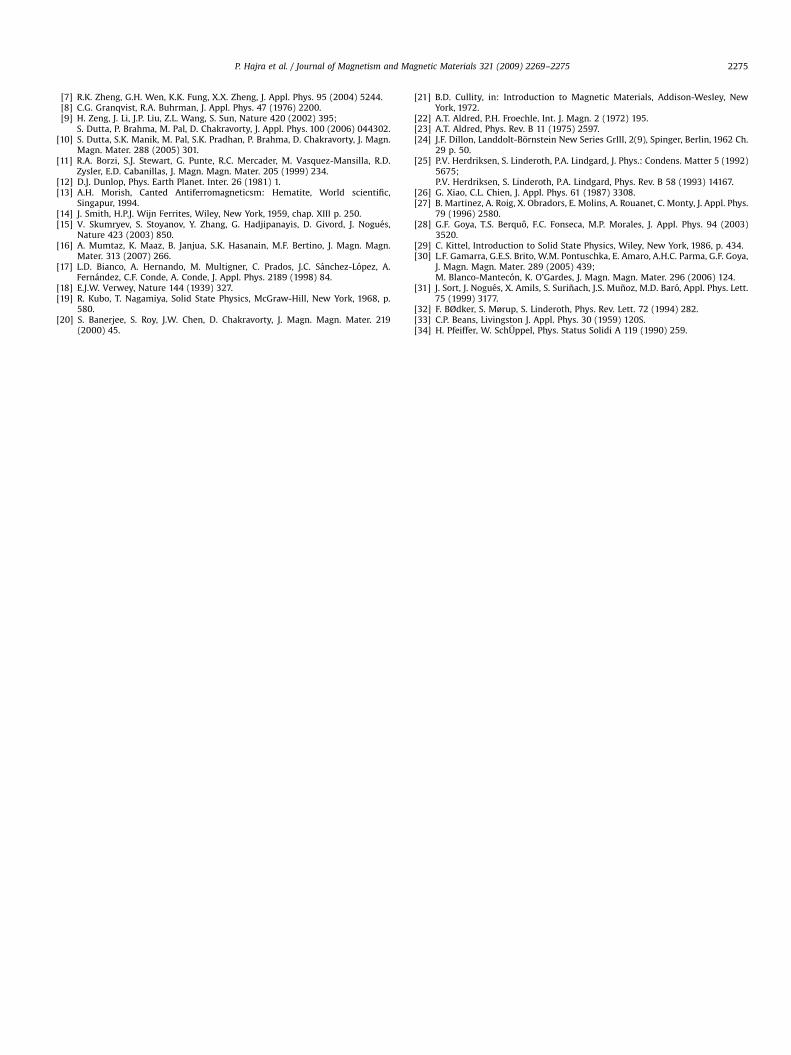
The dependence of the coercivity HC with temperature hasbeen shown in Fig. 8 for all specimens. The thermal dependence ofHC is expected to follow the equation
HC ¼ HCð0Þ½1� ATk� (6)
where HC(0) is the coercive field at T ¼ 0 K, and A and k are theparameters given by the following relation:
A ¼ ½bKB=ðKeff VÞ�k (7)
where b ¼ ln(tm/t0) depends on the typical measuring time tm
and characteristic time t0 and Keff ¼ KV+(6/d) KS, where Keff is theeffective anisotropy constant, KV is the bulk anisotropy energy perunit volume, KS is the surface density of anisotropy energy and d isthe diameter of the particle [32]. It has been shown that a perfectspherical particle should have a zero net contribution fromsurface anisotropy and the exponent k has a value of 0.5 for anassembly of aligned particles [33] and k ¼ 0.77 for randomlyoriented particles [34]. We have fitted HC(T) experimental data toEq. (6) using HC(0), A and k as parameters. Considering b ¼ 25 [27](b varies between 25 and 34). We have estimated effectivemagnetic anisotropy constant Keff for all specimens by using Eq.(7). Values of all the fitting parameters along with Keff have beenincluded in Table 3. Effective anisotropy (Keff) constant 0.17�105
erg/c.c. for 50 nm unmilled sample is consistent with the valuesreported for similar particles [27].
It is evident from Table 3 that the effective anisotropy constantincreases by almost two orders of magnitude as duration ofmilling is increased. This enhancement of the Keff value may beascribed to two reasons: (i) contribution from surface anisotropy(KS) due to deviation from perfect spherical shape of particles. (ii)Strong exchange bias interaction that prevails in the core/shell(Fe3O4/a-Fe2O3) structure induced during high-energy ballmilling of the Fe3O4 particles.
We have also estimated the blocking temperature TB using theArrhenius–Neel relation [27]
TB ¼ Keff V=bKB (8)
Fig. 8. Variation of HC with temperature for all specimens.
and substituting the value of Keff as shown in Table 3. The valuesare shown in the last column of this table. It is observed that theblocking temperature increases as the grinding duration isenhanced. However, the value for 6 h grinding operation showsa decrease. This could be due to error involved in extracting theKeff value from experimental data which show some scatter.
7. Conclusions
In summary, we have synthesized magnetic nanocompositeparticles with core–shell configuration by mechanical grinding ofFe3O4 powder. High-resolution transmission electron microscopyshows the formation of Fe3O4 core–a-Fe2O3 shell particles.Theparticles have diameters around 9 nm. Magnetic measurementscarried out over the temperature range 5–300 K shows exchangebias varying from �140 to 10 Oe. This is ascribed to ferromagne-tic–antiferromagnetic coupling at the interfaces between the twophases. Nanocomposite particles are found to obey Bloch’s law atleast up to a temperature 200 K. Large enhancement of effectiveanisotropy and exchange bias interaction at the core–shellinterface of the magnetic nanocomposites have been observed.This approach may bring about improvement in thermal stabilityof Fe3O4 nanoparticles for practical applications. The presentmethod of synthesis could be further tuned and by varyingvarious experimental parameters (e.g. composition of precursors,milling atmosphere, ball to powder mass ratio, etc.) a narrowdistribution of magnetic nanoparticles could be achieved. Thiswould be suitable for ultrahigh density recording media bybeating the superparamagnetic limit caused by the reduction ofthe anisotropy energy.
Acknowledgements
The research has been supported by the Department of Scienceand Technology (DST) Govt. of India, New Delhi under nanomission. P. Hajra thanks DST for a Junior Research Fellowshipunder Indo-Russian Research Programme. D. Chakravorty thanksthe Indian National Science Academy, New Delhi for the award ofHonorary Scientist position.
References
[1] R.H. Kodama, J. Magn. Magn. Mater. 200 (1999) 359;U. Hafeli, W. Schutt, J. Teller, M. Zbrowski (Eds.), Scientific and ClinicalApplications of Magnetic Materials, Plenum, New York, 1997.
[2] K. Liu, J. Nogue’s, C. Leighton, H. Masuda, K. Nishio, I.V. Roshchin, I.K. Schuller,Appl. Phys. Lett. 81 (2002) 4434;A.F. Berkowitz, K. Takono, J. Magn. Magn. Mater. 200 (1999) 552.
[3] C. Binek, X. He, S. Polisetty, Phys. Rev. B 72 (2005) 054408;J.A. De Toro, P. Andres, J.E. Gonzalez, P. Muniz, T. Munoz, P.S. Normile, J.M.Riveiro, Phys. Rev. B 73 (2006) 094449;W.C. Cain, M.H. Kryder, J. App. Phys. 67 (1990) 5722.
[4] S. Gangapadhya, G.C. Hadjipanayis, C.M. Sorensen, K.J. Klabunde, J. Appl. Phys.73 (1993) 6964.
[5] F.J. Darnell, J. Appl. Phys. 32 (suppl.) (1961) 186S.[6] C. Prados, M. Multigner, A. Hemando, J.C.S. Sanchez, A. Fernandez, C.F. Conde,
A. Conde, J. Appl. Phys 85 (1999) 6118.
ARTICLE IN PRESS
P. Hajra et al. / Journal of Magnetism and Magnetic Materials 321 (2009) 2269–2275 2275
[7] R.K. Zheng, G.H. Wen, K.K. Fung, X.X. Zheng, J. Appl. Phys. 95 (2004) 5244.[8] C.G. Granqvist, R.A. Buhrman, J. Appl. Phys. 47 (1976) 2200.[9] H. Zeng, J. Li, J.P. Liu, Z.L. Wang, S. Sun, Nature 420 (2002) 395;
S. Dutta, P. Brahma, M. Pal, D. Chakravorty, J. Appl. Phys. 100 (2006) 044302.[10] S. Dutta, S.K. Manik, M. Pal, S.K. Pradhan, P. Brahma, D. Chakravorty, J. Magn.
Magn. Mater. 288 (2005) 301.[11] R.A. Borzi, S.J. Stewart, G. Punte, R.C. Mercader, M. Vasquez-Mansilla, R.D.
Zysler, E.D. Cabanillas, J. Magn. Magn. Mater. 205 (1999) 234.[12] D.J. Dunlop, Phys. Earth Planet. Inter. 26 (1981) 1.[13] A.H. Morish, Canted Antiferromagneticsm: Hematite, World scientific,
Singapur, 1994.[14] J. Smith, H.P.J. Wijn Ferrites, Wiley, New York, 1959, chap. XIII p. 250.[15] V. Skumryev, S. Stoyanov, Y. Zhang, G. Hadjipanayis, D. Givord, J. Nogues,
Nature 423 (2003) 850.[16] A. Mumtaz, K. Maaz, B. Janjua, S.K. Hasanain, M.F. Bertino, J. Magn. Magn.
Mater. 313 (2007) 266.[17] L.D. Bianco, A. Hernando, M. Multigner, C. Prados, J.C. Sanchez-Lopez, A.
Fernandez, C.F. Conde, A. Conde, J. Appl. Phys. 2189 (1998) 84.[18] E.J.W. Verwey, Nature 144 (1939) 327.[19] R. Kubo, T. Nagamiya, Solid State Physics, McGraw-Hill, New York, 1968, p.
580.[20] S. Banerjee, S. Roy, J.W. Chen, D. Chakravorty, J. Magn. Magn. Mater. 219
(2000) 45.
[21] B.D. Cullity, in: Introduction to Magnetic Materials, Addison-Wesley, NewYork, 1972.
[22] A.T. Aldred, P.H. Froechle, Int. J. Magn. 2 (1972) 195.[23] A.T. Aldred, Phys. Rev. B 11 (1975) 2597.[24] J.F. Dillon, Landdolt-Bornstein New Series GrIII, 2(9), Spinger, Berlin, 1962 Ch.
29 p. 50.[25] P.V. Herdriksen, S. Linderoth, P.A. Lindgard, J. Phys.: Condens. Matter 5 (1992)
5675;P.V. Herdriksen, S. Linderoth, P.A. Lindgard, Phys. Rev. B 58 (1993) 14167.
[26] G. Xiao, C.L. Chien, J. Appl. Phys. 61 (1987) 3308.[27] B. Martinez, A. Roig, X. Obradors, E. Molins, A. Rouanet, C. Monty, J. Appl. Phys.
79 (1996) 2580.[28] G.F. Goya, T.S. Berquo, F.C. Fonseca, M.P. Morales, J. Appl. Phys. 94 (2003)
3520.[29] C. Kittel, Introduction to Solid State Physics, Wiley, New York, 1986, p. 434.[30] L.F. Gamarra, G.E.S. Brito, W.M. Pontuschka, E. Amaro, A.H.C. Parma, G.F. Goya,
J. Magn. Magn. Mater. 289 (2005) 439;M. Blanco-Mantecon, K. O’Gardes, J. Magn. Magn. Mater. 296 (2006) 124.
[31] J. Sort, J. Nogues, X. Amils, S. Surinach, J.S. Munoz, M.D. Baro, Appl. Phys. Lett.75 (1999) 3177.
[32] F. BØdker, S. Mørup, S. Linderoth, Phys. Rev. Lett. 72 (1994) 282.[33] C.P. Beans, Livingston J. Appl. Phys. 30 (1959) 120S.[34] H. Pfeiffer, W. SchUppel, Phys. Status Solidi A 119 (1990) 259.