examples of discrete probability distributions: the binomial and poisson distributions
TRANSCRIPT
Examples of discrete probability distributions:
The binomial and Poisson distributions
Binomial Probability Distribution
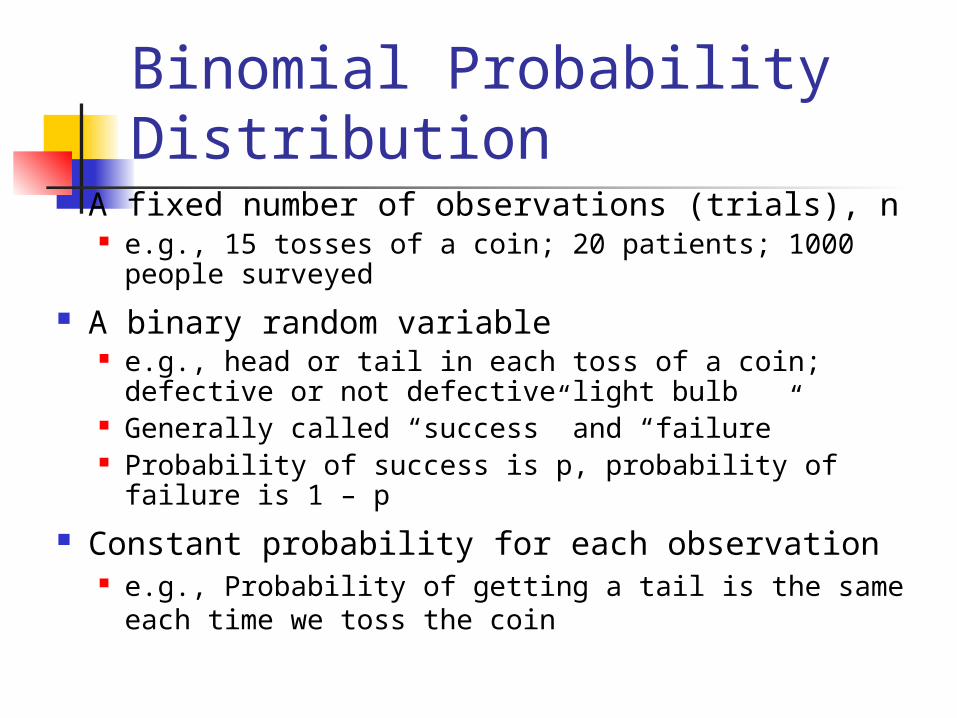
A fixed number of observations (trials), n e.g., 15 tosses of a coin; 20 patients; 1000 people
surveyed
A binary random variable e.g., head or tail in each toss of a coin; defective or
not defective light bulb Generally called “success” and “failure” Probability of success is p, probability of failure is 1 –
p
Constant probability for each observation e.g., Probability of getting a tail is the same each
time we toss the coin
Binomial example
Take the example of 5 coin tosses. What’s the probability that you flip exactly 3 heads in 5 coin tosses?
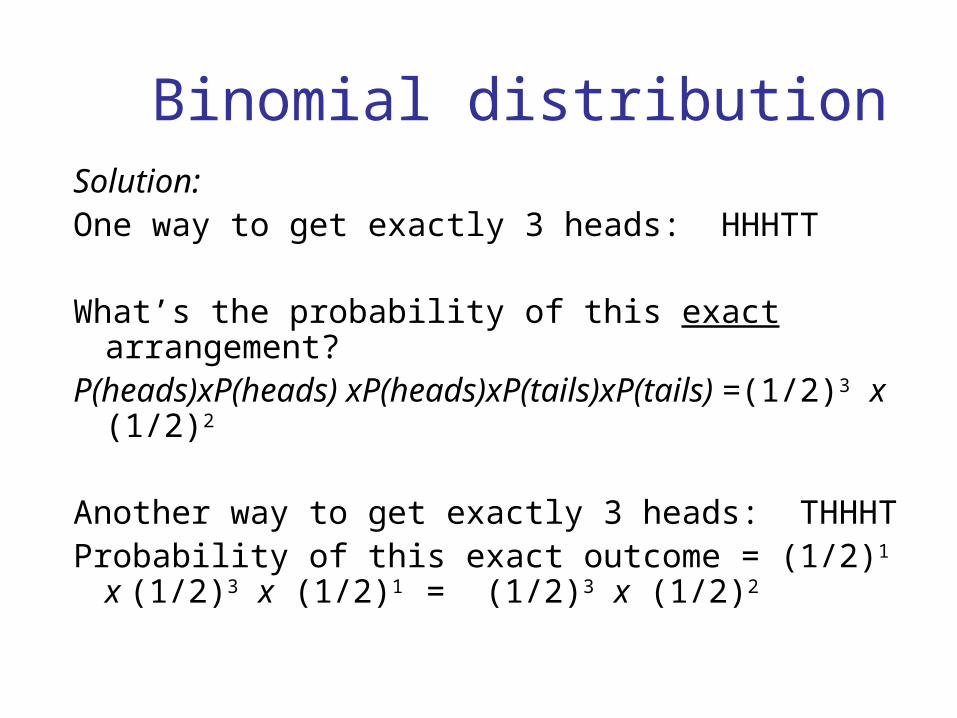
Binomial distributionSolution:One way to get exactly 3 heads: HHHTT
What’s the probability of this exact arrangement?
P(heads)xP(heads) xP(heads)xP(tails)xP(tails) =(1/2)3 x (1/2)2
Another way to get exactly 3 heads: THHHTProbability of this exact outcome = (1/2)1 x
(1/2)3 x (1/2)1 = (1/2)3 x (1/2)2
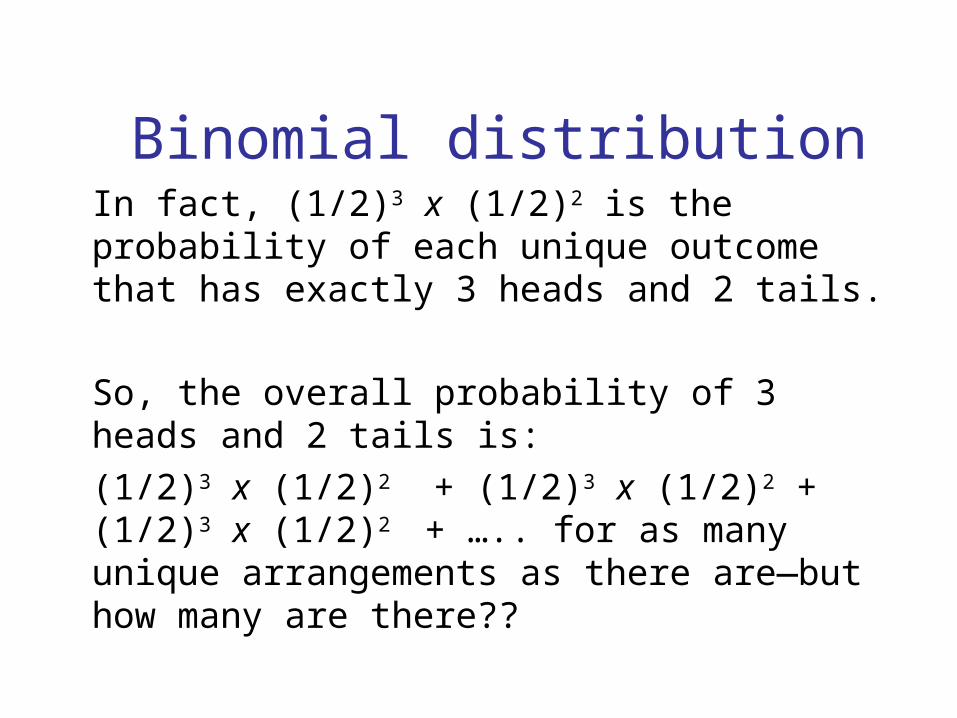
Binomial distributionIn fact, (1/2)3 x (1/2)2 is the probability of each unique outcome that has exactly 3 heads and 2 tails.
So, the overall probability of 3 heads and 2 tails is:(1/2)3 x (1/2)2 + (1/2)3 x (1/2)2 + (1/2)3 x (1/2)2 + ….. for as many unique arrangements as there are—but how many are there??
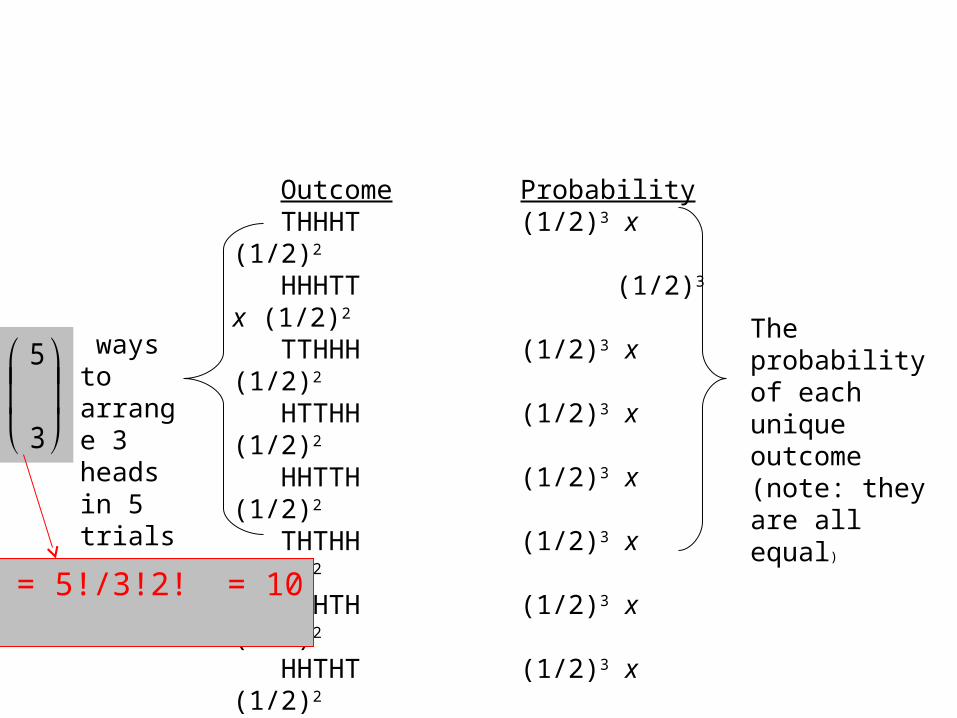
Outcome Probability THHHT (1/2)3 x (1/2)2
HHHTT (1/2)3 x (1/2)2
TTHHH (1/2)3 x (1/2)2
HTTHH (1/2)3 x (1/2)2
HHTTH (1/2)3 x (1/2)2
THTHH (1/2)3 x (1/2)2
HTHTH (1/2)3 x (1/2)2
HHTHT (1/2)3 x (1/2)2
THHTH (1/2)3 x (1/2)2
HTHHT (1/2)3 x (1/2)2
10 arrangements x (1/2)3 x (1/2)2
The probability of each unique outcome (note: they are all equal)
ways to arrange 3 heads in 5 trials
5
3
5C3 = 5!/3!2! = 10
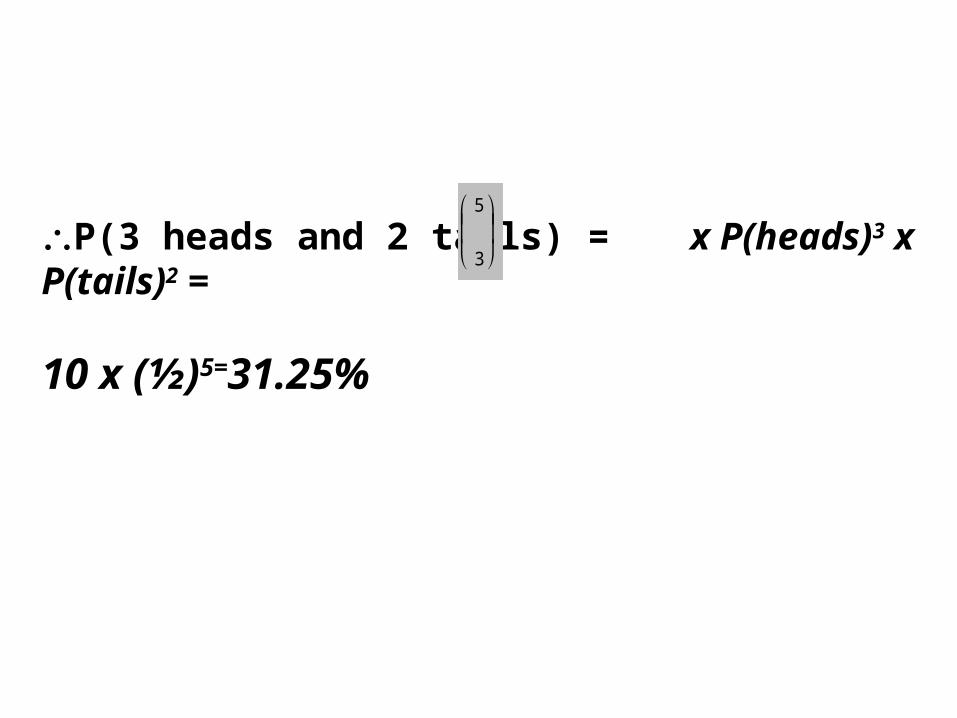
P(3 heads and 2 tails) = x P(heads)3 x P(tails)2 =
10 x (½)5=31.25%
5
3
x
p(x)
0 3 4 51 2
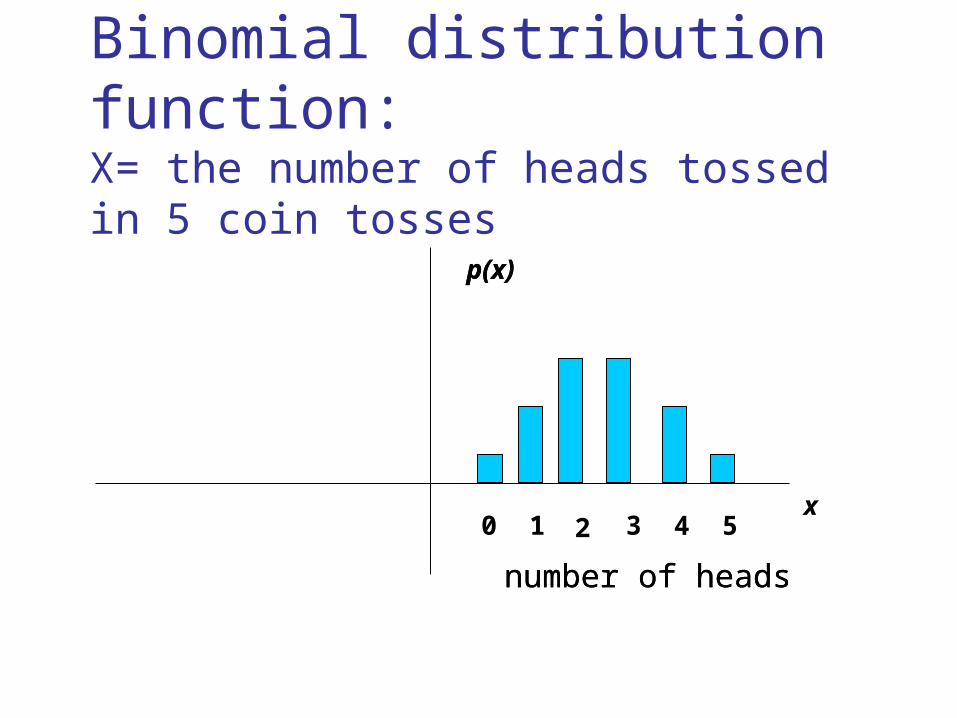
Binomial distribution function:X= the number of heads tossed in 5 coin tosses
number of heads
p(x)
number of heads
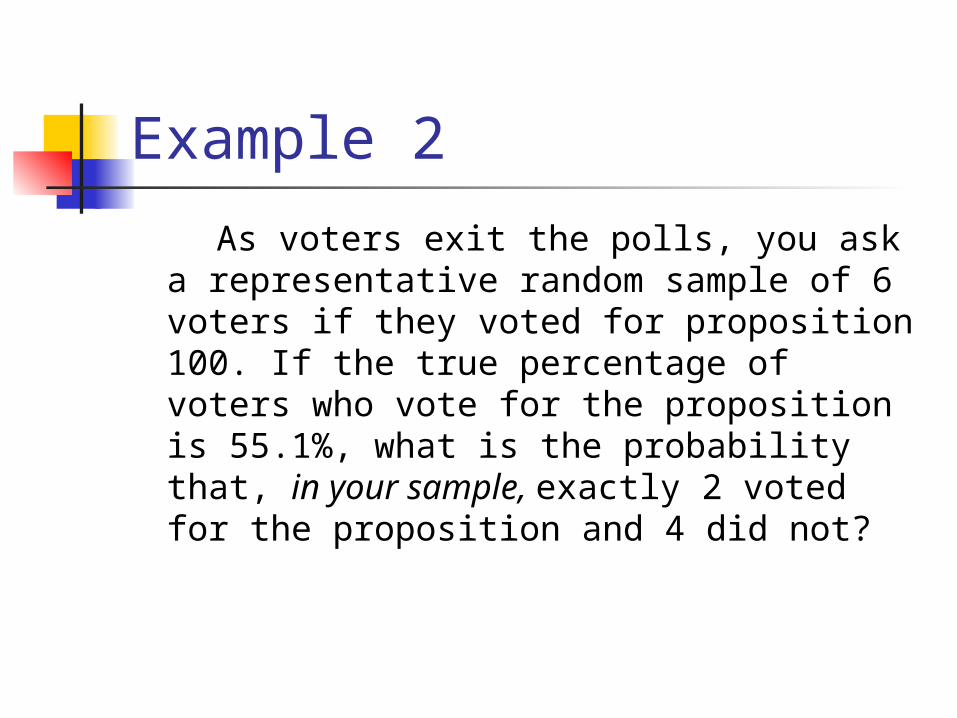
Example 2
As voters exit the polls, you ask a representative random sample of 6 voters if they voted for proposition 100. If the true percentage of voters who vote for the proposition is 55.1%, what is the probability that, in your sample, exactly 2 voted for the proposition and 4 did not?
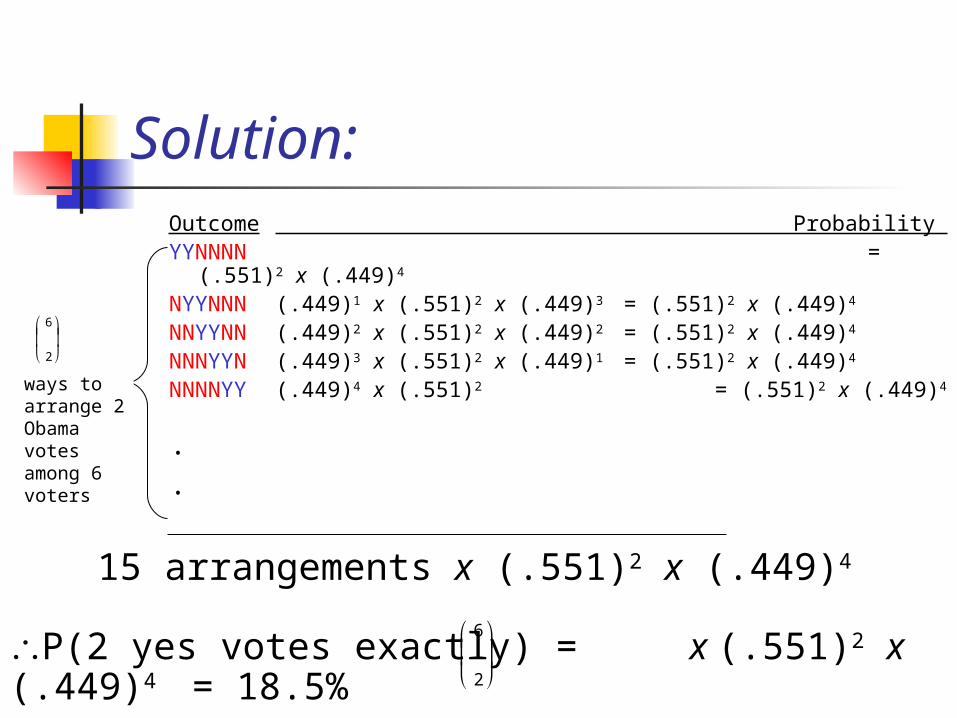
Solution:Outcome Probability YYNNNN = (.551)2 x (.449)4
NYYNNN (.449)1 x (.551)2 x (.449)3 = (.551)2 x (.449)4
NNYYNN (.449)2 x (.551)2 x (.449)2 = (.551)2 x (.449)4
NNNYYN (.449)3 x (.551)2 x (.449)1 = (.551)2 x (.449)4
NNNNYY (.449)4 x (.551)2 = (.551)2 x (.449)4
.
.
ways to arrange 2 Obama votes among 6 voters
6
2
15 arrangements x (.551)2 x (.449)4
6
2
P(2 yes votes exactly) = x (.551)2 x (.449)4 = 18.5%
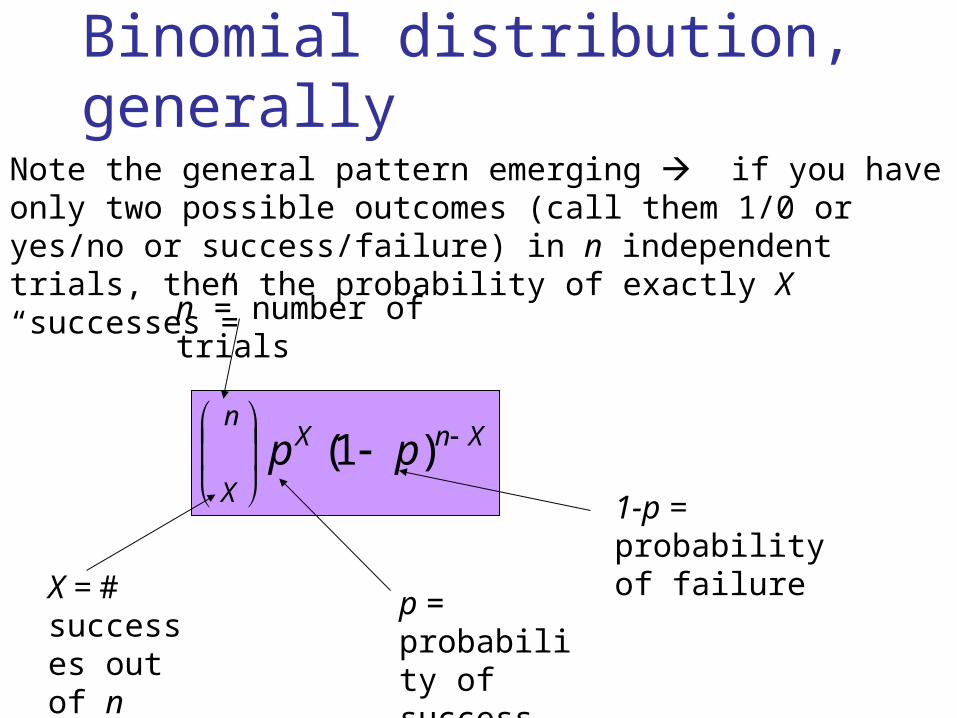
Binomial distribution, generally
XnXn
Xpp
)1(1-p = probability of failure
p = probability of success
X = # successes out of n trials
n = number of trials
Note the general pattern emerging if you have only two possible outcomes (call them 1/0 or yes/no or success/failure) in n independent trials, then the probability of exactly X “successes”=
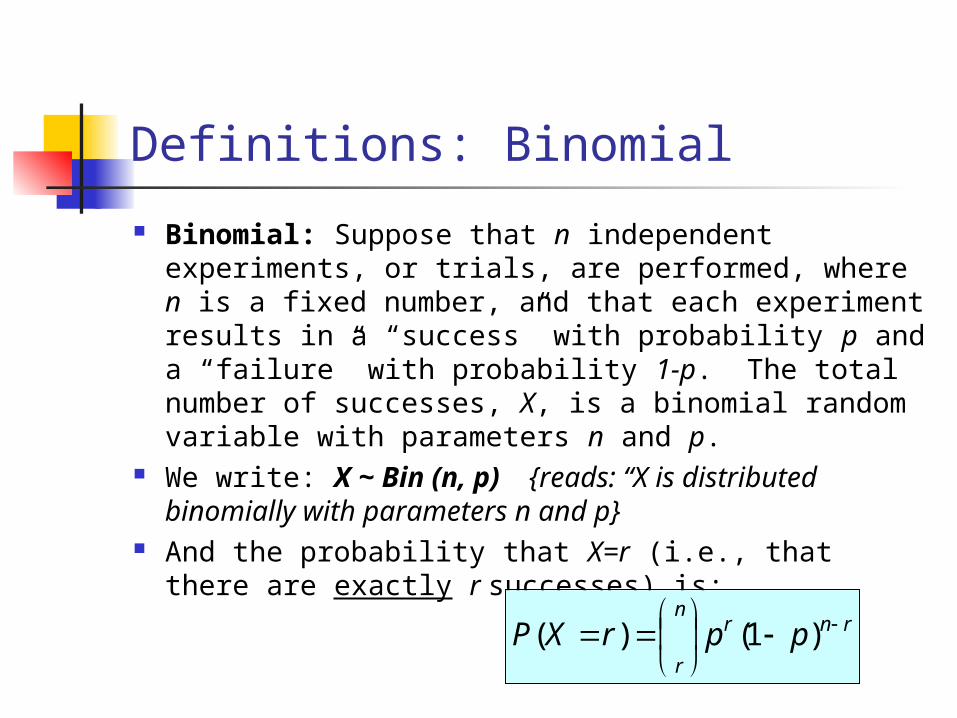
Definitions: Binomial
Binomial: Suppose that n independent experiments, or trials, are performed, where n is a fixed number, and that each experiment results in a “success” with probability p and a “failure” with probability 1-p. The total number of successes, X, is a binomial random variable with parameters n and p.
We write: X ~ Bin (n, p) {reads: “X is distributed binomially with parameters n and p}
And the probability that X=r (i.e., that there are exactly r successes) is: rnr
n
rpprXP
)1()(
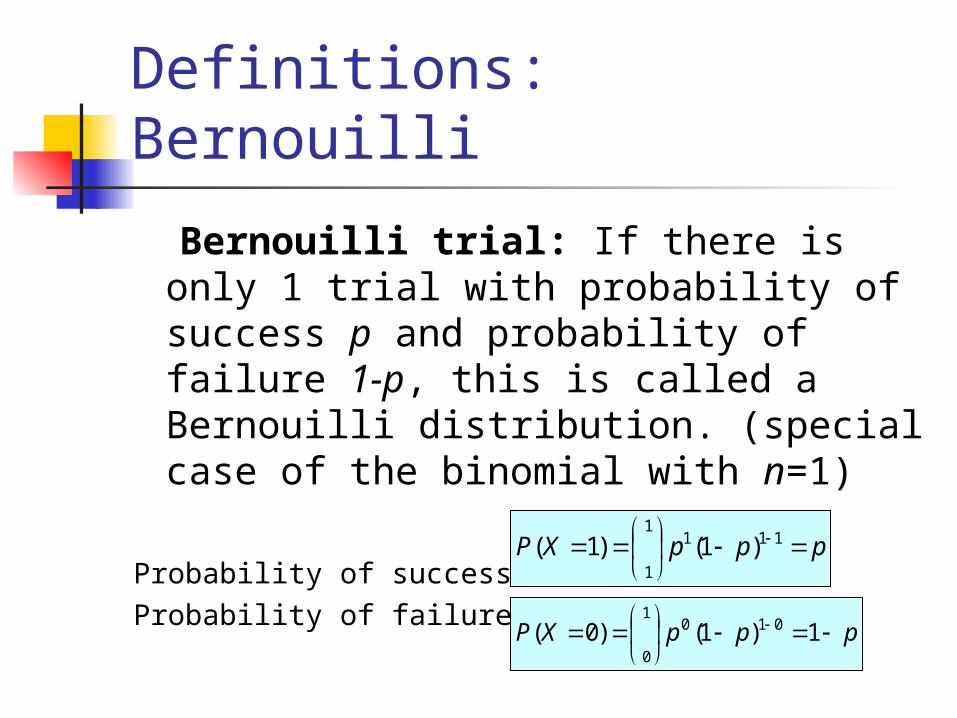
Definitions: Bernouilli
Bernouilli trial: If there is only 1 trial with probability of success p and probability of failure 1-p, this is called a Bernouilli distribution. (special case of the binomial with n=1)
Probability of success:Probability of failure:
pppXP
111
1
1)1()1(
pppXP
1)1()0( 010
1
0
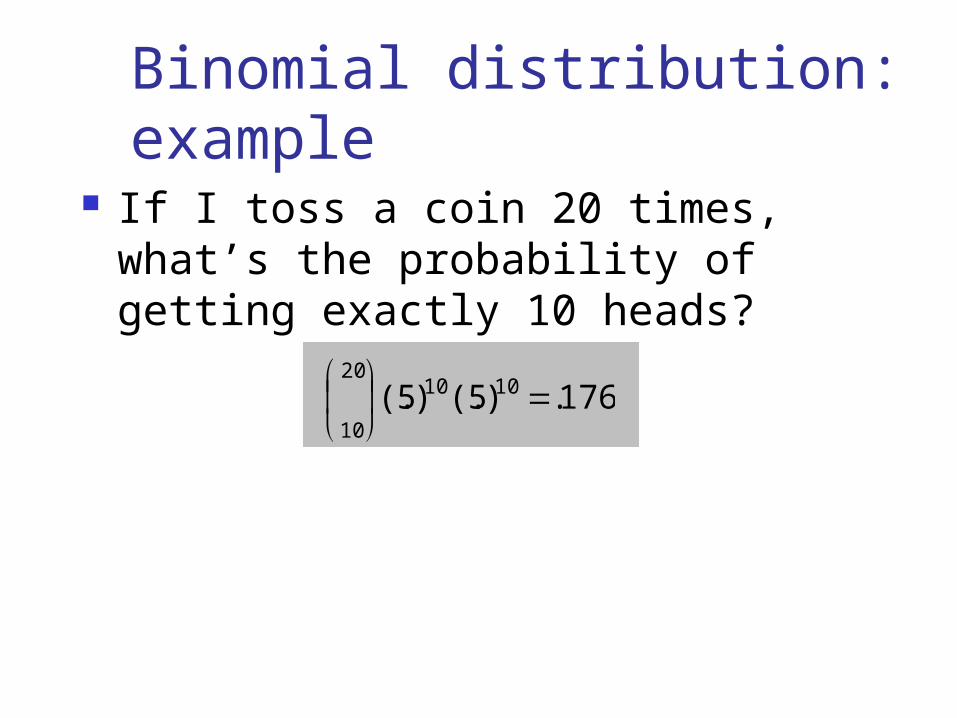
Binomial distribution: example
If I toss a coin 20 times, what’s the probability of getting exactly 10 heads?
176.)5(.)5(. 101020
10
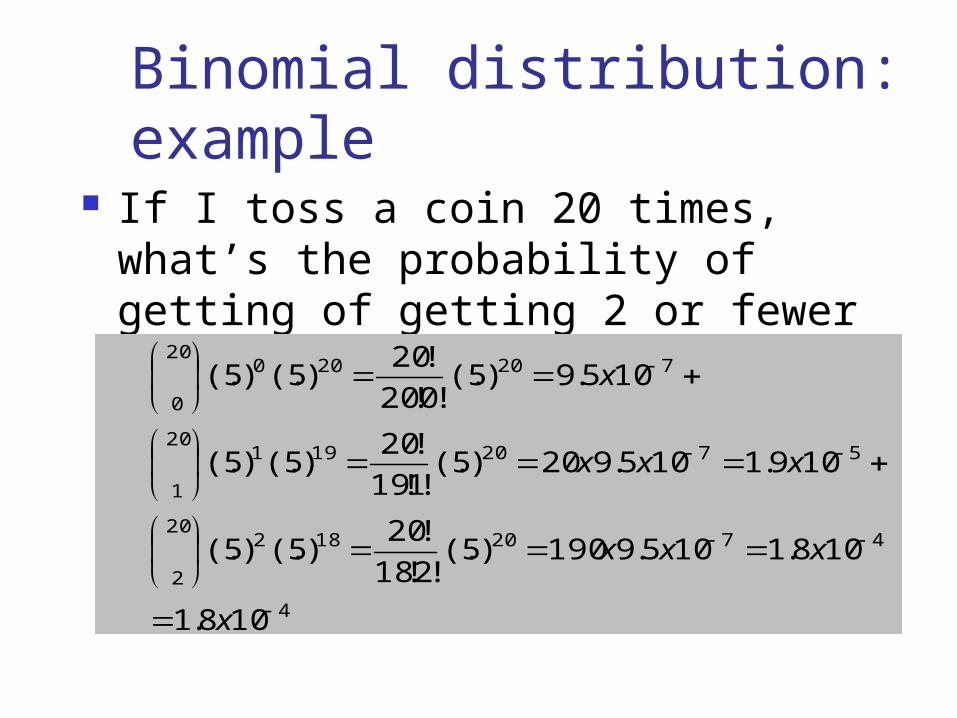
Binomial distribution: example
If I toss a coin 20 times, what’s the probability of getting of getting 2 or fewer heads?
4
472018220
2
572019120
1
72020020
0
108.1
108.1105.9190)5(.!2!18
!20)5(.)5(.
109.1105.920)5(.!1!19
!20)5(.)5(.
105.9)5(.!0!20
!20)5(.)5(.
x
xxx
xxx
x
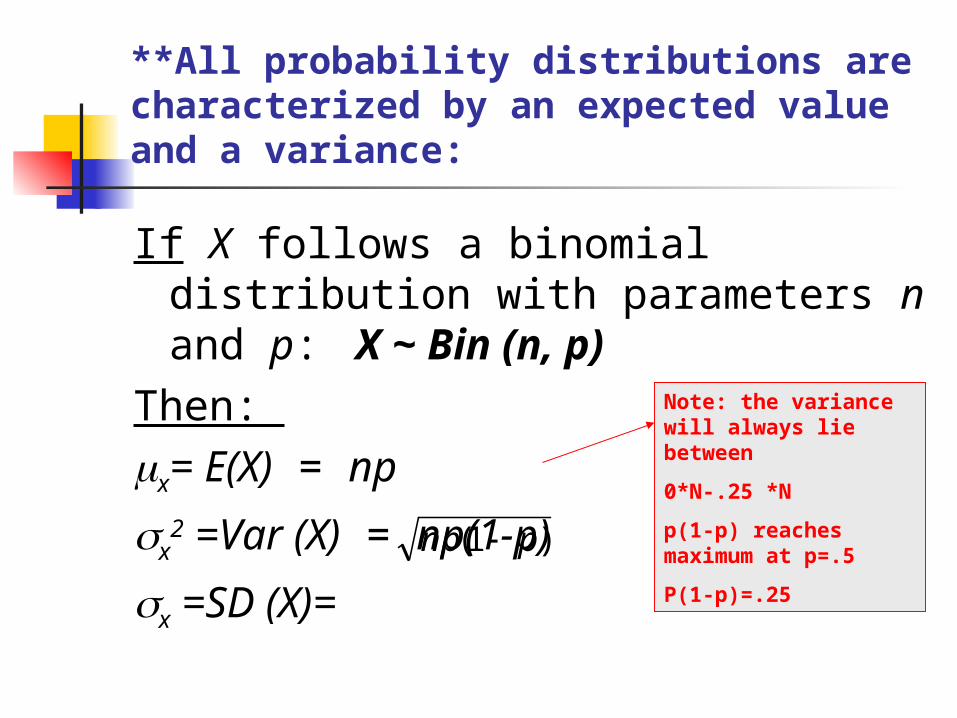
**All probability distributions are characterized by an expected value and a variance:
If X follows a binomial distribution with parameters n and p: X ~ Bin (n, p)
Then: x= E(X) = np
x2 =Var (X) = np(1-p)
x =SD (X)=
)1( pnp
Note: the variance will always lie between
0*N-.25 *N
p(1-p) reaches maximum at p=.5
P(1-p)=.25
Characteristics of Bernouilli distribution
For Bernouilli (n=1)E(X) = pVar (X) = p(1-p)
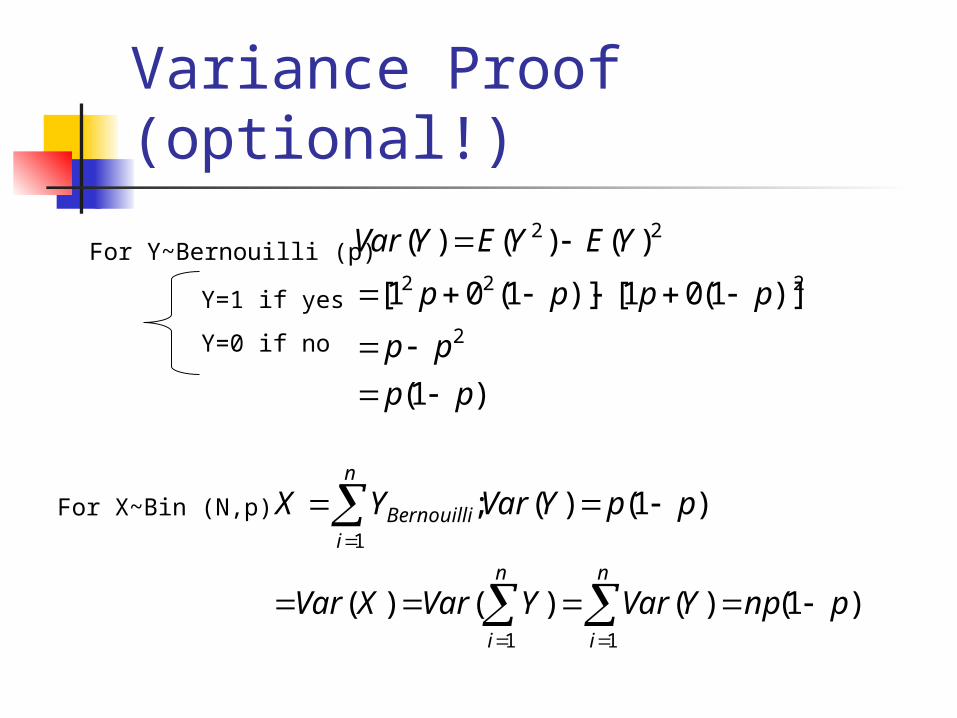
Variance Proof (optional!)
)1(
)]1(01[)]1(01[
)()()(
2
222
22
pp
pp
pppp
YEYEYVar
For Y~Bernouilli (p)
Y=1 if yes
Y=0 if no
For X~Bin (N,p)
n
i
n
i
n
iBernouilli
pnpYVarYVarXVar
ppYVarYX
11
1
)1()()()(
)1()(;
Recall coin toss example
X= number of heads in 100 tosses of a coin
X ~ Bin (100, .5) E(x) = 100*.5=50 Var(X) = 100*.5*.5 = 25 SD(X) = 5
Things that follow a binomial distribution…
Cohort study (or cross-sectional): The number of exposed individuals in your
sample that develop the disease The number of unexposed individuals in your
sample that develop the disease
Case-control study: The number of cases that have had the
exposure The number of controls that have had the
exposure
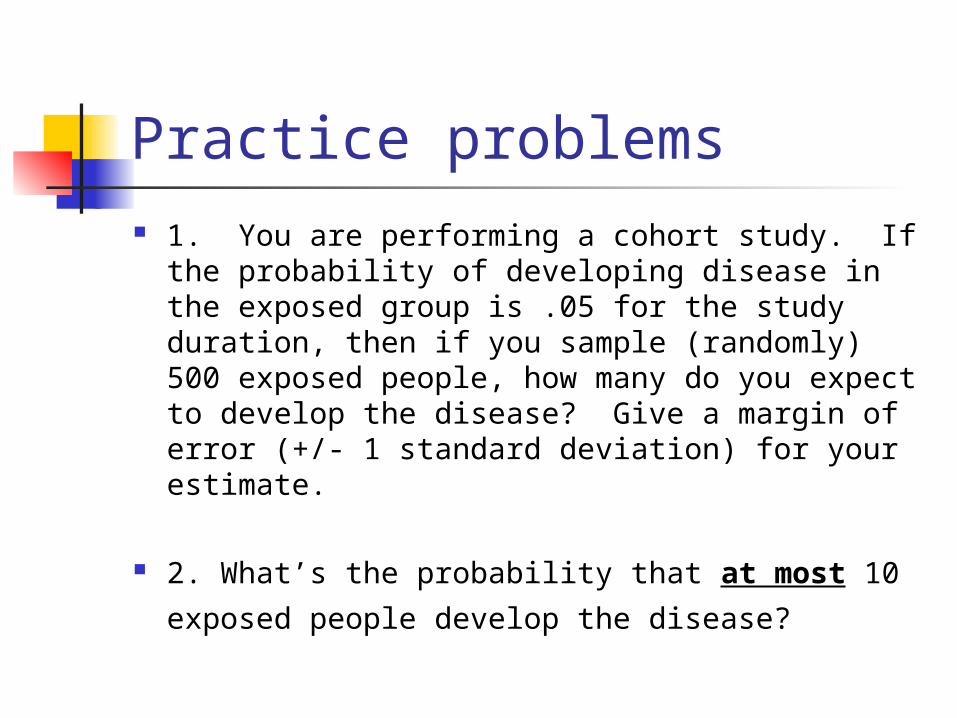
Practice problems 1. You are performing a cohort study. If the
probability of developing disease in the exposed group is .05 for the study duration, then if you sample (randomly) 500 exposed people, how many do you expect to develop the disease? Give a margin of error (+/- 1 standard deviation) for your estimate.
2. What’s the probability that at most 10
exposed people develop the disease?
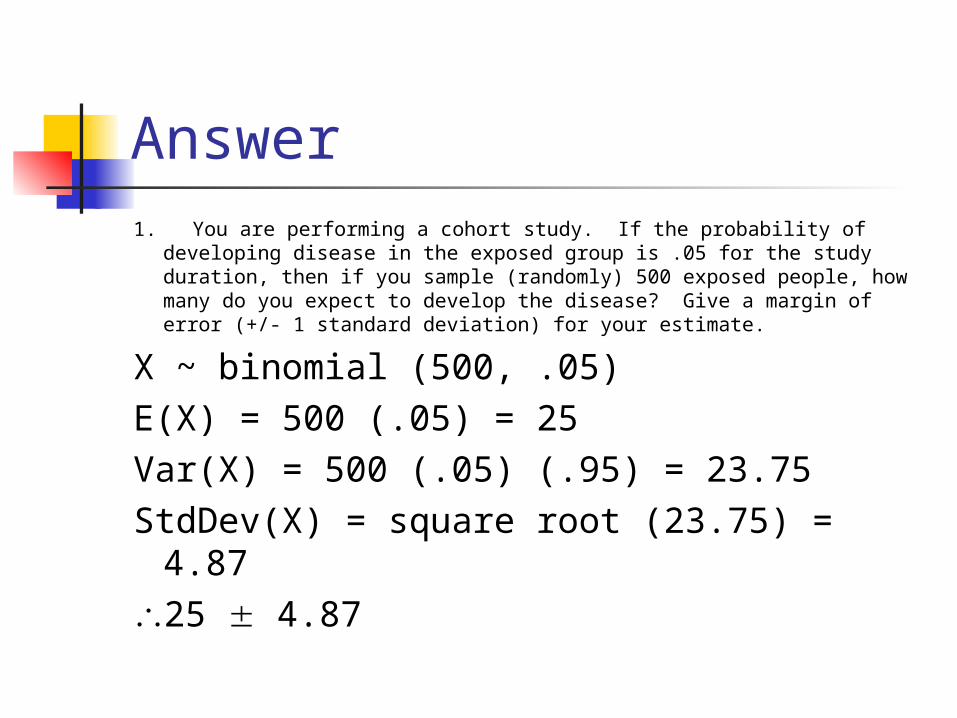
Answer1. You are performing a cohort study. If the probability of
developing disease in the exposed group is .05 for the study duration, then if you sample (randomly) 500 exposed people, how many do you expect to develop the disease? Give a margin of error (+/- 1 standard deviation) for your estimate.
X ~ binomial (500, .05)
E(X) = 500 (.05) = 25
Var(X) = 500 (.05) (.95) = 23.75
StdDev(X) = square root (23.75) = 4.87
25 4.87
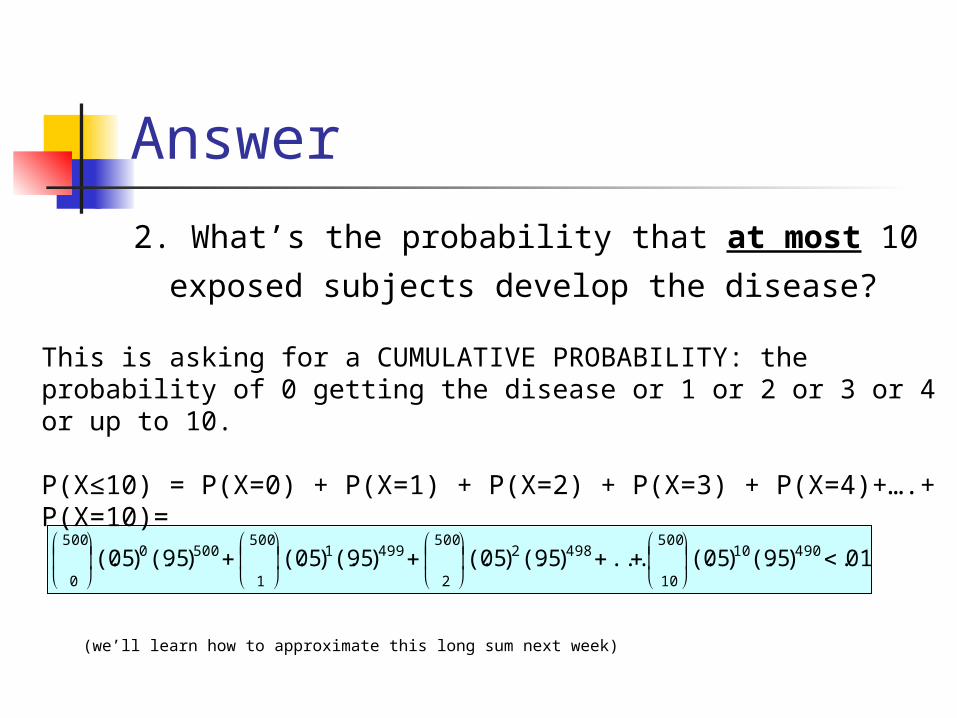
Answer
2. What’s the probability that at most 10
exposed subjects develop the disease?
01.)95(.)05(....)95(.)05(.)95(.)05(.)95(.)05(. 49010500
10
4982500
2
4991500
1
5000500
0
This is asking for a CUMULATIVE PROBABILITY: the probability of 0 getting the disease or 1 or 2 or 3 or 4 or up to 10. P(X≤10) = P(X=0) + P(X=1) + P(X=2) + P(X=3) + P(X=4)+….+ P(X=10)=
(we’ll learn how to approximate this long sum next week)

You’ll rarely calculate the binomial by hand. However, it is good to know how to …
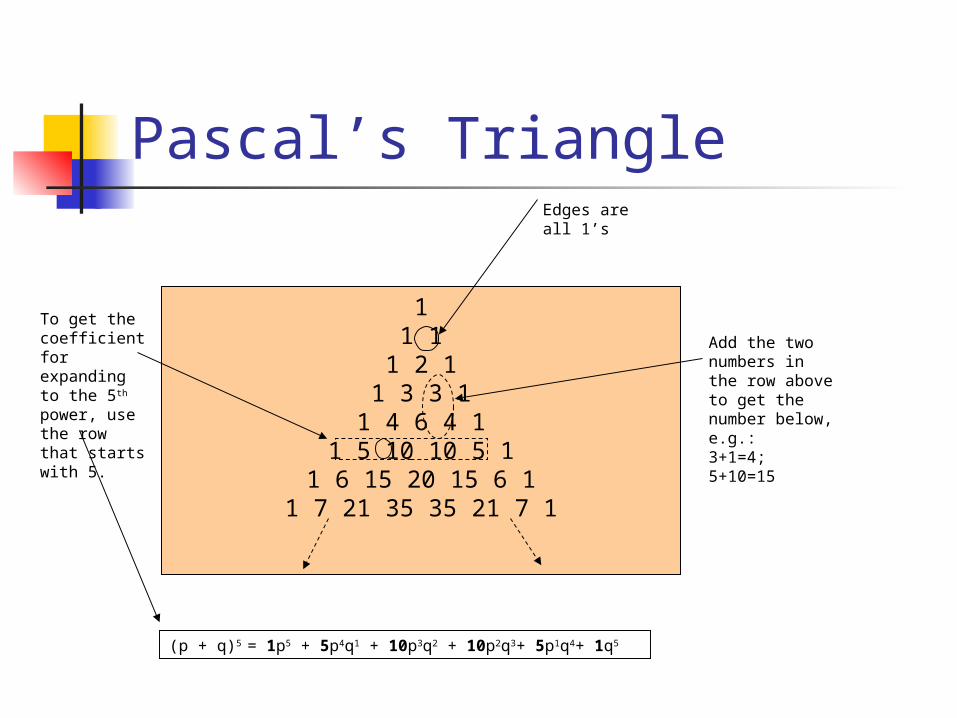
Pascal’s Triangle Trick for calculating binomial coefficients
Recall from math in your past that Pascal’s Triangle is used to get the coefficients for binomial expansion…For example, to expand: (p + q)5
The powers follow a set pattern: p5 + p4q1 + p3q2 + p2q3+ p1q4+ q5
But what are the coefficients? Use Pascal’s Magic Triangle…
A brief distraction: Pascal’s Triangle Trick
Pascal’s Triangle
11 1
1 2 11 3 3 1
1 4 6 4 11 5 10 10 5 1
1 6 15 20 15 6 11 7 21 35 35 21 7 1
Edges are all 1’s
Add the two numbers in the row above to get the number below, e.g.:3+1=4; 5+10=15
To get the coefficient for expanding to the 5th power, use the row that starts with 5.
(p + q)5 = 1p5 + 5p4q1 + 10p3q2 + 10p2q3+ 5p1q4+ 1q5
505
0)5(.)5(.
415
1)5(.)5(.
325
2)5(.)5(.
235
3)5(.)5(.
145
4)5(.)5(.
055
5)5(.)5(.
X P(X)
0
1
2
3
4
5
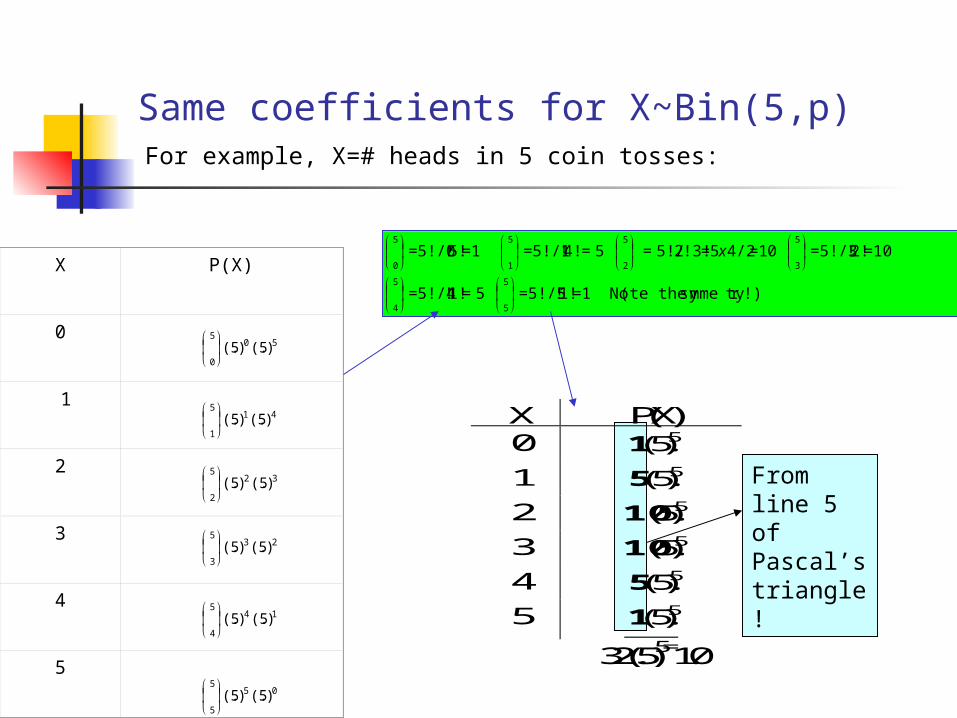
Same coefficients for X~Bin(5,p)
X P(X) 0 5)5(.1 1 5)5(.5 2 5)5(.10 3 5)5(.10 4 5)5(.5 5 5)5(.1
32(.5)5=1.0
5
0=5!/0!5!=1
5
1=5!/1!4! = 5
5
2 = 5!/2!3!=5x4/2=10
5
3=5!/3!2!=10
5
4=5!/4!1!= 5
5
5=5!/5!1!=1 (Note the symmetry!)
For example, X=# heads in 5 coin tosses:
From line 5 of Pascal’s triangle!
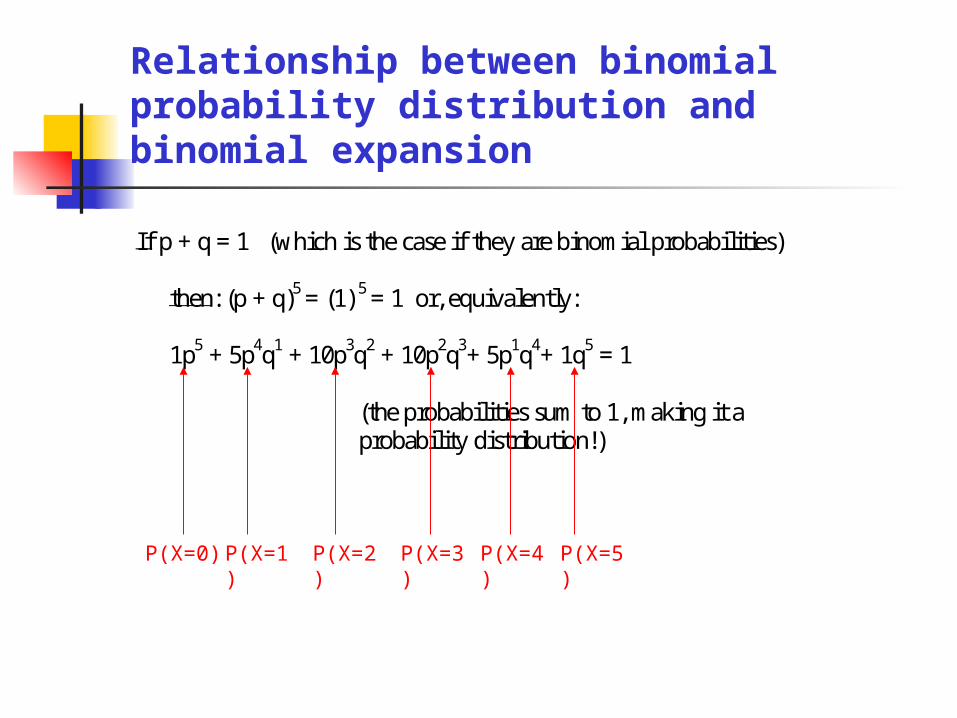
Relationship between binomial probability distribution and binomial expansion
If p + q = 1 (which is the case if they are binomial probabilities)
then: (p + q)5 = (1) 5 = 1 or, equivalently: 1p5 + 5p4q1 + 10p3q2 + 10p2q3+ 5p1q4+ 1q5 = 1
(the probabilities sum to 1, making it a probability distribution!)
P(X=0) P(X=1)
P(X=2)
P(X=3)
P(X=4)
P(X=5)
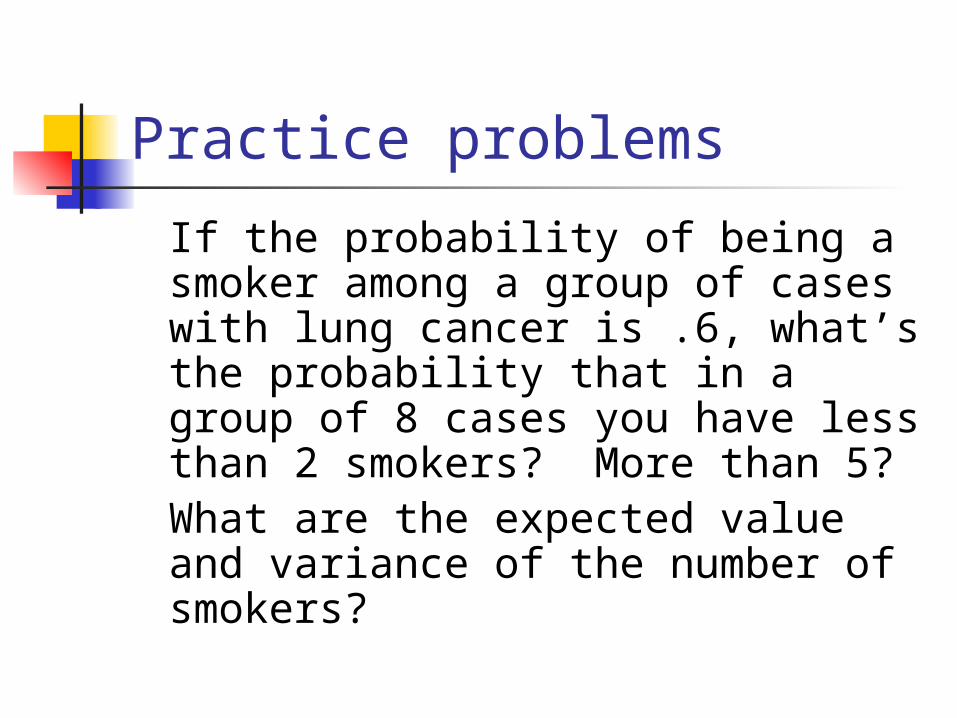
Practice problems
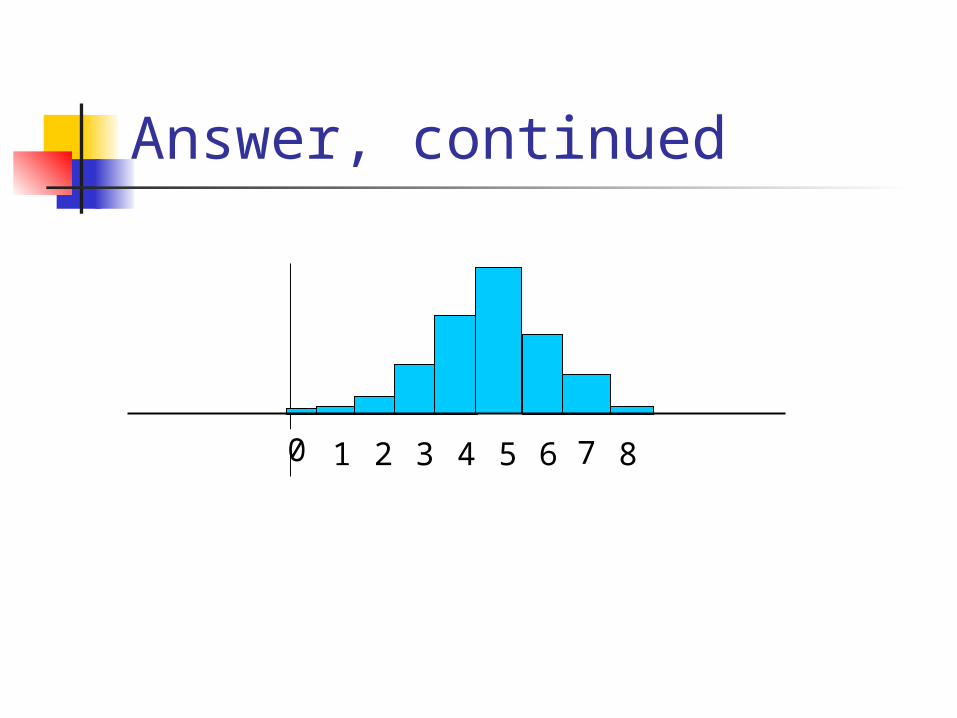
If the probability of being a smoker among a group of cases with lung cancer is .6, what’s the probability that in a group of 8 cases you have less than 2 smokers? More than 5?What are the expected value and variance of the number of smokers?
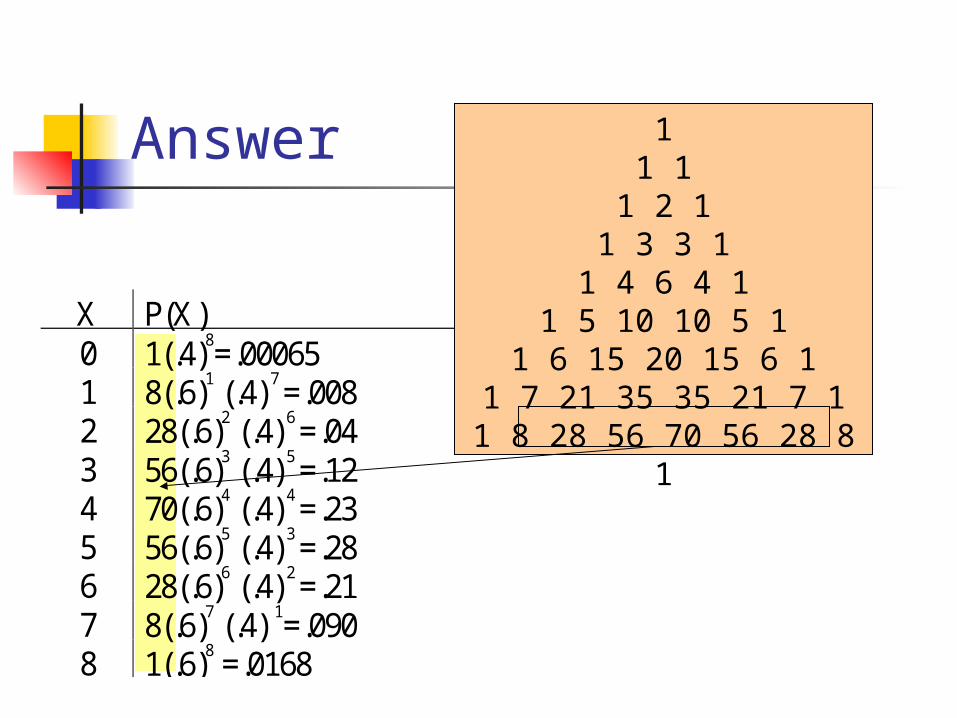
Answer
X P(X) 0 1(.4)8=.00065 1 8(.6)1 (.4) 7 =.008 2 28(.6)2 (.4) 6 =.04 3 56(.6)3 (.4) 5 =.12 4 70(.6)4 (.4) 4 =.23 5 56(.6)5 (.4) 3 =.28 6 28(.6)6 (.4) 2 =.21 7 8(.6)7 (.4) 1=.090 8 1(.6)8 =.0168
11 1
1 2 11 3 3 1
1 4 6 4 11 5 10 10 5 1
1 6 15 20 15 6 11 7 21 35 35 21 7 1
1 8 28 56 70 56 28 8 1
Answer, continued
1 4 52 3 6 7 80
Answer, continued
1 4 52 3 6 7 80
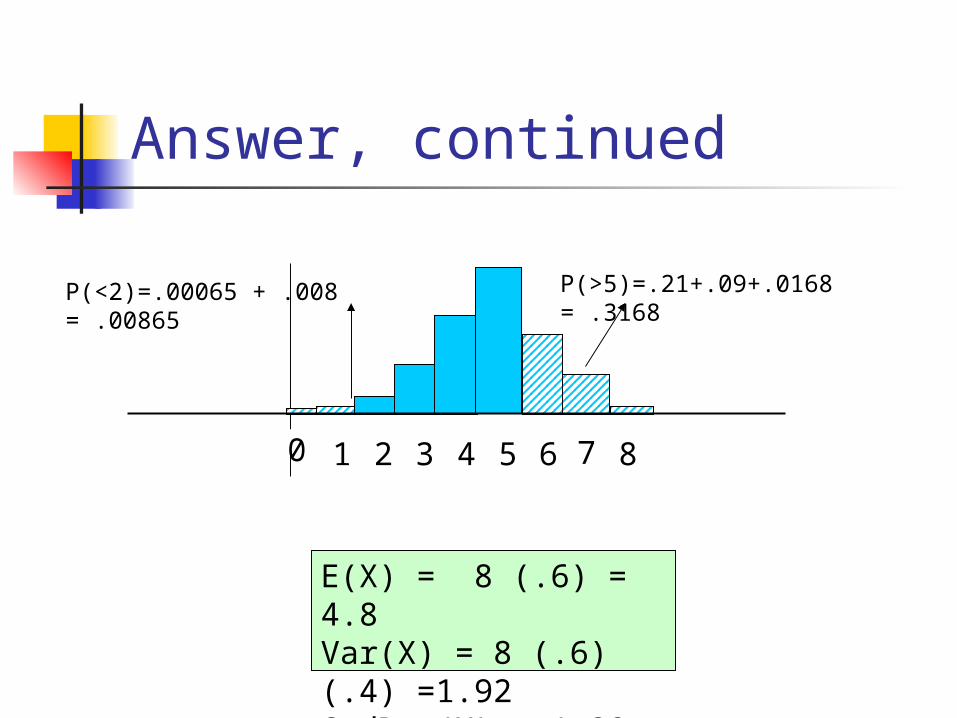
E(X) = 8 (.6) = 4.8Var(X) = 8 (.6) (.4) =1.92StdDev(X) = 1.38
P(<2)=.00065 + .008 = .00865 P(>5)=.21+.09+.0168 = .3168
Practice problem
If Stanford tickets in the medical center ‘A’ lot approximately twice a week (2/5 weekdays), if you want to park in the ‘A’ lot twice a week for the year, are you financially better off buying a parking sticker (which costs $726 for the year) or parking illegally (tickets are $35 each)?
Answer If Stanford tickets in the medical center ‘A’ lot approximately
twice a week (2/5 weekdays), if you want to park in the ‘A’ lot twice a week for the year, are you financially better off buying a parking sticker (which costs $726 for the year) or parking illegally (tickets are $35 each)?
Use BinomialLet X be a random variable that is the number of tickets you
receive in a year.Assuming 2 weeks vacation, there are 50x2 days (twice a week
for 50 weeks) you’ll be parking illegally. p=.40 is the chance of receiving a ticket on a given day:
X~bin (100, .40)E(X) = 100x.40 = 40 tickets expected (with std dev of about 5)40 x $35 = $1400 in tickets (+/- $200); better to buy the sticker!
Multinomial distribution (beyond the scope of this course)
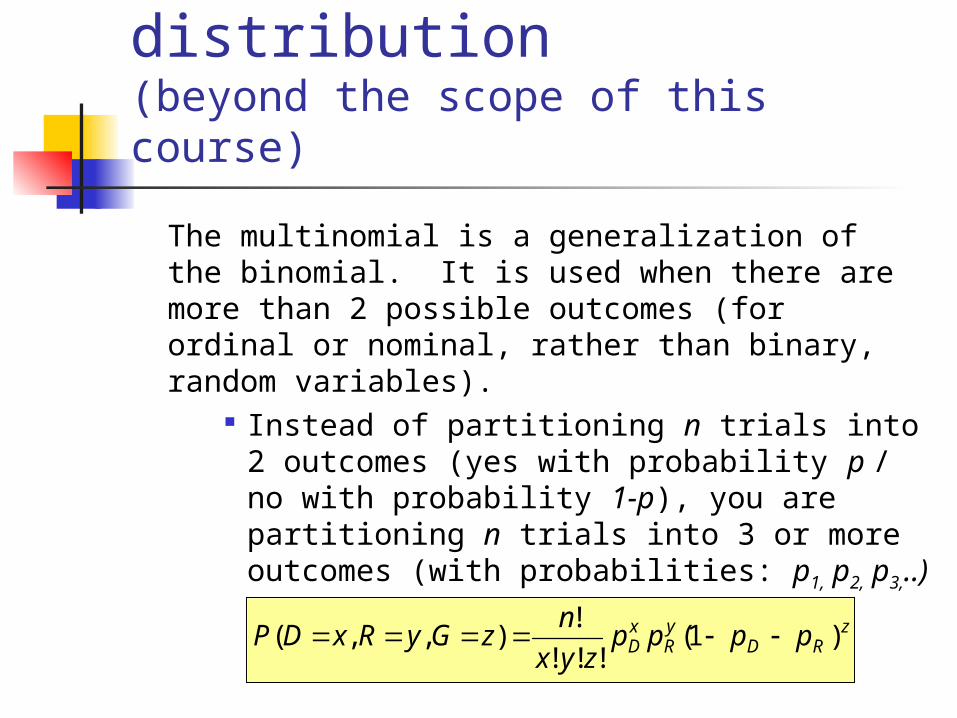
The multinomial is a generalization of the binomial. It is used when there are more than 2 possible outcomes (for ordinal or nominal, rather than binary, random variables).
Instead of partitioning n trials into 2 outcomes (yes with probability p / no with probability 1-p), you are partitioning n trials into 3 or more outcomes (with probabilities: p1, p2, p3,..)
General formula for 3 outcomes: z
RDyR
xD pppp
zyx
nzGyRxDP )1(
!!!
!),,(
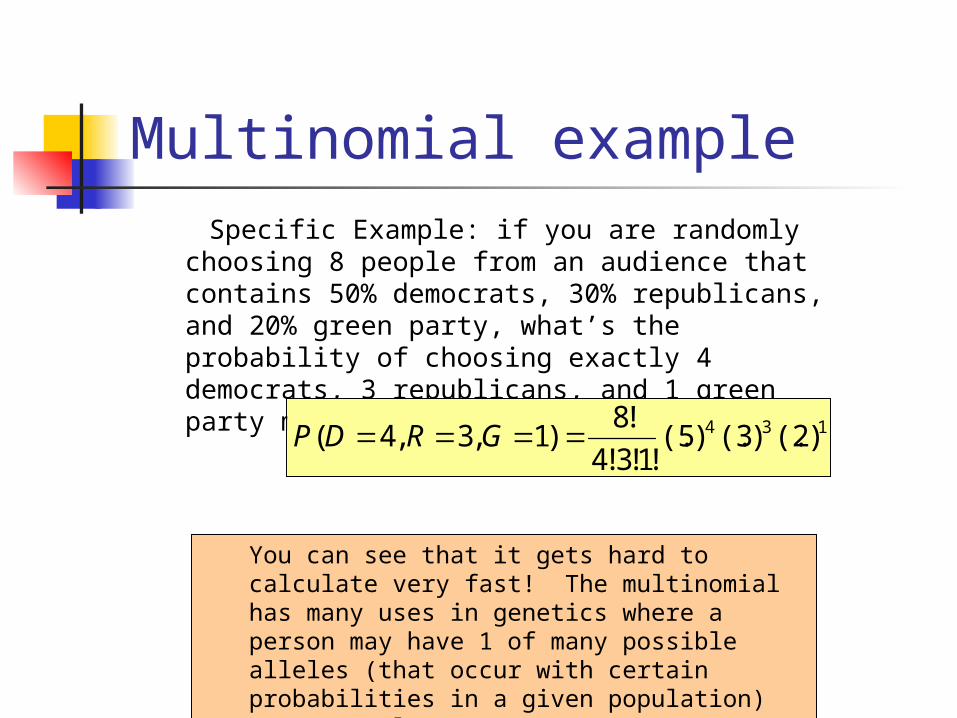
Multinomial example Specific Example: if you are randomly choosing 8
people from an audience that contains 50% democrats, 30% republicans, and 20% green party, what’s the probability of choosing exactly 4 democrats, 3 republicans, and 1 green party member?
134 )2(.)3(.)5(.!1 !3 !4
!8)1,3,4( GRDP
You can see that it gets hard to calculate very fast! The multinomial has many uses in genetics where a person may have 1 of many possible alleles (that occur with certain probabilities in a given population) at a gene locus.
Introduction to the Poisson Distribution
Poisson distribution is for counts—if events happen at a constant rate over time, the Poisson distribution gives the probability of X number of events occurring in time T.
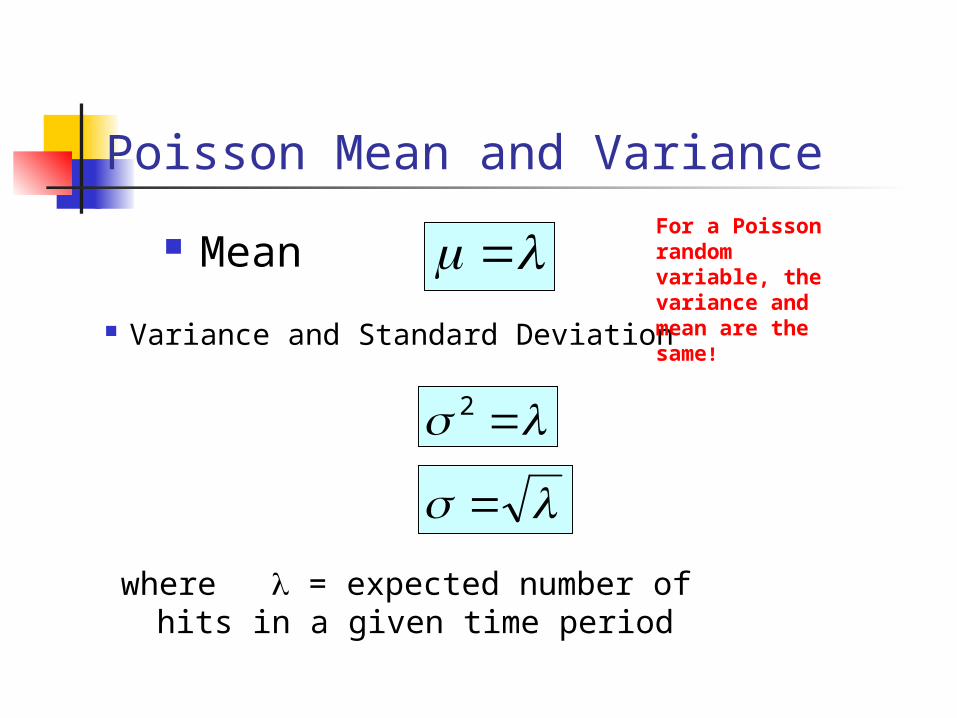
Poisson Mean and Variance
Mean
Variance and Standard Deviation
2
where = expected number of hits in a given time period
For a Poisson random variable, the variance and mean are the same!
Poisson Distribution, example
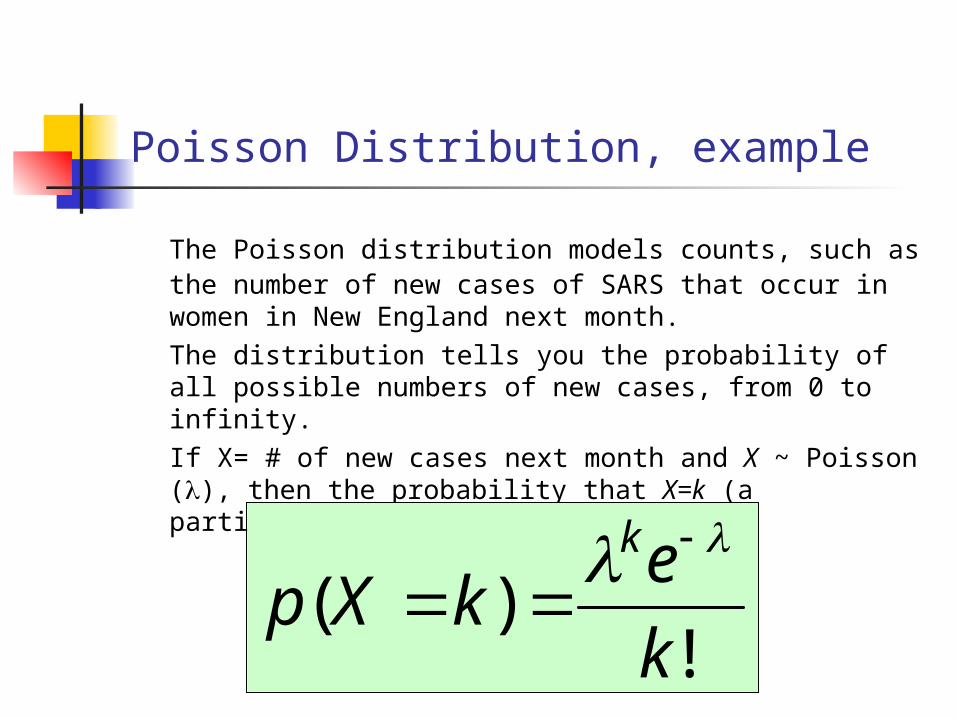
The Poisson distribution models counts, such as the number of new cases of SARS that occur in women in New England next month.
The distribution tells you the probability of all possible numbers of new cases, from 0 to infinity.
If X= # of new cases next month and X ~ Poisson (), then the probability that X=k (a particular count) is:
!)(
k
ekXp
k
Example
For example, if new cases of West Nile Virus in New England are occurring at a rate of about 2 per month, then these are the probabilities that: 0,1, 2, 3, 4, 5, 6, to 1000 to 1 million to… cases will occur in New England in the next month:
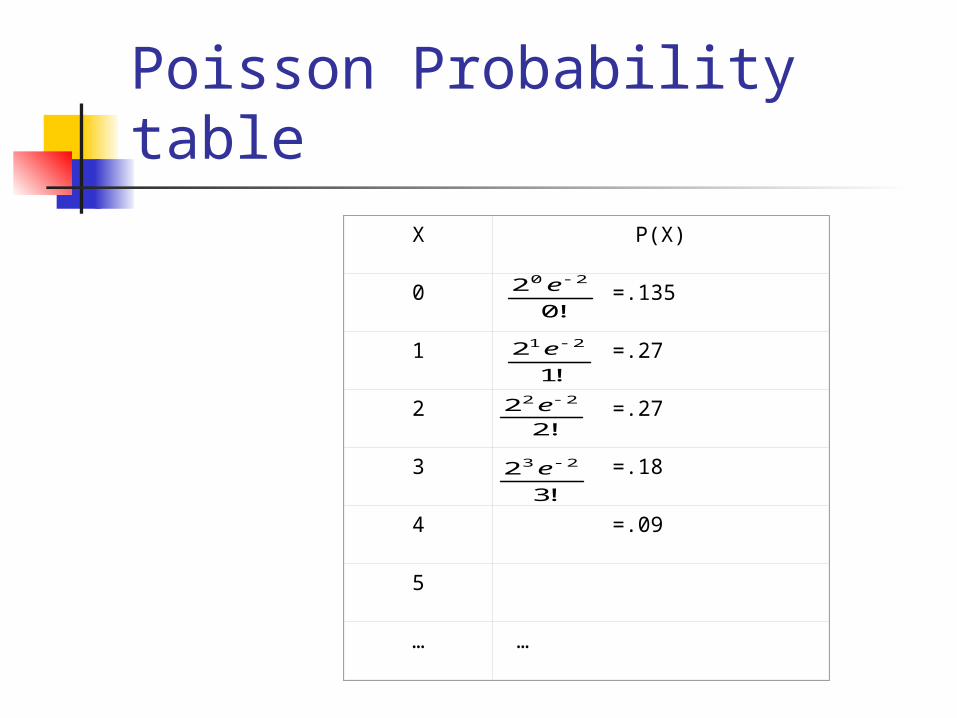
Poisson Probability table
!0
2 20 e
!1
2 21 e
!2
2 22 e
!3
2 23 e
X P(X)
0 =.135
1 =.27
2 =.27
3 =.18
4 =.09
5
… …
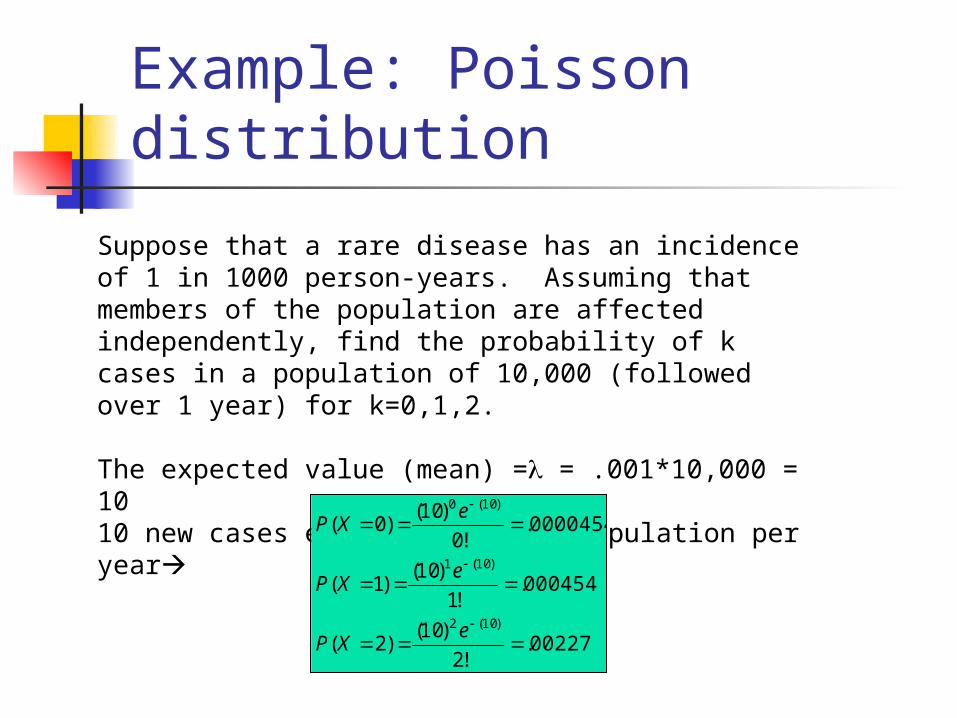
Example: Poisson distribution
Suppose that a rare disease has an incidence of 1 in 1000 person-years. Assuming that members of the population are affected independently, find the probability of k cases in a population of 10,000 (followed over 1 year) for k=0,1,2. The expected value (mean) = = .001*10,000 = 1010 new cases expected in this population per year
00227.!2
)10()2(
000454.!1
)10()1(
0000454.!0
)10()0(
)10(2
)10(1
)10(0
eXP
eXP
eXP
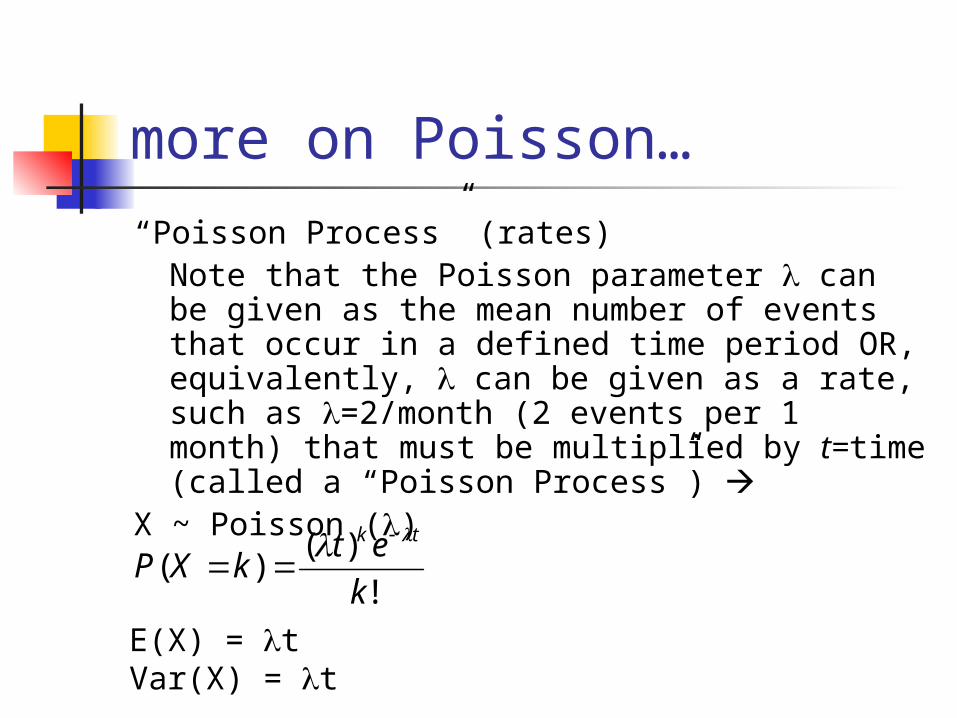
more on Poisson…“Poisson Process” (rates)
Note that the Poisson parameter can be given as the mean number of events that occur in a defined time period OR, equivalently, can be given as a rate, such as =2/month (2 events per 1 month) that must be multiplied by t=time (called a “Poisson Process”)
X ~ Poisson ()
!
)()(
k
etkXP
tk
E(X) = tVar(X) = t
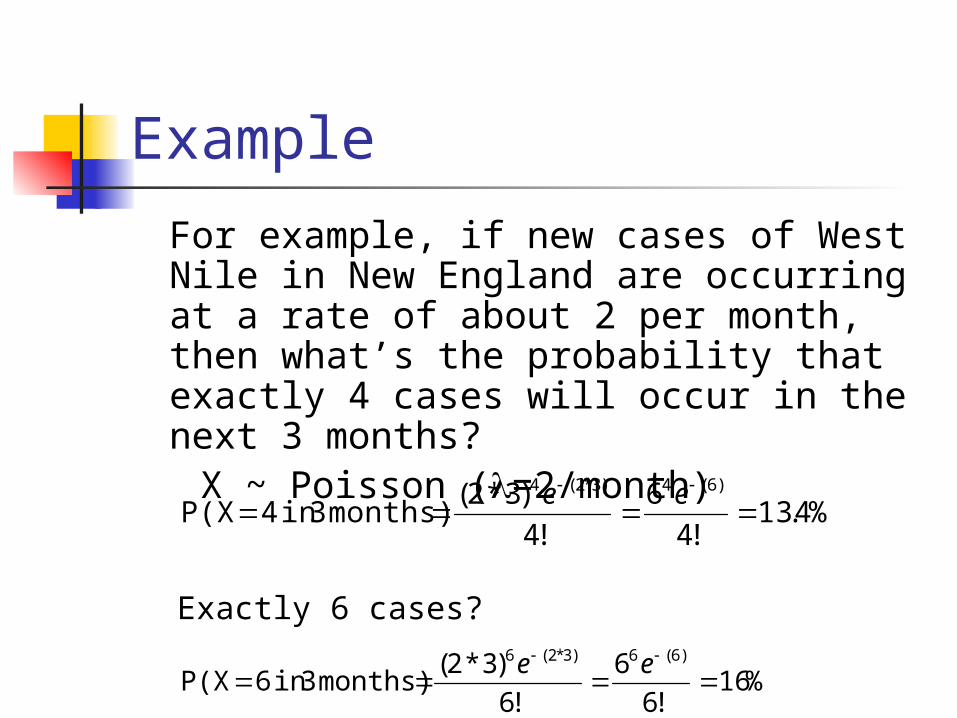
Example
For example, if new cases of West Nile in New England are occurring at a rate of about 2 per month, then what’s the probability that exactly 4 cases will occur in the next 3 months?
X ~ Poisson (=2/month)
%4.13!4
6
!4
)3*2( months) 3 in 4P(X
)6(4)3*2(4
ee
Exactly 6 cases?
%16!6
6
!6
)3*2( months) 3 in 6P(X
)6(6)3*2(6
ee
Practice problems
1a. If calls to your cell phone are a Poisson process with a constant rate =2 calls per hour, what’s the probability that, if you forget to turn your phone off in a 1.5 hour movie, your phone rings during that time?
1b. How many phone calls do you expect to get during the movie?
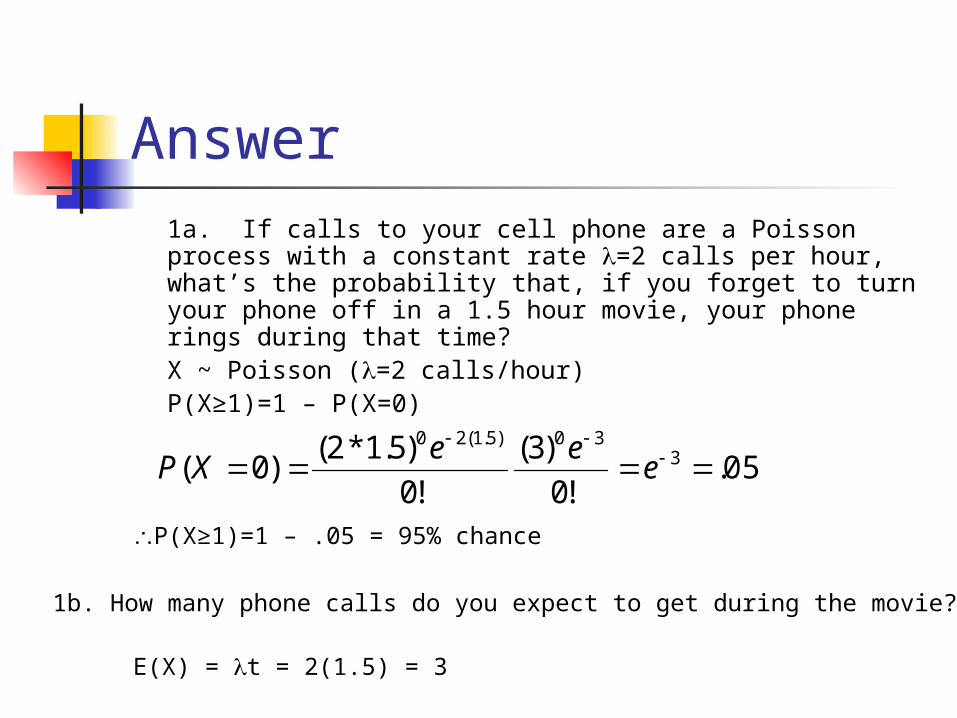
Answer1a. If calls to your cell phone are a Poisson process with a constant rate =2 calls per hour, what’s the probability that, if you forget to turn your phone off in a 1.5 hour movie, your phone rings during that time? X ~ Poisson (=2 calls/hour)P(X≥1)=1 – P(X=0)
05.!0
)3(
!0
)5.1*2()0( 3
30)5.1(20
eee
XP
P(X≥1)=1 – .05 = 95% chance
1b. How many phone calls do you expect to get during the movie?
E(X) = t = 2(1.5) = 3
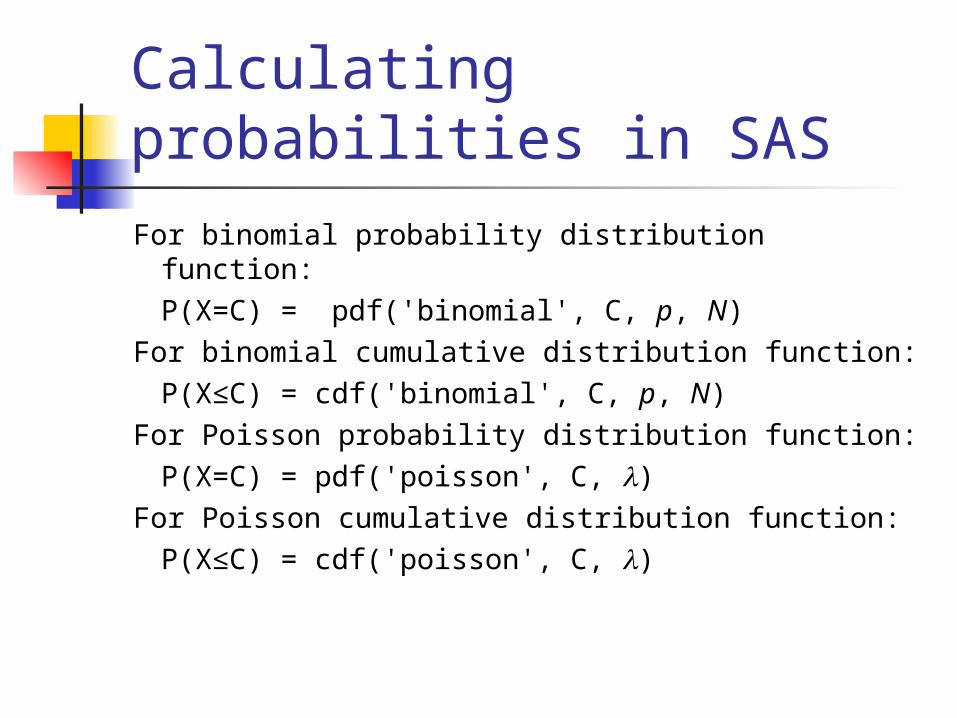
Calculating probabilities in SAS
For binomial probability distribution function:P(X=C) = pdf('binomial', C, p, N)
For binomial cumulative distribution function:P(X≤C) = cdf('binomial', C, p, N)
For Poisson probability distribution function:P(X=C) = pdf('poisson', C, )
For Poisson cumulative distribution function:P(X≤C) = cdf('poisson', C, )
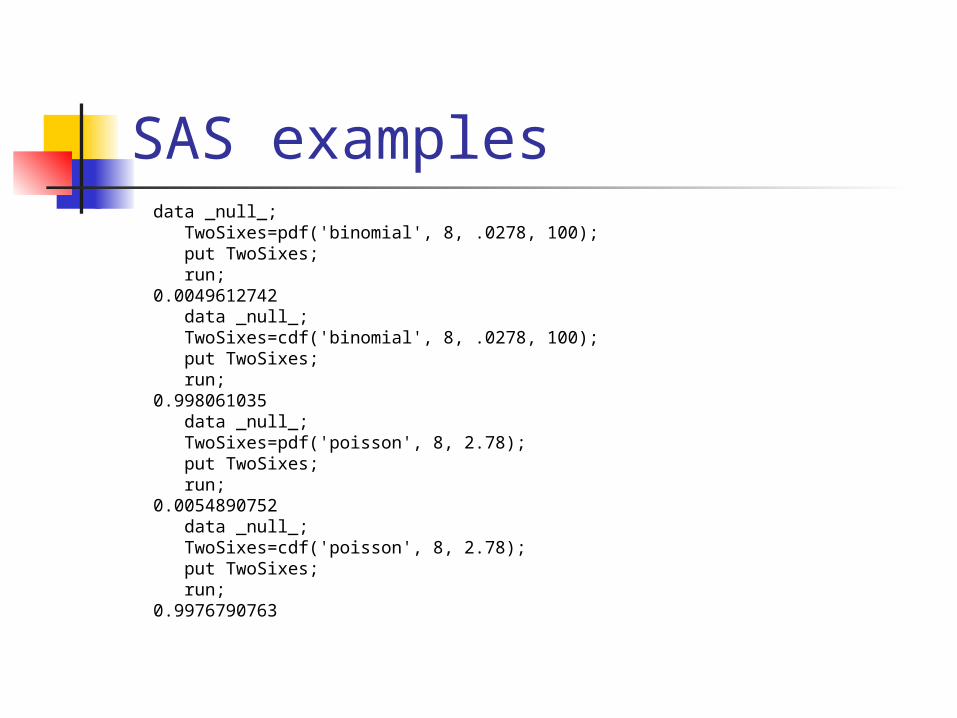
SAS examplesdata _null_; TwoSixes=pdf('binomial', 8, .0278, 100); put TwoSixes; run;0.0049612742 data _null_; TwoSixes=cdf('binomial', 8, .0278, 100); put TwoSixes; run;0.998061035 data _null_; TwoSixes=pdf('poisson', 8, 2.78); put TwoSixes; run;0.0054890752 data _null_; TwoSixes=cdf('poisson', 8, 2.78); put TwoSixes; run;0.9976790763