evolution of thermal desalination · pdf file · 2013-02-13evolution of thermal...
TRANSCRIPT

Saline Water Conversion Corporation
Saline Water Desalination Research Institute (SWDRI)
Evolution of Thermal Desalination Processes
Dr. OSMAN AHMED HAMED

OUTLINE
Background
Evolution of MSF desalination plants
Evolution of MED desalination plants
Dual purpose power/water and hybrid
desalination plants
R&D Prospects

Evolution of Installed membrane and thermal
capacity (cumulative ) 1980-2012
Thermal 33%
Membrane
67%
0
10
20
30
40
50
60
70
80
1980 1985 1990 1995 2000 2005 2008 2010 2012
membrane
thermal
year
mili
on
m3
/d
0
10
20
30
40
50
60
70
80
1980 1984 1988 1992 1996 2000 2004 2008 2012

Breakdown of Total Worldwide Installed
capacity by technology
Other (2%)
Hybrid (1 %)
ED (3 %)
MED (8 %)
MSF (23% RO (63%)
74.8 million m3/d

0
2
4
6
8
10
12
14
16
18
20
22
24
1,988 1,996 1,998 2,000 2,002 2,004 2,010
Pro
du
cti
on
(m
illio
n m
3/d
)
year
thermal membrane
RO 28%
thermal 72%
Historical evolution of total installed capacities of
desalination plants in the GCC countries

MULTI EFFECT
DISTILLATION
(MED)
COMMON
SEAWATER
THERMAL
DESALINATION
PROCESSES
MULTI STAGE
FLASH (MSF)
DISTILLATION
Evolution of Thermal Desalination Processes

The multi-stage flash
(MSF) desalination process

High reliability
& availability.
Life-time over 30
years
Evolutionary
Developments
of MSF Plants
Evolutionary
Developments
of MSF Plants
Evolutionary
Developments
of MSF Plants
Evolutionary
Developments
of MSF Plants
Evolutionary
Developments
of MSF Plants

Life Time Capacity
(migd)
Year Plants S.
#
34 4x5 1979 Jeddah-III 1
32 10 x 5 1981 Jeddah-IV 2
31 6 x 6.2 1982 Al-Jubail-I 3
31 10 x 6 1982 Al-Khobar-II 4
30 40 x 5.38 1983 Al-Jubail-II 5
27 2 x 2.6 1986 Al-Khafji-II 6
24 10 x 5.06 1989 Shoaiba-I 7
24 4 x 6.5 1989 Shuqaiq-I 8
32 5 x 5 1981 Yanbu-I
9
14 4 x 7.94 1999 Yanbu-II 10
12 8 x 7.5 2001 Al-Khobar-III 11
11 10 x 10 2002 Shoaiba-II 12

11
90%
7% 3%
Availability
Planned Shutdown
Forced Shutdown
91%
9%
Water Production
Design Deficiency
88%
12%
Power Production
Design Deficiency
Average Availability for Al-Jubail Plant Phase II
(1983-2012)
Average Water and Power Load Factors for Al-
Jubail Plant Phase II (1983-2012)

12
Reasons For high reliability
and availability
Selection of
High Design
Fouling Factor
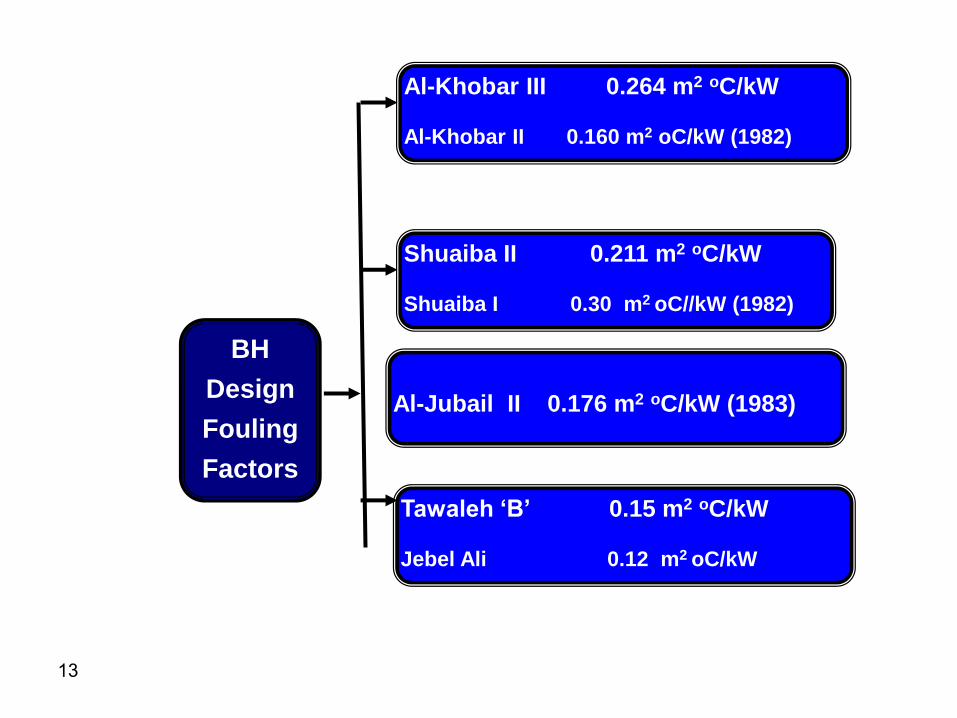
13
BH
Design
Fouling
Factors
Al-Khobar III 0.264 m2 oC/kW
Al-Khobar II 0.160 m2 oC/kW (1982)
Shuaiba II 0.211 m2 oC/kW
Shuaiba I 0.30 m2 oC//kW (1982)
Tawaleh ‘B’ 0.15 m2 oC/kW
Jebel Ali 0.12 m2 oC/kW
Al-Jubail II 0.176 m2 oC/kW (1983)

14
Reasons For high reliability
and availability
Selection of
High Design
Fouling Factor
Effective
alkaline scale
control

To overcome temperature
limitation (88 - 93 oC)
To overcome acid
treatment problems
Inhibitors Based
on Phosphonic Acid
Inhibitors Based on
Polycarboxylic Acid
High Temperature Scale
Control Additive (HTA)
Threshold Agents
1960's, 1970's
Acid Addition
1950's
Polyphosphate
Based Chemical
HISTORICAL DEVELOPMENT OF
CONTROL OF ALKALINE SCALE
Hybrid Treatment
(Acid + Additive)

16
3
4.5
6.5
9
15
0
2
4
6
8
10
12
14
16
85 90 95 100 105 110 115 120
An
tisc
ala
nt
Do
se R
ate
(p
pm
)
Top Brine Temperature (oC)
Dose Rate recommended in 1981
Optimization Tests
Improvement of Chemical
Formulation
Adoption of On-Line Sponge Ball Cleaning System
1.5
1.75
3.53
2.5
0
2
4
6
8
10
12
14
16
85 90 95 100 105 110 115 120
Dose Rate Optimized in 1987
SWCC’s ACHIEVEMENTS IN CONTROLLING
ALKALINE SCALE FORMATION

17
0.8 1
2.521.5
0
2
4
6
8
10
12
14
16
85 90 95 100 105 110 115 120
Dose Rate Optimized in 2003
3
4.5
6.5
9
15
0
2
4
6
8
10
12
14
16
85 90 95 100 105 110 115 120
An
tisc
ala
nt
Do
se R
ate
(p
pm
)
Top Brine Temperature (oC)
Dose Rate recommended in 1981
Optimization Tests
Improvement of Chemical
Formulation
Adoption of On-Line Sponge Ball Cleaning System
1.5
1.75
3.53
2.5
0
2
4
6
8
10
12
14
16
85 90 95 100 105 110 115 120
Dose Rate Optimized in 1987
SWCC’s ACHIEVEMENTS IN CONTROLLING
ALKALINE SCALE FORMATION
2010

18
Economic Impact of Antiscalant Dose Rate
Reduction in SWCC MSF Plants
7.86
4.65
3.21
0 1 2 3 4 5 6 7 8 9
Antiscalant Annual
Operating cost as
per 1987 dose rate
Antiscalant Annual
Operating cost as
per current dose
rate
Annual Savings
Millio
n U
S $

19
Reasons For high reliability
and availability
Selection of
High Design
Fouling Factor
Effective
alkaline scale
control
Good
Selection of
Material of
Construction

20
Section Material of Construction
Brine Heater
Shell Carbon steel (all plants)
Tubes Either 70/30 o,90/10 Cu-Ni or modified 66/30/2/2
Cu/Ni/Fe/Mn except Al-Jubail I (Titanium)
Heat Recovery
Section
Flash
Chamber
• First high temperature stages Al-Jubail, Al-Khafji and
the first two modules of Jeddah IV cladded with
stainless steel
• Al-Khobar II completely cladded with 90/10 Cu/Ni
• Al-Shuqaiq 1completely claded with stainless steel
Tubes All plants except Yanbu and Al-Jubail I: 90/10 Cu Ni
Jubail I: Titanuim
Yanbu 70/30 (1 to 10 stages)
90/10 (11 to 21 stages)
Heat Rejection Tubes All plants except Jeddah & Shoaiba : Titanium
Jeddah II, III, IV 90/10 Cu/Ni
Shoaiba 70/30 Cu Ni

21
Flash chamber of both recovery
and heat rejection sections
Carbon steel lined with stainless steel
(floor lined with 317L, walls with
316L and roof with either 316L or
304.
Water boxes
Carbon steel lined with 90/10
Copper-Nickel
Tubes
Brine heater tubes modified 66/30/2/2
Cu/Ni/Fe/Mn ; heat recovery tubes:
Copper/Nickel (first four stages 70/30
and remaining stages 90/10)
Heat rejection tubes
Titanium &
modified 66/30/2/2 Cu/Ni/Fe/Mn
Projects which were recently built use the following materials of
construction for the major components

Increase in distiller
size
High reliability
& availability.
Life-time over 30
years
Evolutionary
Developments
of MSF Plants
Evolutionary
Developments
of MSF Plants
Evolutionary
Developments
of MSF Plants
Evolutionary
Developments
of MSF Plants
Evolutionary
Developments
of MSF Plants

Historical Growth of MSF Distiller Size
2.5
5.1
7.9
10
17.5
20
0
5
10
15
20
25
1973-1978 JeddahI&II kKhobar I
1979-1988 Jeddah III&IV Yanbu I Jubail
I&II Khobar IIShuaiba I
1999-2001 Yanbu IIkhobar II
2002 Shuaiba II 2003 UAE 2011 Ras Alkhair
• Low investment cost for auxiliary equipment such as interconnection and control
piping .
• Operating and maintenance people depends on the number of unit installed.
• Savings in operational cost.
Large unit size:
23
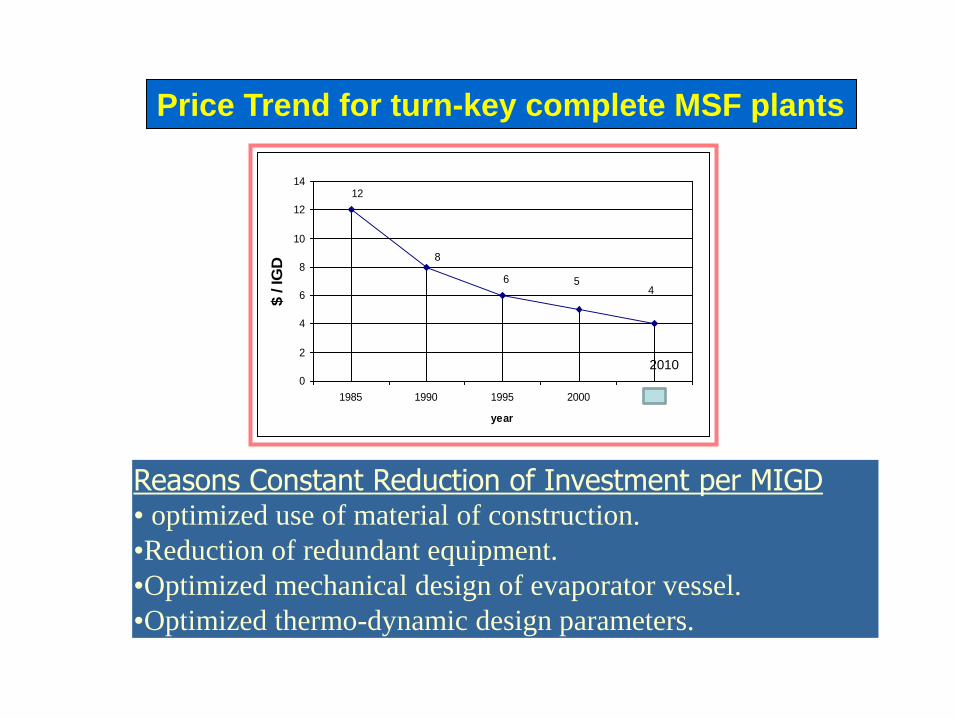
Reasons Constant Reduction of Investment per MIGD • optimized use of material of construction.
•Reduction of redundant equipment.
•Optimized mechanical design of evaporator vessel.
•Optimized thermo-dynamic design parameters.
8
6 54
12
0
2
4
6
8
10
12
14
1985 1990 1995 2000 2004
year
$ / IG
D
Price Trend for turn-key complete MSF plants
2010

Use of thermally
efficient power
generation cycles
Evolutionary
Developments
of MSF Plants
Evolutionary
Developments
of MSF Plants
Evolutionary
Developments
of MSF Plants
Evolutionary
Developments
of MSF Plants Increase in distiller
size
High reliability
& availability.
Life-time over 30
years
Evolutionary
Developments
of MSF Plants

Seawater
Pretreatment
Power generation
Plant
Desalination
Plant
Desalinated
water
LP steam
Condensate
Net power
output
Pumping
power
Seawater intake
Operation flow chart for a water/power cogeneration plant Power/Water Flow Chart
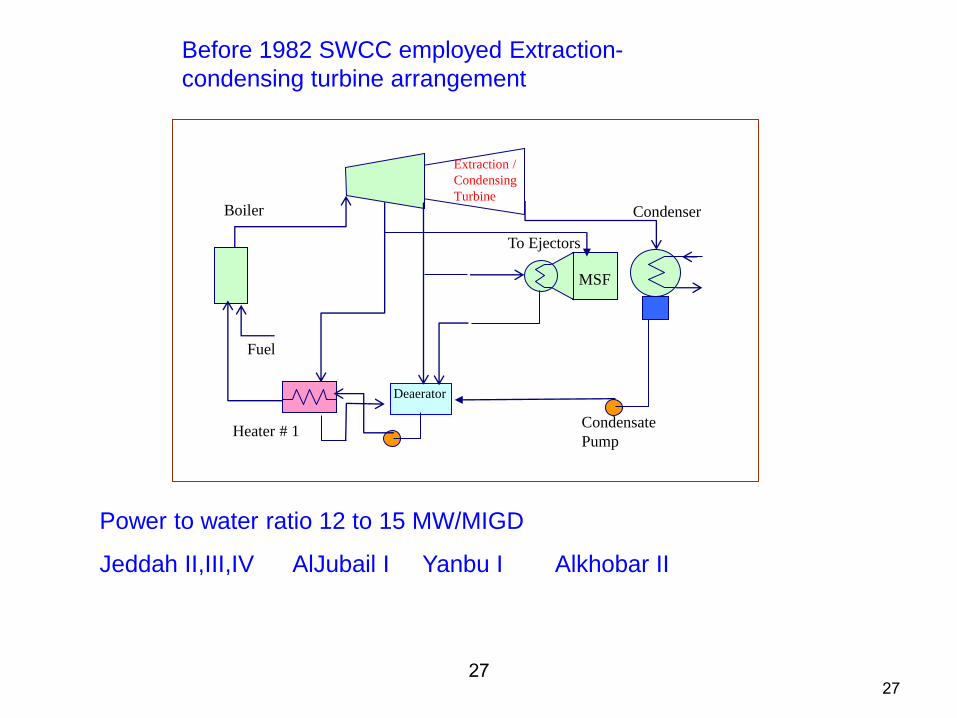
27 27
Extraction /
Condensing
Turbine
Condenser
Condensate
Pump
Heater # 1
Deaerator
MSF
Boiler
Fuel
To Ejectors
Before 1982 SWCC employed Extraction-
condensing turbine arrangement
Power to water ratio 12 to 15 MW/MIGD
Jeddah II,III,IV AlJubail I Yanbu I Alkhobar II

28 28
After 1983 SWCC employed back-pressure turbine arrangement
Condensate Pump
MSF Distillers
Deaerator
Heater # 2 Heater # 1
G
Boiler
Fuel
Back Pressure
Turbine
Ejector Moisture
Separator
Power to water ratio 5 to 7.9 MW/MIGD
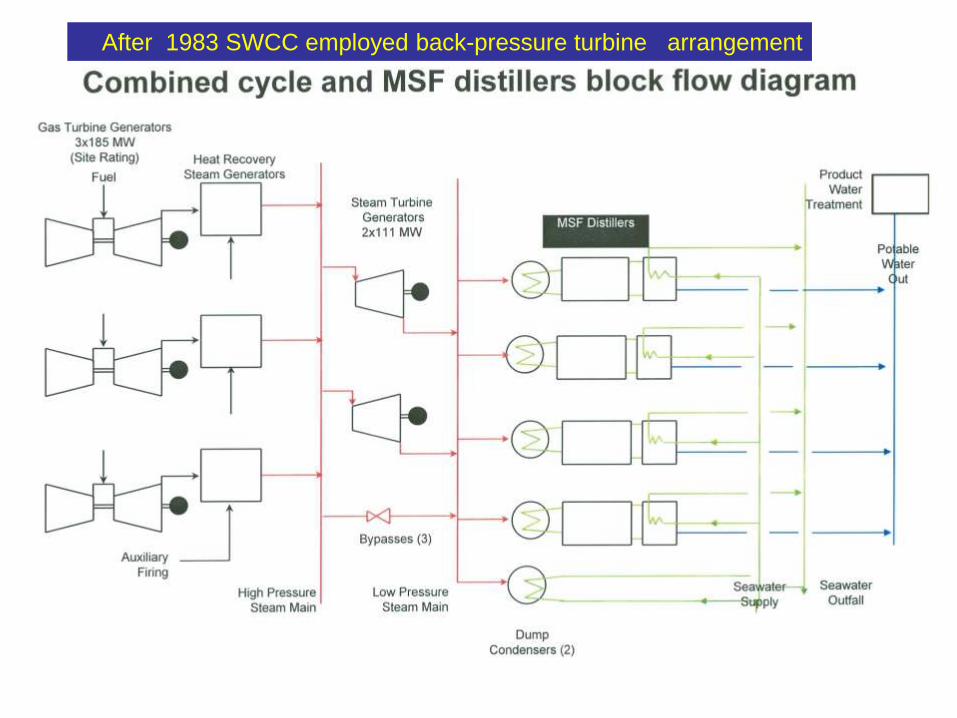
After 1983 SWCC employed back-pressure turbine arrangement

2012 Combined Gas-vapor power generation cycles coupled with MSF/RO desalination
plants
Compressor Gas
Turbine
Combustion
Chamber
Steam
Turbine
Exhaust
gases Air in
Recovery
Section
GAS CYCLE
STEAM CYCLE
Waste Heat Boiler
Rejection
Section
Product Water
Blow down Brine
Heater
Fuel in
Recycle Brine
Power Output
Power Output
Seawater in
Cooling
Seawater
Reject
SWRO
1100 oC
613 oC
539 oC
140 oC, 2.89 Bar
Ejector
Steam
18 bar, 50
MW
230oC
300,000
m3/d 1,000,000 m3/d 62.5 MW
700,000
m3/d
81
MW Common
Equipment
Net
2400 MW
5 x 129.7 MW

Typical power to water ratios for different technologies
Technology PWR (MW installed/Million Imperial Gallopns per)
Steam turbine BTG-MED 3.5
Steam turbine BTG-MSF 5
Steam turbine EST-MED 7
Steam turbine EST-MSF 10
Gas turbine GT-HRSG-MED 6
Gas turbine GT-HRSF-MSF 8
Combine cycle BTG-MED 10
Combine cycle BTG- MSF 16
Combine cycle EST-MED 12
Combine cycle EST-MSF 19

Financial Benefits for Dual Purpose Plants
■ Tremendous saving in fuel consumption related to
the desalting process
■ Elimination of some equipment
(power plant condenser)
Dual purpose power/water plants have an overall
financial gain against two single purpose plants.
■ Sharing of some common equipment (boiler and its
associated facilities, intake and outfall facilities).

243 MW
204 MW
100
Electrical
Water Production
15 MIGD
Dual
Purpose
Dual
Purpose
=447 MW
MW
Fuel
requirements
285 MW
280 MW
Single
Purpose
Single
Purpose
=565 MW
Fuel
requirements
Thermal Benefits of Cogeneration Plants

Thermal
Processes
MSF
MED/TVC

MED_TVC offers the best potential method of improving the performance of straight MED desalination plants and
achieving high performance ratios and hence low water cost.
or Steam Transformer
GOR=6
1kg

Historical evolution of the installed capacities of MED
desalination plants in the GCC states.
13000 65000
243000
754000
2645000
0
500,000
1,000,000
1,500,000
2,000,000
2,500,000
3,000,000
1985 1990 1995 2000 2005 2010 2015
Pro
du
cti
on
m3/d
Year

MARAFIQ POWER/WATER COGENERATION PLANT
Four power cycles : each power cycle incorporates 3 GT,3HRSG and one ST
Three of the power cycles are coupled with 27 MED units.
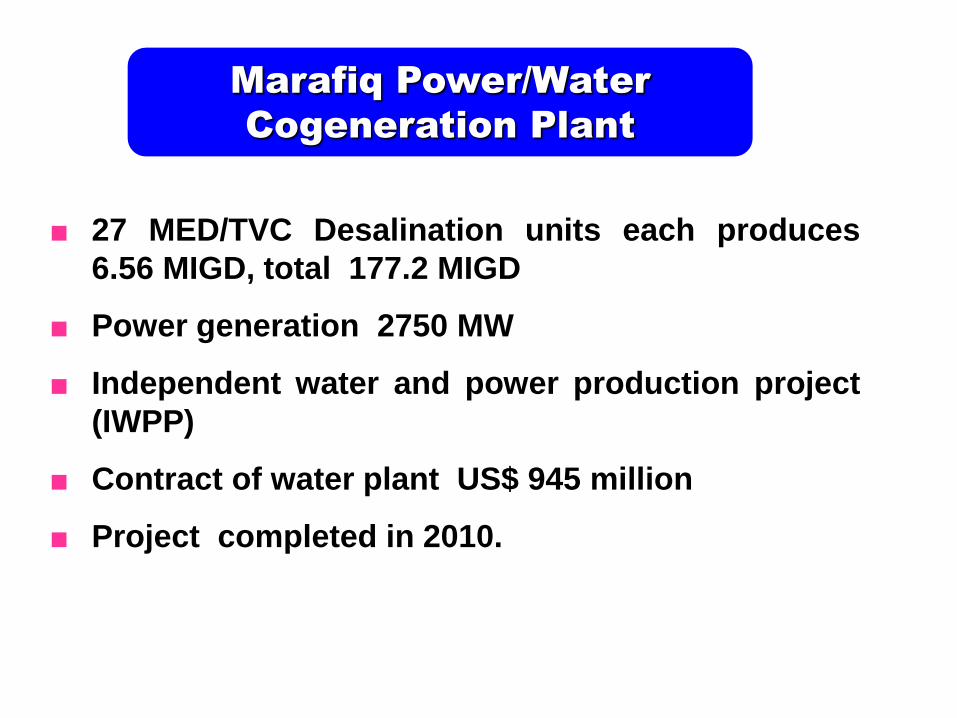
■ 27 MED/TVC Desalination units each produces
6.56 MIGD, total 177.2 MIGD
■ Power generation 2750 MW
■ Independent water and power production project
(IWPP)
■ Contract of water plant US$ 945 million
■ Project completed in 2010.
Marafiq Power/Water
Cogeneration Plant

They provide higher overall heat transfer coefficients when
compared to multistage flash (MSF) desalination systems.
MED does not employ recycling and are thus based on the
once through principle and have low requirements for
pumping energy.
The power consumption of MED/TVC plants is only around
1.5 kWh/m3 as there are no requirements to re-circulate large
quantities of brine.
Increase of MED unit capacity results in the decrease of the
investment cost.
Multi-effect distillation also offers the possibility of reducing
the plant size and footprint
Factors responsible for the recent market emergence of
MED-TVC desalination plants

0
3
6
9
12
15
1990 2000 2009 year
un
it c
ap
acit
y M
IGD
MED UNIT CAPACITY GROWTH
5MIGD
8-10 MIGD
EVOLUTION OF MED/TVC DESALINATION PLANTS
1MIGD
15MIGD
2012

1 2 3 4 5 6 7
B
A
B
A
B
A
B
A
B
A
A A
C C
B B
Steam
Produced
Steam
Distillate through
guillotine
Distillate through
Saw line
Distillate through
U pipe
Brine suction
Cell 1 / distillate
suction
REB 5 REB 3
8

HYBRID CONCEPTS

43 43
Seawater
RO
DESALINATION PLANT PRODUCT
WATER
Power/Water Hybrid Flow Chart
Seawater intake
Blending
Power Plant Thermal Desalination Plant Pumping power
steam
condensate
Power
Pumping
Power Distillate
Permeate

Integrated Hybrid systems
the plant is designed from
the beginning
as a combined plant .
HYBRID
SYSTEMS
Simple hybrid Systems
adding a stand- alone
RO desalination
plant to an existing MSF complex
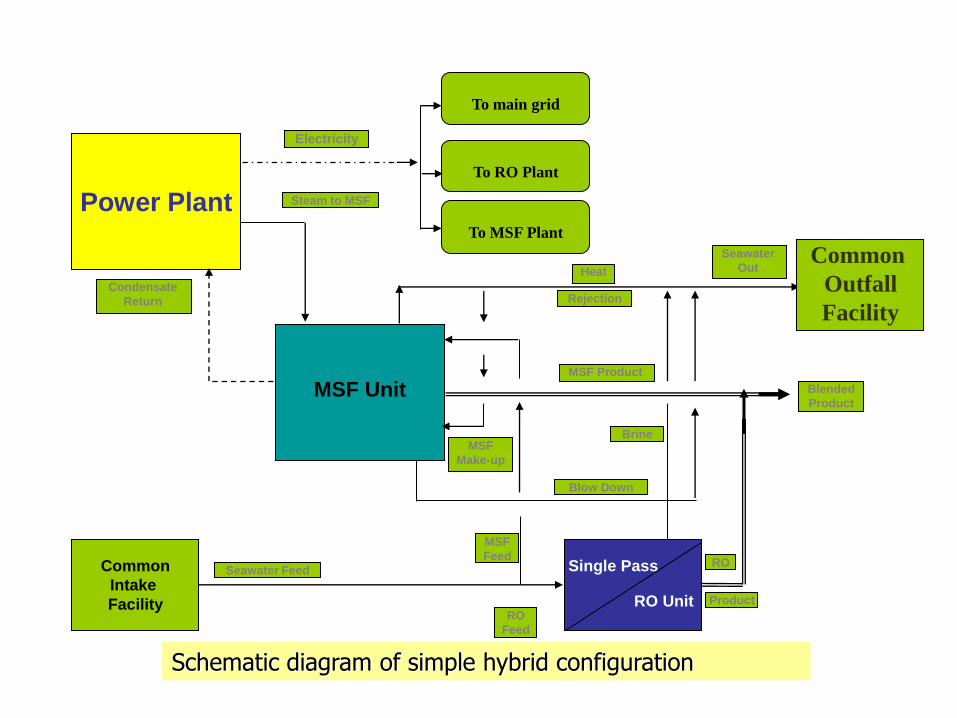
Power Plant
Electricity
To main grid
To RO Plant
To MSF Plant
MSF Unit
Condensate
Return
Steam to MSF
Heat
Rejection
Seawater
Out Common
Outfall
Facility
Blended
Product
MSF Product
MSF
Make-up
Brine
Blow Down
Single Pass
RO Unit
Common
Intake
Facility
MSF
Feed
RO
Feed
Seawater Feed RO
Product
Schematic diagram of simple hybrid configuration

ADVANTAGES
• Such arrangement allows to operate the RO unit with relatively high TDS and consequently allows to lower the replacement rate of the membranes.
• If the useful life of the RO membrane can be extended from 3 to 5 years the annual membrane replacement cost can be reduced by nearly 40 percent . Blending the products of the thermal and SWRO allows for the use of a single stage SWRO instead of the two stage SWRO plant normally employed in standalone SWRO plants.
• Combining thermal and membranes desalination plant in the same site will allow to use common intake and outfall facilities with less capital cost.
• An integrated pretreatment and post-treatment operation can reduce cost and chemicals.
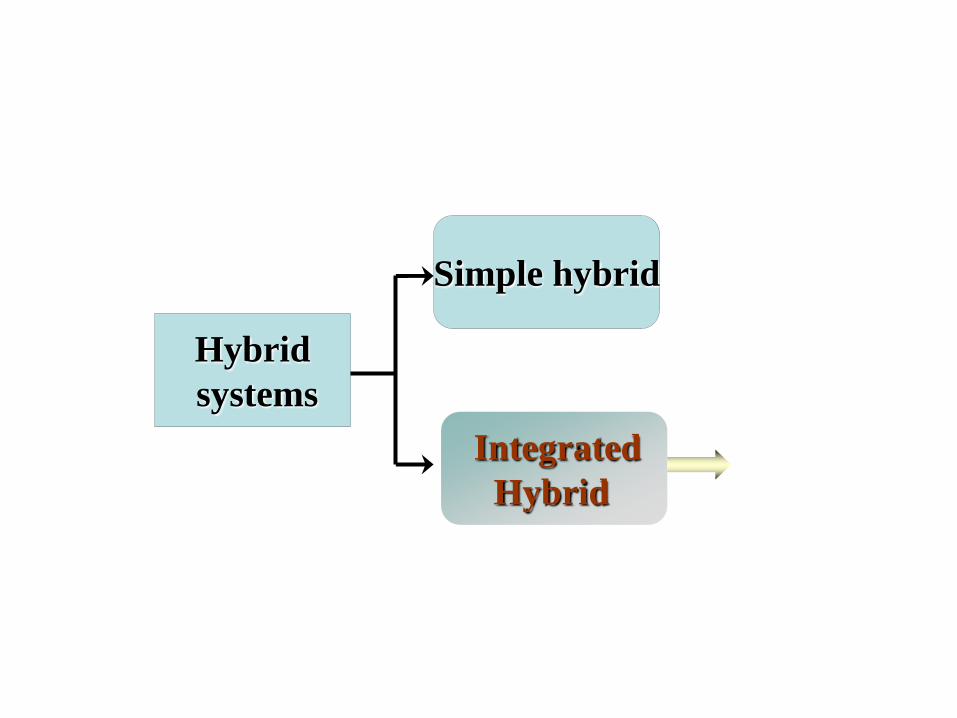
Hybrid
systems
Simple hybrid
Integrated
Hybrid

Schematic diagram of fully integrated hybrid configuration
Power Plant
Electricity
To main grid
To RO Plant
To MSF Plant
MSF Unit
Condensate
Return
Steam to MSF
Heat
Rejection
Seawater
Out Common
Outfall
Facility
BlendedProduct
MSF Product
MSF
Make-up
Brine
Blow Down
Single Pass
RO Unit
Common
Intake
Facility
MSF
Feed
RO
Feed
Seawater Feed RO
Product
Common Post
Treatment
Facility

Commercially Available
Hybrid Desalination
Plants
Jeddah
MSF/SWRO
Yanbu
MSF / SWRO
Al-Jubail
MSF/SWRO
Ras Al Khair
MSF/SWRO
Product blended with MSF Product
SWRO 28.16 MIGD
Phase II MSF 40 MIGD
20 MIGD
Comman intake/outful with MSF
Product blended with MSF
1989 , Phase I
Single stage , 12.5 MIGD
1994 , Phase II
Single stage , 12-5 MIGD

HH للGas
turbine
system
HRSG
Steam
turbine
MSF
plant
SWRO
plant
Natural gas
P=10*199.7 MW
P=5*129.7 MW
P= 10*199.7 MW Pnet
2400 MW
PMSF
PRO
300000
m3/d
700000
m3/d
1000000
m3/d
PRO
Flue
gases
Steam Steam
Condensate
return
Block diagram of the combined power cycle integrated
with the hybrid MSF/SWRO desalination plant
Paux

MSF
Unit # 1
12.5 MIGD
MSF
Unit # 5
12.5 MIGD
MSF
Unit # 2
12.5 MIGD
MSF
Unit # 3
12.5 MIGD
MSF
Unit # 4
12.5 MIGD
RO
Plant
37.5 MIGD
To Grid
G G S/T
Unit # 1 S/T
Unit # 2
STEAM
Electricity
118 MW
Electricity
118 MW B
y-p
ass
DS
H
Electricity
HRSG
Unit # 3
HRSG
Unit # 2
G G G G
Electricity
105 MW
Electricity
105 MW
Electricity
105 MW
Steam 390 t/h Steam 390 t/h
(Fujairah Power/Water Plant (Combined cycle)
Electricity To Grid
Internal
Consumers
HRSG
Unit # 1
HRSG
Unit # 4
G/T # 1
GE9171E
G/T # 2
GE9171E
G/T # 3
GE9171E
G/T # 4
GE9171E
Supp.
Firing
Supp.
Firing
WATER
STEAM
MSF
Unit # 1
12.5 MIGD
MSF
Unit # 5
12.5 MIGD
MSF
Unit # 2
12.5 MIGD
MSF
Unit # 3
12.5 MIGD
MSF
Unit # 4
12.5 MIGD
RO
Plant
37.5 MIGD

0
10
20
30
40
50
60
70
2 (Yanbu) 3.3 (Jeddah) 13.51 (Al Jubail)
MSF/SWRO water production
Sp
ec
ific
fu
el
en
ery
co
ns
um
pti
on
kW
h/m
3MSF dual purpose
SWRO
hybrid MSF/SWRO
...
Specific fuel energy consumption of SWCC hybrid
MSF/SWRO desalination plants

R&D PROSPECTS

R&D
PROSPECTS IN
THERMAL
DESALINATION
Address the shortcomings
Of currently employed thermal
desalination processes
Development of desalination concepts
That have not been fully explored and
Applied in commercial scale
Development of new desalination concepts

R&D
PROSPECTS IN
THERMAL
DESALINATION
Address the shortcomings
Of currently employed thermal
desalination processes

R&D PROSPECTS
Address the shortcomings of current thermal desalination processes.
C OS T OF WATE R
Chemicals1%
S pare & Maintenance
4% Labor (O & M)8%
S team Cos t52%
Pow er Cos t6%
Capital Charges29%
Breakdown of water production cost

10000
15000
20000
25000
30000
35000
40000
80 90 100 110 120 130 140 150
6
6.5
7
7.5
8
8.5
9
9.5
10
Top brine temperature oC
Wa
ter
pro
du
ctio
n m
3/d
Per
form
an
ce r
ati
o
Chemical additives
pretreatment
Aci
d z
on
e
Prohibitive zone
.Principal deterent is the
formation of hard
(sulfate) scale
Address the shortcomings
Of currently employed thermal
desalination processes
Impact of variation of TBT on MSF water production and performance ratio

Prohibitive Zone
Impact of the variation of operating temperature on the energy
consumption of the MED Process
To eliminate the possibility of scale formation, commercial MED
desalination plants are currently operating with TBT up to 65 oC .

NF Reject
Seawater
NF Unit
NF Product
Ca = 481
Mg = 1507
TH = 7406
HCO3 = 145
SO4 = 3257
TDS =
45400
Ca = 72
Mg = 63
TH = 440
HCO3 = 51
SO4 = 23
TDS =
32060
NF/RO/MSF or NF/RO/MED Tri-hybird System
RO Reject
SWRO Unit RO Product
Ca = 281
Mg = 437
TH = 2502
HCO3 = 101
SO4 = 124
TDS = 61080
Ca = 1
Mg = 2
TH = 9
HCO3 = 4
SO4 = -
TDS = 660
MSF/MED Unit MSF/MED Product

Schematic flow diagram of trihybrid NF/RO/MED desalination system
RO Unit
RO ProductBlended
Product
MED/TVC Unit
MED Product
Steam
Cooling Seawater out
Cooling Seawater in
Condensate
Return
RO Reject
NF Unit
NF Reject
Seawater Intake
NF Product
Pretreatment
Make-up Seawater
MED Brine
RO Unit
RO ProductBlended
Product
MED/TVC Unit
MED Product
Steam
Cooling Seawater out
Cooling Seawater in
Condensate
Return
RO Reject
NF Unit
NF Reject
Seawater Intake
NF Product
Pretreatment
Make-up Seawater
MED Brine

61
CONCEPTUAL DESIGN OF THE HIGH
TEMPERATURE AND UNIT CAPACITY
MED-TVC DESALINATION PLANT

Configuration of new MED/TVC desalination plants
Steam
Transformer
Cell
3B
Cell
1B
Cell
2B
Cell
2B
Cell
1B
Cell
3A
Cell
4
Cell
5
Dist
Cond
enser
Cell
6

63
Schematic flow diagram of MED
unit of Tri-Hybrid Desalination Plant

0
2
4
6
8
10
12
14
16
0 10 20 30 40 50 60 70 80 90 100
Wat
er C
ost
(SR
/m3)
($/bbl)
Standalone MED
0
2
4
6
8
10
12
14
16
0 10 20 30 40 50 60 70 80 90 100
Wat
er C
ost
(SR
/m3)
($/bbl)
Standalone MED
MED+Power Plant
0
2
4
6
8
10
12
14
16
0 10 20 30 40 50 60 70 80 90 100
Wat
er C
ost
(SR
/m3)
($/bbl)
Standalone MED
MED+Power Plant
Standalone NF/RO/MED (70-30)
0
2
4
6
8
10
12
14
16
0 10 20 30 40 50 60 70 80 90 100
Wat
er C
ost
(SR
/m3)
($/bbl)
Standalone MED
MED+Power Plant
Standalone NF/RO/MED (70-30)
NF/RO/MED (70-30) +Power Plant
The impact of energy cost in $/bbl oil equivalent on the water production cost

Schematic flow diagram of trihybrid NF/RO/MSF desalination system
RO Unit
RO ProductBlended
Product
MED/TVC Unit
MED Product
Steam
Cooling Seawater out
Cooling Seawater in
Condensate
Return
RO Reject
NF Unit
NF Reject
Seawater Intake
NF Product
Pretreatment
Make-up Seawater
MED Brine
RO Unit
RO ProductBlended
Product
MED/TVC Unit
MED Product
Steam
Cooling Seawater out
Cooling Seawater in
Condensate
Return
RO Reject
NF Unit
NF Reject
Seawater Intake
NF Product
Pretreatment
Make-up Seawater
MED Brine
MSF
MSF
66
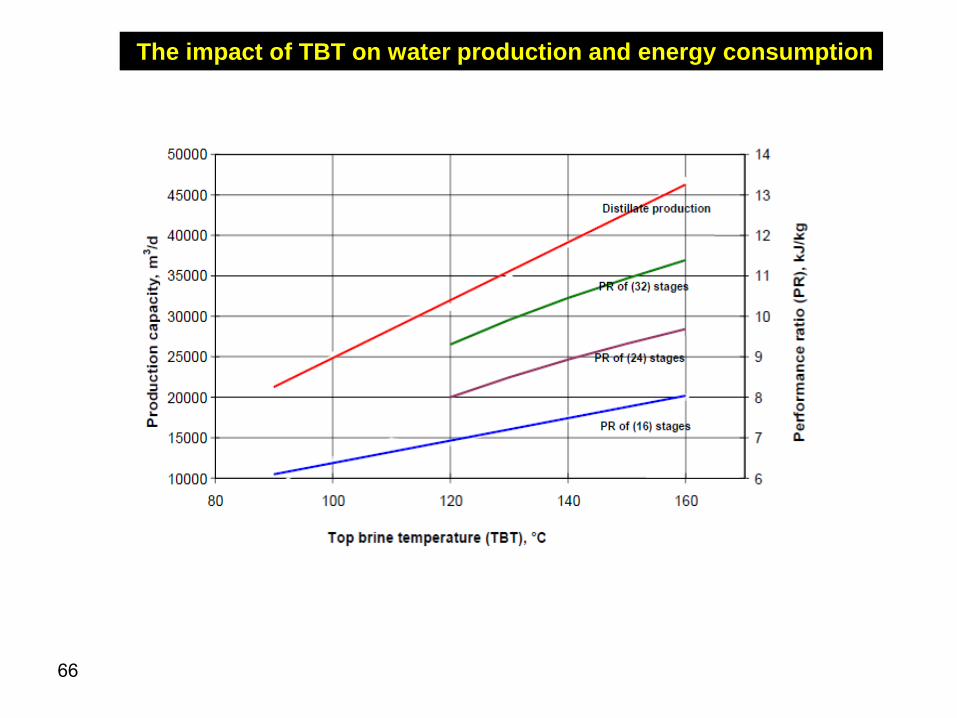
The impact of TBT on water production and energy consumption

67
0
0.5
1
1.5
2
2.5
3
3.5
4
4.5
5
5.5
0 20 40 60 80 100 120
Wa
ter
pro
du
cti
on
co
st
$/m
3
Energy cost $/bbl
conventional MSF
conventional MSF
0
0.5
1
1.5
2
2.5
3
3.5
4
4.5
5
5.5
0 20 40 60 80 100 120
Wa
ter
pro
du
cti
on
co
st
$/m
3
Energy cost $/bbl
conventional MSF
Dihybride NF/MSF System
0
0.5
1
1.5
2
2.5
3
3.5
4
4.5
5
5.5
0 20 40 60 80 100 120
Wa
ter
pro
du
cti
on
co
st
$/m
3
Energy cost $/bbl
conventional MSF
Dihybride NF/MSF System
Trihybrid NF/RO/MSF System
The impact of energy cost in $/bbl oil equivalent on the water production cost

Comparison between the standalone MSF and
MSF combined with NF/RO configuration
0
1
2
3
4
5
6
7
8
9
10
11
12
13
14
Standalone MSF MSF Wthin Trihybrid Scheme
Ad*102
( m2/kg/hr )
34%
Pumping Power(kWh/m3) 10%
Mu/Md42 %Mc/Md
23 %
Mr/Md17 %PR
39 %
68

Prospects of reduction of operational cost
of SWCC small scale thermal desalination
plants using solar energy
Saline Water Conversion Corporation (SWCC)

Electricity
RO ED MVC
RO = Reverse Osmosis ED = Electrodialysis (ED) MVC = Mechanical vapor compression TVC = Thermal Vapor compression MED = Multieffect distillation MSF = Multistage flash distillation
TVC MED MSF RO ED MVC
Heat
TVC MED MSF
Heat Electricity Thermal power
cycle
Thermal energy
Electricity to grid
Synergy between desalination and solar energy Solar desalination combinations
Concentrating solar collector field,
Photovoltaic cells (PV)
Solar energy driven
desalination processes
solar ponds,
evacuated tube , flat
plate,
parabolic trough

SWCC-SWDRI/HITACHI ZOSEN Joint Solar Research Project
Schematic diagram of the solar assisted thermal desalination experimental set-up

SWDRI SWCC
Solar Energy
for
Desalination Plants

R&D
PROSPECTS IN
THERMAL
DESALINATION
Address the shortcomings
Of current thermal desalination processes
Development of desalination concepts
That have not been fully explored and
Applied in commercial scale

R&D PROSPECTS
Development of
desalination concepts
That have not been
fully explored and
Applied in commercial
scale
Membrane distillation
Freezing processes

R&D
PROSPECTS IN
THERMAL
DESALINATION
Address the shortcomings
Of current thermal desalination processes
Development of desalination concepts
That have not been fully explored and
Applied in commercial scale
Development of new desalination concepts

Wate
r P
roduction C
ost
Year
Step Change
Evolutionary change

Thank You
77
