everyone hates privatization, but why? survey evidence ... · 1 everyone hates privatization, but...
TRANSCRIPT

1
Everyone Hates Privatization, but Why?
Survey Evidence from 28 Post-Communist Countries
Irina Denisova, Markus Eller, Timothy Frye, Ekaterina Zhuravskaya1
This draft: May 10, 2010
Abstract: A 2006 survey of 28,000 individuals in 28 post-communist countries reveals overwhelming support for revising privatization, but also that most respondents prefer to leave firms in private hands. We test whether individuals support revising privatization primarily due to a preference for state property or due to concerns about the legitimacy of privatization. We find that a lack of human capital and privately owned assets affects the support for revising privatization primarily via a preference for state property over private property; whereas transition-related hardships influence support for revising privatization via both a preference for state property and concerns about the illegitimacy of privatization. These results suggest the value of analyses that not only link respondent traits with support for policy, but that also probe the motivations that underpin this support. Keywords: privatization, revision, nationalization, property rights, demand for property rights, legitimacy
of property rights, transition
1 Irina Denisova ([email protected]) is from the Center for Economic and Financial Research (CEFIR) at the New Economic School. Markus Eller ([email protected]) is from the Oesterreichische Nationalbank (OeNB). Timothy Frye ([email protected]) is from Columbia University and the Harriman Institute. Ekaterina Zhuravskaya ([email protected]) is from the New Economic School, CEFIR, and CEPR. We thank Erik Berglof, Sergei Guriev, Pauline Jones-Luong, William Megginson, Annette Poulsen, Andrei Shleifer, and the participants of the 2007 Annual Meeting of the American Political Science Association in Chicago, the 3rd Russia-China Global Institute conference in Beijing, the 2008 Annual Meeting of the American Economic Association in New Orleans, and the Political Economy Faculty Lunch at Harvard for helpful comments. The authors also gratefully acknowledge the financial support by the European Bank for Reconstruction and Development. Opinions expressed in this paper do not necessarily reflect the official viewpoint of the Oesterreichische Nationalbank or the Eurosystem.

2
Introduction
Studies of mass support for economic reform reveal a simple conclusion: Everyone hates
privatization. Despite the great diversity of privatization strategies and outcomes, majorities oppose
privatization in countries from Latin America to Eastern Europe (Boix 2005, Graham and Sukhtankar
2004, Lora and Panizza 2003, Panizza and Yanez 2006, Denisova et al. 2010). Even when respondents
receive tangible benefits from privatization they still oppose privatization in large numbers (World Bank
2005).
Yet precisely why respondents hold this view is unclear. Opposition to privatization could be
rooted in support for state over private property. Individuals with skills best suited for an economy
dominated by state ownership may oppose privatization due to concerns for material self interest (Rodrik
1995; Dewatripont and Roland 1994). In addition to this standard view, individuals may oppose
privatization due to concerns for the legitimacy of the process or outcome of privatization (Hoff and
Stiglitz 2004; 2008).
Existing literature provides scant evidence to discriminate between these views. Studies from
Latin American have explored the determinants of privatization, but do not examine why respondents
hold these views (Boix 2005, Graham and Sukhtankar 2004, Lora and Panizza 2003, Panizza and Yanez
2006). Scholars of postcommunism have examined mass attitudes towards market economies, but have
paid less attention to the privatization of state-owned enterprises (c.f., Duch 1993, 1995). Hoff and
Stiglitz (2004, 2008) identify the inefficiencies induced by an illegitimate privatization but do not directly
test their argument. Frye (2006, 2007) conducts survey experiments on business elites and the mass
public in Russia to examine how violations of the law on privatization shape support for revising
privatization, but his findings are limited to Russia. Kaltenthaler et al. (2006) estimate individual-level
determinants of privatization support in seven post-Soviet countries, but do not explore why respondents
hold these views. Denisova et al. (2009) study how the individual market skills and country institutions
interact in determining individual support for privatization in 28 transition countries using the same data
as this paper; but they also do not distinguish between different reasons for the dislike of privatization. Di

3
Tella et al. (2008) examine the role of propaganda and reality in the formation of beliefs about
privatization but do not examine the arguments behind the beliefs as well.
We test for the arguments underlying attitudes towards privatization by analyzing the “Life in
Transition Survey” (LiTS) of 28,000 individuals from 28 transition countries conducted by the World
Bank and EBRD in 2006 (EBRD 2007 a, b). The survey asked respondents whether they would like to
revise privatization results; and if so, whether they prefer privatized assets be re-nationalized and left in
state hands, re-nationalized and then re-privatized to new owners using a more transparent procedure, or
be left with the current owners provided they pay additional compensation for their privatized assets.
Overall, respondents express strong support for revising privatization in all post-communist
countries: more than one half of the population in each of the 28 countries and over 80 percent of all
respondents support some form of revision of privatization. Less than one-third of respondents, however,
would like to see firms left in state hands. And, therefore, much of the support of revising privatization is
based on peoples’ view that the process and outcome of privatization is illegitimate. Thus, support for
revising privatization should not be equated with support for re-nationalization.
We develop a simple framework for analyzing responses to this question in light of two possible
reasons for supporting the revision of privatization: a concern for the legitimacy of privatization or a
preference for state over private property.2
Our study is distinctive in that the construction of the LiTS question about individual support for
privatization permits us to go beyond previous empirical studies which have tended to focus only on the
determinants of support for and opposition to privatization. By examining a broader range of possible
responses, we gain greater insight into the sources of support for revising privatization, i.e., we examine
why respondents hold their views. In particular, we differentiate between those supporters of revision of
privatization who would like to leave assets in state hands and those who would like to revise
2 We adopt a minimalist notion of the legitimacy of privatization outcomes. Respondents who favored
levying taxes on new owners or re-privatizing privatized assets using a more transparent process are
thought to be motivated by concerns over legitimacy.

4
privatization, but ultimately opt for private property. This is important because whether respondents are
motivated by material preferences for state property or by concerns over the legitimacy of privatization
has implications for theory and for policy. For example, if support for revising privatization is due to
relative losses from returns to human capital in a reformed economy, then retraining programs that
improve skills can be effective. Whereas, if support for revising privatization is driven by concerns for
legitimacy, then redistribution of income or privatized assets themselves may be unavoidable (Alesina
and Rodrik 1994).3
We examine how respondents’ endowments of human capital, assets, employment history and
experience during transition affect individual support for revising privatization and explore whether
individual attitudes towards privatization outcomes are due to their personal interest or concerns over the
legitimacy of privatization. Controlling for country-level variation with country fixed effects and for
various individual characteristics (including household expenditure, location and labor market status as of
2006), we find that respondents with human capital specific to an economy dominated by state ownership
favor revising privatization.4 They hold this view primarily due to expectations of greater relative returns
3 The mere threat of revising privatization out of concerns for legitimacy is a critical issue for efficiency.
If the public views current owners of privatized property as illegitimate, owners anticipate the possibility
of expropriation ex post and refrain from making productive investments. This, in turn, further increases
public support for expropriation. In the more corrupt countries of the region (such as Russia and Ukraine),
political elites have used public sentiment of illegitimacy of privatization to redistribute assets to
themselves or their supporters. As these property redistributions do not increase the legitimacy of new
owners, the specter of “permanent re-distribution” from one owner to another dramatically weakens
private property rights (e.g., Hellman 2002 or Sonin 2003).
4 Country fixed effects are to control for the differences in institutions, social norms and privatization
procedures in the sampled countries. The interaction between institutions, preference towards state
property and legitimacy concerns in shaping attitudes towards privatization is an important future
research agenda.

5
to their specific human capital in an economy with extensive state ownership as re-nationalization is
expected to reverse wage decompression at least partly associated with privatization (Milanovic 1999).
We also find that work trajectories during transition affect evaluations of privatization. The more
years respondents worked in the state sector during transition, the more likely they favor revising
privatization due to concerns over legitimacy, presumably because they believe that they failed to obtain
their fair share from the initial round of privatization. At the same time, both a move to self-employment
and small entrepreneurship (from the old sector and non-employment) and the experience of working in
the private sector strengthen the preference for private over state property, but do not significantly affect
attitudes towards revising privatization because of increased concerns over the legitimacy of
privatization.5
A history of sustained economic hardships during transition (e.g., food cuts, forced asset sales,
and wage cuts) is associated with greater support for revising privatization, and the support comes from
both sources. Respondents who experienced these hardships prefer state property and they believe that
privatization was illegitimate.
Finally, we find that skills suited to market economy can boost support for privatization even
among individuals with good reason to oppose it. For example, older workers with skills more suited to a
market economy are less likely to support revising privatization than older workers whose skills are
poorly suited for a market economy. This finding not only emphasizes the importance of skills as a
determinant of attitudes towards economic reform; it also provides some optimism that retraining
programs may bolster support for privatization.
5 We focus on those who moved to self-employment and small-scale entrepreneurs among the mass
public rather than the rent-seeking oligarchs from privatized big businesses emphasized by Hellman
(1998). The LiTS (like any other survey of mass public) does not have oligarchs in the sample. Note that
we do not equate new entrepreneurs with the wealthy as we control for income and assets, although in the
vast majority of countries those who moved to self-employment and entrepreneurship are in the upper
quintiles of per capita household income distribution.

6
We proceed by presenting data and an analytical framework to understand support for revising
privatization in Section 1. We then present our hypotheses and empirical methodology in Section 2 and
discuss our results in Section 3. Section 4 describes robustness checks. Conclusions are presented in
Section 5.
1. Public Support for Revising Privatization: Data Summary and Analytical Framework
To study public support for revising privatization, we rely on the “Life in Transition Survey”
(LiTS).6 Face-to-face interviews were conducted for a representative sample of 1,000 individuals in each
of 28 post-communist countries in Europe and Central Asia.
We focus on responses to the following question from LiTS:
“In your opinion, what should be done with most privatized companies? They should be…
(1) Left in the hands of current owners with no change
(2) Left in the hands of current owners provided they pay privatized assets’ worth
(3) Renationalized and kept in state hands
(4) Renationalized and then re-privatized again using a more transparent process.”
Table 1 here.
6 For technical details of the survey, see EBRD (2007 a, b). The exact list of countries included in the
study is as follows: Albania, Armenia, Azerbaijan, Belarus, Bosnia and Herzegovina, Bulgaria, Croatia,
Czech Republic, Estonia, FYR Macedonia, Georgia, Hungary, Kazakhstan, Kyrgyzstan, Latvia,
Lithuania, Moldova, Mongolia, Montenegro, Poland, Romania, Russia, Serbia, Slovak Republic,
Slovenia, Tajikistan, Ukraine, and Uzbekistan.

7
Table 1 summarizes responses to this question.7 In sum, twenty nine percent of respondents
preferred re-nationalization and leaving property in state hands. Seventeen percent of respondents
supported re-nationalization followed by privatization to new owners using a more transparent
process. Thirty-five percent of respondents favored leaving property in the hands of the current owners
provided they pay what the privatized assets are worth. And a little over nineteen percent of respondents
favored the status quo of leaving privatized assets in the hands of current owners with no additional
payments. The support for revising privatized property varies considerably across countries. Re-
nationalization and keeping companies in state hands is strongly preferred in Central Asia and the South
Caucasus (between 40% in Armenia and about 52% in Uzbekistan). The highest support for re-
nationalization followed by re-privatization using a more transparent process is observed again in the
South Caucasus and in Croatia. In contrast, respondents in Albania, Bulgaria, the Czech Republic,
Hungary, Montenegro, Romania, and Serbia have a strong preference for leaving property with current
owners, provided that they pay what the privatized assets are worth (between 48% in Bulgaria and 53% in
Romania). The least support for revising privatization is found in Belarus, Estonia, and Mongolia, where
47, 44, and 37% of respondents, respectively, support leaving most privatized companies in the hands of
current owners without any change.
The four alternative answers to this question shed light on why respondents support or oppose
privatization.8 We distinguish between two possible arguments for the revision of privatization: a
7 This question allows us to identify different sources of support for revising privatization, but has several
shortcomings. It refers to “most” privatized enterprises rather than identifying a specific threshold. In
addition, response 2 does not indicate the size of the payment. Finally, the question would benefit from a
filter question that would ask whether anything should be done to privatized firms. The ordering of the
responses mitigates this final concern somewhat by offering the status quo as the first response.
8 The construction of the question does not allow us to make a strong distinction between those concerned
about the legitimacy of the process of privatization and those concerned about the legitimacy of the
outcome of privatization, although response 2 is closer to the latter and response 4 is closer to the former.

8
preference for state over private property and a concern about the legitimacy of privatization.9 In
particular, one could support revising privatization because the policy was illegitimate even though one
prefers private to state property; then, one would opt for a revision of privatization that leaves property in
private hands, i.e., choose alternatives (2) or (4). One could also favor the revision of privatization purely
due to a preference for state property, and, therefore, choose alternative (3).10
It also does not allow us to draw conclusions about mass preferences over revising the privatization of
different types, e.g., manufacturing versus natural resource sector firms. These are topics for future
research.
9 Our research is related to literature that views social welfare policies through the interplay of economic
individualism and collective responsibility (c.f., Hasenfeld and Rafferty 1989). For instance, early
research indicates that the two most dominant social ideologies that shape individual attitudes towards the
welfare state are material self-interest and/or preference for social equality and fairness (Prothro and
Grigg 1960; Huber and Form 1973; Robinson and Bell 1978). Importantly, the two dimensions are not
orthogonal as people tend to adopt social ideologies that are closer to their life experiences.
10 A preference for state property could arise for ideological reasons as one could believe that state
property is superior to private property in general or, alternatively, because one could personally benefit
from moving property to state hands. The question on revision of privatization does not allow us to
differentiate between the two underlying reasons directly. In unreported analyses, we include
respondents’ attitudes toward a market economy, democracy, the preferred extent of state ownership of
large companies, as well as perceptions of government as regressors to control for ideology. Obviously,
these variables may be endogenous to respondents’ views about revising privatization. Nonetheless, if we
include these variables in the list of regressors, the results for education, wealth, and ownership of
property become somewhat less pronounced (as one would expect because of omitted ideology in these
regressions), while the results for transition-related variables are unaffected. In this paper we do not
control for these ideological background variables due to concerns for endogeneity, but it is comforting to
know that our results are robust to their inclusion.

9
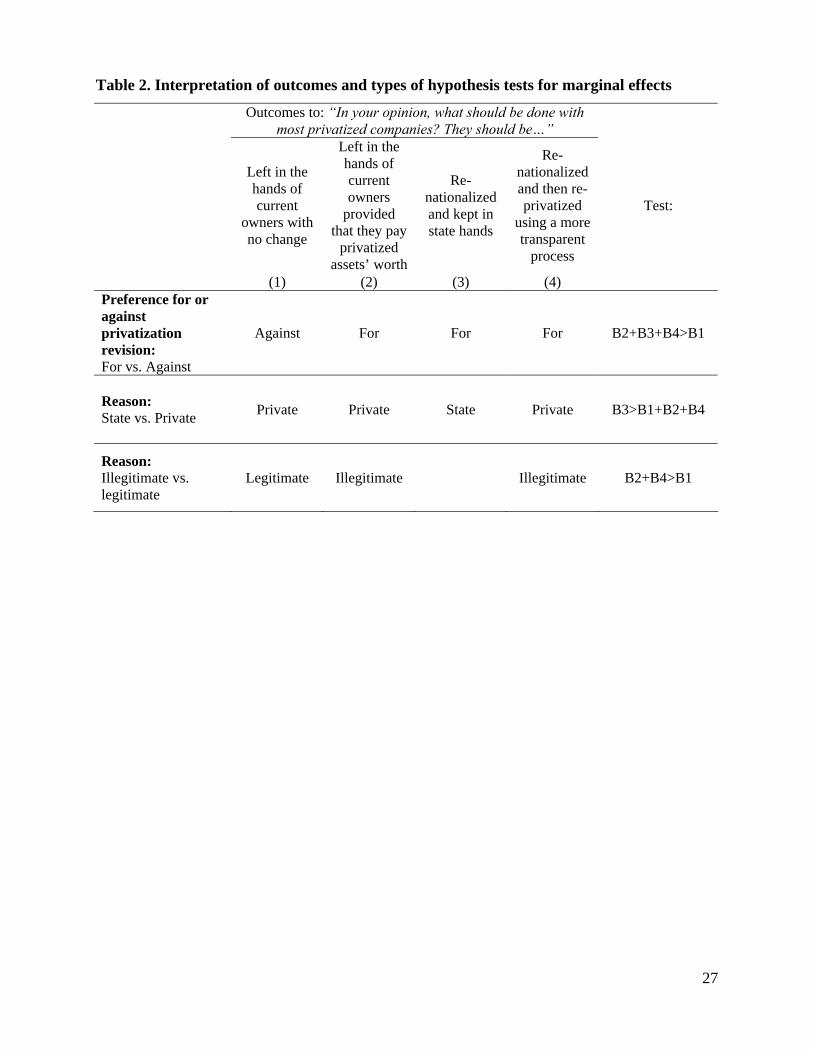
Table 2 summarizes our interpretation of the four alternative answers. We consider individuals
who want any type of change in privatization (those choosing alternative (2), (3), and (4) over (1)) as
favoring the revision of privatization, while individuals who favor leaving property in private hands with
no change (alternative (1) over (2), (3), and (4)) as opposing the revision of privatization. Further, we
treat individuals who support re-nationalization and leaving property in the hands of the state (alternative
(3) over (1), (2), and (4)) as preferring state property to private property. Finally, it is difficult to know
what individuals, who support re-nationalization and leaving property in state hands, think about the
legitimacy of privatization. Yet, the data allow us to infer the assessment of the legitimacy of privatization
by those who ultimately prefer private property. We consider individuals who favor leaving privatized
assets in the hands of the current owners provided that they pay what the assets are worth (alternative (2))
and individuals who chose re-nationalization followed by re-privatization using a more transparent
process (alternative (4)) as being more concerned about the legitimacy of privatization compared to
individuals who support the status quo (alternative (1)).11
Table 2 here.
2. Methodology
2.1. Hypothesis Testing
We seek to identify the determinants of attitudes towards privatization by running multinomial
cross-section regressions of the type:
, (1) 11 The different motivations for revising privatization are not mutually exclusive: one could favor revising
privatization based on legitimacy concerns and also due to a preference for state property. The survey,
however, allowed only one answer to the question on revision of privatization. Therefore, we cannot
observe multiple motivations for each individual. We can observe multiple motivations for a group of
individuals, however, as we observe the shares of people from a particular group (country, PSU) choosing
among the four alternatives.

10
where i indexes the 28,000 individuals. Yi is a four-category response to the revision of privatization
question. The outcomes, denoted by k, are the alternative answers: (1) leave in the hands of current
owners without any change; (2) leave in the hands of current owners and pay what the assets are worth;
(3) re-nationalize and keep in state hands; (4) re-nationalize and then re-privatize. Yi is treated as a
multinomial variable. Xi denotes a vector of explanatory variables discussed below, and εik is an error
term. We estimate equation (1) using the Huber-White sandwich estimator of variance to take individual-
specific heteroskedasticity into account. In addition, we cluster error terms by primary sampling units
(PSUs) – fifty in each country – to adjust the standard errors for intra-PSU correlations.12
Denote Bk to be the estimated marginal effect of the influence of variable Xi on the probability of
choosing outcome k from the multinomial dependent variable Yi, k=1,2,3,4:
.
Based on the results of the estimation, we compute marginal effects on probabilities (Bk) and conduct the
following three types of hypothesis tests for each of the explanatory variables of the vector Xi (as
summarized by the last column of Table 2).
Test 1: Preference towards the Revision of Privatization.
We say that a particular characteristic Xi increases the preference towards revising privatization if we
observe the following relationship between the estimated marginal effects:
B2 + B3 + B4 > B1. (2)
12 The sample selection in LiTS consisted of two stages. First, 50 primary sampling units (PSUs) were
randomly selected in each country, based on information from the most recent census in the country.
Second, 20 households were selected at random from each PSU. Within each household, the head of the
household (or another knowledgeable household member) responded to the questions on aspects of
material well-being, while for the other questions one household member (aged 18 or over) was randomly
selected to respond.

11
Conversely, if B2 + B3 + B4 < B1, then the variable Xi is said to decrease support for revising
privatization.
Test 2: Preference for State Property.
We say that a characteristic Xi is associated with stronger preference for state over private property if:
B3 > B1 + B2 + B4. (3)
Conversely, if B3 < B1 + B2 + B4, then Xi strengthens the preference for private over state property.
Test 3: The Illegitimacy of Privatization.
We say that Xi is associated with the perception that privatization was illegitimate if:
B2 + B 4 > B1. (4)
Conversely, if B2 + B4 < B1, then Xi strengthens the view that privatization was legitimate.
For all the tests, we apply standard tests for the equality of coefficients.
2.2. Explanatory Variables
We assess the impact of individual characteristics on attitudes toward revising privatization
taking the institutional environment and all other country characteristics as given by including country-
level fixed effects. Conceptually, we focus on two groups of explanatory variables: (i) human capital,
such as skills, education, age, and health and (ii) transition experiences, including labor market history
and the extent of economic hardships during transition.13 In the next section, we discuss the theoretical
predictions about the effect of these groups of variables and present the results.
13 Some questions in the survey are rather demanding and the technical appendix of the survey indicates
that some respondents asked for help from the interviewer in describing their employment history and
occupation. This may introduce interviewer bias into the responses, especially for respondents with less
education. We control for education in all our analyses. Moreover, we examined the distribution of
responses for occupations in one comparable data set from Russia. The Russian Longitudinal Monitoring
Survey (RLMS) applies a different methodology but produces results similar to the LiTS.

12
In all specifications, we control for asset endowments, such as ownership of property and wealth;
and a host of individual level characteristics including the respondent’s gender, location of residence
(rural vs. urban vs. metropolitan area), religion, whether the respondent belongs to an ethnic minority,
labor market status in 2006 (employed vs. unemployed). As mentioned above, we also control for the
country of residence with country dummies. To sum up, we use the following vector of covariates Xi from
equation (1) in our baseline specification:
Xi = [HCi, Ti, Wi, Ci, FCi]. (5)
HCi denotes a set of human capital individual-level variables, Ti represents transition experiences,
Wi denotes the assets endowments, Ci represents other individual controls, and FCi stands for country-
specific dummies. All variables are described and summarized in Tables A1 and A2 in Appendix A. As a
refinement of the baseline estimation, we also include interactions of selected individual-level
characteristics with the vector of covariates.14
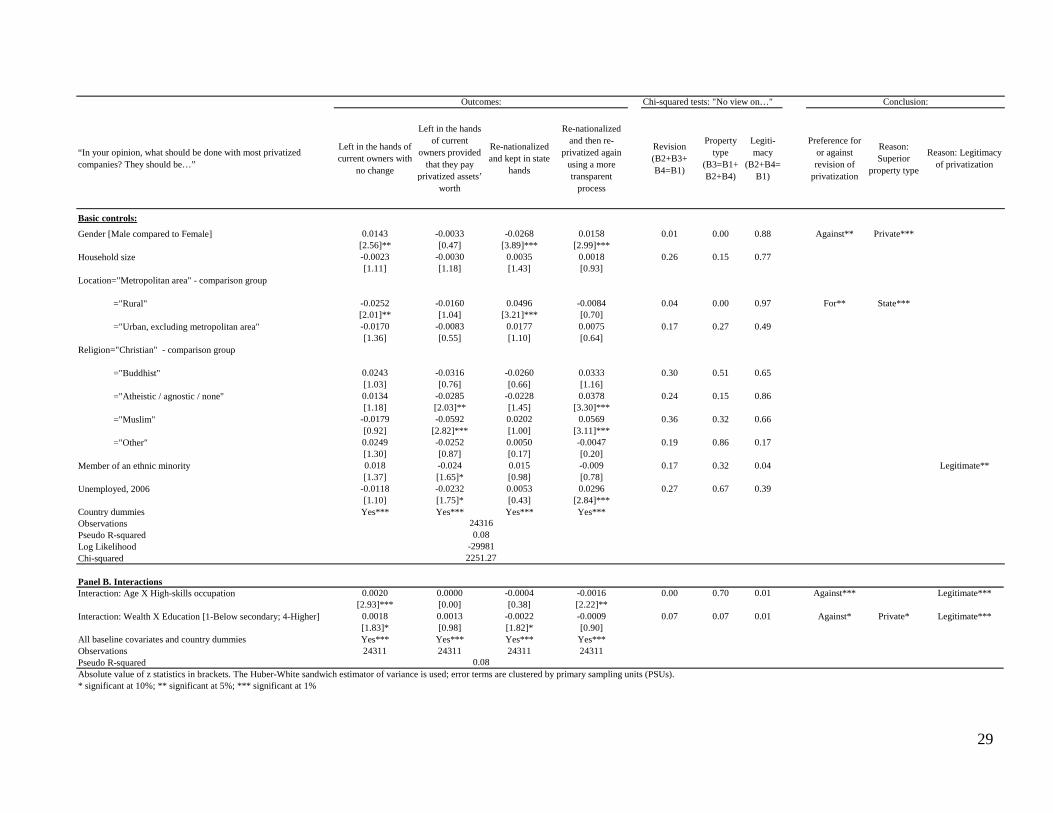
Table 3 presents the results of our empirical estimation. Panel A of Table 3 presents the results of
an estimation of the baseline equation (1) which focuses on the direct effect of individual-level variables
controlling for institutional environment with country fixed effects. Panel B of Table 3 presents
abbreviated results of a similar regression with interaction terms of individual-level variables. In all of
Table 3 columns 2 to 5 report the estimated marginal effects for the four outcomes of the dependent
variable, with z-statistics in brackets. The next three columns report p-values of the tests described in
Section 3.1. The last three columns present the implications of these tests. In particular, the ninth column
reports whether a particular characteristic in Xi has an effect on the preference for or against revising
privatization. The next column reports the results of the tests of whether this component of Xi makes
respondents more likely to favor revising privatization based on their preference for state versus private
property. Similarly, the last column presents results of testing whether or not Xi affects respondents’
14 We deliberately focus only on regressions with country fixed effects because analysis of cross-country
correlations suffers from unobserved country-level heterogeneity.

13
considerations of the legitimacy of privatization. If there are no statistically significant results, the cells
are left blank in these three “conclusion” columns.
3. Who Supports Revising Privatization and Why?
In this section, we present our hypotheses and the results of our empirical tests about the
individual-level determinants of support for revising privatization and of the motives behind the
individual support for revising privatization. First, we consider in turn the direct effects of human capital,
transition experiences, and wealth. And second, we highlight how human capital and wealth effects
interact.
3.1. Individual Endowments of Human Capital
The self-interest argument suggests that individuals with higher skills and better opportunities to
take advantage of transition are expected to express greater support for privatization and oppose its
revision (see Kaltenthaler et al. 2006). Groups with skills and networks specifically developed for an
economy dominated by state-owned firms may have strong incentives to oppose privatization fearing
diminished career opportunities. For instance, older people are expected to have a vested interest against
privatization because the private sector is known to provide relatively lower, if any, return to the
experience obtained during the pre-reform period, while the state sector is known to provide positive
returns to experience (e.g., Brainerd 1998).15 In sum, older, less healthy, less educated, and less skilled
individuals are expected to be especially strong supporters of revising privatization based primarily on
how it shapes their economic prospects; and, therefore, their views are motivated by their relative gains
from state versus private property.
There is no clear-cut prediction about how human capital is related to the likelihood that a
respondent evaluates privatization based on concerns for legitimacy. One might expect respondents with
15 In labor market studies, age – being a proxy for experience – is positively associated with human
capital (e.g., Willis 1986). As workers gain experience, they accumulate human capital. This relationship
is less pronounced in the post-communist countries because the older workers were trained in skills that
are far less applicable to current market conditions.

14
higher education to have greater information and, therefore, capacity to judge the process and outcome of
privatization. If so, the effect of human capital on views about revision of privatization may depend on
the actual privatization process in the country.
We measure human capital by the highest educational degree obtained by the respondent (ranking
from no degree to post graduate degree), age, self-reported health status, and by the skill-type of the
respondent’s occupation in 200616.
As reported in Table 3, we find that the human capital variables are generally good predictors of
attitudes toward revising privatization. Age is positively associated with support for revising
privatization. Older respondents express this preference due to their support for state property. A 10-year
increase in the age of a respondent increases the probability of support for revising privatization by 0.9
percentage points, and for re-nationalization as a means of revising privatization by 1.9 percentage points.
The result is consistent with the self-interest argument as older respondents have accumulated skills more
relevant for the state sector than for the private sector (Guriev and Zhuravskaya 2009). Interestingly, age
is not related to a belief that privatization should be revised based on concerns for legitimacy.
Skills have a similar effect. Workers with low skills tend to favor revising privatization, and the
reason respondents hold this view is their support for state property. Holding a low-skilled occupation
increases the probability of supporting the revision of privatization by 1.8 percentage points, and of
supporting a re-nationalization that leaves assets in state hands by 5 percentage points compared to the
rest of the respondents. Skills (measured by occupation) are unrelated to concerns for the legitimacy of
privatization as well. In addition, individuals in poor health are more likely to favor revising privatization.
They also hold this view for the reason that they favor state property over private while having no clear
view on the legitimacy of privatization.
The relationship between education and attitudes toward revising privatization is somewhat more
complex because the level of education in transition economies does not necessarily reflect the possession
16 LiTS provides data on occupation for those who worked for wages in any of the years 1989-2006. We
distinguish between occupations requiring high skills and occupations requiring low or medium skills.

15
of skills specific to a market economy. The most clear-cut pattern in the effects of education is that the
educational level monotonically increases concerns over the legitimacy of privatization. Presumably, this
is because more educated individuals are more aware of the actual process of privatization. Respondents
with higher education (i.e. university, college, or postgraduate degree) have a strong preference for
private property compared to the rest of the population. There is no difference in preferences for state or
private property among respondents with different educational levels below higher education. For
example, the probability that a respondent with a higher degree supports a re-nationalization that leaves
assets in state hands is 4.1 percentage points lower than for a secondary school graduate. As a result of the
interplay of the two motivations respondents with a high school (i.e. secondary) degree are significantly
more likely to support revising privatization than respondents with less than secondary education (due to
legitimacy considerations). In contrast, they are less likely to support revision of privatization than
respondents with professional and vocational training (due to both reasons). And they are equally likely to
support privatization revision as respondents with higher education (but for a different reason: high school
graduates are less in favor of private property, but also consider privatization as more legitimate
compared to college graduates). 17
In sum, individuals with human capital suited for an economy with extensive state ownership
(i.e., old, less healthy and low-skilled individuals) are especially likely to favor revising privatization and
are likely to hold this view due to a preference for state property rather than due to legitimacy
considerations.
3.2. Individual Transition Experience
Individuals may also use their personal experience during transition as a metric for evaluating
privatization. Individuals who adjusted poorly to the new economic conditions, i.e., those who
experienced sustained periods of wage cuts or food cuts, may attribute their hardships to the reform
17Results from Latin America are inconclusive about the link between education and support for
privatization (Boix 2005, Graham and Sukhtankar 2004, Lora and Panizza 2003, Panizza and Yanez
2006).

16
process in general or to privatization in particular and are likely to favor revising it. Similarly,
respondents whose career trajectories were negatively affected by the transition – those who held many
jobs, or failed to move from working in the state sector to entrepreneurship – are also likely to blame
privatization for their woes and support revision. In sum, individuals experiencing significant economic
losses or negative career trajectories during the transition may support revising privatization and may hold
this view for two reasons. If they expected re-nationalization to put an end to their losses, they would
have a preference for state ownership; and if they attributed their losses to inequities in the process of
privatization, they would support revising privatization due to legitimacy concerns.
LiTS data enable us to reconstruct each individual job trajectory since 1989. We observe whether
the respondent worked for wages (in the state or private sector, in a high- or low-skill occupation), was
self-employed or an entrepreneur, or was not employed in each year between 1989 and 2006. To identify
the impact of individual job trajectories for each respondent, we calculate the number of jobs held since
1989, the number of years working in the state sector, the number of years working in the private sector,
and a number of variables reflecting the direction of changes, i.e., moves from state to private sector, from
low-skill to high-skill occupation, and from being an employee or non-employed to self-employment and
entrepreneurship.
With one notable exception – i.e., the number of years worked in the state sector – employment
trajectories are not significantly related to the support for revising privatization. They do, however, shape
whether respondents evaluate privatization based on a preference for property type or concerns for
legitimacy. For example, the longer an individual worked for wages in either the state or private sector,
the more likely she is to view privatization as illegitimate. Despite this concern, work in the private sector
does not diminish support for private property: the longer a respondent worked for wages in the private
sector, the more likely she is to favor private property. As a result, the two motivations cancel each other
out: private sector veterans do not express significant support for or against revising privatization. The
probability of opposing state property increases by 3 percentage points for each ten year increase in work
experience in the private sector. The result is not symmetric for those working in the state sector: the
length of work in the state sector is not associated with stronger preferences towards state property, but it

17
is the only career trajectory variable that directly predicts support for revising privatization. A ten-year
increase in state sector employment decreases the probability of recognizing the status quo privatization
outcome by 2.3 percentage points. The main reason behind this stance is the perceived illegitimacy of
privatization.
Job turnover, changes in the level of occupation and in the type of ownership of enterprises where
the respondents worked, do not have a significant effect on attitudes towards the revision of privatization,
private vs. state property, or the legitimacy of privatization once we control for the level of skills and the
years of experience in the state and private sectors.18 In contrast, opening one’s own business (i.e., the
move to self-employment and entrepreneurship) has an important and robust effect: small business
owners are strongly in favor of private property (compared to those who did not become entrepreneurs).
The probability that they oppose re-nationalization is 7.1 percentage points higher compared to all other
respondents. Small business owners’ preferred policy is to levy additional taxes on current owners of big
privatized firms (they are 5.4 percentage points more likely to choose this option compared to similar
non-entrepreneurs).
In addition, we examine the impact of important economic hardships during transition, such as
the number of years that the respondent experienced wage cuts, food cuts, or needed to sell household
assets. Individuals who experience extensive economic losses related to transition are significantly more
likely to favor revising privatization. An additional year of wage cuts or wage arrears decreases the
probability of recognizing the status quo privatization outcome by 0.6 percentage points, and an
additional year of having to sell household assets decreases this probability by 0.7 percentage points. An
additional year of having to cut down on basic food consumption increases support for revising
privatization by 0.4 percentage points. Moreover, individuals, who incurred economic losses in the form
of wage cuts, asset sales and cuts in basic food consumption, tend to hold this view due to both concerns
18 We omit variables that reflect moves between private and state sector employment and high- and low-
skilled jobs from the list of regressors because they have no significant impact themselves and have no
effect on coefficients of other explanatory variables.

18
about the legitimacy of privatization and a loss of confidence in private ownership. Respondents who
endured long periods of economic hardships prefer state ownership and perceive privatization as
illegitimate.19
In sum, individual transition-related experience is a significant determinant of public views
toward revising privatization. Experience of work in the state sector increases support for revising
privatization due to concerns about the legitimacy of privatization. Those who experienced transition-
related hardships support revising privatization on grounds of both a concern over legitimacy and a
preference for state property.
3.3. Asset Endowments
Ownership of a home or apartment is strongly associated with opposition to revising privatization
and this view is driven solely by a preference for private property. Respondents moving up the income
ladder relative to 1989 strongly oppose the revision of privatization and the main reasons behind this view
are a preference for private property and a perception of privatization as legitimate. The overall effect of
wealth on revising privatization is ambiguous due to the two counteracting effects: wealthier people tend
to prefer private property and view privatization as illegitimate.20
It is worth noting that some control variables have a significant effect as well. Males are more
likely to support private property, and rural households are more likely to back state property compared to
metropolitan households. These factors are significantly related to support for the revision of privatization
19 Notice that the statistical significance level that those who experienced hardships in the form of asset
sales view privatization as illegitimate is 11%.
20 In LiTS upper-income individuals are likely to belong to the middle class rather than to the upper class
because of the relatively high income inequality in transition countries and the inherent under-
representation of the upper class in individual and household surveys (Deaton 2005). Therefore the
impact of wealth on the perception over legitimacy of privatization may actually be u-shaped with the
middle class at the bottom of the curve.

19
in rural areas and opposition to the revision of privatization among males. In addition, members of an
ethnic minority are significantly more likely to view privatization as legitimate.
3.4. Interactions
In addition to the analysis of direct effects of individual characteristics, we examined their
interactions. Panel B of Table 3 highlights the two most interesting interaction effects: (1) between age
and skills and (2) between wealth and education. An increase in respondents’ skills reduces the effect of
age on support for the revision of privatization: older respondents have a less negative view of the status
quo privatization outcome as compared to younger respondents when their skills are high. This result
suggests that the opportunities gained by possessing higher skills offset the negative effect of age.
In addition, an increase in the respondent’s level of education leads to an increase in the effect of
wealth on the likelihood of support for the status quo. This view is driven by a greater increase in the
perception that privatization was legitimate among educated wealthy individuals compared to uneducated
wealthy individuals. More broadly, these results underscore the importance of human capital suitable for a
market economy for the legitimacy of privatization.
In an earlier paper, Denisova et al. (2009) examined how the individual support for revising
privatization is affected by the interaction between market skills and institutions, showing that market
skills decrease support for revising privatization only in countries with good institutions. As Denisova et
al. (2009) do not consider the reasons for support of revising privatization; we also tested whether the
individual determinants of the reasons of support for revising privatization systematically depend on
country’s institutional environment or privatization methods and found no robust effect.
4. Robustness Checks
Our results are robust to several alternative specifications, including different estimation
techniques, different specifications, and different sets of covariates.21 As alternatives to the multinomial
logit estimation, we employed multinomial probit estimation. The results remained unaffected. We also
21 The results of all robustness checks are available from the authors upon request.
20
experimented with other specifications (such as combining the four responses into two categories and
running simple probit, logit, and OLS regressions) and the results did not change significantly.
We also experimented with an alternative definition of opposition to privatization on the grounds
of legitimacy concerns: only those who opt for renationalization and then re-privatization using a more
transparent procedure are considered to have legitimacy concerns. The definition of perceived
illegitimacy is thus restricted to a relatively more ‘illegitimacy intensive’ case. In technical terms, this
changes the test from B2+B4=B1 to B4=B1. The main results are robust to the change in the definition,
with the noticeable changes in the perception of the legitimacy of privatization among older and less
healthy respondents (they are distinct from the reference group according to the new definition and view
privatization as illegitimate) and university degree holders and private sector veterans (they are not
different from the reference group based on the new definition of legitimacy concerns).
In the baseline specification, we adjust the standard errors to allow for clusters in error terms
within PSUs to account for intra-PSU correlation. Alternatively, we have also added PSU fixed effects
(i.e., dummies for each PSU) dropping the location variables and the country dummies. The effects of
interest remain robust to this specification with one notable exception: after controlling for PSU fixed
effects, correlation between the perception of illegitimacy of privatization and transition-related hardships
disappears. This, however, is explained by the fact that many transition-related hardships are PSU-
specific rather than individual-specific.
We apply a weighting scheme for the summary statistics to account for the fact that the LiTS data
turned out to be biased towards elderly and female respondents due to non-responses even though the
sample was originally constructed to be representative. In the baseline regressions we do not apply this
weighting scheme, but instead, introduce controls for age and gender. When we use the weights in the
regression analysis, the results do not change.
We repeated our empirical exercise for each country individually to examine country-specific
patterns. As for the human capital and assets variables, the significance of the results varies somewhat
across countries, but, qualitatively, the results are broadly consistent across countries. In contrast, we do
find some differences across countries for the effects of career trajectories and transition hardships. These

21
differences, however, are consistent with the results reported in Denisova et al. (2009) and concern only
the overall support for privatization, rather than the underlying reasons for it, which is the main focus of
our analysis. In addition, the results are robust to dropping the two most authoritarian countries –
Uzbekistan and Belarus – from the sample.
5. Conclusion
Our analysis suggests several broader conclusions. First, dissatisfaction with privatization should
not be equated with a preference for state property. Public support for revising privatization in the post-
communist world is broad and deep. More than 50 percent of the population in each of the 28 countries
and over 80 percent of all respondents support some form of revision of privatization from levying
additional taxes on current owners of privatized assets to the full expropriation and re-nationalization of
assets. However, only 36 percent out of those 80 who support revision of privatization (29 percent of all
respondents) hold such a view because of their preference for state ownership, the remaining 64 percent
of supporters of privatization revision (a little over one half of all respondents) prefer private property
despite their support for privatization revision. Such views are due to a massive discontent with the
process and outcome of privatization in transition countries.
Thus, it is important not only to identify factors that influence respondents’ preferences over
revising privatization, but also to explore their underlying motives for holding these views.
Discriminating between these motivations is important as they suggest very different policies to increase
the legitimacy of privatization. Some oppose privatization because they prefer state ownership, which in
turn could be rooted in ideology or personal interest. Others favor private property in principle, but
oppose privatization because it resulted in an illegitimate distribution of wealth. When public support for
the revision of privatization is rooted in relative losses from declining returns to human capital (as is the
case for less skilled and long-time state sector workers), then retraining programs designed to match skills
with demand from the new market sectors may prove to be an effective tool. In contrast, when public
support for the revision of privatization is driven by concerns of legitimacy, and this is the case for the
majority of population of transition countries, governments may have to revise privatization results

22
through policies ranging from redistributive taxation to expropriation of current owners of privatized
assets which necessarily generate distortions in the investment decisions of current owners.
We find that human capital poorly suited for a market economy with private ownership, lack of
privately owned assets, economic hardships during transition and exposure to work in the state sector
significantly increase support for revising privatization. The lack of human capital and private assets
affect the support for revising privatization primarily via a preference for state property over private
property; whereas work in the state sector mainly influences support for revising privatization due to the
perceived illegitimacy of privatization; and transition-related hardships shape support for revising
privatization via both a preference for state property and the perceived illegitimacy of privatization. These
results suggest the value of analyses that not only link respondent traits with support for policy, but that
also probe the motivations that underpin this support. Whether these results extend to other dimensions of
economic reform or to other regions of the world is an open question, but analyzing how material
interests, perceptions of legitimacy and institutions interact is an important research agenda for the future.
Two optimistic lessons emerge from our analysis for those who are concerned about the
consequences of revising privatization. First, while support for revising privatization in the region is very
high, about 70 percent of respondents ultimately support private property. Second, most of the support for
the revision of privatization due to illegitimacy comes from negative personal experiences during the
transition, and these transition experiences are likely to play a smaller role in shaping attitudes over time.

23
References
Alesina, Alberto and Rodrik, Dani (1994) “Distributive Politics and Economic Growth,” Quarterly
Journal of Economics, Vol. 109(2), pp. 465-90.
Brainerd, Elizabeth (1998) “Winners and Losers in Russia's Economic Transition,” American Economic
Review, vol. 88(5), pp. 1094-1116.
Boix, Charles (2005) “Privatization and Public Discontent in Latin America,” Paper prepared for Inter-
American Development Bank, Sustainable Development Department, pp. 1-31.
Deaton, Angus (2005) “Measuring Poverty in a Growing World (or Measuring Growth in a Poor World),”
Review of Economics and Statistics, vol. 87(1), pp. 1-19.
Denisova, Irina, Markus Eller and Ekaterina Zhuravskaya (2010) “What Do Russians Think about
Transition?” Economics of Transition, Volume 18(2), 2010, pp. 249-280.
Denisova, Irina, Markus Eller, Timothy Frye and Ekaterina Zhuravskaya (2009) “Who Wants to Revise
Privatization? The Complementarity of Market Skills and Institutions,” American Political Science
Review, Volume 103 (2), May, pp. 284-304.
Dewatripont, Mathias and Gérard Roland (1992) “The Virtues of Gradualism and Legitimacy in the
Transition to a Market Economy,” The Economic Journal, vol. 102, pp.291-300.
Di Tella, Rafael, Sebastian Galiani and Ernesto Schargrodsky (2008) “Reality versus Propaganda in the
Formation of Beliefs about Privatization,” NBER Working paper 14483.
Duch, Raymond M. (1993) “Tolerating Economic Reform: Popular Support for Transition to a Free
Market in the Former Soviet Union,” American Political Science Review, vol. 87(3), September, pp.
590-608.
Duch, Raymond M. (1995) “Economic Chaos and the Fragility of Democratic Transition in Former
Communist Regimes,” Journal of Politics, vol. 571(1), February, pp. 121-158.
EBRD (1997) (1999) (2007b) Transition Reports, European Bank for Reconstruction and Development,
London.
EBRD (2007a) “Life in Transition, A Survey of People’s Experiences and Attitudes,” London, European
Bank for Reconstruction and Development, May 2007.
Frye, Timothy (2006) “Original Sin, Good Works, and Property Rights in Russia,” World Politics, vol.
58(4), pp. 479-504.
Frye, Timothy (2007) “Property Rights and Property Wrongs: Evidence from a Survey-Based Experiment
in Russia,” American Economics Association Annual Meeting. Chicago, IL, pp. 1-32.

24
Graham, Carol and Sandip Sukhtankar (2004) “Does Economic Crisis Reduce Support for Markets and
Democracy in Latin America? Some Evidence from Surveys of Public Opinion and Well Being,”
Journal of Latin American Studies, vol. 36, pp. 349-377.
Guriev, Sergei and Ekaterina Zhuravskaya (2009) “(Un)happiness in Transition,” Journal of Economic
Perspectives, Volume 23(2), pp. 143-168.
Hasenfeld, Yeheskel and Jane A. Rafferty (1989) “The Determinants of Public Attitudes towards the
Welfare State,” Social Forces, Vol. 67(4), pp.1027-48.
Hellman, Joel (1998) “Winners Take All: The Pitfalls of Partial Reform,” World Politics, vol. 50 (2), pp.
203-234.
Hellman, Joel (2002) “Russia’s Transition to a Market: A Permanent Redistribution?” in Russia After the
Fall, ed. Andrew Kuchins, Washington, D.C., Carnegie Endowment for International Peace.
Hoff, Karla and Joseph E. Stiglitz (2004) “After the Big Bang? Obstacles to the Emergence of the Rule of
Law in Post-Communist Societies,” American Economic Review, vol. 94(3): pp. 753–763.
Hoff, Karla and Joseph E. Stiglitz (2008) “Exiting Lawlessness,” Economic Journal, vol. 118(531), pp.
1474-97.
Huber, Joan, and William Form (1973) “Income and Ideology: An Analysis of the American Political
Formula,” Free Press.
Kaltenthaler, Karl C., Stephen J. Ceccoli, and Andrew Michta (2006) “Explaining Individual-level
Support for Privatization in European Post-Soviet Economies,” European Journal of Political
Research, vol. 45, pp. 1–29.
Lora, Eduardo and Ugo Panizza (2003) “The Future of Structural Reform,” Journal of Democracy, vol.
14(2), April 2003, pp.123-137.
Milanovic, Branko (1999) “Explaining the Increase in Inequality During Transition,” Economics of
Transition, vol. 7(2), pp. 299-341.
Panizza, Ugo and Monica Yanez (2006) “Why Are Latin Americans So Unhappy about Reforms?”
Research Department, Inter-American Development Bank, July 2006, pp. 1-29.
Prothro, James and Charles Grigg (1960) “Fundamental Principles of Democracy: Bases of Agreement
and Disagreement,” Journal of Politics, Vol.22, pp.276-94.
Robinson, Robert and Wendell Bell (1978) “Equality, Success, and Social Justice in England and the
United States,” American Sociological Review, Vol.43, pp.125-43.

25
Rodrik, Dani, 1995. “The Dynamics of Political Support for Reform in Economies in Transition," Journal
of Japanese and International Economies, vol. 9(4), pp. 403-25.
Sonin, Konstantin (2003) “Why the Rich May Favor Poor Property Rights Protection,” Journal of
Comparative Economics, vol. 31(4), December, pp. 715-731.
Willis, Robert J. (1986) “Wage Determinants: A Survey and Reinterpretation of Human Capital Earnings
Function,” in Ashenfelter, O. and Layard P.R.G. (eds.) Handbook of Labor Economics, 1, pp. 45-50
Amsterdam: North Holland
World Bank. 2005. Infrastructure in Latin America and the Caribbean: Recent Developments and Key
Changes. Washington, D.C. World Bank.

26
Table 1. “In your opinion, what should be done with most privatized companies? They should be…”
Left in the hands of
current owners with no change
Left in the hands of current owners
provided that they pay privatized assets’ worth
Renationalized and kept in state hands
Renationalized and then re-privatized again using a more transparent process
Albania 15.2 51.7 14.5 18.7 Armenia 10.1 26.8 40.5 22.6 Azerbaijan 23.7 8.6 41.4 26.4 Belarus 46.7 25.8 20.4 7.1 Bosnia 13.7 43.4 25.0 17.9 Bulgaria 7.2 48.3 28.8 15.8 Croatia 6.0 41.0 23.9 29.1 Czech Republic 24.6 50.6 13.0 11.8 Estonia 44.4 22.6 22.4 10.7 FYR Macedonia 6.0 38.0 35.3 20.7 Georgia 23.2 14.0 30.9 31.9 Hungary 13.3 51.9 24.6 10.2 Kazakhstan 12.5 26.7 47.5 13.4 Kyrgyzstan 27.4 17.7 43.8 11.2 Latvia 26.4 40.4 19.1 14.2 Lithuania 26.8 38.3 17.6 17.3 Moldova 17.9 32.7 34.8 14.6 Mongolia 36.5 21.0 19.9 22.6 Montenegro 8.8 51.3 19.3 20.6 Poland 20.0 37.2 22.4 20.4 Romania 12.8 53.0 19.9 14.4 Russia 18.5 31.5 36.7 13.3 Serbia 11.0 50.7 20.0 18.3 Slovakia 17.1 39.9 34.2 8.7 Slovenia 31.4 36.6 12.4 19.6 Tajikistan 16.0 21.9 48.4 13.7 Ukraine 12.6 31.9 43.0 12.5 Uzbekistan 15.3 22.6 51.6 10.6 Total, % 19.4 34.8 29.0 16.7 Observations 5 412 9 697 8 077 4 654 Notes: We are applying a weighting scheme for these summary statistics to ensure that the population as a whole is represented, taking into account the age and gender distribution of the population in each country (see EBRD 2007a: 6). The reported percentages have Bernoulli distribution. Their standard errors depend on the actual percentage and the number of observations (1000 per
country); thus, they are equal to , where pi denotes the percentage points as reported in the table. The magnitudes of the SE indicate that if a difference between any two countries exceeds 3 percentage points, it is statistically significant. The result holds for each of the four alternatives.
27
Table 2. Interpretation of outcomes and types of hypothesis tests for marginal effects
Outcomes to: “In your opinion, what should be done with
most privatized companies? They should be…”
Left in the hands of current
owners with no change
Left in the hands of current owners
provided that they pay
privatized assets’ worth
Re-nationalized and kept in state hands
Re-nationalized and then re-privatized
using a more transparent
process
(1) (2) (3) (4)
Test:
Preference for or against privatization revision: For vs. Against
Against For For For B2+B3+B4>B1
Reason: State vs. Private Private Private State Private B3>B1+B2+B4
Reason: Illegitimate vs. legitimate
Legitimate Illegitimate Illegitimate B2+B4>B1

28
Table 3. Multinomial logit. Marginal effects reported.
“In your opinion, what should be done with most privatized companies? They should be…”
Left in the hands of current owners with
no change
Left in the hands of current
owners provided that they pay
privatized assets’ worth
Re-nationalized and kept in state
hands
Re-nationalized and then re-
privatized again using a more transparent
process
Revision (B2+B3+B4=B1)
Property type
(B3=B1+B2+B4)
Legiti-macy
(B2+B4=B1)
Preference for or against
revision of privatization
Reason: Superior
property type
Reason: Legitimacy of privatization
Panel A. B1 B2 B3 B4 p-value p-value p-value
-0.0009 -0.0009 0.0019 -0.0001 0.00 0.00 0.80 For*** State***[4.27]*** [3.39]*** [7.07]*** [0.35]-0.0175 -0.0184 0.0514 -0.0156 0.09 0.00 0.41 For* State***[1.69]* [1.43] [3.74]*** [1.59]
0.0243 -0.0197 0.0143 -0.0189 0.01 0.20 0.00 Against*** Legitimate***[2.64]*** [1.68]* [1.27] [1.98]**-0.0137 0.0026 0.0084 0.0027 0.08 0.39 0.23 For*[1.74]* [0.26] [0.86] [0.34]0.0027 0.0237 -0.0410 0.0146 0.76 0.00 0.04 Private*** Illegistimate**[0.31] [2.07]** [3.72]*** [1.68]*
-0.0157 -0.0048 0.0193 0.0011 0.00 0.00 0.12 For*** State***[3.92]*** [1.04] [4.36]*** [0.31]
-0.0019 -0.0103 0.0063 0.0059 0.62 0.19 0.73[0.49] [2.13]** [1.30] [1.51]
-0.0023 0.0024 0.0003 -0.0004 0.00 0.63 0.00 For*** Illegitimate***[3.78]*** [3.38]*** [0.49] [0.73]
0.0003 0.0025 -0.0030 0.0001 0.63 0.00 0.08 Private*** Illegitimate*[0.48] [2.83]*** [3.13]*** [0.20]0.0263 0.0536 -0.0708 -0.0091 0.13 0.00 0.59 Private***[1.50] [2.67]*** [3.68]*** [0.62]
-0.0064 -0.0025 0.0038 0.0051 0.00 0.07 0.02 For*** State* Illegistimate**[3.19]*** [1.10] [1.80]* [3.09]***-0.0075 -0.0022 0.0055 0.0042 0.01 0.08 0.11 For** State*[2.54]** [0.61] [1.75]* [1.89]*-0.0037 -0.0012 0.0042 0.0007 0.00 0.00 0.10 For*** State*** Illegitimate*
[3.74]*** [1.01] [3.79]*** [0.89]
0.0184 0.0113 -0.0337 0.0040 0.05 0.00 0.86 Against** Private***[1.98]** [0.97] [2.83]*** [0.43]-0.0013 0.0058 -0.0078 0.0033 0.33 0.00 0.00 Private*** Illegitimate***[0.97] [3.46]*** [4.87]*** [2.58]***0.0097 0.0046 -0.0120 -0.0023 0.00 0.00 0.01 Against*** Private*** Legitimate**
[6.53]*** [2.52]** [6.60]*** [1.53]Continued to the next page…
Years had to cut down on basic food consumption, 1989-2006
Assets:
Ownership of a house or apartment
Moved to entrepreneurship and self-employment
Transition-related hardships:
Years had wage cuts or wage arrears, 1989-2006
Years had to sell household assets, 1989-2006
Wealth (Decile of per capita household consumption)
Self-accessed difference wealth ranking b/w 1989 and 2006
="Below secondary"
="Professional, vocational training"
="Higher"
Self-reported poor health status [1-excellent, …, 5-poor]
Transition-related employment history:
Number of jobs, 1989-2006
Years worked for wages in state sector, 1989-2006
Years worked for wages in private sector, 1989-2006
Human capital:
Age
Low-skills occupation
Education ="Secondary" - comparison group
Chi-squared tests: "No view on…" Conclusion:Outcomes:
29
“In your opinion, what should be done with most privatized companies? They should be…”
Left in the hands of current owners with
no change
Left in the hands of current
owners provided that they pay
privatized assets’ worth
Re-nationalized and kept in state
hands
Re-nationalized and then re-
privatized again using a more transparent
process
Revision (B2+B3+B4=B1)
Property type
(B3=B1+B2+B4)
Legiti-macy
(B2+B4=B1)
Preference for or against revision of
privatization
Reason: Superior
property type
Reason: Legitimacy of privatization
0.0143 -0.0033 -0.0268 0.0158 0.01 0.00 0.88 Against** Private***[2.56]** [0.47] [3.89]*** [2.99]***-0.0023 -0.0030 0.0035 0.0018 0.26 0.15 0.77[1.11] [1.18] [1.43] [0.93]
-0.0252 -0.0160 0.0496 -0.0084 0.04 0.00 0.97 For** State***[2.01]** [1.04] [3.21]*** [0.70]-0.0170 -0.0083 0.0177 0.0075 0.17 0.27 0.49[1.36] [0.55] [1.10] [0.64]
0.0243 -0.0316 -0.0260 0.0333 0.30 0.51 0.65[1.03] [0.76] [0.66] [1.16]0.0134 -0.0285 -0.0228 0.0378 0.24 0.15 0.86[1.18] [2.03]** [1.45] [3.30]***
-0.0179 -0.0592 0.0202 0.0569 0.36 0.32 0.66[0.92] [2.82]*** [1.00] [3.11]***0.0249 -0.0252 0.0050 -0.0047 0.19 0.86 0.17[1.30] [0.87] [0.17] [0.20]0.018 -0.024 0.015 -0.009 0.17 0.32 0.04 Legitimate**[1.37] [1.65]* [0.98] [0.78]
-0.0118 -0.0232 0.0053 0.0296 0.27 0.67 0.39[1.10] [1.75]* [0.43] [2.84]***
Country dummies Yes*** Yes*** Yes*** Yes***ObservationsPseudo R-squaredLog LikelihoodChi-squared
Panel B. Interactions0.0020 0.0000 -0.0004 -0.0016 0.00 0.70 0.01 Against*** Legitimate***
[2.93]*** [0.00] [0.38] [2.22]**0.0018 0.0013 -0.0022 -0.0009 0.07 0.07 0.01 Against* Private* Legitimate***[1.83]* [0.98] [1.82]* [0.90]
All baseline covariates and country dummies Yes*** Yes*** Yes*** Yes***Observations 24311 24311 24311 24311Pseudo R-squaredAbsolute value of z statistics in brackets. The Huber-White sandwich estimator of variance is used; error terms are clustered by primary sampling units (PSUs).* significant at 10%; ** significant at 5%; *** significant at 1%
Household size
Location="Metropolitan area" - comparison group
Basic controls:
Gender [Male compared to Female]
="Other"
="Rural"
="Urban, excluding metropolitan area"
Religion="Christian" - comparison group
Outcomes: Chi-squared tests: "No view on…"
Member of an ethnic minority
Unemployed, 2006
="Buddhist"
="Atheistic / agnostic / none"
="Muslim"
2251.27
243160.08
Conclusion:
-29981
Interaction: Age X High-skills occupation
Interaction: Wealth X Education [1-Below secondary; 4-Higher]
0.08

30
Appendix A: The Life in Transition Survey, Technical Details
Table A1: Description of Variables Variable Description
(1) Individual-level variables Source: Life in Transition Survey (LiTS), EBRD and World Bank, 2006.
Dependent variable: Revision of privatization
Four-category response indicating whether the respondent prefers to (1) leave most privatized companies in the hands of current owners without any change; (2) leave most privatized companies in the hands of current owners provided that they pay what the assets are worth; (3) renationalize most privatized companies and keep them in state hands; and (4) renationalize most privatized companies and then re-privatize them, using a more transparent process. This variable is treated as a multinomial one.
(1.1) Human capital
Age Age of the respondent.
High-skills occupation Dummy indicating that in 2006 the respondent worked for wages in an occupation that requires high skills (i.e., legislators, senior government officials, enterprise managers, director/chief executives, owners of business, physicists, engineers, mathematicians, architects, computing professionals, medical doctors, dentists, pharmacists, teachers (university, secondary, primary), lawyers, accountants, authors, professionals and similar occupations).
Low-skills occupation Dummy indicating that in 2006 the respondent worked for wages in an occupation that requires only low skills.
Educational degrees Highest educational degree obtained by the respondent: (1) no degree / no education, (2) compulsory school education, (3) secondary education, (4) professional, vocational school/training, (5) higher professional degree (university, college), (6) post graduate degree.
Self-reported poor health status
Subjective assessment of the respondent’s health conditions: (1) very good, (2) good, (3) medium, (4) bad, (5) very bad.
(1.2) Transition-related employment history
Number of jobs, 1989-2006 Number of jobs for respondents worked for wages (for an employer) in any of the years from 1989 to 2006. A different job is defined by a different occupational position working for the same employer, by a change in the ownership type of the enterprise, and by a change of employer.
Years worked for wages in the state sector, 1989-2006
Number of years (1989-2006) when the respondent worked for wages in the state sector (i.e. the state was the owner of the company).
Years worked for wages in the private sector, 1989-2006
Number of years (1989-2006) when the respondent worked for wages in the private sector (i.e. the owner of the company was a private one).
Moved to entrepreneurship and self-employment until 2006
Dummy indicating that the respondent moved to self-employment and entrepreneurship until 2006 (no matter with what for a labor market status he or she started; eventually shifting more than once, but ending up with self-employment and entrepreneurship). We only refer to within-working-age respondents, i.e. respondents with an age between 18 and 60 years for any year.
Continued to the next page…

31
Table A1: Continued
Variable Description
(1.3) Transition-related hardships
Years had to accept wage cuts or wage arrears, 1989-2006
Number of years (1989-2006) when the respondent had to accept wage cuts or wage arrears.
Years had to sell household assets, 1989-2006
Number of years (1989-2006) when the respondent had to sell some of the household assets.
Years had to cut down on basic food consumption, 1989-2006
Number of years (1989-2006) when the respondent had to cut down on basic food consumption.
(1.4) Assets
Ownership of a house or apartment
Dummy indicating that any household member (including the respondent) is the majority owner of a house (detached, semi-detached, townhouse, terrace house), apartment, or flat. This information is given by the head of household (or another knowledgeable household member).
Wealth Approximated by the within-country deciles of total household’s annualized consumption expenditures per (equalized) household member. Children younger than 14 years enter with a weight of 0.3. The information for consumption expenditures is given by the head of household (or another knowledgeable household member). Our measure of wealth ranges from 1 to 10 based on the expenditure decile in which a respondent is located.
Self-accessed difference wealth ranking b/w 1989 and 2006
Subjective household’s wealth ranking on an imaginary ten-step ladder (from the poorest to the richest), difference today with respect to 1989 (retrospective). This information is given by the head of household (or another knowledgeable household member).
(1.5) Additional individual-level controls
Gender Gender of the respondent (0=female, 1=male).
Household size Number of household members.
Location Location of the interviewed household in a (1) metropolitan, (2) rural, or (3) urban (excluding metropolitan) area.
Religion Religion of the respondent: (1) Christian, (2) Buddhist, (3) atheistic / agnostic / none, (4) Muslim, (5) other.
Member of an ethnic minority Dummy indicating that the respondent belongs to an ethnic minority in this country.
Unemployment, 2006 Dummy getting a value of 1 if the respondent is actively looking for a job at the moment.

32
Variable # of obs. Mean SD Min MaxAge 28000 45.97 16.87 17 97Gender (Male==1) 28000 0.47 0.50 0 1The occupation in 2006 requires high skills 27590 0.10 0.31 0 1Attained educational degree 27993 3.50 1.13 1 6No degree / no education 27993 0.04 0.20 0 1Compulsory school education 27993 0.16 0.37 0 1Secondary education 27993 0.27 0.44 0 1Professional, vocational school/training 27993 0.32 0.47 0 1Higher professional degree (university, college) 27993 0.20 0.40 0 1Post graduate degree 27993 0.01 0.09 0 1Self-reported poor health status 27996 2.71 0.99 1 5Number of jobs, 1989-2006 27611 1.09 0.99 0 5Years worked for wages in the state sector, 1989-2006 27611 4.48 6.11 0 18Years worked for wages in the private sector, 1989-2006 27611 2.54 4.92 0 18Moved to entrepreneurship and self-employment until 2006 27640 0.03 0.18 0 1Years had to accept wage cuts or arrears, 1989-2006 27450 0.57 1.87 0 18Years had to sell household assets, 1989-2006 27450 0.27 1.19 0 18Years had to cut down on basic food consumption, 1989-2006 27450 1.86 4.10 0 18Ownership of a house or apartment 28000 0.85 0.35 0 1Wealth (deciles of per capita household consumption) 28000 5.68 2.93 1 10Self-accessed difference wealth ranking b/w 1989 and 2006 25179 -1.37 2.47 -9 9Household size 28000 2.81 1.66 1 12Location==metropolitan 28000 0.22 0.41 0 1Location==rural 28000 0.40 0.49 0 1Location==urban (excluding metropolitan) 28000 0.37 0.48 0 1Religion==Christian 28000 0.65 0.48 0 1Religion==Buddhist 28000 0.02 0.15 0 1Religion==atheistic/agnostic/none 28000 0.11 0.31 0 1Religion==Muslim 28000 0.19 0.39 0 1Religion==other 28000 0.02 0.14 0 1Member of an ethnic minority 27974 0.10 0.30 0 1Unemployment (actively looking for a job at the moment) 28000 0.09 0.28 0 1
Table A2: Summary Statistics