evaluation of illumination uniformity metrics in design ... · evaluation of illumination...
TRANSCRIPT
DGaOProceedings 2012 – http://www.dgao-proceedings.de – ISSN: 1614-8436 – urn:nbn:de:0287-2011-XXX-Y
Evaluation of illumination uniformity metrics in design and optimization of lightguides
Milan Maksimoviċ
Focal Optical Systems, Oldenzaal, The Netherlands
mailto:[email protected]
We compare influence of the different uniformity metrics on the merit function landscape related to the design of free-form and tapered rectangular/circular light guides.
1 Introduction
Uniform illumination is an important design target in many applications such as displays, backlights, medical lighting, solid-state lighting, microscopy etc. In the design process, optical systems are assessed according to light flux transfer efficiency and using number of the uniformity metrics [1],[2],[3]. In this contribution, we evaluate several uniformity metrics in the design of a free-form and classical polygonal light guides. We implemented within the standard Zemax optical design software [4] various uniformity metrics as the constraints and as the terms in the suitable merit function.
2 Uniformity metrics
Transfer efficiency usually is defined as ratio of total output to total input light flux. Uniformity is assessed with several metrics in terms of illumi-nance or luminous intensity L (depending on the definition domain in spatial or angular space). Most common uniformity metrics are:
max
min1 L
LU = (1),
minmax
minmax2 LL
LLU
+−= (2),
L
LU min
3 = (3),
LU
σ=4 (4),
where local sampling measures are U1 is min-max ratio,U2 contrast,U3 min-average ratio and global sampling measure is U4 relative standard deviation (σ-standard deviation, L is average).
3 Simulation Results
We use a source with ideal Lambertian radiation pattern of rectangular shape and 2x2mm size.
First, we consider light guides with the rectangular/ circular cross section and tapered geometry made from PMMA. Input size is set to source size for rectangular light guide and output size 5x5mm to provide angle conversion; diameter 2mm and 5mm for circular light guide input and output face re-spectively. Uniformity metrics are computed for 1D dependence: change length L while input and out-put size is fixed; 2D dependence where both length and output size are changed while input size is fixed. Detector is rectangular with 28x28 bins, positioned at the light guide output and with the size equal to output size of the light guide. Merit function is constructed as weighted sum of squared differences between targets and comput-ed values in the chosen parameter space [4]. In all simulations 106 rays is to enable low numerical noise level.
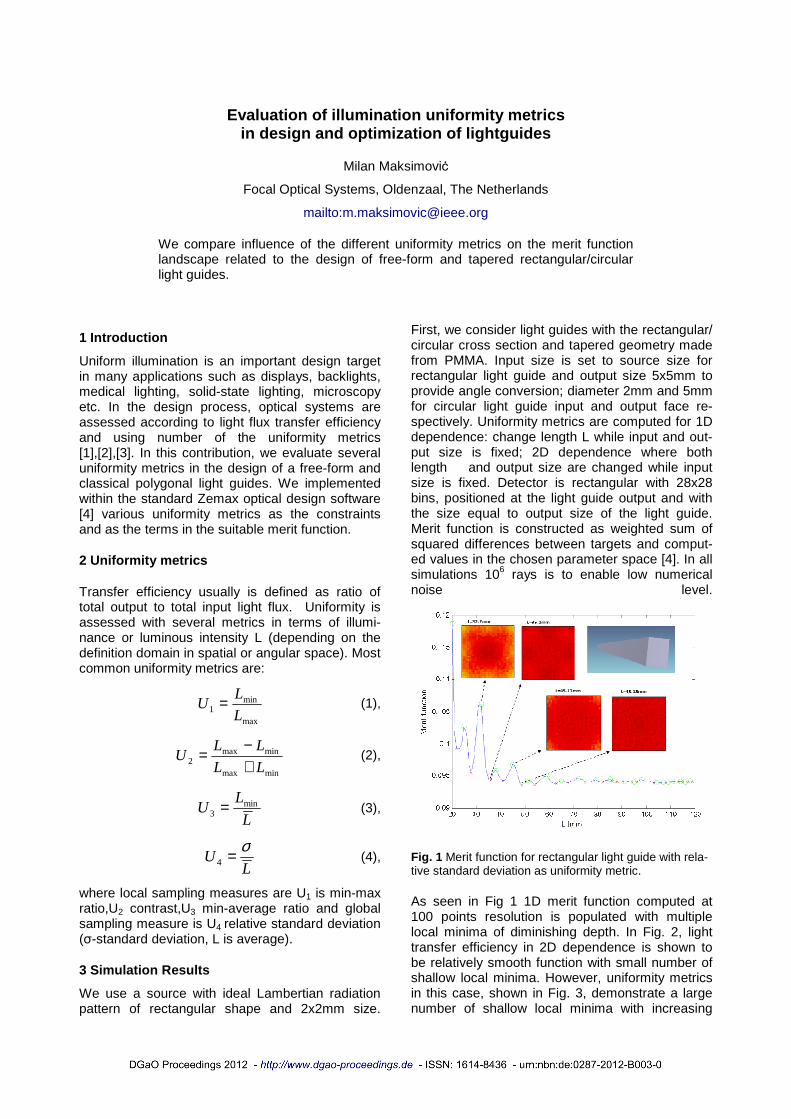
Fig. 1 Merit function for rectangular light guide with rela-tive standard deviation as uniformity metric.
As seen in Fig 1 1D merit function computed at 100 points resolution is populated with multiple local minima of diminishing depth. In Fig. 2, light transfer efficiency in 2D dependence is shown to be relatively smooth function with small number of shallow local minima. However, uniformity metrics in this case, shown in Fig. 3, demonstrate a large number of shallow local minima with increasing
DGaOProceedings 2012 – http://www.dgao-proceedings.de – ISSN: 1614-8436 – urn:nbn:de:0287-2011-XXX-Y
frequency in the part of landscape. Second, we consider a free-form, radially symmetric light guide with fixed input and output size (1mm and 5mm diameter respectively) and length 50mm, made of PMMA. Uniformity metrics are computed for 3D dependence where parameters are equispaced points along the length and vertical displacements L1,L2,L3 are varied. In this way a range of com-plex convex and concave shaped light guide ge-ometries are accessible. This light guide can be seen as perturbation of tapered circular light guide. Search space in our example is more than 1200 shapes.
Fig. 2 Transfer efficiency for rectangular light guide
Fig. 3 Uniformity metrics for rectangular light guide
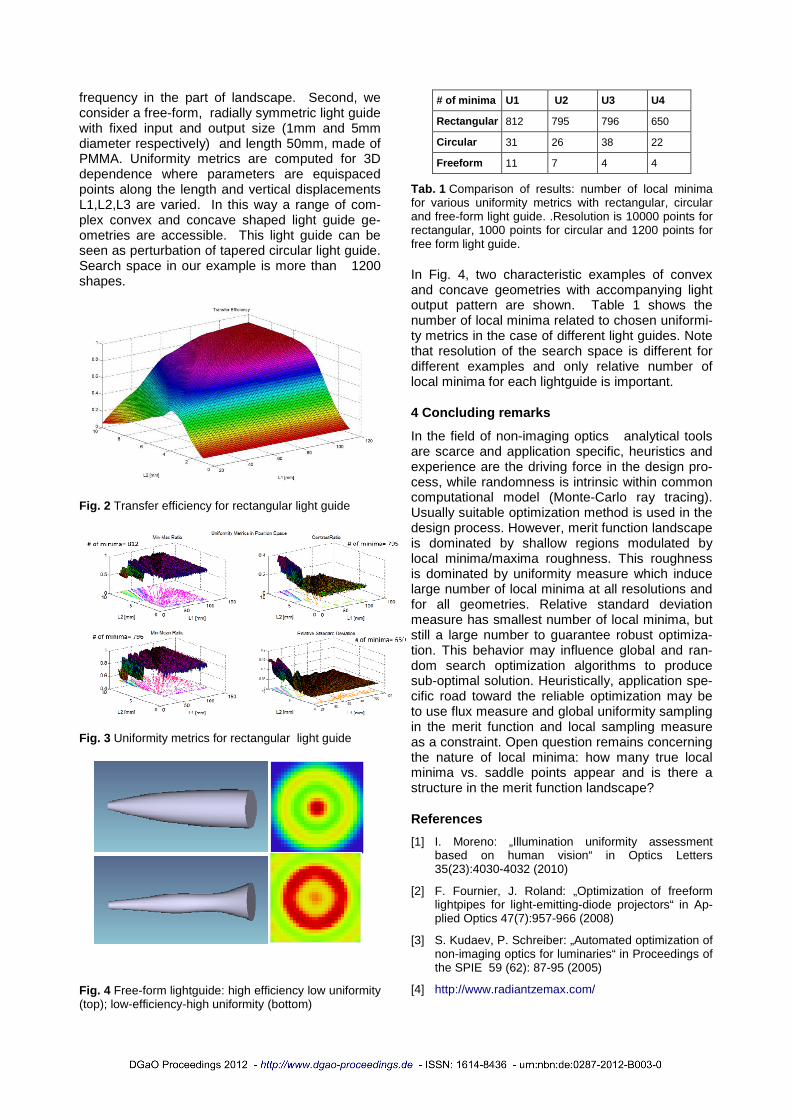
Fig. 4 Free-form lightguide: high efficiency low uniformity (top); low-efficiency-high uniformity (bottom)
# of minima U1 U2 U3 U4
Rectangular 812 795 796 650
Circular 31 26 38 22
Freeform 11 7 4 4
Tab. 1 Comparison of results: number of local minima for various uniformity metrics with rectangular, circular and free-form light guide. .Resolution is 10000 points for rectangular, 1000 points for circular and 1200 points for free form light guide.
In Fig. 4, two characteristic examples of convex and concave geometries with accompanying light output pattern are shown. Table 1 shows the number of local minima related to chosen uniformi-ty metrics in the case of different light guides. Note that resolution of the search space is different for different examples and only relative number of local minima for each lightguide is important.
4 Concluding remarks
In the field of non-imaging optics analytical tools are scarce and application specific, heuristics and experience are the driving force in the design pro-cess, while randomness is intrinsic within common computational model (Monte-Carlo ray tracing). Usually suitable optimization method is used in the design process. However, merit function landscape is dominated by shallow regions modulated by local minima/maxima roughness. This roughness is dominated by uniformity measure which induce large number of local minima at all resolutions and for all geometries. Relative standard deviation measure has smallest number of local minima, but still a large number to guarantee robust optimiza-tion. This behavior may influence global and ran-dom search optimization algorithms to produce sub-optimal solution. Heuristically, application spe-cific road toward the reliable optimization may be to use flux measure and global uniformity sampling in the merit function and local sampling measure as a constraint. Open question remains concerning the nature of local minima: how many true local minima vs. saddle points appear and is there a structure in the merit function landscape?
References
[1] I. Moreno: „Illumination uniformity assessment based on human vision“ in Optics Letters 35(23):4030-4032 (2010)
[2] F. Fournier, J. Roland: „Optimization of freeform lightpipes for light-emitting-diode projectors“ in Ap-plied Optics 47(7):957-966 (2008)
[3] S. Kudaev, P. Schreiber: „Automated optimization of non-imaging optics for luminaries“ in Proceedings of the SPIE 59 (62): 87-95 (2005)
[4] http://www.radiantzemax.com/