evaluating remaining oil saturation in middle east carbonates · drainage and imbibition archie...
TRANSCRIPT

Sch
lum
berg
er P
ub
licS
ch
lum
berg
er P
rivate
Evaluating Remaining Oil Saturation in
Middle East Carbonates
Sch
lum
berg
er P
ub
licS
ch
lum
berg
er P
rivateRaghu Ramamoorthy
Petrophysics Domain Head
Schlumberger Wireline Middle East
Abu Dhabi, U.A.E.

Sch
lum
berg
er P
ub
lic
Outline
� Some definitions to lay the ground
– Implications of ROS and Sor– Conditions required for Sor
� Log measurements of ROS
– When is this Sor?
Sch
lum
berg
er P
ub
lic
– When is this Sor?
� Log measurements for Sor– MicroPilot*
� Summary and Conclusions

Sch
lum
berg
er P
ub
lic
Remaining Oil Saturation
� I define ROS as Remaining Oil Saturation
– It is the fractional pore volume occupied by oil at any point in
the reservoir at any given time in the production of the asset
– The process by which this saturation is arrived at is not defined
Sch
lum
berg
er P
ub
lic
– The process by which this saturation is arrived at is not defined
– It is a snapshot of the reservoir in space and time

Sch
lum
berg
er P
ub
lic
Residual Oil Saturation
� I define Sor as Residual Oil Saturation
– It is the ultimate fractional pore volume of oil at the end of a
specified displacement process with a given fluid
– It is achieved after an infinite number of Pore Volumes of the
displacing fluid has passed through the given point in the
Sch
lum
berg
er P
ub
lic
displacing fluid has passed through the given point in the
reservoir
– It is specific to the displacing fluid and is denoted by Sorxwhere
‘x’ denotes the displacing fluid, eg. Sorw– It requires that the displacement reproduces the conditions
achievable in the far field in a typical reservoir flood

Sch
lum
berg
er P
ub
lic
ROS versus Sor
� ROS is simply a snapshot of the reservoir. It has no
petrophysical significance beyond an assessment of the
amount of oil remaining in the rock. There is no appreciation
of the process up to that point
– Remaining oil may include oil mobile to that process
S , on the other hand, is a very important Reservoir
Sch
lum
berg
er P
ub
lic� Sor, on the other hand, is a very important Reservoir
Engineering quantity. It is an endpoint for relative
permeability in the simulator. It signifies the ultimate recovery
under a given displacement process. Very specific conditions
need to be ensured both during displacement and during
measurement
– Residual oil is immobile to that displacement process

Sch
lum
berg
er P
ub
lic
Residual Oil versus Remaining Oil Saturation
Sor Sor SorROS ROS ROS
Sch
lum
berg
er P
ub
lic
ratioviscosity
k
kf
w
o
rw
ro
o
ww =
⋅+
=µ
µ
µ
µ1
1
05.0=w
o
µ
µ5=
w
o
µ
µ500=
w
o
µ
µ

Sch
lum
berg
er P
ub
lic
Conditions for Sor
� Ultimate recovery: requires several tens of pore volumes of
displacing fluid to pass through
� Displacement velocities must be comparable to actual flood
– Ensure capillary numbers are comparable
Displacement direction should not reverse
Sch
lum
berg
er P
ub
lic
� Displacement direction should not reverseSPE 13213 Chatzis et.al
SPE 5050 Abrams et.al
Sch
lum
berg
er P
ub
lic
Outline
� Some definitions to lay the ground
– Implications of ROS and Sor– Conditions required for Sor
� Log measurements of ROS
– When is this Sor?
Sch
lum
berg
er P
ub
lic
– When is this Sor?
� Log measurements for Sor– MicroPilot*
� Summary and Conclusions

Sch
lum
berg
er P
ub
lic
So what do logs measure?
� Logs measure ROS (remaining oil saturation)
� Conditions in reservoir may render ROS = Sorw– Behind water flood front in light oil reservoir
– Invaded zone in a light oil reservoir
• No control on capillary number
Sch
lum
berg
er P
ub
lic
• No control on capillary number
• Need to avoid use of surfactants in mud
– Log-inject-log methods
• No control on capillary number
• Need to ensure sufficient injection is achieved
• MicroPilot* is a new downhole SCAL technique for Sor to a wide
range of displacing fluids

Sch
lum
berg
er P
ub
lic
Saturation Logs
� Resistivity-based Methods
– Open or Cased Hole
– Deep and Shallow Measurement
– Cross-well Resistivity Mapping
� Resistivity Independent Methods
Sch
lum
berg
er P
ub
lic– NMR and Dielectric
• Open Hole only (fiber glass casing possible)
• Shallow Measurement only
– Pulsed Neutron Logs
• Open or Cased Hole, even while drilling
• Inelastic C/O Ratio and Thermal Neutron Capture (Sigma)
• Shallow Measurement only

Sch
lum
berg
er P
ub
lic
Resistivity-based Saturation Monitoring: Saturation from Resistivity Logging
n
m
T
ww
a
R
RS
1
=
φ
Sch
lum
berg
er P
ub
lic
T
a, m, n: rock properties typically derived from core plugs in laboratories
φ: reservoir porosity from logs
Rw: formation water resistivity/salinity (?)
RT: true formation resistivity from resistivity logging

Sch
lum
berg
er P
ub
lic
Challenges in Carbonates
Presence of vugs affects Archie Cementation Exponent – m
– m varies between
• 1.7 for intergranular rocks (mudstones, wackestones,
packstones)
• Over 3 for vuggy rocks (grainstones)
Sch
lum
berg
er P
ub
licMixed salinity due to water flood
– Formation water salinity ~ 250,000 ppm
– Injection water salinity 10,000 ppm – 80,000 ppm
Mixed-wet rocks have different Archie Saturation Exponent, n,
for drainage and imbibition

Sch
lum
berg
er P
ub
lic
Texture sensitivity of Cementation Exponent
Vuggy porosity in carbonates increases ‘m’
Acoustics can provide estimate of vuggy porosity
� Needs high porosity rock
Macro-porosity from P3A can be used as vuggy porosity
Sch
lum
berg
er P
ub
lic
Macro-porosity from P3A can be used as vuggy porosity
estimate
Cementation exponent can be determined from pore
partitioning
�Method of Nugent (empirical)
�Method of Brie (grounded in physics)
KSST 2012

Sch
lum
berg
er P
ub
lic
Variable ‘m’ from Pore Geometry
� The Bruggeman-Ramakrishnan effective medium model uses
all three pore partitions – micro, meso and macro
� Tortuosity is enhanced when one type of pore exists in a
background of another type
� Purely micritic rock or purely intergrannular rock have a low
Sch
lum
berg
er P
ub
lic
� Purely micritic rock or purely intergrannular rock have a low
‘m’ – approximately 1.7
� Mixing intragranular micro-porosity with intergranular meso-
porosity results in an increase in ‘m’
� Vugs or macro-porosity increases ‘m’ further
KSST 2012

Sch
lum
berg
er P
ub
licS
ch
lum
berg
er P
ub
lic

Sch
lum
berg
er P
ub
lic
Challenges in Carbonates
Presence of vugs affects Archie Cementation Exponent – m
– m varies between
• 1.7 for intergranular rocks (mudstones, wackestones,
packstones)
• Over 3 for vuggy rocks (grainstones)
Sch
lum
berg
er P
ub
licMixed salinity due to water flood
– Formation water salinity ~ 250,000 ppm
– Injection water salinity 10,000 ppm – 80,000 ppm
Mixed-wet rocks have different Archie Saturation Exponent, n,
for drainage and imbibition

Sch
lum
berg
er P
ub
lic
Resistivity RSM: Drainage vs Imbibition
Plug 107: Primary Drainage and Imbibition Pc Curves
20
40
60
80
100
imbibition
drainage
Oil Migration
100
1000
RI
Carbonate Reservoir Rcok
m=1.95 ♦♦♦♦ =2.78 g/cc k=1.22 md ♦♦♦♦=0.143
nimb=2.3232
Sch
lum
berg
er P
ub
lic
-100
-80
-60
-40
-20
0
0 0.2 0.4 0.6 0.8 1
Sw
Pc,
psi
Waterflood
1
10
0.01 0.1 1
Sw
RI
Drainage Dr_fit Imbibition Imb_fit
ndr=1.7654
SPE 92426 Ma et.al

Sch
lum
berg
er P
ub
lic
Resistivity RSM: Saturation from Resistivity Logging
ndr: drainage saturation exponent
Rw,dr: connate water resistivity/salinity
RT,dr: true virgin formation resistivity
drn
m
drT
drw
drw
a
R
RS
1
,
,
,
=
φ
Drainage: oil migration
Sch
lum
berg
er P
ub
lic
imbn
m
imbT
imbw
imbw
a
R
RS
1
,
,
,
=
φ
Imbibition: waterflooding
nimb: imbibition saturation exponent
Rw,imb: injected water resistivity/salinity
RT,imb: true flushed formation resistivity

Sch
lum
berg
er P
ub
lic
Cased-Hole RSM: Resistivity Time Lapse (W-A)
RDD_FAL.VOL_CALCITE_1
V/V CALCITE0 1
RDD_FAL.VOL_DOLOM_1
V/V DOLOMITE0 1
RDD_FAL.VOL_ANHYDR_1
V/V ANHYDRITE0 1
RDD_FAL.PHIT_1
V/V POROSITY1 0
7050
7100
DE
PT
H (
MD
)F
EE
T
RDD.GR_1
GAPI0 50
RDD.CALI_1
IN0 10
RDD_FAL.SWT_1
V/V WATER SAT1 0
RDD_FAL.SALT_1
PPK0 300
RDD.RHOB_1
G/CC1.95 2.95
RDD.NPHI_1
V/V0.45 -0.15
RDD.PEF_1
B/E-3 7
RDD.DRHO_1
G/CC-0.1 0.9
POST ARAB-D STRINGERBASE POST-D STRINGER
TOP ARAB-D ZONE 1
TOP ARAB-D ZONE 2
Water-Oil Contact
RDD.RXO_1
OHMM, 92 OH1 1000
RDD.ILM_3
OHMM, 92 OH1 1000
RDD_FAL.RT_2
OHMM, 92 OH1 1000
RDD_FAL.PHIT_1
V/V OIL0.5 0
RDD_FAL.VOL_UWAT_1
V/V WATER0.5 0
MODEL_DR.N_1
1 6
D050
D100
FLM_19920917.QW_PCT_1
WATER0 100
FLM_19920917.QT_PCT_1
OIL0 100FLM_19930417.QW_PCT_1
WATER0 100
FLM_19930417.QT_PCT_1
OIL0 100
POST ARAB-D STRINGER (7031)BASE POST-D STRINGER (7034)
TOP ARAB-D ZONE 1 (7043)
TOP ARAB-D ZONE 2 (7071)
Water-Oil Contact
93 PLT92 PLT
FLM_19920917.QW_PCT_1
WATER0 100
FLM_19920917.QT_PCT_1
OIL0 100FLM_19930417.QW_PCT_1
WATER0 100
FLM_19930417.QT_PCT_1
OIL0 100
POST ARAB-D STRINGER (7031)BASE POST-D STRINGER (7034)
TOP ARAB-D ZONE 1 (7043)
TOP ARAB-D ZONE 2 (7071)
Water-Oil Contact
93 PLT92 PLT
FLM_19920917.QW_PCT_1
WATER0 100
FLM_19920917.QT_PCT_1
OIL0 100FLM_19930417.QW_PCT_1
WATER0 100
FLM_19930417.QT_PCT_1
OIL0 100
POST ARAB-D STRINGER (7031)BASE POST-D STRINGER (7034)
TOP ARAB-D ZONE 1 (7043)
TOP ARAB-D ZONE 2 (7071)
Water-Oil Contact
93 PLT92 PLT
Lithology VolumeResistivityPorosity
Drainag
e
WOC, S
wc
POST ARAB-D STRINGER (7031)BASE POST-D STRINGER (7034)
RDD.RT_1
V/V WATER0.2 2000
FALMD_SALTS.RT_B_1
KPPM0.2 2000
0.5
0.5
0.5
0
1
Massive
water flushing
Abnormal CHFR readingPOST ARAB-D STRINGER (7031)BASE POST-D STRINGER (7034)
RDD.RT_1
V/V WATER0.2 2000
FALMD_SALTS.RT_B_1
KPPM0.2 2000
0.5
0.5
0.5
0
1
Massive
water flushing
Abnormal CHFR reading
04-Rt
92-Rt
Drainage and Imbibition Archie Saturation1992
11 years
WOC, S
wc
Sch
lum
berg
er P
ub
lic
7150
7200
7250
7300
TOP ARAB-D ZONE 3
TOP ARAB-D ZONE 4
BASE ARAB-D RESERVOIR
D300
D150
D200
D250
7150
7200
7250
7300
TOP ARAB-D ZONE 3
TOP ARAB-D ZONE 4
BASE ARAB-D RESERVOIR
D300
D150
D200
D250
TOP ARAB-D ZONE 3 (7203)
TOP ARAB-D ZONE 4 (7304)
BASE ARAB-D RESERVOIR (7342)
TOP ARAB-D ZONE 3 (7203)
TOP ARAB-D ZONE 4 (7304)
BASE ARAB-D RESERVOIR (7342)
TOP ARAB-D ZONE 3 (7203)
TOP ARAB-D ZONE 4 (7304)
BASE ARAB-D RESERVOIR (7342)
Imbibition
Variable Archie parameter processing
BASE ARAB-D RESERVOIR (7342)
Time-Lapse
ResistivityBASE ARAB-D RESERVOIR (7342)
Time-Lapse
Resistivity
SPE 92426 Ma et.al

Sch
lum
berg
er P
ub
lic
Saturation Logs
� Resistivity-based Methods
– Open or Cased Hole
– Deep and Shallow Measurement
– Cross-well Resistivity Mapping
� Resistivity Independent Methods
Sch
lum
berg
er P
ub
lic– NMR and Dielectric
• Open Hole only (fiber glass casing possible)
• Shallow Measurement only
– Pulsed Neutron Logs
• Open or Cased Hole, even while drilling
• Inelastic C/O Ratio and Thermal Neutron Capture (Sigma)
• Shallow Measurement only

Sch
lum
berg
er P
ub
lic
Nuclear Magnetic Resonance
Total Porosity
Swirr
Pore Size Distribution
Derived Permeability
Sch
lum
berg
er P
ub
lic
Derived Permeability

Sch
lum
berg
er P
ub
lic
Nuclear Magnetic Resonance
Saturation Measurements Independent of
� Formation Water Resistivity
� Saturation Exponents (Archie’s)
0.00
0.50
1.00
1.50
2.00
0.1 1 10 100 1000 10000
T2 [msec]
Incre
menta
l P
oro
sity [
pu]
0
2
4
6
8
10
12
14
16
Cum
ula
tive P
oro
sity [
pu]
Sch
lum
berg
er P
ub
lic
(Archie’s)
Saturation Based on
� Differences in Fluid Properties
� Sensitivity to MnCl2
T2 [msec]
1 10 100 1000
TT2A 2A , , msecmsec..
OilOilWaterWater

Sch
lum
berg
er P
ub
lic
NMR ROS Determination
The image cannot be displayed. Your
computer may not have enough memory to open the image, or the image may have been corrupt
ed. Restart your computer, and then open the file again. If the red x still appears, you
may have to delete the image and then insert it again.
The
im
age
cannot
be
d
isplayed.
Your
computer
may
not
The
im
age
cannot
be
d
isplayed.
Your
computer
may
not
Oil OilWater
Sch
lum
berg
er P
ub
lic
1 10 100 1000
have
enoug
h
memory
to
op
en
the
image,
o
r
the
image
ma
y
have
been
co
rrupted.
Resta
rt
your
com
have
enoug
h
memory
to
op
en
the
image,
o
r
the
image
ma
y
have
been
co
rrupted.
Resta
rt
your
com
TT2A 2A , , msecmsec ..

Sch
lum
berg
er P
ub
lic
NMR Results Compared to Sponge Core
SPE 90339 Eyvazzadeh et. al
Sch
lum
berg
er P
ub
lic

Sch
lum
berg
er P
ub
lic
Magnetic Resonance Fluid Characterization
0.1 1.0 10.0 100.0 1000.0 10000.0
Rock Bulk Volume
Rock
MatrixClay
Clay
bound
water
Total Porosity
Effective Porosity
Capillary bound
water
Free
waterHydrocarbons
Minerals
T2 cutoff
T2 Distribution
T2 Relaxation (msec)
Am
plit
ud
e
0.1 1.0 10.0 100.0 1000.0 10000.0
Rock Bulk Volume
Rock
MatrixClay
Clay
bound
water
Total Porosity
Effective Porosity
Capillary bound
water
Free
waterHydrocarbons
Minerals
T2 cutoff
T2 Distribution
T2 Relaxation (msec)
Am
plit
ud
e
Sch
lum
berg
er P
ub
lic
Oil Filtrate
Bound
Water
Oil Filtrate
Bound
Water
Sch
lum
berg
er P
ub
lic
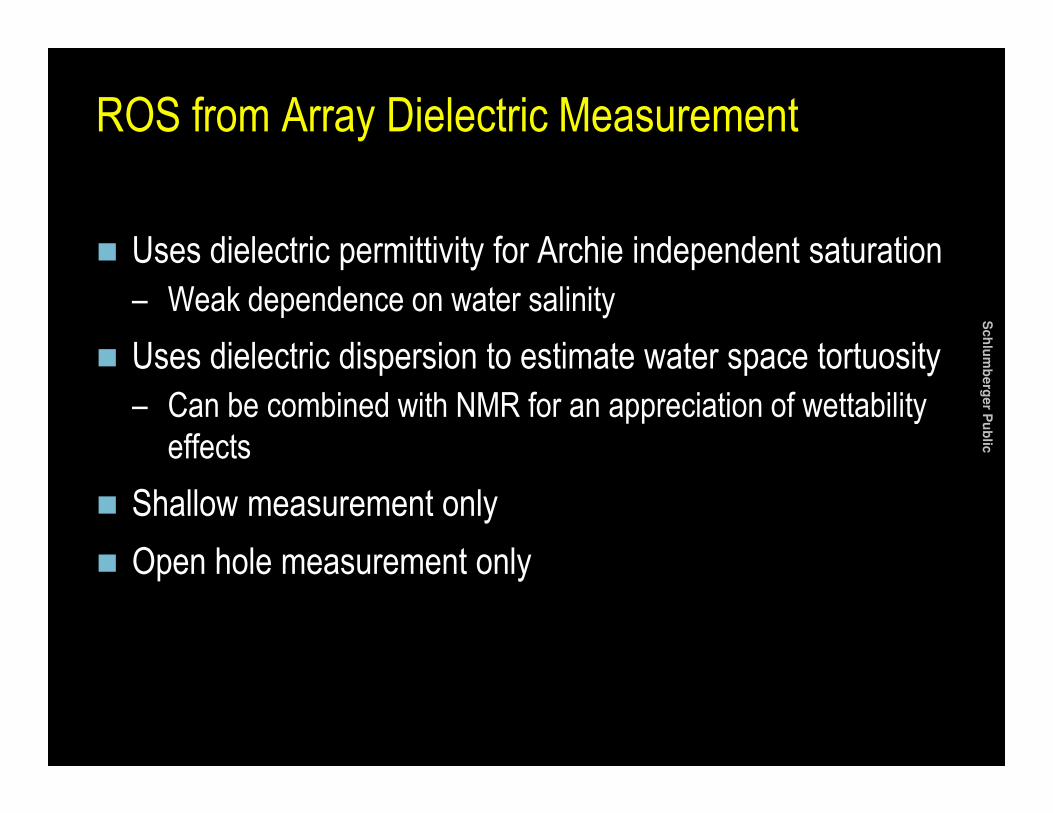
ROS from Array Dielectric Measurement
� Uses dielectric permittivity for Archie independent saturation
– Weak dependence on water salinity
� Uses dielectric dispersion to estimate water space tortuosity
– Can be combined with NMR for an appreciation of wettability
Sch
lum
berg
er P
ub
lic
– Can be combined with NMR for an appreciation of wettability
effects
� Shallow measurement only
� Open hole measurement only

Sch
lum
berg
er P
ub
lic
ROS from Dielectric
� Dielectric tools are sensitive to the water filled porosity PHIWdielectric
� The remaining/residual oil volume is computed by difference to a total
porosity PHIT externally supplied:
Sch
lum
berg
er P
ub
lic
VOILremaining = PHIT - PHIWdielectric
� Residual saturation is obtained by comparison to PHIT
ROS = (PHIT – PHIWdielectric) / PHIT

Sch
lum
berg
er P
ub
lic
Benchmarking ROS
from NMR LIL to
Dielectric logs
ADT Run 1: before
doping
ADT Run 2: after
reaming and
doping
Sch
lum
berg
er P
ub
lic
doping
NMR LIL

Sch
lum
berg
er P
ub
lic
ROS – NMR LIL vs. Dielectric
NMR LILPro’s:
� Proven, accurate technique
� Practically no parameters
� Residual oil and total porosity measured simultaneously in the same volume of rock
Con’s:
� Additional costs:
Dielectric
Pro’s:
� No extra runs (rig time)
� No exotic chemicals in the mud
� Always get results
Con’s:
Sch
lum
berg
er P
ub
lic
� Additional costs:– 2 NMR logs (optional)
– Rig time for reaming and logging
– MnCl2 (cost, logistics, availability)
� Doping incomplete > 50% of the time and results inconclusive*
� The technique only works with light oils with narrow T2 distributions (… we still could kill all water signal, high MnCl2 concentration)
� Both PHIT and PWXO have to be
measured accurately
� Good knowledge of EPSI_MATR
required
� More certainty when salinity < 50 ppk
NaCl
* NMR LIL successful 2 times out of 7 in 2008-2010
SPE-149131 – D. Schmitt et al, 2011

Sch
lum
berg
er P
ub
lic
Very Good Repeatability of Dielectric Measurement
First runSecond run 2 days later, after doping the mud
Sch
lum
berg
er P
ub
lic

Sch
lum
berg
er P
ub
lic
ROS measurement
Dielectric
Measurement
confirmed by core
analysis
Sch
lum
berg
er P
ub
lic
analysis

Sch
lum
berg
er P
ub
lic
Carbonate – Comparison with MRF station -1S
ch
lum
berg
er P
ub
lic

Sch
lum
berg
er P
ub
lic
Carbonate – Comparison with MRF station -2S
ch
lum
berg
er P
ub
lic

Sch
lum
berg
er P
ub
lic
Carbonate – Comparison with MRF station -3S
ch
lum
berg
er P
ub
lic

Sch
lum
berg
er P
ub
lic
Flushed Zone ROS from NMR and Array Dielectric
MRF
x
x
x
Sch
lum
berg
er P
ub
lic
SXO from ADT
SXO from MCFL
x
x
x
x
x
SXO from NMR
SPE 134841 Zielinski et.al

Sch
lum
berg
er P
ub
lic
Saturation Logs
� Resistivity-based Methods
– Open or Cased Hole
– Deep and Shallow Measurement
– Cross-well Resistivity Mapping
� Resistivity Independent Methods
Sch
lum
berg
er P
ub
lic– NMR and Dielectric
• Open Hole only (fiber glass casing possible)
• Shallow Measurement only
– Pulsed Neutron Logs
• Open or Cased Hole, even while drilling
• Inelastic C/O Ratio and Thermal Neutron Capture (Sigma)
• Shallow Measurement only

Sch
lum
berg
er P
ub
lic
Carbon-Oxygen Tools
Concentric Detector Tool
� 1 11/16” Tool
� Spectral Calibration
� High Count Rate
1 11/16-in.RST Sonde
2 1/2 -in.RST Sonde
Sch
lum
berg
er P
ub
lic
� Not Shielded from Borehole
Eccentric Detector Tool
� 2 1/2” Tool
� Spectral Calibration
� Lower Count Rate
� Shielded from Borehole

Sch
lum
berg
er P
ub
lic
C/O – NMR – Core Comparisons
Slim
Flowing
Slim
Shut-In
Large
Flowing
Large
Shut-In
SPE 90339 Eyvazzadeh et. al
Sch
lum
berg
er P
ub
lic

Sch
lum
berg
er P
ub
lic
Other benefits of C/O Logging
� Superior lithology through neutron spectroscopy
– Ca, Fe, Si, S, Ti, Gd from Capture Spectrum
– Inelastic Mg helps in calcite-dolomite quantification
� Apparent formation salinity through chlorine/hydrogen ratio
Sch
lum
berg
er P
ub
lic
� Apparent formation salinity through chlorine/hydrogen ratio
– Useful to determine effective Rw
– Well based salinity variations may be incorporated into Eclipse
simulations to history match field-wide salinity and saturation
variations

Sch
lum
berg
er P
ub
lic
Dielectric ROS compared to Sigma and C/O
Sch
lum
berg
er P
ub
lic
SPE-149131 – D. Schmitt et al, 2011

Sch
lum
berg
er P
ub
lic
Outline
� Some definitions to lay the ground
– Implications of ROS and Sor– Conditions required for Sor
� Log measurements of ROS
– When is this Sor?
Sch
lum
berg
er P
ub
lic
– When is this Sor?
� Log measurements for Sor– MicroPilot*
� Summary and Conclusions

Sch
lum
berg
er P
ub
lic
The MicroPilotTM Concept
The MicroPilot™ concept is an offering for the EOR projects for quick
screening of EOR processes by altering formation properties through the
controlled injection of EOR-agents while measuring the “recovery and/or
displacement behavior” in-situ.
Sch
lum
berg
er P
ub
licInformation acquired is critical for comparative elimination:
� Fast tracking of EOR screening studies
� Evaluation of dynamic petrophysical properties
� Evaluation / optimization of EOR simulation parameters

Sch
lum
berg
er P
ub
lic
• Phase 1─ Log across the zone of interest (10 to 15 min)
� Fluids T2 distributions and Sw after invasion are inferred
� The So inferred that way is an estimate of the in-situ
ROS after invasion
• Phase 2─ Water injection with the CHDT module
Water based mud
Station Logs: Acquisition Sequence
Sch
lum
berg
er P
ub
lic
Mud filtrate
─ Water injection with the CHDT module
� Injection aims at simulating water-flood and achieving
ROS status
• Phase 3─ Log across the zone of interest after injection
� Fluids T2 distributions and Sw after injection are inferred
� The So inferred that way is an estimate of the in-situ
ROS after water-flood

Sch
lum
berg
er P
ub
lic
SPE 129069: FMI Images Clearly Show Injection
Point at X06.9m After InjectionBefore Injection
Scale represent close to a 1:1
vertical : horizontal perspective
We can see the actual de-
saturation and resultant oil bank
caused by the ASP injection.
Top of upper oil rim
Bottom of upper oil rim
Sch
lum
berg
er P
ub
lic
Bottom of upper oil rim
Injection Depth
Top of lower oil rim
Bottom of lower oil rim

Sch
lum
berg
er P
ub
lic
Results Summary
This plot shows a summary
of the results shown in the
previous slides.
NMR, MRF, and Dielectric
are all in agreement.
The NMR and Dielectric are
two very different techniques
Sch
lum
berg
er P
ub
lic
Sxo CMR Phi CMR Pwxo ADTSxo ADT
two very different techniques
physically. They are also of
two different vertical
resolution.
The comparison of the two
results are in very good
agreement, and also
supported visually by the
Electrical images.
SPE 129069 Arora et.al

Sch
lum
berg
er P
ub
lic
MicroPilot Modeling WorkflowModeling Step:
1: Grid calibration
2: Mud filtrate invasion
Method of validation:
Single phase
analytical solution
Post-invasion
NMR saturation
Sch
lum
berg
er P
ub
lic
3: Production pretests
4: ASP injection
NMR saturation
Measured pressure
Electrical image log
NMR saturation
Measured pressure
Pressure match, high CDC, Kh = 6.75D
Measured Pressure

Sch
lum
berg
er P
ub
lic
Step 4: ASP Injection Modeling
Post-injection oil saturation:
Vertical Horizontal Azimuthal S
ch
lum
berg
er P
ub
lic
28cm 28cm
0 0.2 0.4 0.6 0.8 1
26cm

Sch
lum
berg
er P
ub
lic
Step 4: ASP Injection Modeling
Simulated salt concentration Electrical Image Log
Sch
lum
berg
er P
ub
lic
Unit: ppm

Sch
lum
berg
er P
ub
lic
Step 4: ASP Injection Modeling
0 0.2 0.4 0.6 0.8x06.0
x06.2
x06.4
Oil saturation vs. depth
Sch
lum
berg
er P
ub
lic
x06.6
x06.8
x07.0
x07.2
x07.4
x07.6
x06.0
MD
[m
]
Measured (NMR)
ECLIPSE
Vertical resolution
of NMR
measurement =
7.5”

Sch
lum
berg
er P
ub
lic
Outline
� Some definitions to lay the ground
– Implications of ROS and SOR
– Conditions required for SOR
� Log measurements of ROS
– When is this SOR?
Sch
lum
berg
er P
ub
lic
– When is this SOR?
� Log measurements for SOR
– MicroPilot*
� Summary and Conclusions

Sch
lum
berg
er P
ub
lic
Concluding Remarks
� Sor and ROS represent very different concepts
– Terminology relating to the two has been proposed
� Logs measure ROS
– Conditions need to be carefully engineered to ensure
Sch
lum
berg
er P
ub
lic
– Conditions need to be carefully engineered to ensure
downhole measurement of Sor
� Several logging technologies can be used
– Resistivity, NMR, Dielectric, Pulsed Neutron Logs
� New logging service introduced for downhole Sor– MicroPilot*