evaluating digital libraries dea (not the drug enforcement agency) paul kantor lida 2007
TRANSCRIPT
Evaluating Digital LibrariesDEA
(not the Drug Enforcement Agency)Paul Kantor
LIDA
2007

Prof. Saracevic showed evaluation as a magician, pulling a rabbit out of a hat.

Qualitative versusQuantitative?
Economics of Digital Libraries
The baseball player with 2 hits last season; 5 hits this week.
The difference is ...Not 3
Quantitative studies are subtle
Informed by, and
informing
qualitative studies

Baseball player ..
• Outputs– Hits– Bases– Runs scored– Hit safely– Runs batted in– Attendance/fans– Earnings
• Inputs– Games played– At bats– Salary
• 1. Which players are “economically better”

You can’t learn ...– to hit a baseball– to kick a football– to dance the kolo– to play the gaida– to run a library
• by reading about it– you need to
• see it• feel it• ask questions about it
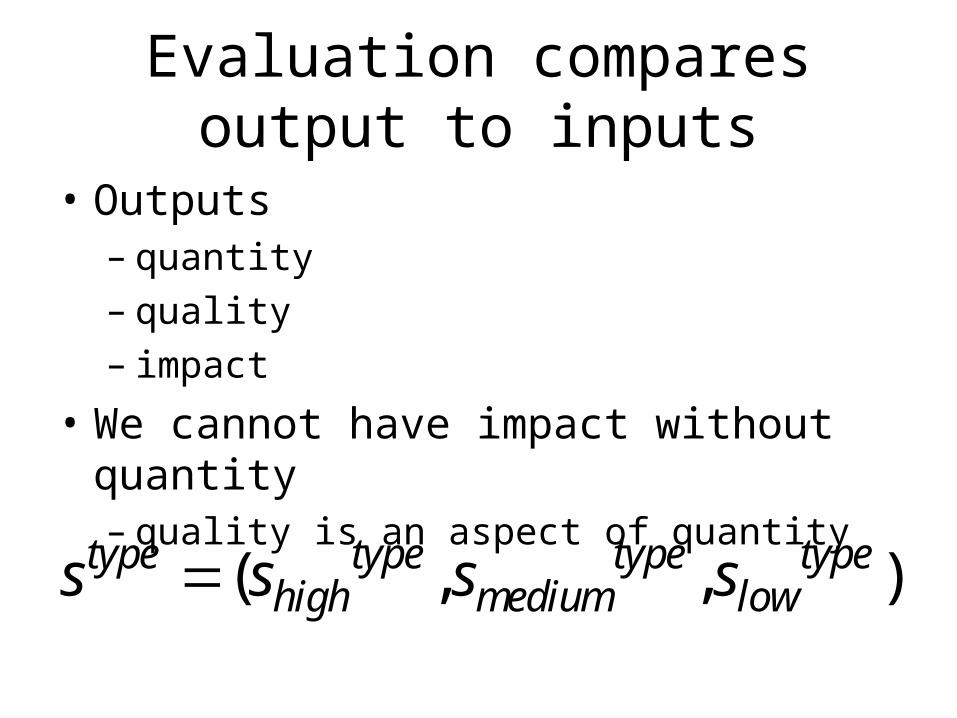
( , , )type type type typehigh medium lows s s s
• Outputs– quantity– quality– impact
• We cannot have impact without quantity– quality is an aspect of quantity
Evaluation compares output to inputs
For comparison we’d like to see a single number
• But there are many kinds of service– lending materials– reference assistance– providing copies– obtaining remote materials
• and many kinds of input– staff expenses– materials– licenses/contracts.
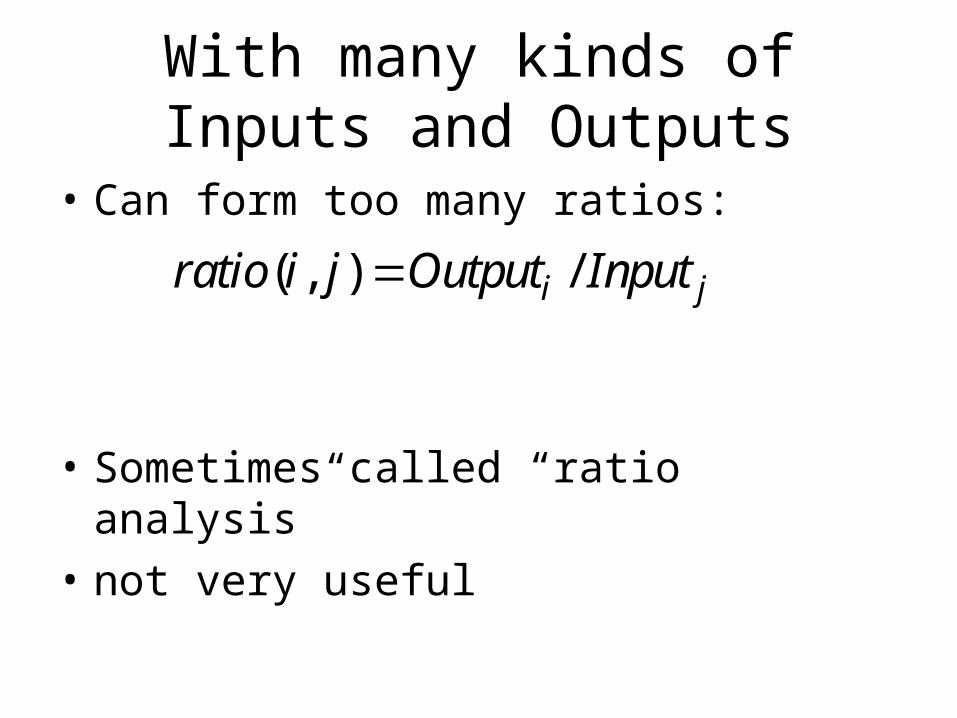
• Can form too many ratios:
• Sometimes called “ratio analysis”
• not very useful
( , ) /i jratio i j Output Input
With many kinds of Inputs and Outputs
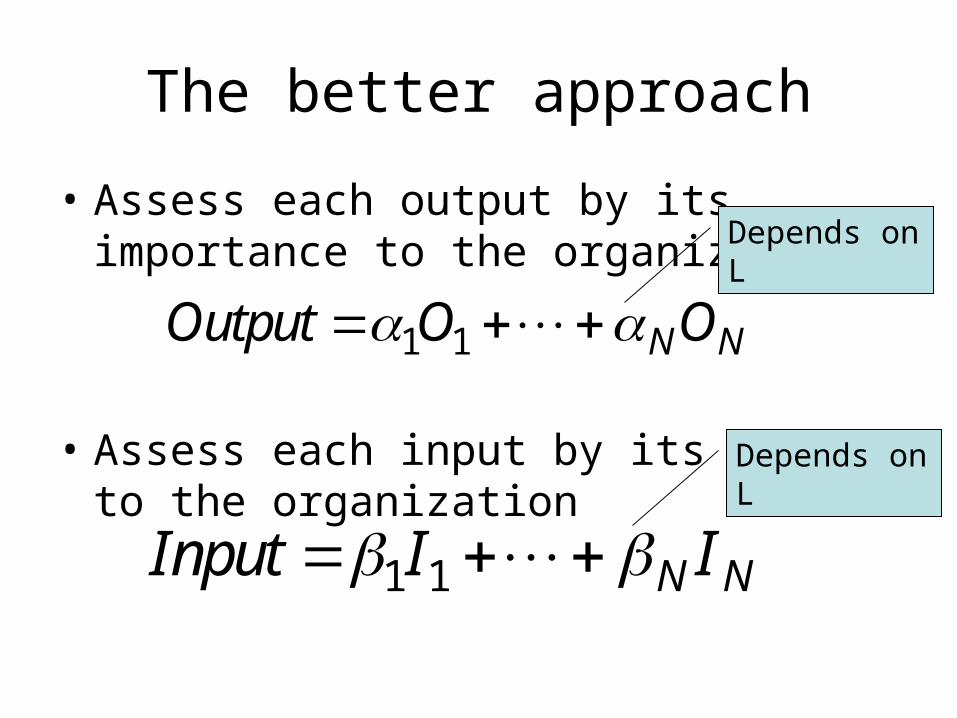
The better approach
• Assess each output by its importance to the organization
• Assess each input by its cost to the organization
1 1 N NInput I I
1 1 N NOutput O O
Depends on L
Depends on L
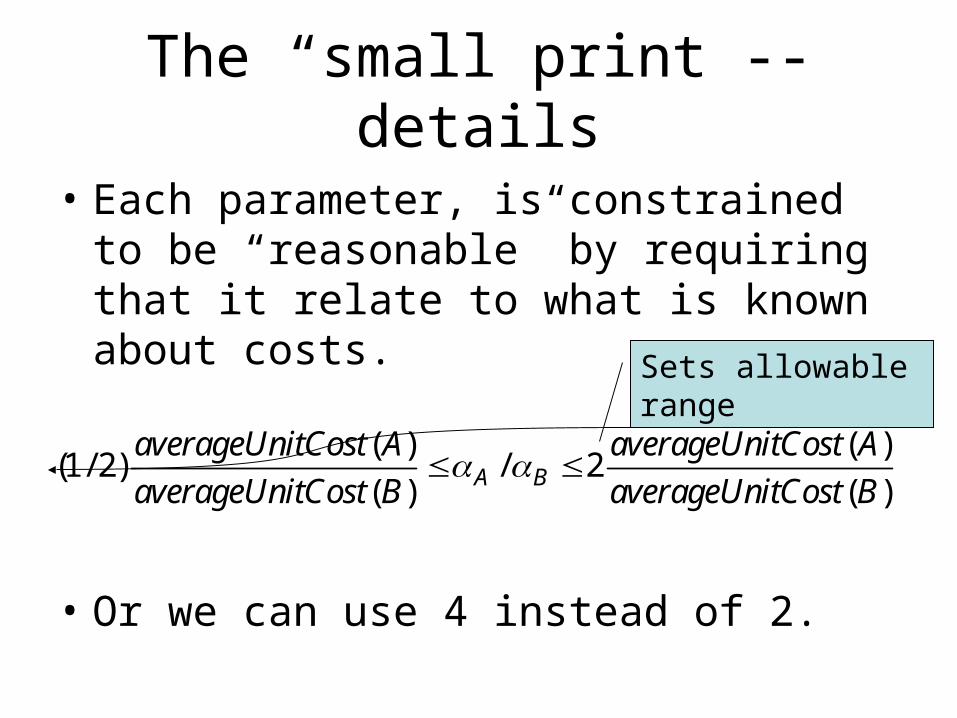
The “small print”-- details
• Each parameter, is constrained to be “reasonable” by requiring that it relate to what is known about costs.
• Or we can use 4 instead of 2.
( ) ( )(1/ 2) / 2
( ) ( )A BaverageUnitCost A averageUnitCost A
averageUnitCost B averageUnitCost B
Sets allowable range

Then divide
• Get the performance ratio that really matters– to this organization
• How to compare with others?– Charnes and Cooper found a way– let each organization select its own weights– let it choose them to make it look as good as
possible
How to compare
• If I choose weights to make my library look as good as possible
• we can use the same weights to see how efficient every other library is– if I am the most efficient– I get a “gold star”– if not– I can compare my efficiency to the best

So DEA has two steps
• 1. For each library– make it look as efficient as possible– compare it to the others– compute
• 2. Compare the efficiencies of all the libraries in a sensible “peer group”
/tomakemelook good BestMyLibraryeff e e
Input
Output
L
C
B
A
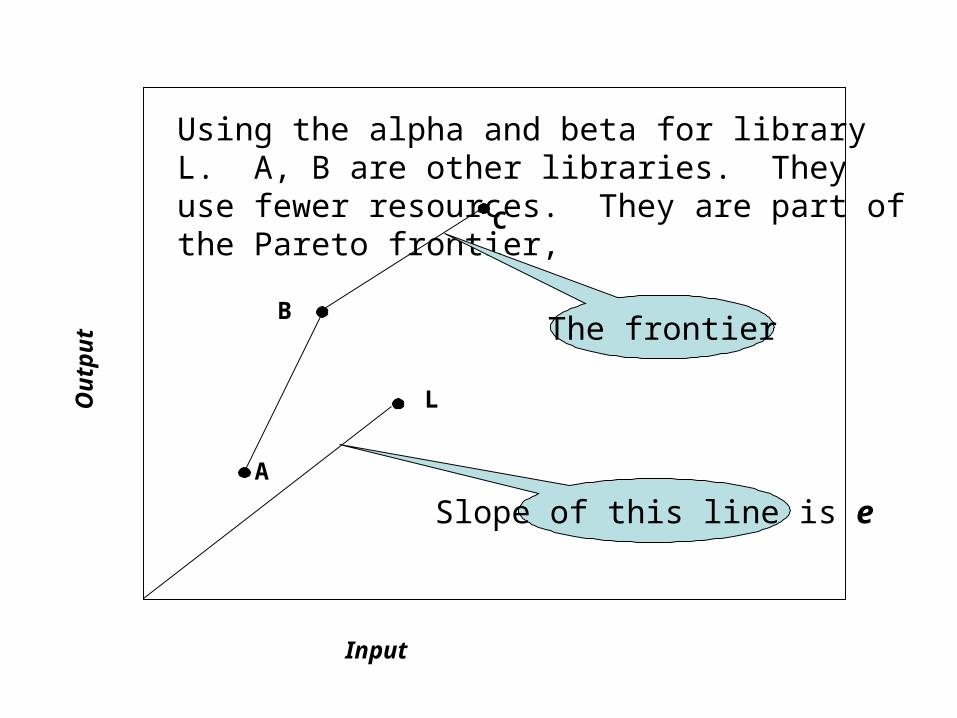
Using the alpha and beta for library L. A, B are other libraries. They use fewer resources. They are part of the Pareto frontier,
The frontier
Slope of this line is e

Output
C
B
A
Input
Output
L
C
B
A
H
ILIH
Output
L
C
B
A
Input
Output
L
C
B
A
H
ILIH
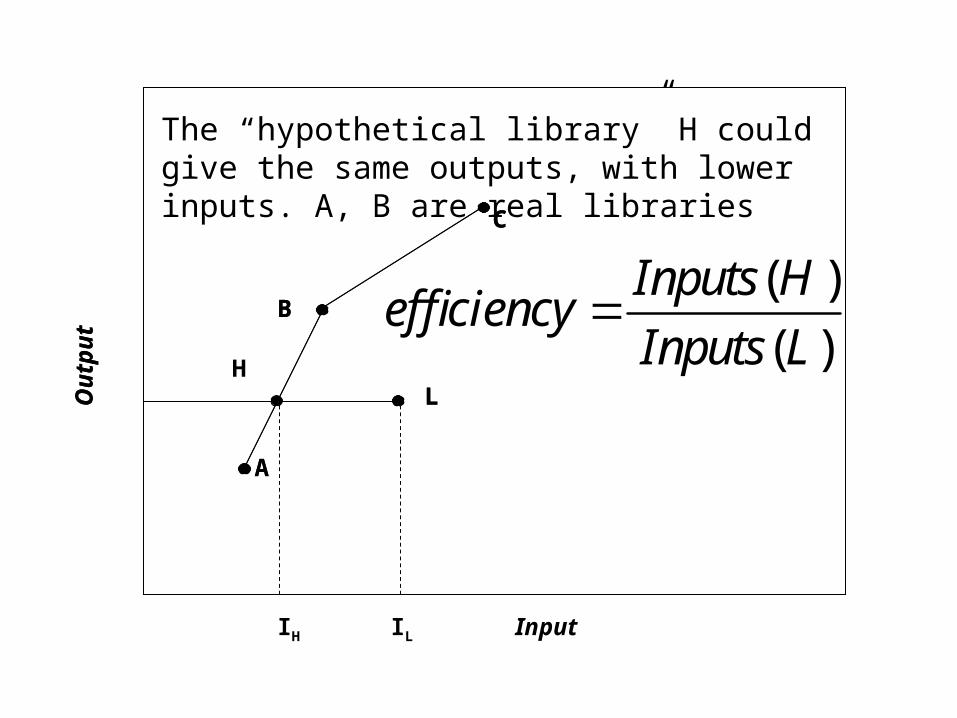
The “hypothetical library” H could give the same outputs, with lower inputs. A, B are real libraries
( )
( )
Inputs Hefficiency
Inputs L
How to do it
• Use DEA software
• Hire a bright Operational Researcher– it can be coded into Excel– but it takes some work to do it
• Assemble a group of peer libraries
• Gather the statistics
• “Crunch the numbers”

Then what?• Either a library is Pareto optimal
– no changes required
• Or it is not, because there is some set of libraries which define a more efficient way of doing precisely what this library wants to do– arrange for visits by line managers– groups supervisors– see how they do it
L
C
B
A
Input
Output
L
C
B
A
H’
OL
OH
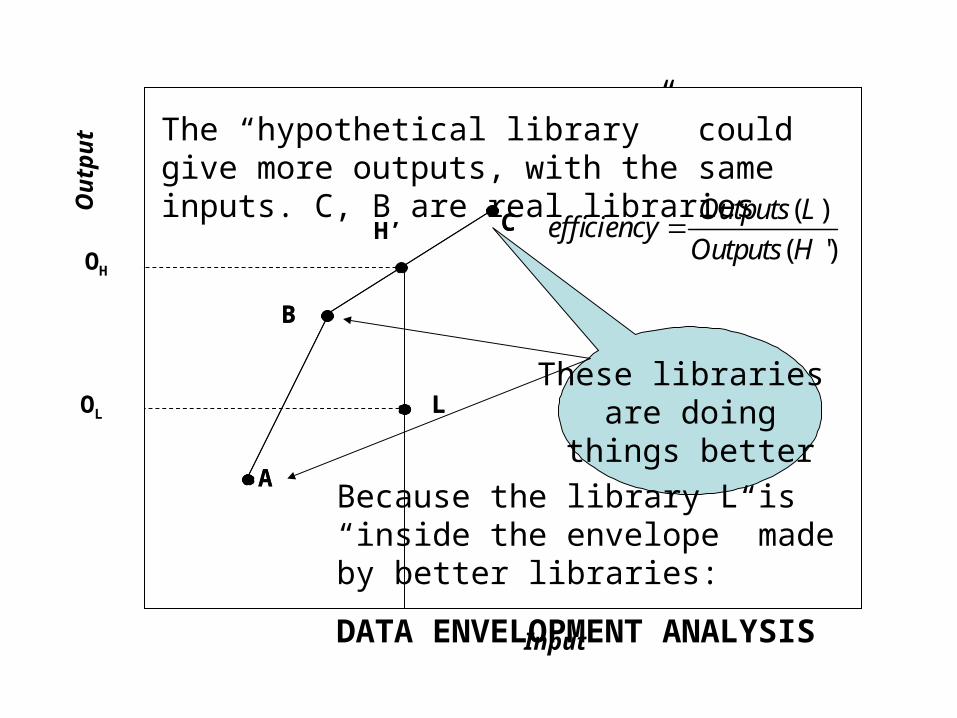
The “hypothetical library” could give more outputs, with the same inputs. C, B are real libraries
These libraries are doing
things better
( )
( ')
Outputs Lefficiency
Outputs H
Because the library L is “inside the envelope” made by better libraries:
DATA ENVELOPMENT ANALYSIS
Visiting is necessary
• The paper description of policies and procedures can conceal 4-fold efficiency or 4-fold waste. A ratio of 16 has been observed between best and worst efficiencies

Extension to digital libraries
• Need solid, measurable definitions of services– human interaction– web-based interactions
• is it the page or the book? (King: kiloword page)• is it the page or the site• is the service in the link• or in the annotation• or in the pages retrieved [!! We cannot see them!!]
Your suggestions needed• Outputs must be
– measurable• with a reasonable effort
– comparable• meaning should be the same at other libraries
– sensible • makes sense to key “Stakeholders”• library managers• funding sources• patrons

Extension to digital libaries
• Link versus Lease
• Links– with links to other open services– partners, public sites, consortia– no direct expense to the using library per use
• Leases– direct expense– recurring -- no need to amortize :)

The kinds of inputs
• Staff
• Equipment
• Software
• Training
• Licenses
• ….. Defining these is the next step
• Input measures must be available, comparable, sensible.
