european private equity ipo report - pwc nederland€¦ · the cyclical recovery of the european...
TRANSCRIPT

European private equity IPO report
November 2018
www.pwc.nl

PwC
Basis of preparation
Our analysis includes Initial Public Offerings (“IPOs”) that listed on a European stock exchange1
between 1 January 2009 and 30 June 2018. All market data is sourced from Dealogic and Bloomberg and has not been independently verified by PwC.
An IPO is considered to be private equity(“PE”)-backed if there is a financial sponsor, classified as a private equity firm, which had direct influence over the issuer at the time of IPO or if the private equity firm itself was directly involved in the transaction.
The data in this report excludes IPOs raising less than €50m in proceeds and includes exercised greenshoes.
In order to create a pure and comparable sample, only operational companies have been taken into account. Therefore, issuers with one of the following Dealogic classifications have been excluded: closed-end funds, non-equity investment companies, acquisitions/restructurings companies, capital pool companies, SPACs, SPVs, REITs and Oil & Gas royalty trusts.
Industry classifications are based on the Industry Classification Benchmark (ICB) and index adjusted performance corrects for performance of the STOXX Europe 600 index. Both are sourced from Bloomberg.
A total of 607 IPOs are included in the analysis, of which 243 are private equity-backed and 364 are non PE-backed and which raised €104.1bn and €151.2bn respectively.
November 2018European private equity IPO report
2
1) The following stock exchanges are included in the sample: Bolsas y Mercados Españoles, Borsa Istanbul, Borsa Italiana, Bucharest Stock Exchange, Budapest Stock Exchange, Deutsche Börse, Euronext Amsterdam, Euronext Brussels, Euronext Dublin, Euronext Lisbon, Euronext Paris, Kazakhstan Stock Exchange, London Stock Exchange, Luxembourg Stock Exchange, Moscow Exchange, Nasdaq Copenhagen, Nasdaq Helsinki, Nasdaq Iceland, Nasdaq Stockholm, Nasdaq Tallinn, Oslo Børs, Prague Stock Exchange, SIX Swiss Exchange, Vienna Stock Exchange, and Warsaw Stock Exchange

PwC
Number and proceeds of European IPOs
European private equity IPO report
3
November 2018

PwC
The cyclical recovery of the European IPO market kicked off in 2010 whilst the PE-backed IPO activity only started to rebound in 2013
European private equity IPO report
4
November 2018
After having been subdued during the financial crisis, European IPO activity slightly started to rebound in 2010, driven by non PE-backed issues. Whereas PE-owners only followed suit from 2013 onwards.
2015 saw the most active year for PE-backed IPO activity, both in terms of number of IPOs and money raised. The largest PE-backed IPOs that year were Worldpay and Auto Trader, while also large privatisations such as Aena and ABN AMRO took advantage of strong capital market conditions.
Figure 1 – IPO activity by PE-backed issuers
Figure 2 – IPO activity by non PE-backed issuers
2
15
10
3
23
50
54
32
43
11
0
5
10
15
20
25
30
2009 2010 2011 2012 2013 2014 2015 2016 2017 H12018
Money raised (€bn)
Money raised (€bn) Number of PE-backed IPOs
8
40
28
19
31
56 57
30
50
45
0
5
10
15
20
25
30
2009 2010 2011 2012 2013 2014 2015 2016 2017 H12018
Money raised (€bn)
Money raised (€bn) Number of non PE-backed IPOs

PwC
PE-backed IPO activity accounted for 40%–50% of total IPO activity in recent years, but this has dropped in H1 2018
European private equity IPO report
5
November 2018
Immediately following the financial crisis, PE-backed activity was still subdued. Probably because equity capital market valuations were not sufficiently attractive for portfolio companies PE owners had acquired prior to the financial crisis.
In the period 2013 to 2017, PE-backed IPOs accounted for approximately 40%-50% of total IPO activity in Europe, both in terms of number of transactions and money raised.
The surge of large European carve-outs (e.g. Siemens Healthineers, DWS Group and Elkem) in H1 2018, has led to a drop in PE-backed IPO activity as a percentage of total IPO activity compared to recent years. At the same time, after the wave of PE exits in 2013-2017 there might not be so much left in the “old” PE-portfolios, while the more recent acquisitions are not ready yet.
Average money raised per IPO over the last years has been around €400m without a clear trend regarding PE-backed vs. non PE-backed IPOs.
Figure 3 – PE-backed IPO activity as a % of total IPO activity
Figure 4 – Average money raised per IPO (in €m)
0%
10%
20%
30%
40%
50%
60%
2009 2010 2011 2012 2013 2014 2015 2016 2017 H12018
% of total IPO activity
Money raised by PE-backed IPOs as % of total
Number of PE-backed IPOs as % of total
0
100
200
300
400
500
600
700
800
900
2009 2010 2011 2012 2013 2014 2015 2016 2017 H12018
Average money raised (€m)
PE-backed IPOs Non PE-backed IPOs

PwC
The London Stock Exchange attracted most PE-backed IPOs
European private equity IPO report
6
November 2018
For the past years, the UK has seen the most active IPO market in Europe for both PE-backed and non PE-backed issuers and accounted for more than a third of all IPOs in Europe.
Nasdaq Stockholm, Deutsche Börse, Euronext Paris and Euronext Amsterdam are completing the top five exchanges by number of PE-backed IPOs.
Two of the three largest PE-backed IPOs were issued on the London Stock Exchange, the other listed on Nasdaq Copenhagen.
Figure 5 – Most active stock exchanges (by number of PE-backed IPOs)
Figure 6 – Distribution of PE-backed IPO activity, including the top three PE-backed IPOs
Dong Energy A/S€2.6bn
Worldpay Group€3.4bn
Auto Trader Group plc
€2.2bn
> 2010–20< 10
Number of PE-backed IPOs, 2009-2018 H1
35%
10% 11%
4% 3%
38% 38%
14% 9%
6%
5%
27%
36%
12% 10%
5% 4%
34%
Total IPOactivity
Non PE-backedIPO activity
PE-backedIPO activity
London Stock Exchange
Deutsche Börse
Nasdaq Stockholm
Euronext Paris
Euronext Amsterdam Other

PwC
Performance
European private equity IPO report
7
November 2018

PwC
While non PE-backed IPOs show more upside immediately post IPO, PE-backed IPOs outperform in the long run
European private equity IPO report
8
November 2018
IPOs as an asset class display an attractive performance, with a few IPOs having a current aftermarket performance of more than 1,000%.
PE-backed IPOs underperformed non PE-backed transactions within the first year post IPO by 4.0 percentage points (absolute) and 4.8 percentage points (index adjusted), respectively. A similar, albeit a slightly smaller, underperformance is observable for shorter time periods post listing.
Reasons for this might be that PE owners, which are experienced capital market participants and/or make use of external specialist advisors, have a rather firm view on the value of an asset and optimum timing of a transaction. They are therefore able to sell at higher valuation levels, limiting upside for the shares in the secondary market.
In the longer term, PE-backed IPOs outperform non PE-backed transactions. This can, among other factors, point to higher operating efficiency acquired during PE ownership.
Figure 7.1 –Average performance1
Figure 7.2 –Index adjusted average performance1
1) Current performance as per 30 June 2018
Figure 7 – Aftermarket performance of European IPOs 2009-H1 2018
5.2%5.7%
11.6%
16.9%
49.6%
7.1%9.0%
13.7%
20.9%
44.4%
0%
10%
20%
30%
40%
50%
60%
1 d
ay
per
form
an
ce
1 m
on
th p
erfo
rma
nce
6 m
on
ths
per
form
an
ce
1 y
ear
per
form
an
ce
Cu
rren
t p
erf
orm
an
ce
PE-backed IPOs Non PE-backed IPOs
5.3% 5.0%
11.0%13.1%
38.1%
7.2% 8.8%12.6%
17.9%
28.4%
0%
10%
20%
30%
40%
50%
60%
1 d
ay
per
form
an
ce
1 m
on
th p
erfo
rma
nce
6 m
on
ths
per
form
an
ce
1 y
ear
per
form
an
ce
Cu
rren
t p
erf
orm
an
ce
PE-backed IPOs Non PE-backed IPOs
Average performance relative to STOXX Europe 600 indexAverage performance

PwC
PE-backed Fevertree Drinks has the highest current index adjusted performance of all IPOs in the period 2009-H1 2018
European private equity IPO report
9
November 2018
All of the top performing PE-backed and non PE-backed IPOs are currently trading at a multiple of their offer price.
The PE-backed IPO of tonic water producer Fevertree Drinks shows the highest current index adjusted performance of +2,417%, but there are also four non PE-backed companies that currently trade at more than 1,000% of their offer price.
1) Market capitalisation is post deal and includes exercised greenshoes2) Current performance as per 30 June 2018
Figure 8 – Top five PE-backed IPOs by current performance
Figure 9 – Top five non PE-backed IPOs by current performance
Company DateMoney
raised (€m)Market cap
at IPO (€m)1 IndustryCountry of domicile/
Exchange countryCurrent index adjusted
performance2
Fevertree Drinks 04-Nov-14 119 197 Consumer Goods / +2,417%
Brenntag 29-Mar-10 748 2,575 Basic Materials / +715%
Chr. Hansen 03-June-10 742 1,670 Health Care / +500%
Amadeus IT 27-Apr-10 1,444 4,923 Technology / +467%
Kruk 19-May-11 94 170 Financials / +368%
Company DateMoney
raised (€m)Market cap
at IPO (€m)1 IndustryCountry of domicile/
Exchange countryCurrent index adjusted
performance2
NMC Health 02-Apr-12 155 468 Health Care / +1,561%
Burford Capital 16-Oct-09 86 86 Financials / +1,343%
P/F Bakkafrost 24-Mar-10 89 188 Consumer Goods / +1,315%
Plus500 19-Jul-13 57 153 Financials / +1,277%
Yoox 30-Dec-09 120 209Consumer Services
/ +725%
PwC
In terms of short term performance, recent PE-backed IPOs have generally outperformed those in prior years
European private equity IPO report
10
November 2018
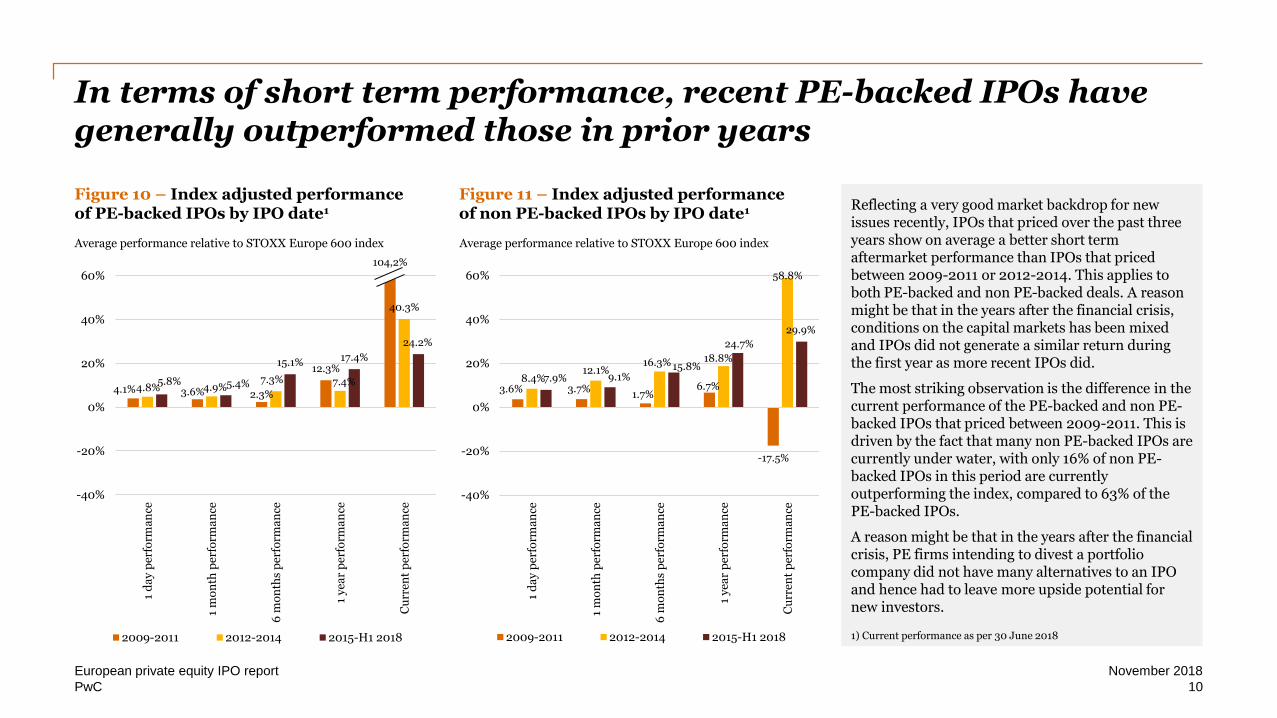
Reflecting a very good market backdrop for new issues recently, IPOs that priced over the past three years show on average a better short term aftermarket performance than IPOs that priced between 2009-2011 or 2012-2014. This applies to both PE-backed and non PE-backed deals. A reason might be that in the years after the financial crisis, conditions on the capital markets has been mixed and IPOs did not generate a similar return during the first year as more recent IPOs did.
The most striking observation is the difference in the current performance of the PE-backed and non PE-backed IPOs that priced between 2009-2011. This is driven by the fact that many non PE-backed IPOs are currently under water, with only 16% of non PE-backed IPOs in this period are currently outperforming the index, compared to 63% of the PE-backed IPOs.
A reason might be that in the years after the financial crisis, PE firms intending to divest a portfolio company did not have many alternatives to an IPO and hence had to leave more upside potential for new investors.
1) Current performance as per 30 June 2018
Figure 10 – Index adjusted performance of PE-backed IPOs by IPO date1
Figure 11 – Index adjusted performance of non PE-backed IPOs by IPO date1
Average performance relative to STOXX Europe 600 indexAverage performance relative to STOXX Europe 600 index
4.1% 3.6% 2.3%
12.3%
4.8% 4.9%7.3% 7.4%
40.3%
5.8% 5.4%
15.1% 17.4%
24.2%
-40%
-20%
0%
20%
40%
60%
1 d
ay
per
form
an
ce
1 m
on
th p
erfo
rma
nce
6 m
on
ths
per
form
an
ce
1 y
ear
per
form
an
ce
Cu
rren
t p
erfo
rma
nce
2009-2011 2012-2014 2015-H1 2018
104,2%
3.6% 3.7%1.7%
6.7%
-17.5%
8.4%12.1%
16.3% 18.8%
58.8%
7.9% 9.1%15.8%
24.7%
29.9%
-40%
-20%
0%
20%
40%
60%
1 d
ay
per
form
an
ce
1 m
on
th p
erfo
rma
nce
6 m
on
ths
per
form
an
ce
1 y
ear
per
form
an
ce
Cu
rren
t p
erfo
rma
nce
2009-2011 2012-2014 2015-H1 2018

PwC
On average, smaller IPOs have outperformed €1bn+ IPOs
European private equity IPO report
11
November 2018
In general, performances in the year following the IPO do vary by transaction size, noticeably IPOs raising less than €1bn have on average performed better than larger IPOs. This can be explained by the fact that smaller companies often have a stronger growth story.
Most striking is the current average outperformance of PE-backed IPOs raising more than €500m, compared to the current performance of non PE-backed IPOs of a similar size. This can partly be explained by lower index adjusted performance of a number of non PE-backed IPOs in industries such as Basic Materials, Utilities or Oil & Gas,. They didn’t manage to get a similar (or a better) performance than the index, despite the fact that these companies are currently trading above their offer price.
1) Current performance as per 30 June 2018
Figure 12 – Index adjusted performance of PE-backed IPOs by money raised1
Figure 13 – Index adjusted performance of non PE-backed IPOs by money raised1
Average performance relative to STOXX Europe 600 indexAverage performance relative to STOXX Europe 600 index
4.5% 4.7%
11.5%
13.9%
34.4%
8.0% 6.2% 10.7%
13.0%
52.3%
5.5% 5.1%
7.7% 6.8%
36.0%
0%
10%
20%
30%
40%
50%
60%
1 d
ay
per
form
an
ce
1 m
on
th p
erfo
rma
nce
6 m
on
ths
per
form
an
ce
1 y
ear
per
form
an
ce
Cu
rren
t p
erfo
rma
nce
< €500m €500m - €1.0bn > €1.0bn
7.9% 9.5%
12.9%
18.3%
33.6%
4.8% 6.0%
14.5%
19.3%
12.1%
3.7% 6.5%
8.6%
13.6%
4.6%
0%
10%
20%
30%
40%
50%
60%
1 d
ay
per
form
an
ce
1 m
on
th p
erfo
rma
nce
6 m
on
ths
per
form
an
ce
1 y
ear
per
form
an
ce
Cu
rren
t p
erfo
rma
nce
< €500m €500m - €1.0bn > €1.0bn

PwC
The three most active PE-backed IPO industries all outperform the STOXX Europe 600 index during the first year of trading
European private equity IPO report
12
November 2018
IPOs in the three largest industries (based on money raised by PE-backed IPOs) have all outperformed the STOXX Europe 600 index. However, in line with the general trend, on average the short term aftermarket performance of non PE-backed IPOs in these same industries was higher.
1) Current performance as per 30 June 2018
Figure 14 – Performance of PE-backed IPOs by industry
Figure 15 – Performance of non PE-backed IPOs by industry
Top three Industries
Total money raised (€bn)
Average performance relative to STOXX Europe 600 index
Top three IPOs1 day 3 months 6 months 1 year Current1
Industrials 26.8 +6.8 +5.8 +8.4 +10.0 +20.9 Worldpay GroupNets AA
Consumer Services
22.8 +4.1 +2.9 +8.5 +10.7 +20.1 Auto Trader GroupB&M European Value RetailMerlin Entertainments
Financials 18.3 +3.5 +2.1 +9.1 +12.2 +17.0 BAWAG GroupBTG Pactualesure Group
Top three Industries
Total money raised (€bn)
Average performance relative to STOXX Europe 600 index
Top three IPOs1 day 3 months 6 months 1 year Current1
Industrials 24.8 +8.5 +11.7 +13.4 +15.2 +12.5 AenaRoyal MailLandis & Gyr
Consumer Services
12.1 +8.4 +6.6 +15.0 +21.7 +46.2 Galenica SanteDKSHAO World
Financials 47.8 +4.1 +5.8 +12.4 +17.0 +34.7 ABN AMRO GroupPoste ItalianeBankia

PwC
Bookbuilding and pricing
European private equity IPO report
13
November 2018

PwC
PE-backed and non PE-backed IPOs mostly priced within the middle of their initial price range
European private equity IPO report
14
November 2018
More than 90% of the European IPOs priced within their initial price range and the majority of transactions priced around the middle of their range. On average, PE-backed issuers priced slightly more often towards the lower end of their price range than non PE-backed issuers.
Price ranges have in most transactions a breadth of around 24% with no clear trend regarding PE-backed versus non PE-backed IPOs.
1) Breadth of price range has been calculated as the difference between the high-end and low-end of the range divided by the low-end of the range multiplied by 100%2) IPOs are classified “Middle” if the offer price is in the middle 50% of the initial price range. The top and bottom 25% are classified as ‘Top range” and “Bottom range”, whereas “Above” and “Below” indicate IPOs pricing outside the price range 3) IPOs with a fixed price have been excluded from the breadth of price range calculations
Figure 16 –Pricing of largest PE-backed IPOs
Figure 17 –Pricing of largest non PE-backed IPOs
Issuer
Money raised (€m)
Filingrange
Offer Price Currency
Breadth of price range
(%)1
Worldpay Group 3,350 2.25 - 2.60 2.40 GBP 15.6%
Dong Energy 2,647 200 - 255 235 DKr 27.5%
Auto Trader Group 2,227 2.00 - 2.50 2.35 GBP 25.0%
Sunrise Communications Group
2,148 57 - 78 68 CHF 36.8%
Nets 2,113 130 - 160 150 DKr 23.1%
Issuer
Money raised (€m)
Filingrange
Offer Price Currency
Breadth of price range
(%)1
Glencore International 7,088 4.80 - 5.80 5.30 GBP 20.8%
innogy 4,641 32 – 36 36 EUR 12.5%
Aena 4,262 43 - 55 58 EUR 27.9%
Siemens Healthineers 4,200 26 – 31 28 EUR 19.2%
ABN AMRO Group 3,838 16 - 20 17.75 EUR 25.0%
Figure 18 – IPO pricing dynamics2
Figure 19 – Price range3 by money raised
Figure 20 – Price range3 by year
5% 7%
30% 27%
51% 51%
13% 15% 0% 1%
0%
20%
40%
60%
80%
100%
PE-backedIPOs
Non PE-backedIPOs
Below Bottom range Middle range Top range Above
24.0% 23.6%
25.8%
23.3%23.5%22.6%
20%
22%
24%
26%
28%
PE-backed IPOs Non PE-backed IPOs
< €500m €500m - €1.0bn > €1.0bn
10%
15%
20%
25%
30%
2009 2010 2011 2012 2013 2014 2015 2016 2017 2018
PE-backed IPOs Non PE-backed IPOs
Breadth of price range (%)1
Breadth of price range (%)1

PwC
Transaction structures
European private equity IPO report
15
November 2018

PwC
Secondary sell-downs are much more common in PE-backed IPOs
European private equity IPO report
16
November 2018
Primary proceeds, i.e. new funds raised in the IPO which go to the company, accounted for 46% of IPO proceeds from 2009 to H1 2018. The majority of IPO proceeds (54%) went to selling shareholders (secondary proceeds).
In PE-backed transactions, secondary selldowns are significantly more pronounced, as Private Equity firms often use IPOs as a first step to divest a portfolio company.
Figure 21.1 –All IPOs
Figure 21 – Primary vs. secondary proceeds in European IPOs 2009-2018 H1
Figure 21.2 –PE-backed IPOs
Figure 21.3 –Non PE-backed IPOs
46%
54%
39%
61%
50%50%
Primary proceeds Secondary proceeds

PwC
On average, PE-backed IPOs displayed a larger initial free float as compared to non PE-backed IPOs
European private equity IPO report
17
November 2018
Between 2009 and H1 2018, the average free float at IPO of PE-backed IPOs (47.8%) was higher than that of non PE-backed IPOs (39.7%).
Out of the 243 PE-backed IPOs that are included in the sample, only 3 (or 1%) saw the PE shareholder(s) sell all their shares at IPO. This compares to 8 (or 2%) of non PE-backed IPOs where 100% of the outstanding shares were offered at IPO.
The majority of companies have a free float at IPO between 25% and 50%. In addition, almost a third of PE-backed IPOs have a free float between 50% and 75%.
In contrast, more than 20% of all non PE-backed IPOs have an initial free float of less than 25%. This can partly be explained by the relatively large number of sizeable transactions (including a number of privatisations), which often have a lower initial free float.
1) Only two and three PE-backed IPOs were included in the 2009 and 2013 data respectively, distorting the trend in the figure 22
Figure 22 – Average free float at IPO1 Figure 23 – Distribution of free float at IPO
Number of IPOs (%)Free float (%)
47%
44%
52%
21%
39%
51% 50%
44%
52%
42%
46%
32%
36%37%
49%
38%
42%
37%39%
44%
0%
10%
20%
30%
40%
50%
60%
2009 2010 2011 2012 2013 2014 2015 2016 2017 H12018
PE-backed IPOs non PE-backed IPOs
7%
53%
31%
7%
1%
21%
57%
15%
5%
2%
0%
10%
20%
30%
40%
50%
60%
Less than25%
Between 25%and 50%
Between 50%and 75%
Between 75%and 100%
100% sell-down
PE-backed IPOs non PE-backed IPOs

PwC
Use of proceeds
European private equity IPO report
18
November 2018

PwC
Debt repayment is the most important driver of PE-backed IPOs
European private equity IPO report
19
November 2018
PE-backed issuers most frequently use their primary proceeds to repay debt, whereas non PE-backed issuers commonly use their IPO proceeds for growth-oriented purposes, with ‘Expansion’, ‘Investments’ and ‘Research and Development’ being the most prominent ones.
A reason for this might be that PE-backed companies come to market with a higher leverage than family, or publicly owned companies and they need to decrease the leverage to a level more accepted by capital market investors.
1) The percentages represent the number of issuers as a percentage of the total number of IPOs, that state the applicable use of primary proceeds in their prospectus. Issuers may announce multiple uses of proceeds, so the numbers do not add up to 100%
Figure 24 – Use of proceeds by number of PE-backed IPOs1
Number of IPOs
Figure 25 – Use of proceeds by number of non PE-backed IPOs1
Number of IPOs
97 86
19 18 15 6 5 3 3 3 2
-
25
50
75
100
125
150
Repay Debt GeneralCorporatePurposes
WorkingCapital
Expansion Acquisitions& Future
Acquisitions
Investments Research andDevelopment
Sales &Marketing
ProjectFinancing
Restructuring CapitalExpenditures
141
70
44 40 30 30
22 12 8 6 2
-
25
50
75
100
125
150
GeneralCorporatePurposes
Expansion Acquisitions& Future
Acquisitions
Repay Debt Investments Research andDevelopment
WorkingCapital
Sales &Marketing
ProjectFinancing
CapitalExpenditures
Restructuring

PwC
Most active PE firms
European private equity IPO report
20
November 2018

PwC
CVC and Nordic Capital were the most active PE firms on the European IPO market, with involvement in 11 IPOs each
European private equity IPO report
21
November 2018
CVC and Nordic Capital were involved in the highest number of PE-backed IPO exits, which raised a total of €9.5bn and €4.2bn respectively.
In addition, CVC was the leading PE firm in the UK with 5 IPOs on the London Stock Exchange with average money raised of more than €900m. Nordic Capital however led the ranks in Sweden with 7 IPOs on Nasdaq Stockholm. The average money raised was lower as each transaction raised less than €500m.
1) In case multiple PE firms tie at the same rank, the PE firm with the largest total PE-backed IPO proceeds has been included. If the PE firms that tied a place were involved in the same IPO, they are both included in the table2) Money raised includes total IPO proceeds , i.e. primary and secondary proceeds are included3) Hellman & Friedman and Blackstone were both involved in the IPO of Scout244) CDR and Ardian were both involved in the IPO of SPIE
Figure 26 – Most active PE firms by number of IPOs1
Figure 27 – Most active PE firms by exchange country1
Private equity firm
Number of IPO exits
Money raised (€m)2 Top three issuers
CVC 11 9,487 Sunrise Communications Group, AA, Merlin Entertainments
Nordic Capital 11 4,232 ConvaTec Group, Munters, Europris
Bain Capital 8 8,410 Worldpay Group, Nets, Brenntag
EQT 8 4,649 ISS, Terveystalo, SSP Group
Cinven 7 4,689 Amadeus, Ziggo, Numericable
Exchange country Top three PE firms (# of IPOs) per country
Top PE firms’ share of total number of IPOs per country
CVC (5), Apax (4), Oaktree (4) 14.6%
Nordic Capital (7), EQT (4), FSN (3) 40.0%
Apollo (2), Triton (2), Hellman & Friedman and Blackstone3 (1) 22.7%
Eurazeo (2), KKR (2), CDR and Ardian4 (1) 35.7%
JC Flowers (2), 3i (2), Hal Investments (1) 38.5%

PwC
Holding periods
European private equity IPO report
22
November 2018

PwC
The average PE holding period prior to executing a PE-backed IPO has been fairly stable at around five years
European private equity IPO report
23
November 2018
The average holding period of around five years before PE firms bring their portfolio companies to market via an IPO has been relatively stable for the last years. In 2013, the average holding period was 6.5 years, likely as PE firms started to exit their investments made before the financial crisis.
The distribution of holding periods is of course broader than the average holding period of five years. A number of PE firms started to sell-down within a couple of years and others have kept a company in their portfolio for over 10 years.
There are different reasons for longer or shorter holding periods, including the following:
• General strategy of the PE firm, including a certain industry focus for example
• Application of a buy-and-build strategy, whereby a portfolio company is held for a longer period of time
• Capital market conditions versus the conditions for re-financing
• Operational issues and sector/ market developments
1) Only two and three PE-backed IPOs were included in the 2009 and 2013 data respectively, distorting the trend in the figures shown on this page
Figure 28 – Average holding period prior to PE-backed IPO1
Figure 29 – Breakdown of holding periods prior to PE-backed IPO1
Proportion of totalAverage holding period (in years)
3.0
4.9 5.1
3.6
6.5
4.9
5.4 5.4
4.8 4.9
0
1
2
3
4
5
6
7
2009 2010 2011 2012 2013 2014 2015 2016 2017 H12018
Year of IPO
2
6
3
2
5
21 21 14 20
6
7
5
1
8
18
11 6
16
2
1 2
8
11
18 9
4
1 2 3 3 3
2
0%
10%
20%
30%
40%
50%
60%
70%
80%
90%
100%
2009 2010 2011 2012 2013 2014 2015 2016 2017 H12018Year of IPO
Less than 4 years 4-7 years

PwC
European IPOs by industry
European private equity IPO report
24
November 2018

PwC
PE-backed IPO activity has mainly been driven by the Industrials and Consumer Services industries
European private equity IPO report
25
November 2018
PE-backed IPO activity is centred around a selected number of industries, while non PE-backed activity is distributed more widely.
Most PE-backed IPO proceeds were raised by companies in the Industrials industry, but Consumer Services has been the most active industry in terms of number of PE-backed IPOs. Together, the Industrials and Consumer Services industries accounted for almost half the PE-backed IPO activity.
The Financials industry (including real estate) came in third for PE-backed IPOs in terms of both proceeds and number of IPOs, whereas this was by far the most active industry for non PE-backed IPOs driven by post-crisis (re)privatisations.
The Utilities and Oil & Gas industries were the least active industries for PE-backed IPO activity, which is in line with the traditional private equity investment preferences.
1) Industries are sorted by PE-backed IPO proceeds
Figure 30 – IPO activity by industry1
Money raised (€bn) Number of IPOs
Industrials
Consumer Services
Financials
Consumer Goods
Health Care
Technology
Telecommunications
Basic Materials
Utilities
Oil & Gas€ 6,6bn
€ 12,4bn
€ 16,0bn
€ 9,5bn
€ 3,5bn
€ 7,9bn
€ 10,6bn
€ 47.8bn
€12,1bn
€ 24,8bn
€ 0,6bn
€ 2,9bn
€ 3,0bn
€ 4,8bn
€ 5,3bn
€ 8,5bn
€ 11,1bn
€ 8,3bn
€ 2,8bn
€ 26,8bn
PE-backed IPOs Non PE-backed IPOs
25
16
17
11
17
30
38
92
51
67
3
2
9
5
11
27
34
41
58
53

PwC
Support Services drove IPO activity in the Industrials industry
European private equity IPO report
26
November 2018
The Industrials’ subsector Support Services, which includes companies with operations other than heavy industrials, was the driving force behind activity in the Industrials industry. The Support Services subsector includes amongst others non-financial service providers, payment service providers like Worldpay and Adyen, employment agencies and waste and disposal companies.
The most active subsector by number of transactions was General Retailers with the IPOs of B&M European Value Retail and Delivery Hero being the largest PE-backed transactions.
Figure 31 – Activity per subsector of the top PE-backed IPO industries
Industry SectorNumber of
PE-backed IPOs Money raised (€bn)
Industrials
Support Services 21 15.8
Construction & Materials 13 4.0
Industrial Transportation 7 2.8
Other 12 4.3
Consumer Services
General Retailers 26 9.0
Travel & Leisure 23 8.2
Media 4 3.5
Other 5 2.1
Financials
Financial Services 17 6.0
Banks 10 5.5
Real Estate Investment & Services 8 4.0
Other 6 2.8

PwC
Top European IPOs 2009 – H1 2018
European private equity IPO report
27
November 2018

PwC
UK IPOs dominate the list of largest PE-backed transactions
European private equity IPO report
28
November 2018
Five out of the top ten largest PE-backed IPOs came out of the UK and an additional three out of Denmark.
The most active years for large-cap transactions were 2015 and 2016, when capital markets showed benign conditions for issuers.
Figure 32 – Top ten PE-backed IPOs 2009-H1 2018 by money raised
1) Market capitalisation is post deal and includes exercised greenshoes2) IPOs are classified “Middle” if the offer price is in the middle 50% of the initial price range. The top and bottom 25% are classified as ‘Top range” and “Bottom range”, whereas “Above” and “Below” indicate IPOs pricing outside the price range 3) Current performance as per 30 June 2018
Issuer Date
Money raised
(€m)Market cap
at IPO (€m)1 Industry
Country of domicile/
Exchange countryPrivate Equity firm Pricing2
Index adjusted performance
1 day Current3
Worldpay Group 13-Oct-15 3,350 6,473 Industrials /Advent, Bain Capital
Middle +11% +72%
Dong Energy 09-Jun-16 2,647 13,200 Utilities /Goldman Sachs
Middle +11% +54%
Auto Trader Group 19-Mar-15 2,227 3,283 Consumer Services / Apax Middle +8% +86%
Sunrise Communications Group
05-Feb-15 2,148 2,890 Telecommunications / CVC Middle +12% +17%
Nets 23-Sep-16 2,113 4,024 Industrials /Advent, ATP, Bain Capital
Middle -3% 0%
ConvaTec Group 26-Oct-16 1,782 4,931 Health Care /Avista, Nordic Capital
Bottom range
0% -16%
AA 23-Jun-14 1,733 1,733 Industrials /Charterhouse, CVC, Permira
Middle -7% -59%
BAWAG Group 24-Oct-17 1,680 4,800 Financials / CerberusBottom range
-3% -14%
Pandora 05-Oct-10 1,524 3,617 Consumer Goods / Axcel Middle +24% +65%
B&M European Value Retail
11-Jun-14 1,456 3,340 Consumer Services / CD&R Middle +6% +40%
PwC
Continental European issuers are more prominent in top largest non PE-backed IPOs
European private equity IPO report
29
November 2018
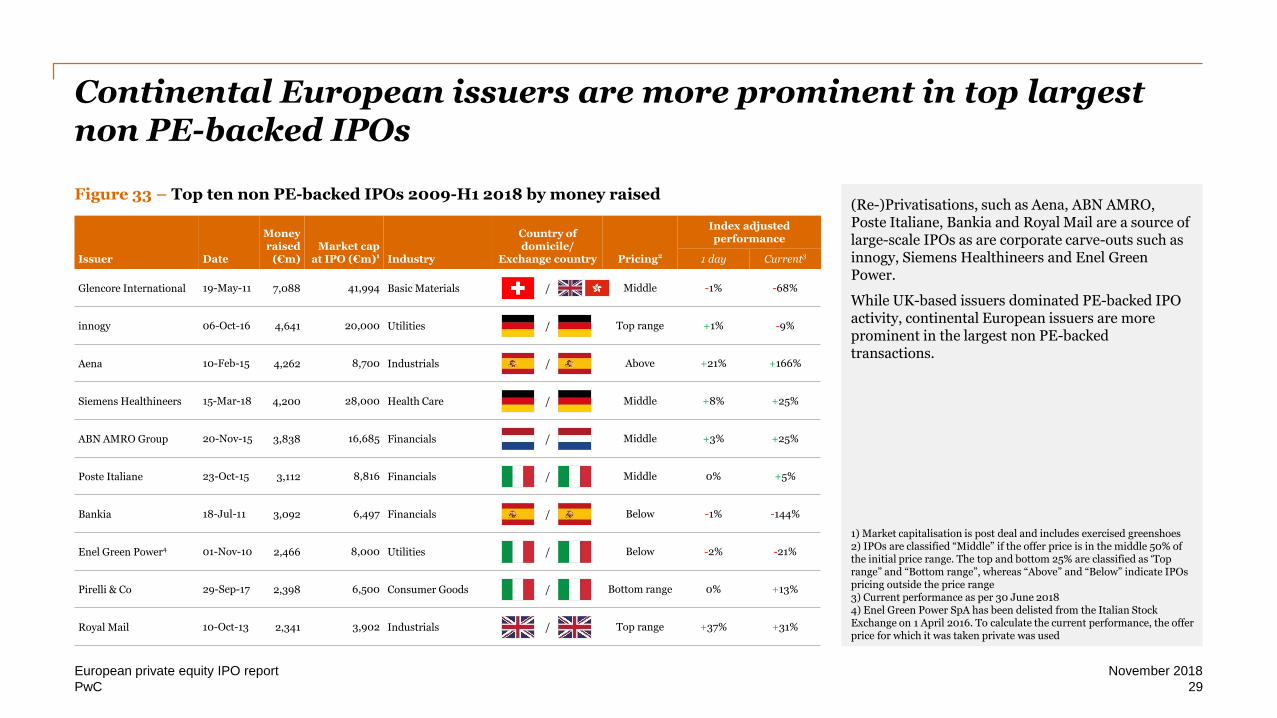
(Re-)Privatisations, such as Aena, ABN AMRO, Poste Italiane, Bankia and Royal Mail are a source of large-scale IPOs as are corporate carve-outs such as innogy, Siemens Healthineers and Enel Green Power.
While UK-based issuers dominated PE-backed IPO activity, continental European issuers are more prominent in the largest non PE-backed transactions.
Figure 33 – Top ten non PE-backed IPOs 2009-H1 2018 by money raised
1) Market capitalisation is post deal and includes exercised greenshoes2) IPOs are classified “Middle” if the offer price is in the middle 50% of the initial price range. The top and bottom 25% are classified as ‘Top range” and “Bottom range”, whereas “Above” and “Below” indicate IPOs pricing outside the price range 3) Current performance as per 30 June 20184) Enel Green Power SpA has been delisted from the Italian Stock Exchange on 1 April 2016. To calculate the current performance, the offer price for which it was taken private was used
Issuer Date
Money raised
(€m)Market cap
at IPO (€m)1 Industry
Country of domicile/
Exchange country Pricing2
Index adjusted performance
1 day Current3
Glencore International 19-May-11 7,088 41,994 Basic Materials / Middle -1% -68%
innogy 06-Oct-16 4,641 20,000 Utilities / Top range +1% -9%
Aena 10-Feb-15 4,262 8,700 Industrials / Above +21% +166%
Siemens Healthineers 15-Mar-18 4,200 28,000 Health Care / Middle +8% +25%
ABN AMRO Group 20-Nov-15 3,838 16,685 Financials / Middle +3% +25%
Poste Italiane 23-Oct-15 3,112 8,816 Financials / Middle 0% +5%
Bankia 18-Jul-11 3,092 6,497 Financials / Below -1% -144%
Enel Green Power4 01-Nov-10 2,466 8,000 Utilities / Below -2% -21%
Pirelli & Co 29-Sep-17 2,398 6,500 Consumer Goods / Bottom range 0% +13%
Royal Mail 10-Oct-13 2,341 3,902 Industrials / Top range +37% +31%

PwC
The ten largest PE-backed IPOs listing in H1 2018 originated from nine different countries
European private equity IPO report
30
November 2018
The ten largest PE-backed IPOs in H1 2018 originated from nine different countries and listed on just as many different stock exchanges.
The aftermarket performance of PE-backed IPOs shows some mixed results. With seven out of the top ten PE-backed IPOs underperforming the index. This reflects the more challenging conditions in capital markets with raising concerns over trade wars and an upcoming end to loose monitory policy.
Payment processor Adyen, the largest European PE-backed IPO in H1 2018, priced at the top of the initial price range. Nevertheless, Adyen’s share price jumped up on its first trading day and had an index adjusted performance of +99% at the 30th of June, 2018.
Figure 34 – Top ten PE-backed IPOs H1 2018 by money raised
1) Market capitalisation is post deal and includes exercised greenshoes2) IPOs are classified “Middle” if the offer price is in the middle 50% of the initial price range. The top and bottom 25% are classified as ‘Top range” and “Bottom range”, whereas “Above” and “Below” indicate IPOs pricing outside the price range 3) Current performance as per 30 June 2018
Issuer Date
Money raised
(€m)Market cap
at IPO (€m)1 Industry
Country of domicile/
Exchange countryPrivate Equity firm Pricing2
Index adjusted performance
1 day Current3
Adyen 12-Jun-18 947 7,067 Industrials /General Atlantic
Top range
+89% +99%
Avast 10-May-18 688 2,722 Technology / CVC, SummitBottom range
-1% -12%
CEVA Logistics 03-May-18 687 952 Industrials / Apollo Bottom range
-6% -15%
Vivo Energy 04-May-18 684 2,245 Consumer Services / Helios Middle +4% -9%
Netcompany Group 07-Jun-18 479 1,041 Technology / FSN Middle +30% +53%
NIBC Holding 23-Mar-18 320 1,291 Financials /aPriori, JC Flowers & Co
Bottom range
-2% -11%
JTC 14-Mar-18 273 347 Financials / CBPE Middle +9 +31
MLP Saglik Hizmetleri 07-Feb-18 268 845 Health Care / Turkven Below -1% -26%
Bygghemma Group First 27-Mar-18 138 354 Consumer Services / FSN Middle -13% -17%
Harvia 21-Mar-18 58 93 Consumer Goods / CapManBottomrange
+2% +19%

PwC
In line with PE-backed IPOs, the top ten largest non PE-backed IPOs were executed by companies from a diverse range of countries
European private equity IPO report
31
November 2018
The ten largest non PE-backed IPOs in H1 2018 originated from eight different countries.
The top non PE-backed IPOs in H1 2018 were larger on average compared to PE-backed IPOs due to Siemens Healthineers, which was not only the largest non PE-backed IPO in Europe, but also the largest IPO globally in H1 2018.
Although still mixed, aftermarket performance is slightly better compared to PE-backed IPOs with only four deals underperforming the broader index. This seems to reflect investors’ preference for large names with differentiated stories, which are likely to enter an index post IPO.
Half of the top ten issuers are active in the Financials industry, of which four are Real Estate companies.
Figure 34 – Top ten non PE-backed IPOs H1 2018 by money raised
1) Market capitalisation is post deal and includes exercised greenshoes2) IPOs are classified “Middle” if the offer price is in the middle 50% of the initial price range. The top and bottom 25% are classified as ‘Top range” and “Bottom range”, whereas “Above” and “Below” indicate IPOs pricing outside the price range3) Current performance as per 30 June 2018
Issuer Date
Money raised
(€m)Market cap
at IPO (€m)1 Industry
Country of domicile/
Exchange country Pricing2
Index adjusted performance
1 day Current3
Siemens Healthineers 15-Mar-18 4,200 28,000 Health Care / Middle +8% +25%
DWS Group 22-Mar-18 1,333 6,500 Financials / Middle +3% -24%
Elkem 21-Mar-18 742 1,774 Basic Materials / Bottom range -3% +30%
Metrovacesa 02-Feb-18 646 2,503 Financials / Below -1% -9%
Kojamo 14-Jun-18 553 2,101 Financials / Bottom range +2% +11%
SoK Marketler Ticaret 14-May-18 445 1,179 Consumer Services / Below -4% -13%
Amigo Holdings 29-Jun-18 407 1,479 Financials / Middle range +3% +3%
Instone Real Estate Group
13-Feb-18 390 795 Financials / Bottom range -3% +3%
B&S Group 22-Mar-18 381 1,221 Consumer Services / Bottom range +1% -5%
Godewind Immobilien 28-Mar-18 375 435 Financials / Middle range -9% -8%

PwC
Contacts
European private equity IPO report
32
November 2018
Capital markets Private Equity leaders
Nadja PicardPartner
Tel: +49 151 1427 0382 [email protected]
Carsten StäckerPartner
Tel: +49 170 457 [email protected]
Christine ReschSenior Manager
Tel: +49 160 9126 [email protected]
Martin CoenenPartner
Tel: +31 6 2001 [email protected]
Jan-Willem de GrootDirector
Tel: +31 6 5393 [email protected]
Christine van den BosManager
Tel: +31 6 2095 [email protected]
Remco van DaalPartner
Tel: +31 8 8792 [email protected]
Steve RobertsPartner
Tel: +49 699 585 [email protected]

© 2018 PwC. All rights reserved.
PwC refers to the PwC network and/or one or more of its member firms, each of which is a separate legal entity. Please see
www.pwc.com/structure for further details. This content is for general information purposes only, and should not be used as a
substitute for consultation with professional advisors.
At PwC, our purpose is to build trust in society and solve important problems. We're a network of firms in 158 countries with
more than 236,000 people who are committed to delivering quality in assurance, advisory and tax services. Find out more and
tell us what matters to you by visiting us at www.pwc.com.
www.pwc.com