european gold forum -...
TRANSCRIPT

TSX:TGZ / OTCQX:TGCDF
European Gold ForumApril 17-19, 2018
Building The Next Multi-Asset Mid-Tier
West African Gold Producer

Paul ChawrunChief Operating Officer
2

Forward-Looking Statements
3
This document contains certain statements that constitute forward-looking information within the meaning of applicable securities laws ("forward-looking statements"), whichreflects management's expectations regarding Teranga's future growth opportunities, results of operations, performance (both operational and financial) and business prospects(including the timing and development of new deposits and the success of exploration activities) and other opportunities. Wherever possible, words such as “plans”, “expects”,“does not expect”, “scheduled”, “trends”, “indications”, “potential”, “estimates”, “predicts”, “anticipate”, “to establish” or “does not anticipate”, “believe”, “intend”, “ability to” andsimilar expressions or statements that certain actions, events or results “may”, “could”, “would”, “might”, “will”, or are "likely" to be taken, occur or be achieved, have been used toidentify such forward looking information. Specific forward-looking statements include, without limitation, all disclosure regarding possible events, conditions or results ofoperations, future economic conditions and anticipated courses of action. Although the forward-looking statements contained in this document reflect management's currentbeliefs based upon information currently available to management and based upon what management believes to be reasonable assumptions, Teranga cannot be certain thatactual results will be consistent with such forward-looking information. Such forward-looking statements are based upon assumptions, opinions and analysis made bymanagement in light of its experience, current conditions and its expectations of future developments that management believe to be reasonable and relevant but that may proveto be incorrect. These assumptions include, among other things, the ability to obtain any requisite governmental approvals, the accuracy of mineral reserve and mineral resourceestimates, gold price, exchange rates, fuel and energy costs, future economic conditions, anticipated future estimates of free cash flow, and courses of action. Teranga cautionsyou not to place undue reliance upon any such forward-looking statements.
The risks and uncertainties that may affect forward-looking statements include, among others: the inherent risks involved in exploration and development of mineral properties,including government approvals and permitting, changes in economic conditions, changes in the worldwide price of gold and other key inputs, changes in mine plans and otherfactors, such as project execution delays, many of which are beyond the control of Teranga, as well as other risks and uncertainties which are more fully described in Teranga'sAnnual Information Form dated March 30, 2017, and in other filings of Teranga with securities and regulatory authorities which are available at www.sedar.com. Teranga does notundertake any obligation to update forward-looking statements should assumptions related to these plans, estimates, projections, beliefs and opinions change. Nothing in thisdocument should be construed as either an offer to sell or a solicitation to buy or sell Teranga securities. All references to Teranga include its subsidiaries unless the contextrequires otherwise.
This presentation is as of April 16, 2018. All references to Teranga include its subsidiaries unless the context requires otherwise. This presentation contains references to Terangausing the words “we”, “us”, “our” and similar words and the reader is referred to using the words “you”, “your” and similar words. All dollar amounts stated are denominated in U.S.dollars unless specified otherwise.

Senegal
Côte d’Ivoire
Burkina Faso
Mali
Guinea
Guinea-Bisseau
The Gambia
GhanaBenin
Niger
Sierra Leone
Liberia
Togo
Sabodala Gold Mine• Long-life mine• More than 1.4Moz production
since late 2010
4
Wahgnion Development Project • Expect to close financing and
commence construction in Q2 2018• Reserve update expected by mid-year
Golden Hill Exploration JV• Initial resource expected in 2018• Fully funded to feasibility
GourmaExploration JV
Guitry
Dianra
Mahepleu
Tiassale
Sangaredougou
Building The Next Multi-Asset Mid-Tier Gold Producer in Mining-Friendly West Africa
Teranga has nearly 4.0 million ounces of
gold reserves from its Sabodala Gold Mine
and its WahgnionDevelopment Project(1)(2)
Afema
Refer to Appendix – Endnotes (1) and (2)

Achieved record production of 233,267 ozof gold
Increased Sabodala reserves by 400,000 ozand filedupdated NI 43-101(2)
Announced positive feasibility for Wahgnion Project includingreserves of1.2Moz(1)
Positive drill results from Golden Hill
Entered into joint venture on Afema land package in Côte d’lvoire
FY2017 Highlights
5
Refer to Appendix – Endnotes (1) and (2)

6
Prospectors & Developers Association of Canada2017 Environmental & Social Responsibility Award
United Nations Global CompactNetwork Canada Sustainability Award
3X Winner of Corporate Knights Future 40 Responsible Corporate Leaders in Canada
Capital Finance International: Best ESGResponsible Mining Management West Africa
Leading With Our Social License

SabodalaSenegal, West Africa
7

8
Exploration ProspectsMineral ResourcesMasato Style Bulk Tonnage Gold Trend Golouma Style High-Grade Gold Trend Mining ConcessionExploration PermitsPrevious Mine License
SabodalaMill
Sabodala Mine License & Regional Land Package
Largest Gold Producer in Senegal:Continuing to Replace Reserves, Strong 5-Year Profile
Refer to Appendix – Endnotes (2) and (9)
Mali
Niakafiri
GoumbatiWest
Life of Mine Summary(2)
5 years(2018-2022)
13 years (2018-2030)
Annual production 213koz 176koz
All-in sustaining costs $885/oz $893/oz
Total free cash flow $230M $556M
2.7Moz2P Reserves
4.4MozM&I Resources(9)
13-YearMine Life(9)
Wahgnion ProjectBurkina Faso, West Africa
9

10
Solid Start to Teranga’s Second Mine – Wahgnion
Nogbele
Stinger15km from plant
Samavogo25km from plant
Fourkoura6km from plantLife of Mine Summary
Initial5.5 years
LOM(9 years)
Annual production(1) 131koz 119koz
All-in Sustaining Costs* $807/oz $843/oz
Total free cash flow* $302M $409M
Pre-production capital ($232M)
Net cash flow $176M
*Refer to Appendix – Non-IFRS Performance MeasuresRefer to Appendix – Endnote (1)
1.2Moz2P
Reserves
1.8MozM&I
Resources(1)
0.7MozInferred
Resources(1)
Wahgnion Development ProjectPermitted mining license: 89 km2
Exploration licenses:+1,000 km2
Four initial deposits at Wahgnion(Nogbele, Samavogo, Fourkoura& Stinger) located in close proximityto proposed plant site
Proposed Processing Plant

11
Near-Term Upside Potential at Wahgnion: Reserve Update Expected by Mid-Year
Completed 73,000-Metre Targeted Infill Drill Program• Infill drill program is targeting inferred resources
located near to the current reserve pits • Objective is to increase drill hole density within the
existing inferred resources
Aiming for a Conversion Rate of 25%-50% of Inferred• Given demonstrated continuity of mineralization of the
inferred resources, 25%-50% of inferred resources is targeted to be converted to indicated
Target Area Along Strike
Target Area at Depth
$1,450 Resource Pit Limit
$1,200Reserves Pit Limit

Kafina West
RaulHillside
12
Significant Mid to Long-Term Upside Potential
Samavogo
Nogbele
FourkouraStinger
Bagu Sud
Korindougou
Ouahiri
Sud
Regional Exploration Includes ~12 Drill-Ready Targets
• Targets have potential to become resources and are within trucking distance of proposed plant site
• Konatvogo: 2,000-metre NW-trending anomaly between Fourkoura and Nogbele deposits. Up to 21.6 g/t Au from altered shear-hosted quartz vein outcrops
• Bassongoro: 1,500-metre NNE-trending soil and auger anomaly (up to 15g/t Au). Intersection of regional Nianka and Fourkoura structures undrilled
Raul
Proposed Plant Site
Kondandougoug
Konatvogo
Bazogo
Bassongoro
Samavogo North
MuddhiPetit Colline
Reserve Deposits
Exploration Targets

13
Next Steps at Wahgnion
Q22018
Mid2018
YE2019
Close project debt financing and
commence plant construction
2018-19
Update reservesUpdate NI 43-101
Continue exploration to further enhance project profile and
economics
Anticipated first gold pour at Wahgnion

Golden HillBurkina Faso
14

15
Sources¹ Semafo Corporate Presentation (Mar 2017)² Roxgold Corporate Presentation (Feb 2017)³ Endeavour Corporate Presentation (Feb 2017)⁴ Acacia Preliminary Results (Feb 2017)⁵ Savary Corporate Presentation (Mar 2017)
M&I Resources are inclusive of P&P Reserves
Uniquely Positioned: High-Grade, Big Potential Siou PitM&I: 0.89 Moz ¹
ManaM&I: 3.63 Moz ¹
HoundéM&I: 2.55 Moz ³
YaramokoM&I: 0.81 Moz ²
Acacia JVs ⁴
Karankasso JVInf: 0.67 Moz ⁵
South Houndé JVInf: 2.10 Moz ⁴
Sarama Permits
Teranga’s Golden Hill
JV
Situated in the Heart of the Houndé Belt (Burkina Faso)
• 468 km2 situated ~250 km NE of Wahgnion
• One of the most prospective gold belts in the world
• In close proximity and along strike to other deposits
One of the Best High-Grade Projects in West Africa
• Plan to release an initial resource for Golden Hill’s most advanced prospects by end of 2018
• $25 million financing secured for the future advancement of Golden Hill feasibility study
Joint Venture with Boss Resources (51%, earning 80%)
• Teranga, as the operator, can earn an 80% interest in the JV upon delivery of a feasibility study and the payment of AUD2.5 million

16
Five Prospects Within ~5-Kilometre Radius of Central Point
• In just one year, there have been three discoveries at Golden Hill
• To date Golden Hill has produced a series of high-grade, near-surface drill results at the first five prospects:
– Ma– Jackhammer Hill– Peksou– C-Zone– Nahiri
• The close proximity of these targets and prospects lends itself to a central mill/multi-deposit operation similar to Sabodala and Wahgnion
For full details on Golden Hill, please visit www.terangagold.com
Rapidly Progressing Towards an Initial Resource
GEOLOGYTarkwaian Type Sediments
Volcano Sediments
Mixed Volcano Sediments & Volcanics
Basalt
Grantoid
Batholith
Ma North
Ma Main
Ma East
Jackhammer Hill
PeksouC-ZoneB-Zone
A-Zone
Nahiri

1717
Ma Prospect – Representative Drill Section Ma Prospect – Drill Plan
Excellent Grades Near Surface and to Depth at Ma Prospect

Extracting Potential at Jackhammer Hill Prospect
18
Jackhammer Hill Prospect – Representative Drill SectionJackhammer Hill Prospect – Drill Plan

Côte d’Ivoire ExplorationGuitry & Afema
19

Exciting Opportunities in Côte d’Ivoire
Initial 5 Greenfield Exploration Tenements Totaling +1,800 km2
• Positive preliminary results at the Guitry prospect have made it a priority
• 3 km x 7 km gold-in-soil geochemical anomaly
• First ever drilling evaluation just completed – 3,500-metre air-core program
Recently Added 1,400 km2 Afema Land Package• Afema land package includes:
– mine license– three exploration permits (Ayame, Mafere, Aboisso)
Endeavour
Endeavour
Perseus
Randgold
Côte d’Ivoire
Guitry
Tiassale
Mahepleu
Sangaredougou
Operating Gold Mine/ Development Project
Newcrest
Dianra
20
Afema

Ahafo17 Moz
Newmont
3 Afema Exploration
Permits
Afema Mining Permit
Bibiani7 Moz
Resolute
Chirano5 Moz
Kinross
Edikan6.6 MozPerseus
Bogoso/Prestea18 Moz Gold Star
Konogo1.4 MozSignature Metals
Akyem Newmont
Essase 5.19 Moz
Obotan5.5 MozAsanko Obuasi 41 Moz
Anglo Gold Ashanti
Kubi 0.9 MozAsaute Gold Corporation
Damang 7.1 MozGoldfields
Tarkwa 24 Moz
Iduapriem8.2 MozAngloGold Ashanti
Kumasi
Cape Coast
Sefwi-BibianiGold Belt
AsankrangwaGold Belt
Ashanti Gold Belt
Winneba-KibiGold Belt
21
Afema: Historical Resource* of 2Moz of Gold
Well Located Geologically
• Along trend and within the same gold belts of a number of high profile producing mines in Ghana
JV With Sodim Limited (51%, earning 70%)
• Teranga can earn a 70% interest in the Afema mining license and exploration permits through:
– completion of a 3-year $11M exploration and community relations work program
– delivery of an updated technical study
• Teranga will sole fund and manage the exploration programs and studies
*Refer to Appendix – Afema Mine License Historical Resource Estimate
Ghana
Côte d’Ivoire

Wrap-Up
22
2018 2019 2020 2021 2022 2023 2024 2025 2026 2027 2028
~$100M annual free cash flow* (11)
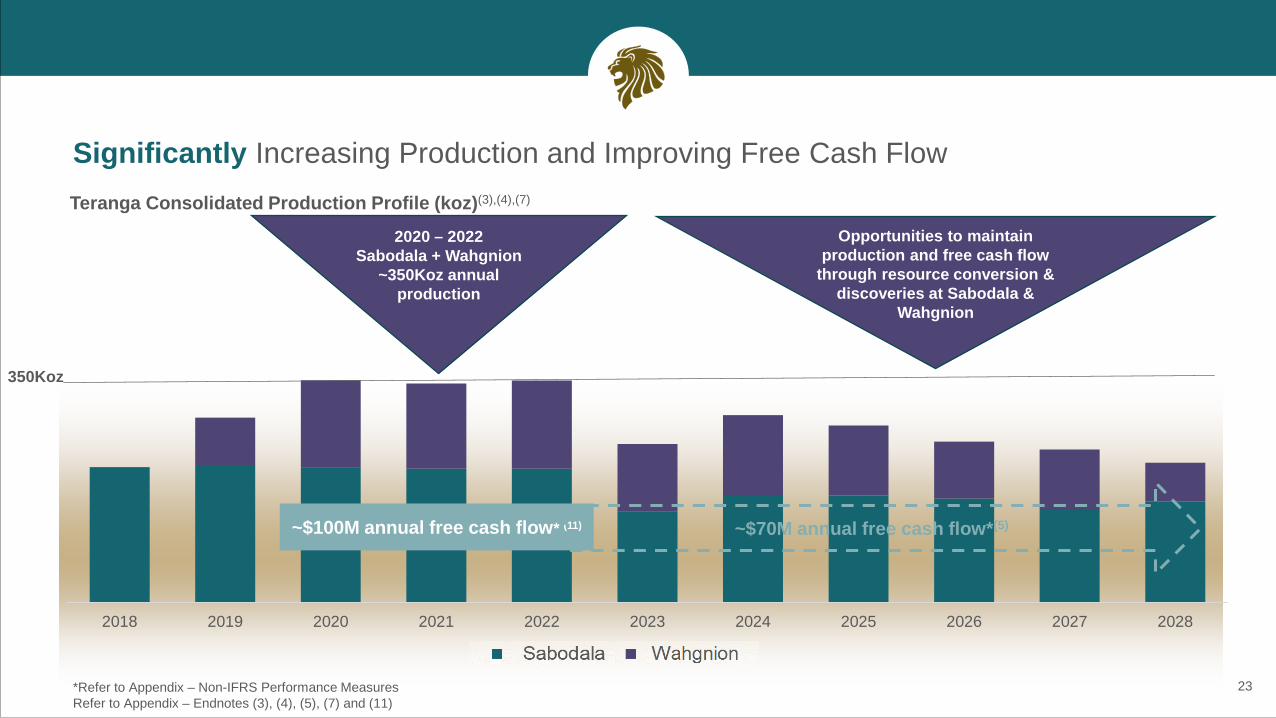
Significantly Increasing Production and Improving Free Cash Flow
23*Refer to Appendix – Non-IFRS Performance MeasuresRefer to Appendix – Endnotes (3), (4), (5), (7) and (11)
Teranga Consolidated Production Profile (koz)(3),(4),(7)
350Koz
~$70M annual free cash flow*(5)
2020 – 2022 Sabodala + Wahgnion
~350Koz annual production
Opportunities to maintain production and free cash flow
through resource conversion & discoveries at Sabodala &
Wahgnion

Strong Financial Position to Fund Construction of Second Mine
24
$88 MillionCash balance
as at December 31, 2017
+$90 Million(6)
Estimated cash flow from Sabodala 2018-2019
$165 Million$165M (net $150M)
project debt facility expected to close in Q2 2018
Solid Financial Position
to fund pre-production capital cost
of building second mine (Wahgnion)
Refer to Appendix – Endnote (6)
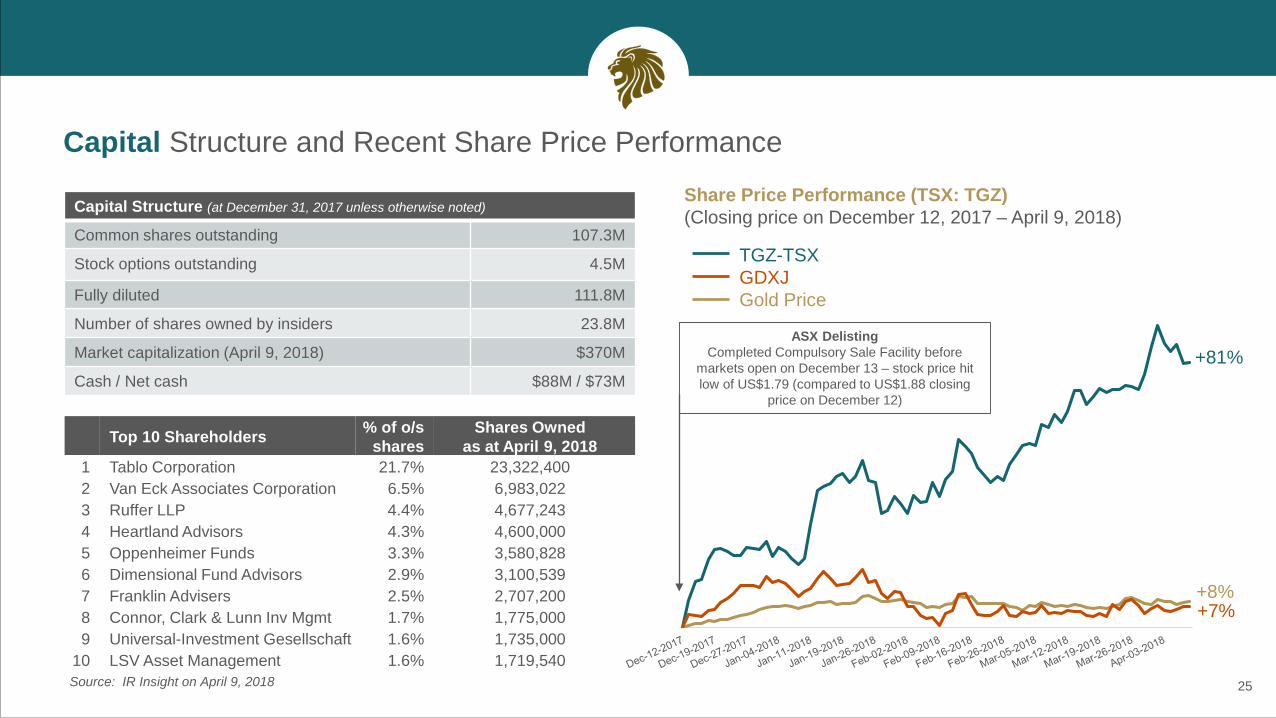
Top 10 Shareholders % of o/s shares
Shares Ownedas at April 9, 2018
1 Tablo Corporation 21.7% 23,322,400 2 Van Eck Associates Corporation 6.5% 6,983,022 3 Ruffer LLP 4.4% 4,677,243 4 Heartland Advisors 4.3% 4,600,000 5 Oppenheimer Funds 3.3% 3,580,828 6 Dimensional Fund Advisors 2.9% 3,100,5397 Franklin Advisers 2.5% 2,707,2008 Connor, Clark & Lunn Inv Mgmt 1.7% 1,775,0009 Universal-Investment Gesellschaft 1.6% 1,735,000
10 LSV Asset Management 1.6% 1,719,54025
Share Price Performance (TSX: TGZ)(Closing price on December 12, 2017 – April 9, 2018)
Capital Structure and Recent Share Price Performance
Source: IR Insight on April 9, 2018
ASX DelistingCompleted Compulsory Sale Facility before
markets open on December 13 – stock price hit low of US$1.79 (compared to US$1.88 closing
price on December 12)
+8% +7%
+81%
TGZ-TSXGDXJGold Price
Capital Structure (at December 31, 2017 unless otherwise noted)
Common shares outstanding 107.3M
Stock options outstanding 4.5M
Fully diluted 111.8M
Number of shares owned by insiders 23.8M
Market capitalization (April 9, 2018) $370M
Cash / Net cash $88M / $73M
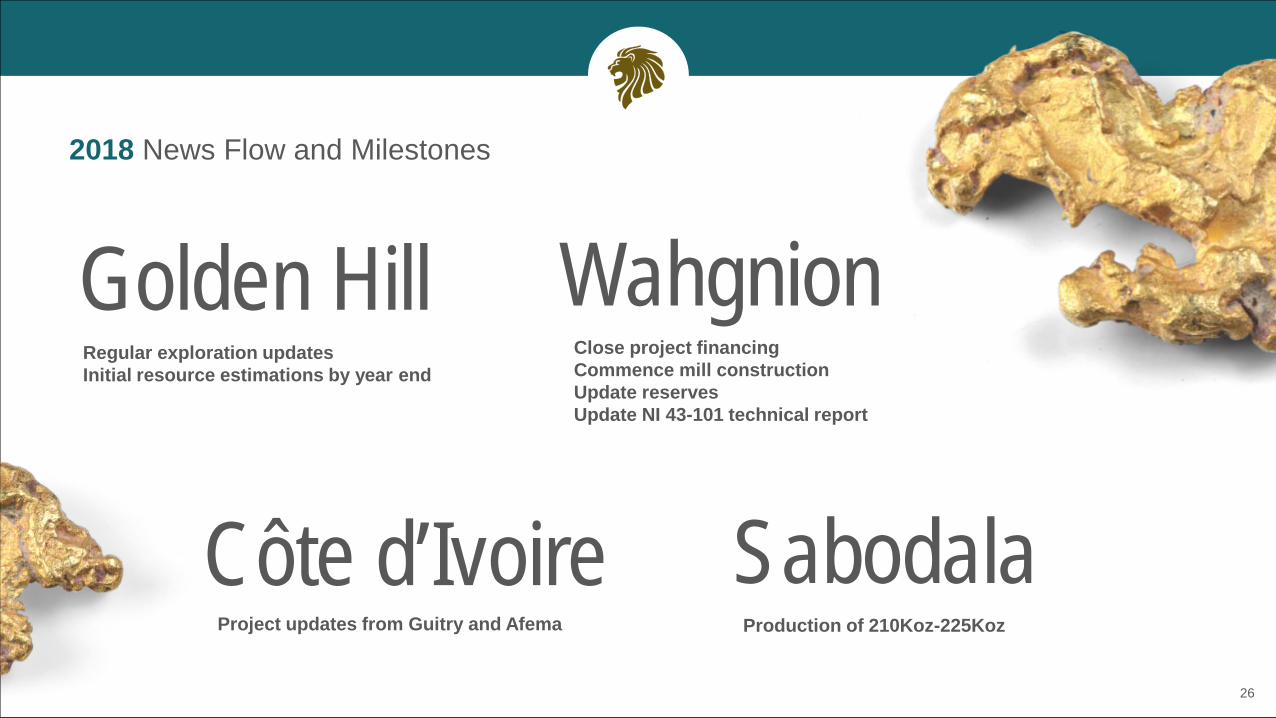
2018 News Flow and Milestones
26
Regular exploration updatesInitial resource estimations by year end
Close project financingCommence mill constructionUpdate reservesUpdate NI 43-101 technical report
Project updates from Guitry and Afema
WahgnionGolden Hill
Côte d’Ivoire SabodalaProduction of 210Koz-225Koz

Potential for Significant Share Price Appreciation
27
Teranga’s Share Price vs. Net Present Value* (NPV)(12) per Share
84%
*Refer to Appendix – Non-IFRS Performance MeasuresRefer to Appendix – Endnote (12)
$3.40
$5.70 $6.27
Share Price BMO NPV per Share(Spot)
Revalued Share Price
0.8xCurrent TGZ NPV Trading Multiple(12)
1.1xAverage NPV Multiple
for Medium Producers(12)
Data Source: BMO GoldPages published April 9, 2018
EV/2018E EBITDA
454
399
286
246
222
110
89
68
B2Gold
Roxgold
Endeavour
Semafo
Golden Star
Teranga
Alacer
Perseus
EV/2P Reserves ($/oz)
2.9
3.4
3.6
5.2
5.3
5.9
30.0
Golden Star
Roxgold
Teranga
B2Gold
Semafo
Endeavour
Alacer

28
Deep Value: A Re-Rating Opportunity(US$)
Gold Price per Ounce Assumption
Cash balance as at December 31, 2017
Wahgnion Project NPV5% based on 2P(1)
Sabodala NPV5% based on 2P(2)
$4.04
$1.11
$0.81
$1,300
$3.40TGZ Current Share Price
(closing price Apr 9, 2018)
$5.96 NPV* Per Share
based on cash & 2P reserves(1)(2)
Excludes potential value from:• Wahgnion infill drill program • Golden Hill• Afema and Côte d’Ivoire assets
*Refer to Appendix – Non-IFRS Performance MeasuresRefer to Appendix – Endnotes (1) and (2)USD/CAD FX rate 0.79

Appendix
29

2018 Outlook
30
Notes to 2018 Guidance
A. 22,500 ounces of gold production are to be sold to Franco-Nevada Corporation at 20% of the spot gold price.
B. Total cash cost per ounce sold is a non-IFRS financial measure and does not have a standard meaning under IFRS.
C. All-in sustaining costs per ounce is a non-IFRS financial measure and does not have a standard meaning under IFRS. All-in sustaining costs per ounce sold include total cash costs per ounce, administration expenses, share based compensation and sustaining capital expenditures as defined by the World Gold Council. All-in sustaining costs also include cash / (non-cash) inventory movements and non-cash amortization of advanced royalties.
D. Exploration and evaluation costs includes both Expensed Exploration, primarily attributable to exploration work on exploration permits, and Capitalized Reserve Development, which is work performed on Mine Licenses.
E. Site development costs for 2018 include village relocation costs for the Sabodala village.
F. Excludes capitalized deferred stripping costs, included in mine production costs.
G. Construction readiness / early works expenditures for 2018 includes anticipated expenditures for the construction of the Wahgnion Gold Project prior to completion of a debt facility agreement.
Other
This forecast financial information is based on the following material assumptions for 2018: gold price: $1,250 per ounce; light fuel oil price $0.87/L; heavy fuel oil price $0.50/L; Euro:USD exchange rate of 1:1.17
Other important assumptions: any political events are not expected to impact operations, including movement of people, supplies and gold shipments; grades and recoveries will remain consistent with the life-of-mine plan to achieve the forecast gold production; and no unplanned delays in or interruption of scheduled production.
Year Ended December 31
2017 2018Actual Guidance
Operating Results Ore mined (‘000t) 2,101 2,000 – 2,500Waste mined (‘000t) 35,385 35,000 – 37,000Total mined (‘000t) 37,486 37,000 – 39,500Grade mined (g/t) 3.48 2.50 – 3.00Strip ratio waste/ore 16.8 16.5 – 18.5Ore milled (‘000t) 4,221 4,200 – 4,400Head grade (g/t) 1.87 1.70 – 1.90Recovery rate % 92.1 90.0 – 91.5Gold produced (A) (oz) 233,267 210,000 – 225,000
Cost of sales per ounce sold $/oz sold 961 950 – 1,025Total cash cost per ounce sold (B) $/oz sold 721 700 – 750All-in sustaining costs (C) $/oz sold 1,024 1,000 – 1,075Cash / (non-cash) inventory movements and amortized advanced royalty costs (C) $/oz sold (81) (50)
All-in sustaining costs (excluding cash / (non-cash) inventory movements and amortized advanced royalty costs) (C) $/oz sold 943 950 – 1,025
Mining ($/t mined) 2.36 2.25 – 2.50Mining long haul ($/t hauled) 2.97 2.50 – 3.50Milling ($/t milled) 11.34 11.00 – 12.50General and Administration ($/t milled) 4.26 4.25 – 4.50
Mine Production Costs $ millions 161.2 162.0 – 172.0Corporate Administration Expense $ millions 10.7 11.0 – 13.0Regional Administration Costs $ millions 2.0 ~2.0Community Social Responsibility Expense $ millions 2.9 4.0 – 5.0Exploration and Evaluation (D) $ millions 24.9 ~15.0Sustaining Capital Expenditures
Mine site sustaining $ millions 10.7 10.0 – 15.0Site development costs (E) $ millions 8.6 10.0 – 15.0
Total Sustaining Capital Expenditures (F) $ millions 19.3 20.0 – 30.0Growth Capital Expenditures (Wahgnion)
Feasibility study $ millions 2.4 N/AConstruction readiness / early works (G) $ millions 15.8 ~30.0
Total Growth Capital Expenditures $ millions 18.2 ~30.0

8.4%
4.8%
Implied Net Smelter Royalty
OJVG Acquisition Financed by Franco-Nevada
• In connection with Teranga’s transformational acquisition of Oromin Joint Venture Group in 2014, Franco-Nevada invested $135 million in exchange for a fixed and floating stream on Teranga’s future production
• Fixed gold deliveries of 22,500 ounces per year from2014 to 2019 with trailing 6% gold stream once fixed deliveries completed in 2019*
• Franco-Nevada to pay 20% of spot gold price per ounce delivered (6% stream is equivalent to a 4.8% NSR royalty)
• Streaming agreement covers Teranga’s current mine license and land package
Effective Cost of Franco-Nevada Stream onAll-in Sustaining Costs per Ounce(based on $1,200/ounce gold price)
$100
$58
2016E Post 2019
Effe
ctiv
e C
ost
31

Extensive Organic Growth Pipeline
32
Burkina Faso Senegal Côte d'lvoire
~$15M
2018 Exploration BudgetSenegal
Burkina Faso $9M-10M
Côte d’Ivoire ~$3M
Senegal ~$1M
Operating Gold Mine/ Development Project
WahgnionGold Project

Production
Construction
Feasibility Study
Concept Study (Initial Resource)
Advanced Exploration
Advanced Exploration 2
Advanced Exploration 3
Robust Exploration Pipeline in Three Mining-Friendly Jurisdictions
33Senegal Côte d’Ivoire Burkina Faso
Sabodala
Niakafiri Main
Maki Medina
Niakafiri SENiakafiri SW
Kobokoto
Korouloulou
Guitry
Dianra Djinta
Tiassale
Goumbati West/Kobokoto
Golouma North*
Sekoto
Marougou Main
Honey
Mamasato
Jam
Kinemba
Bransan East A,B,CMaleko
Wahgnion
Ouahiri
Kafina
Samavogo NorthHillside
Bassangoro
Muddi Bagu Sud
Raul
Petite Colline
KassengaraWeah
Korindougou
Fembefasso
Mahepleu
Sangaredougou
Niakafiri West
Ma
PeksouJackhammer Hill
Nahiri
BongoriFoutouri
Tambiga Hill
Cinnamon
Maragou South
Konatvogo
Afema 1
Afema 2Afema 3

Executive Team
34
Richard Young, MA, CPAPresident & CEO25+ years experience in gold mining including 13 years at Barrick Gold including finance and corporate development
Paul Chawrun, P.Eng, MBAChief Operating Officer25+ years experience in mining including serving as Director, Technical Services at Detour Gold
Navin Dyal, CPAChief Financial Officer13 years experience in mining including 7 years at Barrick Gold as Head of Finance in copper business unit
David Savarie, LL.BGeneral Counsel & Corporate Secretary11 years of Corporate Counsel experience in mining including his role as Deputy General Counsel and Corporate Secretary of Gabriel Resources
Aziz Sy, P.Eng, M.Sc., MBAGeneral Manager, SGO17+ years experience in managing gold exploration projects, including his work as Vice President Senegal Operations for the Oromin Joint Venture Group until its acquisition in 2014 by Teranga Gold
Sepanta Dorri, MAcc, MBA, CPAVP, Corporate and Stakeholder Development10 years experience in mining including 5 years at Xstrata Nickel in Strategic Planning and M&A. 2012 winner of the WXN Top 100 Canada's Most Powerful Women award, Trailblazers and Trendsetters Category
David Mallo, B.Sc. GeologyVP, Exploration35+ years of mineral exploration in project evaluation and program management, playing an integral role in acquisition, discovery, and exploration of world-class deposits including Eskay Creek and Cobre Panama

Alan Hill, M.EngChairman35+ years experience in mining including 20 years at Barrick Gold in project evaluation and development
Christopher Lattanzi, B.EngDirector30 years experience in mining property valuation, scoping, feasibility studies and project monitoring on a global basis. Founder of MiconInternational
Richard Young, MA, CPAPresident & CEO25+ years experience in gold mining including 13 years at Barrick Gold in finance and corporate development
Jendayi Frazer, Ph.D.Director17 years experience in key roles supporting initiatives and policies to build Africa’s equity and commodity markets. First woman U.S. Ambassador to South Africa
William Biggar, MA, CPADirector25+ years experience in senior executive positions in investment, mining and real estate including Barrick Gold and Merrill Lynch
Edward Goldenberg, MA, BClDirectorDistinguished career in policy including 10 years as Senior Policy Advisor to the Prime Minister of Canada and the Prime Minister's Chief of Staff in 2003. HonouraryDoctorate of Laws from McGill University
David MimranDirector & Teranga’s Largest ShareholderCEO of Grands Moulins d’Abidjan and Grands Moulins de Dakar, among the largest producers of agri-food in West Africa. Special Advisor to the Government of the Republic of Côte d'Ivoire
Alan Thomas, CPADirector30+ years mining and energy industry experience in senior financial and director roles including 6 years as VP and CFO of ShawCorand 11 years as CFO of Noranda
Frank Wheatley, LL.BDirector28 years mining industry experience as director, senior officer and legal counsel. Extensive experience in public financing, project debt financing, permitting of large-scale mining projects and strategic M&A
Board of Directors
35

Qualified Persons Statement
36
The technical information contained in this document relating to the Sabodala open pit mineral reserve estimates is based on, and fairly represents, information compiled by Mr. Stephen Ling, P. Eng who is a member of the ProfessionalEngineers Ontario. Mr. Ling is a full time employee of Teranga and is not "independent" within the meaning of NI 43-101. Mr. Ling has sufficient experience which is relevant to the style of mineralisation and type of deposit under considerationand to the activity which he is undertaking to qualify as a "Qualified Person" under NI 43-101 Standards of Disclosure for Mineral Projects. Mr. Ling has consented to the inclusion in this document of the matters based on his compiledinformation in the form and context in which it appears in this document.
The technical information contained in this document relating to Sabodala mineral resource estimates is based on, and fairly represents, information compiled by Ms. Patti Nakai-Lajoie. Ms. Nakai-Lajoie, P. Geo., is a Member of the Associationof Professional Geoscientists of Ontario. Ms. Nakai-Lajoie is a full time employee of Teranga and is not "independent" within the meaning of NI 43-101. Ms. Nakai-Lajoie has sufficient experience which is relevant to the style of mineralisationand type of deposit under consideration and to the activity which she is undertaking to qualify as a "Qualified Person" under NI 43-101 Standards of Disclosure for Mineral Projects. Ms. Nakai-Lajoie has consented to the inclusion in thisdocument of the matters based on her compiled information in the form and context in which it appears in this document.
The technical information contained in this document relating to the Sabodala underground ore reserves estimates is based on, and fairly represents, information compiled by Jeff Sepp, P. Eng., of Roscoe Postle Associates Inc. (“RPA”), who isa member of the Professional Engineers Ontario. Mr. Sepp is “independent” within the meaning of NI 43-101. Mr. Sepp has sufficient experience which is relevant to the style of mineralisation and type of deposit under consideration and to theactivity he is undertaking to qualify as a “Qualified Person” under NI 43-101 Standards of Disclosure for Mineral Projects. Mr. Sepp has consented to the inclusion in this document of the matters based on his compiled information in the formand context in which it appears in this document.
The technical information contained in this document relating to the Wahgnion open pit mineral reserve estimates is based on, and fairly represents, information compiled by Mr. Glen Ehasoo, P. Eng., of RPA, who is a member of the Associationof Professional Engineers and Geoscientists of British Columbia. Mr. Ehasoo is "independent" within the meaning of NI 43-101. Mr. Ehasoo has sufficient experience which is relevant to the style of mineralisation and type of deposit underconsideration and to the activity which he is undertaking to qualify as a “Qualified Person” under NI 43-101 Standards of Disclosure for Mineral Projects. Mr. Ehasoo has consented to the inclusion in this document of the matters based on hiscompiled information in the form and context in which it appears in this document.
The technical information contained in this document relating to Wahgnion mineral resource estimates is based on, and fairly represents, information compiled by Mr. David Ross, P.Geo., of RPA, who is a Member of the Association ofProfessional Geoscientists of Ontario. Mr. Ross is "independent" within the meaning of NI 43-101. Mr. Ross has sufficient experience which is relevant to the style of mineralisation and type of deposit under consideration and to the activitywhich he is undertaking to qualify as a “Qualified Person” under NI 43-101 Standards of Disclosure for Mineral Projects. Mr. Ross has consented to the inclusion in this document of the matters based on his compiled information in the form andcontext in which it appears in this document.
Teranga's exploration programs are being managed by Peter Mann, FAusIMM. Mr. Mann is a full time employee of Teranga and is not "independent" within the meaning of NI 43-101. Mr. Mann has sufficient experience which is relevant to thestyle of mineralisation and type of deposit under consideration and to the activity which he is undertaking to qualify as a “Qualified Person” as under NI 43-101 Standards of Disclosure for Mineral Projects. The technical information contained inthis document relating to exploration results are based on, and fairly represents, information compiled by Mr. Mann. Mr. Mann has verified and approved the data disclosed in this release, including the sampling, analytical and test dataunderlying the information. The samples are prepared at site and assayed in the SGS laboratory located at the site. Analysis for diamond drilling is sent for fire assay analysis at ALS Johannesburg, South Africa. Mr. Mann has consented to theinclusion in this document of the matters based on his compiled information in the form and context in which it appears in this document.
Teranga's disclosure of mineral reserve and mineral resource information is governed by NI 43-101 under the guidelines set out in the Canadian Institute of Mining, Metallurgy and Petroleum (the "CIM") Standards on Mineral Resources andMineral Reserves, adopted by the CIM Council, as may be amended from time to time by the CIM ("CIM Standards"). There can be no assurance that those portions of mineral resources that are not mineral reserves will ultimately be convertedinto mineral reserves.
Teranga confirms that it is not aware of any new information or data that materially affects the information included in the technical reports for the Sabodala Project (August 30, 2017) and the Wahgnion Project (October 20, 2017) pursuantto National Instrument 43-101 - Standards of Disclosure for Mineral Projects (the “Technical Reports”), or year end 2017 results, market announcements and, in the case of estimates of Mineral Resources, that all material assumptions andtechnical parameters underpinning the estimates in the relevant market announcements concerning the Technical Reports continue to apply and have not materially changed.

37
Non-IFRS Performance Measures
The Company has included non-IFRS measures in this document, including “total cash cost per ounce of gold sold”, “all-in sustaining costs per ounce”, “free cash flow from operations” and “EBITDA”. TheCompany believes that these measures, in addition to conventional measures prepared in accordance with IFRS, provide investors an improved ability to evaluate the underlying performance of the Company.The non-IFRS measures are intended to provide additional information and should not be considered in isolation or as a substitute for measures of performance prepared in accordance with IFRS. Thesemeasures do not have any standardized meaning prescribed under IFRS, and therefore may not be comparable to other issuers.
Total cash costs figures are calculated in accordance with a standard developed by The Gold Institute, which was a worldwide association of suppliers of gold and gold products and included leading NorthAmerican gold producers. The Gold Institute ceased operations in 2002, but the standard is considered the accepted standard of reporting cash cost of production in North America. Adoption of the standard isvoluntary and the cost measures presented may not be comparable to other similarly titled measure of other companies. The World Gold Council (“WGC”) definition of all-in sustaining costs seeks to extendthe definition of total cash costs by adding corporate general and administrative costs, reclamation and remediation costs (including accretion and amortization), exploration and study costs (capital andexpensed), capitalized stripping costs and sustaining capital expenditures and represents the total costs of producing gold from current operations. All-in sustaining cost excludes income tax payments, interestcosts, costs related to business acquisitions and items needed to normalize earnings. Consequently, this measure is not representative of all of the Company’s cash expenditures. In addition, the calculation ofall-in sustaining costs does not include depreciation expense as it does not reflect the impact of expenditures incurred in prior periods. Therefore, it is not indicative of the Company’s overall profitability. ForSabodala and Wahgnion, life of mine total cash costs and all-in sustaining costs figures used in this presentation are before cash/non-cash inventory movements and exclude any allocation of corporateoverheads. Total cash costs and all-in sustaining costs figures for Sabodala further excludes amortized advanced royalty costs. Other companies may calculate this measure differently. Consolidated total cashcosts and all-in sustaining cost figures add corporate overhead costs. Other companies may calculate this measure differently.
The Company calculates free cash flow from operations as net cash flow provided by operating activities less sustaining capital expenditures. The Company believes this to be a useful indicator of its ability togenerate cash for growth initiatives. “Earnings before interest, taxes, depreciation and amortization” (“EBITDA”) is a non-IFRS financial measure, which excludes income tax, finance costs (before unwinding ofdiscounts), interest income, depreciation and amortization, and non-cash impairment charges from net earnings. EBITDA is intended to provide additional information to investors and analysts and do not haveany standardized definition under IFRS and should not be considered in isolation or as a substitute for measures of performance prepared in accordance with IFRS. Management believes that EBITDA is avaluable indicator of our ability to generate liquidity by producing operating cash flow to: fund working capital needs, service debt obligations, and fund capital expenditures.
Net asset value (“NAV”) per share and net present value (“NPV”) per share are non-IFRS financial measures. NAV per share is equal to NPV per share and is calculated using the NPV of the life of mine(“LOM”) cash flows based on the Wahgnion and Sabodala 43-101 technical reports. The NPV calculation assumes a long-term gold price of $1,300 per ounce, a 5% discount rate, a 0.79 CAD/USD exchangerate, a 1.10 Euro/USD exchange rate, and current cash on hand. It includes interest, income taxes, and changes in working capital and excludes corporate administration, exploration expenditures, minorityinterest payments and debt repayments. The Wahgnion and Sabodala NPV are based on reserves only.
For more information regarding these measures, please refer to the Company’s management’s discussion and analysis accessible on the Company’s website at www.terangagold.com.

38
A number of economic and technical studies have been prepared on the Afema project prior to Teranga’s entry into the Afema JV with Sodim. The most recent study, which included a mineralresource estimate for the Afema mine license, was issued by RockRidge Consulting Services Geologists for and on behalf of TGL and is dated as of June 27, 2016 (the “June 2016 HistoricalEstimate”). The June 2016 Historical Estimate includes an Indicated oxide resource estimate of 110Koz (comprised of 2.7Mt at an average grade of 1.26 g/t Au) and Inferred oxide resources of122Koz (comprised of 3.0Mt at an average grade of 1.26 g/t Au). In addition, it includes an Indicated transitional resource estimate of 59Koz (comprised of 1.3Mt at an average grade of 1.39 g/t Au)and an Inferred transitional resource of 28Koz (comprised of 0.8Mt at an average grade of 1.11 g/t Au). Finally, the June 2016 Historical Estimate provides a sulphide resource estimate as follows:865Koz Indicated ounces (comprised of 17.3Mt at an average grade of 1.55 g/t Au) and 806Koz inferred ounces (comprised of 17.8Mt at an average grade of 1.40 g/t Au). This historical estimate isreported as using a cut-off grade of 0.5 g/t Au.
RockRidge further states that it reviewed the geological and grade continuity to supplement the review of data quality in order to confirm the CIM mineral resource classification categories used. Aswell, the June 2016 Historical Estimate states the following with respect to the basis of the mineral resource estimate:
• mineralized volumes were received for oxide, transitional and sulphide modelled volumes;
• gold grades were determined using ordinary kriging and Inverse distance squared interpolation (depending on data density) into a 3-dimensional block model constrained bymineralization wireframes;
• the block models comprised sub-celled block dimensions of 5m x 5m x 1m and 5m x 5m x 2m (depending on data sampling interval);
• mineralized wireframes were truncated to the topographic surface reflecting the mining that had previously occurred on the property;
• gold values were investigated for outlier values and put though two statistical capping/cutting routines;
• Datamine Studio 3 was the modelling package; and
• relationship between geology and preliminary mining and economic factors was taken into account at all times.
Teranga considers the June 2016 Historical Estimate to be a “historical estimate” as defined under NI 43-101 and relevant as the most recent resource estimate on the Afema project. Furtherdrilling, resource modelling and updates to key economic assumptions would be required to upgrade or verify these historical estimates as current mineral resources and accordingly they should berelied upon only as a historical resource estimate. A Qualified Person has not done sufficient work to classify the historical estimate as current mineral resources or mineral reserves and Teranga isnot treating the historical estimate as current mineral resources or mineral reserves.
Afema Mine License Historical Resource Estimate

Endnotes
39
1. Refers to proven and probable reserves of 1.2Moz for the Wahgnion project as per reserve estimate as of September 7, 2017 included in the Wahgnion technical report dated October 20, 2017 available on the Company’s website at www.terangagold.com and SEDAR at www.sedar.com.
2. Refers to proven and probable reserves of 2.7Moz for the Sabodala project as per reserve estimate as of June 30, 2017 included in the Sabodala NI 43-101 technical report dated August 30, 2017 available onthe Company’s website at www.terangagold.com and SEDAR at www.sedar.com.
3. This production target is based on proven and probable reserves only from Teranga’s Sabodala Project as at June 30, 2017. For more information regarding Teranga Gold’s Mineral Reserves and Resources andrelated notes, please refer to the NI 43-101 compliant technical report for the Sabodala Project dated August 30, 2017 available on the Company’s website at www.terangagold.com and on SEDAR atwww.sedar.com.
4. This production target is based on proven and probable ore reserves only for Teranga’s Wahgnion Project as at September 7, 2017. For more information regarding the Wahgnion’s Mineral Reserves andResources and related notes, please refer to the NI 43-101 compliant technical report for the Wahgnion Project dated October 20, 2017 accessible on the Company’s website at www.terangagold.com and onSEDAR at www.sedar.com.
5. LOM assumptions include: Gold Price $1,250 per ounceHeavy Fuel Oil (HFO): Wahgnion - $0.59 per litre; Sabodala - $0.46 per litreLight Fuel Oil (LFO): Wahgnion - $1.04 per litre ($0.88 per litre during construction period); Sabodala - $0.81 per litreEuro to USD Exchange Rate: $1.10
6. This Sabodala free cash flow is an estimate that is based on the updated life of mine plan and reserve estimate for the Sabodala project, as set out in the Technical Report of Teranga for the Sabodala Project,Senegal, West Africa, dated August 30, 2017 (the “Sabodala Technical Report”). See in particular Section 21 of the Sabodala Technical Report - Capital and Operating Costs.
7. See the NI 43-101 compliant technical report for the Wahgnion Project. This LOM production plan assumes that the Wahgnion Project plant construction will commence in Q1 2018. If the Wahgnion plantconstruction commences in Q2 2018 instead, the LOM production plan is expected to shift by several months.
8. Other considerations (uses) is an estimate of potential other uses of the Company’s cash during the period, including, but not limited to, discretionary exploration expenditures, financing costs and any cost overrunor minimum cash requirements that might be contained in any completed debt financing agreement. Actual amounts may total more or less than the aggregate amount specified.
9. Teranga’s Sabodala Mineral Reserves and Mineral Resources estimates as at June 30, 2017. For more information regarding Sabodala’s Mineral Reserves and Resources and related notes, please refer to the NI43-101 compliant technical report for the Sabodala Project dated August 30, 2017 accessible on the Company’s website at www.terangagold.com and on SEDAR at www.sedar.com.
10. Teranga’s Wahgnion Mineral Reserves and Mineral Resources estimates as at September 7, 2017. For more information regarding Wahgnion’s Mineral Reserves and Resources and related notes, please refer tothe NI 43-101 compliant technical report for the Wahgnion Project dated October 20, 2017 accessible on the Company’s website at www.terangagold.com and on SEDAR at www.sedar.com.
11. Free cash flow excludes Wahgnion financing and corporate-wide resource development and exploration expenditures. Please see table on slide 7 of the Company’s Investor & Analyst Workshop presentationdated September 14, 2017, which was filed on www.sedar.com.
12. Net Present Value (“NPV”) per share is a Non-IFRS financial measure. NPV per share, average NPV multiple of medium producers, and Teranga’s share price is as per BMO GoldPages published April 6, 2018.According to BMO GoldPages, NPV per share is calculated using the net present value of the life of mine cash flows based on the NI 43-101 plan, less cash flow of corporate costs, less net debt per share, usingthe model at SPOT commodity prices and exchange rates. The “Revalued Share Price” is calculated using the NPV per share at SPOT times the NPV multiples as listed. The BMO NPV calculation assumes aUS$1,334 SPOT gold price per ounce, 5% discount, 0.79 USD/CAD exchange rate.
Trish MoranHead of Investor Relations77 King Street West, Suite 2110 Toronto, ON M5K 2A1T: +1.416.607.4507E: [email protected]: terangagold.com
TSX:TGZ / OTCQX:TGCDF