eu wide overview of phosphorus flows & data quality
TRANSCRIPT
EU wide overview of phosphorus flows & data quality
Kimo van Dijk
Wageningen University
DONUTSS workshop, Ghent, Belgium 3 September 2015
Overview
Phosphorus (P) flows and balances in the EU-27 Member States Data & methods used Data quality & monitoring challenges
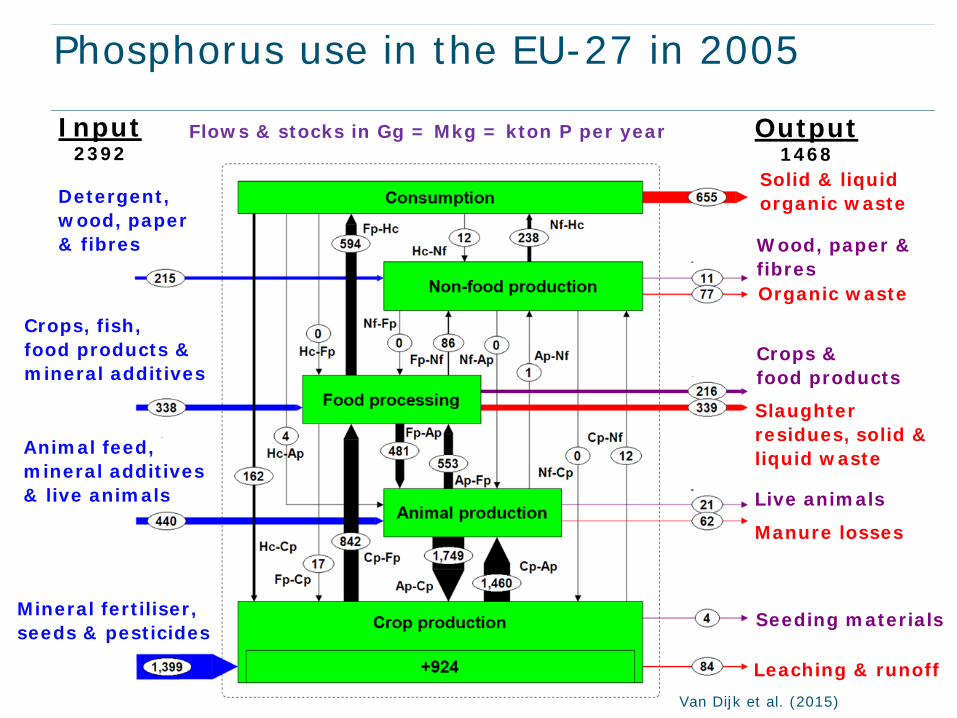
Phosphorus use in the EU-27 in 2005
Detergent, wood, paper & fibres
Crops, fish, food products & mineral additives
Animal feed, mineral additives & live animals
Mineral fertiliser, seeds & pesticides
Solid & liquid organic waste
Organic waste
Wood, paper & fibres
Slaughter residues, solid & liquid waste
Crops & food products
Manure losses
Live animals
Leaching & runoff
Seeding materials
Input 2392
Output 1468
Flows & stocks in Gg = Mkg = kton P per year
Van Dijk et al. (2015)
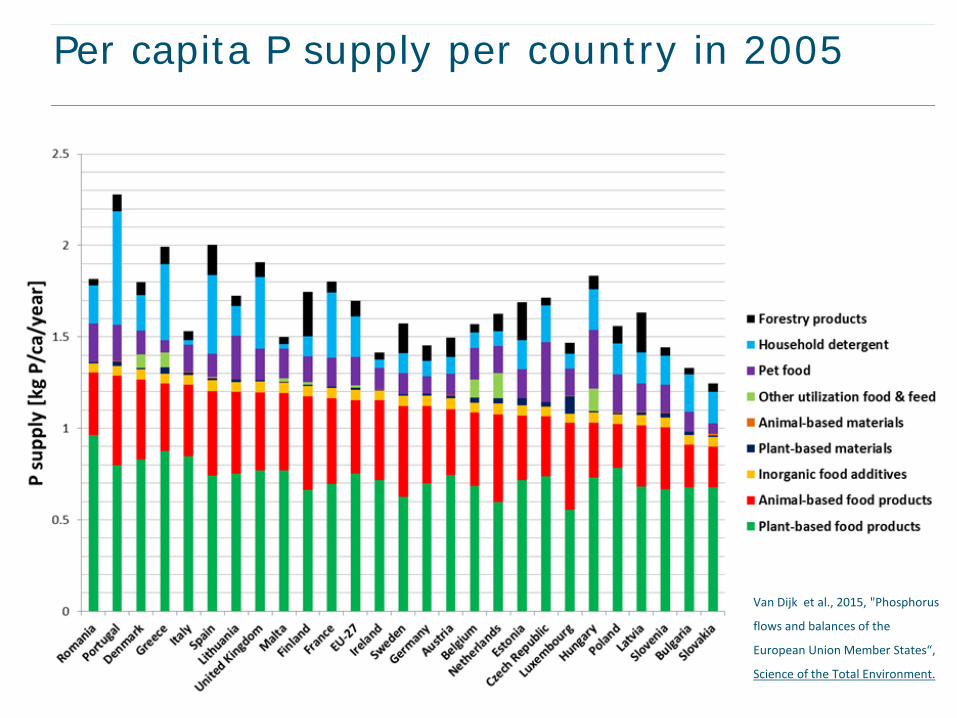
Per capita P supply per country in 2005
Van Dijk et al., 2015, "Phosphorus
flows and balances of the
European Union Member States“,
Science of the Total Environment.
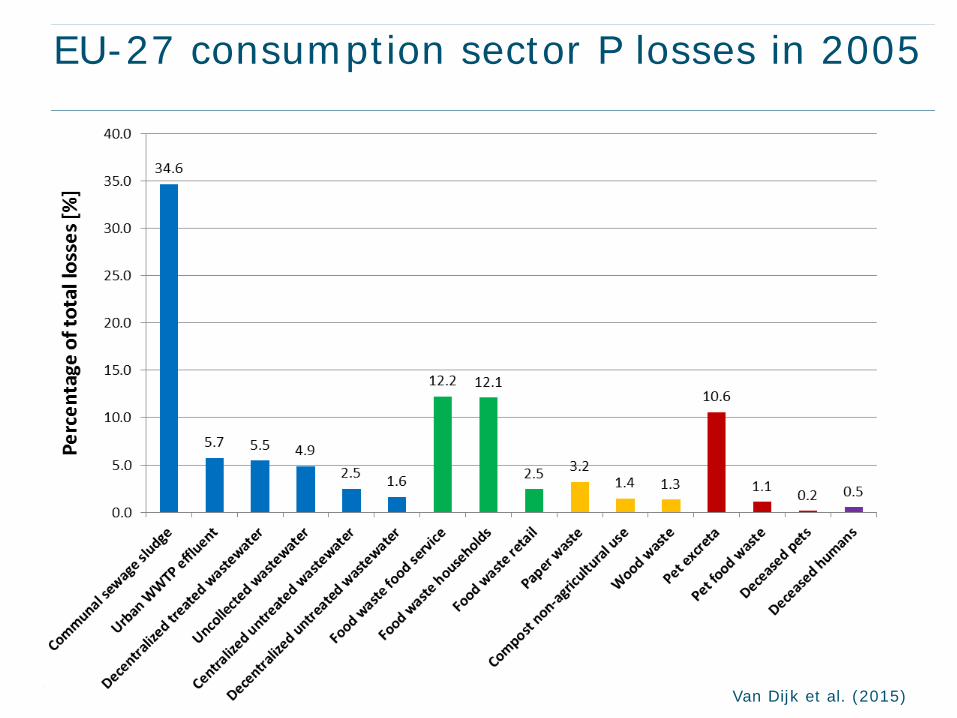
EU-27 consumption sector P losses in 2005
Van Dijk et al. (2015)
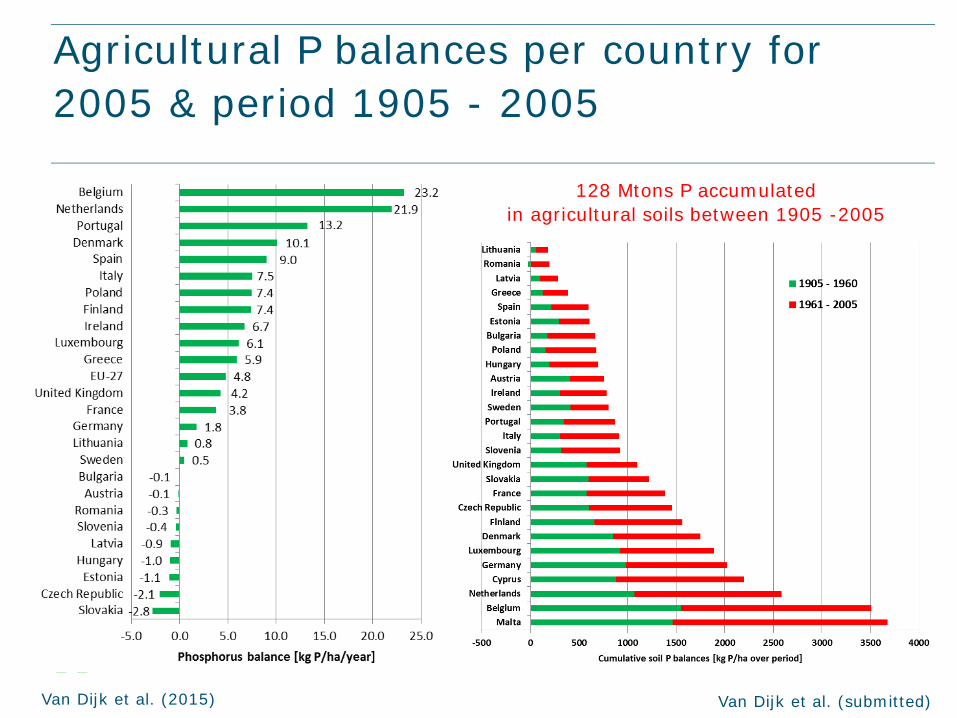
Agricultural P balances per country for 2005 & period 1905 - 2005
Van Dijk et al. (submitted) Van Dijk et al. (2015)
128 Mtons P accumulated in agricultural soils between 1905 -2005
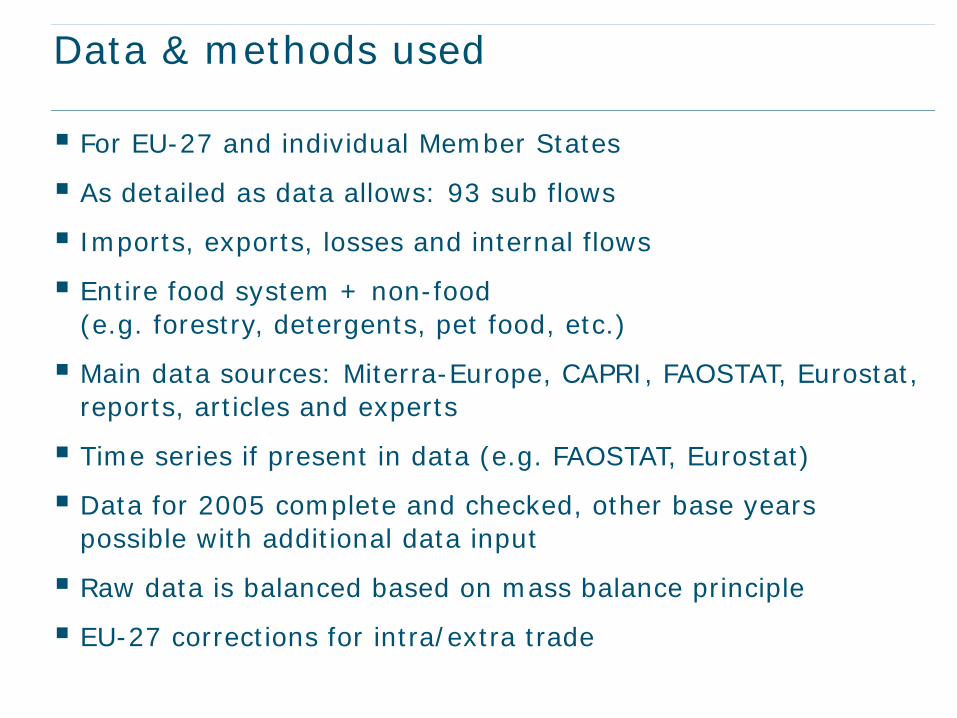
Data & methods used
For EU-27 and individual Member States
As detailed as data allows: 93 sub flows
Imports, exports, losses and internal flows
Entire food system + non-food (e.g. forestry, detergents, pet food, etc.)
Main data sources: Miterra-Europe, CAPRI, FAOSTAT, Eurostat, reports, articles and experts
Time series if present in data (e.g. FAOSTAT, Eurostat)
Data for 2005 complete and checked, other base years possible with additional data input
Raw data is balanced based on mass balance principle
EU-27 corrections for intra/extra trade
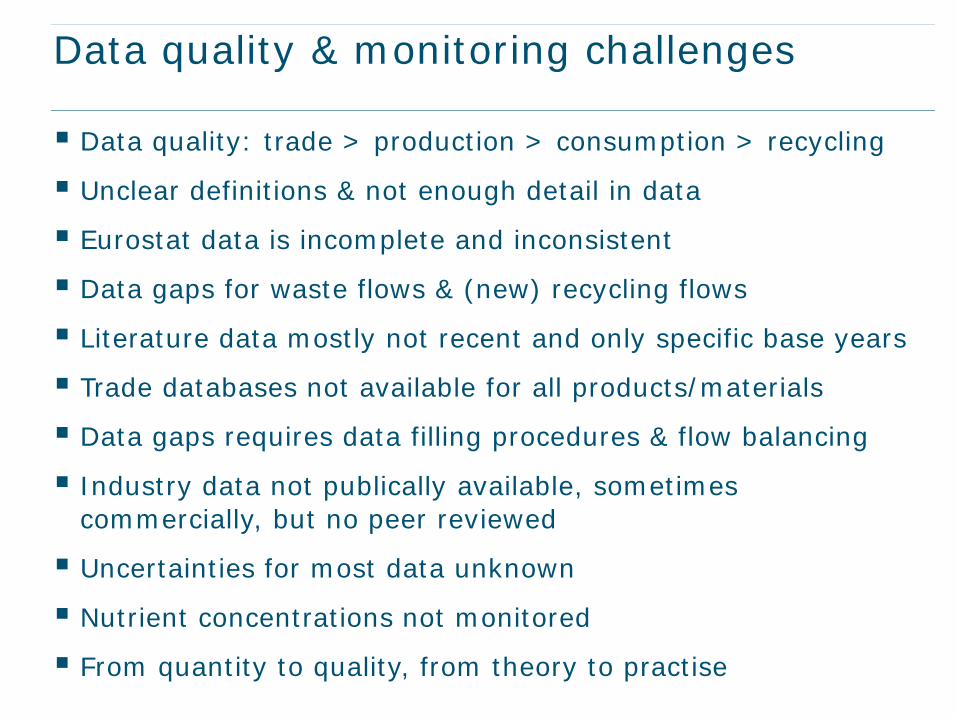
Data quality & monitoring challenges
Data quality: trade > production > consumption > recycling
Unclear definitions & not enough detail in data
Eurostat data is incomplete and inconsistent
Data gaps for waste flows & (new) recycling flows
Literature data mostly not recent and only specific base years
Trade databases not available for all products/materials
Data gaps requires data filling procedures & flow balancing
Industry data not publically available, sometimes commercially, but no peer reviewed
Uncertainties for most data unknown
Nutrient concentrations not monitored
From quantity to quality, from theory to practise
Thank you for your attention
Questions? Comments? Suggestions? [email protected] / [email protected] Twitter: @kimovandijk Website: kimovandijk.weebly.com

Extra additional slides as background
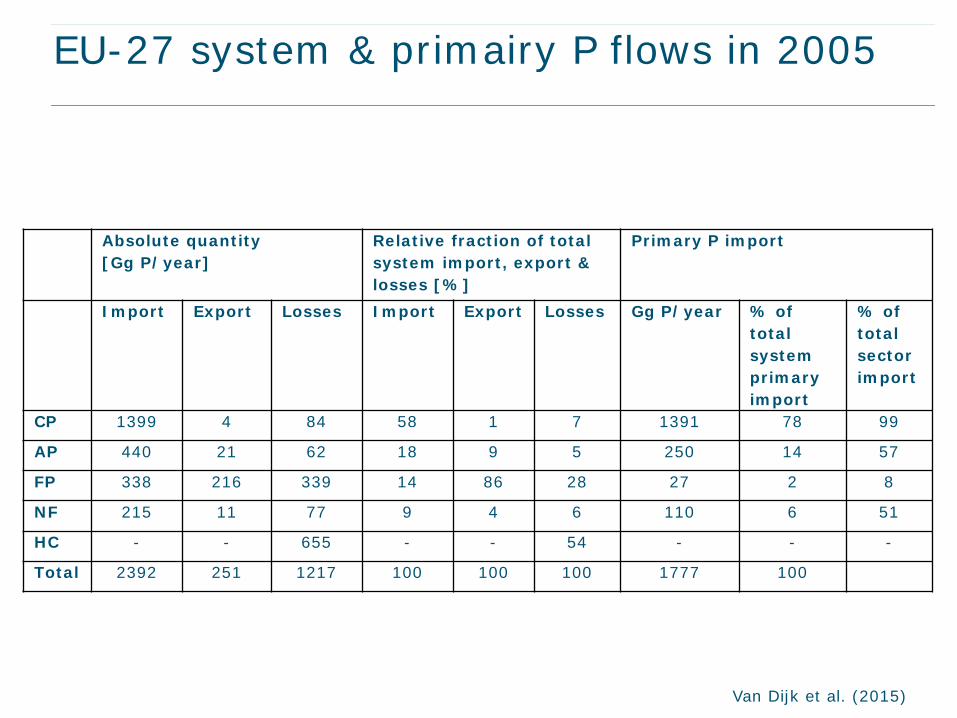
EU-27 system & primairy P flows in 2005
Van Dijk et al. (2015)
Absolute quantity [Gg P/year]
Relative fraction of total system import, export & losses [%]
Primary P import
Import Export Losses Import Export Losses Gg P/year % of total system primary import
% of total sector import
CP 1399 4 84 58 1 7 1391 78 99
AP 440 21 62 18 9 5 250 14 57
FP 338 216 339 14 86 28 27 2 8
NF 215 11 77 9 4 6 110 6 51
HC - - 655 - - 54 - - -
Total 2392 251 1217 100 100 100 1777 100
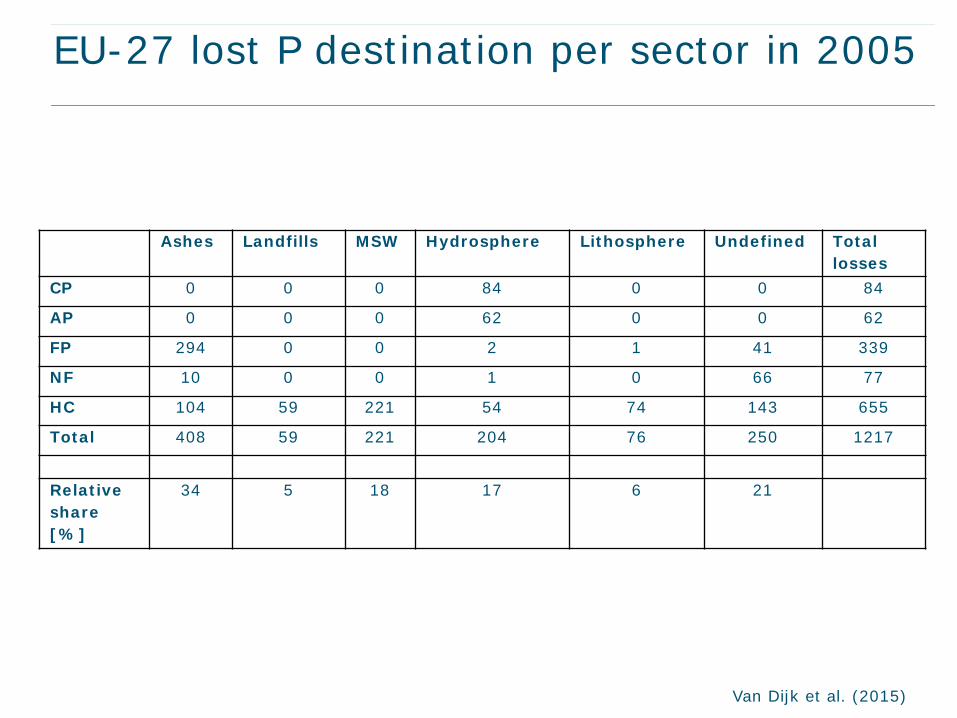
EU-27 lost P destination per sector in 2005
Van Dijk et al. (2015)
Ashes Landfills MSW Hydrosphere Lithosphere Undefined Total losses
CP 0 0 0 84 0 0 84
AP 0 0 0 62 0 0 62
FP 294 0 0 2 1 41 339
NF 10 0 0 1 0 66 77
HC 104 59 221 54 74 143 655
Total 408 59 221 204 76 250 1217
Relative share [%]
34 5 18 17 6 21
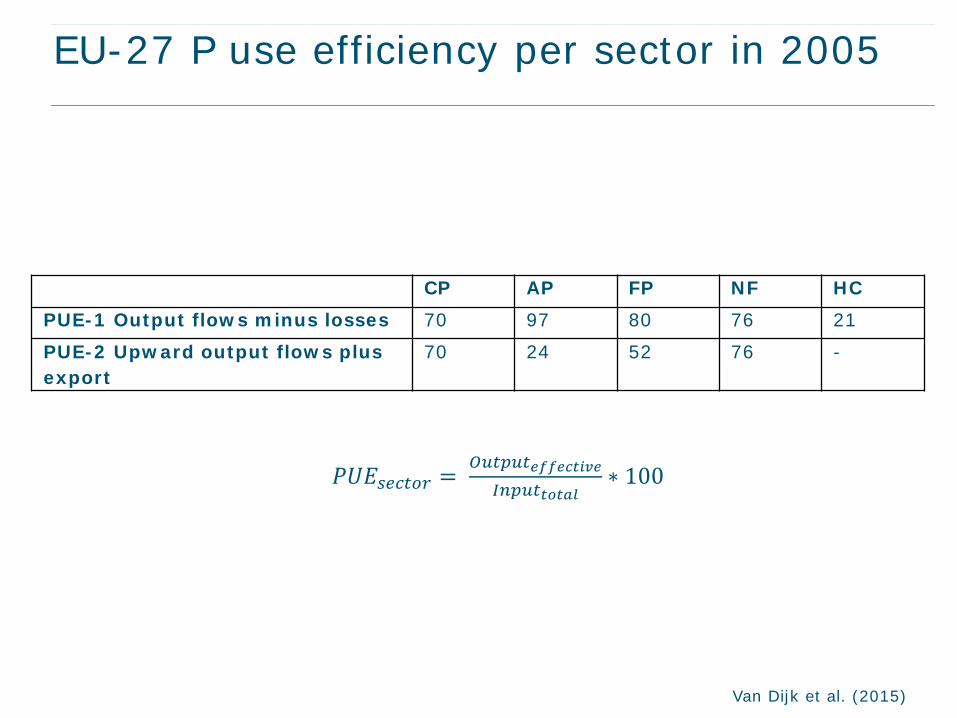
EU-27 P use efficiency per sector in 2005
Van Dijk et al. (2015)
CP AP FP NF HC
PUE-1 Output flows minus losses 70 97 80 76 21
PUE-2 Upward output flows plus export
70 24 52 76 -
𝑃𝑃𝑃𝑃𝑃𝑃𝑠𝑠𝑠𝑠𝑠𝑠𝑠𝑠𝑠𝑠𝑠𝑠 = 𝑂𝑂𝑂𝑂𝑠𝑠𝑂𝑂𝑂𝑂𝑠𝑠𝑒𝑒𝑒𝑒𝑒𝑒𝑒𝑒𝑒𝑒𝑒𝑒𝑒𝑒𝑒𝑒𝑒𝑒
𝐼𝐼𝐼𝐼𝑂𝑂𝑂𝑂𝑠𝑠𝑒𝑒𝑡𝑡𝑒𝑒𝑡𝑡𝑡𝑡∗ 100
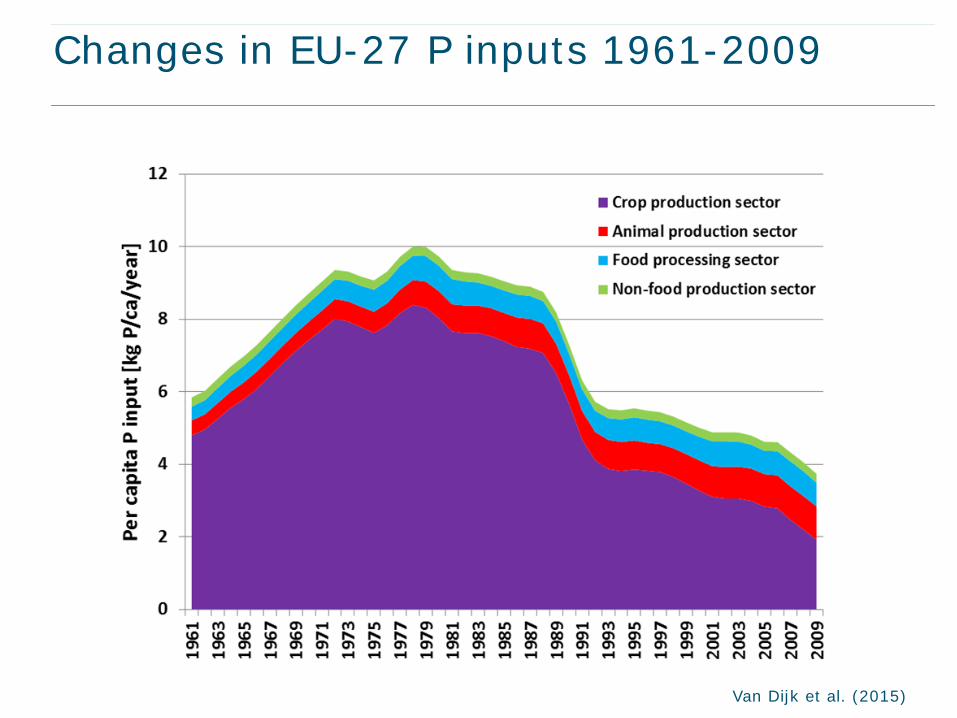
Changes in EU-27 P inputs 1961-2009
Van Dijk et al. (2015)
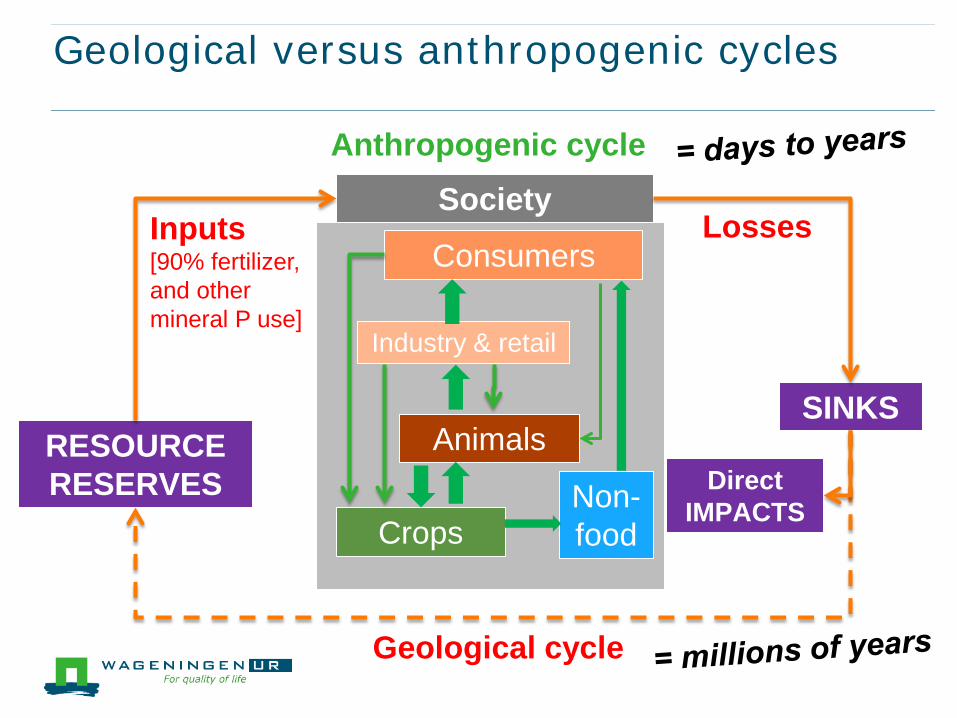
Geological versus anthropogenic cycles
RESOURCE RESERVES
SINKS
Society
Crops
Animals
Industry & retail
Consumers
Non-food
Losses Inputs [90% fertilizer, and other mineral P use]
Geological cycle
Direct IMPACTS
Anthropogenic cycle
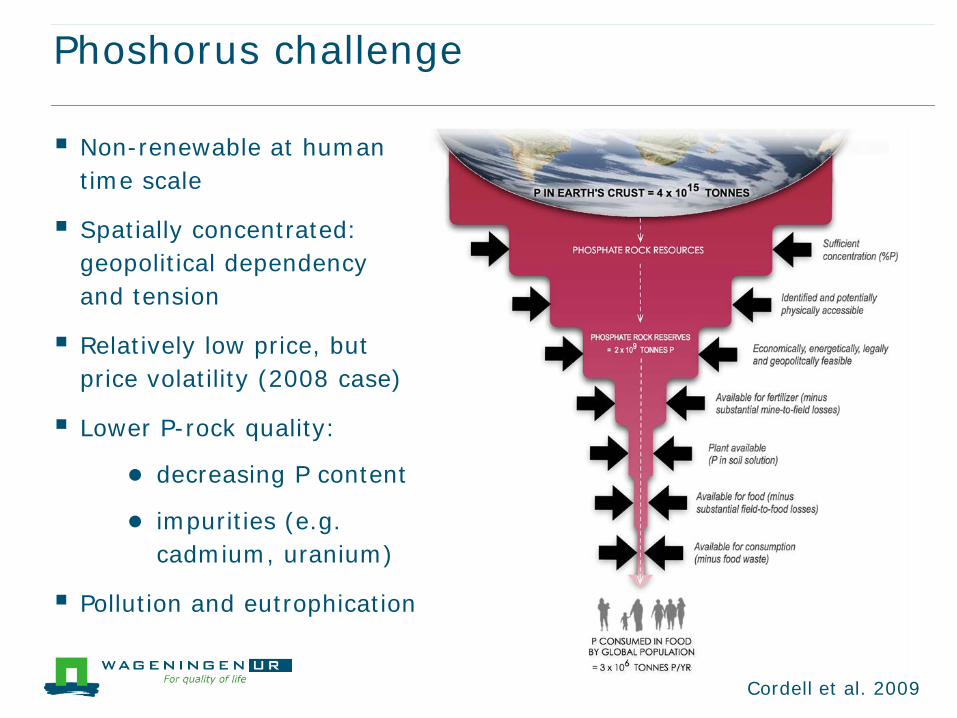
Phoshorus challenge
Non-renewable at human time scale
Spatially concentrated: geopolitical dependency and tension
Relatively low price, but price volatility (2008 case)
Lower P-rock quality:
● decreasing P content
● impurities (e.g. cadmium, uranium)
Pollution and eutrophication
Cordell et al. 2009
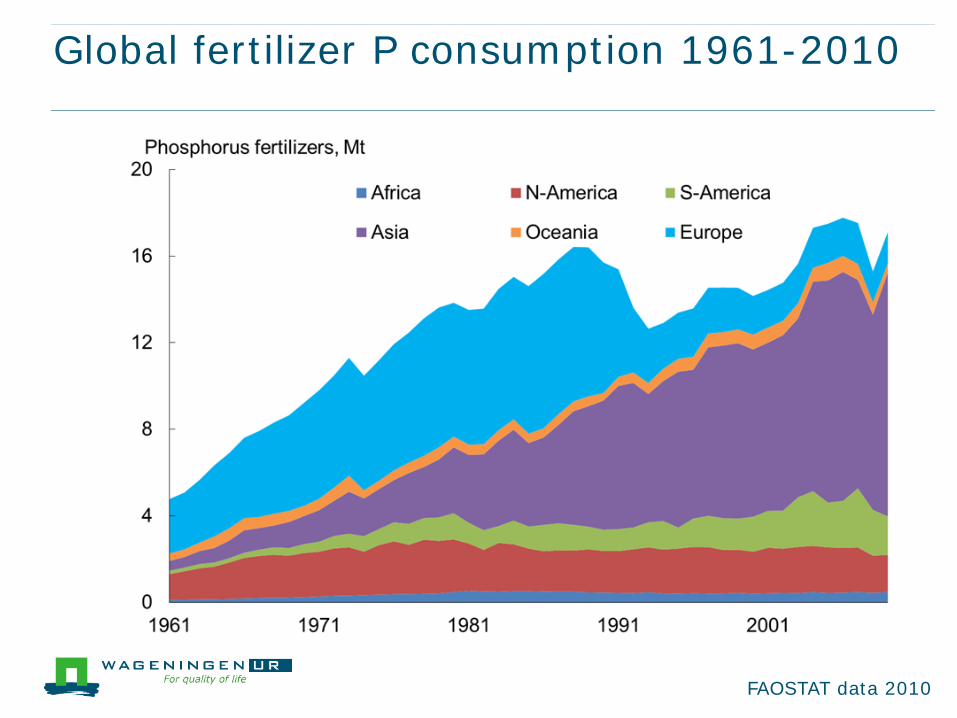
Global fertilizer P consumption 1961-2010
FAOSTAT data 2010
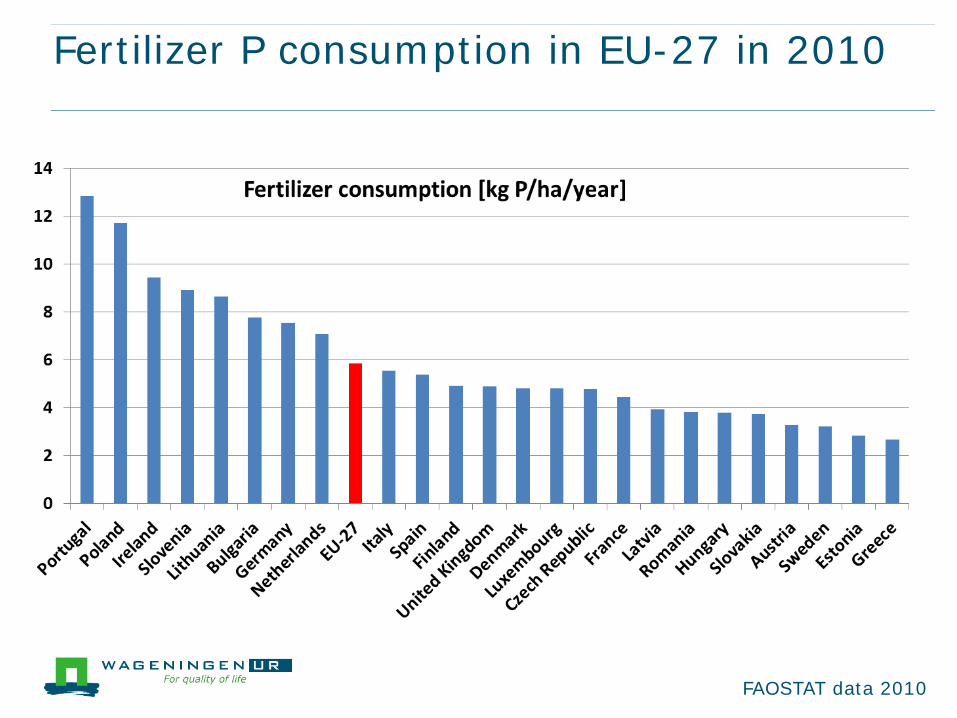
Fertilizer P consumption in EU-27 in 2010
FAOSTAT data 2010
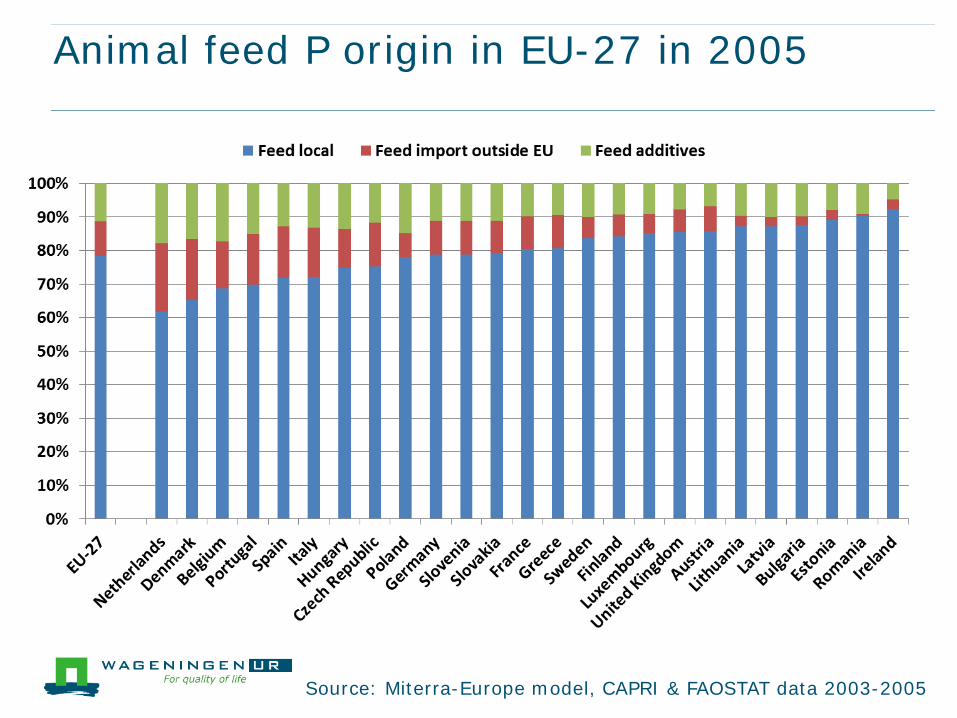
Animal feed P origin in EU-27 in 2005
Source: Miterra-Europe model, CAPRI & FAOSTAT data 2003-2005
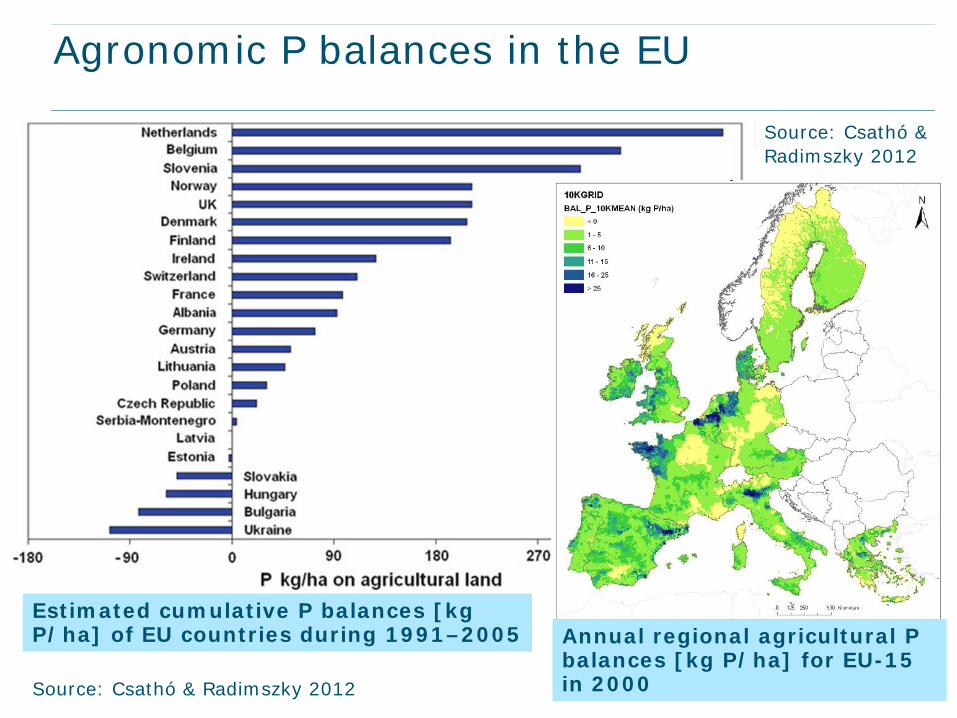
Agronomic P balances in the EU
Annual regional agricultural P balances [kg P/ha] for EU-15 in 2000
Estimated cumulative P balances [kg P/ha] of EU countries during 1991–2005
Source: Csathó & Radimszky 2012
Source: Csathó & Radimszky 2012
0
0.2
0.4
0.6
0.8
1
1.2
1.4
1.6
Dom
estic
food
P su
pply
[kg/
ca/y
ear]
AnimalPlant
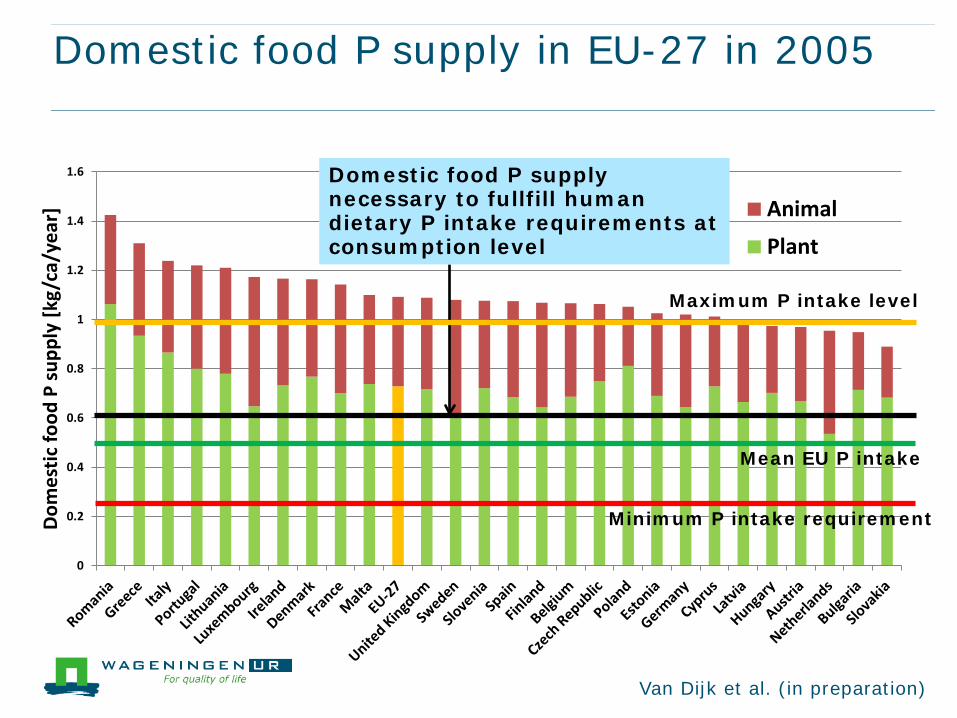
Domestic food P supply in EU-27 in 2005
Domestic food P supply necessary to fullfill human dietary P intake requirements at consumption level
Van Dijk et al. (in preparation)
Minimum P intake requirement
Mean EU P intake
Maximum P intake level
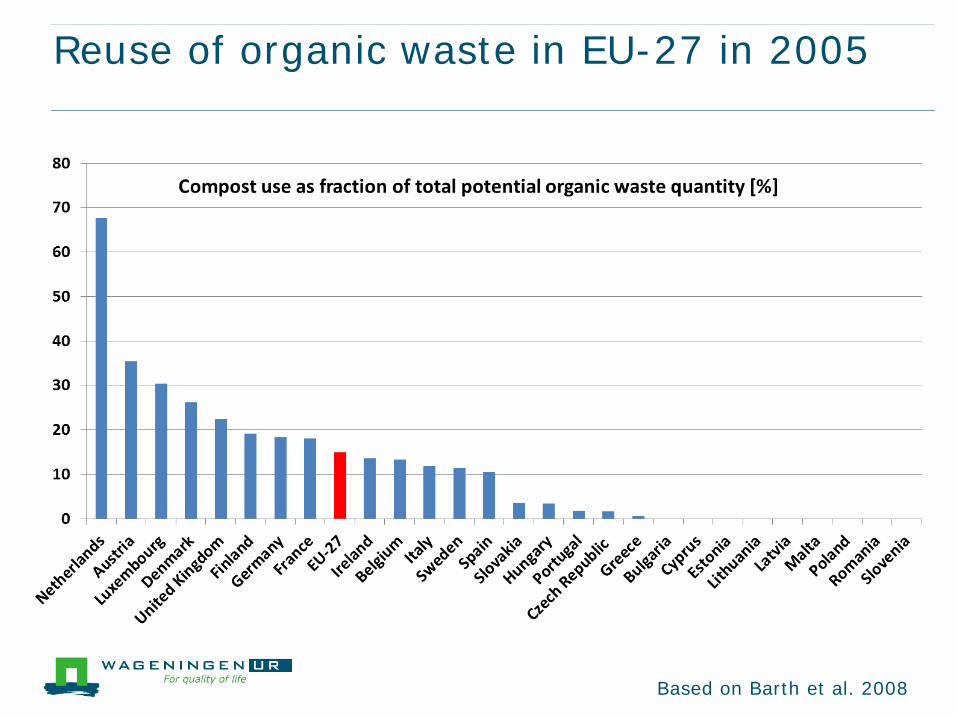
Reuse of organic waste in EU-27 in 2005
Based on Barth et al. 2008

Sludge destinations in EU-27 in 2010
Source: P-Rex, FP7 project, www.p-rex.eu; based on Eurostat 2010, Milieu Ltd 2010 & Destatis 2011
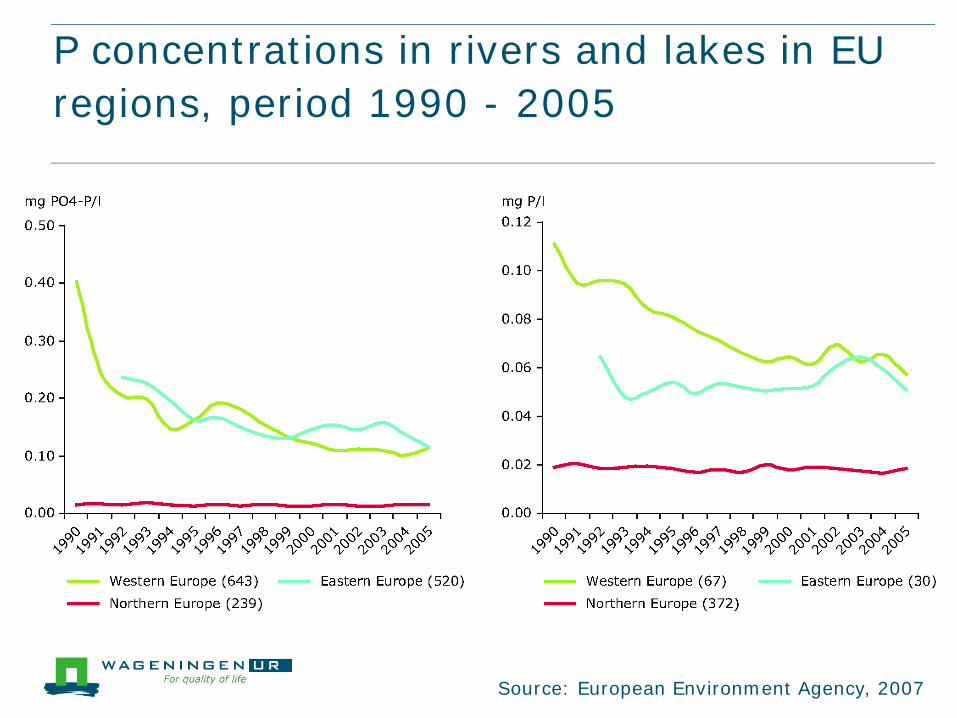
P concentrations in rivers and lakes in EU regions, period 1990 - 2005
Source: European Environment Agency, 2007