ethyl octyl ether synthesis - ubdiposit.ub.edu/dspace/bitstream/2445/45985/1/jgs_phd... ·...
TRANSCRIPT
Ethyl octyl ether synthesis from 1-octanol and ethanol or diethyl carbonate on acidic ion-
exchange resins
Jordi Guilera Sala
Aquesta tesi doctoral està subjecta a la llicència Reconeixement 3.0. Espanya de Creative Commons. Esta tesis doctoral está sujeta a la licencia Reconocimiento 3.0. España de Creative Commons. This doctoral thesis is licensed under the Creative Commons Attribution 3.0. Spain License.
Ethyl octyl ether synthesis
from 1-octanol and ethanol or diethyl carbonate on acidic ion-exchange resins
Jordi Guilera Sala
under the supervision of:
Dra. Eliana Ramírez Rangel
Prof. Dr. Javier Tejero Salvador
Ethyl octyl ether synthesis from 1-octanol and ethanol or diethyl carbonate on acidic ion-exchange resins
Doctoral thesis to obtain the degree of doctor in
Engineering and Advanced Technologies
presented by:
Jordi Guilera Sala
performed in the ―Applied Kinetics and Catalysis‖ research group,
Chemical Engineering Department,
University of Barcelona
approved by:
Dra. Eliana Ramírez Rangel Prof. Dr. Javier Tejero Salvador
University of Barcelona University of Barcelona
Barcelona, June 2013
List of publications, works in progress and conference contributions
List of publications
Authors: J. Guilera, R. Bringué, E. Ramírez, M. Iborra, J. Tejero
Title: Synthesis of ethyl octyl ether from diethyl carbonate and 1-octanol over solid catalysts. A screening study
Journal: Applied Catalysis A-General
Volume: 413-414 Pages: 21-29 Year: 2012
Authors: J. Guilera, R. Bringué, E. Ramírez, M. Iborra and J. Tejero
Title: Comparison between ethanol and diethyl carbonate as ethylating agents for ethyl octyl ether synthesis over acidic ion-exchange resins
Journal: Industrial & Engineering Chemistry Research
Volume: 51 Pages: 16525-16530 Year: 2012
Authors: C. Casas, J. Guilera, E. Ramírez, R. Bringué, M. Iborra and J. Tejero
Title: Reliability of the synthesis of C10–C16 linear ethers from 1-alkanols over acidic ion-exchange resins
Journal: Biomass Conversion and Biorefinery
Volume: 3 Pages: 27-37 Year: 2013
List of publications, works in progress and conference contributions
Works in progress
Authors: J. Guilera, E. Ramírez, M. Iborra, J. Tejero, F. Cunill Title: Synthesis of ethyl octyl ether by reaction between 1-octanol and ethanol over Amberlyst 70
Journal: Green Syntheses
Publication status: Accepted
Authors: J. Guilera, E. Ramírez, C. Fité, M. Iborra, J. Tejero
Title: Thermal stability and water effect on ion-exchange resins in ethyl octyl ether production at high temperature
Journal: Applied Catalysis A-General
Publication status: Revise and resubmit
Authors: J. Guilera, E. Ramírez, M. Iborra, J. Tejero, F. Cunill
Title: Experimental study of chemical equilibria of the liquid-phase alcohol dehydration to 1-ethoxy-octane and to ethoxyethane
Journal: Journal of Chemical & Engineering Data
Publication status: Revise and resubmit
Authors: J. Guilera, L. Hankova, K. Jerabek, E. Ramírez, J. Tejero
Title: Influence of the functionalization degree of acidic ion-exchange resins on ethyl octyl ether formation
Journal: Catalysis Today
Publication status: Under revision
Authors: J. Guilera, R. Bringué, E. Ramírez, J. Tejero, F. Cunill
Title: Kinetics of ethyl octyl ether formation from ethanol and 1-octanol dehydration catalyzed by Amberlyst 70
Journal: Chemical Engineering Journal
Publication status: Under revision
List of publications, works in progress and conference contributions
Conference contributions
Authors: J. Guilera, C. Casas, E. Ramírez, R. Bringué, M. Iborra
Title: Synthesis of ethyl octyl ether from diethyl carbonate and 1-octanol over solid catalysts
Kind of participation: Poster
Conference: Ubiochem I (Utilisation of biomass for fuels and chemicals)
Place of celebration: Cordoba (SPAIN) Year: 2010 (May)
Authors: J. Guilera, E. Ramírez, R. Bringué, M. Iborra and J. Tejero
Title: Comparison between ethanol and diethyl carbonate as ethylating agents for ethyl octyl ether production over high swollen acid resins
Kind of participation: Poster
Conference: X EUROPACAT (European Congress on Catalysis)
Place of celebration: Glasgow (SCOTLAND) Year: 2011 (August)
Authors: C. Casas, J. Guilera, E. Ramírez, R. Bringué, M. Iborra and J. Tejero
Title: Reliability of the synthesis of C10-C16 linear ethers from 1-alkanols over acidic ion exchange resins
Kind of participation: Poster
Conference: XIX ISAF (International Symposium on Alcohol Fuels)
Place of celebration: Verona (ITALY) Year: 2011 (October)
Authors: J. Guilera, E. Ramírez, C. Fité, M. Iborra, J. Tejero
Title: Water effects on the activity of ion-exchange resins as catalysts of the reaction between ethanol and 1-octanol at high temperature
Kind of participation: Poster
Conference: 15th ICC (International Congress on Catalysis)
Place of celebration: Munich (GERMANY) Year: 2012 (July)
Authors: J. Guilera, L. Hankova, K. Jerabek, E. Ramírez, J. Tejero
Title: Influence of the sulfonation degree of acidic ion-exchange resins on ethyl octyl ether formation
Kind of participation: Oral communication
Conference: CAFC10 (Congress on Catalysis Applied to Fine Chemicals)
Place of celebration: Turku (FINLAND) Year: 2013 (June)
Authors: J. Guilera, R. Bringué, E. Ramírez, J. Tejero, F. Cunill
Title: Kinetics of 1-octanol and ethanol dehydration to ethyl octyl ether over Amberlyst 70
Kind of participation: Poster
Conference: XI EUROPACAT (European Congress on Catalysis)
Place of celebration: Lyon (FRANCE) Year: 2013 (September)
Contents
Contents Chapter 1: General introduction 9
1.1 Oil influence in our society 10
1.2 Bioethanol 11
1.3 Ethyl octyl ether 12
1.4 Acidic ion-exchange resins as catalysts 13
1.5 Reaction kinetic modelling 16
1.6 Scope of the thesis 19
Chapter 2: Experimental 21
2.1 Chemicals 22
2.2 Catalysts 22
2.2.1 Acidic ion-exchange resins 22
2.2.2 Others 28
2.3 Apparatus and analysis 29
2.3.1 Batch reactor 29
2.3.2 Fixed-bed reactor 30
2.3.3 Auxiliary devices 31
Chapter 3: Synthesis of ethyl octyl ether from ethanol and 1-octanol
over acidic ion-exchange resins. A screening study 33
3.1 Introduction 34
3.2 Experimental procedure 34
3.3 Results and discussion 35
3.3.1 Description of the reaction between OcOH and EtOH 35
3.3.2 Resin morphology influence on selectivity 37
3.3.3 Resin morphology influence on yield 39
3.4 Conclusions 41
Chapter 4: Synthesis of ethyl octyl ether from diethyl carbonate and
1-octanol over solid catalysts 43
4.1 Introduction 44
4.2 Experimental procedure 45
4.3 Results and discussion 46
4.3.1 Preliminary experiments 46
4.3.2 Catalyst screening 46
4.4. Conclusions 52
Contents
Chapter 5: Comparison between ethanol and diethyl carbonate as ethylating
agents for ethyl octyl ether synthesis over acidic ion-exchange resins 53
5.1 Introduction 54
5.2 Experimental procedure 54
5.3 Results and discussion 56
5.3.1 Resin swelling 56
5.3.2 Catalytic tests 58
5.3.3 Long time catalytic tests 62
5.4 Conclusions 64
Chapter 6: Thermal stability and water effect on ion-exchange resins
in ethyl octyl ether production at high temperature 65
6.1 Introduction 66
6.2 Experimental procedure 67
6.3 Results and discussion 68
6.3.1 Hydrothermal stability 70
6.3.2 Reusability tests 72
6.3.3 Catalytic tests with alcohol-water feed 73
6.3.4 Catalytic activity for DEE, EOE and DNOE syntheses 75
6.4 Conclusions 77
Chapter 7: Kinetic and equilibrium study of ethyl octyl ether formation
from ethanol and 1-octanol dehydration on Amberlyst 70 79
7.1 Introduction 80
7.2 Experimental procedure 81
7.2.1 Equilibrium experiments 81
7.2.2 Kinetic experiments 81
7.3 Results and discussion 83
7.3.1 Equilibrium study 84
7.3.2 Kinetic study 91
7.4 Conclusions 101
Contents
Chapter 8: Influence of the functionalization degree of acidic ion-exchange
resins on ethyl octyl ether formation 103
8.1 Introduction 104
8.2 Experimental procedure 105
8.3 Results and discussion 106
8.3.1 Catalyst preparation 106
8.3.2 Catalyst characterization 106
8.3.3 Catalytic tests 112
8.3.4 Relationship between resin morphology and catalytic activity 116
8.4 Conclusions 118
Chapter 9: Summary and outlook 119
9.1 Summary 120
9.2 Outlook 122
References 123
Nomenclature, list of tables and figures 128
Resum del treball (català) 135

Chapter 1
General introduction
1. General introduction
10
1.1 Oil influence in our society
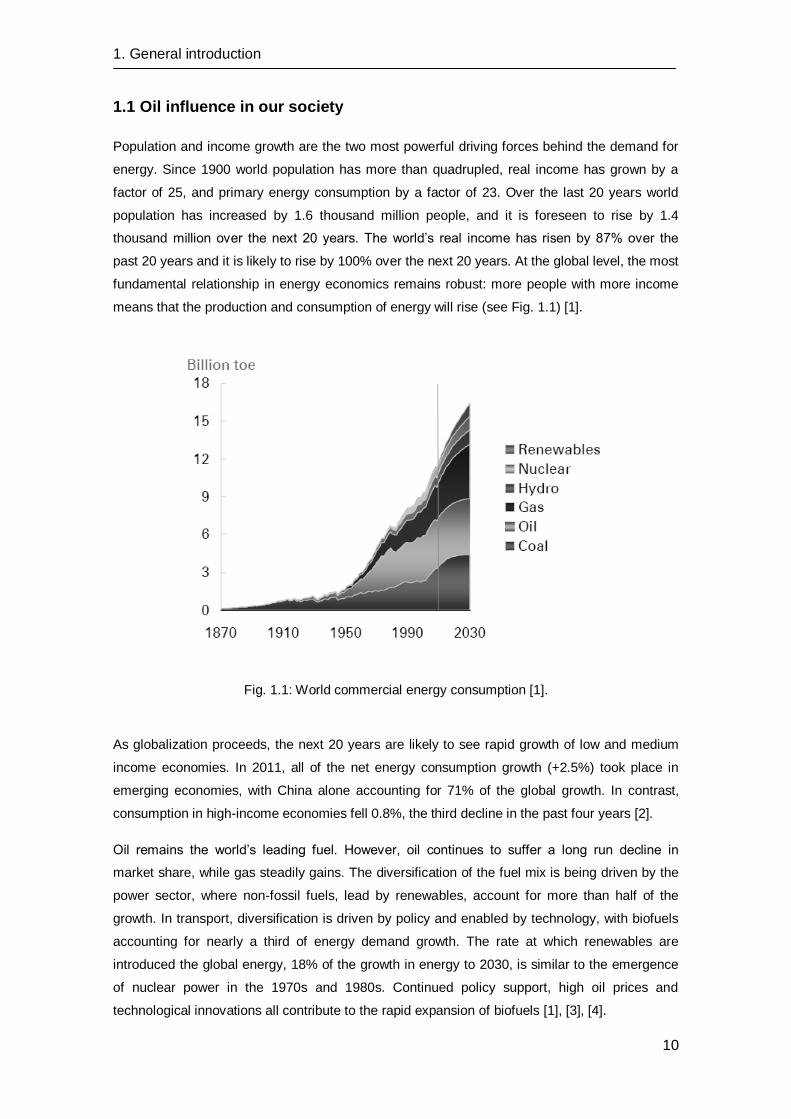
Population and income growth are the two most powerful driving forces behind the demand for
energy. Since 1900 world population has more than quadrupled, real income has grown by a
factor of 25, and primary energy consumption by a factor of 23. Over the last 20 years world
population has increased by 1.6 thousand million people, and it is foreseen to rise by 1.4
thousand million over the next 20 years. The world’s real income has risen by 87% over the
past 20 years and it is likely to rise by 100% over the next 20 years. At the global level, the most
fundamental relationship in energy economics remains robust: more people with more income
means that the production and consumption of energy will rise (see Fig. 1.1) [1].
Fig. 1.1: World commercial energy consumption [1].
As globalization proceeds, the next 20 years are likely to see rapid growth of low and medium
income economies. In 2011, all of the net energy consumption growth (+2.5%) took place in
emerging economies, with China alone accounting for 71% of the global growth. In contrast,
consumption in high-income economies fell 0.8%, the third decline in the past four years [2].
Oil remains the world’s leading fuel. However, oil continues to suffer a long run decline in
market share, while gas steadily gains. The diversification of the fuel mix is being driven by the
power sector, where non-fossil fuels, lead by renewables, account for more than half of the
growth. In transport, diversification is driven by policy and enabled by technology, with biofuels
accounting for nearly a third of energy demand growth. The rate at which renewables are
introduced the global energy, 18% of the growth in energy to 2030, is similar to the emergence
of nuclear power in the 1970s and 1980s. Continued policy support, high oil prices and
technological innovations all contribute to the rapid expansion of biofuels [1], [3], [4].
1. General introduction
11
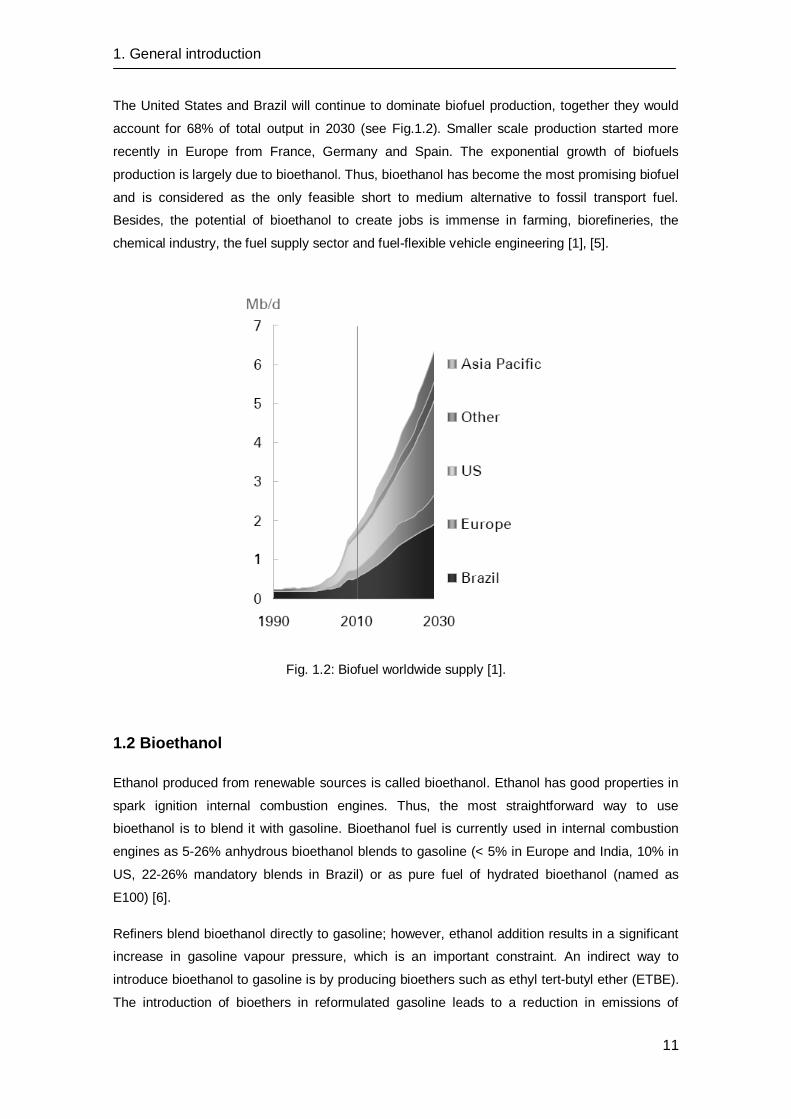
The United States and Brazil will continue to dominate biofuel production, together they would
account for 68% of total output in 2030 (see Fig.1.2). Smaller scale production started more
recently in Europe from France, Germany and Spain. The exponential growth of biofuels
production is largely due to bioethanol. Thus, bioethanol has become the most promising biofuel
and is considered as the only feasible short to medium alternative to fossil transport fuel.
Besides, the potential of bioethanol to create jobs is immense in farming, biorefineries, the
chemical industry, the fuel supply sector and fuel-flexible vehicle engineering [1], [5].
Fig. 1.2: Biofuel worldwide supply [1].
1.2 Bioethanol
Ethanol produced from renewable sources is called bioethanol. Ethanol has good properties in
spark ignition internal combustion engines. Thus, the most straightforward way to use
bioethanol is to blend it with gasoline. Bioethanol fuel is currently used in internal combustion
engines as 5-26% anhydrous bioethanol blends to gasoline (< 5% in Europe and India, 10% in
US, 22-26% mandatory blends in Brazil) or as pure fuel of hydrated bioethanol (named as
E100) [6].
Refiners blend bioethanol directly to gasoline; however, ethanol addition results in a significant
increase in gasoline vapour pressure, which is an important constraint. An indirect way to
introduce bioethanol to gasoline is by producing bioethers such as ethyl tert-butyl ether (ETBE).
The introduction of bioethers in reformulated gasoline leads to a reduction in emissions of
1. General introduction
12
exhaust pollutants such as volatile organic compounds and particles. Likewise, fuel asymmetric
branched ethers have higher octane numbers, and in this way, allow refiners to substitute other
less desirable components e.g. aromatics and olefins. Besides, blending bioethers into gasoline
is more energy efficient than that of bioethanol, with an additional saving of 24 kg of CO2-
equivalent/GJ of bioethanol [7], [8].
Ethanol is unable to be directly used in diesel engines. Nonetheless, to blend bioethanol with
conventional diesel has been evaluated since 1980s. Over the last years, this topic has been a
subject of research due to diesel fuel is foreseen to grow much faster than gasoline over the
next 20 years. In addition, interest in maximizing the production of diesel fuel is specially high in
Europe. European refineries do not produce enough diesel fuel, and consequently, European
countries are importing diesel and exporting gasoline to the United States [9], [10]. However,
the use of ethanol-diesel blends has some limitations. With respect to conventional diesel,
ethanol-diesel blend has lower viscosity and lubricity, reduced ignitability and cetane number,
higher volatility and lower miscibility. In order to overcome these difficulties, the use of cetane
enhancers and solvent additives are needed to recover the potential of these blends [9], [11].
Analogously as gasoline, a more attractive way to introduce bioethanol to the diesel pool is by
producing suitable compounds, namely bioethanol-derived components. Quoted alternative
diesel compositions can contain C4-C10 oligomers of dehydrated ethanol and ethyl glycerol
ethers [12]–[14]. Nevertheless, oligomers do not have the combustion advantages of
oxygenated compounds and ethyl glycerol ethers have been proven to be disadvantageous with
regard to the undesired particle emissions [15]. With the aim of avoiding the above
disadvantages, Eberhard recently patented the use of diesel fuel based on ethanol (60-90% v/v)
that contains linear dialkyl ethers (up to 20% v/v) [15]. The interest in using linear dialkyl ethers
in diesel fuel is caused by their high cetane number and other desirable fuel properties, such as
lower pour and cloud point [16], [17]. Additionally, the use of an alcohol from a renewable origin
to form such ethers is an opportunity to increase the biofuel percentage in the diesel pool.
1.3 Ethyl octyl ether
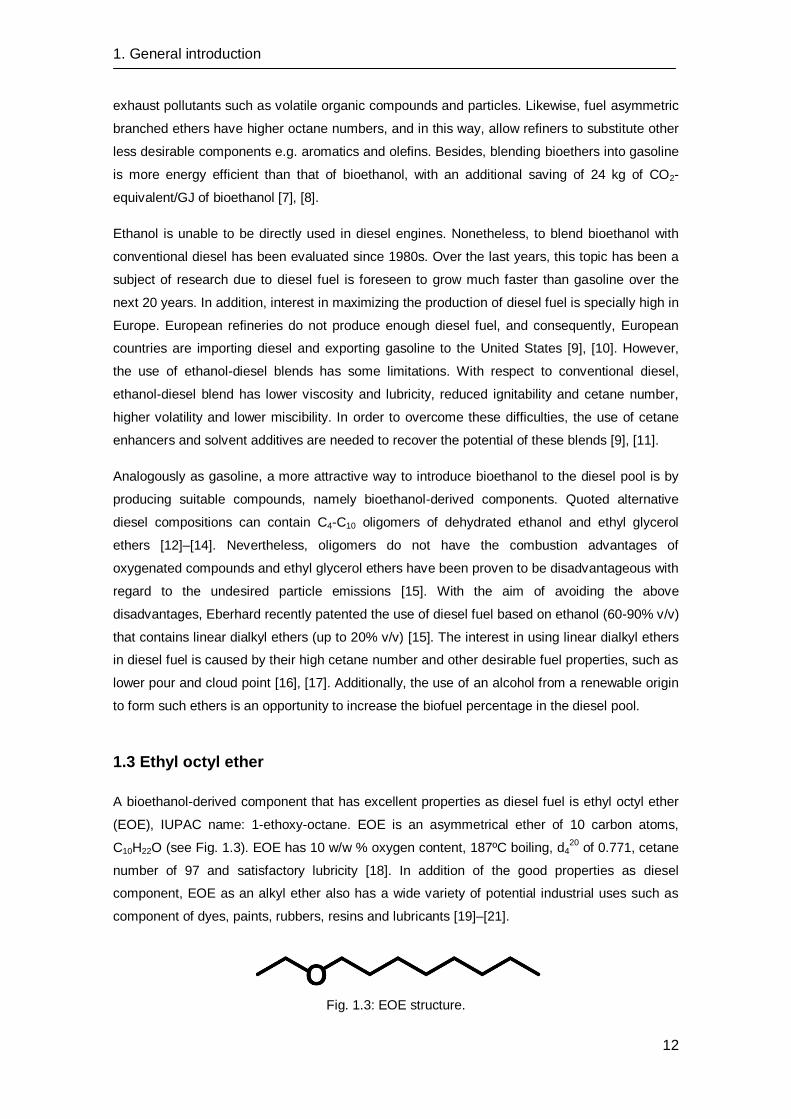
A bioethanol-derived component that has excellent properties as diesel fuel is ethyl octyl ether
(EOE), IUPAC name: 1-ethoxy-octane. EOE is an asymmetrical ether of 10 carbon atoms,
C10H22O (see Fig. 1.3). EOE has 10 w/w % oxygen content, 187ºC boiling, d420
of 0.771, cetane
number of 97 and satisfactory lubricity [18]. In addition of the good properties as diesel
component, EOE as an alkyl ether also has a wide variety of potential industrial uses such as
component of dyes, paints, rubbers, resins and lubricants [19]–[21].
Fig. 1.3: EOE structure.
1. General introduction
13
Linear ethers can be formed by the bimolecular dehydration of primary linear alcohols over acid
catalysts. Alcohol dehydration reaction is highly useful for obtaining symmetrical ethers from
primary alcohols such as dimethyl ether, di-n-butyl ether, di-n-pentyl ether, di-n-hexyl ether or
di-n-octyl ether. In the case of using secondary alcohols, the obtained selectivities to ethers are
lower, as a result of the olefinic by-product obtained by monomolecular dehydration [22]–[25].
So far, the dehydration of alcohols has been industrially catalyzed by sulfuric acid [15].
However, it is widely known that solid catalysts have the advantage of easier separation and
they yield a reaction product free of blacken compounds. Accordingly, it is desirable to obtain
solid acid catalysts that exhibit activities and selectivities at least comparable to their
homogeneous counterparts in order to obtain an economic and environmental viable process.
Besides, by using a solid catalyst it is possible to carry out the ether production on a fixed,
fluidized or mobile bed process. Over the last years, it has found that acidic ion-exchange resins
are able to catalyze the dehydration of primary alcohols to linear symmetrical ethers with high
selectivity (97-99%) [22], [25]–[27].
1.4 Acidic ion-exchange resins as catalysts
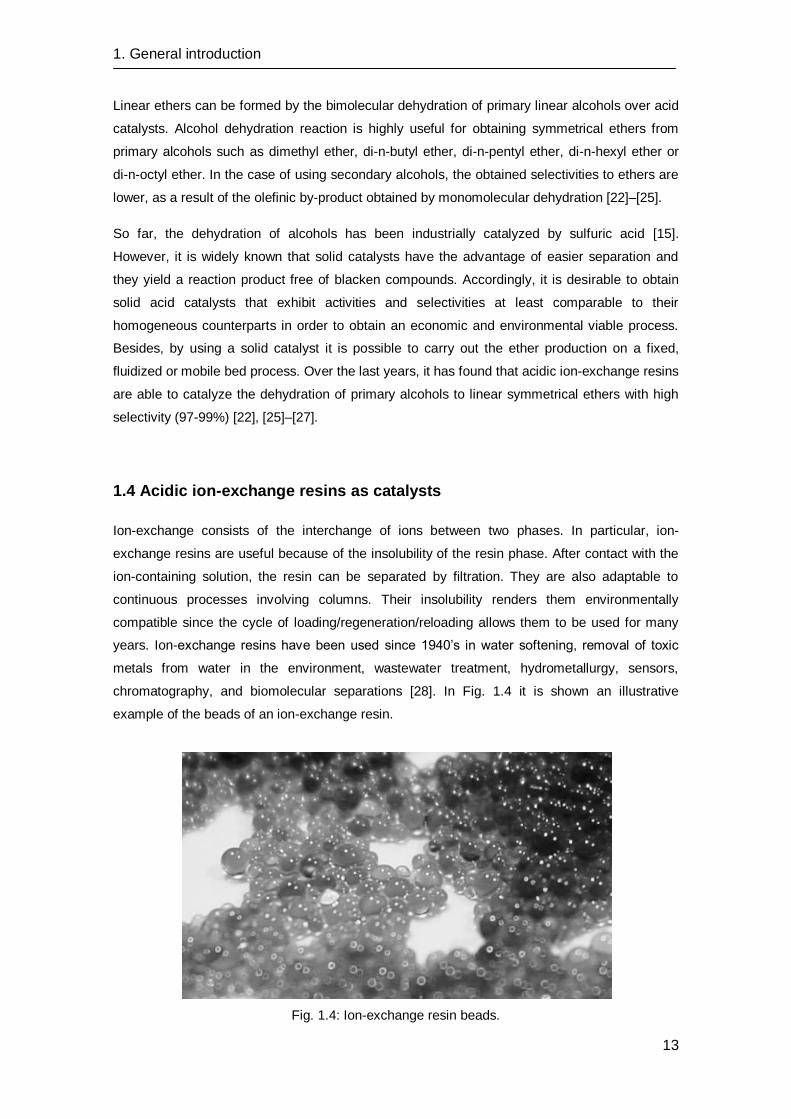
Ion-exchange consists of the interchange of ions between two phases. In particular, ion-
exchange resins are useful because of the insolubility of the resin phase. After contact with the
ion-containing solution, the resin can be separated by filtration. They are also adaptable to
continuous processes involving columns. Their insolubility renders them environmentally
compatible since the cycle of loading/regeneration/reloading allows them to be used for many
years. Ion-exchange resins have been used since 1940’s in water softening, removal of toxic
metals from water in the environment, wastewater treatment, hydrometallurgy, sensors,
chromatography, and biomolecular separations [28]. In Fig. 1.4 it is shown an illustrative
example of the beads of an ion-exchange resin.
Fig. 1.4: Ion-exchange resin beads.
1. General introduction
14
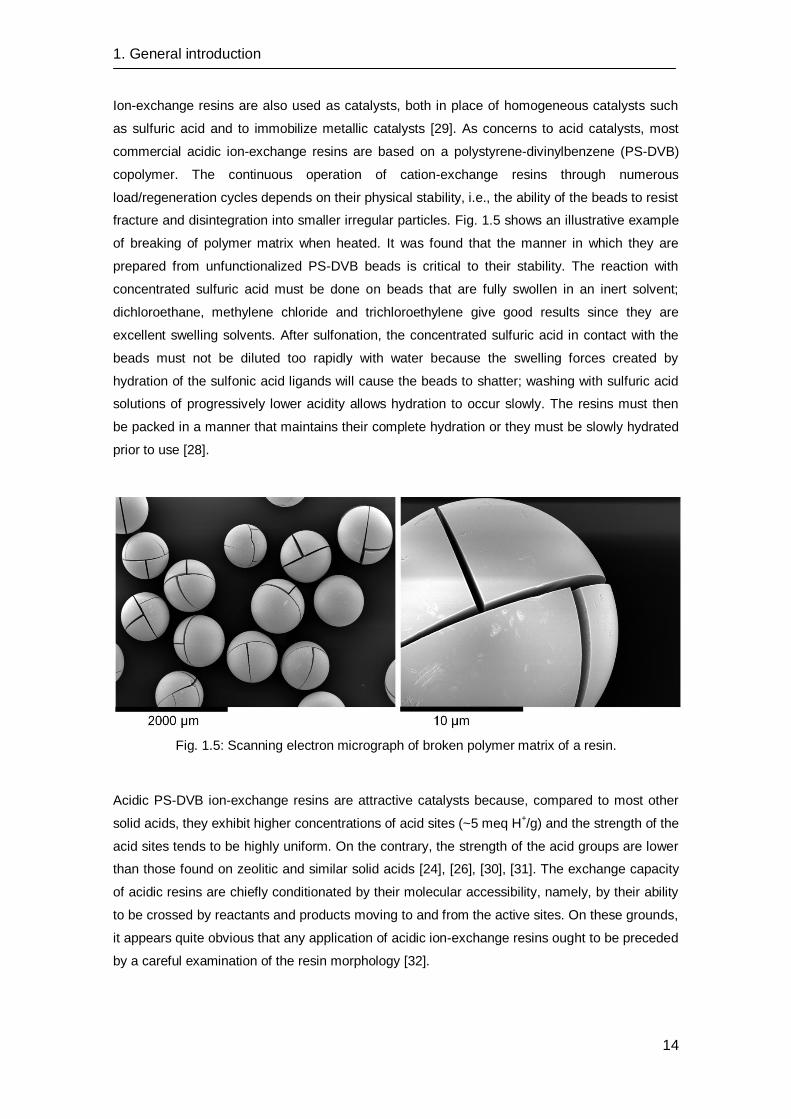
Ion-exchange resins are also used as catalysts, both in place of homogeneous catalysts such
as sulfuric acid and to immobilize metallic catalysts [29]. As concerns to acid catalysts, most
commercial acidic ion-exchange resins are based on a polystyrene-divinylbenzene (PS-DVB)
copolymer. The continuous operation of cation-exchange resins through numerous
load/regeneration cycles depends on their physical stability, i.e., the ability of the beads to resist
fracture and disintegration into smaller irregular particles. Fig. 1.5 shows an illustrative example
of breaking of polymer matrix when heated. It was found that the manner in which they are
prepared from unfunctionalized PS-DVB beads is critical to their stability. The reaction with
concentrated sulfuric acid must be done on beads that are fully swollen in an inert solvent;
dichloroethane, methylene chloride and trichloroethylene give good results since they are
excellent swelling solvents. After sulfonation, the concentrated sulfuric acid in contact with the
beads must not be diluted too rapidly with water because the swelling forces created by
hydration of the sulfonic acid ligands will cause the beads to shatter; washing with sulfuric acid
solutions of progressively lower acidity allows hydration to occur slowly. The resins must then
be packed in a manner that maintains their complete hydration or they must be slowly hydrated
prior to use [28].
Fig. 1.5: Scanning electron micrograph of broken polymer matrix of a resin.
Acidic PS-DVB ion-exchange resins are attractive catalysts because, compared to most other
solid acids, they exhibit higher concentrations of acid sites (~5 meq H+/g) and the strength of the
acid sites tends to be highly uniform. On the contrary, the strength of the acid groups are lower
than those found on zeolitic and similar solid acids [24], [26], [30], [31]. The exchange capacity
of acidic resins are chiefly conditionated by their molecular accessibility, namely, by their ability
to be crossed by reactants and products moving to and from the active sites. On these grounds,
it appears quite obvious that any application of acidic ion-exchange resins ought to be preceded
by a careful examination of the resin morphology [32].
1. General introduction
15
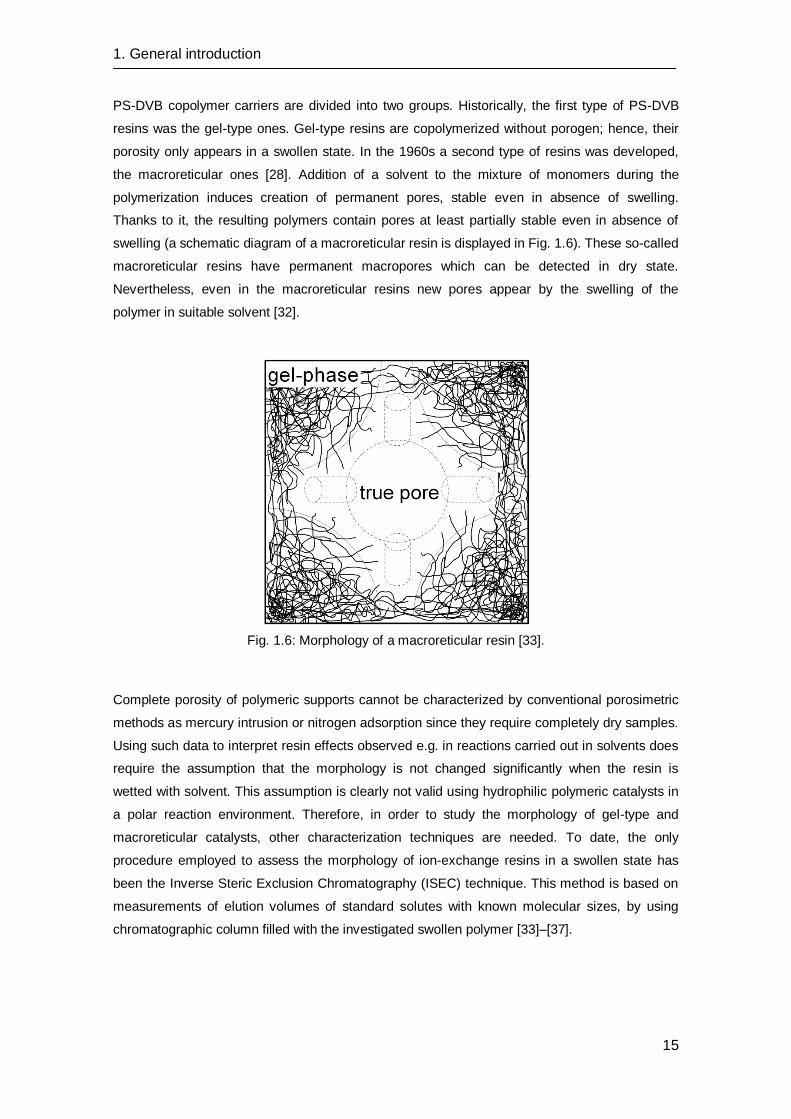
PS-DVB copolymer carriers are divided into two groups. Historically, the first type of PS-DVB
resins was the gel-type ones. Gel-type resins are copolymerized without porogen; hence, their
porosity only appears in a swollen state. In the 1960s a second type of resins was developed,
the macroreticular ones [28]. Addition of a solvent to the mixture of monomers during the
polymerization induces creation of permanent pores, stable even in absence of swelling.
Thanks to it, the resulting polymers contain pores at least partially stable even in absence of
swelling (a schematic diagram of a macroreticular resin is displayed in Fig. 1.6). These so-called
macroreticular resins have permanent macropores which can be detected in dry state.
Nevertheless, even in the macroreticular resins new pores appear by the swelling of the
polymer in suitable solvent [32].
Fig. 1.6: Morphology of a macroreticular resin [33].
Complete porosity of polymeric supports cannot be characterized by conventional porosimetric
methods as mercury intrusion or nitrogen adsorption since they require completely dry samples.
Using such data to interpret resin effects observed e.g. in reactions carried out in solvents does
require the assumption that the morphology is not changed significantly when the resin is
wetted with solvent. This assumption is clearly not valid using hydrophilic polymeric catalysts in
a polar reaction environment. Therefore, in order to study the morphology of gel-type and
macroreticular catalysts, other characterization techniques are needed. To date, the only
procedure employed to assess the morphology of ion-exchange resins in a swollen state has
been the Inverse Steric Exclusion Chromatography (ISEC) technique. This method is based on
measurements of elution volumes of standard solutes with known molecular sizes, by using
chromatographic column filled with the investigated swollen polymer [33]–[37].
1. General introduction
16
Attempts to obtain porosimetric data from ISEC technique have been reported in the open
literature since 1975. Ten years later, Jerabek proposed an approach based on modelling of the
porous structure as a set of discrete fractions, each composed of pores having simple geometry
and uniform sizes. From that point of view, gel-phase porosity is described as zones of different
chain density. According to this model, the pore size of the gel-phase is represented as total rod
length per unit of volume (nm-2) [34], [35].
The morphological information given by ISEC technique has been used in successful correlation
on catalytic activity of ion-exchangers. In polar reaction systems the catalyst swelling is
comparable to that of water, hence, it is expected that the internal catalyst morphology to be
also similar. Recently, several studies on alcohol dehydration to ethers had make use of ISEC
description to correlate ion-exchange morphology with catalytic results [22], [26], [38]. In these
works, it is observed that the accessibility of the reactants to acid centres is the key factor to
describe the catalytic results. Consequently, the ISEC technique is attracting increased interest
from resin designers and exploiters [39].
Besides acidity and morphological properties, on the selection of a suitable acidic resin for a
given reaction it is important that the catalyst retains its activity and selectivity for some time.
With respect to acid resins, a great disadvantage of its industrial use is their low thermal
stability. In general, thermal deactivation by sulfonic groups leaching hinders their application at
high temperature. Most PS-DVB resins are stable up to 150ºC, but the maximum operating
temperature of some highly used resins is even lower [40], [41]. Thermal resistance to
desulphonation of PS-DVB resins can be enhanced by adding electron withdrawing groups to
the sulfonated phenyl ring, such as chlorine atoms. Therefore, in some reactions that are
catalyzed by acidic ion-exchange resins, the operating temperature can be increased to obtain
higher reaction rates and, therefore, to have a more economically feasible reaction unit [30].
1.5 Reaction kinetic modelling
The modelling of a reaction process is necessary for further reactor design purposes. When an
acidic ion-exchange resin is used as catalyst, analogously as other solid catalysts, it is
compulsory that at least one reactant in the fluid phase interact with the solid surface, and get
fixed on it. Therefore, chemical reaction takes part in a complex process, where different
elemental catalytic steps are involved. The reaction process consists of the following seven
stages (see Fig. 1.7):
1. General introduction
17
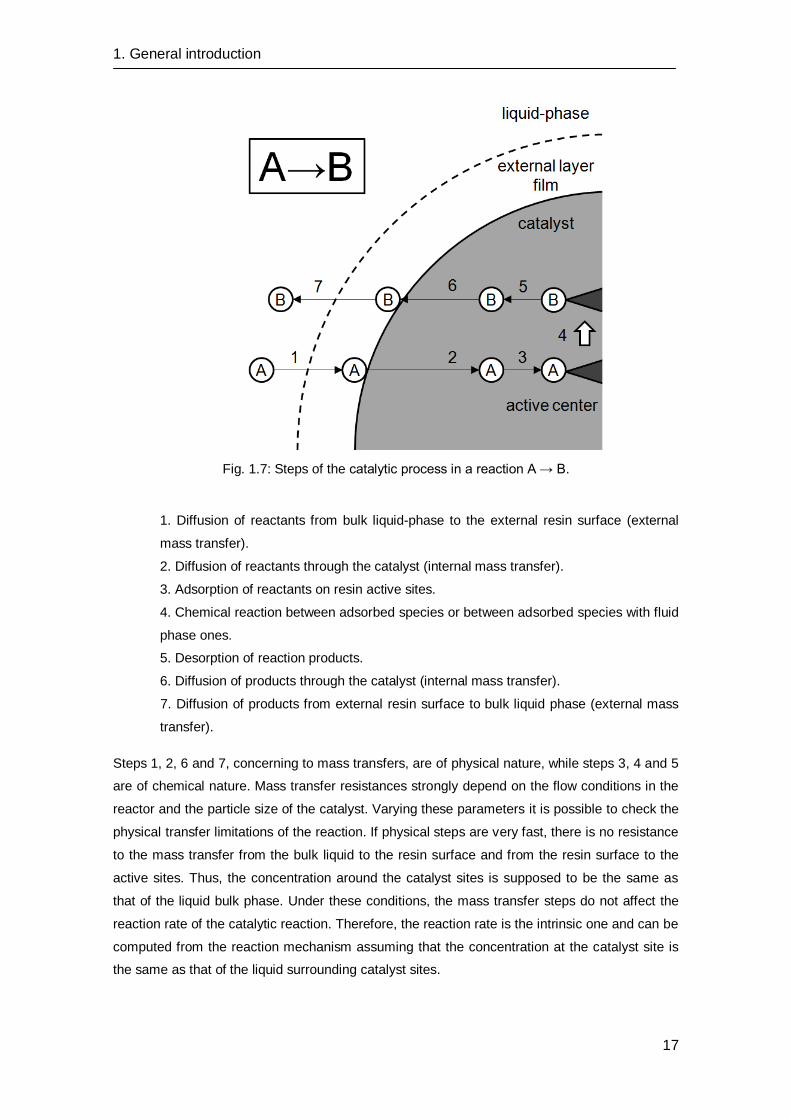
Fig. 1.7: Steps of the catalytic process in a reaction A → B.
1. Diffusion of reactants from bulk liquid-phase to the external resin surface (external
mass transfer).
2. Diffusion of reactants through the catalyst (internal mass transfer).
3. Adsorption of reactants on resin active sites.
4. Chemical reaction between adsorbed species or between adsorbed species with fluid
phase ones.
5. Desorption of reaction products.
6. Diffusion of products through the catalyst (internal mass transfer).
7. Diffusion of products from external resin surface to bulk liquid phase (external mass
transfer).
Steps 1, 2, 6 and 7, concerning to mass transfers, are of physical nature, while steps 3, 4 and 5
are of chemical nature. Mass transfer resistances strongly depend on the flow conditions in the
reactor and the particle size of the catalyst. Varying these parameters it is possible to check the
physical transfer limitations of the reaction. If physical steps are very fast, there is no resistance
to the mass transfer from the bulk liquid to the resin surface and from the resin surface to the
active sites. Thus, the concentration around the catalyst sites is supposed to be the same as
that of the liquid bulk phase. Under these conditions, the mass transfer steps do not affect the
reaction rate of the catalytic reaction. Therefore, the reaction rate is the intrinsic one and can be
computed from the reaction mechanism assuming that the concentration at the catalyst site is
the same as that of the liquid surrounding catalyst sites.
1. General introduction
18
A plausible intrinsic reaction mechanism of acidic resins catalytic reactions is that the reactants
chemisorb on the surface and react while in the adsorbed state. The process of adsorption A on
a sulfonic group σ is represented by (single site adsorption)
A + σ ↔ Aσ
and the reaction between adsorbed molecules, for instance, by
Aσ + Bσ ↔ Cσ + Dσ
The developed kinetic expressions for explaining this process are based on 3 assumptions: a)
the solid surface contains a fixed number of active sites b) all the active sites are identical c) the
active sites reactivity does not depend on quantity and nature of the rest of compounds present
on the solid surface during the reaction, it only depends on temperature. However, it is worth
mentioning that assumptions (b) and (c) are inaccurate using ion-exchangers as catalyst [37],
[39], [42].
Classical kinetic models catalyzed by solids comes from Langmuir isotherm development using
species concentration near from active sites instead of occupied sites fraction (Langmuir and
Hinshelwood) or surface molar concentrations (Hougen and Watson), which are difficult to
determine experimentally. In Langmuir-Hinshelwood-Hougen-Watson (LHHW) formalism, the
reaction is between adsorbed molecules, while in Eley-Rideal (ER) formalisms, it is considered
that some reactants are not adsorbed so that reaction occurs directly between an adsorbed
reactant with reactants present in the liquid-phase. In both cases, in the absence of external
and internal mass resistances, general procedure consists of proposing a rate-limiting step
(reactants adsorption, products desorption or surface reaction), and then to develop equations
depending on possible different active sites involved in the catalytic process. Usually, many
different possible kinetic models can be proposed to explain reaction data, but all of them
possess the same general structure (eq. 1.1), so it is compulsory to check all of them to reach
those fit better the experimental reaction rate data and provide values of thermodynamically
parameters [43], [44].
[kinetic term][driving force]reaction rate =
[adsorption term] eq. 1.1
1. General introduction
19
1.6 Scope of the thesis
Ethyl octyl ether has excellent properties as a diesel compound and it can be an industrial
option to introduce bioethanol indirectly to the diesel pool. The aim of this thesis is to study the
catalytic reaction process for obtaining such product. This involves the selection of a suitable
reaction pathway and catalysts, as well as, thermochemical and kinetic evaluation of the
process, which are necessary for a reactor design purposes.
In Chapter 2, materials, catalysts and experimental apparatus used in this work are described.
In Chapter 3, the production of ethyl octyl ether from ethanol and 1-octanol dehydration is
evaluated. In this study, several acidic ion-exchange resins are compared to establish a relation
between morphological parameters and catalytic activity to the desired product. In Chapter 4,
the synthesis of ethyl octyl ether from a mixture of diethyl carbonate over several solid catalysts
is studied. Again, the influence of the morphological parameters of the catalysts is related to the
activity. In Chapter 5, both ethanol and diethyl carbonate, are compared as ethylating agents of
1-octanol to give ethyl octyl ether over some of the best catalysts found. In Chapter 6, the
evolution of catalytic activity to form ethyl octyl ether from ethanol and 1-octanol along time is
evaluated. Temperature and water effects are highlighted. In Chapter 7, the thermochemical
data of the ethyl octyl ether formation from ethanol and 1-octanol is obtained. Besides, a kinetic
model able to predict the reaction rates on the best catalyst found, Amberlyst 70, is proposed. In
Chapter 8, the possibility of increasing the selectivity to ethyl octyl ether on acidic resins by
using partially sulfonated resins is explored. Chapter 9 summarizes the results obtained in the
scope of this work and it gives recommendations for future research.


Chapter 2
Experimental
2. Experimental
22
2.1 Chemicals
1-octanol (OcOH) (≥ 99%, Acros), ethanol (EtOH) (≥ 99.8%, Panreac), diethyl carbonate (DEC)
(≥98%, Fluka), diethyl ether (DEE) (≥99%, Panreac), di-n-octyl ether (DNOE) (≥ 97%, Fluka), 1-
octene (≥ 97%, Fluka), 1,4-dioxane (≥ 99.8, Sigma), 1-pentanol (≥99%, Sigma), sulphuric acid
(>95%, Lac-ner) and 1,2-dichloroethane (DCE) (99.8%, Acros) were used without further
purification. EOE was synthesized and purified in our lab by rectification to 99%. Bidistilled
water was also used.
2.2 Catalysts
A great part of experiments shown in this work was performed by using commercial acidic PS-
DVB resins (described in section 2.2.1). Besides, in chapter 4, it was used other types of
commercial solid catalysts such as basic resins, acidic nafion, a zeolite and two aluminas
(described in section 2.2.2). Eventually, in chapter 8, a series of PS-DVB resins were prepared
by sulfonation of a polymer carrier, and subsequently, tested (described in section 8.3).
2.2.1 Acidic PS-DVB resins
17 acidic PS-DVB resins were used as catalysts, supplied by Purolite (CT 124, 224 and 482),
Aldrich (Dowex 50Wx8, 50Wx4 and 50Wx2) and Rohm and Haas France (Amberlyst 15, 16, 31,
35, 36, 39, 46, 48, 70, 121 and XE804). The main properties of tested ion-exchange resins are
presented in Table 2.1.
2. Experimental
23
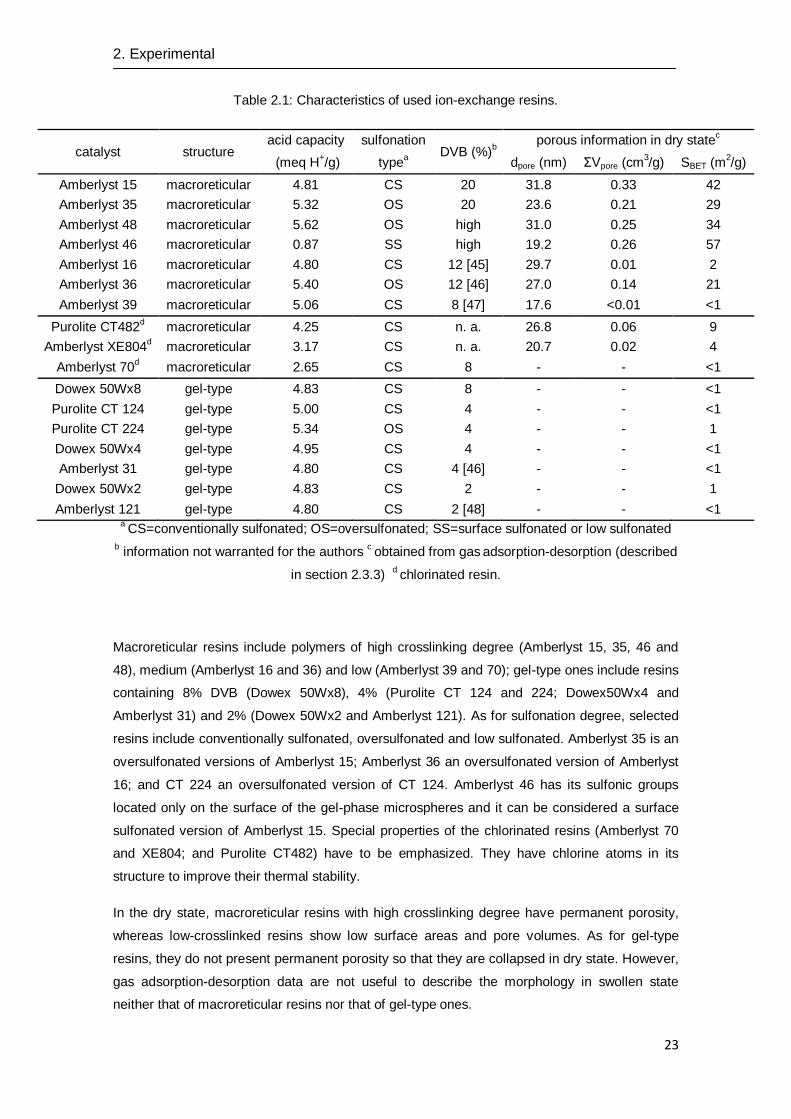
Table 2.1: Characteristics of used ion-exchange resins.
catalyst structure acid capacity sulfonation
DVB (%)b
porous information in dry statec
(meq H+/g) type
a dpore (nm) ΣVpore (cm
3/g) SBET (m
2/g)
Amberlyst 15 macroreticular 4.81 CS 20 31.8 0.33 42
Amberlyst 35 macroreticular 5.32 OS 20 23.6 0.21 29
Amberlyst 48 macroreticular 5.62 OS high 31.0 0.25 34
Amberlyst 46 macroreticular 0.87 SS high 19.2 0.26 57
Amberlyst 16 macroreticular 4.80 CS 12 [45] 29.7 0.01 2
Amberlyst 36 macroreticular 5.40 OS 12 [46] 27.0 0.14 21
Amberlyst 39 macroreticular 5.06 CS 8 [47] 17.6 <0.01 <1
Purolite CT482d macroreticular 4.25 CS n. a. 26.8 0.06 9
Amberlyst XE804d macroreticular 3.17 CS n. a. 20.7 0.02 4
Amberlyst 70d macroreticular 2.65 CS 8 - - <1
Dowex 50Wx8 gel-type 4.83 CS 8 - - <1
Purolite CT 124 gel-type 5.00 CS 4 - - <1
Purolite CT 224 gel-type 5.34 OS 4 - - 1
Dowex 50Wx4 gel-type 4.95 CS 4 - - <1
Amberlyst 31 gel-type 4.80 CS 4 [46] - - <1
Dowex 50Wx2 gel-type 4.83 CS 2 - - 1
Amberlyst 121 gel-type 4.80 CS 2 [48] - - <1 a CS=conventionally sulfonated; OS=oversulfonated; SS=surface sulfonated or low sulfonated
b information not warranted for the authors
c obtained from gas
adsorption-desorption (described
in section 2.3.3) d chlorinated resin.
Macroreticular resins include polymers of high crosslinking degree (Amberlyst 15, 35, 46 and
48), medium (Amberlyst 16 and 36) and low (Amberlyst 39 and 70); gel-type ones include resins
containing 8% DVB (Dowex 50Wx8), 4% (Purolite CT 124 and 224; Dowex50Wx4 and
Amberlyst 31) and 2% (Dowex 50Wx2 and Amberlyst 121). As for sulfonation degree, selected
resins include conventionally sulfonated, oversulfonated and low sulfonated. Amberlyst 35 is an
oversulfonated versions of Amberlyst 15; Amberlyst 36 an oversulfonated version of Amberlyst
16; and CT 224 an oversulfonated version of CT 124. Amberlyst 46 has its sulfonic groups
located only on the surface of the gel-phase microspheres and it can be considered a surface
sulfonated version of Amberlyst 15. Special properties of the chlorinated resins (Amberlyst 70
and XE804; and Purolite CT482) have to be emphasized. They have chlorine atoms in its
structure to improve their thermal stability.
In the dry state, macroreticular resins with high crosslinking degree have permanent porosity,
whereas low-crosslinked resins show low surface areas and pore volumes. As for gel-type
resins, they do not present permanent porosity so that they are collapsed in dry state. However,
gas adsorption-desorption data are not useful to describe the morphology in swollen state
neither that of macroreticular resins nor that of gel-type ones.
2. Experimental
24
Accordingly, morphological properties of acidic PS-DVB resins discussed in this work are
obtained from ISEC technique, using water as the mobile phase due to the hydrophilic character
of the catalytic tests, described in section 1.4.
True pores
Macroreticular resins are synthesized in the presence of a solvent, miscible with the monomers
but the formed polymer is insoluble in it. Thanks to it, the resulting polymers contain pores at
least partially stable even in absence of swelling (a schematic diagram of a macroreticular resin
is displayed in Fig. 1.6). This family of pores is usually called macropores and they are
permanent pores. Unambiguously, as ―true‖ pores can be evaluated pores having diameter
greater than 8 nm [38]. To characterize these pores it is possible to use the cylindrical model
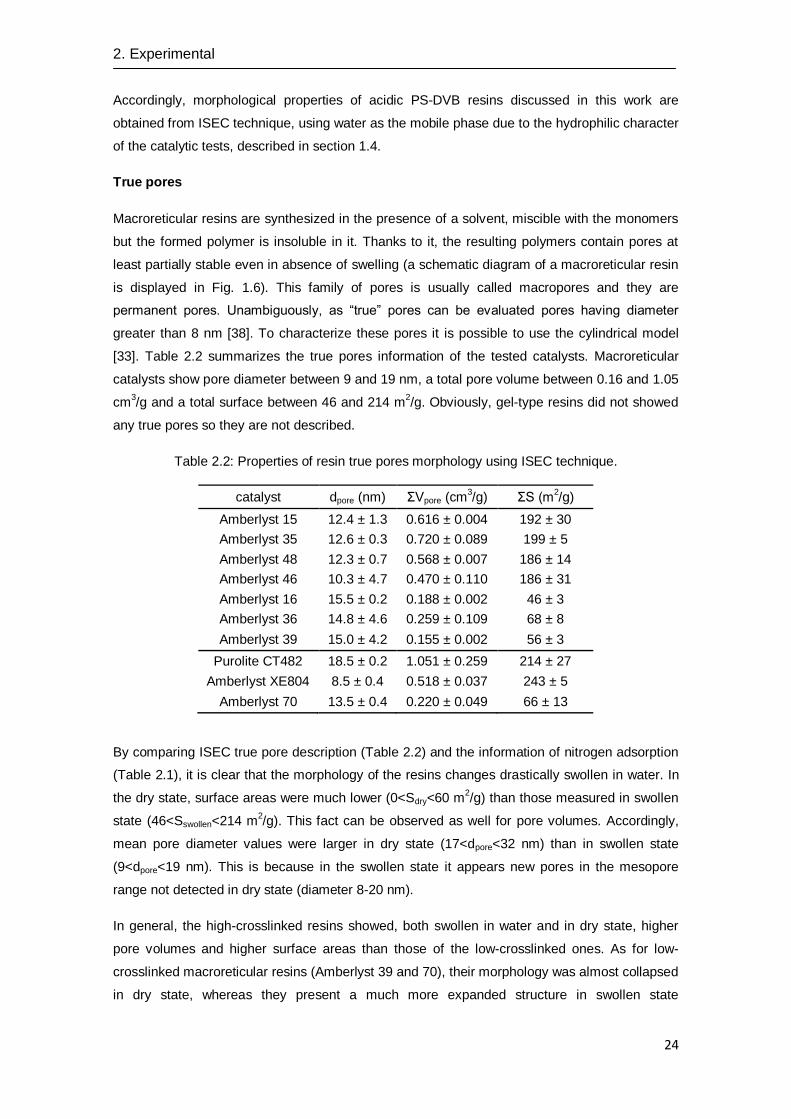
[33]. Table 2.2 summarizes the true pores information of the tested catalysts. Macroreticular
catalysts show pore diameter between 9 and 19 nm, a total pore volume between 0.16 and 1.05
cm3/g and a total surface between 46 and 214 m
2/g. Obviously, gel-type resins did not showed
any true pores so they are not described.
Table 2.2: Properties of resin true pores morphology using ISEC technique.
catalyst dpore (nm) ΣVpore (cm3/g) ΣS (m
2/g)
Amberlyst 15 12.4 ± 1.3 0.616 ± 0.004 192 ± 30
Amberlyst 35 12.6 ± 0.3 0.720 ± 0.089 199 ± 5
Amberlyst 48 12.3 ± 0.7 0.568 ± 0.007 186 ± 14
Amberlyst 46 10.3 ± 4.7 0.470 ± 0.110 186 ± 31
Amberlyst 16 15.5 ± 0.2 0.188 ± 0.002 46 ± 3
Amberlyst 36 14.8 ± 4.6 0.259 ± 0.109 68 ± 8
Amberlyst 39 15.0 ± 4.2 0.155 ± 0.002 56 ± 3
Purolite CT482 18.5 ± 0.2 1.051 ± 0.259 214 ± 27
Amberlyst XE804 8.5 ± 0.4 0.518 ± 0.037 243 ± 5
Amberlyst 70 13.5 ± 0.4 0.220 ± 0.049 66 ± 13
By comparing ISEC true pore description (Table 2.2) and the information of nitrogen adsorption
(Table 2.1), it is clear that the morphology of the resins changes drastically swollen in water. In
the dry state, surface areas were much lower (0<Sdry<60 m2/g) than those measured in swollen
state (46<Sswollen<214 m2/g). This fact can be observed as well for pore volumes. Accordingly,
mean pore diameter values were larger in dry state (17<dpore<32 nm) than in swollen state
(9<dpore<19 nm). This is because in the swollen state it appears new pores in the mesopore
range not detected in dry state (diameter 8-20 nm).
In general, the high-crosslinked resins showed, both swollen in water and in dry state, higher
pore volumes and higher surface areas than those of the low-crosslinked ones. As for low-
crosslinked macroreticular resins (Amberlyst 39 and 70), their morphology was almost collapsed
in dry state, whereas they present a much more expanded structure in swollen state
2. Experimental
25
(56<Sswollen<66 m2/g). Besides, the only pores detected in dry state for Amberlyst 39 and 70
were the large ones (18<dpore<27 nm).
Gel-phase
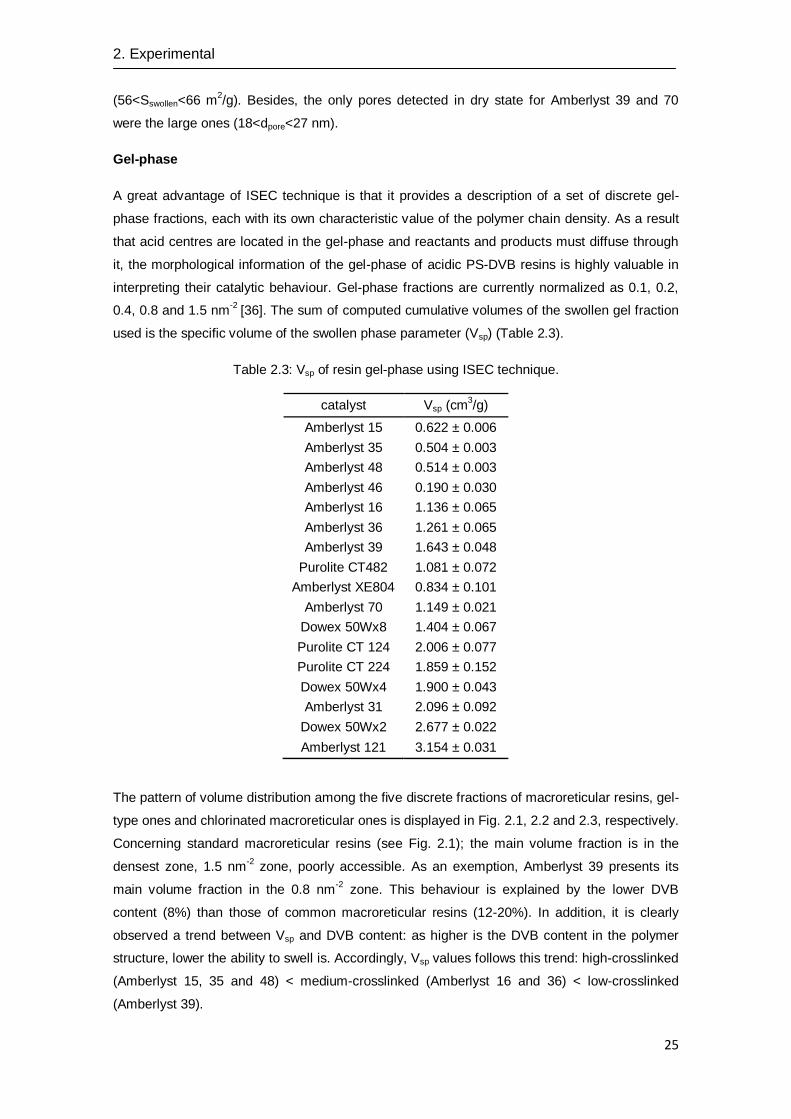
A great advantage of ISEC technique is that it provides a description of a set of discrete gel-
phase fractions, each with its own characteristic value of the polymer chain density. As a result
that acid centres are located in the gel-phase and reactants and products must diffuse through
it, the morphological information of the gel-phase of acidic PS-DVB resins is highly valuable in
interpreting their catalytic behaviour. Gel-phase fractions are currently normalized as 0.1, 0.2,
0.4, 0.8 and 1.5 nm-2
[36]. The sum of computed cumulative volumes of the swollen gel fraction
used is the specific volume of the swollen phase parameter (Vsp) (Table 2.3).
Table 2.3: Vsp of resin gel-phase using ISEC technique.
catalyst Vsp (cm3/g)
Amberlyst 15 0.622 ± 0.006
Amberlyst 35 0.504 ± 0.003
Amberlyst 48 0.514 ± 0.003
Amberlyst 46 0.190 ± 0.030
Amberlyst 16 1.136 ± 0.065
Amberlyst 36 1.261 ± 0.065
Amberlyst 39 1.643 ± 0.048
Purolite CT482 1.081 ± 0.072
Amberlyst XE804 0.834 ± 0.101
Amberlyst 70 1.149 ± 0.021
Dowex 50Wx8 1.404 ± 0.067
Purolite CT 124 2.006 ± 0.077
Purolite CT 224 1.859 ± 0.152
Dowex 50Wx4 1.900 ± 0.043
Amberlyst 31 2.096 ± 0.092
Dowex 50Wx2 2.677 ± 0.022
Amberlyst 121 3.154 ± 0.031
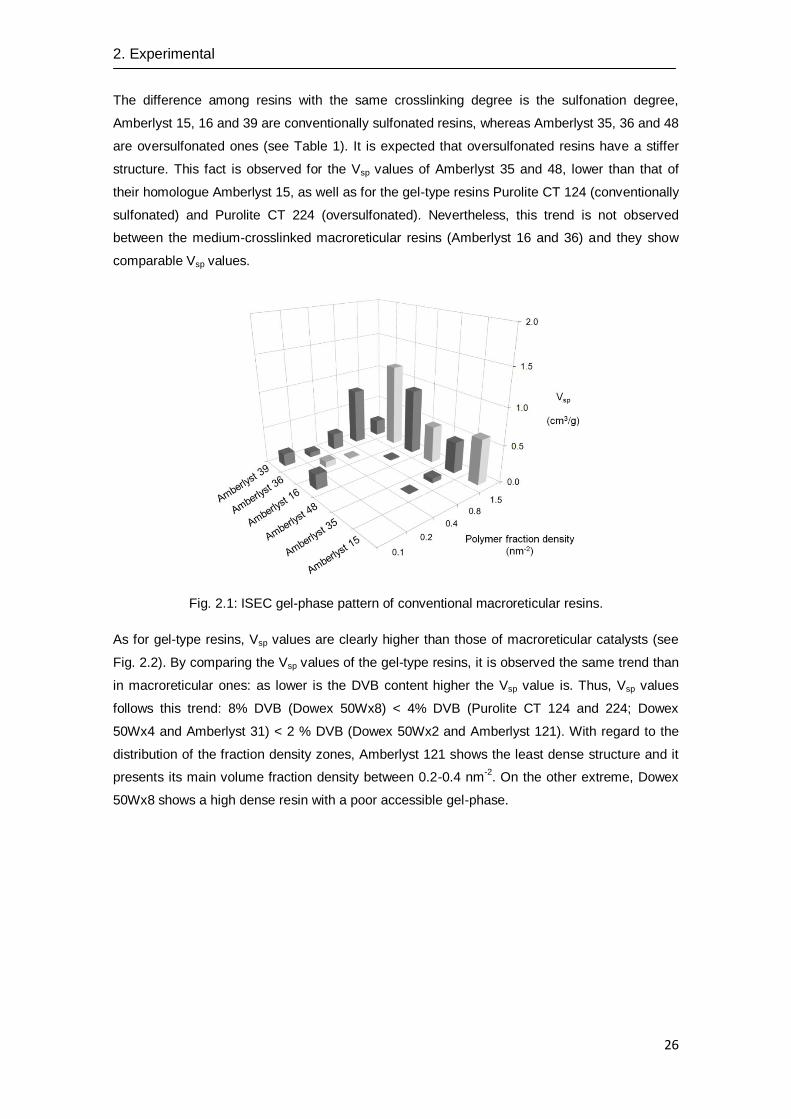
The pattern of volume distribution among the five discrete fractions of macroreticular resins, gel-
type ones and chlorinated macroreticular ones is displayed in Fig. 2.1, 2.2 and 2.3, respectively.
Concerning standard macroreticular resins (see Fig. 2.1); the main volume fraction is in the
densest zone, 1.5 nm-2
zone, poorly accessible. As an exemption, Amberlyst 39 presents its
main volume fraction in the 0.8 nm-2
zone. This behaviour is explained by the lower DVB
content (8%) than those of common macroreticular resins (12-20%). In addition, it is clearly
observed a trend between Vsp and DVB content: as higher is the DVB content in the polymer
structure, lower the ability to swell is. Accordingly, Vsp values follows this trend: high-crosslinked
(Amberlyst 15, 35 and 48) < medium-crosslinked (Amberlyst 16 and 36) < low-crosslinked
(Amberlyst 39).
2. Experimental
26
The difference among resins with the same crosslinking degree is the sulfonation degree,
Amberlyst 15, 16 and 39 are conventionally sulfonated resins, whereas Amberlyst 35, 36 and 48
are oversulfonated ones (see Table 1). It is expected that oversulfonated resins have a stiffer
structure. This fact is observed for the Vsp values of Amberlyst 35 and 48, lower than that of
their homologue Amberlyst 15, as well as for the gel-type resins Purolite CT 124 (conventionally
sulfonated) and Purolite CT 224 (oversulfonated). Nevertheless, this trend is not observed
between the medium-crosslinked macroreticular resins (Amberlyst 16 and 36) and they show
comparable Vsp values.
Fig. 2.1: ISEC gel-phase pattern of conventional macroreticular resins.
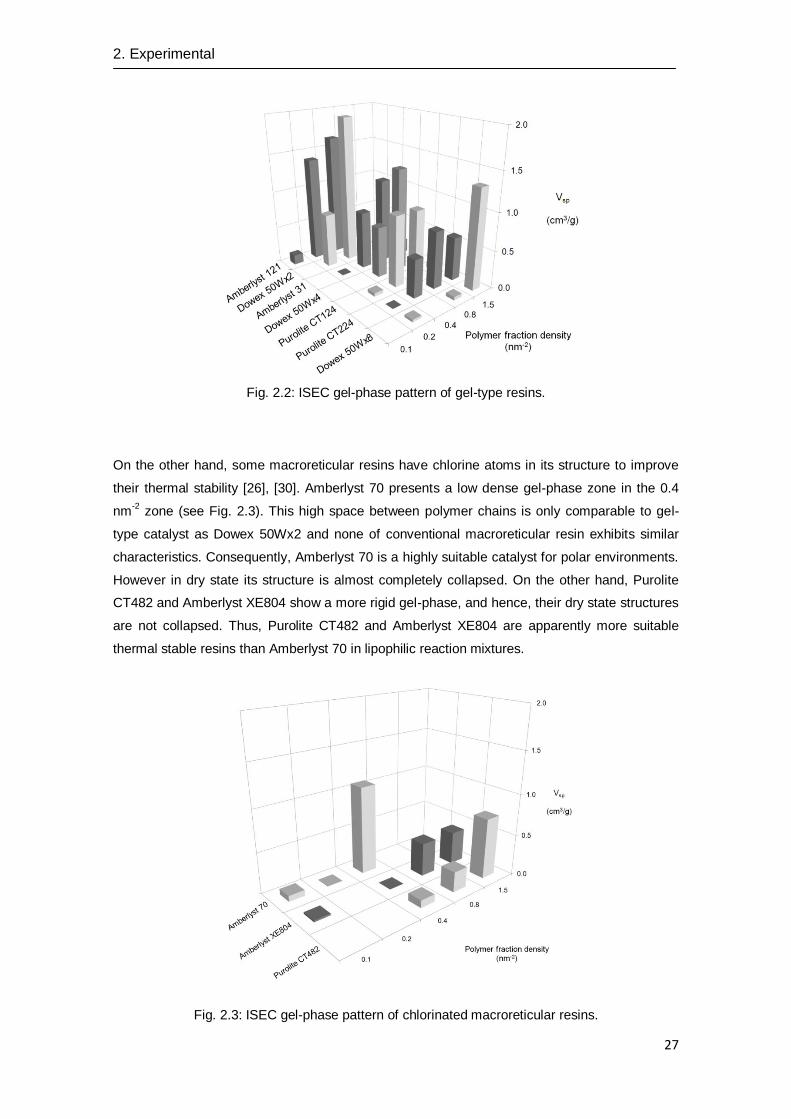
As for gel-type resins, Vsp values are clearly higher than those of macroreticular catalysts (see
Fig. 2.2). By comparing the Vsp values of the gel-type resins, it is observed the same trend than
in macroreticular ones: as lower is the DVB content higher the Vsp value is. Thus, Vsp values
follows this trend: 8% DVB (Dowex 50Wx8) < 4% DVB (Purolite CT 124 and 224; Dowex
50Wx4 and Amberlyst 31) < 2 % DVB (Dowex 50Wx2 and Amberlyst 121). With regard to the
distribution of the fraction density zones, Amberlyst 121 shows the least dense structure and it
presents its main volume fraction density between 0.2-0.4 nm-2
. On the other extreme, Dowex
50Wx8 shows a high dense resin with a poor accessible gel-phase.
2. Experimental
27
Fig. 2.2: ISEC gel-phase pattern of gel-type resins.
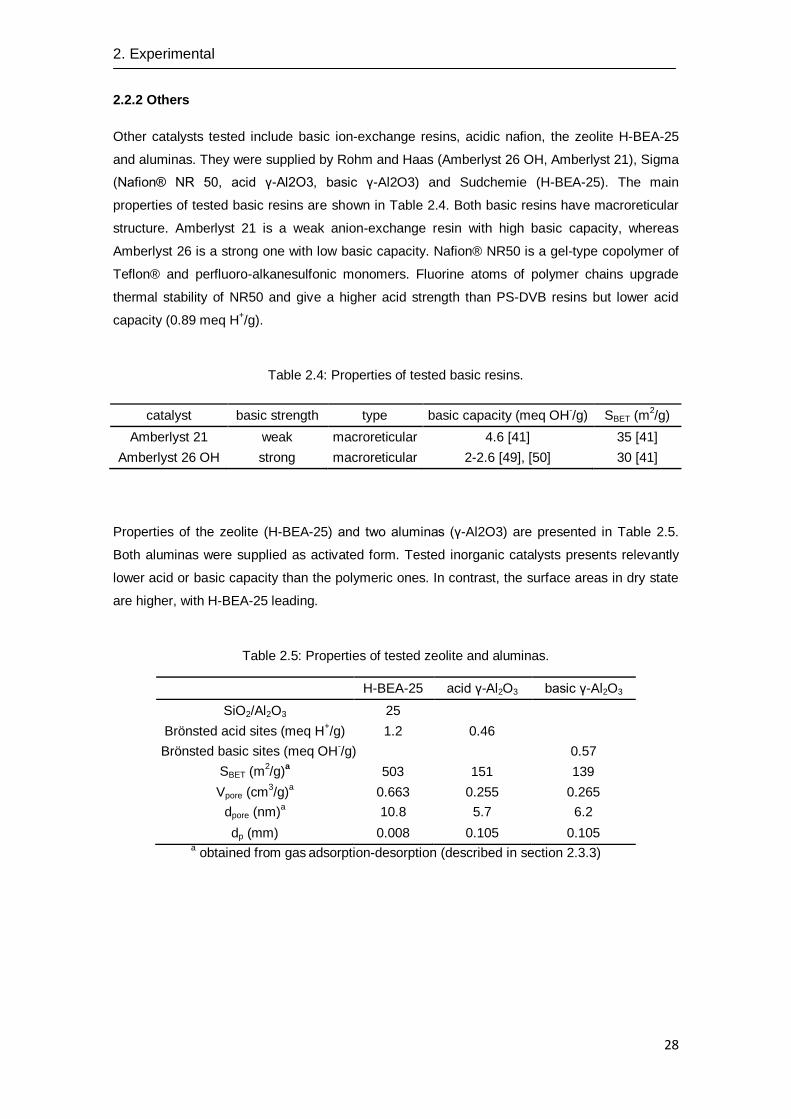
On the other hand, some macroreticular resins have chlorine atoms in its structure to improve
their thermal stability [26], [30]. Amberlyst 70 presents a low dense gel-phase zone in the 0.4
nm-2
zone (see Fig. 2.3). This high space between polymer chains is only comparable to gel-
type catalyst as Dowex 50Wx2 and none of conventional macroreticular resin exhibits similar
characteristics. Consequently, Amberlyst 70 is a highly suitable catalyst for polar environments.
However in dry state its structure is almost completely collapsed. On the other hand, Purolite
CT482 and Amberlyst XE804 show a more rigid gel-phase, and hence, their dry state structures
are not collapsed. Thus, Purolite CT482 and Amberlyst XE804 are apparently more suitable
thermal stable resins than Amberlyst 70 in lipophilic reaction mixtures.
Fig. 2.3: ISEC gel-phase pattern of chlorinated macroreticular resins.
2. Experimental
28
2.2.2 Others
Other catalysts tested include basic ion-exchange resins, acidic nafion, the zeolite H-BEA-25
and aluminas. They were supplied by Rohm and Haas (Amberlyst 26 OH, Amberlyst 21), Sigma
(Nafion® NR 50, acid γ-Al2O3, basic γ-Al2O3) and Sudchemie (H-BEA-25). The main
properties of tested basic resins are shown in Table 2.4. Both basic resins have macroreticular
structure. Amberlyst 21 is a weak anion-exchange resin with high basic capacity, whereas
Amberlyst 26 is a strong one with low basic capacity. Nafion® NR50 is a gel-type copolymer of
Teflon® and perfluoro-alkanesulfonic monomers. Fluorine atoms of polymer chains upgrade
thermal stability of NR50 and give a higher acid strength than PS-DVB resins but lower acid
capacity (0.89 meq H+/g).
Table 2.4: Properties of tested basic resins.
catalyst basic strength type basic capacity (meq OH-/g) SBET (m
2/g)
Amberlyst 21 weak macroreticular 4.6 [41] 35 [41]
Amberlyst 26 OH strong macroreticular 2-2.6 [49], [50] 30 [41]
Properties of the zeolite (H-BEA-25) and two aluminas (γ-Al2O3) are presented in Table 2.5.
Both aluminas were supplied as activated form. Tested inorganic catalysts presents relevantly
lower acid or basic capacity than the polymeric ones. In contrast, the surface areas in dry state
are higher, with H-BEA-25 leading.
Table 2.5: Properties of tested zeolite and aluminas.
H-BEA-25 acid γ-Al2O3 basic γ-Al2O3
SiO2/Al2O3 25
Brönsted acid sites (meq H+/g) 1.2 0.46
Brönsted basic sites (meq OH
-/g)
0.57
SBET (m2/g)
a 503 151 139
Vpore (cm3/g)
a 0.663 0.255 0.265
dpore (nm)a 10.8 5.7 6.2
dp (mm) 0.008 0.105 0.105 a obtained from gas
adsorption-desorption (described in section 2.3.3)
2. Experimental
29
2.3 Apparatus and analysis
The experimental data on the synthesis of EOE were obtained from two different experimental
devices, a batch and a fixed-bed reactor. Alternative devices used in this work are also
presented.
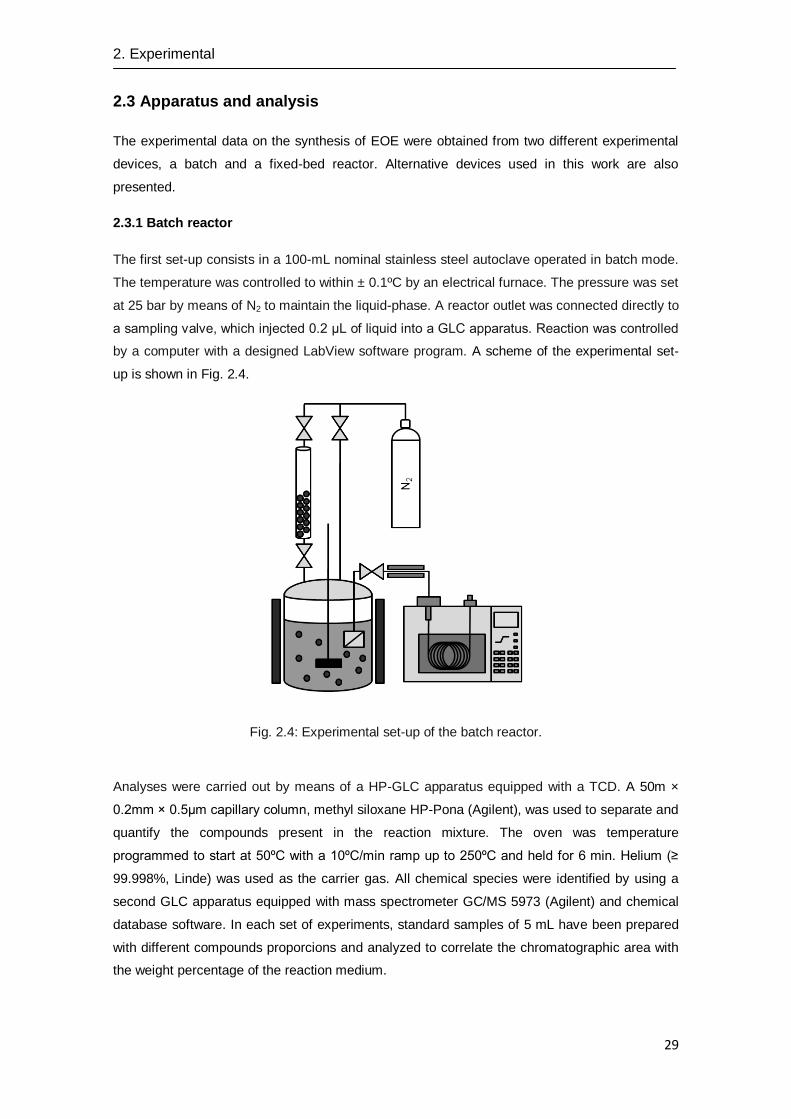
2.3.1 Batch reactor
The first set-up consists in a 100-mL nominal stainless steel autoclave operated in batch mode.
The temperature was controlled to within ± 0.1ºC by an electrical furnace. The pressure was set
at 25 bar by means of N2 to maintain the liquid-phase. A reactor outlet was connected directly to
a sampling valve, which injected 0.2 μL of liquid into a GLC apparatus. Reaction was controlled
by a computer with a designed LabView software program. A scheme of the experimental set-
up is shown in Fig. 2.4.
Fig. 2.4: Experimental set-up of the batch reactor.
Analyses were carried out by means of a HP-GLC apparatus equipped with a TCD. A 50m ×
0.2mm × 0.5μm capillary column, methyl siloxane HP-Pona (Agilent), was used to separate and
quantify the compounds present in the reaction mixture. The oven was temperature
programmed to start at 50ºC with a 10ºC/min ramp up to 250ºC and held for 6 min. Helium (≥
99.998%, Linde) was used as the carrier gas. All chemical species were identified by using a
second GLC apparatus equipped with mass spectrometer GC/MS 5973 (Agilent) and chemical
database software. In each set of experiments, standard samples of 5 mL have been prepared
with different compounds proporcions and analyzed to correlate the chromatographic area with
the weight percentage of the reaction medium.
2. Experimental
30
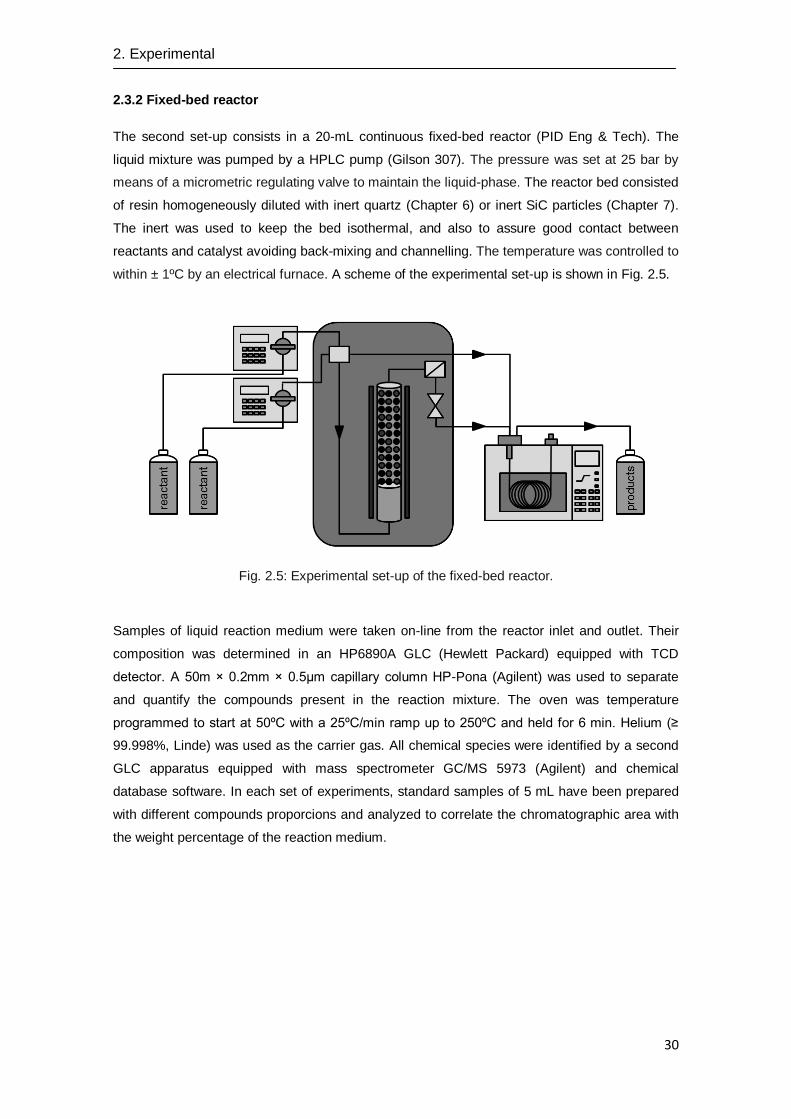
2.3.2 Fixed-bed reactor
The second set-up consists in a 20-mL continuous fixed-bed reactor (PID Eng & Tech). The
liquid mixture was pumped by a HPLC pump (Gilson 307). The pressure was set at 25 bar by
means of a micrometric regulating valve to maintain the liquid-phase. The reactor bed consisted
of resin homogeneously diluted with inert quartz (Chapter 6) or inert SiC particles (Chapter 7).
The inert was used to keep the bed isothermal, and also to assure good contact between
reactants and catalyst avoiding back-mixing and channelling. The temperature was controlled to
within ± 1ºC by an electrical furnace. A scheme of the experimental set-up is shown in Fig. 2.5.
Fig. 2.5: Experimental set-up of the fixed-bed reactor.
Samples of liquid reaction medium were taken on-line from the reactor inlet and outlet. Their
composition was determined in an HP6890A GLC (Hewlett Packard) equipped with TCD
detector. A 50m × 0.2mm × 0.5μm capillary column HP-Pona (Agilent) was used to separate
and quantify the compounds present in the reaction mixture. The oven was temperature
programmed to start at 50ºC with a 25ºC/min ramp up to 250ºC and held for 6 min. Helium (≥
99.998%, Linde) was used as the carrier gas. All chemical species were identified by a second
GLC apparatus equipped with mass spectrometer GC/MS 5973 (Agilent) and chemical
database software. In each set of experiments, standard samples of 5 mL have been prepared
with different compounds proporcions and analyzed to correlate the chromatographic area with
the weight percentage of the reaction medium.
2. Experimental
31
2.3.3 Auxiliary devices
ISEC
The morphology of ion-exchange resins in a swollen state has been assessed by means of the
ISEC technique. The ISEC apparatus consisted of HPLC pump (Waters 510), sampling valve,
stainless steel column (4.27 cm3) and a refractometric detector (Shodex RI-100). The detector
signal was connected to a computer and the sampling data was synchronized with the mobile
phase flow rate using a drop counter. Catalysts were crushed, sieved in swollen state
(0.250<dp<0.125 mm) and placed overnight in the mobile phase (0.2N Na2SO4). Then, the
swollen catalyst was packed in the column by flowing the mobile phase during around 30
minutes (~5 mL/min). Later on, the filled column was placed in the apparatus. During the
chromatographic measurements the standard solutes (deuterium oxide, sugars and dextranes)
were injected independently (20 µL). Elution volumes were determined on the basis of the first
statistical moments of the chromatographic peaks. And for each standard solutethe
measurement was three times repeated for minimization and determination of the experimental
error. At the end of the measurements, the catalyst was washed with distilled water,
quantitatively extruded from the column dried overnight (T=110ºC), and finally weighted.
Additionally, the swollen morphology of the starting polymer was also characterized by ISEC
measurements using THF as the mobile phase and n-alkanes and polystyrenes as standard
solutes.
For description of the true pores was used conventional model of cylindrical pores. Morphology
of the swollen gel was described using the Ogston model defining pores as spaces between
randomly oriented rigid rods representing the polymer chains. Instead pore diemeter, the pore
size is then defined as polymer chain concentration in units of length per unit of volume. Model
of the gel part of the polymer morphology was composed of five discrete fractions with the
polymer chain density 0.1, 0.2, 0.4, 0.8 and 1.5 nm-2
. The ISEC data treatment was based on
adjusting the volumes of the model fractions with the aim to minimize differences between
experimental elution volumes of standard solutes and values computed on the base of the
morphology model. A complete description of the procedure can be found elsewhere [33].
Distillation column A 1 meter distillation column packed with Pall rings was used to purify ethyl octyl ether (Fisher
Scientific). Pressure was set at 0.1 bar.
Karl-Fischer
A Karl Fischer automatic titrator (Orion AF8) was used to determine the water content of resins.
2. Experimental
32
Laser diffraction Size Analyzer
Particle size of resins was measured in several media by means of a LS 13320 Laser Diffraction
Particle Size Analyzer. Resins samples, previously dried at 110ºC at vacuum, were soaked for 2
days in the solvent to assure that resins were completely swollen by the solvent.
Scanning Electron Microscopy
The resin morphology and the homogeneity of the catalytic bed were examined by using
Scanning Electron Microscopy (SEM) analysis (Hitachi H-2300). The samples were dried at
110ºC under vacuum overnight, and subsequently, sputtered with a thin gold layer before
imaging.
Gas adsorption-desorption
Catalyst BET surface area (SBET), pore volue (Vpore) and pore diameter (dpore) in dry state was
obtained by nitrogen adsorption-desorption at -196ºC (Accusorb ASAP 2020, Micrometrics).
Kripton was used for surface areas < 1 m2/g. SBET was obtained by BET method. Vpore was
obtained by the volume of gas adsorbed at relative pressure (P/P0)=0.99. dpore was computed as
4Vpore/S. The samples were previously dried at 110ºC under vacuum overnight.
Chapter 3
Synthesis of ethyl octyl ether
from ethanol and 1-octanol over
acidic ion-exchange resins.
A screening study
AN EXTENDED VERSION OF THIS CHAPTER HAS BEEN PUBLISHED IN:
C. Casas, J. Guilera, E. Ramírez, R. Bringué, M. Iborra and J. Tejero. Reliability of the synthesis of C10–C16 linear ethers from 1-alkanols over acidic ion-exchange resins. Biomass Conversion and Biorefinery. 2013. 3 (1) 27-37.
3. Synthesis of EOE from EtOH and OcOH over acidic ion-exchange resins. A screening study
34
3.1 Introduction
Linear symmetrical C10-C16 ethers can be synthesized by the bimolecular dehydration reaction
of primary alcohols, such as 1-pentanol, 1-hexanol or OcOH over acid catalysts [22]. As these
alcohols can be obtained from hydroformylation of linear olefins, this could be a way to upgrade
C4 to C7 cuts from catalytic cracking. Moreover, some of these alcohols could be produced from
renewable sources such as bioethanol or glucose. Corville et al. have reported EtOH
dimerisation to butanol over MgO at 450ºC while Tsuchida et al. obtained butanol, hexanol and
OcOH over nonstoichiometric hydroxypatite between 400-450ºC [51], [52]. Recently, promising
works involving syntheses of such alcohols from biomass are being developed; Dekishima et al.
engineered an Escherichia coli strain to obtain 1-hexanol from glucose, extending a previous
work in which 1-butanol was efficiently synthesized from glucose in Escherichia coli [53].
Thus, glucose and bioethanol are potential raw materials to produce renewable additives for
commercial gasoil. Co-etherification of alcohol with bioethanol is another way of introducing
renewable materials into diesel. As an example, asymmetrical C10 ethyl octyl ether (EOE) could
be produced by reaction between EtOH and OcOH. Since the oil industry addresses efforts to
introduce a given percentage of bioethanol to diesel market, EOE could be a way to incorporate
bioethanol to diesel pool avoiding the problems of direct blending to diesel fuels. In this way,
EOE and other ethers derived from EtOH can enhance the biofuel content in diesel blends
without a reduction of the fuel quality.
Ion-exchange resins are efficient and selective in the dehydration of 1-pentanol to di-n-pentyl
ether, 1-hexanol to di-n-hexyl ether and OcOH to DNOE. Thus, it seems likely that ion-
exchange resins might be efficient catalysts in the co-dehydration between EtOH and OcOH. As
a consequence, the aim of this chapter is to study the reaction in liquid-phase on a series of
polymeric catalysts. The relationship between morphology and catalytic behaviour of tested
resins is discussed.
3.2 Experimental procedure
Catalytic tests were performed in the batch reactor (described in section 2.3.1). Resins were
previously dried at 110ºC for 3 h at atmospheric pressure and subsequently at 110 under
vacuum overnight. Then, the reactor was loaded 1 g of commercial dried resin and 70 mL of
alcohol mixture, OcOH and EtOH 1:1 molar ratio (57 g). The reaction mixture was pressurized
to 25 bar by means of N2 heated to 150ºC and stirred at 500 rpm. The time the mixture reached
150ºC was considered as zero time of the experiment. Heating time was about 20 min, and
alcohol conversion at zero time was always less than 0.5 %. Liquid samples were taken out
hourly and analyzed online to follow the reaction until the end of the experiment (6h). Working
conditions were selected since, as quoted in literature, liquid phase reactions of dehydration of
1-pentanol and 1-hexanol to linear ethers take place at these conditions in the same set-up free
3. Synthesis of EOE from EtOH and OcOH over acidic ion-exchange resins. A screening study
35
of external and internal mass transfer influences [26], [54]. In all the experiments, mass balance
was accomplished within an accuracy of ± 5 %.
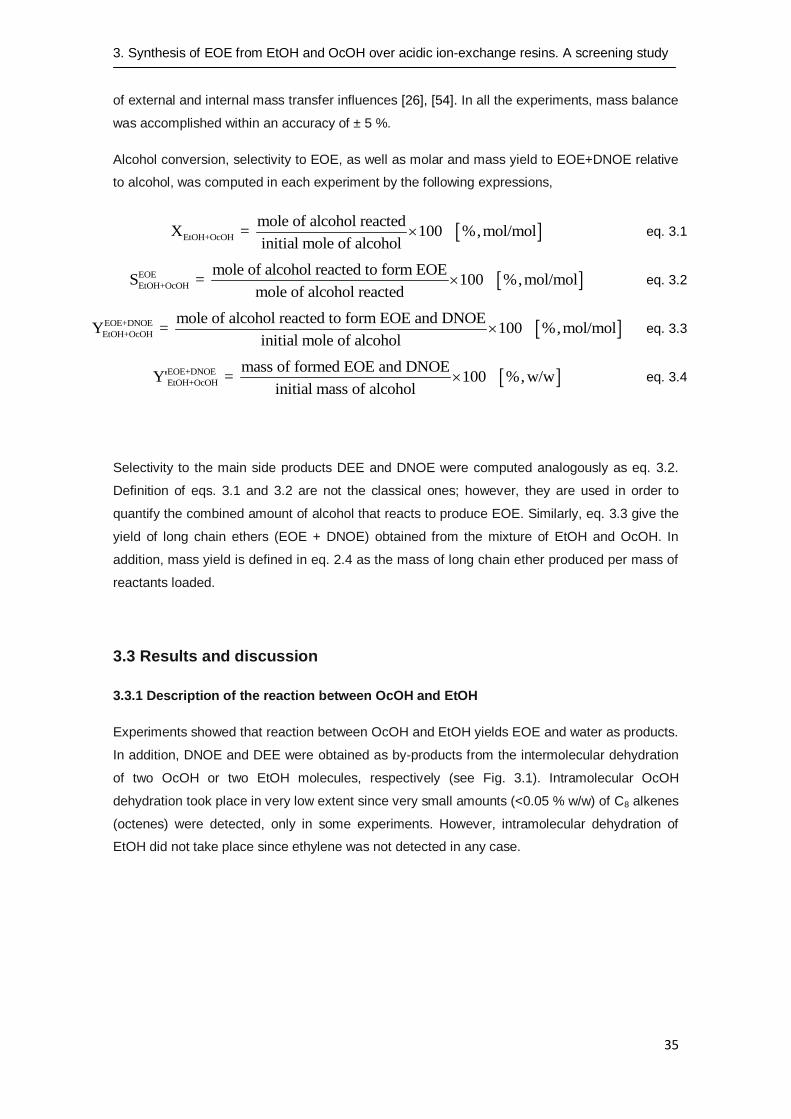
Alcohol conversion, selectivity to EOE, as well as molar and mass yield to EOE+DNOE relative
to alcohol, was computed in each experiment by the following expressions,
EtOH+OcOH
mole of alcohol reactedX = 100 %,mol/mol
initial mole of alcohol eq. 3.1
EOE
EtOH+OcOH
mole of alcohol reacted to form EOES = 100 %,mol/mol
mole of alcohol reacted eq. 3.2
EOE+DNOE
EtOH+OcOH
mole of alcohol reacted to form EOE and DNOEY = 100 %,mol/mol
initial mole of alcohol
eq. 3.3
EOE+DNOE
EtOH+OcOH
mass of formed EOE and DNOEY' = 100 %, w/w
initial mass of alcohol
eq. 3.4
Selectivity to the main side products DEE and DNOE were computed analogously as eq. 3.2.
Definition of eqs. 3.1 and 3.2 are not the classical ones; however, they are used in order to
quantify the combined amount of alcohol that reacts to produce EOE. Similarly, eq. 3.3 give the
yield of long chain ethers (EOE + DNOE) obtained from the mixture of EtOH and OcOH. In
addition, mass yield is defined in eq. 2.4 as the mass of long chain ether produced per mass of
reactants loaded.
3.3 Results and discussion
3.3.1 Description of the reaction between OcOH and EtOH
Experiments showed that reaction between OcOH and EtOH yields EOE and water as products.
In addition, DNOE and DEE were obtained as by-products from the intermolecular dehydration
of two OcOH or two EtOH molecules, respectively (see Fig. 3.1). Intramolecular OcOH
dehydration took place in very low extent since very small amounts (<0.05 % w/w) of C8 alkenes
(octenes) were detected, only in some experiments. However, intramolecular dehydration of
EtOH did not take place since ethylene was not detected in any case.
3. Synthesis of EOE from EtOH and OcOH over acidic ion-exchange resins. A screening study
36
Fig. 3.1: Reaction scheme of EOE production from OcOH and EtOH.
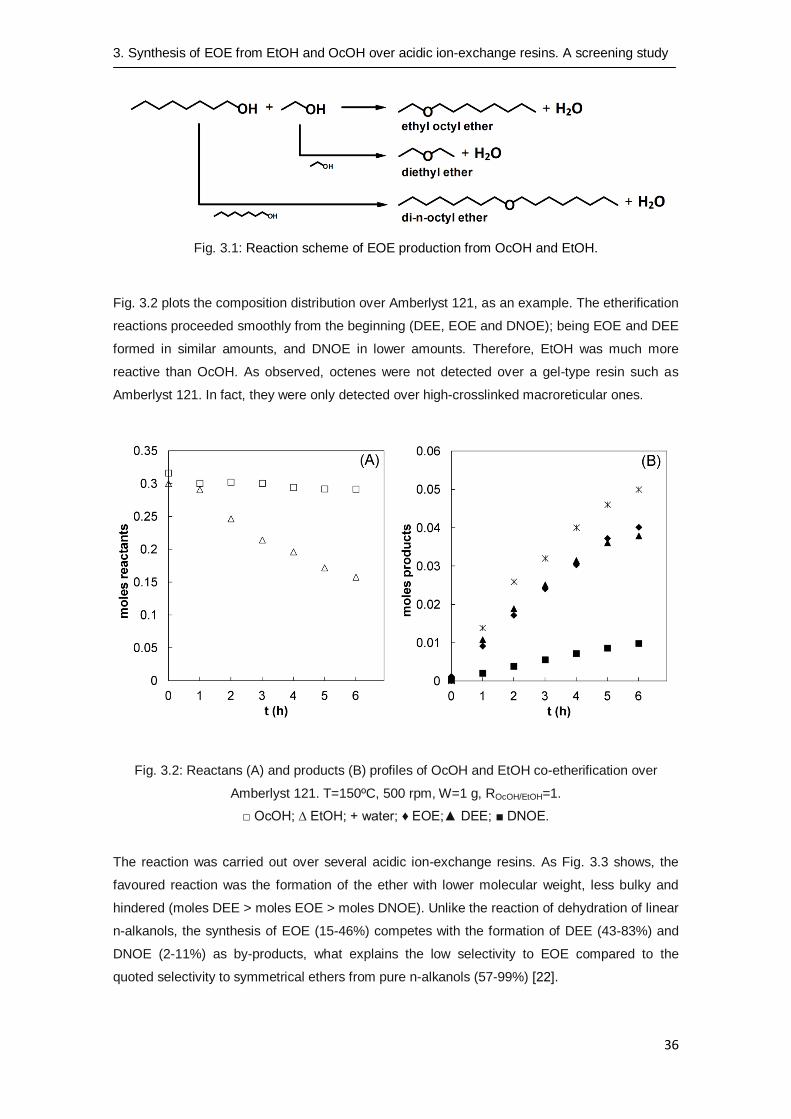
Fig. 3.2 plots the composition distribution over Amberlyst 121, as an example. The etherification
reactions proceeded smoothly from the beginning (DEE, EOE and DNOE); being EOE and DEE
formed in similar amounts, and DNOE in lower amounts. Therefore, EtOH was much more
reactive than OcOH. As observed, octenes were not detected over a gel-type resin such as
Amberlyst 121. In fact, they were only detected over high-crosslinked macroreticular ones.
Fig. 3.2: Reactans (A) and products (B) profiles of OcOH and EtOH co-etherification over
Amberlyst 121. T=150ºC, 500 rpm, W=1 g, ROcOH/EtOH=1.
□ OcOH; ∆ EtOH; + water; ♦ EOE;▲ DEE; ■ DNOE.
The reaction was carried out over several acidic ion-exchange resins. As Fig. 3.3 shows, the
favoured reaction was the formation of the ether with lower molecular weight, less bulky and
hindered (moles DEE > moles EOE > moles DNOE). Unlike the reaction of dehydration of linear
n-alkanols, the synthesis of EOE (15-46%) competes with the formation of DEE (43-83%) and
DNOE (2-11%) as by-products, what explains the low selectivity to EOE compared to the
quoted selectivity to symmetrical ethers from pure n-alkanols (57-99%) [22].
3. Synthesis of EOE from EtOH and OcOH over acidic ion-exchange resins. A screening study
37
From an industrial standpoint, the differences between EOE, DNOE and DEE as possible
candidates for diesel blends are relevant. DEE has a potential interest as a diesel compound
because it is completely produced from (bio)ethanol. In addition, the cetane number of DEE is
really high (~90) in comparison to that of EtOH (~8) or that of commercial diesel fuel (40–55)
[55]. However, the high volatility of DEE is a serious drawback for its addition in large quantities
to diesel blends. On the other hand, EOE and DNOE are linear long chain ethers with excellent
properties as diesel components [16]. At present, production of EOE may be limited by the
OcOH availability. In any case, the combined production of EOE and DNOE is useful for diesel
blends.
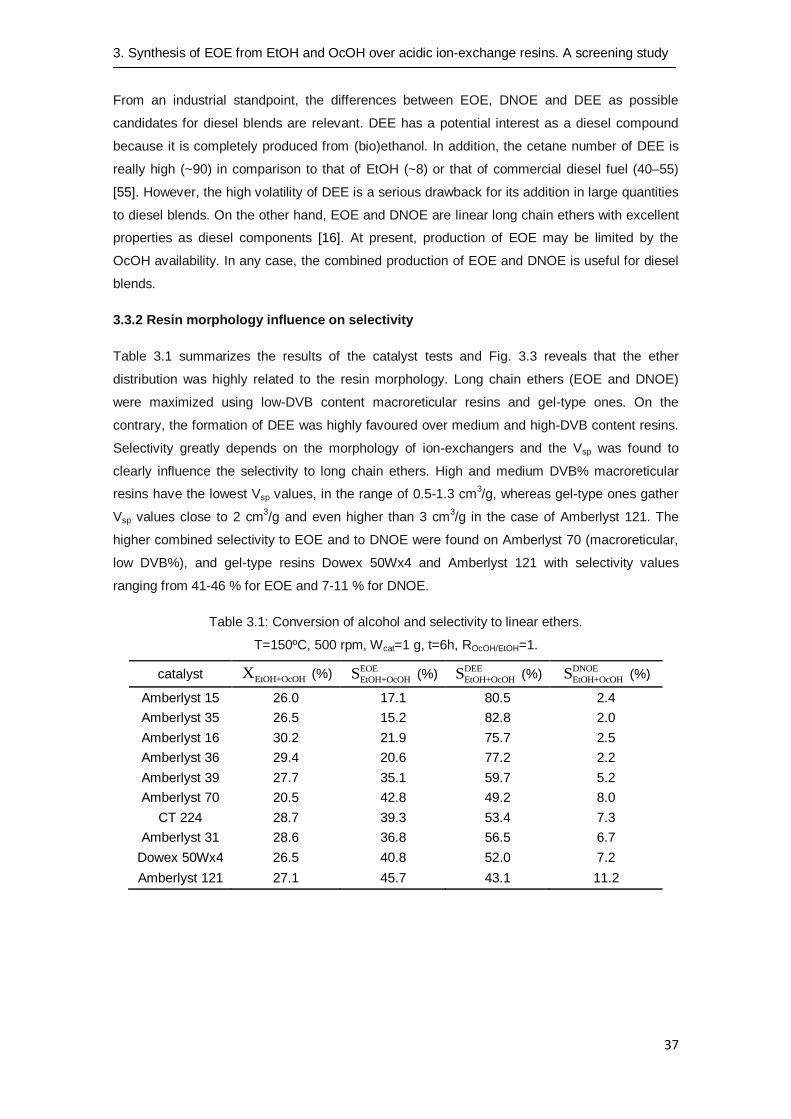
3.3.2 Resin morphology influence on selectivity
Table 3.1 summarizes the results of the catalyst tests and Fig. 3.3 reveals that the ether
distribution was highly related to the resin morphology. Long chain ethers (EOE and DNOE)
were maximized using low-DVB content macroreticular resins and gel-type ones. On the
contrary, the formation of DEE was highly favoured over medium and high-DVB content resins.
Selectivity greatly depends on the morphology of ion-exchangers and the Vsp was found to
clearly influence the selectivity to long chain ethers. High and medium DVB% macroreticular
resins have the lowest Vsp values, in the range of 0.5-1.3 cm3/g, whereas gel-type ones gather
Vsp values close to 2 cm3/g and even higher than 3 cm
3/g in the case of Amberlyst 121. The
higher combined selectivity to EOE and to DNOE were found on Amberlyst 70 (macroreticular,
low DVB%), and gel-type resins Dowex 50Wx4 and Amberlyst 121 with selectivity values
ranging from 41-46 % for EOE and 7-11 % for DNOE.
Table 3.1: Conversion of alcohol and selectivity to linear ethers.
T=150ºC, 500 rpm, Wcat=1 g, t=6h, ROcOH/EtOH=1.
catalyst EtOH+OcOHX (%) EOE
EtOH+OcOHS (%) DEE
EtOH+OcOHS (%) DNOE
EtOH+OcOHS (%)
Amberlyst 15 26.0 17.1 80.5 2.4
Amberlyst 35 26.5 15.2 82.8 2.0
Amberlyst 16 30.2 21.9 75.7 2.5
Amberlyst 36 29.4 20.6 77.2 2.2
Amberlyst 39 27.7 35.1 59.7 5.2
Amberlyst 70 20.5 42.8 49.2 8.0
CT 224 28.7 39.3 53.4 7.3
Amberlyst 31 28.6 36.8 56.5 6.7
Dowex 50Wx4 26.5 40.8 52.0 7.2
Amberlyst 121 27.1 45.7 43.1 11.2
3. Synthesis of EOE from EtOH and OcOH over acidic ion-exchange resins. A screening study
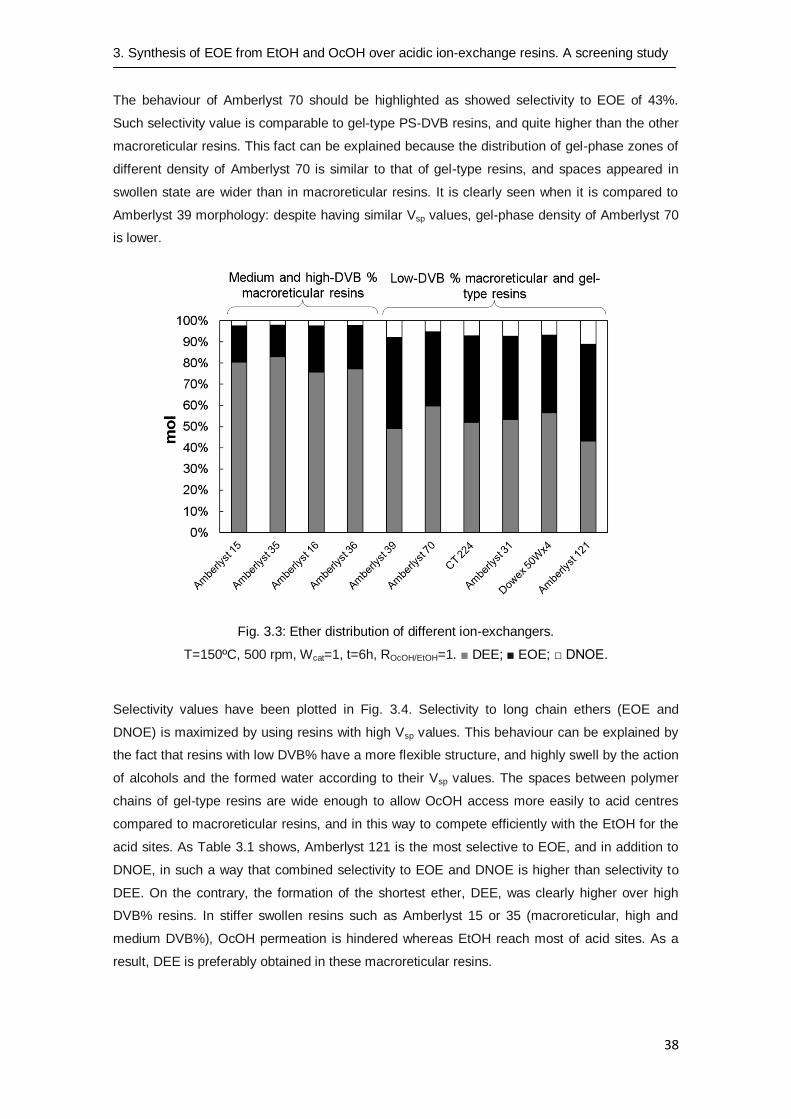
38
The behaviour of Amberlyst 70 should be highlighted as showed selectivity to EOE of 43%.
Such selectivity value is comparable to gel-type PS-DVB resins, and quite higher than the other
macroreticular resins. This fact can be explained because the distribution of gel-phase zones of
different density of Amberlyst 70 is similar to that of gel-type resins, and spaces appeared in
swollen state are wider than in macroreticular resins. It is clearly seen when it is compared to
Amberlyst 39 morphology: despite having similar Vsp values, gel-phase density of Amberlyst 70
is lower.
Fig. 3.3: Ether distribution of different ion-exchangers.
T=150ºC, 500 rpm, Wcat=1, t=6h, ROcOH/EtOH=1. ■ DEE; ■ EOE; □ DNOE.
Selectivity values have been plotted in Fig. 3.4. Selectivity to long chain ethers (EOE and
DNOE) is maximized by using resins with high Vsp values. This behaviour can be explained by
the fact that resins with low DVB% have a more flexible structure, and highly swell by the action
of alcohols and the formed water according to their Vsp values. The spaces between polymer
chains of gel-type resins are wide enough to allow OcOH access more easily to acid centres
compared to macroreticular resins, and in this way to compete efficiently with the EtOH for the
acid sites. As Table 3.1 shows, Amberlyst 121 is the most selective to EOE, and in addition to
DNOE, in such a way that combined selectivity to EOE and DNOE is higher than selectivity to
DEE. On the contrary, the formation of the shortest ether, DEE, was clearly higher over high
DVB% resins. In stiffer swollen resins such as Amberlyst 15 or 35 (macroreticular, high and
medium DVB%), OcOH permeation is hindered whereas EtOH reach most of acid sites. As a
result, DEE is preferably obtained in these macroreticular resins.
3. Synthesis of EOE from EtOH and OcOH over acidic ion-exchange resins. A screening study
39
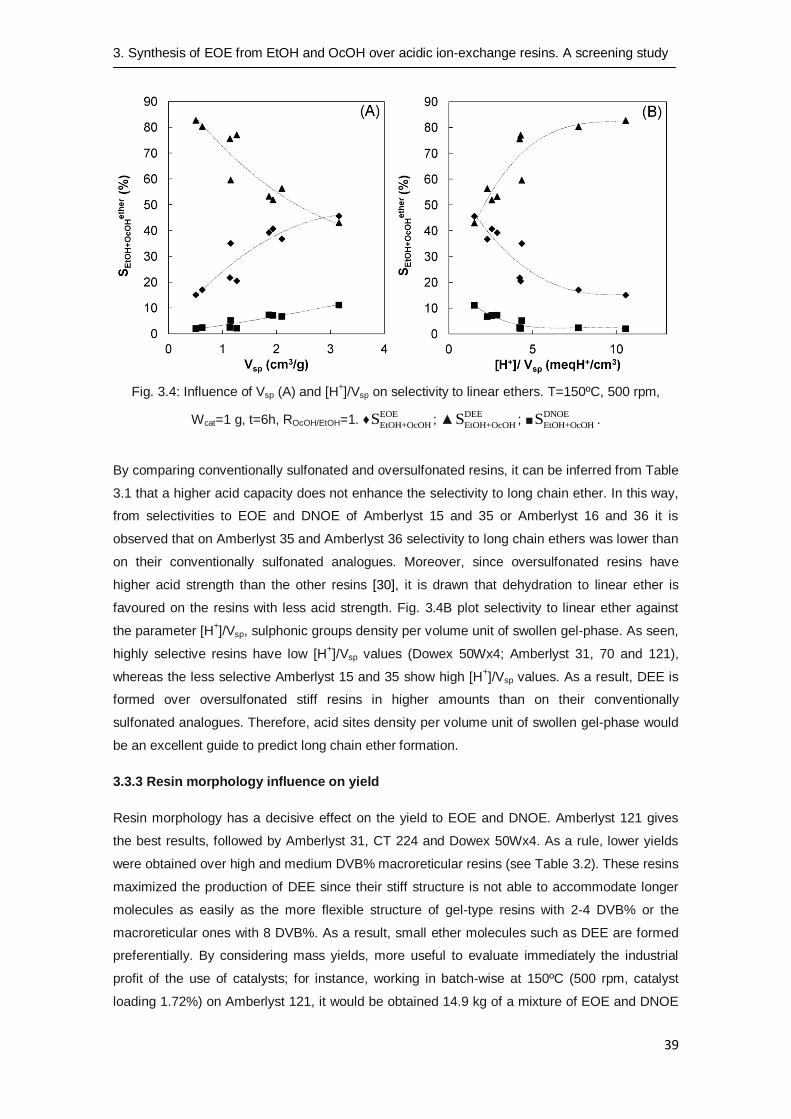
Fig. 3.4: Influence of Vsp (A) and [H+]/Vsp on selectivity to linear ethers. T=150ºC, 500 rpm,
Wcat=1 g, t=6h, ROcOH/EtOH=1. ♦EOE
EtOH+OcOHS ; ▲DEE
EtOH+OcOHS ; ■DNOE
EtOH+OcOHS .
By comparing conventionally sulfonated and oversulfonated resins, it can be inferred from Table
3.1 that a higher acid capacity does not enhance the selectivity to long chain ether. In this way,
from selectivities to EOE and DNOE of Amberlyst 15 and 35 or Amberlyst 16 and 36 it is
observed that on Amberlyst 35 and Amberlyst 36 selectivity to long chain ethers was lower than
on their conventionally sulfonated analogues. Moreover, since oversulfonated resins have
higher acid strength than the other resins [30], it is drawn that dehydration to linear ether is
favoured on the resins with less acid strength. Fig. 3.4B plot selectivity to linear ether against
the parameter [H+]/Vsp, sulphonic groups density per volume unit of swollen gel-phase. As seen,
highly selective resins have low [H+]/Vsp values (Dowex 50Wx4; Amberlyst 31, 70 and 121),
whereas the less selective Amberlyst 15 and 35 show high [H+]/Vsp values. As a result, DEE is
formed over oversulfonated stiff resins in higher amounts than on their conventionally
sulfonated analogues. Therefore, acid sites density per volume unit of swollen gel-phase would
be an excellent guide to predict long chain ether formation.
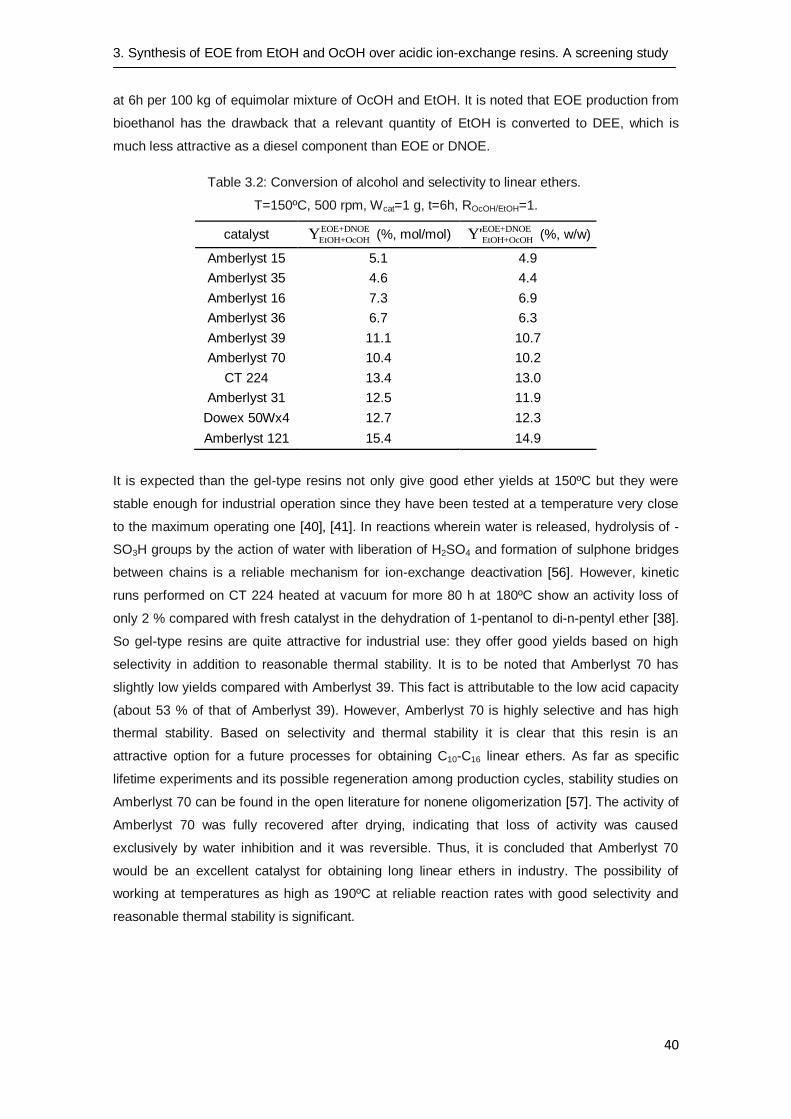
3.3.3 Resin morphology influence on yield
Resin morphology has a decisive effect on the yield to EOE and DNOE. Amberlyst 121 gives
the best results, followed by Amberlyst 31, CT 224 and Dowex 50Wx4. As a rule, lower yields
were obtained over high and medium DVB% macroreticular resins (see Table 3.2). These resins
maximized the production of DEE since their stiff structure is not able to accommodate longer
molecules as easily as the more flexible structure of gel-type resins with 2-4 DVB% or the
macroreticular ones with 8 DVB%. As a result, small ether molecules such as DEE are formed
preferentially. By considering mass yields, more useful to evaluate immediately the industrial
profit of the use of catalysts; for instance, working in batch-wise at 150ºC (500 rpm, catalyst
loading 1.72%) on Amberlyst 121, it would be obtained 14.9 kg of a mixture of EOE and DNOE
3. Synthesis of EOE from EtOH and OcOH over acidic ion-exchange resins. A screening study
40
at 6h per 100 kg of equimolar mixture of OcOH and EtOH. It is noted that EOE production from
bioethanol has the drawback that a relevant quantity of EtOH is converted to DEE, which is
much less attractive as a diesel component than EOE or DNOE.
Table 3.2: Conversion of alcohol and selectivity to linear ethers.
T=150ºC, 500 rpm, Wcat=1 g, t=6h, ROcOH/EtOH=1.
catalyst EOE+DNOE
EtOH+OcOHY (%, mol/mol) EOE+DNOE
EtOH+OcOHY' (%, w/w)
Amberlyst 15 5.1 4.9
Amberlyst 35 4.6 4.4
Amberlyst 16 7.3 6.9
Amberlyst 36 6.7 6.3
Amberlyst 39 11.1 10.7
Amberlyst 70 10.4 10.2
CT 224 13.4 13.0
Amberlyst 31 12.5 11.9
Dowex 50Wx4 12.7 12.3
Amberlyst 121 15.4 14.9
It is expected than the gel-type resins not only give good ether yields at 150ºC but they were
stable enough for industrial operation since they have been tested at a temperature very close
to the maximum operating one [40], [41]. In reactions wherein water is released, hydrolysis of -
SO3H groups by the action of water with liberation of H2SO4 and formation of sulphone bridges
between chains is a reliable mechanism for ion-exchange deactivation [56]. However, kinetic
runs performed on CT 224 heated at vacuum for more 80 h at 180ºC show an activity loss of
only 2 % compared with fresh catalyst in the dehydration of 1-pentanol to di-n-pentyl ether [38].
So gel-type resins are quite attractive for industrial use: they offer good yields based on high
selectivity in addition to reasonable thermal stability. It is to be noted that Amberlyst 70 has
slightly low yields compared with Amberlyst 39. This fact is attributable to the low acid capacity
(about 53 % of that of Amberlyst 39). However, Amberlyst 70 is highly selective and has high
thermal stability. Based on selectivity and thermal stability it is clear that this resin is an
attractive option for a future processes for obtaining C10-C16 linear ethers. As far as specific
lifetime experiments and its possible regeneration among production cycles, stability studies on
Amberlyst 70 can be found in the open literature for nonene oligomerization [57]. The activity of
Amberlyst 70 was fully recovered after drying, indicating that loss of activity was caused
exclusively by water inhibition and it was reversible. Thus, it is concluded that Amberlyst 70
would be an excellent catalyst for obtaining long linear ethers in industry. The possibility of
working at temperatures as high as 190ºC at reliable reaction rates with good selectivity and
reasonable thermal stability is significant.
3. Synthesis of EOE from EtOH and OcOH over acidic ion-exchange resins. A screening study
41
3.4 Conclusions
EOE can be successfully formed from the reaction between OcOH and EtOH over acidic ion-
exchange resins. However, selectivity to the asymmetrical EOE (15-46 %) is much lower than
those of symmetrical ethers from pure alkanols (57-99 %). This is a result that EOE synthesis
competes with the formation of DEE (43-83 %) and DNOE (2-11 %) as by-products.
The resin morphology is decisive to optimize the production to long chain ethers (EOE and
DNOE). Selectivity to EOE is enhanced in gel-type and low-DVB% macroreticular resins since
they have wide spaces in the swollen state, being Amberlyst 121 the most suitable in terms of
yield maximization. Due to the high selectivity to ether and its high thermal stability, Amberlyst
70 is a very attractive catalyst for synthesize EOE.

Chapter 4
Synthesis of ethyl octyl ether
from diethyl carbonate and
1-octanol over solid catalysts
A REVISED VERSION OF THIS CHAPTER HAS BEEN PUBLISHED IN:
J. Guilera, R. Bringué, E. Ramírez, M. Iborra, J. Tejero. Synthesis of ethyl octyl ether from diethyl carbonate and 1-octanol over solid catalysts. A screening study. Applied Catalysis A: General. 2012. 413-414 (31) 21-29.
4. Synthesis of EOE from DEC and OcOH over solid catalysts
44
4.1 Introduction
Chapter 3 proved that EOE can be successfully formed from the alcohol co-dehydration of
OcOH and EtOH over acidic ion-exchange resins. Another promising green alkylation route to
produce asymmetrical ethers is achieved with carbonates. Dimethyl carbonate has been
proposed as methylating agent of several substances and reacts either as a
methoxycarbonylating or as a methylating agent depending on the operation conditions [58]. In
particular, the OcOH alkylation from dimethyl carbonate clearly showed to be more efficient than
using directly methanol [59]. As dimethyl carbonate, DEC is generally accepted as an
environmentally benign ethylating agent [60]–[64]. An advantage of using DEC with respect to
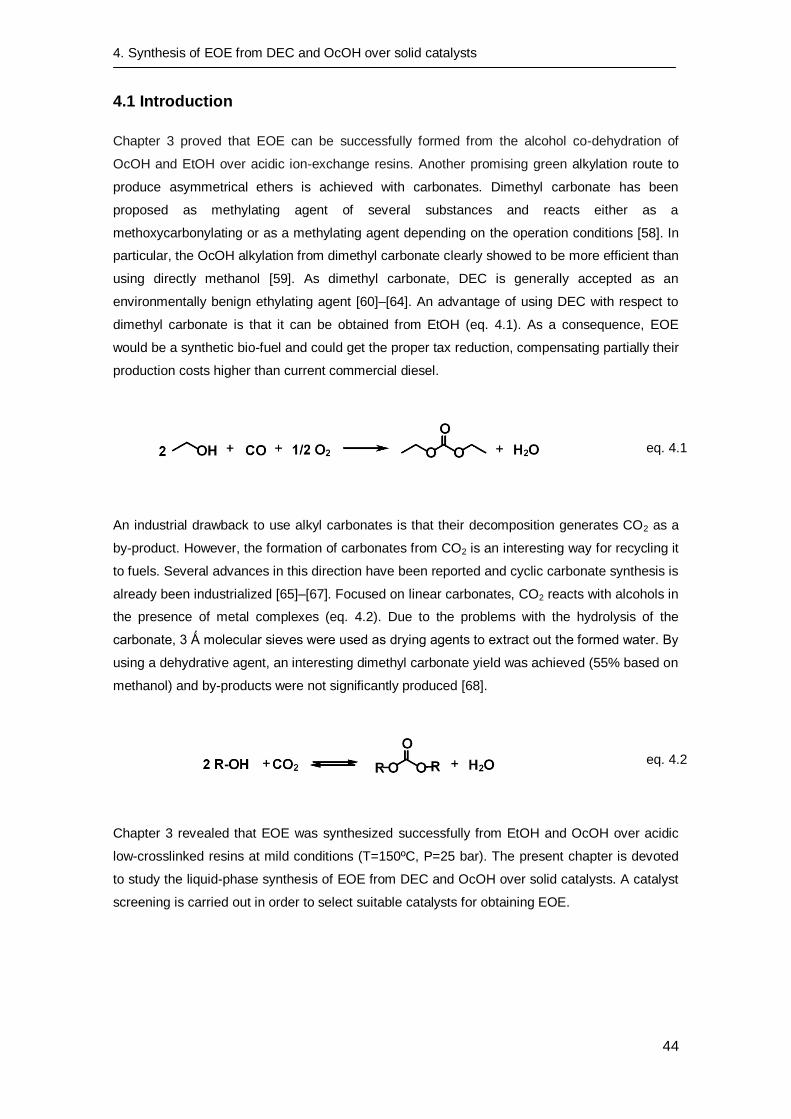
dimethyl carbonate is that it can be obtained from EtOH (eq. 4.1). As a consequence, EOE
would be a synthetic bio-fuel and could get the proper tax reduction, compensating partially their
production costs higher than current commercial diesel.
eq. 4.1
An industrial drawback to use alkyl carbonates is that their decomposition generates CO2 as a
by-product. However, the formation of carbonates from CO2 is an interesting way for recycling it
to fuels. Several advances in this direction have been reported and cyclic carbonate synthesis is
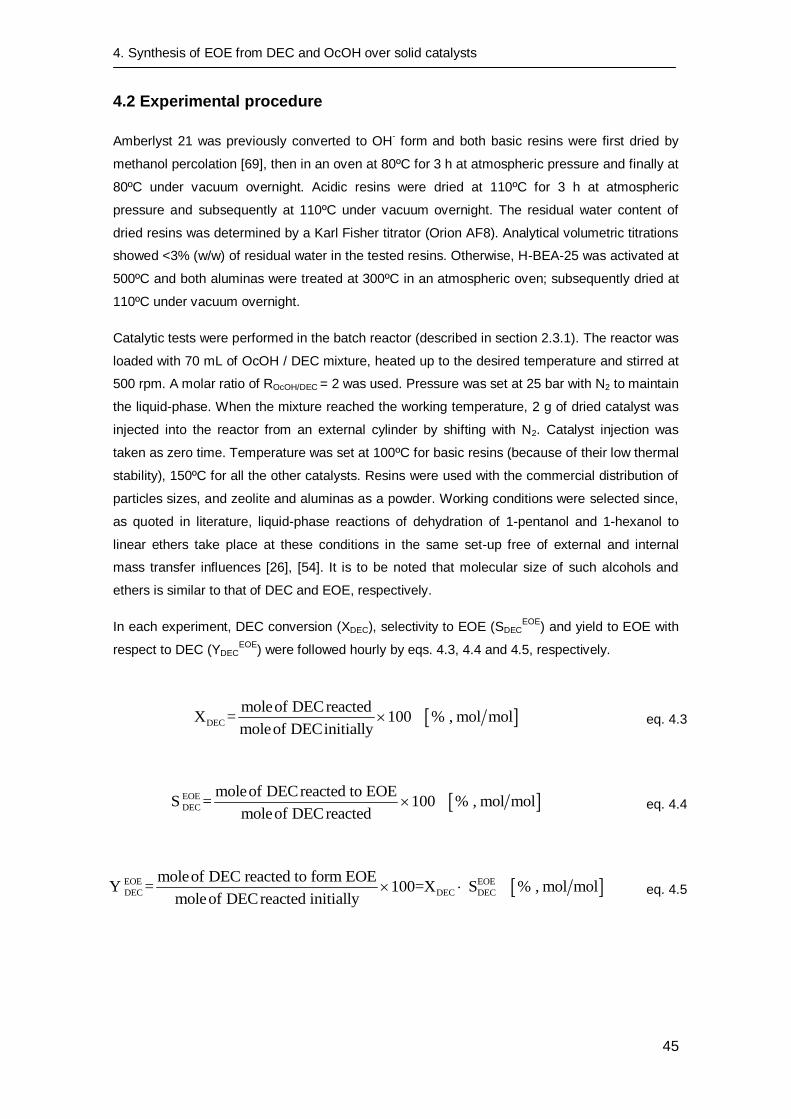
already been industrialized [65]–[67]. Focused on linear carbonates, CO2 reacts with alcohols in
the presence of metal complexes (eq. 4.2). Due to the problems with the hydrolysis of the
carbonate, 3 Ǻ molecular sieves were used as drying agents to extract out the formed water. By
using a dehydrative agent, an interesting dimethyl carbonate yield was achieved (55% based on
methanol) and by-products were not significantly produced [68].
eq. 4.2
Chapter 3 revealed that EOE was synthesized successfully from EtOH and OcOH over acidic
low-crosslinked resins at mild conditions (T=150ºC, P=25 bar). The present chapter is devoted
to study the liquid-phase synthesis of EOE from DEC and OcOH over solid catalysts. A catalyst
screening is carried out in order to select suitable catalysts for obtaining EOE.
4. Synthesis of EOE from DEC and OcOH over solid catalysts
45
4.2 Experimental procedure
Amberlyst 21 was previously converted to OH- form and both basic resins were first dried by
methanol percolation [69], then in an oven at 80ºC for 3 h at atmospheric pressure and finally at
80ºC under vacuum overnight. Acidic resins were dried at 110ºC for 3 h at atmospheric
pressure and subsequently at 110ºC under vacuum overnight. The residual water content of
dried resins was determined by a Karl Fisher titrator (Orion AF8). Analytical volumetric titrations
showed <3% (w/w) of residual water in the tested resins. Otherwise, H-BEA-25 was activated at
500ºC and both aluminas were treated at 300ºC in an atmospheric oven; subsequently dried at
110ºC under vacuum overnight.
Catalytic tests were performed in the batch reactor (described in section 2.3.1). The reactor was
loaded with 70 mL of OcOH / DEC mixture, heated up to the desired temperature and stirred at
500 rpm. A molar ratio of ROcOH/DEC = 2 was used. Pressure was set at 25 bar with N2 to maintain
the liquid-phase. When the mixture reached the working temperature, 2 g of dried catalyst was
injected into the reactor from an external cylinder by shifting with N2. Catalyst injection was
taken as zero time. Temperature was set at 100ºC for basic resins (because of their low thermal
stability), 150ºC for all the other catalysts. Resins were used with the commercial distribution of
particles sizes, and zeolite and aluminas as a powder. Working conditions were selected since,
as quoted in literature, liquid-phase reactions of dehydration of 1-pentanol and 1-hexanol to
linear ethers take place at these conditions in the same set-up free of external and internal
mass transfer influences [26], [54]. It is to be noted that molecular size of such alcohols and
ethers is similar to that of DEC and EOE, respectively.
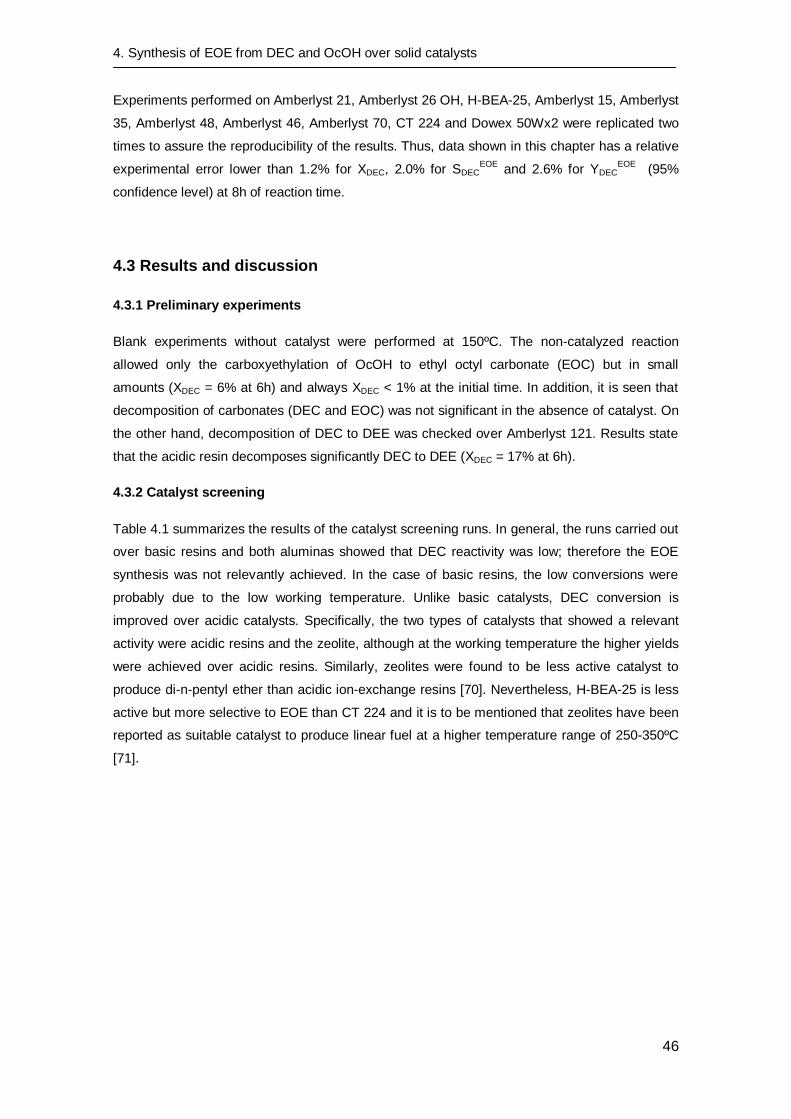
In each experiment, DEC conversion (XDEC), selectivity to EOE (SDECEOE
) and yield to EOE with
respect to DEC (YDECEOE
) were followed hourly by eqs. 4.3, 4.4 and 4.5, respectively.
DEC
moleof DECreactedX = 100 % , mol mol
moleof DECinitially eq. 4.3
EOE
DEC
moleof DECreacted to EOES = 100 % , mol mol
moleof DECreacted eq. 4.4
EOE EOE
DEC DEC DEC
moleof DEC reacted to form EOEY = 100=X S % , mol mol
moleof DECreacted initially eq. 4.5
4. Synthesis of EOE from DEC and OcOH over solid catalysts
46
Experiments performed on Amberlyst 21, Amberlyst 26 OH, H-BEA-25, Amberlyst 15, Amberlyst
35, Amberlyst 48, Amberlyst 46, Amberlyst 70, CT 224 and Dowex 50Wx2 were replicated two
times to assure the reproducibility of the results. Thus, data shown in this chapter has a relative
experimental error lower than 1.2% for XDEC, 2.0% for SDECEOE
and 2.6% for YDECEOE
(95%
confidence level) at 8h of reaction time.
4.3 Results and discussion
4.3.1 Preliminary experiments
Blank experiments without catalyst were performed at 150ºC. The non-catalyzed reaction
allowed only the carboxyethylation of OcOH to ethyl octyl carbonate (EOC) but in small
amounts (XDEC = 6% at 6h) and always XDEC < 1% at the initial time. In addition, it is seen that
decomposition of carbonates (DEC and EOC) was not significant in the absence of catalyst. On
the other hand, decomposition of DEC to DEE was checked over Amberlyst 121. Results state
that the acidic resin decomposes significantly DEC to DEE (XDEC = 17% at 6h).
4.3.2 Catalyst screening
Table 4.1 summarizes the results of the catalyst screening runs. In general, the runs carried out
over basic resins and both aluminas showed that DEC reactivity was low; therefore the EOE
synthesis was not relevantly achieved. In the case of basic resins, the low conversions were
probably due to the low working temperature. Unlike basic catalysts, DEC conversion is
improved over acidic catalysts. Specifically, the two types of catalysts that showed a relevant
activity were acidic resins and the zeolite, although at the working temperature the higher yields
were achieved over acidic resins. Similarly, zeolites were found to be less active catalyst to
produce di-n-pentyl ether than acidic ion-exchange resins [70]. Nevertheless, H-BEA-25 is less
active but more selective to EOE than CT 224 and it is to be mentioned that zeolites have been
reported as suitable catalyst to produce linear fuel at a higher temperature range of 250-350ºC
[71].
4. Synthesis of EOE from DEC and OcOH over solid catalysts
47
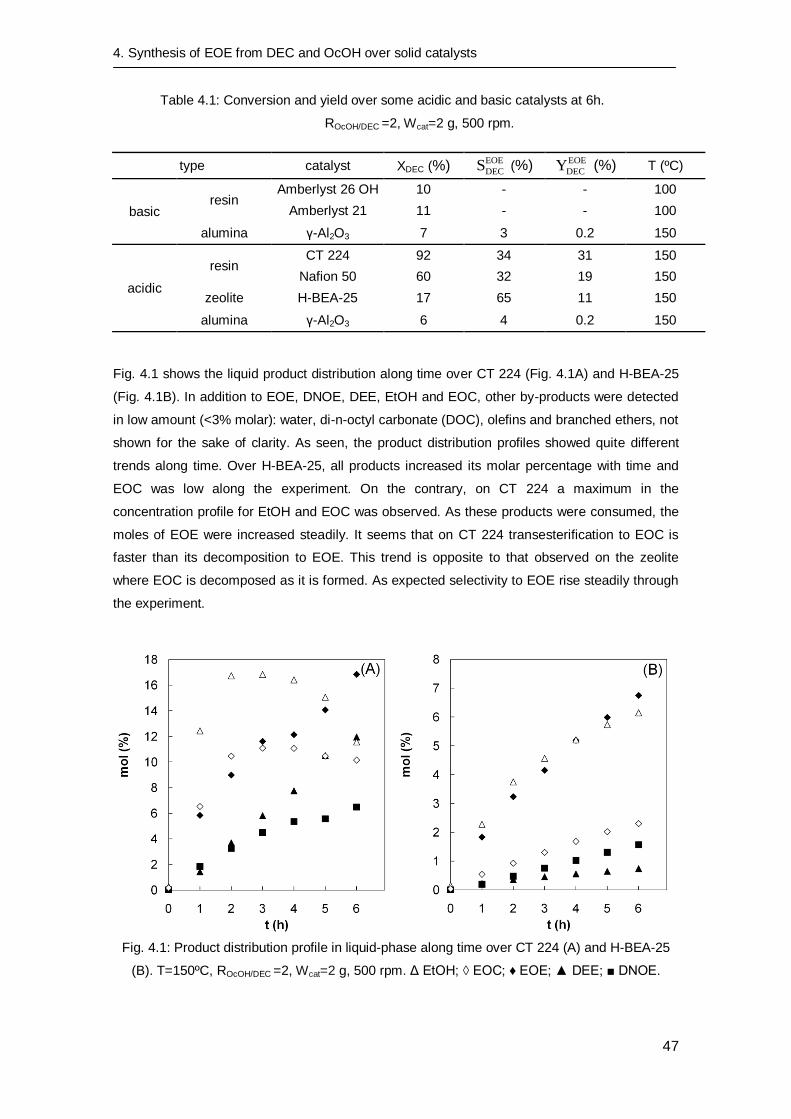
Table 4.1: Conversion and yield over some acidic and basic catalysts at 6h.
ROcOH/DEC =2, Wcat=2 g, 500 rpm.
type catalyst XDEC (%) EOE
DECS (%) EOE
DECY (%) T (ºC)
basic resin
Amberlyst 26 OH 10 - - 100
Amberlyst 21 11 - - 100
alumina γ-Al2O3 7 3 0.2 150
acidic
resin CT 224 92 34 31 150
Nafion 50 60 32 19 150
zeolite H-BEA-25 17 65 11 150
alumina γ-Al2O3 6 4 0.2 150
Fig. 4.1 shows the liquid product distribution along time over CT 224 (Fig. 4.1A) and H-BEA-25
(Fig. 4.1B). In addition to EOE, DNOE, DEE, EtOH and EOC, other by-products were detected
in low amount (<3% molar): water, di-n-octyl carbonate (DOC), olefins and branched ethers, not
shown for the sake of clarity. As seen, the product distribution profiles showed quite different
trends along time. Over H-BEA-25, all products increased its molar percentage with time and
EOC was low along the experiment. On the contrary, on CT 224 a maximum in the
concentration profile for EtOH and EOC was observed. As these products were consumed, the
moles of EOE were increased steadily. It seems that on CT 224 transesterification to EOC is
faster than its decomposition to EOE. This trend is opposite to that observed on the zeolite
where EOC is decomposed as it is formed. As expected selectivity to EOE rise steadily through
the experiment.
Fig. 4.1: Product distribution profile in liquid-phase along time over CT 224 (A) and H-BEA-25
(B). T=150ºC, ROcOH/DEC =2, Wcat=2 g, 500 rpm. Δ EtOH; ◊ EOC; ♦ EOE; ▲ DEE; ■ DNOE.
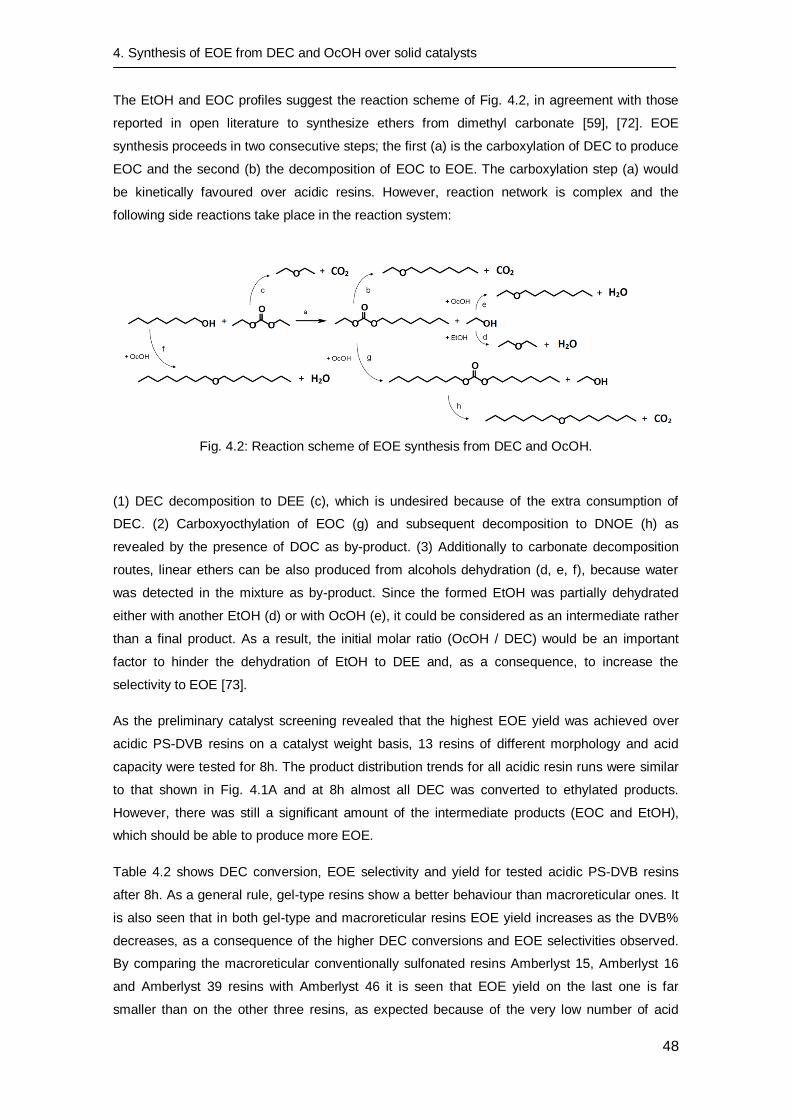
4. Synthesis of EOE from DEC and OcOH over solid catalysts
48
The EtOH and EOC profiles suggest the reaction scheme of Fig. 4.2, in agreement with those
reported in open literature to synthesize ethers from dimethyl carbonate [59], [72]. EOE
synthesis proceeds in two consecutive steps; the first (a) is the carboxylation of DEC to produce
EOC and the second (b) the decomposition of EOC to EOE. The carboxylation step (a) would
be kinetically favoured over acidic resins. However, reaction network is complex and the
following side reactions take place in the reaction system:
Fig. 4.2: Reaction scheme of EOE synthesis from DEC and OcOH.
(1) DEC decomposition to DEE (c), which is undesired because of the extra consumption of
DEC. (2) Carboxyocthylation of EOC (g) and subsequent decomposition to DNOE (h) as
revealed by the presence of DOC as by-product. (3) Additionally to carbonate decomposition
routes, linear ethers can be also produced from alcohols dehydration (d, e, f), because water
was detected in the mixture as by-product. Since the formed EtOH was partially dehydrated
either with another EtOH (d) or with OcOH (e), it could be considered as an intermediate rather
than a final product. As a result, the initial molar ratio (OcOH / DEC) would be an important
factor to hinder the dehydration of EtOH to DEE and, as a consequence, to increase the
selectivity to EOE [73].
As the preliminary catalyst screening revealed that the highest EOE yield was achieved over
acidic PS-DVB resins on a catalyst weight basis, 13 resins of different morphology and acid
capacity were tested for 8h. The product distribution trends for all acidic resin runs were similar
to that shown in Fig. 4.1A and at 8h almost all DEC was converted to ethylated products.
However, there was still a significant amount of the intermediate products (EOC and EtOH),
which should be able to produce more EOE.
Table 4.2 shows DEC conversion, EOE selectivity and yield for tested acidic PS-DVB resins
after 8h. As a general rule, gel-type resins show a better behaviour than macroreticular ones. It
is also seen that in both gel-type and macroreticular resins EOE yield increases as the DVB%
decreases, as a consequence of the higher DEC conversions and EOE selectivities observed.
By comparing the macroreticular conventionally sulfonated resins Amberlyst 15, Amberlyst 16
and Amberlyst 39 resins with Amberlyst 46 it is seen that EOE yield on the last one is far
smaller than on the other three resins, as expected because of the very low number of acid
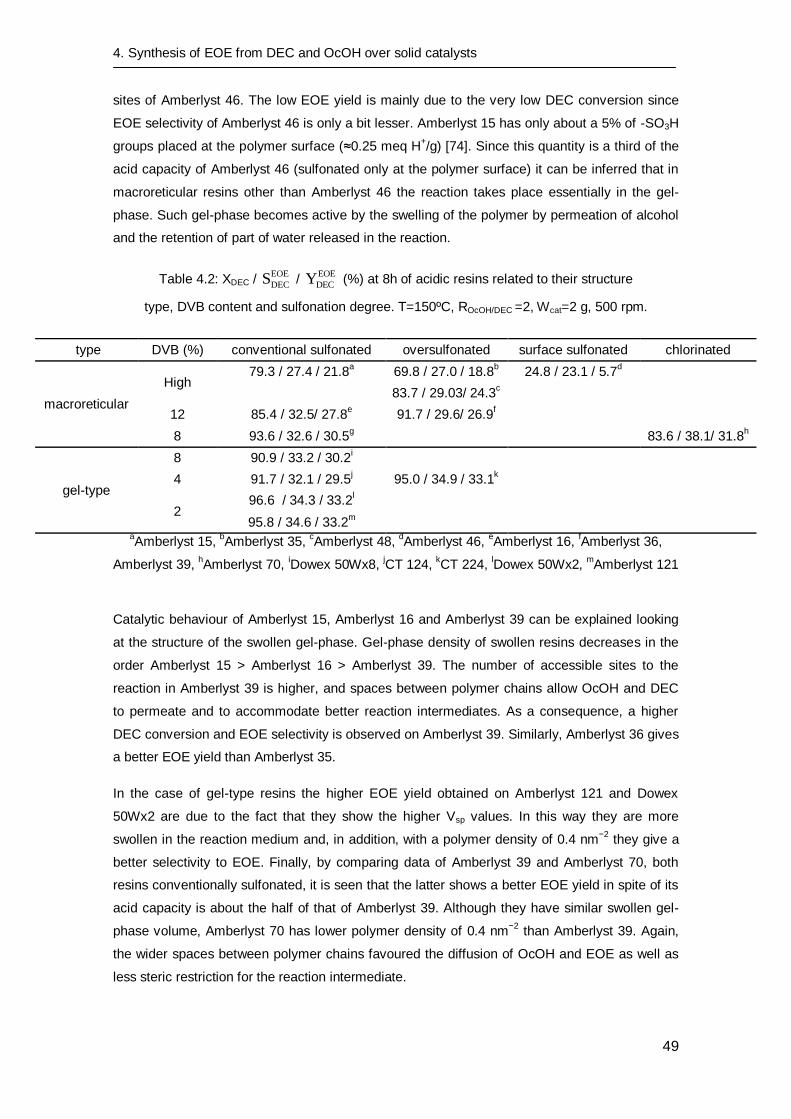
4. Synthesis of EOE from DEC and OcOH over solid catalysts
49
sites of Amberlyst 46. The low EOE yield is mainly due to the very low DEC conversion since
EOE selectivity of Amberlyst 46 is only a bit lesser. Amberlyst 15 has only about a 5% of -SO3H
groups placed at the polymer surface (≈0.25 meq H+/g) [74]. Since this quantity is a third of the
acid capacity of Amberlyst 46 (sulfonated only at the polymer surface) it can be inferred that in
macroreticular resins other than Amberlyst 46 the reaction takes place essentially in the gel-
phase. Such gel-phase becomes active by the swelling of the polymer by permeation of alcohol
and the retention of part of water released in the reaction.
Table 4.2: XDEC / EOE
DECS / EOE
DECY (%) at 8h of acidic resins related to their structure
type, DVB content and sulfonation degree. T=150ºC, ROcOH/DEC =2, Wcat=2 g, 500 rpm.
type DVB (%) conventional sulfonated oversulfonated surface sulfonated chlorinated
macroreticular
High 79.3 / 27.4 / 21.8
a 69.8 / 27.0 / 18.8
b 24.8 / 23.1 / 5.7
d
83.7 / 29.03/ 24.3
c
12 85.4 / 32.5/ 27.8
e 91.7 / 29.6/ 26.9
f
8 93.6 / 32.6 / 30.5
g 83.6 / 38.1/ 31.8
h
gel-type
8 90.9 / 33.2 / 30.2i
4 91.7 / 32.1 / 29.5
j 95.0 / 34.9 / 33.1
k
2 96.6 / 34.3 / 33.2
l
95.8 / 34.6 / 33.2
m
aAmberlyst 15,
bAmberlyst 35,
cAmberlyst 48,
dAmberlyst 46,
eAmberlyst 16,
fAmberlyst 36,
Amberlyst 39, hAmberlyst 70,
iDowex 50Wx8,
jCT 124,
kCT 224,
lDowex 50Wx2,
mAmberlyst 121
Catalytic behaviour of Amberlyst 15, Amberlyst 16 and Amberlyst 39 can be explained looking
at the structure of the swollen gel-phase. Gel-phase density of swollen resins decreases in the
order Amberlyst 15 > Amberlyst 16 > Amberlyst 39. The number of accessible sites to the
reaction in Amberlyst 39 is higher, and spaces between polymer chains allow OcOH and DEC
to permeate and to accommodate better reaction intermediates. As a consequence, a higher
DEC conversion and EOE selectivity is observed on Amberlyst 39. Similarly, Amberlyst 36 gives
a better EOE yield than Amberlyst 35.
In the case of gel-type resins the higher EOE yield obtained on Amberlyst 121 and Dowex
50Wx2 are due to the fact that they show the higher Vsp values. In this way they are more
swollen in the reaction medium and, in addition, with a polymer density of 0.4 nm−2
they give a
better selectivity to EOE. Finally, by comparing data of Amberlyst 39 and Amberlyst 70, both
resins conventionally sulfonated, it is seen that the latter shows a better EOE yield in spite of its
acid capacity is about the half of that of Amberlyst 39. Although they have similar swollen gel-
phase volume, Amberlyst 70 has lower polymer density of 0.4 nm−2
than Amberlyst 39. Again,
the wider spaces between polymer chains favoured the diffusion of OcOH and EOE as well as
less steric restriction for the reaction intermediate.
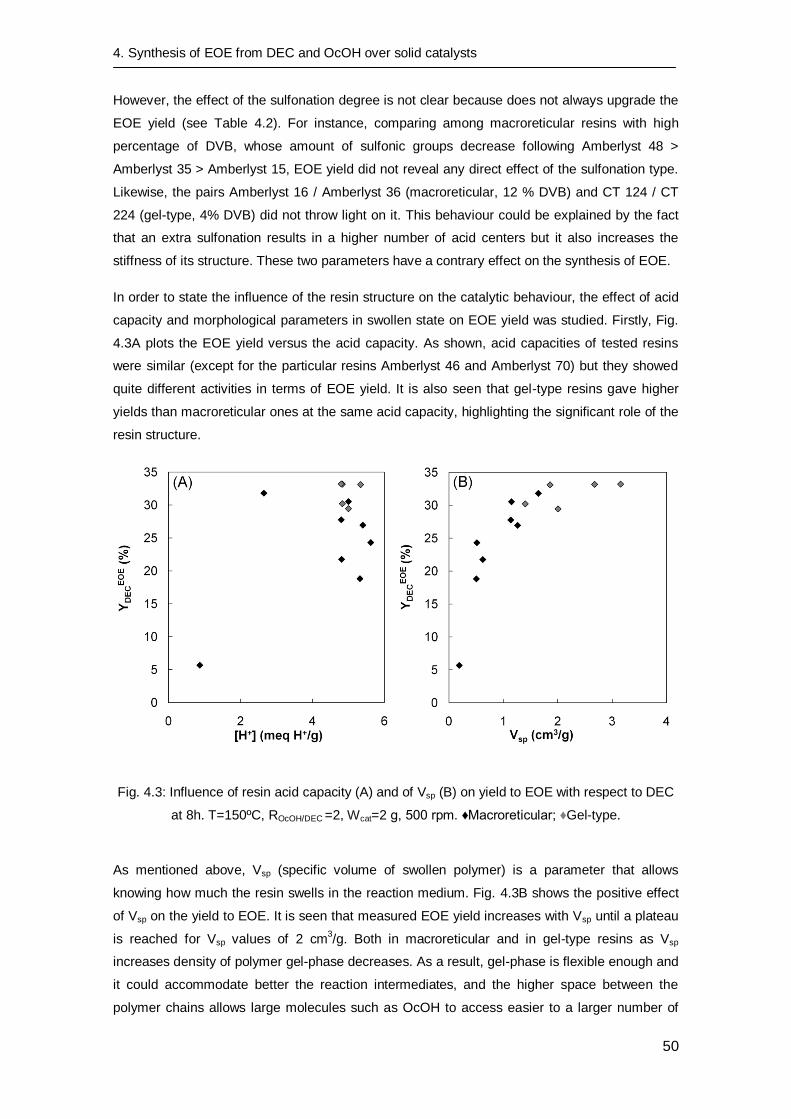
4. Synthesis of EOE from DEC and OcOH over solid catalysts
50
However, the effect of the sulfonation degree is not clear because does not always upgrade the
EOE yield (see Table 4.2). For instance, comparing among macroreticular resins with high
percentage of DVB, whose amount of sulfonic groups decrease following Amberlyst 48 >
Amberlyst 35 > Amberlyst 15, EOE yield did not reveal any direct effect of the sulfonation type.
Likewise, the pairs Amberlyst 16 / Amberlyst 36 (macroreticular, 12 % DVB) and CT 124 / CT
224 (gel-type, 4% DVB) did not throw light on it. This behaviour could be explained by the fact
that an extra sulfonation results in a higher number of acid centers but it also increases the
stiffness of its structure. These two parameters have a contrary effect on the synthesis of EOE.
In order to state the influence of the resin structure on the catalytic behaviour, the effect of acid
capacity and morphological parameters in swollen state on EOE yield was studied. Firstly, Fig.
4.3A plots the EOE yield versus the acid capacity. As shown, acid capacities of tested resins
were similar (except for the particular resins Amberlyst 46 and Amberlyst 70) but they showed
quite different activities in terms of EOE yield. It is also seen that gel-type resins gave higher
yields than macroreticular ones at the same acid capacity, highlighting the significant role of the
resin structure.
Fig. 4.3: Influence of resin acid capacity (A) and of Vsp (B) on yield to EOE with respect to DEC
at 8h. T=150ºC, ROcOH/DEC =2, Wcat=2 g, 500 rpm. ♦Macroreticular; ♦Gel-type.
As mentioned above, Vsp (specific volume of swollen polymer) is a parameter that allows
knowing how much the resin swells in the reaction medium. Fig. 4.3B shows the positive effect
of Vsp on the yield to EOE. It is seen that measured EOE yield increases with Vsp until a plateau
is reached for Vsp values of 2 cm3/g. Both in macroreticular and in gel-type resins as Vsp
increases density of polymer gel-phase decreases. As a result, gel-phase is flexible enough and
it could accommodate better the reaction intermediates, and the higher space between the
polymer chains allows large molecules such as OcOH to access easier to a larger number of
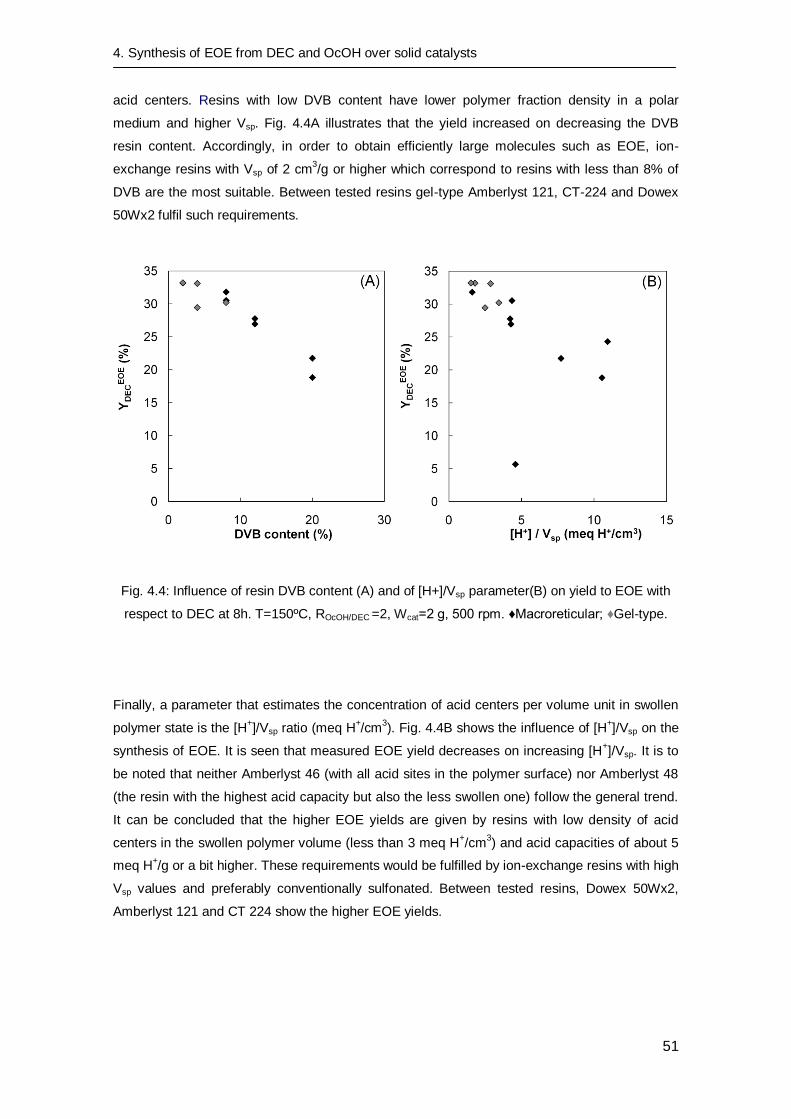
4. Synthesis of EOE from DEC and OcOH over solid catalysts
51
acid centers. Resins with low DVB content have lower polymer fraction density in a polar
medium and higher Vsp. Fig. 4.4A illustrates that the yield increased on decreasing the DVB
resin content. Accordingly, in order to obtain efficiently large molecules such as EOE, ion-
exchange resins with Vsp of 2 cm3/g or higher which correspond to resins with less than 8% of
DVB are the most suitable. Between tested resins gel-type Amberlyst 121, CT-224 and Dowex
50Wx2 fulfil such requirements.
Fig. 4.4: Influence of resin DVB content (A) and of [H+]/Vsp parameter(B) on yield to EOE with
respect to DEC at 8h. T=150ºC, ROcOH/DEC =2, Wcat=2 g, 500 rpm. ♦Macroreticular; ♦Gel-type.
Finally, a parameter that estimates the concentration of acid centers per volume unit in swollen
polymer state is the [H+]/Vsp ratio (meq H
+/cm
3). Fig. 4.4B shows the influence of [H
+]/Vsp on the
synthesis of EOE. It is seen that measured EOE yield decreases on increasing [H+]/Vsp. It is to
be noted that neither Amberlyst 46 (with all acid sites in the polymer surface) nor Amberlyst 48
(the resin with the highest acid capacity but also the less swollen one) follow the general trend.
It can be concluded that the higher EOE yields are given by resins with low density of acid
centers in the swollen polymer volume (less than 3 meq H+/cm
3) and acid capacities of about 5
meq H+/g or a bit higher. These requirements would be fulfilled by ion-exchange resins with high
Vsp values and preferably conventionally sulfonated. Between tested resins, Dowex 50Wx2,
Amberlyst 121 and CT 224 show the higher EOE yields.
4. Synthesis of EOE from DEC and OcOH over solid catalysts
52
4.4. Conclusions
The catalyst screening revealed that EOE can be successfully produced in liquid-phase from
DEC and OcOH over acidic catalysts at 150ºC. High DEC conversion and high EOE yield were
achieved over acidic resins. A two-step pathway for EOE synthesis is proposed. Firstly, the
transesterification of DEC to EOC takes place. Subsequently, EOC decomposes to EOE.
Unfortunately, direct decomposition of DEC to DEE also occurs. Besides carbonate
decomposition route, linear ethers are also produced from alcohols dehydration reactions.
The synthesis of EOE is highly related to morphological resins properties. The accessibility of
large molecules to acid centers is favoured over resins with large space between polymer
chains. Consequently, in order to synthesize large ethers such as EOE, a greatly expanded
polymer network in swollen state is the most suitable resin property. It is also desirable that
density of acid centers in the swollen resin would be low. These requirements can be found in
low DVB content resins (e.g., gel-type resins as Dowex 50Wx2, Amberlyst 121 or CT 224).
Chapter 5
Comparison between ethanol
and diethyl carbonate as
ethylating agents for ethyl octyl
ether synthesis over acidic ion-
exchange resins
A REVISED VERSION OF THIS CHAPTER HAS BEEN PUBLISHED IN:
J. Guilera, R. Bringué, E. Ramírez, M. Iborra and J. Tejero. Comparison between ethanol and diethyl carbonate as ethylating agents for ethyl octyl ether synthesis over acidic ion-exchange resins. 2012. Industrial & Engineering Chemistry Research. 51 (50) 16525-16530.
5. Comparison between EtOH and DEC as EA for EOE synthesis over acidic ion-exchange resins
54
5.1 Introduction
EOE can be synthesized successfully either by the dehydration reaction of OcOH and EtOH
(Chapter 3) or by the transesterification reaction between OcOH and DEC to EOC and its
subsequent decomposition to EOE (Chapter 4). However, to the best of our knowledge,
comparison between EtOH and DEC as ethylating agents (EA) to give linear asymmetrical
ethers is not found in the open literature.
EtOH and DEC are considered as environmentally friendly reactants. Still, since DEC is
produced from EtOH [61], [62], [75], DEC use as ethylating agent would be justified only if
higher selectivity and yield were obtained with respect to its counterpart, EtOH. Thus, the aim of
this chapter is to compare the efficiency of EtOH and DEC as ethylating agents (EA) to produce
EOE by the reaction with OcOH.
In former chapters it was revealed that highly swollen acidic resins are preferred on both
reactions to catalyze efficiently EOE synthesis. Thus, the comparison between both EA was
carried out over the low-crosslinked acidic PS-DVB resins Amberlyst 39 (macroreticular, with
8% crosslinking degree) and Amberlyst 121, Dowex50Wx2, CT 124, CT 224 and Dowex50Wx8
(gel-type with DVB% ranging from 2 to 8%). The two reaction pathways are compared and the
influence of the initial reactants ratio and temperature are evaluated. By using low-crosslinked
resins, the polymer expansion with a good liquid swelling is required to make acid sites
accessible. Thus, the expansion of the polymer immersed in the reactants is checked.
5.2 Experimental procedure
The particle size of acidic ion-exchange resins were measured in several media. Dried samples
were placed 2 days in different solvents to assure that the solvent was completely sorbed in the
resin. Then, resins mean diameter was measured by means of a LS 13320 Laser Diffraction
Particle Size Analyzer. Five solvents (DEC, EtOH, 1-pentanol, OcOH and water) and two
mixtures (ROcOH/DEC=2 and ROcOH/EtOH=2) were used. Resin swelling which is the relative volume
increase in the liquid media was calculated by eq. 5.1. V is the mean particle volume in the
solvent or mixture, whereas the mean volume of reference, V0, was obtained from
measurements of dried resins in air. Volumes were calculated under the assumption that
particles are spherical.
0
0
V-VSwelling = 100 %
V eq. 5.1
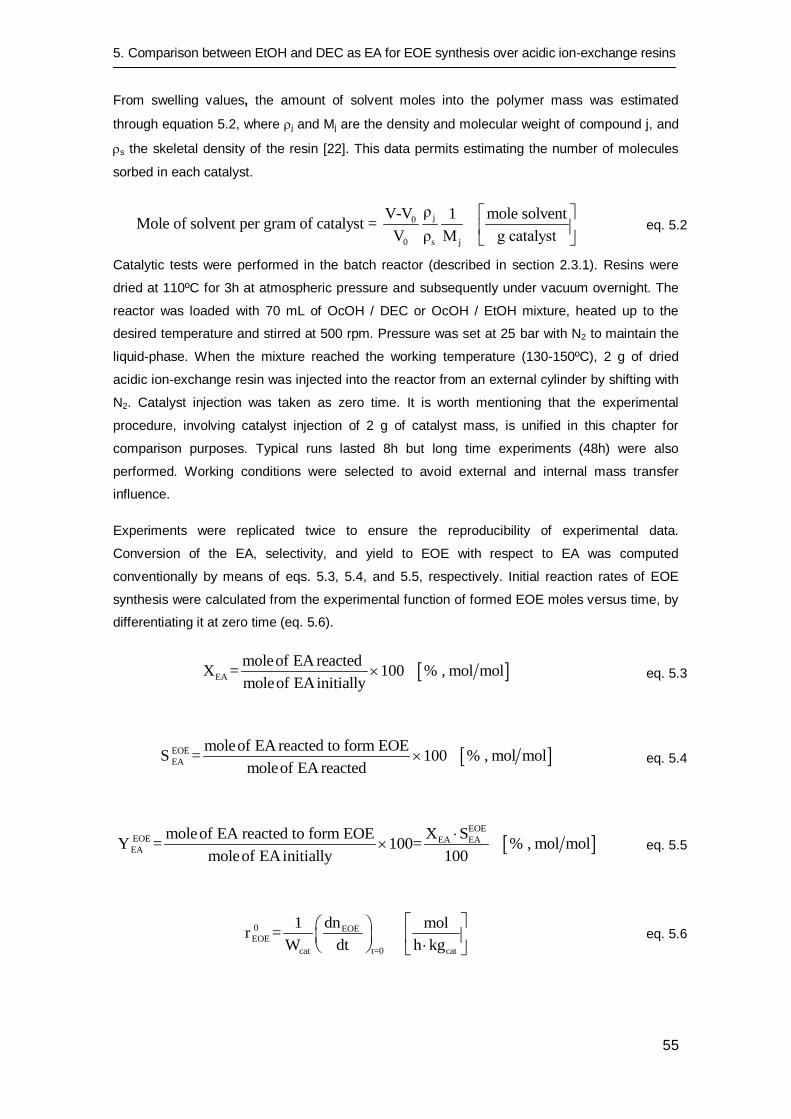
5. Comparison between EtOH and DEC as EA for EOE synthesis over acidic ion-exchange resins
55
From swelling values, the amount of solvent moles into the polymer mass was estimated
through equation 5.2, where j and Mj are the density and molecular weight of compound j, and
s the skeletal density of the resin [22]. This data permits estimating the number of molecules
sorbed in each catalyst.
j0
0 s j
ρV-V 1 mole solventMole of solvent per gram of catalyst =
V ρ Μ g catalyst
eq. 5.2
Catalytic tests were performed in the batch reactor (described in section 2.3.1). Resins were
dried at 110ºC for 3h at atmospheric pressure and subsequently under vacuum overnight. The
reactor was loaded with 70 mL of OcOH / DEC or OcOH / EtOH mixture, heated up to the
desired temperature and stirred at 500 rpm. Pressure was set at 25 bar with N2 to maintain the
liquid-phase. When the mixture reached the working temperature (130-150ºC), 2 g of dried
acidic ion-exchange resin was injected into the reactor from an external cylinder by shifting with
N2. Catalyst injection was taken as zero time. It is worth mentioning that the experimental
procedure, involving catalyst injection of 2 g of catalyst mass, is unified in this chapter for
comparison purposes. Typical runs lasted 8h but long time experiments (48h) were also
performed. Working conditions were selected to avoid external and internal mass transfer
influence.
Experiments were replicated twice to ensure the reproducibility of experimental data.
Conversion of the EA, selectivity, and yield to EOE with respect to EA was computed
conventionally by means of eqs. 5.3, 5.4, and 5.5, respectively. Initial reaction rates of EOE
synthesis were calculated from the experimental function of formed EOE moles versus time, by
differentiating it at zero time (eq. 5.6).
EA
moleof EA reacted X = 100 % , mol mol
moleof EAinitially eq. 5.3
EOE
EA
moleof EA reacted to form EOES = 100 % , mol mol
moleof EA reacted eq. 5.4
EOE
EOE EA EA EA
X Smoleof EA reacted to form EOEY = 100= % , mol mol
moleof EAinitially 100
eq. 5.5
0 EOE EOE
t=0cat cat
dn1 molr =
W dt h kg
eq. 5.6
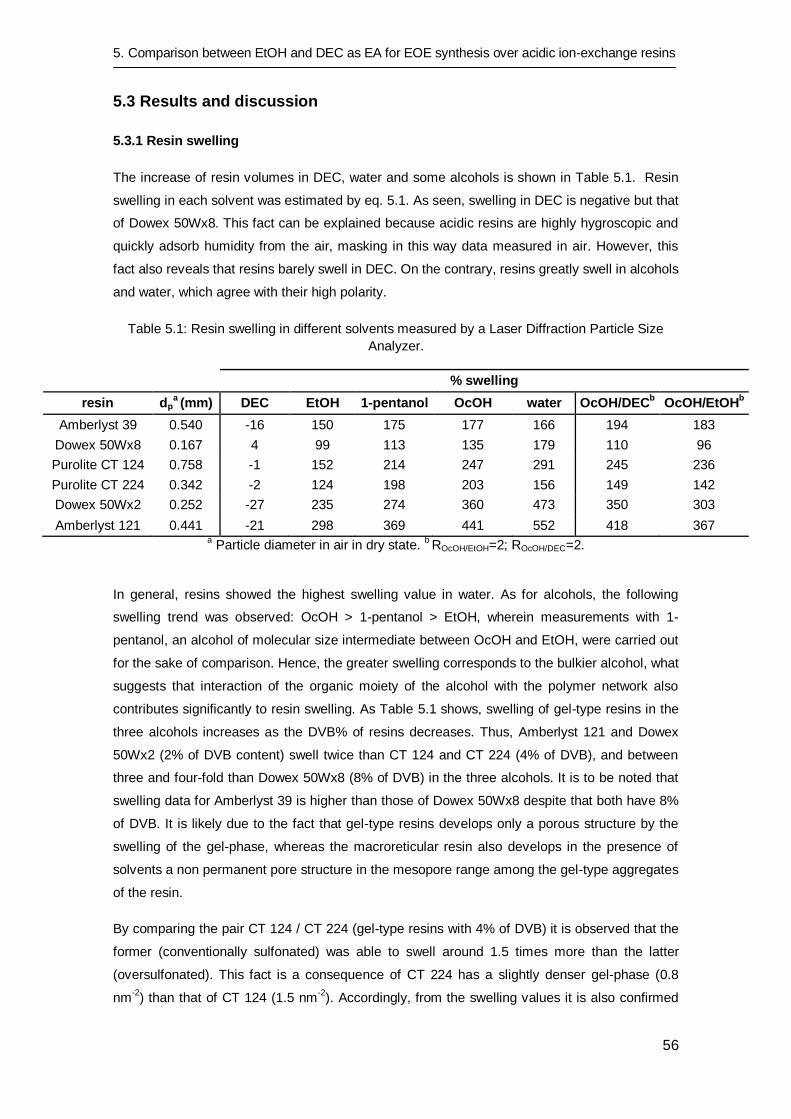
5. Comparison between EtOH and DEC as EA for EOE synthesis over acidic ion-exchange resins
56
5.3 Results and discussion
5.3.1 Resin swelling
The increase of resin volumes in DEC, water and some alcohols is shown in Table 5.1. Resin
swelling in each solvent was estimated by eq. 5.1. As seen, swelling in DEC is negative but that
of Dowex 50Wx8. This fact can be explained because acidic resins are highly hygroscopic and
quickly adsorb humidity from the air, masking in this way data measured in air. However, this
fact also reveals that resins barely swell in DEC. On the contrary, resins greatly swell in alcohols
and water, which agree with their high polarity.
Table 5.1: Resin swelling in different solvents measured by a Laser Diffraction Particle Size
Analyzer.
% swelling
resin dpa (mm) DEC EtOH 1-pentanol OcOH water OcOH/DEC
b OcOH/EtOH
b
Amberlyst 39 0.540 -16 150 175 177 166 194 183
Dowex 50Wx8 0.167 4 99 113 135 179 110 96
Purolite CT 124 0.758 -1 152 214 247 291 245 236
Purolite CT 224 0.342 -2 124 198 203 156 149 142
Dowex 50Wx2 0.252 -27 235 274 360 473 350 303
Amberlyst 121 0.441 -21 298 369 441 552 418 367 a Particle diameter in air in dry state.
b ROcOH/EtOH=2; ROcOH/DEC=2.
In general, resins showed the highest swelling value in water. As for alcohols, the following
swelling trend was observed: OcOH > 1-pentanol > EtOH, wherein measurements with 1-
pentanol, an alcohol of molecular size intermediate between OcOH and EtOH, were carried out
for the sake of comparison. Hence, the greater swelling corresponds to the bulkier alcohol, what
suggests that interaction of the organic moiety of the alcohol with the polymer network also
contributes significantly to resin swelling. As Table 5.1 shows, swelling of gel-type resins in the
three alcohols increases as the DVB% of resins decreases. Thus, Amberlyst 121 and Dowex
50Wx2 (2% of DVB content) swell twice than CT 124 and CT 224 (4% of DVB), and between
three and four-fold than Dowex 50Wx8 (8% of DVB) in the three alcohols. It is to be noted that
swelling data for Amberlyst 39 is higher than those of Dowex 50Wx8 despite that both have 8%
of DVB. It is likely due to the fact that gel-type resins develops only a porous structure by the
swelling of the gel-phase, whereas the macroreticular resin also develops in the presence of
solvents a non permanent pore structure in the mesopore range among the gel-type aggregates
of the resin.
By comparing the pair CT 124 / CT 224 (gel-type resins with 4% of DVB) it is observed that the
former (conventionally sulfonated) was able to swell around 1.5 times more than the latter
(oversulfonated). This fact is a consequence of CT 224 has a slightly denser gel-phase (0.8
nm-2
) than that of CT 124 (1.5 nm-2
). Accordingly, from the swelling values it is also confirmed
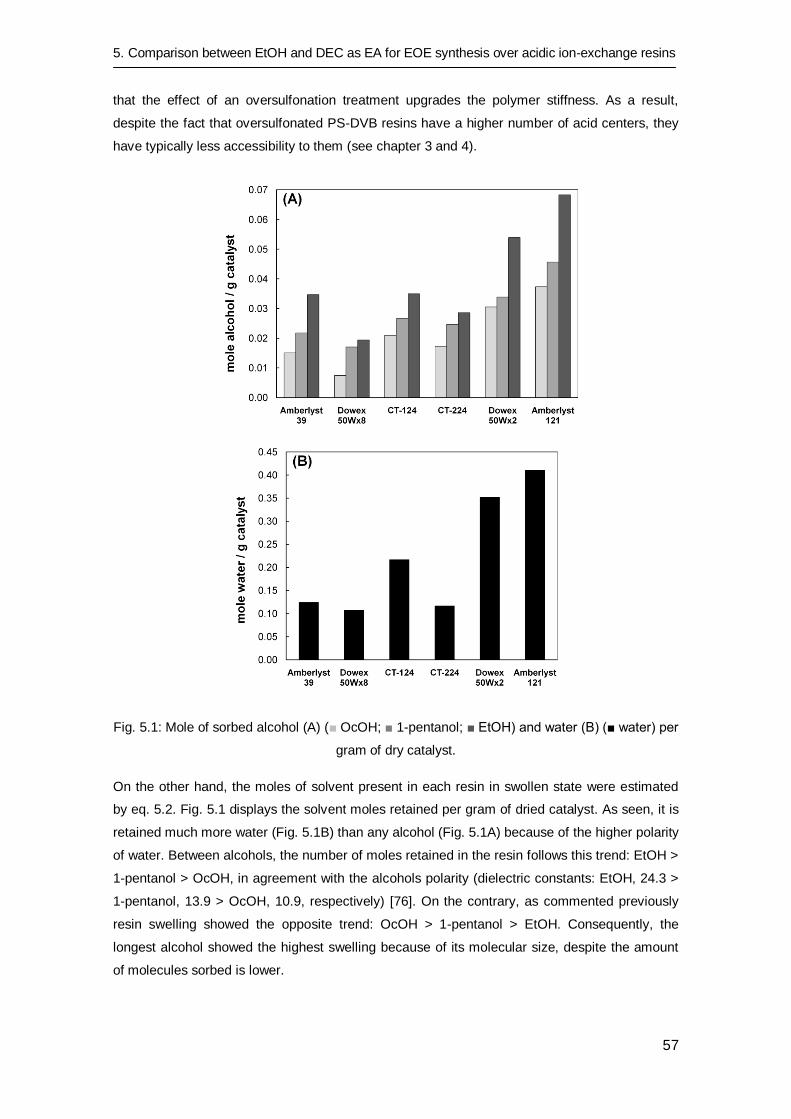
5. Comparison between EtOH and DEC as EA for EOE synthesis over acidic ion-exchange resins
57
that the effect of an oversulfonation treatment upgrades the polymer stiffness. As a result,
despite the fact that oversulfonated PS-DVB resins have a higher number of acid centers, they
have typically less accessibility to them (see chapter 3 and 4).
Fig. 5.1: Mole of sorbed alcohol (A) (■ OcOH; ■ 1-pentanol; ■ EtOH) and water (B) (■ water) per
gram of dry catalyst.
On the other hand, the moles of solvent present in each resin in swollen state were estimated
by eq. 5.2. Fig. 5.1 displays the solvent moles retained per gram of dried catalyst. As seen, it is
retained much more water (Fig. 5.1B) than any alcohol (Fig. 5.1A) because of the higher polarity
of water. Between alcohols, the number of moles retained in the resin follows this trend: EtOH >
1-pentanol > OcOH, in agreement with the alcohols polarity (dielectric constants: EtOH, 24.3 >
1-pentanol, 13.9 > OcOH, 10.9, respectively) [76]. On the contrary, as commented previously
resin swelling showed the opposite trend: OcOH > 1-pentanol > EtOH. Consequently, the
longest alcohol showed the highest swelling because of its molecular size, despite the amount
of molecules sorbed is lower.
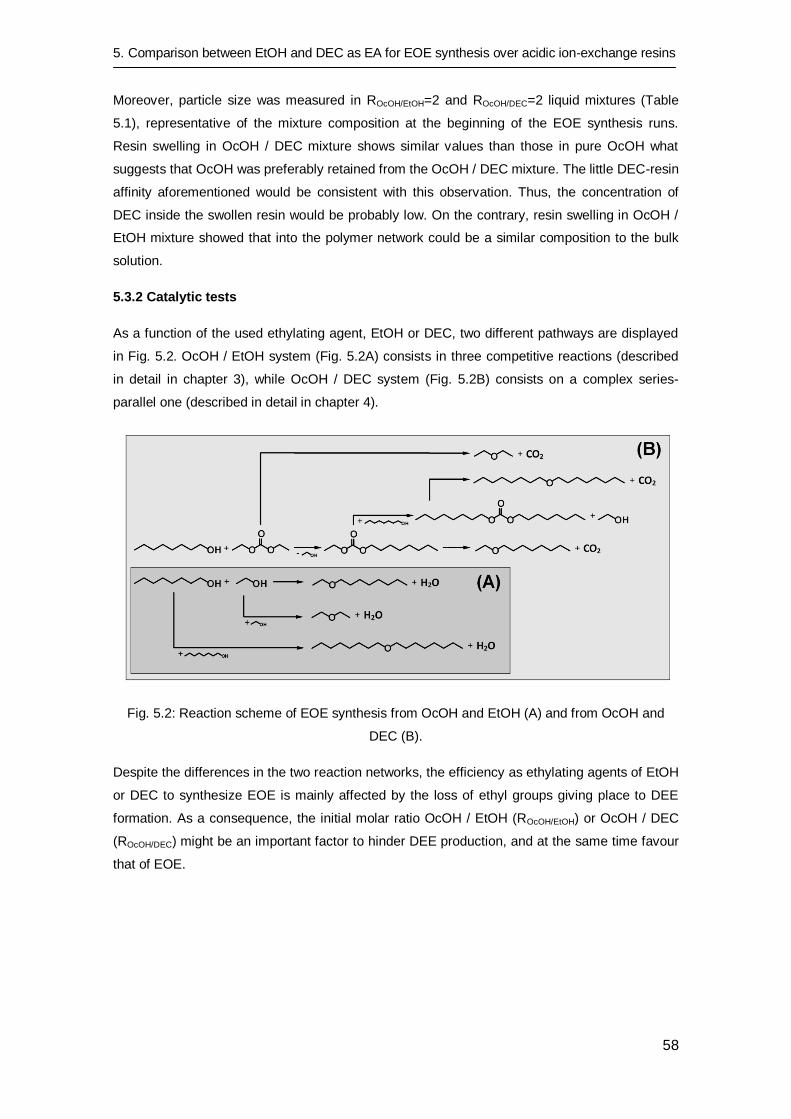
5. Comparison between EtOH and DEC as EA for EOE synthesis over acidic ion-exchange resins
58
Moreover, particle size was measured in ROcOH/EtOH=2 and ROcOH/DEC=2 liquid mixtures (Table
5.1), representative of the mixture composition at the beginning of the EOE synthesis runs.
Resin swelling in OcOH / DEC mixture shows similar values than those in pure OcOH what
suggests that OcOH was preferably retained from the OcOH / DEC mixture. The little DEC-resin
affinity aforementioned would be consistent with this observation. Thus, the concentration of
DEC inside the swollen resin would be probably low. On the contrary, resin swelling in OcOH /
EtOH mixture showed that into the polymer network could be a similar composition to the bulk
solution.
5.3.2 Catalytic tests
As a function of the used ethylating agent, EtOH or DEC, two different pathways are displayed
in Fig. 5.2. OcOH / EtOH system (Fig. 5.2A) consists in three competitive reactions (described
in detail in chapter 3), while OcOH / DEC system (Fig. 5.2B) consists on a complex series-
parallel one (described in detail in chapter 4).
Fig. 5.2: Reaction scheme of EOE synthesis from OcOH and EtOH (A) and from OcOH and
DEC (B).
Despite the differences in the two reaction networks, the efficiency as ethylating agents of EtOH
or DEC to synthesize EOE is mainly affected by the loss of ethyl groups giving place to DEE
formation. As a consequence, the initial molar ratio OcOH / EtOH (ROcOH/EtOH) or OcOH / DEC
(ROcOH/DEC) might be an important factor to hinder DEE production, and at the same time favour
that of EOE.
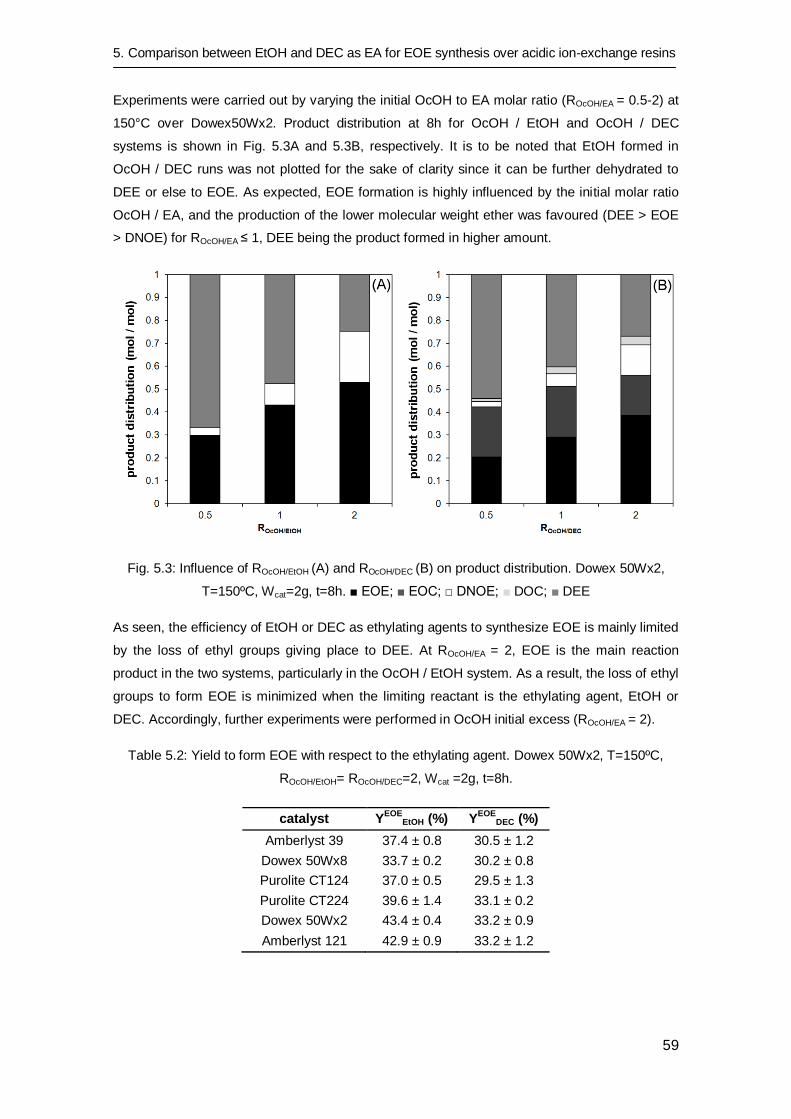
5. Comparison between EtOH and DEC as EA for EOE synthesis over acidic ion-exchange resins
59
Experiments were carried out by varying the initial OcOH to EA molar ratio (ROcOH/EA = 0.5-2) at
150°C over Dowex50Wx2. Product distribution at 8h for OcOH / EtOH and OcOH / DEC
systems is shown in Fig. 5.3A and 5.3B, respectively. It is to be noted that EtOH formed in
OcOH / DEC runs was not plotted for the sake of clarity since it can be further dehydrated to
DEE or else to EOE. As expected, EOE formation is highly influenced by the initial molar ratio
OcOH / EA, and the production of the lower molecular weight ether was favoured (DEE > EOE
> DNOE) for ROcOH/EA ≤ 1, DEE being the product formed in higher amount.
Fig. 5.3: Influence of ROcOH/EtOH (A) and ROcOH/DEC (B) on product distribution. Dowex 50Wx2,
T=150ºC, Wcat=2g, t=8h. ■ EOE; ■ EOC; □ DNOE; ■ DOC; ■ DEE
As seen, the efficiency of EtOH or DEC as ethylating agents to synthesize EOE is mainly limited
by the loss of ethyl groups giving place to DEE. At ROcOH/EA = 2, EOE is the main reaction
product in the two systems, particularly in the OcOH / EtOH system. As a result, the loss of ethyl
groups to form EOE is minimized when the limiting reactant is the ethylating agent, EtOH or
DEC. Accordingly, further experiments were performed in OcOH initial excess (ROcOH/EA = 2).
Table 5.2: Yield to form EOE with respect to the ethylating agent. Dowex 50Wx2, T=150ºC,
ROcOH/EtOH= ROcOH/DEC=2, Wcat =2g, t=8h.
catalyst YEOE
EtOH (%) YEOE
DEC (%)
Amberlyst 39 37.4 ± 0.8 30.5 ± 1.2
Dowex 50Wx8 33.7 ± 0.2 30.2 ± 0.8
Purolite CT124 37.0 ± 0.5 29.5 ± 1.3
Purolite CT224 39.6 ± 1.4 33.1 ± 0.2
Dowex 50Wx2 43.4 ± 0.4 33.2 ± 0.9
Amberlyst 121 42.9 ± 0.9 33.2 ± 1.2
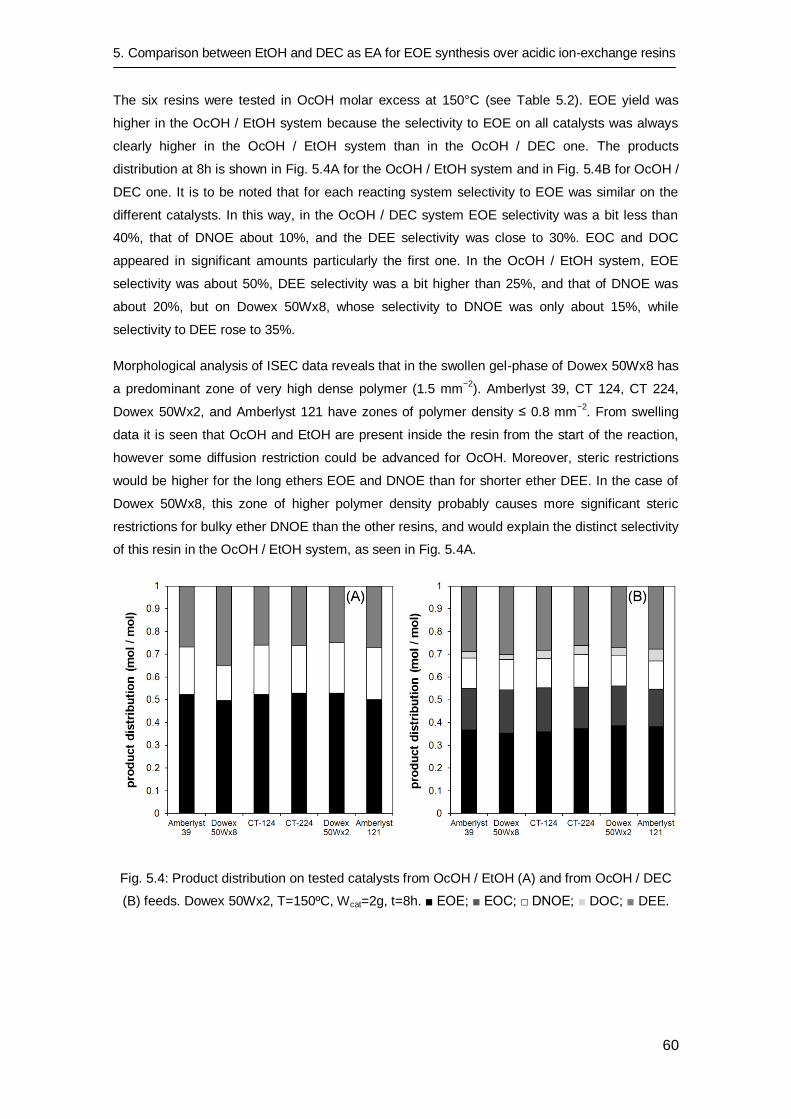
5. Comparison between EtOH and DEC as EA for EOE synthesis over acidic ion-exchange resins
60
The six resins were tested in OcOH molar excess at 150°C (see Table 5.2). EOE yield was
higher in the OcOH / EtOH system because the selectivity to EOE on all catalysts was always
clearly higher in the OcOH / EtOH system than in the OcOH / DEC one. The products
distribution at 8h is shown in Fig. 5.4A for the OcOH / EtOH system and in Fig. 5.4B for OcOH /
DEC one. It is to be noted that for each reacting system selectivity to EOE was similar on the
different catalysts. In this way, in the OcOH / DEC system EOE selectivity was a bit less than
40%, that of DNOE about 10%, and the DEE selectivity was close to 30%. EOC and DOC
appeared in significant amounts particularly the first one. In the OcOH / EtOH system, EOE
selectivity was about 50%, DEE selectivity was a bit higher than 25%, and that of DNOE was
about 20%, but on Dowex 50Wx8, whose selectivity to DNOE was only about 15%, while
selectivity to DEE rose to 35%.
Morphological analysis of ISEC data reveals that in the swollen gel-phase of Dowex 50Wx8 has
a predominant zone of very high dense polymer (1.5 mm−2
). Amberlyst 39, CT 124, CT 224,
Dowex 50Wx2, and Amberlyst 121 have zones of polymer density ≤ 0.8 mm−2
. From swelling
data it is seen that OcOH and EtOH are present inside the resin from the start of the reaction,
however some diffusion restriction could be advanced for OcOH. Moreover, steric restrictions
would be higher for the long ethers EOE and DNOE than for shorter ether DEE. In the case of
Dowex 50Wx8, this zone of higher polymer density probably causes more significant steric
restrictions for bulky ether DNOE than the other resins, and would explain the distinct selectivity
of this resin in the OcOH / EtOH system, as seen in Fig. 5.4A.
Fig. 5.4: Product distribution on tested catalysts from OcOH / EtOH (A) and from OcOH / DEC
(B) feeds. Dowex 50Wx2, T=150ºC, Wcat=2g, t=8h. ■ EOE; ■ EOC; □ DNOE; ■ DOC; ■ DEE.
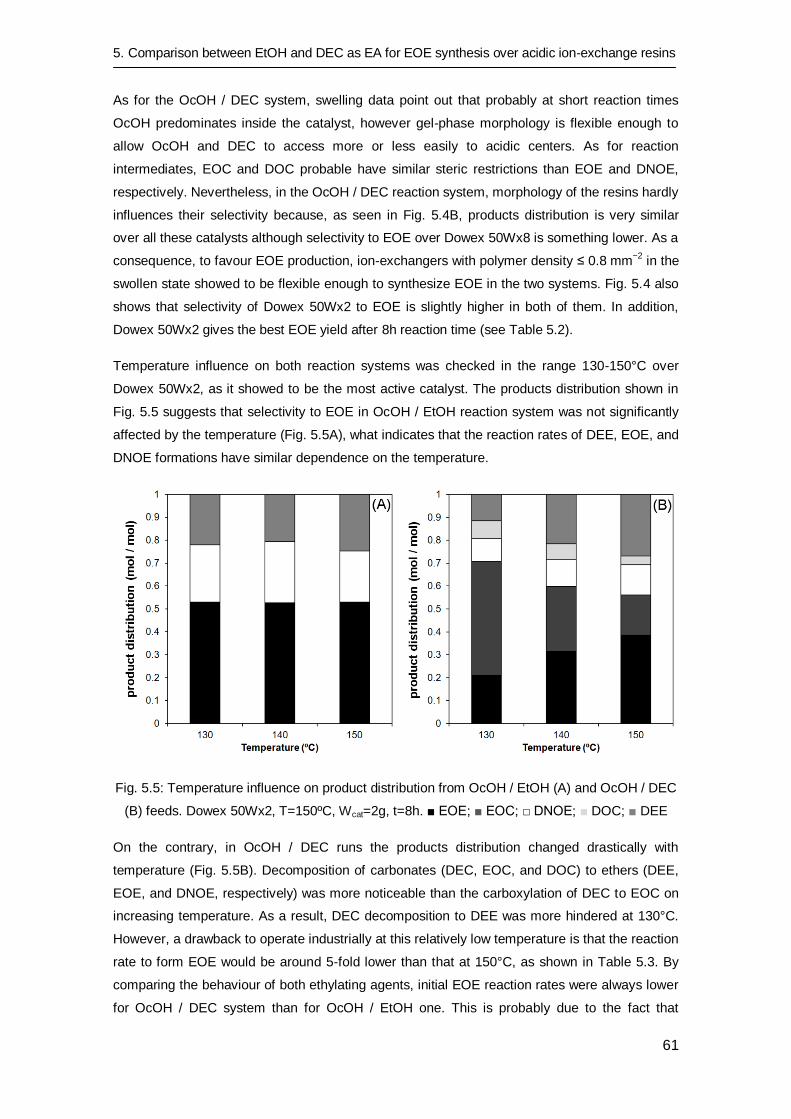
5. Comparison between EtOH and DEC as EA for EOE synthesis over acidic ion-exchange resins
61
As for the OcOH / DEC system, swelling data point out that probably at short reaction times
OcOH predominates inside the catalyst, however gel-phase morphology is flexible enough to
allow OcOH and DEC to access more or less easily to acidic centers. As for reaction
intermediates, EOC and DOC probable have similar steric restrictions than EOE and DNOE,
respectively. Nevertheless, in the OcOH / DEC reaction system, morphology of the resins hardly
influences their selectivity because, as seen in Fig. 5.4B, products distribution is very similar
over all these catalysts although selectivity to EOE over Dowex 50Wx8 is something lower. As a
consequence, to favour EOE production, ion-exchangers with polymer density ≤ 0.8 mm−2
in the
swollen state showed to be flexible enough to synthesize EOE in the two systems. Fig. 5.4 also
shows that selectivity of Dowex 50Wx2 to EOE is slightly higher in both of them. In addition,
Dowex 50Wx2 gives the best EOE yield after 8h reaction time (see Table 5.2).
Temperature influence on both reaction systems was checked in the range 130-150°C over
Dowex 50Wx2, as it showed to be the most active catalyst. The products distribution shown in
Fig. 5.5 suggests that selectivity to EOE in OcOH / EtOH reaction system was not significantly
affected by the temperature (Fig. 5.5A), what indicates that the reaction rates of DEE, EOE, and
DNOE formations have similar dependence on the temperature.
Fig. 5.5: Temperature influence on product distribution from OcOH / EtOH (A) and OcOH / DEC
(B) feeds. Dowex 50Wx2, T=150ºC, Wcat=2g, t=8h. ■ EOE; ■ EOC; □ DNOE; ■ DOC; ■ DEE
On the contrary, in OcOH / DEC runs the products distribution changed drastically with
temperature (Fig. 5.5B). Decomposition of carbonates (DEC, EOC, and DOC) to ethers (DEE,
EOE, and DNOE, respectively) was more noticeable than the carboxylation of DEC to EOC on
increasing temperature. As a result, DEC decomposition to DEE was more hindered at 130°C.
However, a drawback to operate industrially at this relatively low temperature is that the reaction
rate to form EOE would be around 5-fold lower than that at 150°C, as shown in Table 5.3. By
comparing the behaviour of both ethylating agents, initial EOE reaction rates were always lower
for OcOH / DEC system than for OcOH / EtOH one. This is probably due to the fact that
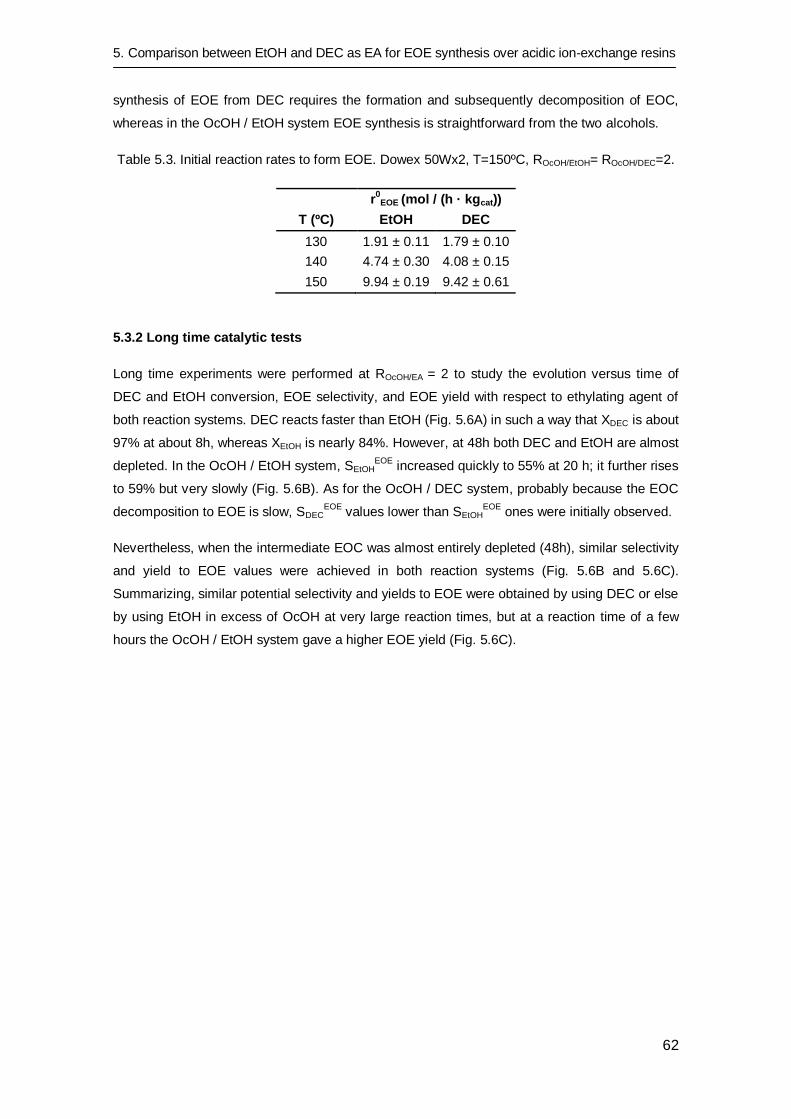
5. Comparison between EtOH and DEC as EA for EOE synthesis over acidic ion-exchange resins
62
synthesis of EOE from DEC requires the formation and subsequently decomposition of EOC,
whereas in the OcOH / EtOH system EOE synthesis is straightforward from the two alcohols.
Table 5.3. Initial reaction rates to form EOE. Dowex 50Wx2, T=150ºC, ROcOH/EtOH= ROcOH/DEC=2.
r
0EOE (mol / (h · kgcat))
T (ºC) EtOH DEC
130 1.91 ± 0.11 1.79 ± 0.10
140 4.74 ± 0.30 4.08 ± 0.15
150 9.94 ± 0.19 9.42 ± 0.61
5.3.2 Long time catalytic tests
Long time experiments were performed at ROcOH/EA = 2 to study the evolution versus time of
DEC and EtOH conversion, EOE selectivity, and EOE yield with respect to ethylating agent of
both reaction systems. DEC reacts faster than EtOH (Fig. 5.6A) in such a way that XDEC is about
97% at about 8h, whereas XEtOH is nearly 84%. However, at 48h both DEC and EtOH are almost
depleted. In the OcOH / EtOH system, SEtOHEOE
increased quickly to 55% at 20 h; it further rises
to 59% but very slowly (Fig. 5.6B). As for the OcOH / DEC system, probably because the EOC
decomposition to EOE is slow, SDECEOE
values lower than SEtOHEOE
ones were initially observed.
Nevertheless, when the intermediate EOC was almost entirely depleted (48h), similar selectivity
and yield to EOE values were achieved in both reaction systems (Fig. 5.6B and 5.6C).
Summarizing, similar potential selectivity and yields to EOE were obtained by using DEC or else
by using EtOH in excess of OcOH at very large reaction times, but at a reaction time of a few
hours the OcOH / EtOH system gave a higher EOE yield (Fig. 5.6C).
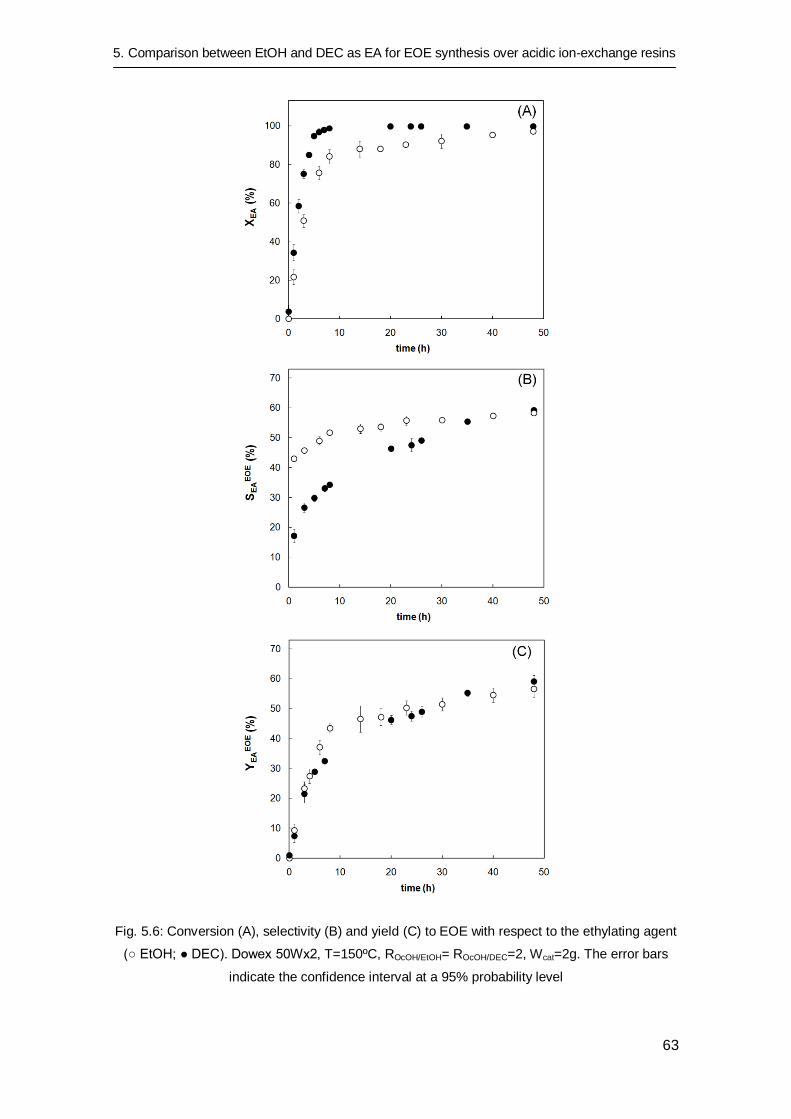
5. Comparison between EtOH and DEC as EA for EOE synthesis over acidic ion-exchange resins
63
Fig. 5.6: Conversion (A), selectivity (B) and yield (C) to EOE with respect to the ethylating agent
(○ EtOH; ● DEC). Dowex 50Wx2, T=150ºC, ROcOH/EtOH= ROcOH/DEC=2, Wcat=2g. The error bars
indicate the confidence interval at a 95% probability level
5. Comparison between EtOH and DEC as EA for EOE synthesis over acidic ion-exchange resins
64
5.4 Conclusions
EOE synthesis from OcOH / EtOH and OcOH / DEC mixtures over acidic ion-exchange resins is
compared. The main secondary reaction in the two reaction schemes (and therefore the main
drawback in industrial practice) is the loss of ethyl groups to produce DEE. As a consequence,
selectivity to EOE with respect to ethylating agent (DEC or EtOH) is relatively low (40-50% at 8
h reaction time). The loss of ethyl groups by DEE formation is a serious problem since this ether
cannot be blended straightforwardly in commercial diesel fuels.
Similar selectivities and yields to EOE were obtained at long reaction time (48h). Nevertheless,
initial reaction rates to form EOE are slightly higher in the OcOH / EtOH system than in the
OcOH / DEC one. Accordingly, EtOH was shown to be a more suitable ethylating agent to
produce synthetic ethers biofuels such as EOE over acidic resins of low cross-linking degree.
Otherwise, the EOE synthesis from OcOH and DEC is only competitive at long reaction times
or, in continuous units, if oversized reactors are used.
Furthermore, the reaction between OcOH and EtOH gives water as a by-product, a nontoxic
substance. It would be an environmentally friendly process, like the one based on the OcOH /
DEC system (there is no net CO2 production). In summary, the current availability of EtOH and
the production of water as by-product suggest EtOH to be a suitable ethylating agent to produce
long chained ethers such as EOE.
Chapter 6
Thermal stability and water
effect on ion-exchange resins in
ethyl octyl ether production at
high temperature
A REVISED VERSION OF THIS CHAPTER HAS BEEN REVISED AND RESUBMITTED IN:
J. Guilera, E. Ramírez, C. Fité, M. Iborra, J. Tejero. Thermal stability and water effect on ion-exchange resins in ethyl octyl ether production. Applied Catalysis A-General.
6. Thermal stability and water effect on ion-exchange resins in EOE production at high temperature
66
6.1 Introduction
A drawback of using sulfonic PS-DVB resins is their low thermal stability [40], [41]. In general,
thermal deactivation by sulfonic groups leaching hinders their application at high temperature.
With respect to EOE formation from EtOH and OcOH, the increase of the reactor temperature
would not involve a loss of selectivity to EOE (chapter 5). Thus, the operating temperature of
the reaction between EtOH and OcOH can be increased to obtain higher reaction rates, and
therefore, a more competitive reaction unit. In contrast, when temperature is increased on the
OcOH / DEC mixture higher amount of DEC is decomposed to DEE, involving a loss of
selectivity (chapter 5).
Most PS-DVB resins are stable up to 150ºC, but the maximum operating temperature of some
resins such as Amberlyst 15 is even lower (120ºC) [41]. In contrast, fluorinated polystyrene
sulfonic resins like Nafion® can operate up to 210ºC, because fluorine atoms upgrade their
thermal stability. In addition, they confer a higher acid strength that could contribute positively to
the catalytic activity [26], [77]. Nevertheless, compared to PS-DVB resins, Nafion® has lower
acid capacity and is more expensive (500-800 $/m2), which are great disadvantages for
industrial use [5]. New thermally stable PS-DVB resins Amberlyst 70 and Purolite CT482 have
been recently commercialized to catalyze processes such as esterification, aromatic alkylation
and olefin hydration at temperatures higher than 150ºC [40], [41]. In these resins, some
hydrogen atoms have been substituted by chlorine. These additional electron withdrawing
atoms increase the acid strength of ion exchangers and minimize the cleavage of the sulphur
bond to aromatic carbon atoms up to 190ºC [30], [57], [79].
Besides, it is well-known that acidic resins suffer different morphological changes, and therefore
catalytic performance varies, depending on the nature of reaction medium. Consequently, their
catalytic activity is highly related to the properties of the reaction mixture [80]. In the presence of
polar substances such as alcohols and water, non-permanent pores appear and diffusion of
reactants towards the acid centres is enhanced [22], [26], [32]. However, in some reaction
systems interactions between water and PS-DVB resin matrix have opposite effects: on one
hand, water competes with reactants as it adsorbs strongly on the sulfonic groups [81]–[85]; on
the other hand, as water is a polar compound, it contributes to open the resin backbone, what
enhances the accessibility of reactants to acid centres. In addition, depending on the water
amount, the catalytic mechanism can change from concerted to ionic which are slower. In
industrial reaction units, the best resin performance takes place at low water contents (0.1-3 mol
water/L) where sulfonic groups are partially dissociated [86].
The aim of this chapter is to evaluate the thermal stability of chlorinated resins, as well as the
effect of water on their catalytic performance, in the temperature range 150-190ºC. Besides,
their properties are examined and compared to those of conventional ones. The chlorinated PS-
DVB resins Amberlyst 70, Amberlyst XE804, and Purolite CT482 have been used as catalysts.
The PS-DVB resin Dowex 50Wx2 has also been used for the sake of comparison.
6. Thermal stability and water effect on ion-exchange resins in EOE production at high temperature
67
6.2 Experimental procedure
The experiments were performed in the fixed-bed reactor (described in section 2.3.2). Catalysts
were dried overnight at 110ºC under vacuum (0.01 bar). Dry samples (0.1-0.7 g) were diluted in
quartz (12-15 g). Reactor feed consisted of an OcOH-EtOH mixture (ROcOH/EtOH = 10). The large
excess of 1-octanol was selected to promote the formation of 1-octenes, and in this way, to
study the possible catalyst deactivation by carbon deposition. Water (1 w/w %) was added to
the reactant mixture in some runs to stress its effect on the reaction rate without the liquid
splitting off in two phases. The feed was preheated in a hot box at 80ºC and then fed to reactor
at a flow rate of 0.25 mL/min. The reactor operated isothermally at 25 bars in the temperature
range 150-190ºC to assure that the reaction took place in the liquid phase.
An additional series of experiments was performed to test the catalyst reusability. After 48 h on-
stream, the reactor was cooled at room temperature. EtOH was fed at a flow rate of 2 mL/min
were fed for 1 h to remove water and OcOH present in the resins. Subsequently, the catalysts
were dried for 2 h in a 50 mL/min N2 stream to remove EtOH. Catalysts dried in this way in the
reactor were re-used in two times. It is to be noted that water content of fresh catalysts (2-4 w/w
%) was some higher than the residual water content after the reactivating process (< 1 w/w %
[87]).
Due to the small catalyst mass in the reactor bed, conversions were low (XOcOH<10%, XEtOH<25
%). Reaction rates to form EOE, DEE and DNOE were calculated by means of the following
equations where it is assumed that the reactor operated in the differential regime:
EOE EOEOcOH OcOH EtOH EtOH1 EOE OcOH EtOH
cat cat cat
F X F X molr =r = S = S
W W h kg
eq. 6.1
DEEEtOH EtOH2 DEE EtOH
cat cat
F X1 molr =r = S
2 W h kg
eq. 6.2
DNOEOcOH OcOH3 DNOE OcOH
cat cat
F X1 molr =r = S
2 W h kg
eq. 6.3
k
j
moleof j reacted to form kS = % , mol mol
moleof j reacted eq. 6.4
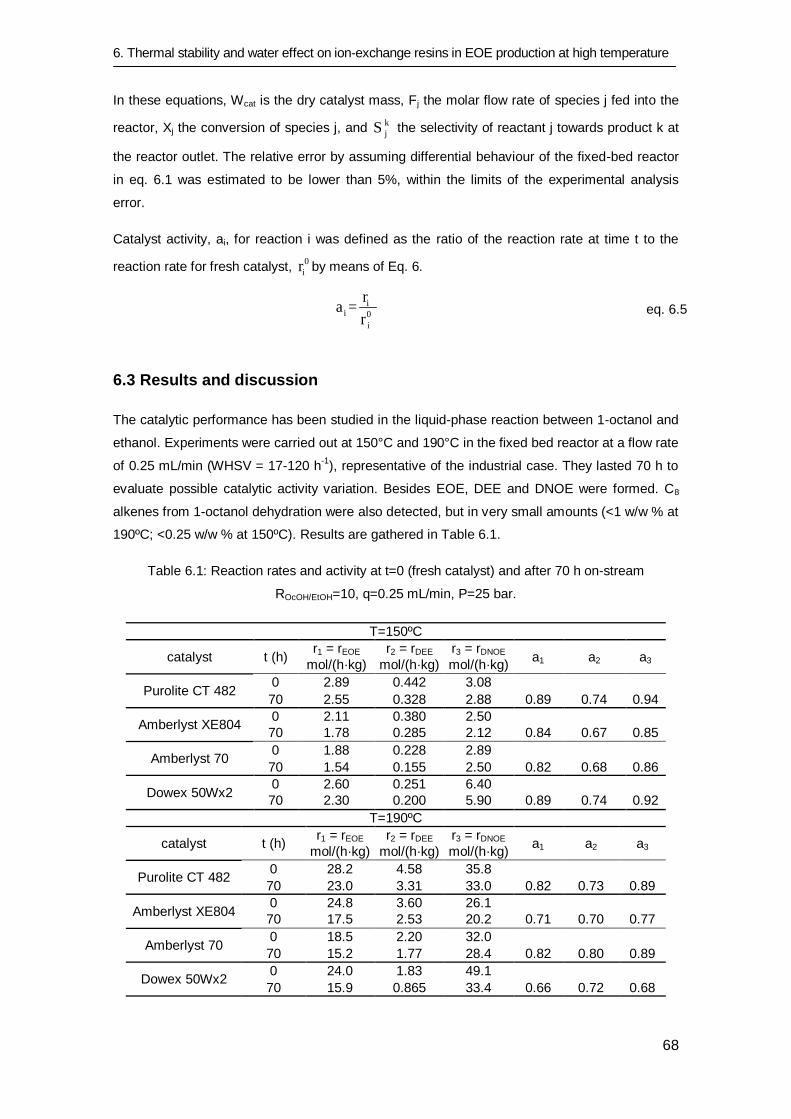
6. Thermal stability and water effect on ion-exchange resins in EOE production at high temperature
68
In these equations, Wcat is the dry catalyst mass, Fj the molar flow rate of species j fed into the
reactor, Xj the conversion of species j, and k
jS the selectivity of reactant j towards product k at
the reactor outlet. The relative error by assuming differential behaviour of the fixed-bed reactor
in eq. 6.1 was estimated to be lower than 5%, within the limits of the experimental analysis
error.
Catalyst activity, ai, for reaction i was defined as the ratio of the reaction rate at time t to the
reaction rate for fresh catalyst, 0
ir by means of Eq. 6.
ii 0
i
ra =
r eq. 6.5
6.3 Results and discussion
The catalytic performance has been studied in the liquid-phase reaction between 1-octanol and
ethanol. Experiments were carried out at 150°C and 190°C in the fixed bed reactor at a flow rate
of 0.25 mL/min (WHSV = 17-120 h-1
), representative of the industrial case. They lasted 70 h to
evaluate possible catalytic activity variation. Besides EOE, DEE and DNOE were formed. C8
alkenes from 1-octanol dehydration were also detected, but in very small amounts (<1 w/w % at
190ºC; <0.25 w/w % at 150ºC). Results are gathered in Table 6.1.
Table 6.1: Reaction rates and activity at t=0 (fresh catalyst) and after 70 h on-stream
ROcOH/EtOH=10, q=0.25 mL/min, P=25 bar.
T=150ºC
catalyst t (h) r1 = rEOE r2 = rDEE r3 = rDNOE
a1 a2 a3 mol/(h·kg) mol/(h·kg) mol/(h·kg)
Purolite CT 482 0 2.89 0.442 3.08
70 2.55 0.328 2.88 0.89 0.74 0.94
Amberlyst XE804 0 2.11 0.380 2.50
70 1.78 0.285 2.12 0.84 0.67 0.85
Amberlyst 70 0 1.88 0.228 2.89
70 1.54 0.155 2.50 0.82 0.68 0.86
Dowex 50Wx2 0 2.60 0.251 6.40
70 2.30 0.200 5.90 0.89 0.74 0.92
T=190ºC
catalyst t (h) r1 = rEOE r2 = rDEE r3 = rDNOE
a1 a2 a3 mol/(h·kg) mol/(h·kg) mol/(h·kg)
Purolite CT 482 0 28.2 4.58 35.8
70 23.0 3.31 33.0 0.82 0.73 0.89
Amberlyst XE804 0 24.8 3.60 26.1
70 17.5 2.53 20.2 0.71 0.70 0.77
Amberlyst 70 0 18.5 2.20 32.0
70 15.2 1.77 28.4 0.82 0.80 0.89
Dowex 50Wx2 0 24.0 1.83 49.1
70 15.9 0.865 33.4 0.66 0.72 0.68
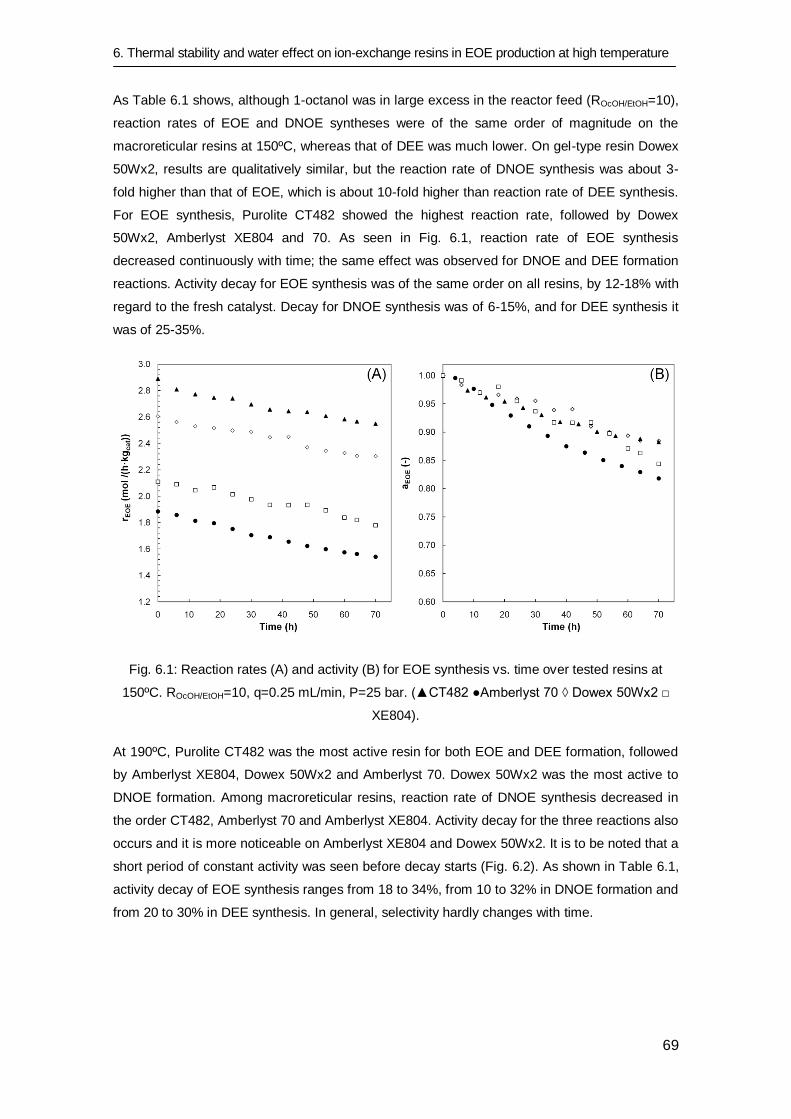
6. Thermal stability and water effect on ion-exchange resins in EOE production at high temperature
69
As Table 6.1 shows, although 1-octanol was in large excess in the reactor feed (ROcOH/EtOH=10),
reaction rates of EOE and DNOE syntheses were of the same order of magnitude on the
macroreticular resins at 150ºC, whereas that of DEE was much lower. On gel-type resin Dowex
50Wx2, results are qualitatively similar, but the reaction rate of DNOE synthesis was about 3-
fold higher than that of EOE, which is about 10-fold higher than reaction rate of DEE synthesis.
For EOE synthesis, Purolite CT482 showed the highest reaction rate, followed by Dowex
50Wx2, Amberlyst XE804 and 70. As seen in Fig. 6.1, reaction rate of EOE synthesis
decreased continuously with time; the same effect was observed for DNOE and DEE formation
reactions. Activity decay for EOE synthesis was of the same order on all resins, by 12-18% with
regard to the fresh catalyst. Decay for DNOE synthesis was of 6-15%, and for DEE synthesis it
was of 25-35%.
Fig. 6.1: Reaction rates (A) and activity (B) for EOE synthesis vs. time over tested resins at
150ºC. ROcOH/EtOH=10, q=0.25 mL/min, P=25 bar. (▲CT482 ●Amberlyst 70 ◊ Dowex 50Wx2 □
XE804).
At 190ºC, Purolite CT482 was the most active resin for both EOE and DEE formation, followed
by Amberlyst XE804, Dowex 50Wx2 and Amberlyst 70. Dowex 50Wx2 was the most active to
DNOE formation. Among macroreticular resins, reaction rate of DNOE synthesis decreased in
the order CT482, Amberlyst 70 and Amberlyst XE804. Activity decay for the three reactions also
occurs and it is more noticeable on Amberlyst XE804 and Dowex 50Wx2. It is to be noted that a
short period of constant activity was seen before decay starts (Fig. 6.2). As shown in Table 6.1,
activity decay of EOE synthesis ranges from 18 to 34%, from 10 to 32% in DNOE formation and
from 20 to 30% in DEE synthesis. In general, selectivity hardly changes with time.
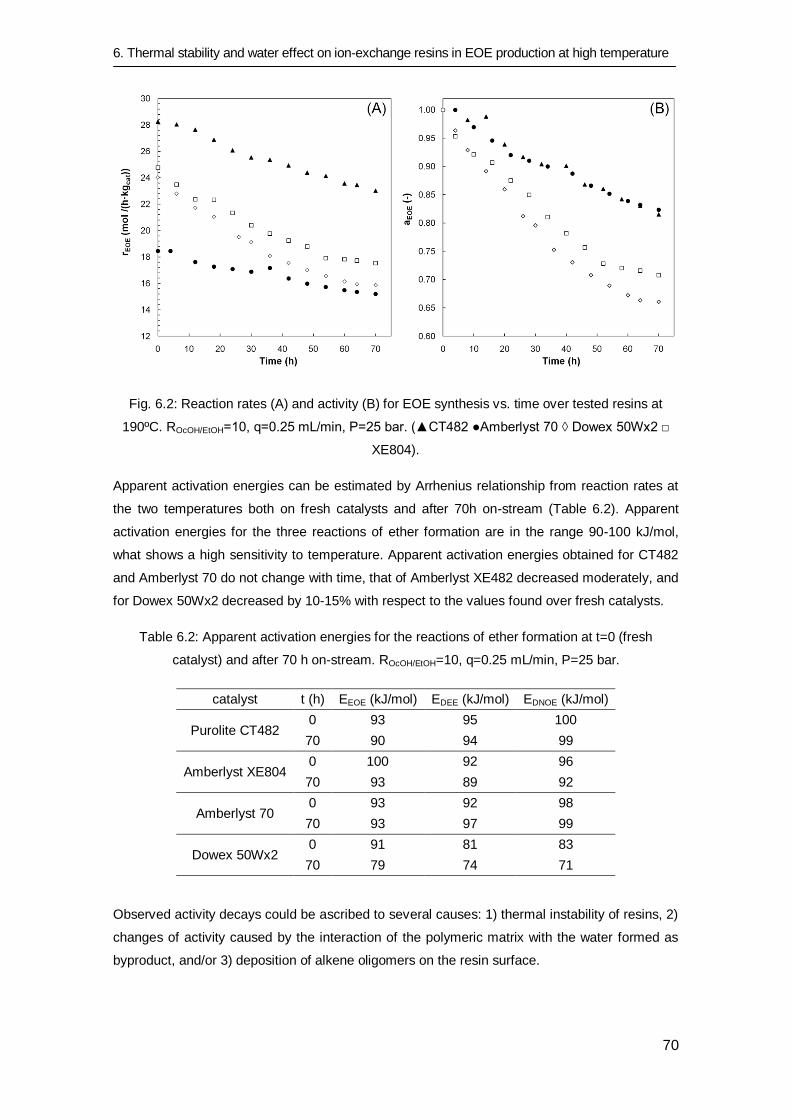
6. Thermal stability and water effect on ion-exchange resins in EOE production at high temperature
70
Fig. 6.2: Reaction rates (A) and activity (B) for EOE synthesis vs. time over tested resins at
190ºC. ROcOH/EtOH=10, q=0.25 mL/min, P=25 bar. (▲CT482 ●Amberlyst 70 ◊ Dowex 50Wx2 □
XE804).
Apparent activation energies can be estimated by Arrhenius relationship from reaction rates at
the two temperatures both on fresh catalysts and after 70h on-stream (Table 6.2). Apparent
activation energies for the three reactions of ether formation are in the range 90-100 kJ/mol,
what shows a high sensitivity to temperature. Apparent activation energies obtained for CT482
and Amberlyst 70 do not change with time, that of Amberlyst XE482 decreased moderately, and
for Dowex 50Wx2 decreased by 10-15% with respect to the values found over fresh catalysts.
Table 6.2: Apparent activation energies for the reactions of ether formation at t=0 (fresh
catalyst) and after 70 h on-stream. ROcOH/EtOH=10, q=0.25 mL/min, P=25 bar.
catalyst t (h) EEOE (kJ/mol) EDEE (kJ/mol) EDNOE (kJ/mol)
Purolite CT482 0 93 95 100
70 90 94 99
Amberlyst XE804 0 100 92 96
70 93 89 92
Amberlyst 70 0 93 92 98
70 93 97 99
Dowex 50Wx2 0 91 81 83
70 79 74 71
Observed activity decays could be ascribed to several causes: 1) thermal instability of resins, 2)
changes of activity caused by the interaction of the polymeric matrix with the water formed as
byproduct, and/or 3) deposition of alkene oligomers on the resin surface.
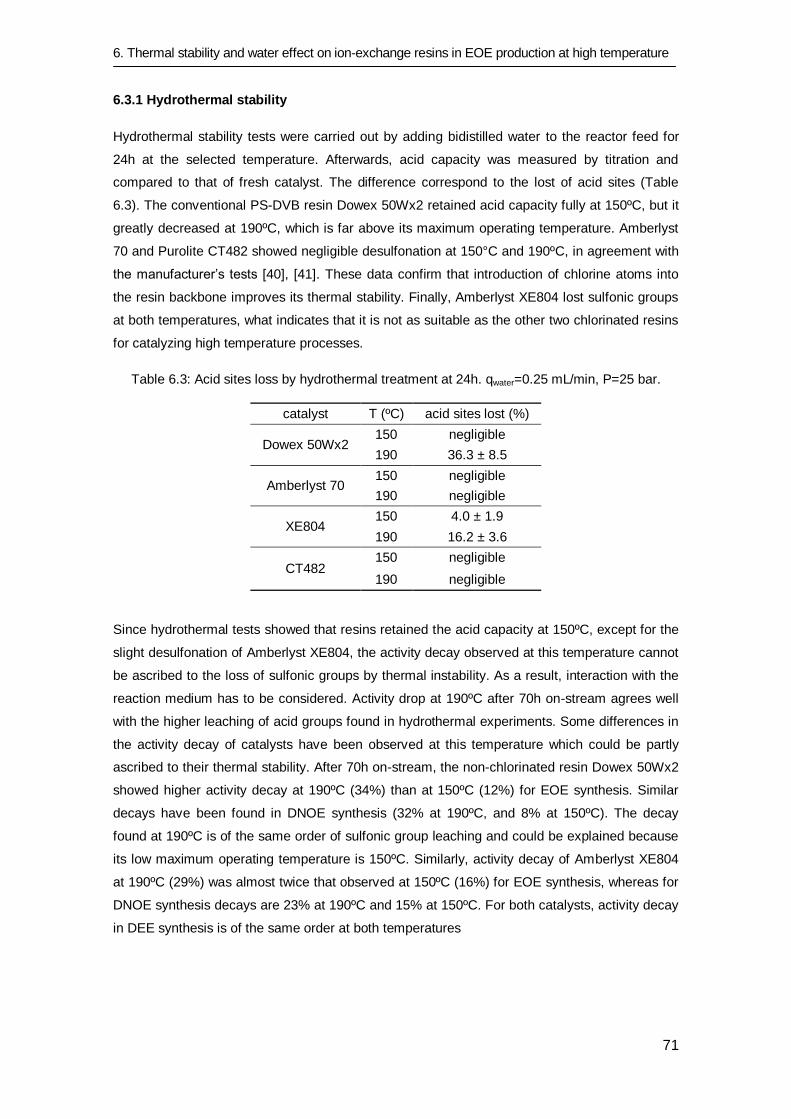
6. Thermal stability and water effect on ion-exchange resins in EOE production at high temperature
71
6.3.1 Hydrothermal stability
Hydrothermal stability tests were carried out by adding bidistilled water to the reactor feed for
24h at the selected temperature. Afterwards, acid capacity was measured by titration and
compared to that of fresh catalyst. The difference correspond to the lost of acid sites (Table
6.3). The conventional PS-DVB resin Dowex 50Wx2 retained acid capacity fully at 150ºC, but it
greatly decreased at 190ºC, which is far above its maximum operating temperature. Amberlyst
70 and Purolite CT482 showed negligible desulfonation at 150°C and 190ºC, in agreement with
the manufacturer’s tests [40], [41]. These data confirm that introduction of chlorine atoms into
the resin backbone improves its thermal stability. Finally, Amberlyst XE804 lost sulfonic groups
at both temperatures, what indicates that it is not as suitable as the other two chlorinated resins
for catalyzing high temperature processes.
Table 6.3: Acid sites loss by hydrothermal treatment at 24h. qwater=0.25 mL/min, P=25 bar.
catalyst T (ºC) acid sites lost (%)
Dowex 50Wx2 150 negligible
190 36.3 ± 8.5
Amberlyst 70 150 negligible
190 negligible
XE804 150 4.0 ± 1.9
190 16.2 ± 3.6
CT482 150 negligible
190 negligible
Since hydrothermal tests showed that resins retained the acid capacity at 150ºC, except for the
slight desulfonation of Amberlyst XE804, the activity decay observed at this temperature cannot
be ascribed to the loss of sulfonic groups by thermal instability. As a result, interaction with the
reaction medium has to be considered. Activity drop at 190ºC after 70h on-stream agrees well
with the higher leaching of acid groups found in hydrothermal experiments. Some differences in
the activity decay of catalysts have been observed at this temperature which could be partly
ascribed to their thermal stability. After 70h on-stream, the non-chlorinated resin Dowex 50Wx2
showed higher activity decay at 190ºC (34%) than at 150ºC (12%) for EOE synthesis. Similar
decays have been found in DNOE synthesis (32% at 190ºC, and 8% at 150ºC). The decay
found at 190ºC is of the same order of sulfonic group leaching and could be explained because
its low maximum operating temperature is 150ºC. Similarly, activity decay of Amberlyst XE804
at 190ºC (29%) was almost twice that observed at 150ºC (16%) for EOE synthesis, whereas for
DNOE synthesis decays are 23% at 190ºC and 15% at 150ºC. For both catalysts, activity decay
in DEE synthesis is of the same order at both temperatures
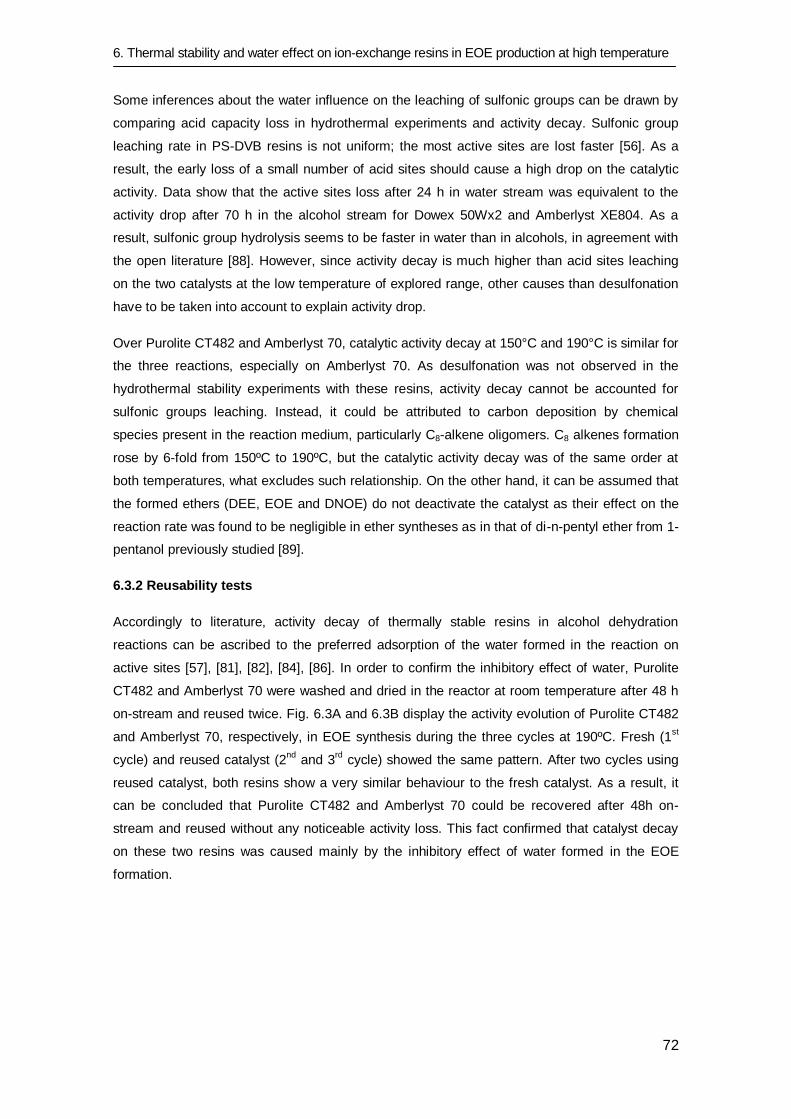
6. Thermal stability and water effect on ion-exchange resins in EOE production at high temperature
72
Some inferences about the water influence on the leaching of sulfonic groups can be drawn by
comparing acid capacity loss in hydrothermal experiments and activity decay. Sulfonic group
leaching rate in PS-DVB resins is not uniform; the most active sites are lost faster [56]. As a
result, the early loss of a small number of acid sites should cause a high drop on the catalytic
activity. Data show that the active sites loss after 24 h in water stream was equivalent to the
activity drop after 70 h in the alcohol stream for Dowex 50Wx2 and Amberlyst XE804. As a
result, sulfonic group hydrolysis seems to be faster in water than in alcohols, in agreement with
the open literature [88]. However, since activity decay is much higher than acid sites leaching
on the two catalysts at the low temperature of explored range, other causes than desulfonation
have to be taken into account to explain activity drop.
Over Purolite CT482 and Amberlyst 70, catalytic activity decay at 150°C and 190°C is similar for
the three reactions, especially on Amberlyst 70. As desulfonation was not observed in the
hydrothermal stability experiments with these resins, activity decay cannot be accounted for
sulfonic groups leaching. Instead, it could be attributed to carbon deposition by chemical
species present in the reaction medium, particularly C8-alkene oligomers. C8 alkenes formation
rose by 6-fold from 150ºC to 190ºC, but the catalytic activity decay was of the same order at
both temperatures, what excludes such relationship. On the other hand, it can be assumed that
the formed ethers (DEE, EOE and DNOE) do not deactivate the catalyst as their effect on the
reaction rate was found to be negligible in ether syntheses as in that of di-n-pentyl ether from 1-
pentanol previously studied [89].
6.3.2 Reusability tests
Accordingly to literature, activity decay of thermally stable resins in alcohol dehydration
reactions can be ascribed to the preferred adsorption of the water formed in the reaction on
active sites [57], [81], [82], [84], [86]. In order to confirm the inhibitory effect of water, Purolite
CT482 and Amberlyst 70 were washed and dried in the reactor at room temperature after 48 h
on-stream and reused twice. Fig. 6.3A and 6.3B display the activity evolution of Purolite CT482
and Amberlyst 70, respectively, in EOE synthesis during the three cycles at 190ºC. Fresh (1st
cycle) and reused catalyst (2nd
and 3rd
cycle) showed the same pattern. After two cycles using
reused catalyst, both resins show a very similar behaviour to the fresh catalyst. As a result, it
can be concluded that Purolite CT482 and Amberlyst 70 could be recovered after 48h on-
stream and reused without any noticeable activity loss. This fact confirmed that catalyst decay
on these two resins was caused mainly by the inhibitory effect of water formed in the EOE
formation.
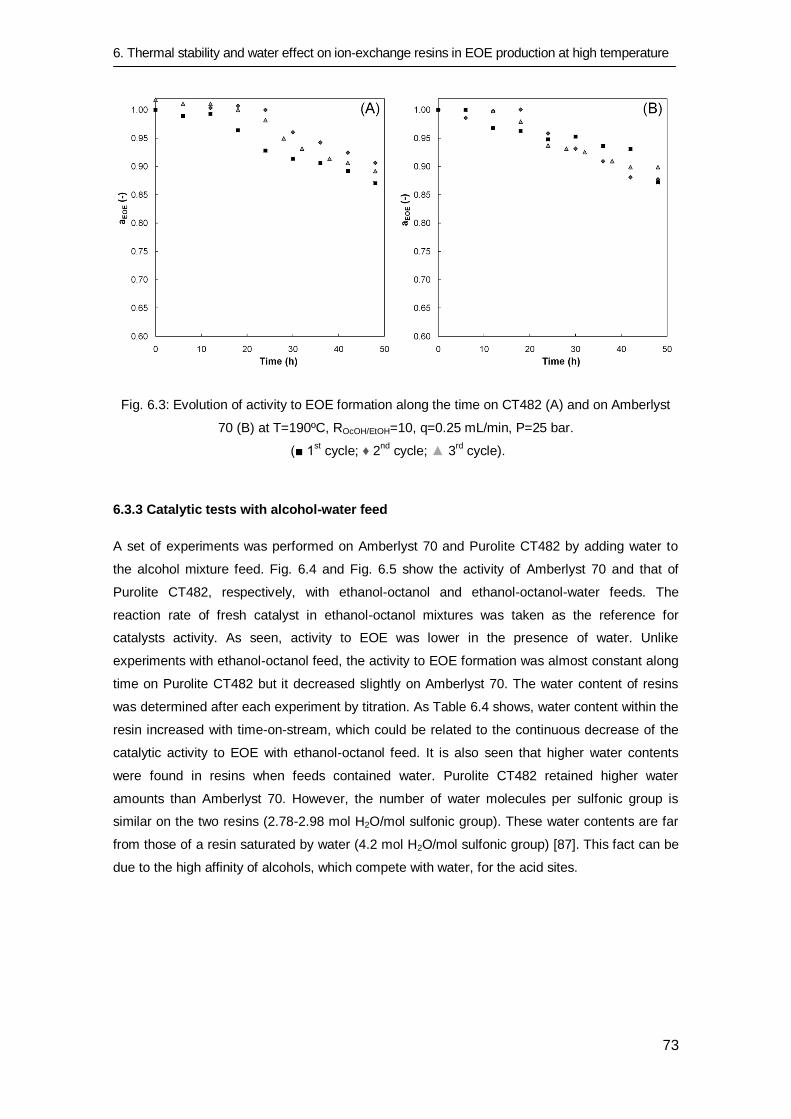
6. Thermal stability and water effect on ion-exchange resins in EOE production at high temperature
73
Fig. 6.3: Evolution of activity to EOE formation along the time on CT482 (A) and on Amberlyst
70 (B) at T=190ºC, ROcOH/EtOH=10, q=0.25 mL/min, P=25 bar.
(■ 1st cycle; ♦ 2
nd cycle; ▲ 3
rd cycle).
6.3.3 Catalytic tests with alcohol-water feed
A set of experiments was performed on Amberlyst 70 and Purolite CT482 by adding water to
the alcohol mixture feed. Fig. 6.4 and Fig. 6.5 show the activity of Amberlyst 70 and that of
Purolite CT482, respectively, with ethanol-octanol and ethanol-octanol-water feeds. The
reaction rate of fresh catalyst in ethanol-octanol mixtures was taken as the reference for
catalysts activity. As seen, activity to EOE was lower in the presence of water. Unlike
experiments with ethanol-octanol feed, the activity to EOE formation was almost constant along
time on Purolite CT482 but it decreased slightly on Amberlyst 70. The water content of resins
was determined after each experiment by titration. As Table 6.4 shows, water content within the
resin increased with time-on-stream, which could be related to the continuous decrease of the
catalytic activity to EOE with ethanol-octanol feed. It is also seen that higher water contents
were found in resins when feeds contained water. Purolite CT482 retained higher water
amounts than Amberlyst 70. However, the number of water molecules per sulfonic group is
similar on the two resins (2.78-2.98 mol H2O/mol sulfonic group). These water contents are far
from those of a resin saturated by water (4.2 mol H2O/mol sulfonic group) [87]. This fact can be
due to the high affinity of alcohols, which compete with water, for the acid sites.
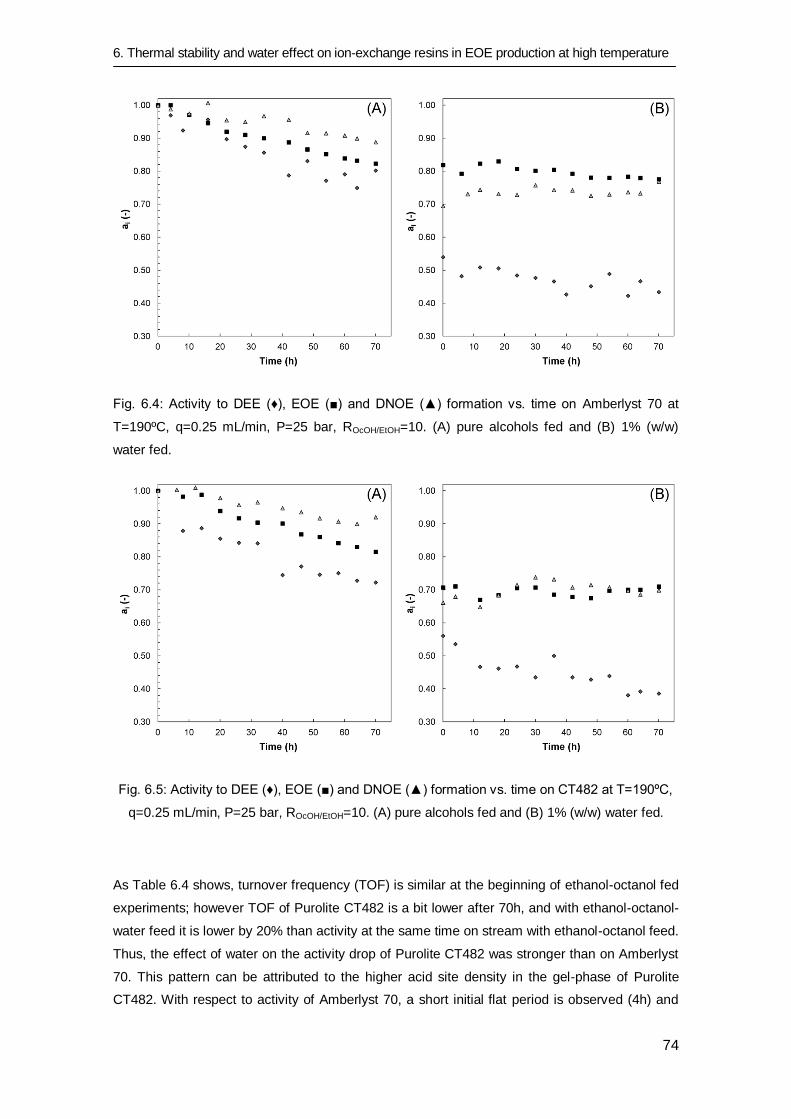
6. Thermal stability and water effect on ion-exchange resins in EOE production at high temperature
74
Fig. 6.4: Activity to DEE (♦), EOE (■) and DNOE (▲) formation vs. time on Amberlyst 70 at
T=190ºC, q=0.25 mL/min, P=25 bar, ROcOH/EtOH=10. (A) pure alcohols fed and (B) 1% (w/w)
water fed.
Fig. 6.5: Activity to DEE (♦), EOE (■) and DNOE (▲) formation vs. time on CT482 at T=190ºC,
q=0.25 mL/min, P=25 bar, ROcOH/EtOH=10. (A) pure alcohols fed and (B) 1% (w/w) water fed.
As Table 6.4 shows, turnover frequency (TOF) is similar at the beginning of ethanol-octanol fed
experiments; however TOF of Purolite CT482 is a bit lower after 70h, and with ethanol-octanol-
water feed it is lower by 20% than activity at the same time on stream with ethanol-octanol feed.
Thus, the effect of water on the activity drop of Purolite CT482 was stronger than on Amberlyst
70. This pattern can be attributed to the higher acid site density in the gel-phase of Purolite
CT482. With respect to activity of Amberlyst 70, a short initial flat period is observed (4h) and
6. Thermal stability and water effect on ion-exchange resins in EOE production at high temperature
75
afterwards a continuous decay, whereas for CT482 the flat period is longer (16h) and the decay
rate is higher, so that after 70 h the activity level of Amberlyst 70 is slightly higher than that of
Purolite CT482. In experiments where water was fed, the activity level of Purolite CT482 is
always clearly lower.
Table 6.4: Water content inside resin and TOFs as a function of time on stream. T=190ºC,
ROcOH/EtOH=10, q=0.25 mL/min, P=25 bar.
catalyst time on-stream (h) water content (w/w,%) mol H20 per sulfonic group TOF (h-1
)
Amberlyst 70
0 2.1 0.45 6.98
24 7.2 1.62
70 9.5 2.19 5.74
70a 12.5 2.98 5.40
Purolite CT482
0 3.6 0.49 6.94
24 10.6 1.55
70 13.2 1.98 5.41
70a 17.5 2.78 4.71
a 1% (w/w) water in the feed
Without water in the feed, both OcOH and EtOH swell the resins and compete for adsorbing on
acid centres and the highest reaction rate is achieved with fresh catalyst. Then, a part of formed
water adsorbs gradually on the resin and the reaction rate starts to decrease. The phase-
equilibrium between water in the liquid phase and adsorbed on acid sites is not likely to be
reached during the experiments without feeding water. On the contrary, when water was fed,
the water amount in the liquid phase was enough to reach water-resin quasi-equilibrium, and
the reaction rate to form EOE is nearly independent on time on-stream. As Table 6.4 shows, the
amount of adsorbed water is similar in both resins. The different TOF could be explained by the
fact that water probably acts as a solvent inside pores even at small quantities, and a transition
takes place from concerted to ionic catalytic mechanism (slower) where the hydrated proton is
the true catalytic agent takes place [82]. The effect of the mechanism change on the rate would
be more noticeable on the three dimensional networks of sulfonic groups in the denser gel-
phase of Purolite CT482 as a result of their proximity [90].
6.3.4 Catalytic activity for DEE, EOE and DNOE syntheses
Morphological changes that take place in the resins with time-on-stream by the action of water
can modify their catalytic behaviour. As the amount of water adsorbed on resins increases with
time-on-stream, accessibility of OcOH and EtOH to acid sites is also modified. It is observed
that activity drop present different pattern depending on the ether (see Fig. 6.4 and 6.5). As a
rule, activity decay was higher as the ether is less bulky: DEE>EOE>DNOE. When water is fed
together with the alcohol mixture, it is seen that EOE and DNOE syntheses tend to similar
activity levels, but DEE formation continues decreasing.
6. Thermal stability and water effect on ion-exchange resins in EOE production at high temperature
76
In ethanol-octanol feed, fresh ion-exchange resins were not fully swollen and the accessibility to
acid centres was in some extent hindered. It is expected that steric restrictions play a major role
for larger ether formation (DNOE>EOE>DEE). Resins swelled progressively with reaction time
and the void spaces appearing between polymer chains favoured the diffusion of OcOH and
bulky ethers EOE and DNOE. Thus, activity drop was less pronounced as the size of the ether
increased. The effect of water was especially stressed in ethanol-octanol-water experiments.
The adsorption of water caused remarkable activity decay for DEE synthesis, but in the case of
EOE and DNOE it was partially balanced by the higher accessibility to acid centres of 1-octanol.
Accordingly, the activity after 70 h time-on-stream was reduced by 30-35% in EOE and DNOE
syntheses, and 57% in DEE formation, in relation to activity of fresh catalysts in ethanol-octanol
feed.
Summarizing, water effects on the reaction between OcOH and EtOH are complex as this study
shows. It is seen that the period of time necessary to get a steady activity in this case is
extremely long. On Purolite CT482 and Amberlyst 70, which show very good hydrothermal
stability at 190ºC, released water acts as a solvent and increased the accessibility of bulky
molecules to the active centres. Consequently, catalytic activity to produce long chain ethers is
less hindered in the presence of water than to short ones. In the particular case of Dowex
50Wx2 and Amberlyst XE804 the presence of significant desulfonation at 190ºC makes the
situation more complicated.
Finally, activity decay patterns were modelled for Amberlyst 70 and Purolite CT482 in runs with
ethanol-octanol feed. Activity drop in Dowex 50Wx2 and Amberlyst XE804 was not modelled
since it was partly due to leaching of sulfonic groups. Literature supplies relationships between
resin activity and the amount of water in the liquid-phase. Some are essentially empirical, but
equations based on exponential, or Langmuir and Freundlich equilibrium approaches have been
also used [90], [91]. Still, in our experiments the water amount in the liquid phase was always
small and often around the threshold of chromatographic detection. So that, activity as a
function of time was fitted to first and second order activation decays functions. Best results
were found by assuming a first order decay with terminal activity (eq. 6.6):
id,i
da- = k a-a
dt eq. 6.6
whose integrated form is
i , , , 0a = a 1 a expi i d ik t t eq. 6.7
where a,I is the terminal activity, kd,i is the rate constant of decay, and t0 the time when decay
starts. The parameters of eq. 6.7 for EOE, DNOE and DEE syntheses on both catalysts are
shown in Table 6.5. As seen, terminal activities roughly agree with the values found at large
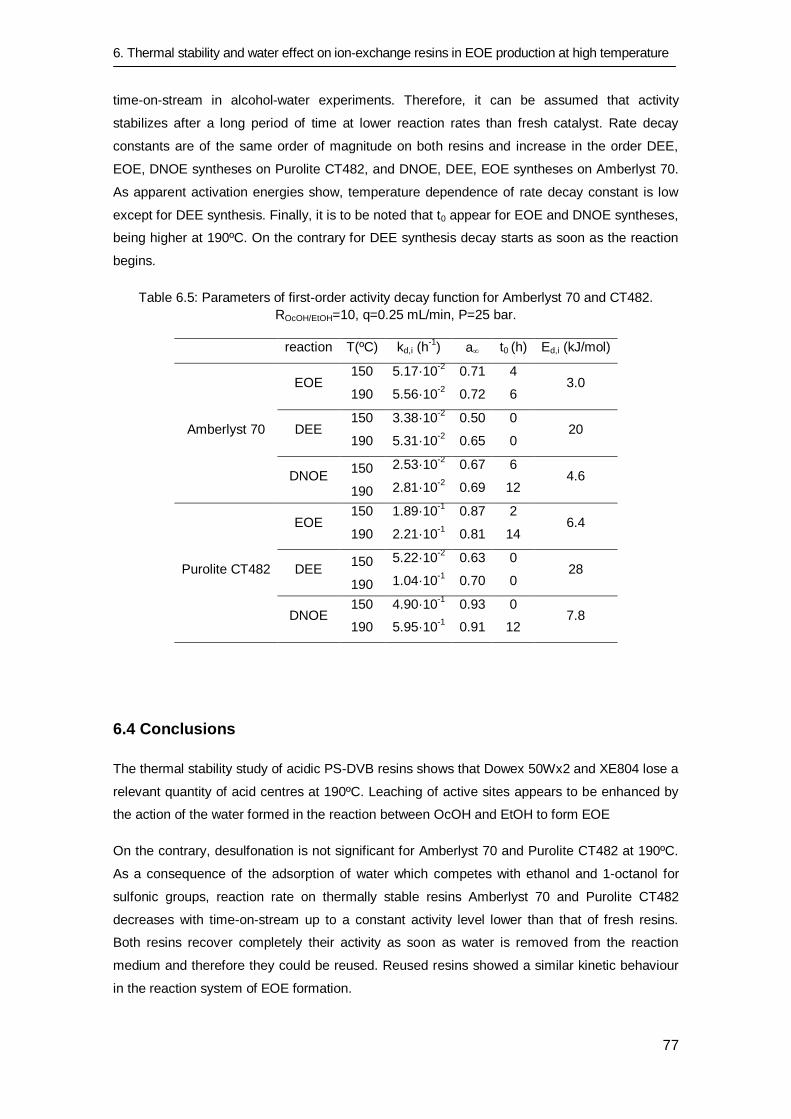
6. Thermal stability and water effect on ion-exchange resins in EOE production at high temperature
77
time-on-stream in alcohol-water experiments. Therefore, it can be assumed that activity
stabilizes after a long period of time at lower reaction rates than fresh catalyst. Rate decay
constants are of the same order of magnitude on both resins and increase in the order DEE,
EOE, DNOE syntheses on Purolite CT482, and DNOE, DEE, EOE syntheses on Amberlyst 70.
As apparent activation energies show, temperature dependence of rate decay constant is low
except for DEE synthesis. Finally, it is to be noted that t0 appear for EOE and DNOE syntheses,
being higher at 190ºC. On the contrary for DEE synthesis decay starts as soon as the reaction
begins.
Table 6.5: Parameters of first-order activity decay function for Amberlyst 70 and CT482.
ROcOH/EtOH=10, q=0.25 mL/min, P=25 bar.
reaction T(ºC) kd,i (h-1
) a t0 (h) Ed,i (kJ/mol)
Amberlyst 70
EOE 150
190
5.17·10-2
5.56·10-2
0.71
0.72
4
6 3.0
DEE 150
190
3.38·10-2
5.31·10-2
0.50
0.65
0
0 20
DNOE 150
190
2.53·10-2
2.81·10-2
0.67
0.69
6
12 4.6
Purolite CT482
EOE 150
190
1.89·10-1
2.21·10-1
0.87
0.81
2
14 6.4
DEE 150
190
5.22·10-2
1.04·10-1
0.63
0.70
0
0 28
DNOE 150
190
4.90·10-1
5.95·10-1
0.93
0.91
0
12 7.8
6.4 Conclusions
The thermal stability study of acidic PS-DVB resins shows that Dowex 50Wx2 and XE804 lose a
relevant quantity of acid centres at 190ºC. Leaching of active sites appears to be enhanced by
the action of the water formed in the reaction between OcOH and EtOH to form EOE
On the contrary, desulfonation is not significant for Amberlyst 70 and Purolite CT482 at 190ºC.
As a consequence of the adsorption of water which competes with ethanol and 1-octanol for
sulfonic groups, reaction rate on thermally stable resins Amberlyst 70 and Purolite CT482
decreases with time-on-stream up to a constant activity level lower than that of fresh resins.
Both resins recover completely their activity as soon as water is removed from the reaction
medium and therefore they could be reused. Reused resins showed a similar kinetic behaviour
in the reaction system of EOE formation.

6. Thermal stability and water effect on ion-exchange resins in EOE production at high temperature
78
Ion-exchange resins are not completely swollen in the absence of water. As a consequence,
diffusion of OcOH and bulky ethers are hindered. However, with time on-stream, released water
acts as solvent and swells partially the resin. Thus, the catalytic activity drop is less pronounced
for the ethers with more steric restrictions (EOE and DNOE) than for the smallest one (DEE).
Chapter 7
Kinetic and equilibrium study of
ethyl octyl ether formation from
ethanol and 1-octanol
dehydration on Amberlyst 70
THE EQUILIBRIUM SECTION OF THIS CHAPTER HAS BEEN REVISED AND RESUBMITTED IN:
J. Guilera, E. Ramírez, M. Iborra, J. Tejero, F. Cunill. Experimental study of chemical equilibria of the liquid-phase alcohol dehydration to 1-ethoxy-octane and to ethoxyethane. Journal of Chemical & Engineering Data.
THE KINETIC SECTION OF THIS CHAPTER HAS BEEN ACCEPTED AS A POSTER IN:
J. Guilera, R. Bringué, E. Ramírez, J. Tejero, F. Cunill. Kinetics of 1-octanol and ethanol dehydration to ethyl octyl ether over Amberlyst 70. September 2013. To be presented at XI
EUROPACAT (European Congress on Catalysis), Lyon, France.
7. Kinetic and equilibrium study of EOE formation from EtOH and OcOH dehydration on Amberlyst 70
80
7.1 Introduction
Former chapters revealed that a feasible way to produce EOE is by means of EtOH and OcOH
dehydration catalyzed by acidic ion-exchange resins. The main drawback of EOE production is
the loss of EtOH molecules to form DEE. In poorly swollen resins such as Amberlyst 15 or 35
(macroreticular, high and medium divinylbenzene content), OcOH permeation is hindered
whereas EtOH reach most of acid sites. As a result, DEE is preferably obtained in these
macroreticular resins (selectivity to EOE 15-20% and to DEE 15-83%, with respect to EtOH).
However, low-crosslinked resins such as Amberlyst 121, Amberlyst 70 or Purolite CT224 have
wide enough spaces between polymer chains to allow OcOH access more easily to acid
centers, and in this way to compete efficiently with EtOH for the acid sites. Therefore, low-
crossliked resins maximized the production of EOE and reduced the amount of DEE formed
(selectivity to EOE 41-46% and to DEE 43-53%).
As concerns to low-crosslinked resins, the chlorinated Amberlyst 70 showed a negligible
desulfonation on EOE formation up to 190ºC (chapter 6), whereas common ion-exchange resins
are only stable up to 120-150ºC [40], [41]. Another commercial thermally stable resin is Purolite
CT482. Such catalyst showed a higher activity to EOE due to its higher acid capacity (4.25
mmol H+/g) in comparison to Amberlyst 70 (2.65 mmol H
+/g). However, Purolite CT482 has a
stiffer morphology than Amberlyst 70 favouring the production of the less sterically demanding
ether, DEE (chapter 6). Therefore, Amberlyst 70 was chosen as the best acidic ion-exchange
catalyst to produce EOE at relatively high temperature range (up to 190ºC).
Preferential adsorption of polar species on ion-exchangers is a key factor to evaluate the
kinetics on alcohol dehydrations [89]. With respect to EOE formation, water preferably adsorbs
on acid centers of exchangers excluding OcOH and EtOH, and as a result, the reaction to form
EOE is inhibited (chapter 6). In order to obtain reaction rate models based on reaction
mechanisms, LHHW and ER formalisms have been used successfully for the treatment of
alcohol dehydration experimental data [54], [89], [92]–[94]. However, to the best of our
knowledge, the liquid-phase kinetics of the synthesis of EOE from EtOH and OcOH, necessary
for design reactor purposes, is not reported in the open literature.
On the other hand, to the best of our knowledge, equilibrium data for EOE synthesis has not
been reported in the open literature up-to-date. As for the main side reaction, DEE formation,
liquid-phase equilibrium data of DEE synthesis up to 190ºC is still unknown. To cover this gap,
in the present chapter, experimental values of the equilibrium constant of the dehydration
reaction between EtOH and OcOH to EOE and water, and the dehydration reaction of two EtOH
molecules to DEE and water; have been determined at the temperature range 137-190ºC by
direct measurement of the mixture composition at equilibrium state. Besides, standard enthalpy,
entropy and free Gibbs energy changes were computed for both EOE and DEE synthesis
reactions
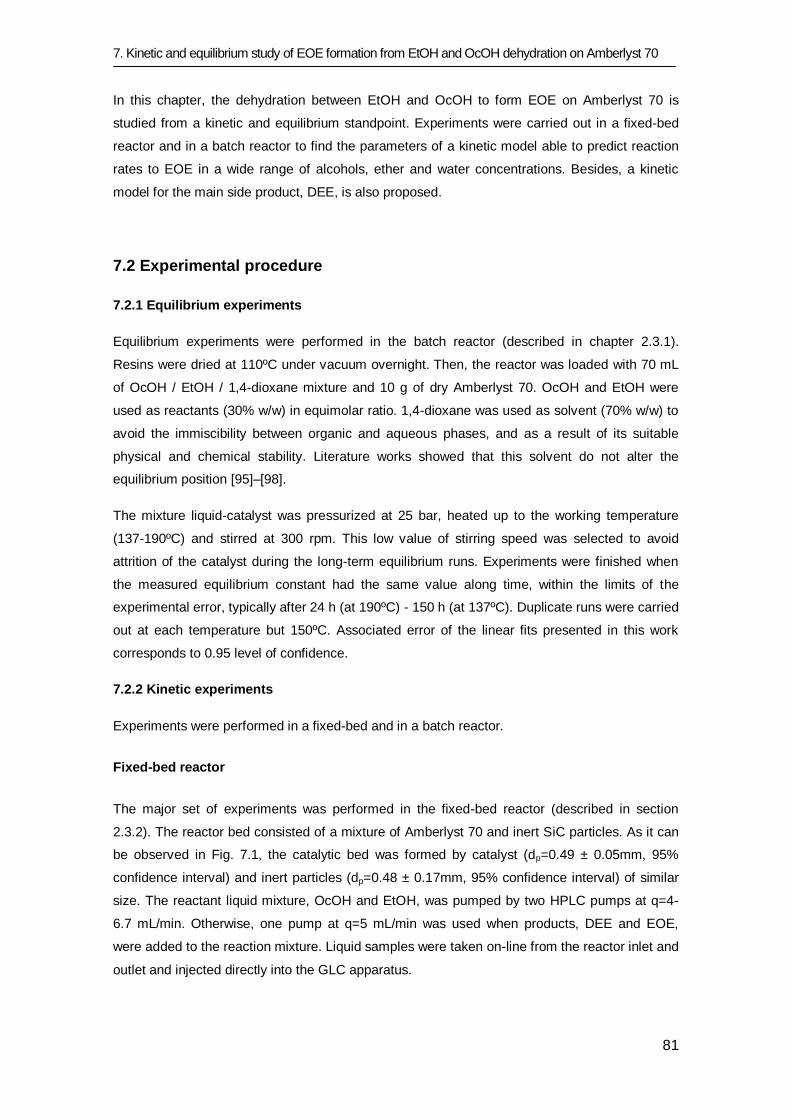
7. Kinetic and equilibrium study of EOE formation from EtOH and OcOH dehydration on Amberlyst 70
81
In this chapter, the dehydration between EtOH and OcOH to form EOE on Amberlyst 70 is
studied from a kinetic and equilibrium standpoint. Experiments were carried out in a fixed-bed
reactor and in a batch reactor to find the parameters of a kinetic model able to predict reaction
rates to EOE in a wide range of alcohols, ether and water concentrations. Besides, a kinetic
model for the main side product, DEE, is also proposed.
7.2 Experimental procedure
7.2.1 Equilibrium experiments
Equilibrium experiments were performed in the batch reactor (described in chapter 2.3.1).
Resins were dried at 110ºC under vacuum overnight. Then, the reactor was loaded with 70 mL
of OcOH / EtOH / 1,4-dioxane mixture and 10 g of dry Amberlyst 70. OcOH and EtOH were
used as reactants (30% w/w) in equimolar ratio. 1,4-dioxane was used as solvent (70% w/w) to
avoid the immiscibility between organic and aqueous phases, and as a result of its suitable
physical and chemical stability. Literature works showed that this solvent do not alter the
equilibrium position [95]–[98].
The mixture liquid-catalyst was pressurized at 25 bar, heated up to the working temperature
(137-190ºC) and stirred at 300 rpm. This low value of stirring speed was selected to avoid
attrition of the catalyst during the long-term equilibrium runs. Experiments were finished when
the measured equilibrium constant had the same value along time, within the limits of the
experimental error, typically after 24 h (at 190ºC) - 150 h (at 137ºC). Duplicate runs were carried
out at each temperature but 150ºC. Associated error of the linear fits presented in this work
corresponds to 0.95 level of confidence.
7.2.2 Kinetic experiments
Experiments were performed in a fixed-bed and in a batch reactor.
Fixed-bed reactor
The major set of experiments was performed in the fixed-bed reactor (described in section
2.3.2). The reactor bed consisted of a mixture of Amberlyst 70 and inert SiC particles. As it can
be observed in Fig. 7.1, the catalytic bed was formed by catalyst (dp=0.49 ± 0.05mm, 95%
confidence interval) and inert particles (dp=0.48 ± 0.17mm, 95% confidence interval) of similar
size. The reactant liquid mixture, OcOH and EtOH, was pumped by two HPLC pumps at q=4-
6.7 mL/min. Otherwise, one pump at q=5 mL/min was used when products, DEE and EOE,
were added to the reaction mixture. Liquid samples were taken on-line from the reactor inlet and
outlet and injected directly into the GLC apparatus.
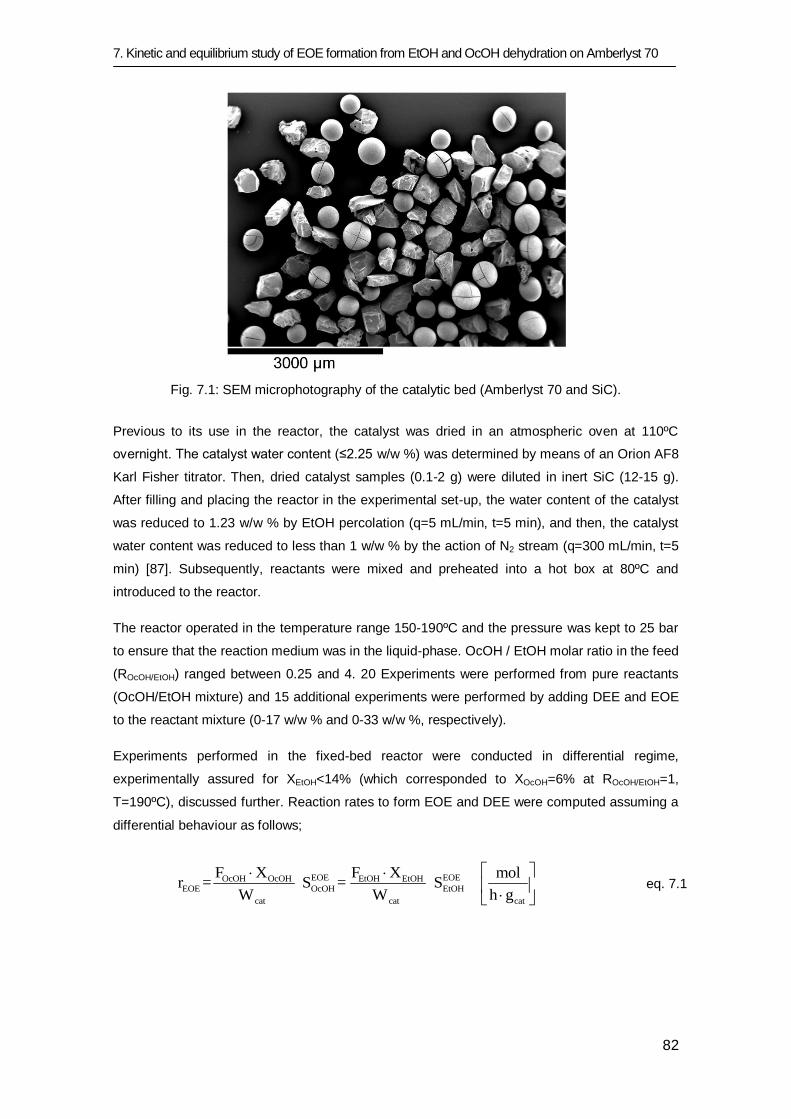
7. Kinetic and equilibrium study of EOE formation from EtOH and OcOH dehydration on Amberlyst 70
82
Fig. 7.1: SEM microphotography of the catalytic bed (Amberlyst 70 and SiC).
Previous to its use in the reactor, the catalyst was dried in an atmospheric oven at 110ºC
overnight. The catalyst water content (≤2.25 w/w %) was determined by means of an Orion AF8
Karl Fisher titrator. Then, dried catalyst samples (0.1-2 g) were diluted in inert SiC (12-15 g).
After filling and placing the reactor in the experimental set-up, the water content of the catalyst
was reduced to 1.23 w/w % by EtOH percolation (q=5 mL/min, t=5 min), and then, the catalyst
water content was reduced to less than 1 w/w % by the action of N2 stream (q=300 mL/min, t=5
min) [87]. Subsequently, reactants were mixed and preheated into a hot box at 80ºC and
introduced to the reactor.
The reactor operated in the temperature range 150-190ºC and the pressure was kept to 25 bar
to ensure that the reaction medium was in the liquid-phase. OcOH / EtOH molar ratio in the feed
(ROcOH/EtOH) ranged between 0.25 and 4. 20 Experiments were performed from pure reactants
(OcOH/EtOH mixture) and 15 additional experiments were performed by adding DEE and EOE
to the reactant mixture (0-17 w/w % and 0-33 w/w %, respectively).
Experiments performed in the fixed-bed reactor were conducted in differential regime,
experimentally assured for XEtOH<14% (which corresponded to XOcOH=6% at ROcOH/EtOH=1,
T=190ºC), discussed further. Reaction rates to form EOE and DEE were computed assuming a
differential behaviour as follows;
EOE EOEOcOH OcOH EtOH EtOHEOE OcOH EtOH
cat cat cat
F X F X molr = S = S
W W h g
eq. 7.1
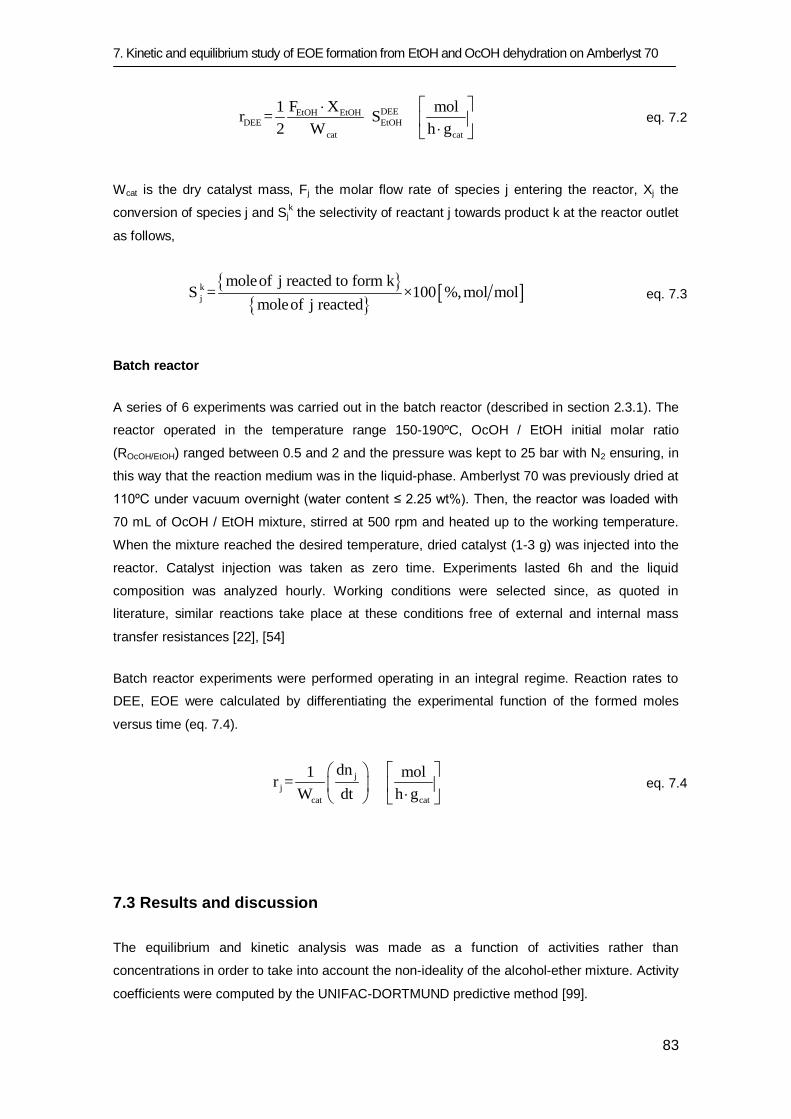
7. Kinetic and equilibrium study of EOE formation from EtOH and OcOH dehydration on Amberlyst 70
83
DEEEtOH EtOHDEE EtOH
cat cat
F X1 molr = S
2 W h g
eq. 7.2
Wcat is the dry catalyst mass, Fj the molar flow rate of species j entering the reactor, Xj the
conversion of species j and Sjk the selectivity of reactant j towards product k at the reactor outlet
as follows,
k
j
moleof j reacted to form kS = ×100 %,mol mol
moleof j reacted eq. 7.3
Batch reactor
A series of 6 experiments was carried out in the batch reactor (described in section 2.3.1). The
reactor operated in the temperature range 150-190ºC, OcOH / EtOH initial molar ratio
(ROcOH/EtOH) ranged between 0.5 and 2 and the pressure was kept to 25 bar with N2 ensuring, in
this way that the reaction medium was in the liquid-phase. Amberlyst 70 was previously dried at
110ºC under vacuum overnight (water content ≤ 2.25 wt%). Then, the reactor was loaded with
70 mL of OcOH / EtOH mixture, stirred at 500 rpm and heated up to the working temperature.
When the mixture reached the desired temperature, dried catalyst (1-3 g) was injected into the
reactor. Catalyst injection was taken as zero time. Experiments lasted 6h and the liquid
composition was analyzed hourly. Working conditions were selected since, as quoted in
literature, similar reactions take place at these conditions free of external and internal mass
transfer resistances [22], [54]
Batch reactor experiments were performed operating in an integral regime. Reaction rates to
DEE, EOE were calculated by differentiating the experimental function of the formed moles
versus time (eq. 7.4).
j
j
cat cat
dn1 molr =
W dt h g
eq. 7.4
7.3 Results and discussion
The equilibrium and kinetic analysis was made as a function of activities rather than
concentrations in order to take into account the non-ideality of the alcohol-ether mixture. Activity
coefficients were computed by the UNIFAC-DORTMUND predictive method [99].
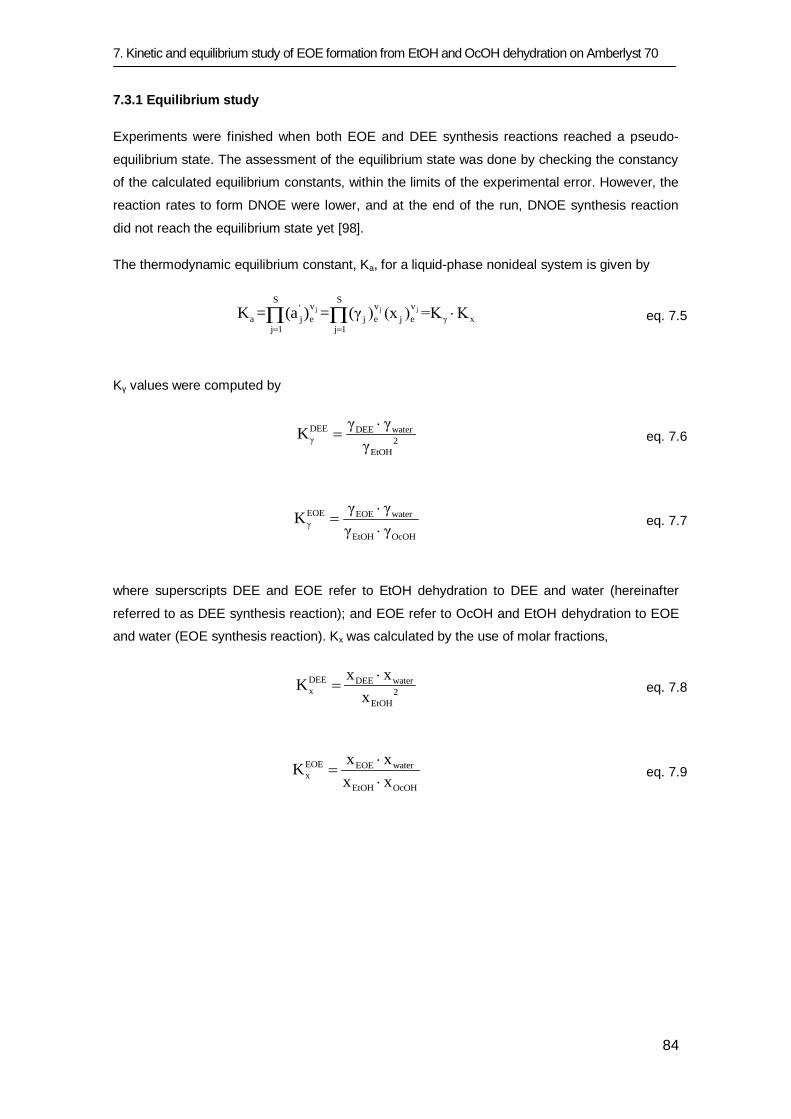
7. Kinetic and equilibrium study of EOE formation from EtOH and OcOH dehydration on Amberlyst 70
84
7.3.1 Equilibrium study
Experiments were finished when both EOE and DEE synthesis reactions reached a pseudo-
equilibrium state. The assessment of the equilibrium state was done by checking the constancy
of the calculated equilibrium constants, within the limits of the experimental error. However, the
reaction rates to form DNOE were lower, and at the end of the run, DNOE synthesis reaction
did not reach the equilibrium state yet [98].
The thermodynamic equilibrium constant, Ka, for a liquid-phase nonideal system is given by
j j j
S Sv v v'
a j e j e j e γ xj 1 j 1
K = (a ) = (γ ) (x ) =K K
eq. 7.5
Kγ values were computed by
DEE DEE waterγ 2
EtOH
γ γK
γ
eq. 7.6
EOE EOE waterγ
EtOH OcOH
γ γK
γ γ
eq. 7.7
where superscripts DEE and EOE refer to EtOH dehydration to DEE and water (hereinafter
referred to as DEE synthesis reaction); and EOE refer to OcOH and EtOH dehydration to EOE
and water (EOE synthesis reaction). Kx was calculated by the use of molar fractions,
DEE DEE waterx 2
EtOH
x xK
x
eq. 7.8
EOE EOE waterx
EtOH OcOH
x xK
x x
eq. 7.9
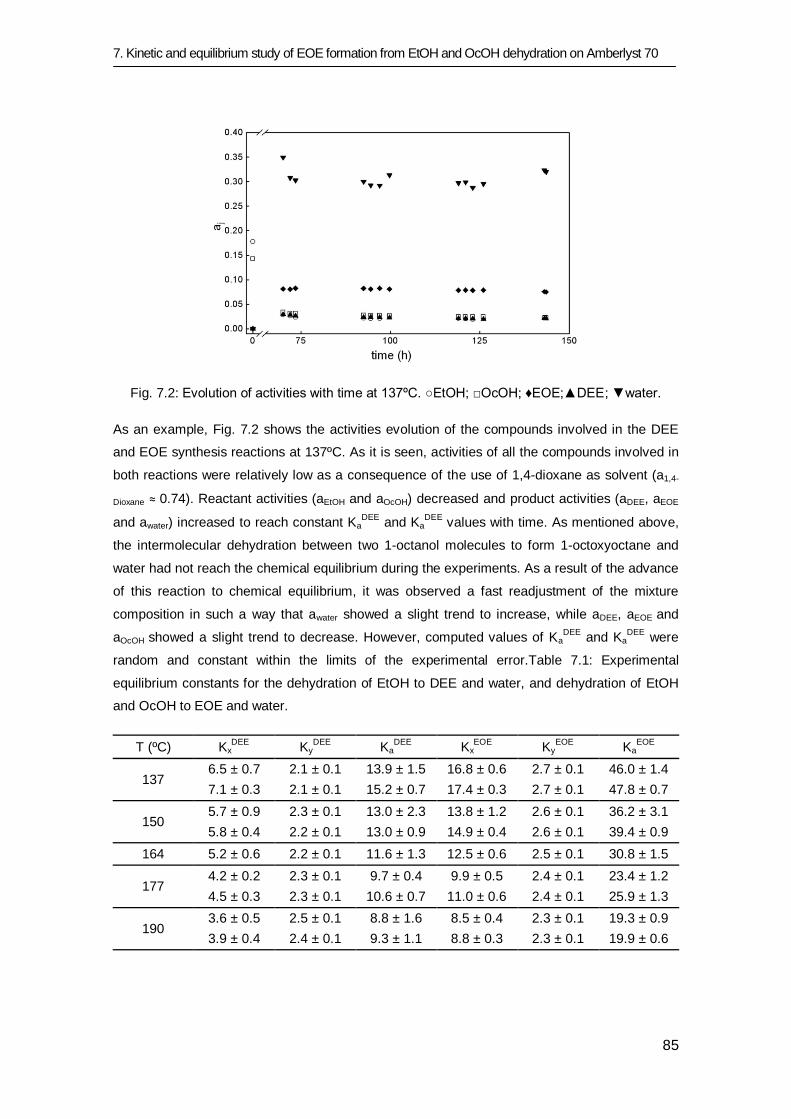
7. Kinetic and equilibrium study of EOE formation from EtOH and OcOH dehydration on Amberlyst 70
85
Fig. 7.2: Evolution of activities with time at 137ºC. ○EtOH; □OcOH; ♦EOE;▲DEE; ▼water.
As an example, Fig. 7.2 shows the activities evolution of the compounds involved in the DEE
and EOE synthesis reactions at 137ºC. As it is seen, activities of all the compounds involved in
both reactions were relatively low as a consequence of the use of 1,4-dioxane as solvent (a1,4-
Dioxane ≈ 0.74). Reactant activities (aEtOH and aOcOH) decreased and product activities (aDEE, aEOE
and awater) increased to reach constant KaDEE
and KaDEE
values with time. As mentioned above,
the intermolecular dehydration between two 1-octanol molecules to form 1-octoxyoctane and
water had not reach the chemical equilibrium during the experiments. As a result of the advance
of this reaction to chemical equilibrium, it was observed a fast readjustment of the mixture
composition in such a way that awater showed a slight trend to increase, while aDEE, aEOE and
aOcOH showed a slight trend to decrease. However, computed values of KaDEE
and KaDEE
were
random and constant within the limits of the experimental error.Table 7.1: Experimental
equilibrium constants for the dehydration of EtOH to DEE and water, and dehydration of EtOH
and OcOH to EOE and water.
T (ºC) KxDEE
KyDEE
KaDEE
KxEOE
KyEOE
KaEOE
137 6.5 ± 0.7 2.1 ± 0.1 13.9 ± 1.5 16.8 ± 0.6 2.7 ± 0.1 46.0 ± 1.4
7.1 ± 0.3 2.1 ± 0.1 15.2 ± 0.7 17.4 ± 0.3 2.7 ± 0.1 47.8 ± 0.7
150 5.7 ± 0.9 2.3 ± 0.1 13.0 ± 2.3 13.8 ± 1.2 2.6 ± 0.1 36.2 ± 3.1
5.8 ± 0.4 2.2 ± 0.1 13.0 ± 0.9 14.9 ± 0.4 2.6 ± 0.1 39.4 ± 0.9
164 5.2 ± 0.6 2.2 ± 0.1 11.6 ± 1.3 12.5 ± 0.6 2.5 ± 0.1 30.8 ± 1.5
177 4.2 ± 0.2 2.3 ± 0.1 9.7 ± 0.4 9.9 ± 0.5 2.4 ± 0.1 23.4 ± 1.2
4.5 ± 0.3 2.3 ± 0.1 10.6 ± 0.7 11.0 ± 0.6 2.4 ± 0.1 25.9 ± 1.3
190 3.6 ± 0.5 2.5 ± 0.1 8.8 ± 1.6 8.5 ± 0.4 2.3 ± 0.1 19.3 ± 0.9
3.9 ± 0.4 2.4 ± 0.1 9.3 ± 1.1 8.8 ± 0.3 2.3 ± 0.1 19.9 ± 0.6
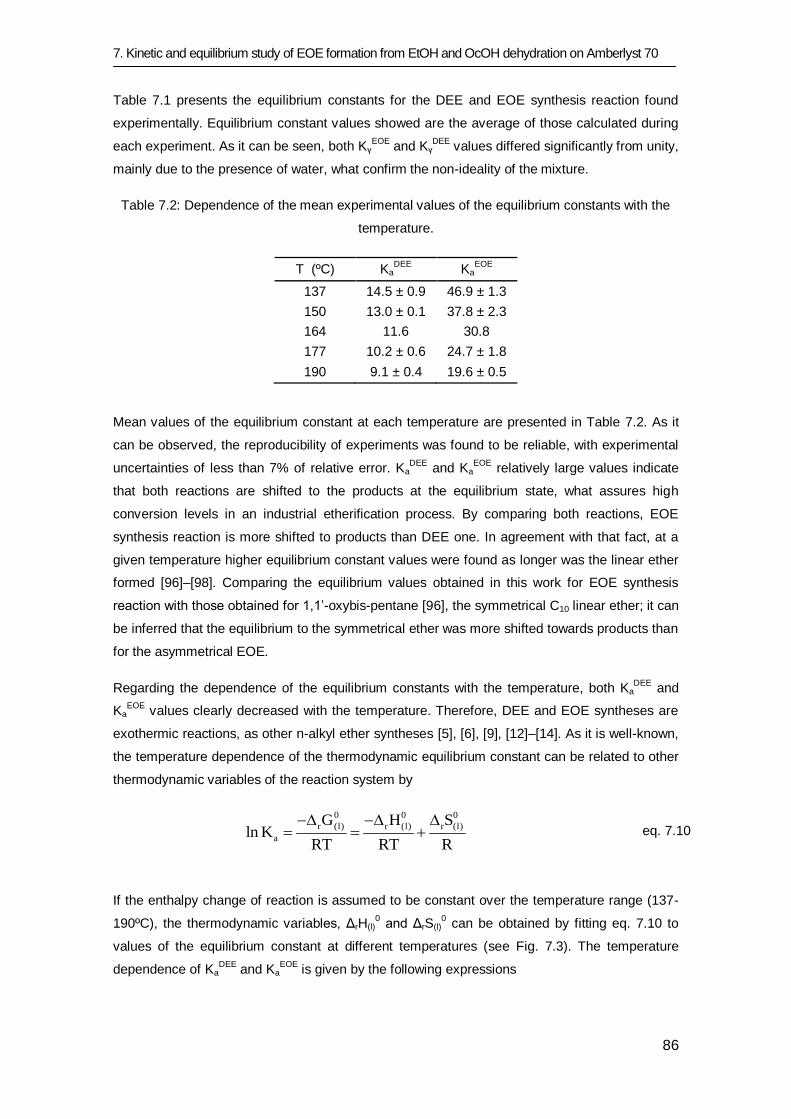
7. Kinetic and equilibrium study of EOE formation from EtOH and OcOH dehydration on Amberlyst 70
86
Table 7.1 presents the equilibrium constants for the DEE and EOE synthesis reaction found
experimentally. Equilibrium constant values showed are the average of those calculated during
each experiment. As it can be seen, both KγEOE
and KγDEE
values differed significantly from unity,
mainly due to the presence of water, what confirm the non-ideality of the mixture.
Table 7.2: Dependence of the mean experimental values of the equilibrium constants with the
temperature.
T (ºC) KaDEE
KaEOE
137 14.5 ± 0.9 46.9 ± 1.3
150 13.0 ± 0.1 37.8 ± 2.3
164 11.6 30.8
177 10.2 ± 0.6 24.7 ± 1.8
190 9.1 ± 0.4 19.6 ± 0.5
Mean values of the equilibrium constant at each temperature are presented in Table 7.2. As it
can be observed, the reproducibility of experiments was found to be reliable, with experimental
uncertainties of less than 7% of relative error. KaDEE
and Ka
EOE relatively large values indicate
that both reactions are shifted to the products at the equilibrium state, what assures high
conversion levels in an industrial etherification process. By comparing both reactions, EOE
synthesis reaction is more shifted to products than DEE one. In agreement with that fact, at a
given temperature higher equilibrium constant values were found as longer was the linear ether
formed [96]–[98]. Comparing the equilibrium values obtained in this work for EOE synthesis
reaction with those obtained for 1,1’-oxybis-pentane [96], the symmetrical C10 linear ether; it can
be inferred that the equilibrium to the symmetrical ether was more shifted towards products than
for the asymmetrical EOE.
Regarding the dependence of the equilibrium constants with the temperature, both KaDEE
and
KaEOE
values clearly decreased with the temperature. Therefore, DEE and EOE syntheses are
exothermic reactions, as other n-alkyl ether syntheses [5], [6], [9], [12]–[14]. As it is well-known,
the temperature dependence of the thermodynamic equilibrium constant can be related to other
thermodynamic variables of the reaction system by
0 0 0
r (l) r (l) r (l)
a
G H Sln K
RT RT R
eq. 7.10
If the enthalpy change of reaction is assumed to be constant over the temperature range (137-
190ºC), the thermodynamic variables, ΔrH(l)0 and ΔrS(l)
0 can be obtained by fitting eq. 7.10 to
values of the equilibrium constant at different temperatures (see Fig. 7.3). The temperature
dependence of KaDEE
and KaEOE
is given by the following expressions
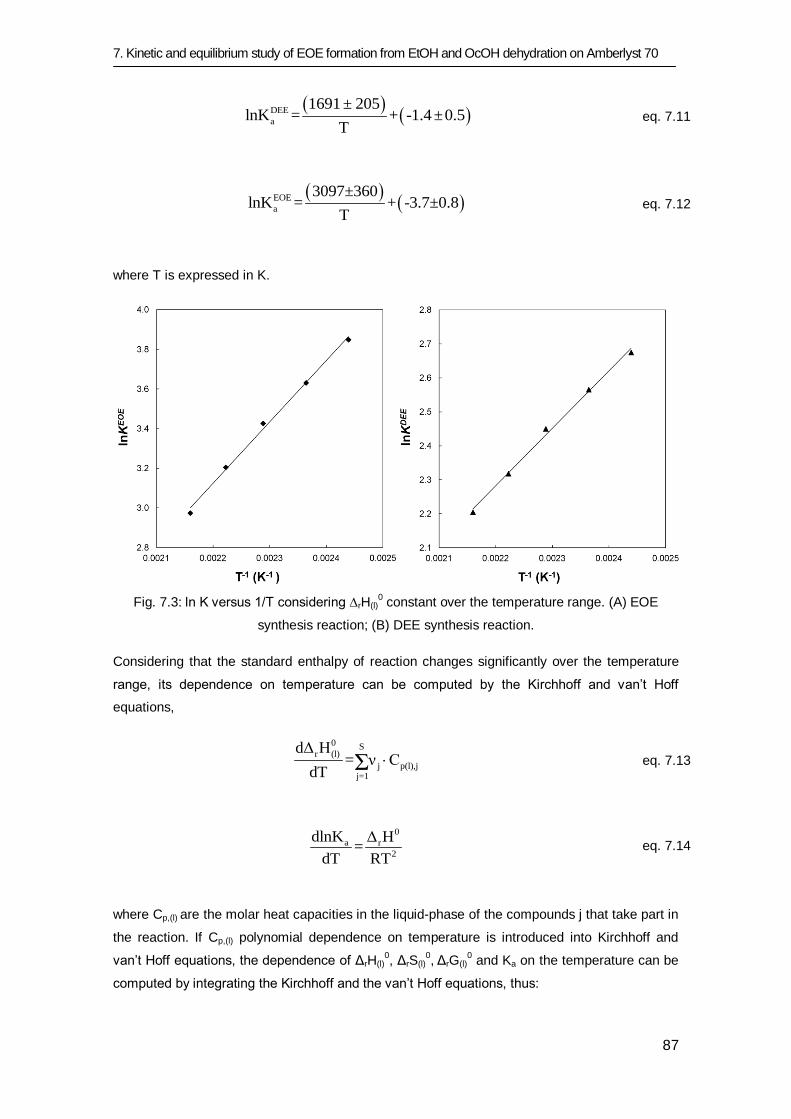
7. Kinetic and equilibrium study of EOE formation from EtOH and OcOH dehydration on Amberlyst 70
87
DEE
a
1691 ± 205lnK = + -1.4 ±0.5
T eq. 7.11
EOE
a
3097±360lnK = + -3.7±0.8
T eq. 7.12
where T is expressed in K.
Fig. 7.3: ln K versus 1/T considering ∆rH(l)0 constant over the temperature range. (A) EOE
synthesis reaction; (B) DEE synthesis reaction.
Considering that the standard enthalpy of reaction changes significantly over the temperature
range, its dependence on temperature can be computed by the Kirchhoff and van’t Hoff
equations,
0 Sr (l)
j p(l),jj=1
dΔ H= ν C
dTΣ eq. 7.13
0
a r
2
dlnK Δ H=
dT RT eq. 7.14
where Cp,(l) are the molar heat capacities in the liquid-phase of the compounds j that take part in
the reaction. If Cp,(l) polynomial dependence on temperature is introduced into Kirchhoff and
van’t Hoff equations, the dependence of ΔrH(l)0, ΔrS(l)
0, ΔrG(l)
0 and Ka on the temperature can be
computed by integrating the Kirchhoff and the van’t Hoff equations, thus:
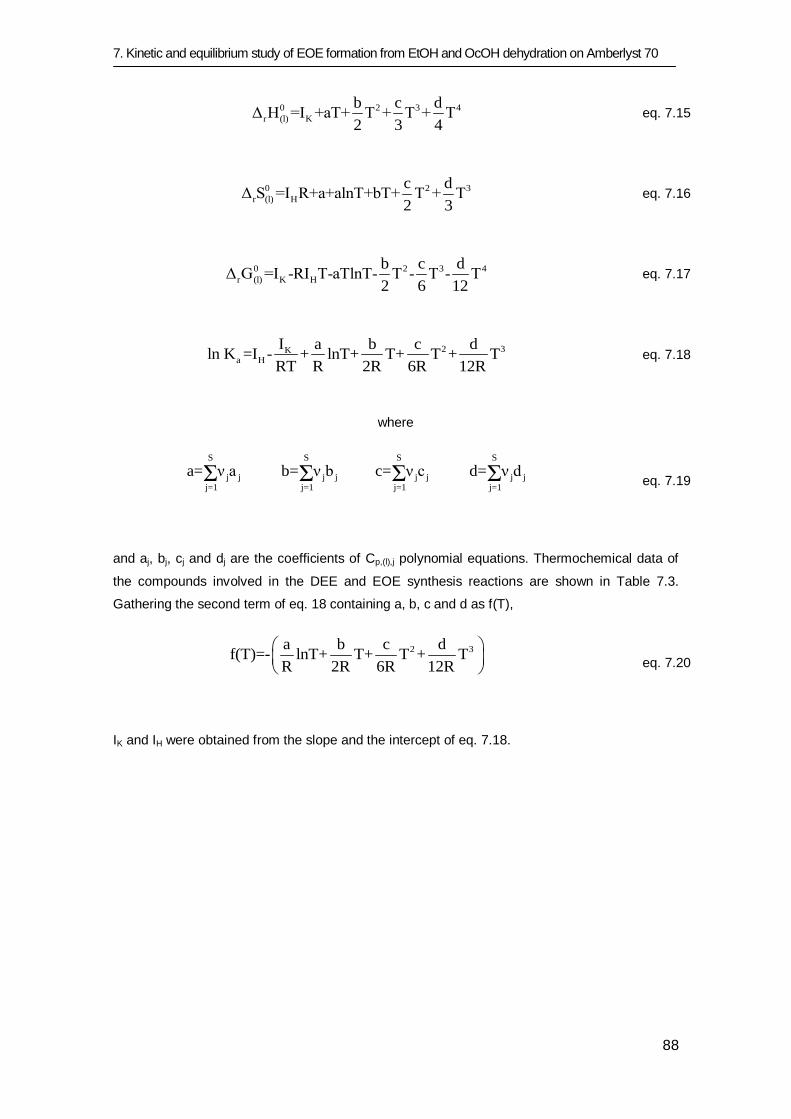
7. Kinetic and equilibrium study of EOE formation from EtOH and OcOH dehydration on Amberlyst 70
88
0 2 3 4
r (l) K
b c dΔ H =I +aT+ T + T + T
2 3 4 eq. 7.15
0 2 3
r (l) H
c dΔ S =I R+a+alnT+bT+ T + T
2 3 eq. 7.16
0 2 3 4
r (l) K H
b c dΔ G =I -RI T-aTlnT- T - T - T
2 6 12 eq. 7.17
2 3Ka H
I a b c dln K =I - + lnT+ T+ T + T
RT R 2R 6R 12R eq. 7.18
where
S
j jj=1
a= ν aΣ
S
j jj=1
b= ν bΣ
S
j jj=1
c= ν cΣ
S
j jj=1
d= ν dΣ
eq. 7.19
and aj, bj, cj and dj are the coefficients of Cp,(l),j polynomial equations. Thermochemical data of
the compounds involved in the DEE and EOE synthesis reactions are shown in Table 7.3.
Gathering the second term of eq. 18 containing a, b, c and d as f(T),
2 3a b c df(T)=- lnT+ T+ T + T
R 2R 6R 12R
eq. 7.20
IK and IH were obtained from the slope and the intercept of eq. 7.18.
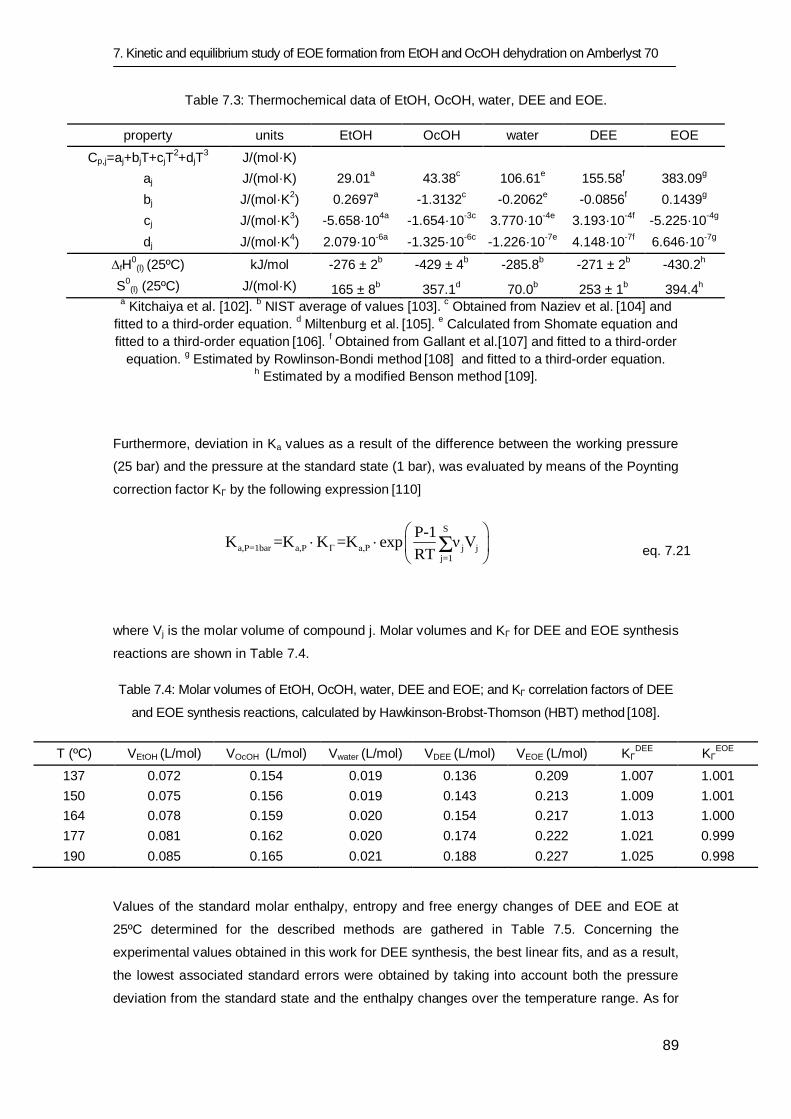
7. Kinetic and equilibrium study of EOE formation from EtOH and OcOH dehydration on Amberlyst 70
89
Table 7.3: Thermochemical data of EtOH, OcOH, water, DEE and EOE.
property units EtOH OcOH water DEE EOE
Cp,j=aj+bjT+cjT2+djT
3 J/(mol·K)
aj J/(mol·K) 29.01
a 43.38
c 106.61
e 155.58
f 383.09
g
bj J/(mol·K2) 0.2697
a -1.3132
c -0.2062
e -0.0856
f 0.1439
g
cj J/(mol·K3) -5.658·10
4a -1.654·10
-3c 3.770·10
-4e 3.193·10
-4f -5.225·10
-4g
dj J/(mol·K4) 2.079·10
-6a -1.325·10
-6c -1.226·10
-7e 4.148·10
-7f 6.646·10
-7g
∆fH0(l) (25ºC) kJ/mol -276 ± 2
b -429 ± 4
b -285.8
b -271 ± 2
b -430.2
h
S0
(l) (25ºC) J/(mol·K) 165 ± 8b 357.1
d 70.0
b 253 ± 1
b 394.4
h
a Kitchaiya et al. [102].
b NIST average of values [103].
c Obtained from Naziev et al.
[104] and
fitted to a third-order equation. d Miltenburg et al.
[105].
e Calculated from Shomate equation and
fitted to a third-order equation [106].
f Obtained from Gallant et al.[107] and fitted to a third-order
equation. g Estimated by Rowlinson-Bondi method
[108] and fitted to a third-order equation.
h Estimated by a modified Benson method
[109].
Furthermore, deviation in Ka values as a result of the difference between the working pressure
(25 bar) and the pressure at the standard state (1 bar), was evaluated by means of the Poynting
correction factor KΓ by the following expression [110]
S
a,P=1bar a,P Γ a,P j jj=1
P-1K =K K =K exp ν V
RTΣ
eq. 7.21
where Vj is the molar volume of compound j. Molar volumes and KΓ for DEE and EOE synthesis
reactions are shown in Table 7.4.
Table 7.4: Molar volumes of EtOH, OcOH, water, DEE and EOE; and KΓ correlation factors of DEE
and EOE synthesis reactions, calculated by Hawkinson-Brobst-Thomson (HBT) method [108].
T (ºC) VEtOH (L/mol) VOcOH (L/mol) Vwater (L/mol) VDEE (L/mol) VEOE (L/mol) KΓDEE
KΓEOE
137 0.072 0.154 0.019 0.136 0.209 1.007 1.001
150 0.075 0.156 0.019 0.143 0.213 1.009 1.001
164 0.078 0.159 0.020 0.154 0.217 1.013 1.000
177 0.081 0.162 0.020 0.174 0.222 1.021 0.999
190 0.085 0.165 0.021 0.188 0.227 1.025 0.998
Values of the standard molar enthalpy, entropy and free energy changes of DEE and EOE at
25ºC determined for the described methods are gathered in Table 7.5. Concerning the
experimental values obtained in this work for DEE synthesis, the best linear fits, and as a result,
the lowest associated standard errors were obtained by taking into account both the pressure
deviation from the standard state and the enthalpy changes over the temperature range. As for
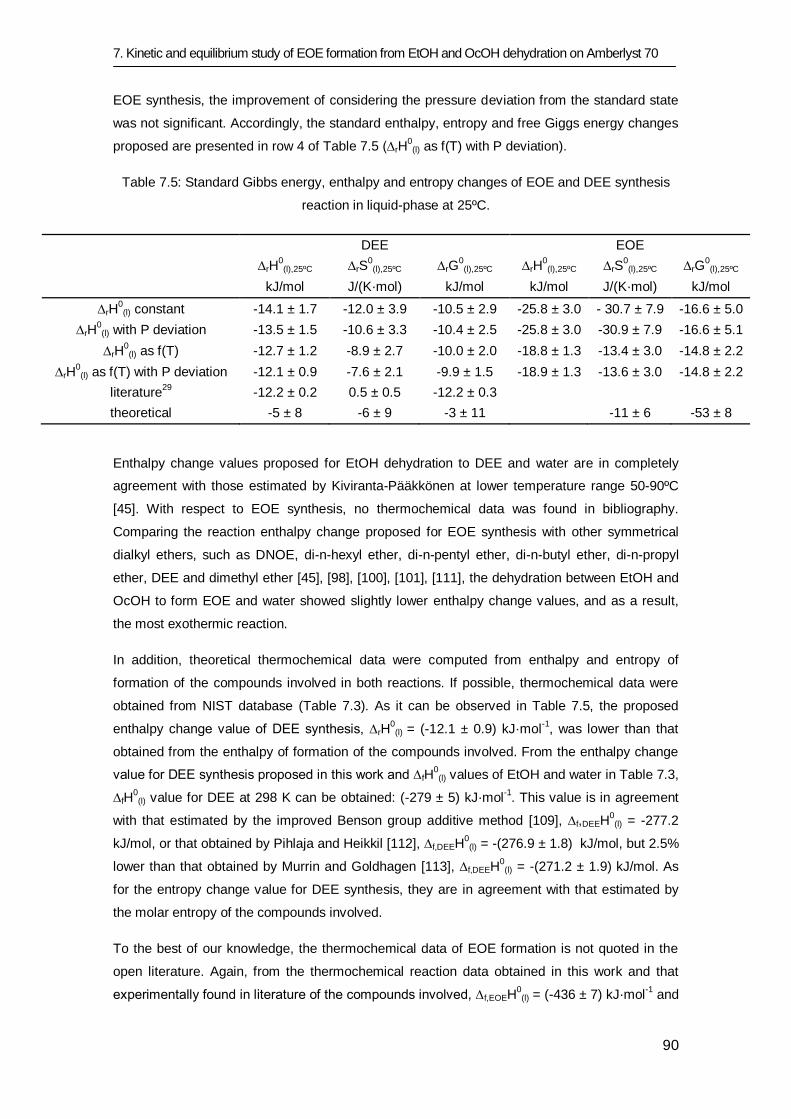
7. Kinetic and equilibrium study of EOE formation from EtOH and OcOH dehydration on Amberlyst 70
90
EOE synthesis, the improvement of considering the pressure deviation from the standard state
was not significant. Accordingly, the standard enthalpy, entropy and free Giggs energy changes
proposed are presented in row 4 of Table 7.5 (∆rH0(l) as f(T) with P deviation).
Table 7.5: Standard Gibbs energy, enthalpy and entropy changes of EOE and DEE synthesis
reaction in liquid-phase at 25ºC.
DEE EOE
∆rH
0(l),25ºC ∆rS
0(l),25ºC ∆rG
0(l),25ºC ∆rH
0(l),25ºC ∆rS
0(l),25ºC ∆rG
0(l),25ºC
kJ/mol J/(K·mol) kJ/mol kJ/mol J/(K·mol) kJ/mol
∆rH0(l) constant -14.1 ± 1.7 -12.0 ± 3.9 -10.5 ± 2.9 -25.8 ± 3.0 - 30.7 ± 7.9 -16.6 ± 5.0
∆rH0(l) with P deviation -13.5 ± 1.5 -10.6 ± 3.3 -10.4 ± 2.5 -25.8 ± 3.0 -30.9 ± 7.9 -16.6 ± 5.1
∆rH0
(l) as f(T) -12.7 ± 1.2 -8.9 ± 2.7 -10.0 ± 2.0 -18.8 ± 1.3 -13.4 ± 3.0 -14.8 ± 2.2
∆rH0(l) as f(T) with P deviation -12.1 ± 0.9 -7.6 ± 2.1 -9.9 ± 1.5 -18.9 ± 1.3 -13.6 ± 3.0 -14.8 ± 2.2
literature29
-12.2 ± 0.2 0.5 ± 0.5 -12.2 ± 0.3
theoretical -5 ± 8 -6 ± 9 -3 ± 11 -11 ± 6 -53 ± 8
Enthalpy change values proposed for EtOH dehydration to DEE and water are in completely
agreement with those estimated by Kiviranta-Pääkkönen at lower temperature range 50-90ºC
[45]. With respect to EOE synthesis, no thermochemical data was found in bibliography.
Comparing the reaction enthalpy change proposed for EOE synthesis with other symmetrical
dialkyl ethers, such as DNOE, di-n-hexyl ether, di-n-pentyl ether, di-n-butyl ether, di-n-propyl
ether, DEE and dimethyl ether [45], [98], [100], [101], [111], the dehydration between EtOH and
OcOH to form EOE and water showed slightly lower enthalpy change values, and as a result,
the most exothermic reaction.
In addition, theoretical thermochemical data were computed from enthalpy and entropy of
formation of the compounds involved in both reactions. If possible, thermochemical data were
obtained from NIST database (Table 7.3). As it can be observed in Table 7.5, the proposed
enthalpy change value of DEE synthesis, ∆rH0(l) = (-12.1 ± 0.9) kJ·mol
-1, was lower than that
obtained from the enthalpy of formation of the compounds involved. From the enthalpy change
value for DEE synthesis proposed in this work and ∆fH0(l) values of EtOH and water in Table 7.3,
∆fH0(l) value for DEE at 298 K can be obtained: (-279 ± 5) kJ·mol
-1. This value is in agreement
with that estimated by the improved Benson group additive method [109], ∆f,DEEH0(l) = -277.2
kJ/mol, or that obtained by Pihlaja and Heikkil [112], ∆f,DEEH0(l) = -(276.9 ± 1.8) kJ/mol, but 2.5%
lower than that obtained by Murrin and Goldhagen [113], ∆f,DEEH0(l) = -(271.2 ± 1.9) kJ/mol. As
for the entropy change value for DEE synthesis, they are in agreement with that estimated by
the molar entropy of the compounds involved.
To the best of our knowledge, the thermochemical data of EOE formation is not quoted in the
open literature. Again, from the thermochemical reaction data obtained in this work and that
experimentally found in literature of the compounds involved, ∆f,EOEH0(l) = (-436 ± 7) kJ·mol
-1 and
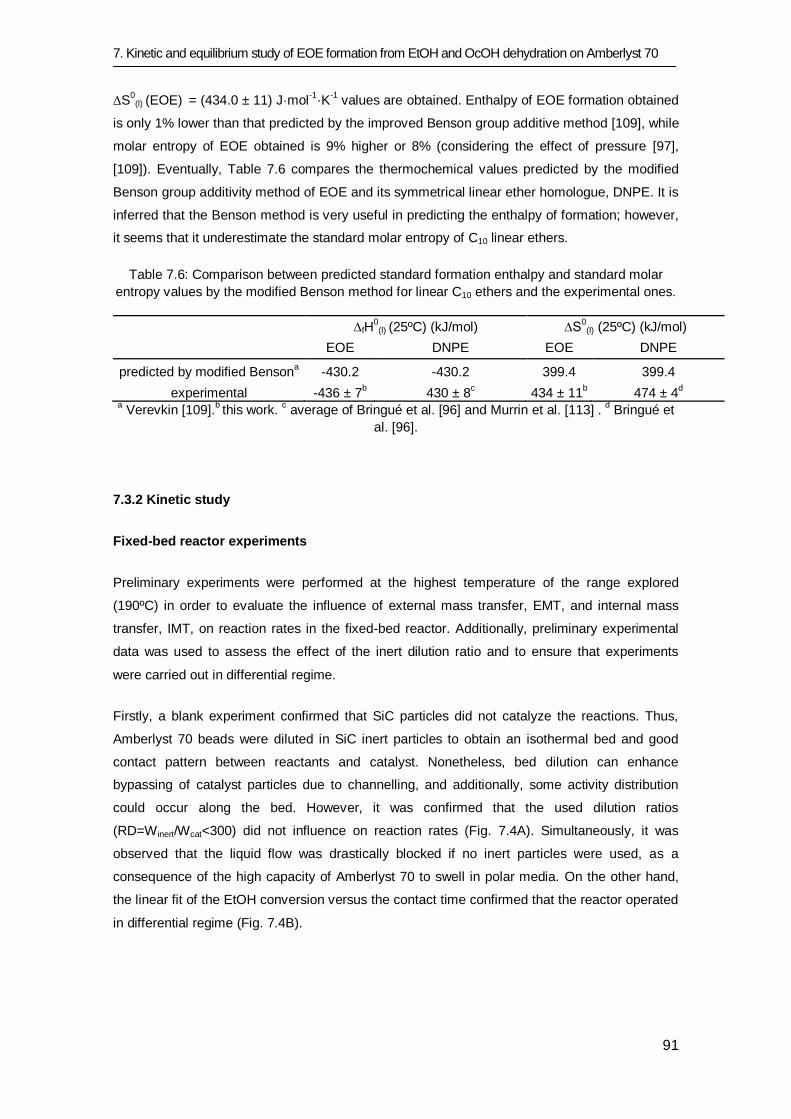
7. Kinetic and equilibrium study of EOE formation from EtOH and OcOH dehydration on Amberlyst 70
91
∆S0(l) (EOE) = (434.0 ± 11) J·mol
-1·K
-1 values are obtained. Enthalpy of EOE formation obtained
is only 1% lower than that predicted by the improved Benson group additive method [109], while
molar entropy of EOE obtained is 9% higher or 8% (considering the effect of pressure [97],
[109]). Eventually, Table 7.6 compares the thermochemical values predicted by the modified
Benson group additivity method of EOE and its symmetrical linear ether homologue, DNPE. It is
inferred that the Benson method is very useful in predicting the enthalpy of formation; however,
it seems that it underestimate the standard molar entropy of C10 linear ethers.
Table 7.6: Comparison between predicted standard formation enthalpy and standard molar
entropy values by the modified Benson method for linear C10 ethers and the experimental ones.
∆fH0
(l) (25ºC) (kJ/mol) ∆S0(l) (25ºC) (kJ/mol)
EOE DNPE EOE DNPE
predicted by modified Bensona -430.2 -430.2 399.4 399.4
experimental -436 ± 7b 430 ± 8
c 434 ± 11
b 474 ± 4
d
a Verevkin [109].
b this work.
c average of Bringué et al. [96] and Murrin et al. [113] .
d Bringué et
al. [96].
7.3.2 Kinetic study
Fixed-bed reactor experiments
Preliminary experiments were performed at the highest temperature of the range explored
(190ºC) in order to evaluate the influence of external mass transfer, EMT, and internal mass
transfer, IMT, on reaction rates in the fixed-bed reactor. Additionally, preliminary experimental
data was used to assess the effect of the inert dilution ratio and to ensure that experiments
were carried out in differential regime.
Firstly, a blank experiment confirmed that SiC particles did not catalyze the reactions. Thus,
Amberlyst 70 beads were diluted in SiC inert particles to obtain an isothermal bed and good
contact pattern between reactants and catalyst. Nonetheless, bed dilution can enhance
bypassing of catalyst particles due to channelling, and additionally, some activity distribution
could occur along the bed. However, it was confirmed that the used dilution ratios
(RD=Winert/Wcat<300) did not influence on reaction rates (Fig. 7.4A). Simultaneously, it was
observed that the liquid flow was drastically blocked if no inert particles were used, as a
consequence of the high capacity of Amberlyst 70 to swell in polar media. On the other hand,
the linear fit of the EtOH conversion versus the contact time confirmed that the reactor operated
in differential regime (Fig. 7.4B).
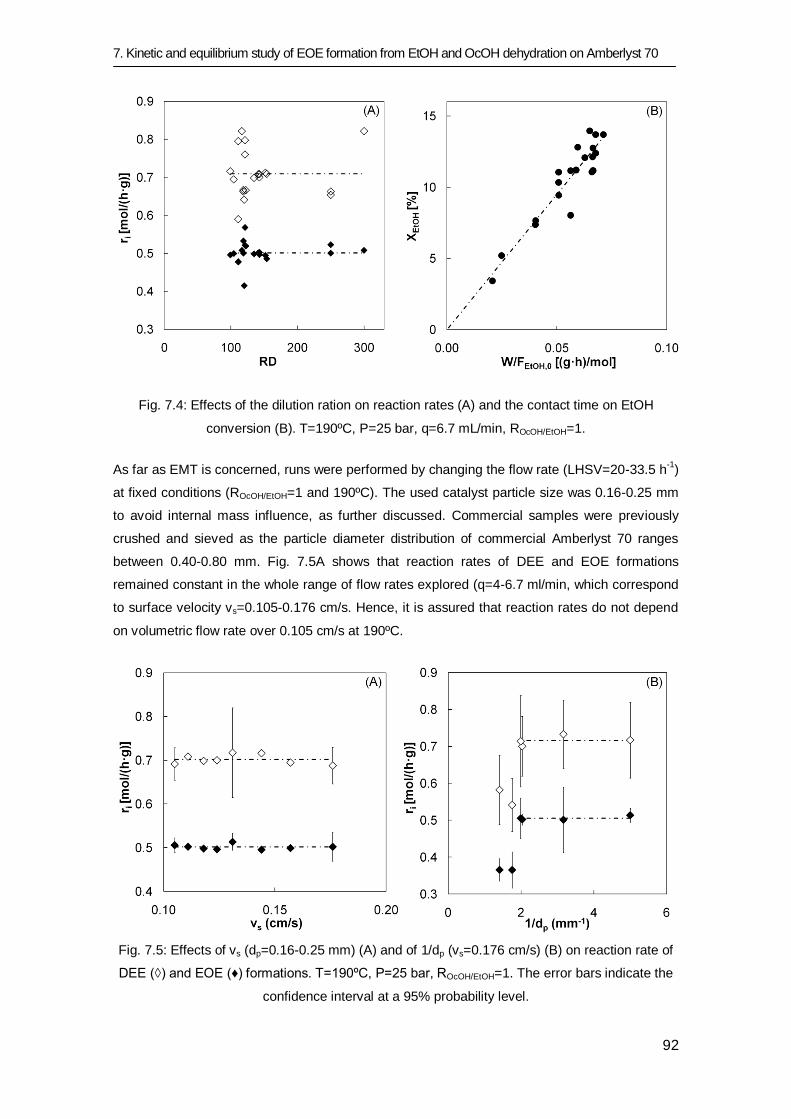
7. Kinetic and equilibrium study of EOE formation from EtOH and OcOH dehydration on Amberlyst 70
92
Fig. 7.4: Effects of the dilution ration on reaction rates (A) and the contact time on EtOH
conversion (B). T=190ºC, P=25 bar, q=6.7 mL/min, ROcOH/EtOH=1.
As far as EMT is concerned, runs were performed by changing the flow rate (LHSV=20-33.5 h-1
)
at fixed conditions (ROcOH/EtOH=1 and 190ºC). The used catalyst particle size was 0.16-0.25 mm
to avoid internal mass influence, as further discussed. Commercial samples were previously
crushed and sieved as the particle diameter distribution of commercial Amberlyst 70 ranges
between 0.40-0.80 mm. Fig. 7.5A shows that reaction rates of DEE and EOE formations
remained constant in the whole range of flow rates explored (q=4-6.7 ml/min, which correspond
to surface velocity vs=0.105-0.176 cm/s. Hence, it is assured that reaction rates do not depend
on volumetric flow rate over 0.105 cm/s at 190ºC.
Fig. 7.5: Effects of vs (dp=0.16-0.25 mm) (A) and of 1/dp (vs=0.176 cm/s) (B) on reaction rate of
DEE (◊) and EOE (♦) formations. T=190ºC, P=25 bar, ROcOH/EtOH=1. The error bars indicate the
confidence interval at a 95% probability level.
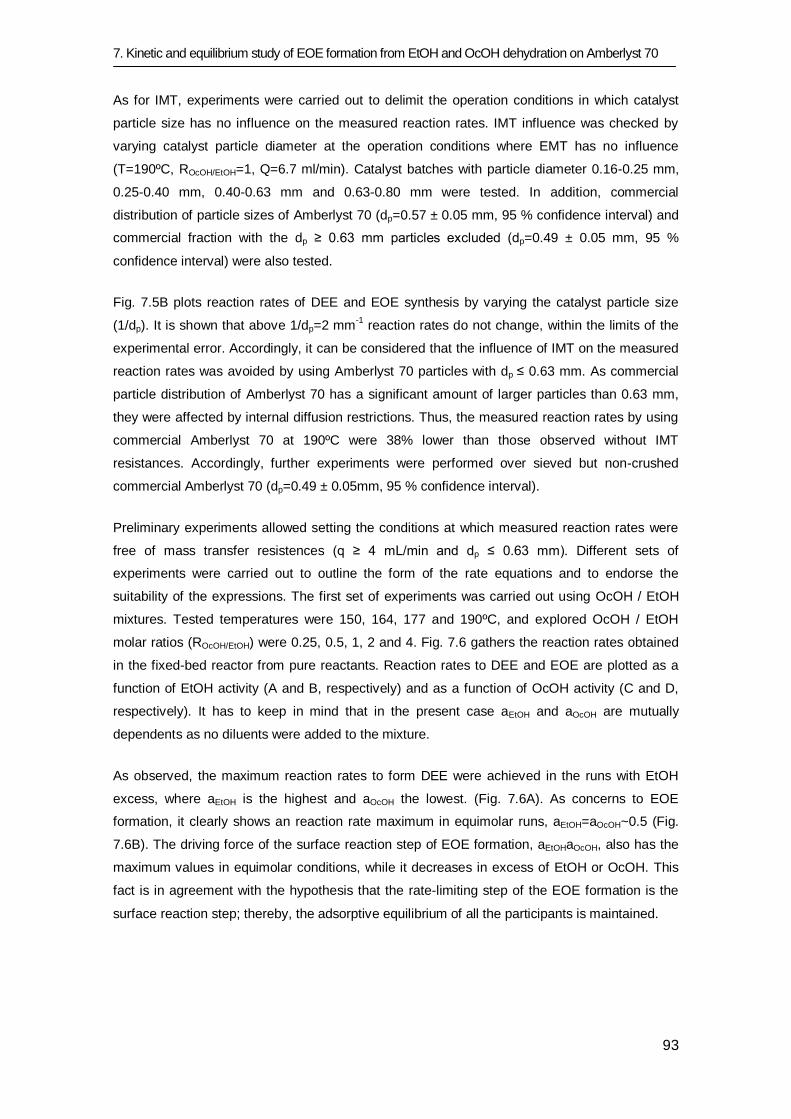
7. Kinetic and equilibrium study of EOE formation from EtOH and OcOH dehydration on Amberlyst 70
93
As for IMT, experiments were carried out to delimit the operation conditions in which catalyst
particle size has no influence on the measured reaction rates. IMT influence was checked by
varying catalyst particle diameter at the operation conditions where EMT has no influence
(T=190ºC, ROcOH/EtOH=1, Q=6.7 ml/min). Catalyst batches with particle diameter 0.16-0.25 mm,
0.25-0.40 mm, 0.40-0.63 mm and 0.63-0.80 mm were tested. In addition, commercial
distribution of particle sizes of Amberlyst 70 (dp=0.57 ± 0.05 mm, 95 % confidence interval) and
commercial fraction with the dp ≥ 0.63 mm particles excluded (dp=0.49 ± 0.05 mm, 95 %
confidence interval) were also tested.
Fig. 7.5B plots reaction rates of DEE and EOE synthesis by varying the catalyst particle size
(1/dp). It is shown that above 1/dp=2 mm-1
reaction rates do not change, within the limits of the
experimental error. Accordingly, it can be considered that the influence of IMT on the measured
reaction rates was avoided by using Amberlyst 70 particles with dp ≤ 0.63 mm. As commercial
particle distribution of Amberlyst 70 has a significant amount of larger particles than 0.63 mm,
they were affected by internal diffusion restrictions. Thus, the measured reaction rates by using
commercial Amberlyst 70 at 190ºC were 38% lower than those observed without IMT
resistances. Accordingly, further experiments were performed over sieved but non-crushed
commercial Amberlyst 70 (dp=0.49 ± 0.05mm, 95 % confidence interval).
Preliminary experiments allowed setting the conditions at which measured reaction rates were
free of mass transfer resistences (q ≥ 4 mL/min and dp ≤ 0.63 mm). Different sets of
experiments were carried out to outline the form of the rate equations and to endorse the
suitability of the expressions. The first set of experiments was carried out using OcOH / EtOH
mixtures. Tested temperatures were 150, 164, 177 and 190ºC, and explored OcOH / EtOH
molar ratios (ROcOH/EtOH) were 0.25, 0.5, 1, 2 and 4. Fig. 7.6 gathers the reaction rates obtained
in the fixed-bed reactor from pure reactants. Reaction rates to DEE and EOE are plotted as a
function of EtOH activity (A and B, respectively) and as a function of OcOH activity (C and D,
respectively). It has to keep in mind that in the present case aEtOH and aOcOH are mutually
dependents as no diluents were added to the mixture.
As observed, the maximum reaction rates to form DEE were achieved in the runs with EtOH
excess, where aEtOH is the highest and aOcOH the lowest. (Fig. 7.6A). As concerns to EOE
formation, it clearly shows an reaction rate maximum in equimolar runs, aEtOH=aOcOH~0.5 (Fig.
7.6B). The driving force of the surface reaction step of EOE formation, aEtOHaOcOH, also has the
maximum values in equimolar conditions, while it decreases in excess of EtOH or OcOH. This
fact is in agreement with the hypothesis that the rate-limiting step of the EOE formation is the
surface reaction step; thereby, the adsorptive equilibrium of all the participants is maintained.
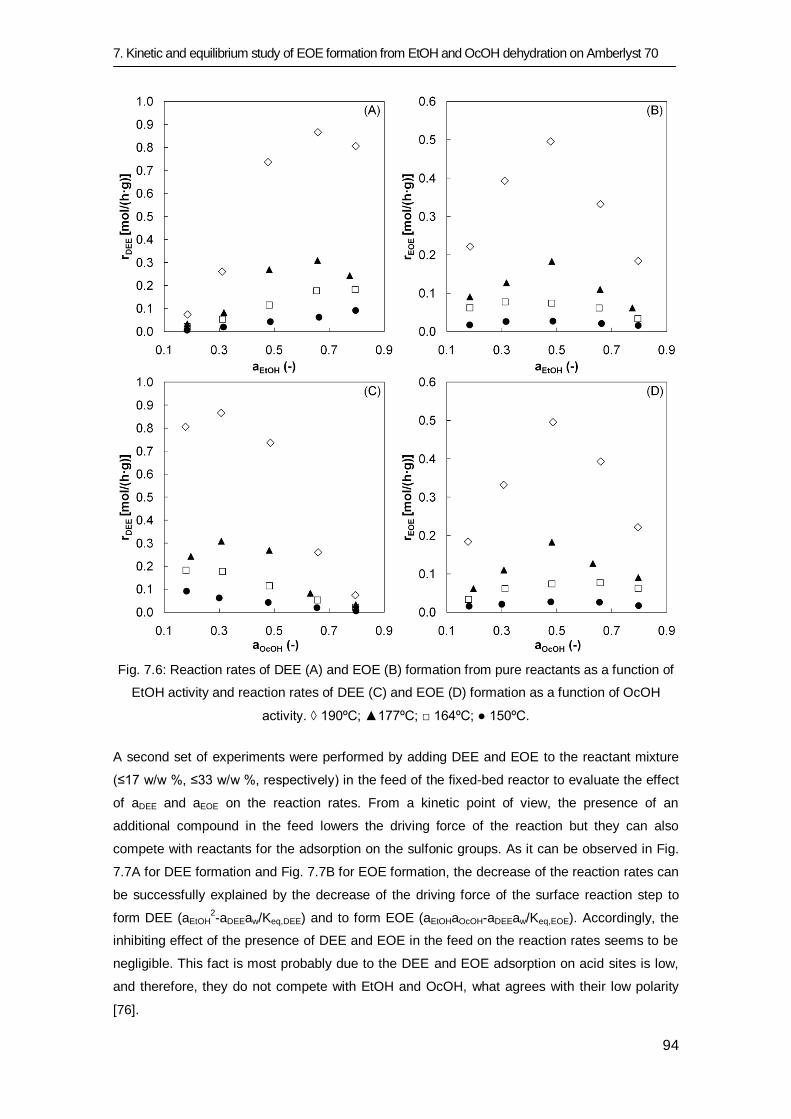
7. Kinetic and equilibrium study of EOE formation from EtOH and OcOH dehydration on Amberlyst 70
94
Fig. 7.6: Reaction rates of DEE (A) and EOE (B) formation from pure reactants as a function of
EtOH activity and reaction rates of DEE (C) and EOE (D) formation as a function of OcOH
activity. ◊ 190ºC; ▲177ºC; □ 164ºC; ● 150ºC.
A second set of experiments were performed by adding DEE and EOE to the reactant mixture
(≤17 w/w %, ≤33 w/w %, respectively) in the feed of the fixed-bed reactor to evaluate the effect
of aDEE and aEOE on the reaction rates. From a kinetic point of view, the presence of an
additional compound in the feed lowers the driving force of the reaction but they can also
compete with reactants for the adsorption on the sulfonic groups. As it can be observed in Fig.
7.7A for DEE formation and Fig. 7.7B for EOE formation, the decrease of the reaction rates can
be successfully explained by the decrease of the driving force of the surface reaction step to
form DEE (aEtOH2-aDEEaw/Keq,DEE) and to form EOE (aEtOHaOcOH-aDEEaw/Keq,EOE). Accordingly, the
inhibiting effect of the presence of DEE and EOE in the feed on the reaction rates seems to be
negligible. This fact is most probably due to the DEE and EOE adsorption on acid sites is low,
and therefore, they do not compete with EtOH and OcOH, what agrees with their low polarity
[76].
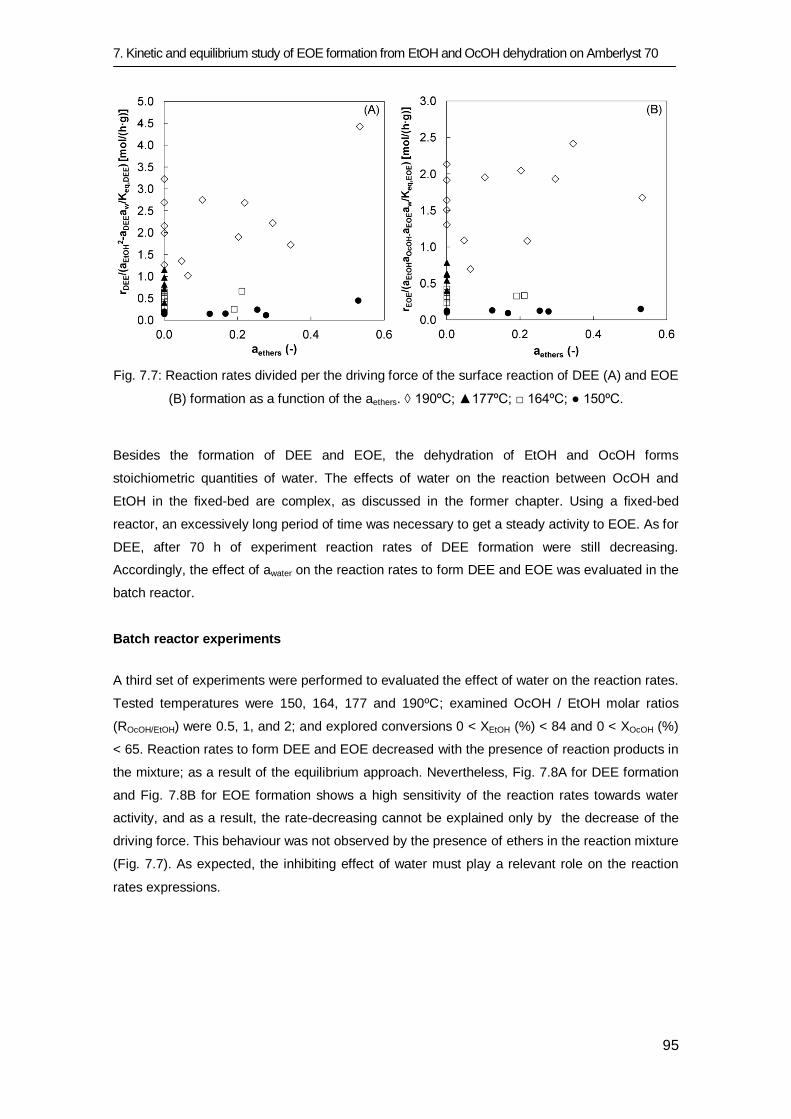
7. Kinetic and equilibrium study of EOE formation from EtOH and OcOH dehydration on Amberlyst 70
95
Fig. 7.7: Reaction rates divided per the driving force of the surface reaction of DEE (A) and EOE
(B) formation as a function of the aethers. ◊ 190ºC; ▲177ºC; □ 164ºC; ● 150ºC.
Besides the formation of DEE and EOE, the dehydration of EtOH and OcOH forms
stoichiometric quantities of water. The effects of water on the reaction between OcOH and
EtOH in the fixed-bed are complex, as discussed in the former chapter. Using a fixed-bed
reactor, an excessively long period of time was necessary to get a steady activity to EOE. As for
DEE, after 70 h of experiment reaction rates of DEE formation were still decreasing.
Accordingly, the effect of awater on the reaction rates to form DEE and EOE was evaluated in the
batch reactor.
Batch reactor experiments
A third set of experiments were performed to evaluated the effect of water on the reaction rates.
Tested temperatures were 150, 164, 177 and 190ºC; examined OcOH / EtOH molar ratios
(ROcOH/EtOH) were 0.5, 1, and 2; and explored conversions 0 < XEtOH (%) < 84 and 0 < XOcOH (%)
< 65. Reaction rates to form DEE and EOE decreased with the presence of reaction products in
the mixture; as a result of the equilibrium approach. Nevertheless, Fig. 7.8A for DEE formation
and Fig. 7.8B for EOE formation shows a high sensitivity of the reaction rates towards water
activity, and as a result, the rate-decreasing cannot be explained only by the decrease of the
driving force. This behaviour was not observed by the presence of ethers in the reaction mixture
(Fig. 7.7). As expected, the inhibiting effect of water must play a relevant role on the reaction
rates expressions.
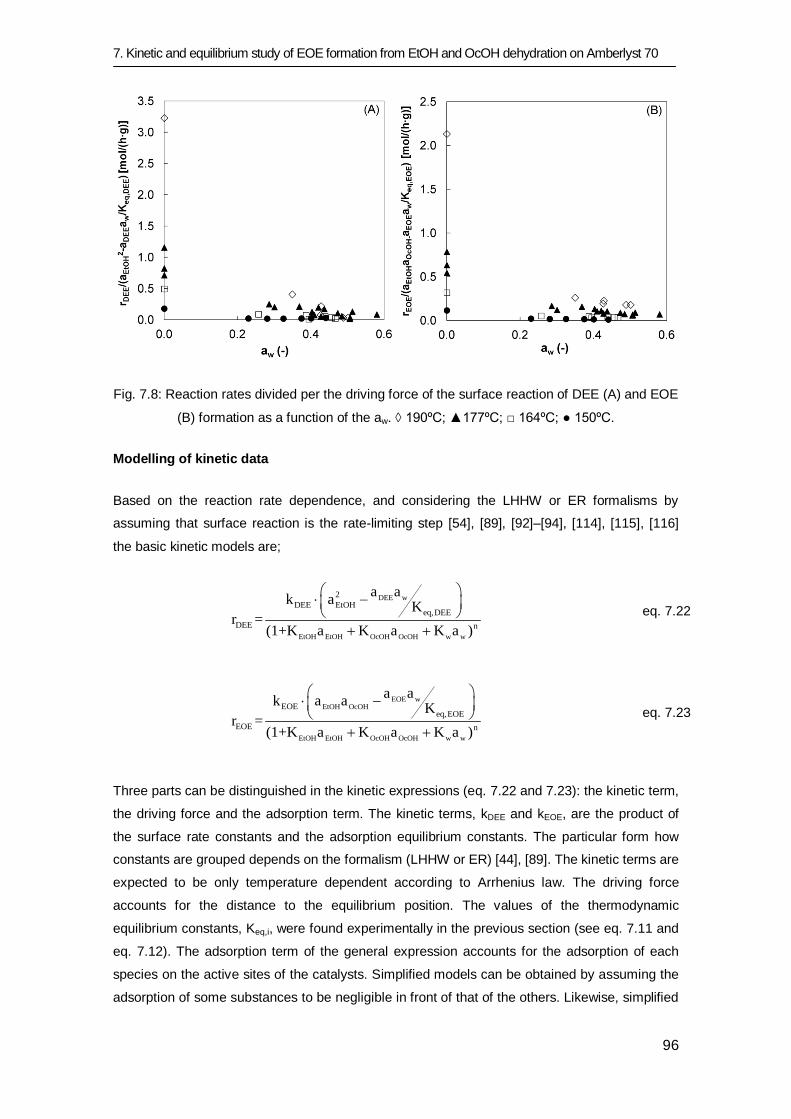
7. Kinetic and equilibrium study of EOE formation from EtOH and OcOH dehydration on Amberlyst 70
96
Fig. 7.8: Reaction rates divided per the driving force of the surface reaction of DEE (A) and EOE
(B) formation as a function of the aw. ◊ 190ºC; ▲177ºC; □ 164ºC; ● 150ºC.
Modelling of kinetic data
Based on the reaction rate dependence, and considering the LHHW or ER formalisms by
assuming that surface reaction is the rate-limiting step [54], [89], [92]–[94], [114], [115], [116]
the basic kinetic models are;
DEE w
EtOH EtOH OcOH OcOH w w
2
DEE EtOHeq,DEE
DEE n
a ak a
Kr =
(1+K a K a K a )
eq. 7.22
EOE wEtOH OcOH
EtOH EtOH OcOH OcOH w w
EOEeq,EOE
EOE n
a ak a a
Kr =
(1+K a K a K a )
eq. 7.23
Three parts can be distinguished in the kinetic expressions (eq. 7.22 and 7.23): the kinetic term,
the driving force and the adsorption term. The kinetic terms, kDEE and kEOE, are the product of
the surface rate constants and the adsorption equilibrium constants. The particular form how
constants are grouped depends on the formalism (LHHW or ER) [44], [89]. The kinetic terms are
expected to be only temperature dependent according to Arrhenius law. The driving force
accounts for the distance to the equilibrium position. The values of the thermodynamic
equilibrium constants, Keq,i, were found experimentally in the previous section (see eq. 7.11 and
eq. 7.12). The adsorption term of the general expression accounts for the adsorption of each
species on the active sites of the catalysts. Simplified models can be obtained by assuming the
adsorption of some substances to be negligible in front of that of the others. Likewise, simplified
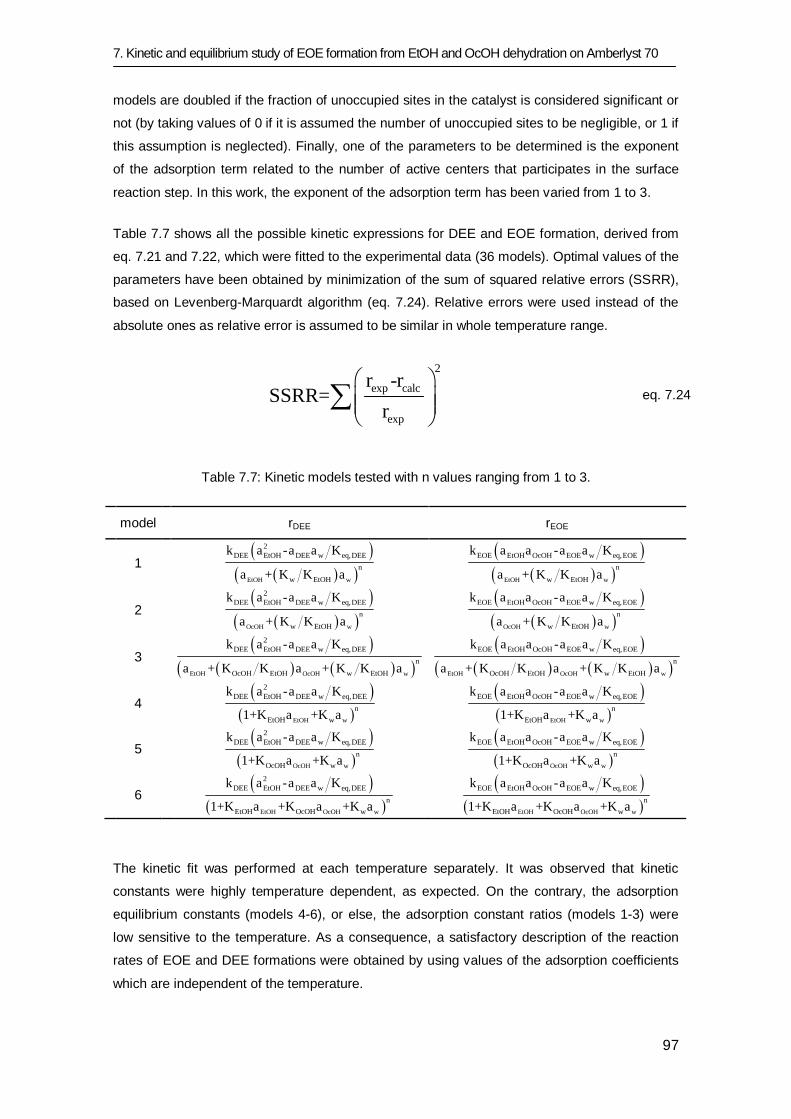
7. Kinetic and equilibrium study of EOE formation from EtOH and OcOH dehydration on Amberlyst 70
97
models are doubled if the fraction of unoccupied sites in the catalyst is considered significant or
not (by taking values of 0 if it is assumed the number of unoccupied sites to be negligible, or 1 if
this assumption is neglected). Finally, one of the parameters to be determined is the exponent
of the adsorption term related to the number of active centers that participates in the surface
reaction step. In this work, the exponent of the adsorption term has been varied from 1 to 3.
Table 7.7 shows all the possible kinetic expressions for DEE and EOE formation, derived from
eq. 7.21 and 7.22, which were fitted to the experimental data (36 models). Optimal values of the
parameters have been obtained by minimization of the sum of squared relative errors (SSRR),
based on Levenberg-Marquardt algorithm (eq. 7.24). Relative errors were used instead of the
absolute ones as relative error is assumed to be similar in whole temperature range.
2
exp calc
exp
r -rSSRR=
r
eq. 7.24
Table 7.7: Kinetic models tested with n values ranging from 1 to 3.
model
rDEE rEOE
1
EtOH w
2
DEE EtOH DEE w eq,DEE
n
w EtOH
k a -a a K
a + K K a
EtOH w
EOE EtOH OcOH EOE w eq,EOE
n
w EtOH
k a a -a a K
a + K K a
2
OcOH w
2
DEE EtOH DEE w eq,DEE
n
w EtOH
k a -a a K
a + K K a
OcOH w
EOE EtOH OcOH EOE w eq,EOE
n
w EtOH
k a a -a a K
a + K K a
3
EtOH OcOH w
2
DEE EtOH DEE w eq,DEE
n
OcOH EtOH w EtOH
k a -a a K
a + K K a + K K a
EtOH OcOH w
EOE EtOH OcOH EOE w eq,EOE
n
OcOH EtOH w EtOH
k a a -a a K
a + K K a + K K a
4
EtOH w
2
DEE EtOH DEE w eq,DEE
n
EtOH w
k a -a a K
1+K a +K a
EtOH w
EOE EtOH OcOH EOE w eq,EOE
n
EtOH w
k a a -a a K
1+K a +K a
5
OcOH w
2
DEE EtOH DEE w eq,DEE
n
OcOH w
k a -a a K
1+K a +K a
OcOH w
EOE EtOH OcOH EOE w eq,EOE
n
OcOH w
k a a -a a K
1+K a +K a
6
EtOH OcOH w
2
DEE EtOH DEE w eq,DEE
n
EtOH OcOH w
k a -a a K
1+K a +K a +K a
EtOH OcOH w
EOE EtOH OcOH EOE w eq,EOE
n
EtOH OcOH w
k a a -a a K
1+K a +K a +K a
The kinetic fit was performed at each temperature separately. It was observed that kinetic
constants were highly temperature dependent, as expected. On the contrary, the adsorption
equilibrium constants (models 4-6), or else, the adsorption constant ratios (models 1-3) were
low sensitive to the temperature. As a consequence, a satisfactory description of the reaction
rates of EOE and DEE formations were obtained by using values of the adsorption coefficients
which are independent of the temperature.
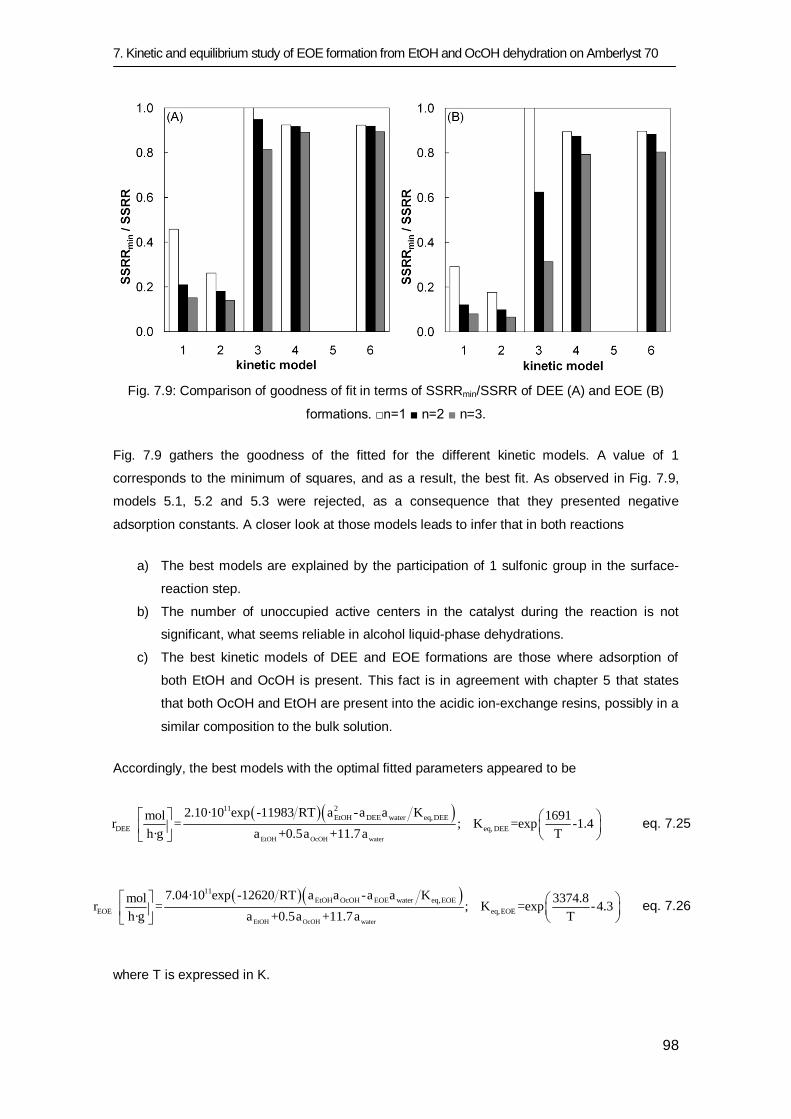
7. Kinetic and equilibrium study of EOE formation from EtOH and OcOH dehydration on Amberlyst 70
98
Fig. 7.9: Comparison of goodness of fit in terms of SSRRmin/SSRR of DEE (A) and EOE (B)
formations. □n=1 ■ n=2 ■ n=3.
Fig. 7.9 gathers the goodness of the fitted for the different kinetic models. A value of 1
corresponds to the minimum of squares, and as a result, the best fit. As observed in Fig. 7.9,
models 5.1, 5.2 and 5.3 were rejected, as a consequence that they presented negative
adsorption constants. A closer look at those models leads to infer that in both reactions
a) The best models are explained by the participation of 1 sulfonic group in the surface-
reaction step.
b) The number of unoccupied active centers in the catalyst during the reaction is not
significant, what seems reliable in alcohol liquid-phase dehydrations.
c) The best kinetic models of DEE and EOE formations are those where adsorption of
both EtOH and OcOH is present. This fact is in agreement with chapter 5 that states
that both OcOH and EtOH are present into the acidic ion-exchange resins, possibly in a
similar composition to the bulk solution.
Accordingly, the best models with the optimal fitted parameters appeared to be
EtOH OcOH water
11 2
EtOH DEE water eq,DEE
DEE eq, DEE
2.10·10 exp -11983 RT a -a a Kmol 1691r = ; K =exp -1.4
h·g a +0.5a +11.7a T
eq. 7.25
EtOH OcOH water
11
EtOH OcOH EOE water eq,EOE
EOE eq,EOE
7.04·10 exp -12620 RT a a -a a Kmol 3374.8r = ; K =exp -4.3
h·g a +0.5a +11.7a T
eq. 7.26
where T is expressed in K.
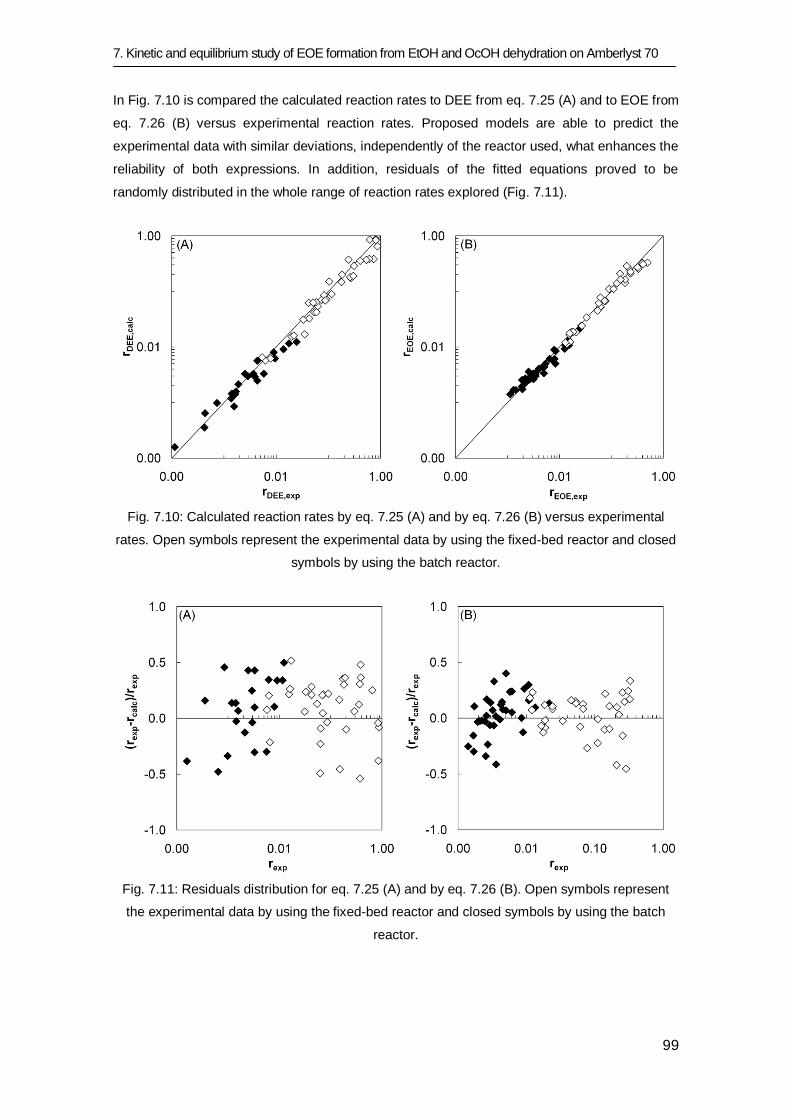
7. Kinetic and equilibrium study of EOE formation from EtOH and OcOH dehydration on Amberlyst 70
99
In Fig. 7.10 is compared the calculated reaction rates to DEE from eq. 7.25 (A) and to EOE from
eq. 7.26 (B) versus experimental reaction rates. Proposed models are able to predict the
experimental data with similar deviations, independently of the reactor used, what enhances the
reliability of both expressions. In addition, residuals of the fitted equations proved to be
randomly distributed in the whole range of reaction rates explored (Fig. 7.11).
Fig. 7.10: Calculated reaction rates by eq. 7.25 (A) and by eq. 7.26 (B) versus experimental
rates. Open symbols represent the experimental data by using the fixed-bed reactor and closed
symbols by using the batch reactor.
Fig. 7.11: Residuals distribution for eq. 7.25 (A) and by eq. 7.26 (B). Open symbols represent
the experimental data by using the fixed-bed reactor and closed symbols by using the batch
reactor.
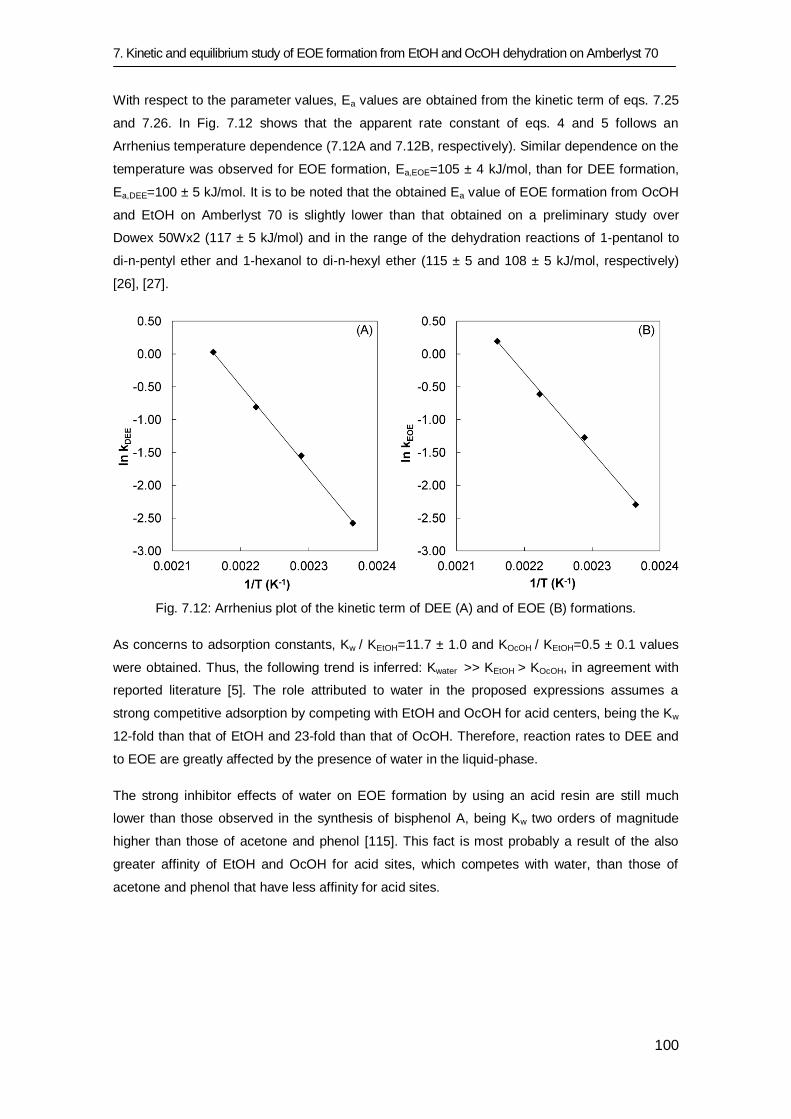
7. Kinetic and equilibrium study of EOE formation from EtOH and OcOH dehydration on Amberlyst 70
100
With respect to the parameter values, Ea values are obtained from the kinetic term of eqs. 7.25
and 7.26. In Fig. 7.12 shows that the apparent rate constant of eqs. 4 and 5 follows an
Arrhenius temperature dependence (7.12A and 7.12B, respectively). Similar dependence on the
temperature was observed for EOE formation, Ea,EOE=105 ± 4 kJ/mol, than for DEE formation,
Ea,DEE=100 ± 5 kJ/mol. It is to be noted that the obtained Ea value of EOE formation from OcOH
and EtOH on Amberlyst 70 is slightly lower than that obtained on a preliminary study over
Dowex 50Wx2 (117 ± 5 kJ/mol) and in the range of the dehydration reactions of 1-pentanol to
di-n-pentyl ether and 1-hexanol to di-n-hexyl ether (115 ± 5 and 108 ± 5 kJ/mol, respectively)
[26], [27].
Fig. 7.12: Arrhenius plot of the kinetic term of DEE (A) and of EOE (B) formations.
As concerns to adsorption constants, Kw / KEtOH=11.7 ± 1.0 and KOcOH / KEtOH=0.5 ± 0.1 values
were obtained. Thus, the following trend is inferred: Kwater >> KEtOH > KOcOH, in agreement with
reported literature [5]. The role attributed to water in the proposed expressions assumes a
strong competitive adsorption by competing with EtOH and OcOH for acid centers, being the Kw
12-fold than that of EtOH and 23-fold than that of OcOH. Therefore, reaction rates to DEE and
to EOE are greatly affected by the presence of water in the liquid-phase.
The strong inhibitor effects of water on EOE formation by using an acid resin are still much
lower than those observed in the synthesis of bisphenol A, being Kw two orders of magnitude
higher than those of acetone and phenol [115]. This fact is most probably a result of the also
greater affinity of EtOH and OcOH for acid sites, which competes with water, than those of
acetone and phenol that have less affinity for acid sites.
7. Kinetic and equilibrium study of EOE formation from EtOH and OcOH dehydration on Amberlyst 70
101
7.4 Conclusions
From the larger equilibrium values obtained from EOE synthesis reaction, it can be concluded
that EOE synthesis is more shifted to products than DEE reaction. Such observation is in
agreement with the literature data on linear ethers formation, where as a general rule, the
longer the ether chain formed, the higher the experimental equilibrium values are.
Both alcohol dehydration reactions proved to be exothermic, with a reaction enthalpy change (at
25ºC) of -(18.9 ± 1.3) kJ/mol for EOE synthesis, and -(12.1 ± 0.9) kJ/mol for DEE synthesis, in
the same magnitude order than other dialkyl ethers. Concerning reaction entropy changes, both
reaction showed negative values, being -(13.6 ± 4.2) J/(K·mol) for EOE synthesis and -(7.6 ±
2.1) J/(K·mol) for DEE synthesis. Standard formation enthalpy and molar entropy of EOE were
computed to be -(436 ± 7) kJ/mol and -(434 ± 11) J/(mol·K), respectively.
A kinetic model in terms of compound activities to describe the formation of ethyl octyl ether
from ethanol and 1-octanol is proposed. From the proposed model it is inferred that the fraction
of free actives sites is negligible and only one acid site seems to take part in the surface
reaction step, which is considered as the rate-limiting step of the mechanism.
The adsorption equilibrium constants of the formed ethers are negligible compared with that of
alcohols and water. Thus, it is considered that diethyl ether and ethyl octyl ether are released
directly to the liquid-phase. On the contrary, reaction rates were highly sensitive to water
content, by clearly showing strong inhibiting effects. Eventually, the apparent activation energy
for the ethyl octyl ether reaction is about 105 ± 4 kJ/mol, a similar dependence on the
temperature to that of the main side product diethyl ether, 100 ± 5 kJ/mol.

Chapter 8
Influence of the functionalization
degree of acidic ion-exchange
resins on ethyl octyl ether
formation
A SUMMARY OF THIS CHAPTER HAS BEEN PRESENTED AS AN ORAL COMMUNICATION IN:
J. Guilera, L. Hankova, K. Jerabek, E. Ramírez, J. Tejero. Influence of the sulfonation degree of acidic ion-exchange resins on ethyl octyl ether formation. June 2013. Presented at CAFC10 (Congress on Catalysis Applied to Fine Chemicals), Turku, Finland.
8. Influence of the functionalization degree of acidic ion-exchange resins on EOE formation
104
8.1 Introduction
EOE production has to compete with the less steric demanding DEE formation, obtained from
the ethylating agent, EtOH or DEC. Thus, the loss of bioethanol molecules by DEE formation is
a serious industrial trouble as this ether cannot be blended straightforwardly in commercial
diesel fuels. Steric hindrances within the catalyst play a determinant role on the selectivity to
EOE or to DEE. A greatly expanded polymer in the reaction medium favours the diffusion of
bulky reactants molecules, such as OcOH, inside the catalysts and EOE production is
maximized (Chapter 3 and 4). In general, this desired flexible structure can be achieved by
decreasing the crosslinking degree of the resin. Nevertheless, it is worth mentioning that an
extensive catalyst swelling reduces the efficiency per unit of volume of the catalyst bed [37].
Another tailoring technique to reduce steric limitations could be achieved by controlling the
location of acid centers. This concept was patented by Chevron Research Company in 1972
and attempts to reduce the amount of by-products by using resins with less amount of acid
groups, but more accessible ones. Such invention reduced the extent of isobutene
polymerization process by partially neutralizing the resin capacity [117]. Instead of neutralizing
acid groups, McMaster and Gilliland limited the sulfonation time with the aim of limiting location
of the sulfonic groups to the pellicular layer at the surface of the polymer beads [118], [119].
Further step was then partial sulfonation of porous (macroreticular) polymer beads gradually
advancing in the whole volume of the polymer beads from pore wall surface into deeper layers
of polymer matrix. In 1995, Rohm and Haas Company patented the use of such partially
functionalized resins for esterification process, favoring in this way the formation of esters over
the formation of ethers [120]. Eventually, the partially sulfonated macroreticular resin Amberlyst
46 (hereinafter termed surface sulfonated) has been commercialized [41].
The term surface sulfonated refers to a functionalization near to the surface of the polymer gel-
phase and it is not restricted to only the surface layer. As a result, Amberlyst 46 has a
heterogeneous distribution of the sulfonic groups, with a sulfonated shell enveloping an inner
non-sulfonated polymer core. Thus, the polymer has great morphological differences depending
on the polymer depth. The external layers posses an strong hydrophilic character, whereas the
inner part has an hydrophobic one [9], [42]. Nowadays, specific acid site distribution in
Amberlyst 46 has been used to study the influence of the acid sites location on many reaction
processes, as well, to optimize the selectivity to the desired products [121]–[126].
In previous chapters, a relationship between the resin crosslinking degree and the EOE yield
was found. In the present work, the influence of the resin functionalization degree on EOE
formation is explored.
8. Influence of the functionalization degree of acidic ion-exchange resins on EOE formation
105
8.2 Experimental procedure
A series of partially sulfonated resins were prepared from a macroreticular PS-DVB copolymer
(DVB content about 20 %) originally manufactured as an intermediate for production of ion
exchanger Ostion KSPC (Spolchemie, Ústí nad Labem, Czech Republic). For to achieve low to
intermediate sulfonation degrees, 15 g of the polymer was placed in 100 mL of concentrated
sulphuric acid and afterwards, the mixture was stirred and heated for 6 hours at a temperature
selected for to achieve the desired degree of sulfonation (T=30-80ºC). These conditions (long
reaction time and control of the conversion by reaction temperature) were chosen with the aim
of limiting differences in the sulfonation degree at the periphery and center of the polymer
beads. Then, the mixture was cooled down slowly and slowly diluted by percolation with
sulphuric acid solution of gradually diminishing concentration (90, 70, 50, 30 and 10 v/v %).
Eventually, the product was washed with deionized water till neutral pH of the eluent.
Additionally, two samples with higher sulfonation degree were prepared by sulfonation of
polymer pre-swollen in DCE overnight.
The performance of a series of partially sulfonated resins was tested over two reaction
pathways for obtaining EOE: the dehydration of OcOH and EtOH; and the transesterification
reaction between OcOH and DEC to EOC, and its subsequent decomposition to EOE.
Catalytic tests were performed in the batch reactor (described in section 2.3.1). Resins were
previously dried at 110ºC under vacuum overnight. Then, the reactor was loaded with 70 mL of
OcOH / DEC mixture (molar ratio, ROcOH/DEC=2) or OcOH / EtOH mixture (molar ratio,
ROcOH/EtOH=1), stirred at 500 rpm and heated up to 150ºC. Pressure was set at 25 bar with N2 to
maintain the liquid-phase. When the mixture reached the working temperature, dried catalyst
(1g) was injected into the reactor. Catalyst injection was taken as zero time. Experiments lasted
6h.
Conversion (Xj) and selectivity (Sjk) were computed by eqs 8.1 and 8.2, respectively.
j
moleof j reactedX = ×100 %,mol mol
moleof j initially eq. 8.1
k
j
moleof j reacted to form kS = ×100 %,mol mol
moleof j reacted
eq. 8.2
Relative turnover frequency (TOFrel) of each catalyst with respect to the least sulfonated
catalyst, 306, was computed by eq 8.3. Initial turnover frequency (TOF) of EtOH and OcOH
reaction to form EOE and that of DEC and OcOH reaction to form EOC; were computed from
the functions of formed moles vs. time, as described in former chapters.
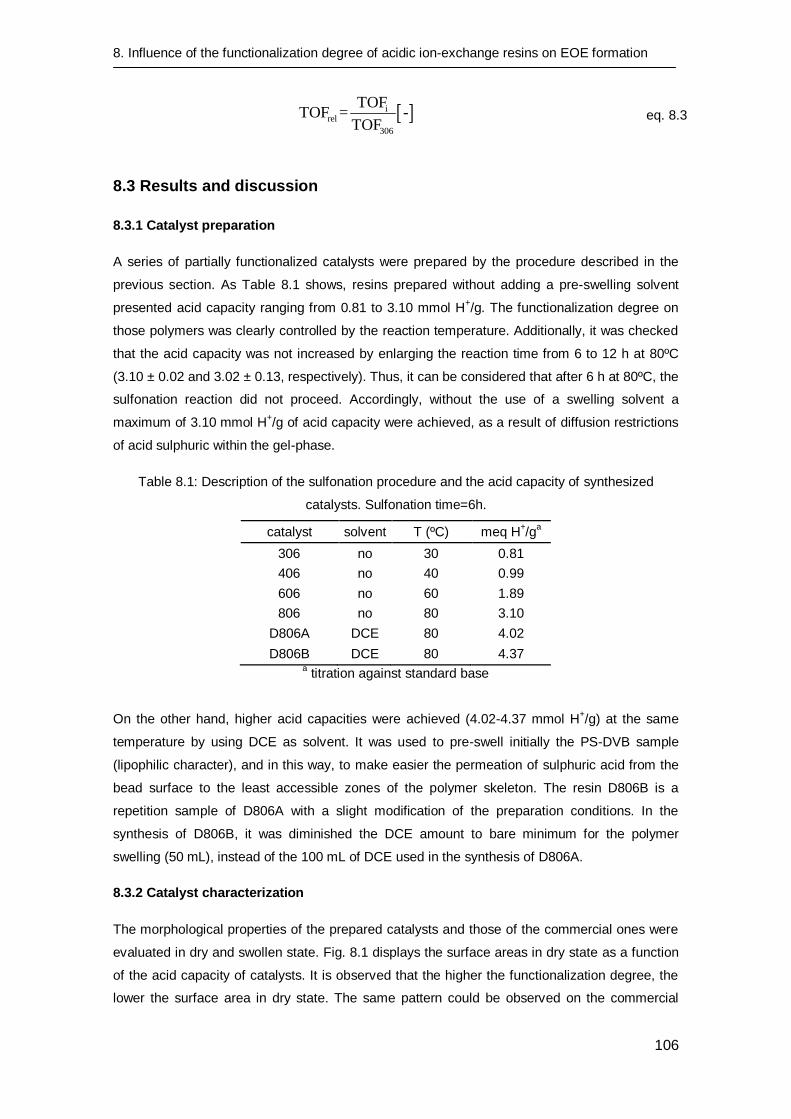
8. Influence of the functionalization degree of acidic ion-exchange resins on EOE formation
106
irel
306
TOFTOF = -
TOF eq. 8.3
8.3 Results and discussion
8.3.1 Catalyst preparation
A series of partially functionalized catalysts were prepared by the procedure described in the
previous section. As Table 8.1 shows, resins prepared without adding a pre-swelling solvent
presented acid capacity ranging from 0.81 to 3.10 mmol H+/g. The functionalization degree on
those polymers was clearly controlled by the reaction temperature. Additionally, it was checked
that the acid capacity was not increased by enlarging the reaction time from 6 to 12 h at 80ºC
(3.10 ± 0.02 and 3.02 ± 0.13, respectively). Thus, it can be considered that after 6 h at 80ºC, the
sulfonation reaction did not proceed. Accordingly, without the use of a swelling solvent a
maximum of 3.10 mmol H+/g of acid capacity were achieved, as a result of diffusion restrictions
of acid sulphuric within the gel-phase.
Table 8.1: Description of the sulfonation procedure and the acid capacity of synthesized
catalysts. Sulfonation time=6h.
catalyst solvent T (ºC) meq H+/g
a
306 no 30 0.81
406 no 40 0.99
606 no 60 1.89
806 no 80 3.10
D806A DCE 80 4.02
D806B DCE 80 4.37 a titration against standard base
On the other hand, higher acid capacities were achieved (4.02-4.37 mmol H+/g) at the same
temperature by using DCE as solvent. It was used to pre-swell initially the PS-DVB sample
(lipophilic character), and in this way, to make easier the permeation of sulphuric acid from the
bead surface to the least accessible zones of the polymer skeleton. The resin D806B is a
repetition sample of D806A with a slight modification of the preparation conditions. In the
synthesis of D806B, it was diminished the DCE amount to bare minimum for the polymer
swelling (50 mL), instead of the 100 mL of DCE used in the synthesis of D806A.
8.3.2 Catalyst characterization
The morphological properties of the prepared catalysts and those of the commercial ones were
evaluated in dry and swollen state. Fig. 8.1 displays the surface areas in dry state as a function
of the acid capacity of catalysts. It is observed that the higher the functionalization degree, the
lower the surface area in dry state. The same pattern could be observed on the commercial
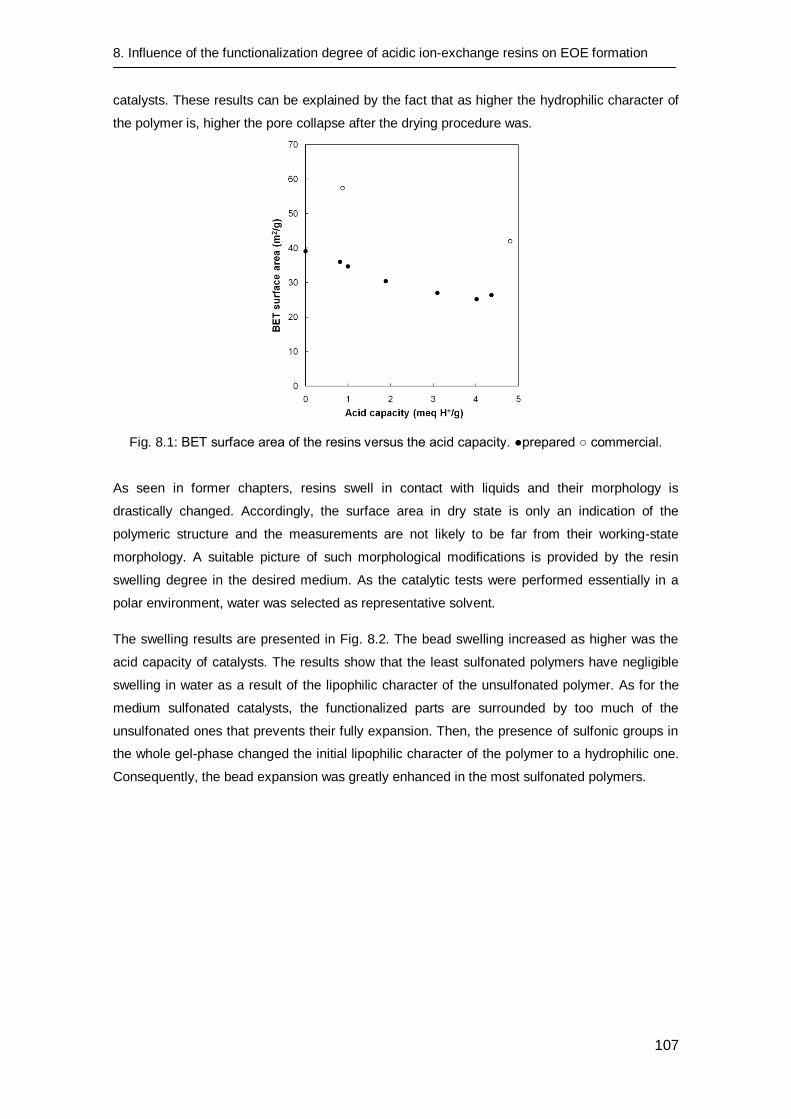
8. Influence of the functionalization degree of acidic ion-exchange resins on EOE formation
107
catalysts. These results can be explained by the fact that as higher the hydrophilic character of
the polymer is, higher the pore collapse after the drying procedure was.
Fig. 8.1: BET surface area of the resins versus the acid capacity. ●prepared ○ commercial.
As seen in former chapters, resins swell in contact with liquids and their morphology is
drastically changed. Accordingly, the surface area in dry state is only an indication of the
polymeric structure and the measurements are not likely to be far from their working-state
morphology. A suitable picture of such morphological modifications is provided by the resin
swelling degree in the desired medium. As the catalytic tests were performed essentially in a
polar environment, water was selected as representative solvent.
The swelling results are presented in Fig. 8.2. The bead swelling increased as higher was the
acid capacity of catalysts. The results show that the least sulfonated polymers have negligible
swelling in water as a result of the lipophilic character of the unsulfonated polymer. As for the
medium sulfonated catalysts, the functionalized parts are surrounded by too much of the
unsulfonated ones that prevents their fully expansion. Then, the presence of sulfonic groups in
the whole gel-phase changed the initial lipophilic character of the polymer to a hydrophilic one.
Consequently, the bead expansion was greatly enhanced in the most sulfonated polymers.
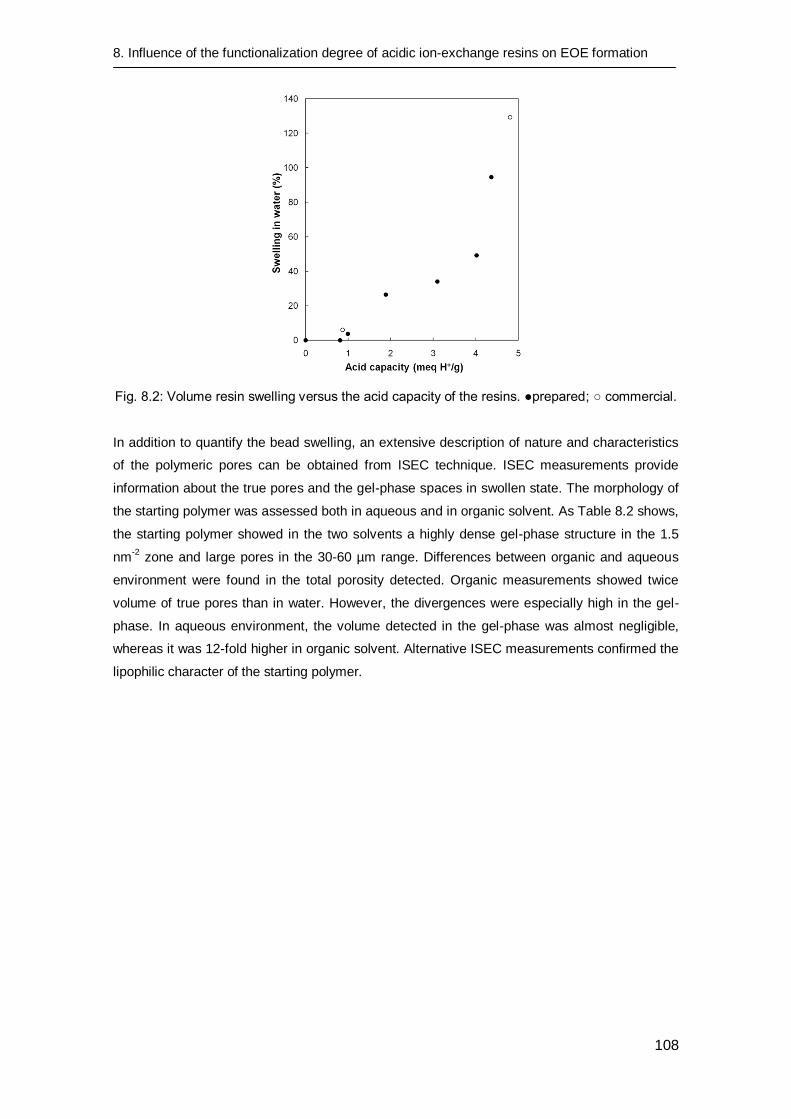
8. Influence of the functionalization degree of acidic ion-exchange resins on EOE formation
108
Fig. 8.2: Volume resin swelling versus the acid capacity of the resins. ●prepared; ○ commercial.
In addition to quantify the bead swelling, an extensive description of nature and characteristics
of the polymeric pores can be obtained from ISEC technique. ISEC measurements provide
information about the true pores and the gel-phase spaces in swollen state. The morphology of
the starting polymer was assessed both in aqueous and in organic solvent. As Table 8.2 shows,
the starting polymer showed in the two solvents a highly dense gel-phase structure in the 1.5
nm-2
zone and large pores in the 30-60 µm range. Differences between organic and aqueous
environment were found in the total porosity detected. Organic measurements showed twice
volume of true pores than in water. However, the divergences were especially high in the gel-
phase. In aqueous environment, the volume detected in the gel-phase was almost negligible,
whereas it was 12-fold higher in organic solvent. Alternative ISEC measurements confirmed the
lipophilic character of the starting polymer.
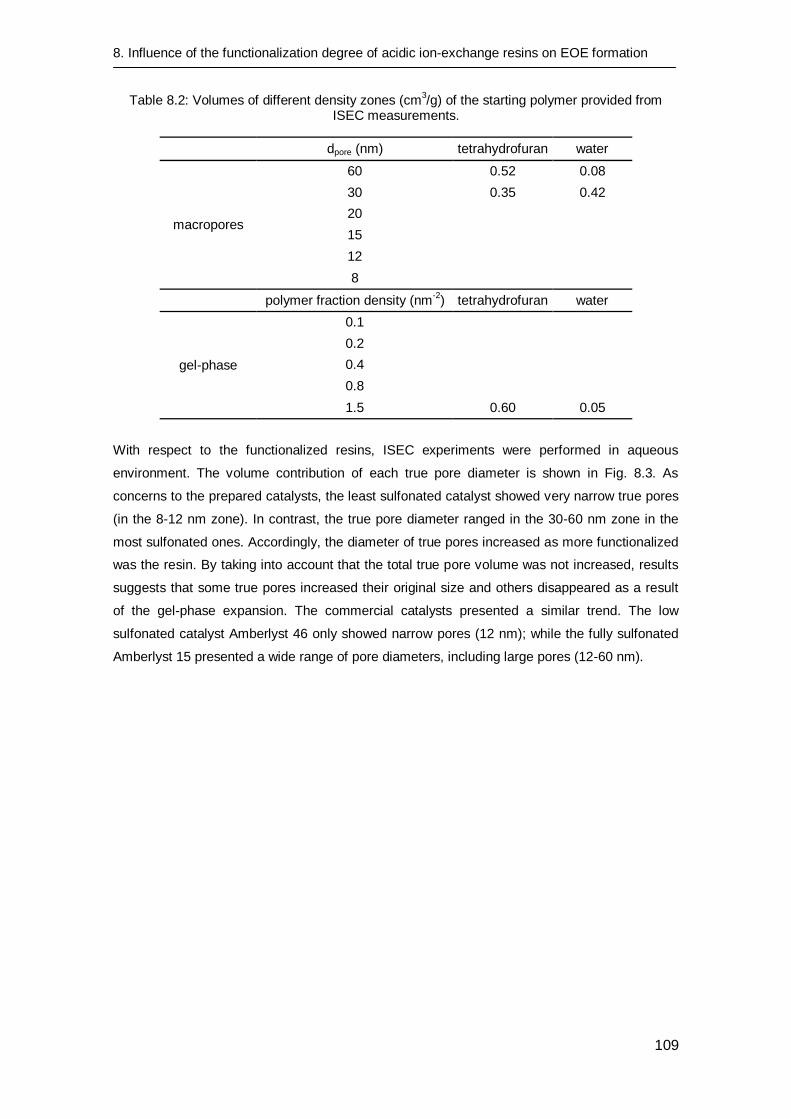
8. Influence of the functionalization degree of acidic ion-exchange resins on EOE formation
109
Table 8.2: Volumes of different density zones (cm3/g) of the starting polymer provided from
ISEC measurements.
dpore (nm) tetrahydrofuran water
macropores
60 0.52 0.08
30 0.35 0.42
20
15
12
8
polymer fraction density (nm-2
) tetrahydrofuran water
gel-phase
0.1
0.2
0.4
0.8
1.5 0.60 0.05
With respect to the functionalized resins, ISEC experiments were performed in aqueous
environment. The volume contribution of each true pore diameter is shown in Fig. 8.3. As
concerns to the prepared catalysts, the least sulfonated catalyst showed very narrow true pores
(in the 8-12 nm zone). In contrast, the true pore diameter ranged in the 30-60 nm zone in the
most sulfonated ones. Accordingly, the diameter of true pores increased as more functionalized
was the resin. By taking into account that the total true pore volume was not increased, results
suggests that some true pores increased their original size and others disappeared as a result
of the gel-phase expansion. The commercial catalysts presented a similar trend. The low
sulfonated catalyst Amberlyst 46 only showed narrow pores (12 nm); while the fully sulfonated
Amberlyst 15 presented a wide range of pore diameters, including large pores (12-60 nm).
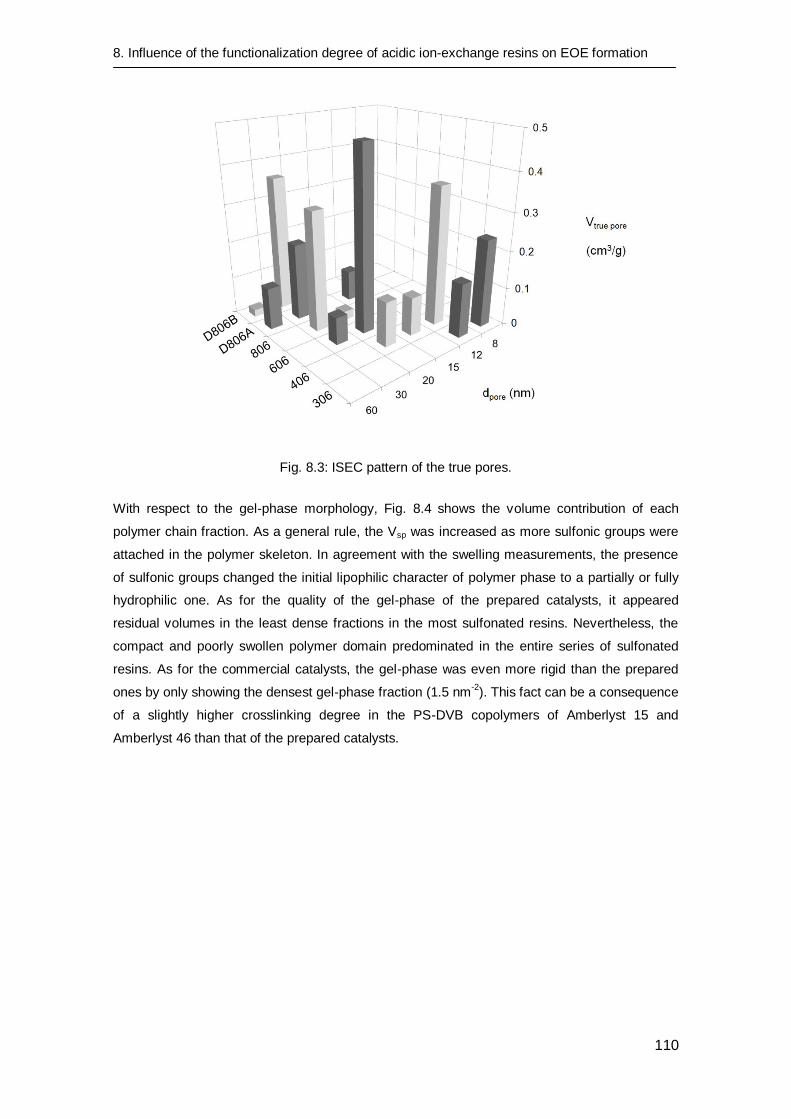
8. Influence of the functionalization degree of acidic ion-exchange resins on EOE formation
110
Fig. 8.3: ISEC pattern of the true pores.
With respect to the gel-phase morphology, Fig. 8.4 shows the volume contribution of each
polymer chain fraction. As a general rule, the Vsp was increased as more sulfonic groups were
attached in the polymer skeleton. In agreement with the swelling measurements, the presence
of sulfonic groups changed the initial lipophilic character of polymer phase to a partially or fully
hydrophilic one. As for the quality of the gel-phase of the prepared catalysts, it appeared
residual volumes in the least dense fractions in the most sulfonated resins. Nevertheless, the
compact and poorly swollen polymer domain predominated in the entire series of sulfonated
resins. As for the commercial catalysts, the gel-phase was even more rigid than the prepared
ones by only showing the densest gel-phase fraction (1.5 nm-2
). This fact can be a consequence
of a slightly higher crosslinking degree in the PS-DVB copolymers of Amberlyst 15 and
Amberlyst 46 than that of the prepared catalysts.
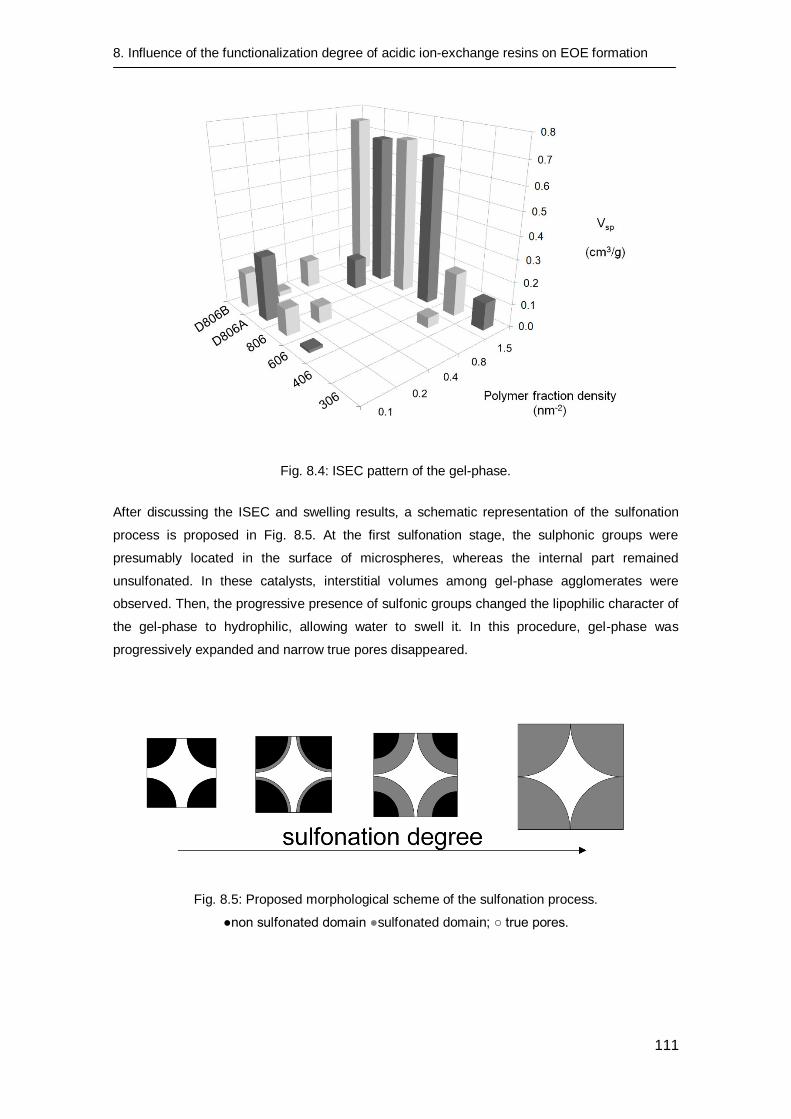
8. Influence of the functionalization degree of acidic ion-exchange resins on EOE formation
111
Fig. 8.4: ISEC pattern of the gel-phase.
After discussing the ISEC and swelling results, a schematic representation of the sulfonation
process is proposed in Fig. 8.5. At the first sulfonation stage, the sulphonic groups were
presumably located in the surface of microspheres, whereas the internal part remained
unsulfonated. In these catalysts, interstitial volumes among gel-phase agglomerates were
observed. Then, the progressive presence of sulfonic groups changed the lipophilic character of
the gel-phase to hydrophilic, allowing water to swell it. In this procedure, gel-phase was
progressively expanded and narrow true pores disappeared.
Fig. 8.5: Proposed morphological scheme of the sulfonation process.
●non sulfonated domain ●sulfonated domain; ○ true pores.
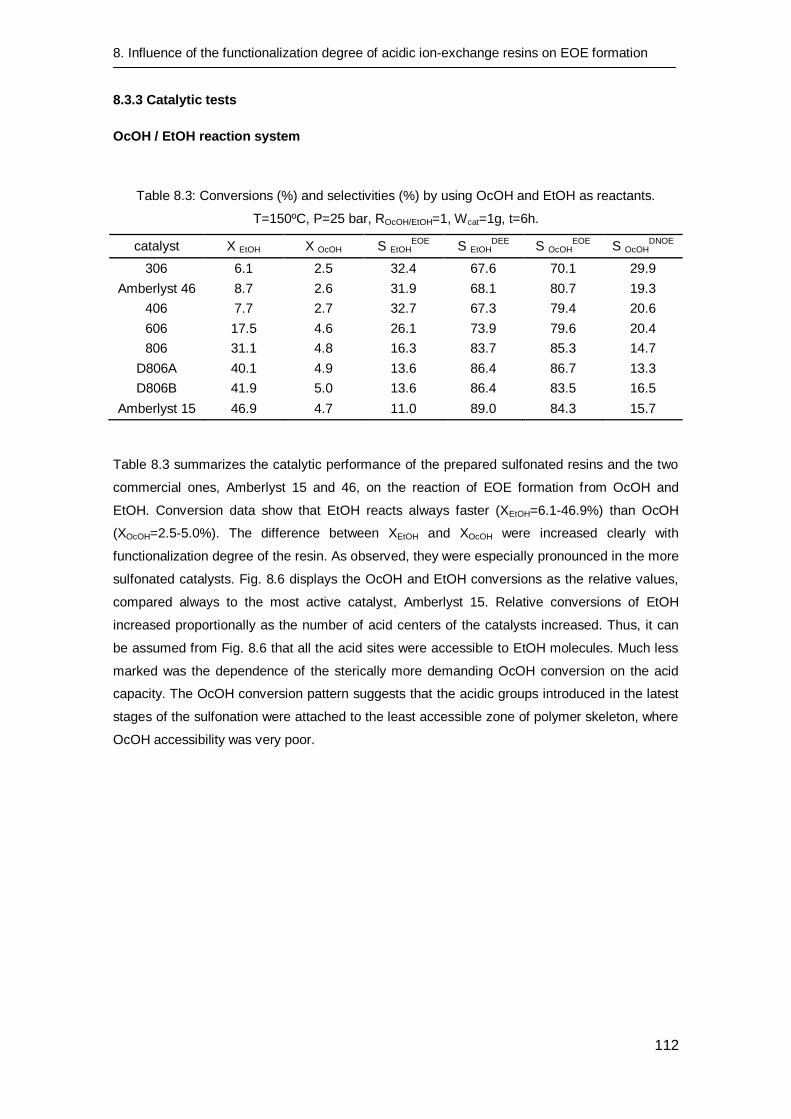
8. Influence of the functionalization degree of acidic ion-exchange resins on EOE formation
112
8.3.3 Catalytic tests
OcOH / EtOH reaction system
Table 8.3: Conversions (%) and selectivities (%) by using OcOH and EtOH as reactants.
T=150ºC, P=25 bar, ROcOH/EtOH=1, Wcat=1g, t=6h.
catalyst X EtOH X OcOH S EtOHEOE
S EtOHDEE
S OcOHEOE
S OcOHDNOE
306 6.1 2.5 32.4 67.6 70.1 29.9
Amberlyst 46 8.7 2.6 31.9 68.1 80.7 19.3
406 7.7 2.7 32.7 67.3 79.4 20.6
606 17.5 4.6 26.1 73.9 79.6 20.4
806 31.1 4.8 16.3 83.7 85.3 14.7
D806A 40.1 4.9 13.6 86.4 86.7 13.3
D806B 41.9 5.0 13.6 86.4 83.5 16.5
Amberlyst 15 46.9 4.7 11.0 89.0 84.3 15.7
Table 8.3 summarizes the catalytic performance of the prepared sulfonated resins and the two
commercial ones, Amberlyst 15 and 46, on the reaction of EOE formation from OcOH and
EtOH. Conversion data show that EtOH reacts always faster (XEtOH=6.1-46.9%) than OcOH
(XOcOH=2.5-5.0%). The difference between XEtOH and XOcOH were increased clearly with
functionalization degree of the resin. As observed, they were especially pronounced in the more
sulfonated catalysts. Fig. 8.6 displays the OcOH and EtOH conversions as the relative values,
compared always to the most active catalyst, Amberlyst 15. Relative conversions of EtOH
increased proportionally as the number of acid centers of the catalysts increased. Thus, it can
be assumed from Fig. 8.6 that all the acid sites were accessible to EtOH molecules. Much less
marked was the dependence of the sterically more demanding OcOH conversion on the acid
capacity. The OcOH conversion pattern suggests that the acidic groups introduced in the latest
stages of the sulfonation were attached to the least accessible zone of polymer skeleton, where
OcOH accessibility was very poor.
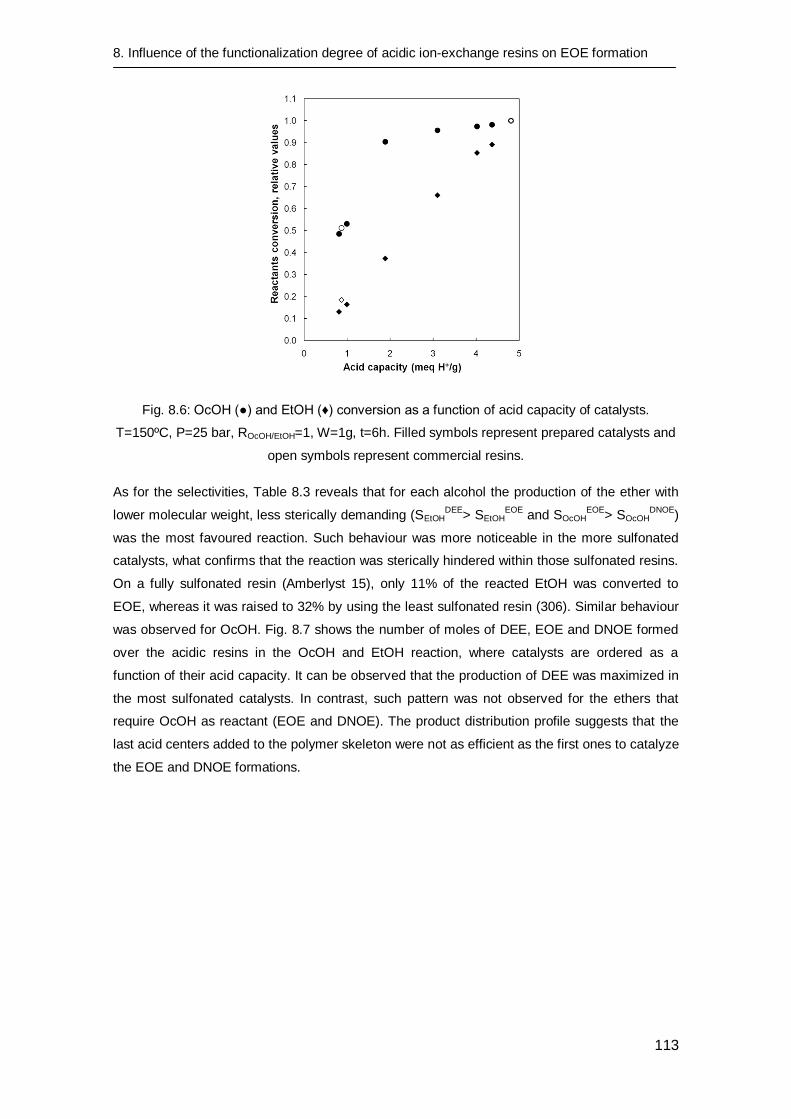
8. Influence of the functionalization degree of acidic ion-exchange resins on EOE formation
113
Fig. 8.6: OcOH (●) and EtOH (♦) conversion as a function of acid capacity of catalysts.
T=150ºC, P=25 bar, ROcOH/EtOH=1, W=1g, t=6h. Filled symbols represent prepared catalysts and
open symbols represent commercial resins.
As for the selectivities, Table 8.3 reveals that for each alcohol the production of the ether with
lower molecular weight, less sterically demanding (SEtOHDEE
> SEtOHEOE
and SOcOHEOE
> SOcOHDNOE
)
was the most favoured reaction. Such behaviour was more noticeable in the more sulfonated
catalysts, what confirms that the reaction was sterically hindered within those sulfonated resins.
On a fully sulfonated resin (Amberlyst 15), only 11% of the reacted EtOH was converted to
EOE, whereas it was raised to 32% by using the least sulfonated resin (306). Similar behaviour
was observed for OcOH. Fig. 8.7 shows the number of moles of DEE, EOE and DNOE formed
over the acidic resins in the OcOH and EtOH reaction, where catalysts are ordered as a
function of their acid capacity. It can be observed that the production of DEE was maximized in
the most sulfonated catalysts. In contrast, such pattern was not observed for the ethers that
require OcOH as reactant (EOE and DNOE). The product distribution profile suggests that the
last acid centers added to the polymer skeleton were not as efficient as the first ones to catalyze
the EOE and DNOE formations.
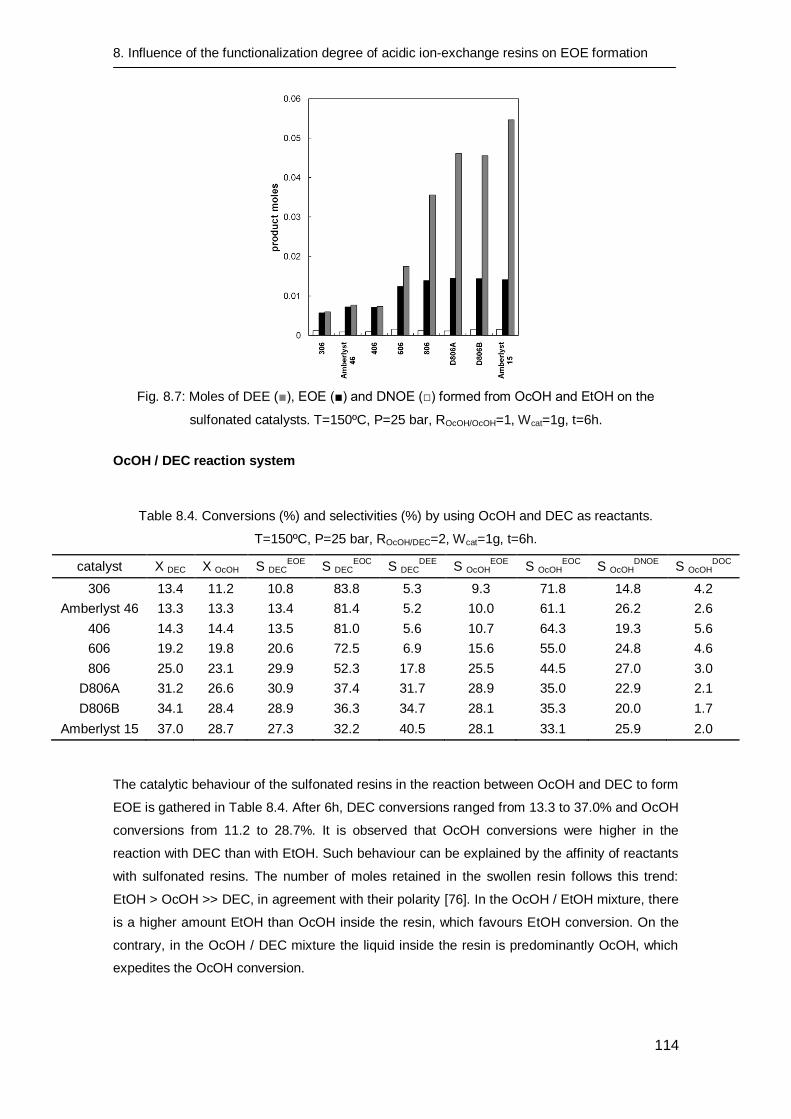
8. Influence of the functionalization degree of acidic ion-exchange resins on EOE formation
114
Fig. 8.7: Moles of DEE (■), EOE (■) and DNOE (□) formed from OcOH and EtOH on the
sulfonated catalysts. T=150ºC, P=25 bar, ROcOH/OcOH=1, Wcat=1g, t=6h.
OcOH / DEC reaction system
Table 8.4. Conversions (%) and selectivities (%) by using OcOH and DEC as reactants.
T=150ºC, P=25 bar, ROcOH/DEC=2, Wcat=1g, t=6h.
catalyst X DEC X OcOH S DECEOE
S DECEOC
S DECDEE
S OcOHEOE
S OcOHEOC
S OcOHDNOE
S OcOHDOC
306 13.4 11.2 10.8 83.8 5.3 9.3 71.8 14.8 4.2
Amberlyst 46 13.3 13.3 13.4 81.4 5.2 10.0 61.1 26.2 2.6
406 14.3 14.4 13.5 81.0 5.6 10.7 64.3 19.3 5.6
606 19.2 19.8 20.6 72.5 6.9 15.6 55.0 24.8 4.6
806 25.0 23.1 29.9 52.3 17.8 25.5 44.5 27.0 3.0
D806A 31.2 26.6 30.9 37.4 31.7 28.9 35.0 22.9 2.1
D806B 34.1 28.4 28.9 36.3 34.7 28.1 35.3 20.0 1.7
Amberlyst 15 37.0 28.7 27.3 32.2 40.5 28.1 33.1 25.9 2.0
The catalytic behaviour of the sulfonated resins in the reaction between OcOH and DEC to form
EOE is gathered in Table 8.4. After 6h, DEC conversions ranged from 13.3 to 37.0% and OcOH
conversions from 11.2 to 28.7%. It is observed that OcOH conversions were higher in the
reaction with DEC than with EtOH. Such behaviour can be explained by the affinity of reactants
with sulfonated resins. The number of moles retained in the swollen resin follows this trend:
EtOH > OcOH >> DEC, in agreement with their polarity [76]. In the OcOH / EtOH mixture, there
is a higher amount EtOH than OcOH inside the resin, which favours EtOH conversion. On the
contrary, in the OcOH / DEC mixture the liquid inside the resin is predominantly OcOH, which
expedites the OcOH conversion.
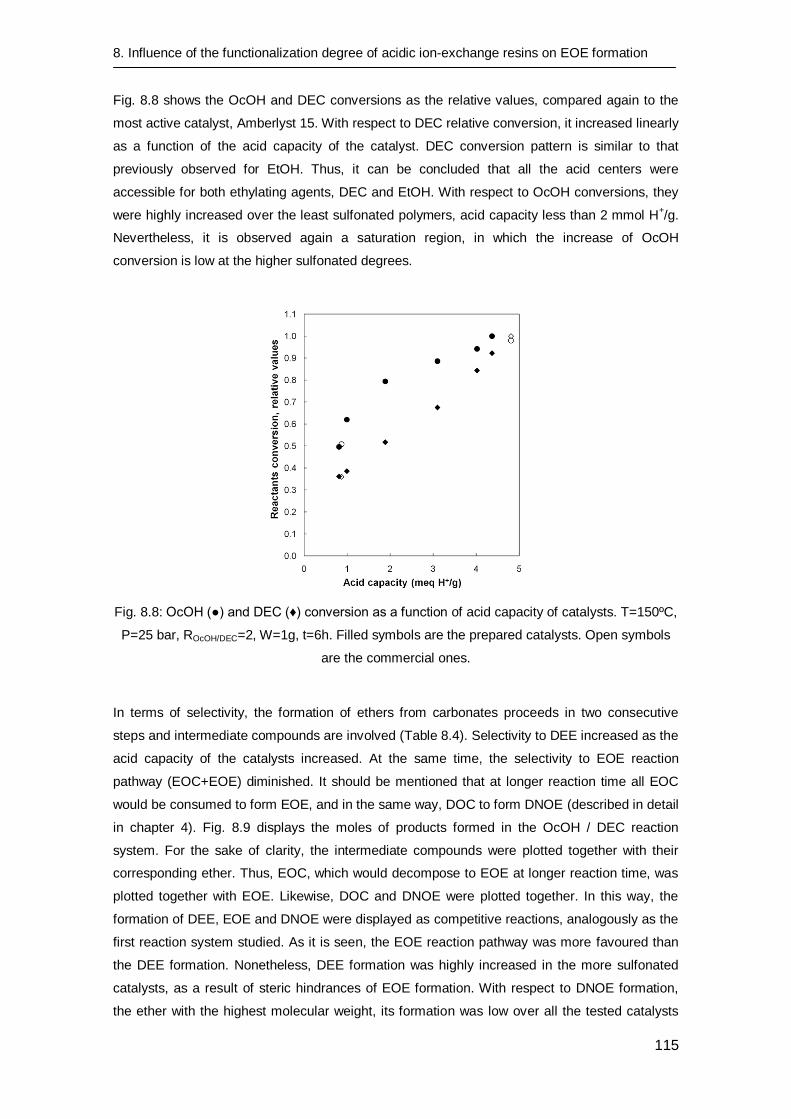
8. Influence of the functionalization degree of acidic ion-exchange resins on EOE formation
115
Fig. 8.8 shows the OcOH and DEC conversions as the relative values, compared again to the
most active catalyst, Amberlyst 15. With respect to DEC relative conversion, it increased linearly
as a function of the acid capacity of the catalyst. DEC conversion pattern is similar to that
previously observed for EtOH. Thus, it can be concluded that all the acid centers were
accessible for both ethylating agents, DEC and EtOH. With respect to OcOH conversions, they
were highly increased over the least sulfonated polymers, acid capacity less than 2 mmol H+/g.
Nevertheless, it is observed again a saturation region, in which the increase of OcOH
conversion is low at the higher sulfonated degrees.
Fig. 8.8: OcOH (●) and DEC (♦) conversion as a function of acid capacity of catalysts. T=150ºC,
P=25 bar, ROcOH/DEC=2, W=1g, t=6h. Filled symbols are the prepared catalysts. Open symbols
are the commercial ones.
In terms of selectivity, the formation of ethers from carbonates proceeds in two consecutive
steps and intermediate compounds are involved (Table 8.4). Selectivity to DEE increased as the
acid capacity of the catalysts increased. At the same time, the selectivity to EOE reaction
pathway (EOC+EOE) diminished. It should be mentioned that at longer reaction time all EOC
would be consumed to form EOE, and in the same way, DOC to form DNOE (described in detail
in chapter 4). Fig. 8.9 displays the moles of products formed in the OcOH / DEC reaction
system. For the sake of clarity, the intermediate compounds were plotted together with their
corresponding ether. Thus, EOC, which would decompose to EOE at longer reaction time, was
plotted together with EOE. Likewise, DOC and DNOE were plotted together. In this way, the
formation of DEE, EOE and DNOE were displayed as competitive reactions, analogously as the
first reaction system studied. As it is seen, the EOE reaction pathway was more favoured than
the DEE formation. Nonetheless, DEE formation was highly increased in the more sulfonated
catalysts, as a result of steric hindrances of EOE formation. With respect to DNOE formation,
the ether with the highest molecular weight, its formation was low over all the tested catalysts
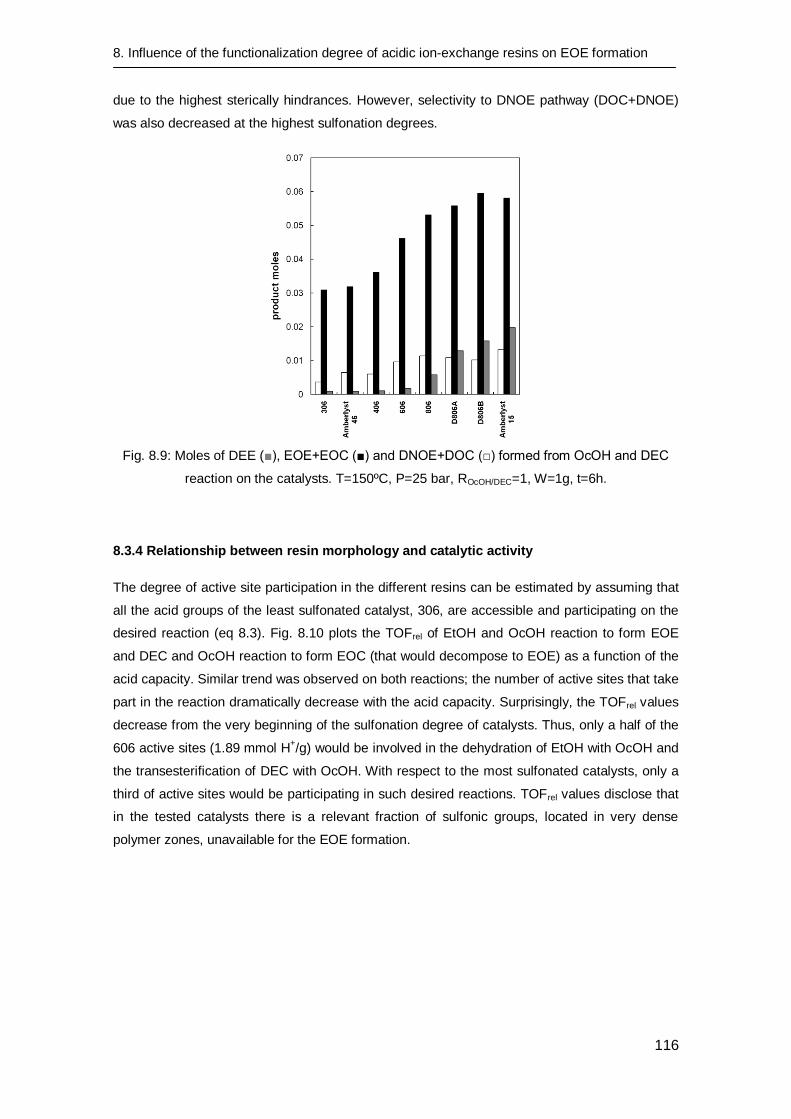
8. Influence of the functionalization degree of acidic ion-exchange resins on EOE formation
116
due to the highest sterically hindrances. However, selectivity to DNOE pathway (DOC+DNOE)
was also decreased at the highest sulfonation degrees.
Fig. 8.9: Moles of DEE (■), EOE+EOC (■) and DNOE+DOC (□) formed from OcOH and DEC
reaction on the catalysts. T=150ºC, P=25 bar, ROcOH/DEC=1, W=1g, t=6h.
8.3.4 Relationship between resin morphology and catalytic activity
The degree of active site participation in the different resins can be estimated by assuming that
all the acid groups of the least sulfonated catalyst, 306, are accessible and participating on the
desired reaction (eq 8.3). Fig. 8.10 plots the TOFrel of EtOH and OcOH reaction to form EOE
and DEC and OcOH reaction to form EOC (that would decompose to EOE) as a function of the
acid capacity. Similar trend was observed on both reactions; the number of active sites that take
part in the reaction dramatically decrease with the acid capacity. Surprisingly, the TOFrel values
decrease from the very beginning of the sulfonation degree of catalysts. Thus, only a half of the
606 active sites (1.89 mmol H+/g) would be involved in the dehydration of EtOH with OcOH and
the transesterification of DEC with OcOH. With respect to the most sulfonated catalysts, only a
third of active sites would be participating in such desired reactions. TOFrel values disclose that
in the tested catalysts there is a relevant fraction of sulfonic groups, located in very dense
polymer zones, unavailable for the EOE formation.
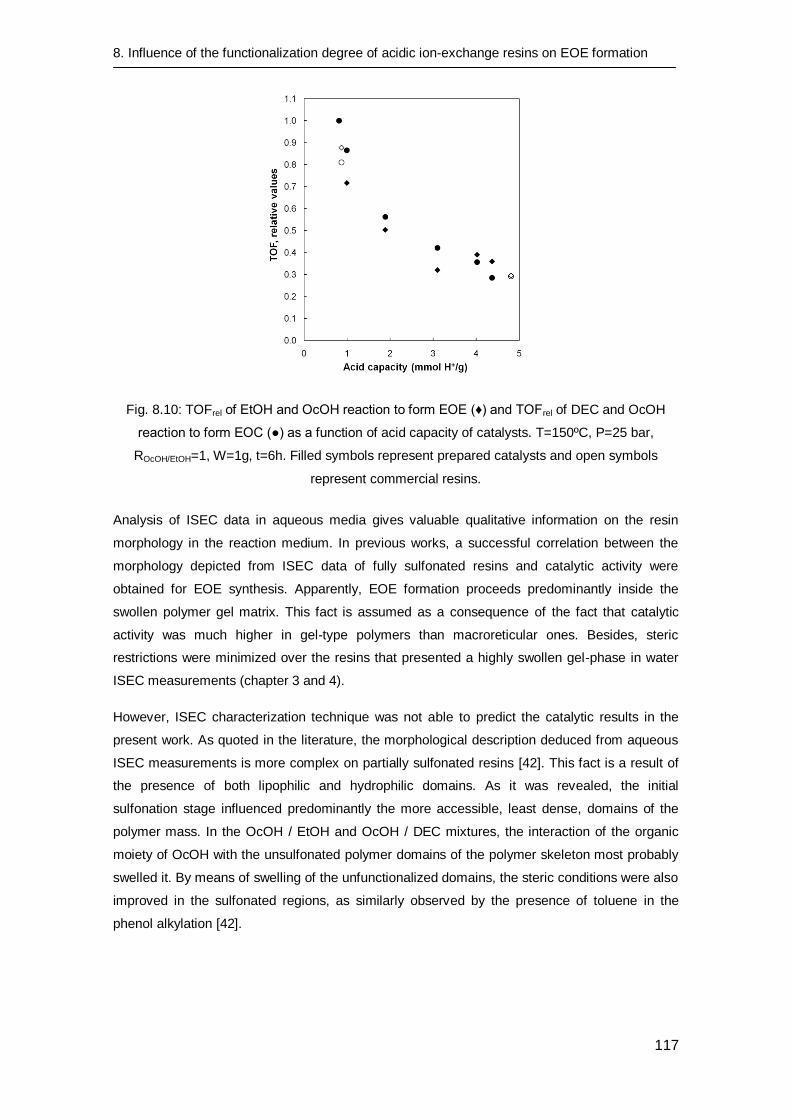
8. Influence of the functionalization degree of acidic ion-exchange resins on EOE formation
117
Fig. 8.10: TOFrel of EtOH and OcOH reaction to form EOE (♦) and TOFrel of DEC and OcOH
reaction to form EOC (●) as a function of acid capacity of catalysts. T=150ºC, P=25 bar,
ROcOH/EtOH=1, W=1g, t=6h. Filled symbols represent prepared catalysts and open symbols
represent commercial resins.
Analysis of ISEC data in aqueous media gives valuable qualitative information on the resin
morphology in the reaction medium. In previous works, a successful correlation between the
morphology depicted from ISEC data of fully sulfonated resins and catalytic activity were
obtained for EOE synthesis. Apparently, EOE formation proceeds predominantly inside the
swollen polymer gel matrix. This fact is assumed as a consequence of the fact that catalytic
activity was much higher in gel-type polymers than macroreticular ones. Besides, steric
restrictions were minimized over the resins that presented a highly swollen gel-phase in water
ISEC measurements (chapter 3 and 4).
However, ISEC characterization technique was not able to predict the catalytic results in the
present work. As quoted in the literature, the morphological description deduced from aqueous
ISEC measurements is more complex on partially sulfonated resins [42]. This fact is a result of
the presence of both lipophilic and hydrophilic domains. As it was revealed, the initial
sulfonation stage influenced predominantly the more accessible, least dense, domains of the
polymer mass. In the OcOH / EtOH and OcOH / DEC mixtures, the interaction of the organic
moiety of OcOH with the unsulfonated polymer domains of the polymer skeleton most probably
swelled it. By means of swelling of the unfunctionalized domains, the steric conditions were also
improved in the sulfonated regions, as similarly observed by the presence of toluene in the
phenol alkylation [42].
8. Influence of the functionalization degree of acidic ion-exchange resins on EOE formation
118
Nevertheless, the sulfonated form of these potentially low dense domains (0.1-0.4 nm-2
) cannot
freely swell in ISEC measurements using water as solvent, due to hydrophobic surrounding
domains that prevent its expansion. Accordingly, they were not detected by aqueous ISEC
technique in the least sulfonated polymers (306, 406, 606) and only little expanded polymer with
high density (1.5 nm-2
) was observed (Fig. 8.4). The poor water swelling observed by means of
laser technique on low sulfonated resins would be consistent with this observation (Fig. 8.2). At
higher sulfonation degrees, the unsulfonated domain was highly reduced and cannot prevent
the fully expansion of the least crosslinked polymer domain. As a result, the less dense gel-
phase (0.1-0.4 nm-2
) was only detected by ISEC technique in the most sulfonated resins (806,
D806A, D806B).
8.4 Conclusions
The PS-DVB polymer used in this work presented a heterogeneous crosslinking degree within
the gel-phase. Thus, acid centers are placed in zones of the polymer with different density. At
the initial sulfonation stage, acid centers are only placed in the least dense domain of the
polymer mass. At higher functionalization degrees, acid centers are also located in the least
accessible zones of the resin.
Catalytic tests revealed the dependencies of the selectivity to EOE on the different polymer
domain. The last sulfonated domain of the polymer is poorly accessible for OcOH molecules. As
a result, the centers located in this domain are inefficient to produce EOE and DNOE. In
contrast, the entire polymer domain is accessible for EtOH and DEC molecules. Accordingly,
the latest acid centers added are only efficient to produce DEE.
It can be concluded that the EOE formation occurs mainly in the initially sulfonated, least dense
zone. In contrast, DEE is formed in the whole polymer matrix. Therefore, for production of long
chain ethers such as EOE or DNOE; which are preferred as diesel fuels using of partially
sulfonated in macroreticular exchanger catalysts would be advantageous.

Chapter 9
Summary and outlook
9. Summary and outlook
120
9.1 Summary
Ethyl octyl ether is a bioethanol-derived component that has excellent properties as diesel fuel.
This work proved that ethyl octyl ether can be produced successfully in liquid-phase at the
temperature range of 130-190ºC by using acidic ion-exchange resins, as suitable and economic
catalysts. The use of two promising reactants that can be a renewable compound source,
ethanol and diethyl carbonate, have been explored. Both reactants are able to ethylate 1-
octanol and form the desired product. However, an identical industrial drawback is observed on
both reactants, the loss of ethyl groups to form diethyl ether, which is not suitable as diesel
compound.
In order to minimize the diethyl ether formation, and in this way, to maximize the ethyl octyl
ether production; several commercial acidic resins were tested, or else, prepared and
subsequently tested. The best catalysts are those allowing 1-octanol to access to most sulfonic
groups of the catalyst. Such desired properties can be achieved by decreasing the amount of
crosslinking agent of resins, as a result, the resin has a high capacity to swell and at the same
time a low gel-phase density. Another tailoring technique that lets 1-octanol to access to the
vast majority of sulfonic groups is by locating them only in the least crosslinked domains of the
gel-phase. Both tailoring techniques involve higher selectivity to ethyl octyl ether, which can be
extrapolated to other bulky molecules. However, the former involves a reduction of the catalytic
activity per volume unit of the catalyst bed, and the latter, per mass unit.
Interestingly for the resin designers and exploiters, it is proved that the Inverse Steric Exclusion
Chromatography characterization technique allows predicting the catalyst performance in polar
environments with high accuracy. In such a manner that polymeric catalysts having high specific
volume of the swollen gel-phase and predominant domains with low polymer density are
desired to enhance selectivity and yield to ethyl octyl ether formation.
The comparison between both ethylating agents, ethanol and diethyl carbonate, revealed that
similar selectivity and yield can be potentially obtained over acidic resins. Nevertheless, diethyl
carbonate is less competitive at shorter reaction times in a batch reactor, or at lower catalyst
mass in continuous units, as a result of the slow decomposition of the required intermediate,
ethyl octyl carbonate. On the other hand, the production of CO2 via diethyl carbonate and the
availability of ethanol nowadays suggest that use of the alcohol to form ethyl octyl ether is
preferred.
Reaction rates to form ethyl octyl ether from ethanol and 1-octanol showed similar, or slightly
higher, dependency on the temperature than that to form the main side product, diethyl ether.
Thus, an enhancement of the reactor temperature clearly increases the feasibility of an ethyl
octyl ether production unit. Accordingly, the use of chlorinated resins, which proved to be
thermally stable up to 190ºC in the ethyl octyl ether production, is desired. Among the
commercial ones, Amberlyst 70 is the most suitable catalyst in terms of selectivity to ethyl octyl
9. Summary and outlook
121
ether due to its low polymer density in aqueous swollen state. Such polymeric expansion should
be taken into account to not block the liquid flow when fixed-bed reactors are employed. That is
to say, Amberlyst 70 must be loaded to the reactor in a swollen state.
The relatively large values found of the thermodynamic equilibrium constant of ethyl octyl ether
formation assure high conversion levels in an industrial etherification process. Interestingly, the
equilibrium values of the formation of diethyl ether are around a half than those of ethyl octyl
ether (150-190ºC). A comprehensive kinetic analysis enlightened that reaction rates to form
ethyl octyl ether on Amberlyst 70 are strongly inhibited by the presence of water. Thus, reaction
rates would be enhanced if most water is removed from bioethanol. Eventually, it was revealed
that production of ethyl octyl ether is optimized by using a molar ratio of 1-octanol / ethanol of
1.4, a particle diameter of Amberlyst 70 of less than 0.63 mm and a reactor temperature of
190ºC. If it is desired to maximize the difference between the formation of ethyl octyl ether rate
and the diethyl ether one, it is preferred to work on a higher excess of 1-octanol involving a 3.40
1-octanol / ethanol molar ratio.
9. Summary and outlook
122
9.2 Outlook
Catalyst screening data revealed that most catalytic performance can be qualitatively predicted
by ISEC technique, as well as several quoted studies in an aqueous environment. Industrially,
in most of the catalytic applications of ion-exchange resins, the catalysts operate in a partially or
entirely swollen state. Some representative examples are the production of bisphenol-A, MTBE,
ETBE or TAME. As it is well-known, the performance of comprehensive experimental catalytic
tests is economically and timely consuming. Accordingly, in order to prepare or select an
appropriated catalyst in these kinds of processes, ISEC measurements can provide economical
and highly valuable information. Therefore, the development of a commercial ISEC technique
can be really attracting from resin designers and exploiters. To the best of our knowledge, only
two homemade ISEC experimental set-ups are worldwide available.
As concerns the resin design, the exploration of some novel ion-exchangers can lead to
minimize the dramatic inhibitor effect of water on the reaction rates. In this line, the use of
acylation agent before sulfonation of the polymer carrier is claimed to reduce the high
hydrophilic character of the catalysts. Specifically for bioethanol derived ethers production, a
higher catalyst affinity towards lipophilic reactants would most possibly hinder the alcohol
adsorption on acid sites, but not in the same extent. The polarity of the compounds that
influence the production of such compounds follows this trend: long chain alcohol < ethanol <
water. The organic moiety of the long chain alcohol can contribute significantly to increase its
concentration inside a lipophilic resin. Thus, selectivity to diethyl ether would be highly
minimized. In addition, the loss of alcohol-resin affinity but also water-resin affinity could also
lead to interesting results.
The present work explored the possibility of using bioethanol to ethylate 1-octanol, and in this
way, to produce an excellent diesel fuel as ethyl octyl ether. Interesting conclusions have been
drawn from a technical standpoint by using acidic ion-exchange resins as catalysts. In case,
further research could be focused to overcome the difficulties of the scale up the process from
lab to industrial case, by process simulations or the use of an experimental pilot reactor.
Nonetheless, the low availability of 1-octanol nowadays implicates a too high price for ethyl octyl
ether as a petroleum derived product. Thus, conclusions extracted in this thesis can also be
qualitatively extrapolated to the synthesis of similar linear ethanol derived ethers. In this line, a
comprehensive exploration of the availability of long chain alcohols, or else long chain olefins,
available in the petroleum industry or, in the foreseeable future, in the promising biorefinery
industry, can overcome the economical drawback.
123
References
[1] BP, ―Energy outlook 2030.‖ 2011. [2] BP, ―Statistical review of world energy 2011.‖ 2012. [3] European Union, ―DIRECTIVE 2009/28/EC.‖ 2009. [4] US Energy Information Administration, ―Annual energy review 2011.‖ 2012. [5] European Biomass Industry Association, ―Bioethanol production and use. Overview of
the European market.‖ 2007. [6] Edgard Gnansounou and Arnaud Daviat, ―Ethanol fuel from biomass: a review,‖ J Sci
Ind Res, vol. 64, pp. 809–821, 2005. [7] K. L. Rock and M. Korpelshoek, ―Increasing refinery biofuels production,‖ PTQ Catal, pp.
45–51, 2008. [8] ―European Fuel Oxygenates Association (EFOA),‖ 2013. [Online]. Available:
http://www.efoa.org. [9] A. C. Hansen, Q. Zhang, and P. W.L. Lyne, ―Ethanol–diesel fuel blends––a review,‖
Biores Tech, vol. 96, pp. 277–285, 2005. [10] E. Benazzi, ―Gasoline and diesel imbalances in the Atlantic basin part 1: market
outlook.‖ 2011. [11] C. Millán, J. E. Gonzalez, F. Soriano, P. Aakko, C. Hamelinck, G. Vossen, and H.
Kattenwinkel, ―Blending ethanol in diesel.‖ 2007. [12] D. Casanave, J. Duplan, and E. Freund, ―Diesel fuels from biomass,‖ Pure Appl Chem,
vol. 79, pp. 2071–2081, 2007. [13] J. A. Melero, J. Vicente, M. Paniagua, G. Morales, and P. Muñoz, ―Etherification of
biodiesel-derived glycerol with ethanol for fuel formulation over sulfonic modified catalysts,‖ Biores Tech, vol. 103, pp. 142–151, 2012.
[14] D. Bradin, L. G. Grune, and M. Trivette, ―Alternative fuel and fuel additive compositions,‖ U.S. Patent WO 2007/061903 A1, 2007.
[15] J. Eberhard, ―Diesel fuel based on ethanol,‖ U.S. Patent 20100242347, 2010. [16] G. A. Olah, ―Cleaner burning and cetane enhancing diesel fuel supplements,‖ U.S.
Patent US 5520710, 1996. [17] M. Marchionna, R. Patrini, F. Giavazzi, M. Sposini, and P. Garibaldi, ―High cetane ethers
for the reformulation of diesel fuels,‖ presented at the 16th World Petroleum Congress, Calgary, Canada, 2000.
[18] G. C. Pecci, M. G. Clerici, F. Giavazzi, F. Ancillotti, M. Marchionna, and R. Patrini, ―Oxygenated diesel fuels-structure and properties correlation,‖ presented at the Proc IX Int Symp Alcohols Fuels, Firenze, Italy, 1991, vol. 1, pp. 321–335.
[19] R. Patrini and M. Marchionna, ―Process for the production of ethers from alcohols,‖ U.S. Patent US 6218583 B1, 2001.
[20] K. Seidel, C. Priebe, and D. Hollenberg, ―Emulsions,‖ U.S. Patent US 5830483, 1998. [21] A. Ansmann and B. Fabry, ―Cosmetic preparations,‖ U.S. Patent US 6878379B2, 2005. [22] C. Casas, R. Bringué, E. Ramírez, M. Iborra, and J. Tejero, ―Liquid-phase dehydration
of 1-octanol, 1-hexanol and 1-pentanol to linear symmetrical ethers over ion exchange resins,‖ Appl Catal A Gen, vol. 1, pp. 321–335, 2011.
[23] S. H. Brown, ―Process for the production of symmetrical ethers from secondary alcohols,‖ U.S. Patent US 5444168, 1995.
[24] M. Poliakoff, W. K. Gray, T. M. Swan, S. K. Ross, S. Wieland, and S. Roeder, ―Acid-catalyzed reactions,‖ U.S. Patent EP1185492, 2005.
[25] W. K. Gray, F. R. Smail, M. G. Hitzler, S. K. Ross, and M. Poliakoff, ―The continuous acid-catalyzed dehydration of alcohols in supercritical fluids: a new approach to the cleaner synthesis of acetals, ketals, and ethers with high selectivity,‖ J Am Chem Soc, vol. 121, pp. 10711–10718, 1999.
[26] R. Bringué, M. Iborra, J. Tejero, J. F. Izquierdo, F. Cunill, C. Fité, and V. J. Cruz, ―Thermally stable ion-exchange resins as catalysts for the liquid-phase dehydration of 1-pentanol to di-n-pentyl ether (DNPE),‖ J Catal, vol. 244, pp. 33–42, 2006.
[27] E. Medina, R. Bringué, J. Tejero, M. Iborra, and C. Fité, ―Conversion of 1-hexanol to di-n-hexyl ether on acidic catalysts,‖ Appl Catal A Gen, vol. 374, pp. 41–47, 2010.
[28] S. D. Alexandratos, ―Ion-exchange resins: a retrospective from Industrial and Engineering Chemistry Research,‖ Ind Eng Chem Res, vol. 48, pp. 388–398, 2009.
124
[29] B. Corain, M. Zecca, P. Canton, and P. Centomo, ―Synthesis and catalytic activity of metal nanoclusters inside functional resins: an endeavour lasting 15 years,‖ Phil Trans R Soc A, vol. 368, 2010.
[30] P. F. Siril, H. E. Cross, and D. R. Brown, ―New polystyrene sulfonic acid resin catalysts with enhanced acidic and catalytic properties,‖ J Mol Catal A Chem, vol. 279, pp. 63–68, 2008.
[31] S. Koujout and D. R. Brown, ―Calorimetric base adsorption and neutralisation studies of supported sulfonic acids,‖ Thermochim acta, vol. 434, 2005.
[32] A. Biffis, B. Corain, M. Zecca, C. Corvaja, and K. Jerabek, ―On the macromolecular structure and molecular accessibility of swollen microporous resins: a combined ESR-ISEC approach,‖ J Am Chem Soc, vol. 117, pp. 1603–1606, 1995.
[33] K. Jerabek, Cross-evaluation of strategie, size-exclusion chromatography. (Inverse steric exclusion chromatography as a tool for morphology characterization). Washington: ACS Symposium Series 635, 1996.
[34] K. Jerabek, ―Determination of pore volume distribution chromatography data from size exclusion,‖ Anal Chem, vol. 57, pp. 1595–1597, 1985.
[35] K. Jerabek, ―Characterization of swollen polymer gels using size exclusion chromatography,‖ Anal Chem, no. 57, pp. 1598–1602, 1985.
[36] P. Centomo, K. Jerabek, D. Canova, A. Sassi, P. Canton, B. Corain, and M. Zecca, ―Highly hydrophilic copolymers of N,N-dimethylacrylamide, acrylamido-2-methylpropanesulfonic acid, and Ethylenedimethacrylate: nanoscale morphology in the swollen state and use as exotemplates for synthesis of nanostructured ferric oxide,‖ Chem Pub Soc Eu, vol. 18, pp. 6632–6643, 2012.
[37] B. Corain, M. Zecca, and K. Jerabek, ―Catalysis and polymer networks—the role of morphology and molecular accessibility,‖ J Mol Catal A Chem, pp. 3–20, 2001.
[38] J. Tejero, F. Cunill, M. Iborra, J. F. Izquierdo, and C. Fité, ―Dehydration of 1-pentanol to di-n-pentyl ether over ion-exchange resin catalysts,‖ J Mol Catal A: Chem, vol. 182–183, pp. 541–554, 2002.
[39] M. R. Buchmeiser, Polymeric materials in organic synthesis and catalysis. Wiley-VCH, 2003.
[40] ―Purolite website.‖ [Online]. Available: www.purolite.com. [41] ―Dow Chemical website.‖ [Online]. Available: www.dow.com. [42] L. Hankova, L. Holub, and K. Jerabek, ―Relation between functionalization degree and
activity of strongly acidic polymer supported catalysts,‖ React Funct Polym, vol. 66, pp. 592–598, 2006.
[43] R. H. Perry and D. W. Green, Perry’s chemical engineers’ handbook, Seventh edition. McGraw-Hill, 1999.
[44] J. F. Izquierdo, F. Cunill, M. Iborra, J. Tejero, and C. Fité, Cinética de las reacciones químicas. Edicions de la Universitat de Barcelona, 2004.
[45] P. K. Kiviranta-Paakkonen, L. K. Struckmann, J. A. Linnekoski, and A. O. I. Krause, ―Dehydration of the alcohol in the etherification of isoamylenes with methanol and ethanol,‖ vol. 37, pp. 18–24, 1998.
[46] S. C. M. Reis, E. R. Lachter, R. S. V. Nascimento, J. A. Rodrigues, and M. Garcia, ―Transesterification of brazilian vegetable oils with methanol over ion-exchange resins,‖ J Am Oil Chem Soc, pp. 661–665, 2005.
[47] W. Liu and C. Tan, ―Liquid-phase esterification of propionic acid with n-butanol,‖ Ind Eng Chem Res, vol. 40, pp. 3281–3286, 2001.
[48] D. Kapila, ―Methods for preparing cycloalkylidene bisphenols,‖ U.S. Patent US 2005/0137428 A1, 2005.
[49] M. Girolamo, M. Lami, M. Marchionna, D. Sanflippo, M. Andreoni, A. Galletti, and G. Sbrana, ―Methanol carbonylation to methyl formate catalyzed by strongly basic resins,‖ Catal Lett, vol. 1–2, pp. 127–131, 1996.
[50] A. Bellamy, ―Reaction of supported fluoride ion with gaseous sulphur mustard,‖ React Polym, vol. 23, pp. 101–106, 1994.
[51] A. S. Ndou, N. Plint, and N. J. Coville, ―Dimerisation of ethanol to butanol over solid-base catalysts,‖ Appl Catal A Gen, vol. 251, pp. 337–345, 2003.
[52] T. Tsuchida, S. Sakuma, T. Takeguchi, and W. Ueda, ―Direct synthesis of n-butanol from ethanol over nonstoichiometric hydroxyapatite,‖ Ind Eng Chem Res, vol. 45, pp. 8634–8642, 2006.
125
[53] Y. Dekishima, E. I. Lan, C. R. Shen, K. M. Cho, and J. C. Liao, ―Extending carbon chain length of 1-butanol pathway for 1-hexanol synthesis from glucose by engineered Escherichia coli,‖ J Am Chem Soc, vol. 133, pp. 11399–11401, 2011.
[54] E. Medina, R. Bringué, J. Tejero, M. Iborra, C. Fité, J. F. Izquierdo, and F. Cunill, ―Dehydrocondensation of 1-hexanol to di-n-hexyl ether (DNHE) on Amberlyst 70,‖ presented at the European Congress of Chemical Engineering (ECCE-6), Copenhagen, 2007.
[55] T. Dogu and D. Varisli, ―Alcohols as alternatives to petroleum for environmentally clean fuels and petrochemicals,‖ Turk J Chem, vol. 31, pp. 551–567, 2007.
[56] L. Petrus, E. J. Stamhuis, and G. E. H. Joosten, ―Thermal deactivation of strong-acid ion-exchange resins in water,‖ Ind Eng Chem Res, vol. 20, pp. 366–371, 1981.
[57] D. M. Alonso, J. Q. Bond, J. C. Serrano-Ruiz, and J. A. Dumesic, ―Production of liquid hydrocarbon transportation fuels by oligomerization of biomass-derived C9 alkenes,‖ Green Chem, vol. 12, pp. 992–999, 2010.
[58] P. Tundo, L. Rossi, and A. Loris, ―Dimethyl carbonate as an ambident electrophile,‖ J Org Chem, vol. 70, pp. 2219–2224, 2005.
[59] P. N. Gooden, R. A. Bourne, A. J. Parrott, H. S. Bevinakatti, D. J. Irvine, and M. Poliakoff, ―Continuous acid-catalyzed methylations in supercritical carbon dioxide: comparison of methanol, dimethyl ether and dimethyl carbonate as methylating agents,‖ Org Process Res Dev, vol. 14, pp. 411–416, 2010.
[60] P. Tundo, F. Trotta, G. Moraglio, and F. Ligorati, ―Continuous-flow processes under gas-liquid phase-transfer catalysis (GL-PTC) conditions: the reaction of dialkyl carbonates with phenols, alcohols, and mercaptans,‖ Ind Eng Chem Res, vol. 27, pp. 1565–1571, 1988.
[61] B.C. Dunn, C. Guenneau, S.A. Hilton, J. Pahnke, and E.M. Eyring, ―Production of diethyl carbonate from ethanol and carbon monoxide over a heterogeneous catalyst,‖ vol. 16, pp. 177–181, 2002.
[62] N. Roh, B.C. Dunn, E.M. Eyring, R.J. Pugmire, and H. Meuzelaar, ―Production of diethyl carbonate from ethanol and carbon monoxide over a heterogeneous catalytic flow reactor,‖ Fuel Process Technol, vol. 83, pp. 27–38, 2003.
[63] T. Sakakura and K. Kohno, ―The synthesis of organic carbonates from carbon dioxide,‖ Chem Commun, pp. 1312–1330, 2009.
[64] N. Keller, G. Rebmann, and V. Keller, ―Catalysts, mechanisms and industrial processes for the dimethylcarbonate synthesis,‖ J Mol Catal A Chem, vol. 317, pp. 1–18, 2010.
[65] G. Centi and S. Perathoner, ―Opportunities and prospects in the chemical recycling of carbon dioxide to fuels,‖ Catal Today, vol. 148, pp. 191–205, 2009.
[66] H. Kurakata, Y. Izumi, and K. Aika, ―Ethanol synthesis from carbon dioxide on Ti02-supported [RhloSe] catalyst,‖ Chem Commun, pp. 389–390, 1996.
[67] Y. Izumi, ―Selective ethanol synthesis from carbon dioxide: roles of rhodium catalytic sites,‖ Platinum Met Rev, vol. 41, pp. 166–170, 1997.
[68] T. Sakakura, J. Choi, and H. Yasuda, ―Transformation of carbon dioxide,‖ Chem Rev, vol. 107, pp. 2365–2387, 2007.
[69] Rohm and Haas Company, ―Lab. Proc. for Testing AmberlystTM Polym. Catal,‖ 2004. [70] J. Tejero, C. Fité, M. Iborra, J. F. Izquierdo, F. Cunill, and R. Bringué, ―Liquid-phase
dehydrocondensation of 1-pentanol to di-n-pentyl ether (DNPE) over medium and large pore acidic zeolites,‖ Microporous Mesoporous Mater, vol. 117, pp. 650–660, 2009.
[71] R. Nel and A. Klerk, ―Dehydration of C5-C12 linear 1-alcohols over η-Alumina to fuel ethers,‖ Ind Eng Chem Res, vol. 48, pp. 5230–5238, 2009.
[72] P. Tundo, F. Arico, A. Rosamilia, and E. Memoli, ―Synthesis of dialkyl ethers by decarboxylation of dialkyl carbonates,‖ Green Chem, vol. 10, pp. 1182–1189, 2008.
[73] S. Pros, ―Synthesis of ethyl octyl ether over acidic ion-exchange resins,‖ University of Barcelona, 2009.
[74] S. Ihm, M. Chung, and K. Park, ―Activity difference between the internal and external sulfonic groups of macroreticular ion-exchange resin catalysts in isobutylene hydration,‖ Ind Eng Chem Res, vol. 27, pp. 41–45, 1988.
[75] D. Zhu, F. Mei, L. Chen, W. Mo, T. Li, and G. Li, ―An efficient catalyst Co(salophen) for synthesis of diethyl carbonate by oxidative carbonylation of ethanol,‖ Fuel, vol. 90, pp. 2098–2102, 2011.
[76] ―Orion Instruments website, dielectric constants data.‖ [Online]. Available: http://orioninstruments.com/html/tools/dielectric.aspx.
126
[77] S. R. Samms, S. Wasmus, and R. F. Savinell, ―Thermal stability of Nafion® in simulated fuel cell environments,‖ J Electrochem Soc, vol. 143, pp. 1498–1504, 1996.
[78] J. Zhang, L. Zhang, H. Liu, A. Sun, and R. Liu, Electrochemical technologies for energy storage and conversion. Weinheim (Germany): Wiley-VCH, 2012.
[79] D. M. Alonso, J. Q. Bond, D. Wang, and J. A. Dumesic, ―Activation of Amberlyst-70 for alkene oligomerization in hydrophobic media,‖ Top Catal, vol. 54, pp. 447–457, 2011.
[80] G. V. Samsonov and V. A. Pasechnik, ―Ion exchange and the swelling of ion-exchange resins,‖ Russ Chem Rev, vol. 38, pp. 547–565, 1969.
[81] B. C. Gates, J. S. Wisnouskas, and H. W. Heath, ―The dehydration of t-butyl alcohol catalyzed by sulfonic acid resin,‖ J Catal, vol. 24, pp. 320–327, 1972.
[82] B. C. Gates and W. Rodriguez, ―General and specific acid catalysis in sulfonic acid resin,‖ J Catal, vol. 31, pp. 27–31, 1973.
[83] R. Thornton and B. C. Gates, ―Catalysis by matrix-bound sulfonic acid groups: olefin and paraffin formation from butyl alcohols,‖ J Catal, vol. 34, pp. 275–287, 1974.
[84] R. Bringué, J. Tejero, M. Iborra, J. F. Izquierdo, C. Fité, and F. Cunill, ―Water effect on the kinetics of 1-pentanol dehydration to di-n-pentyl ether (DNPE) on Amberlyst 70,‖ Top Catal, vol. 45, pp. 181–186, 2007.
[85] A. A. Kiss, F. Omota, A. C. Dimian, and G. Rothenberg, ―The heterogeneous advantage: biodiesel by catalytic reactive distillation,‖ Top Catal, vol. 40, pp. 141–150, 2006.
[86] J. M. Aragon, J. M. R. Begas, and L. G. Jodra, ―Catalytic behavior of macroporous resins in catalytic processes with water production. Activation and inhibition effects in the kinetics of the self-condensation of cyclohexanone,‖ Ind Eng Chem Res, vol. 32, pp. 2555–2562, 1993.
[87] M. Iborra, C. Fité, J. Tejero, F. Cunill, and J. F. Izquierdo, ―Drying of acidic macroporous styrene-divinylbenzene resins,‖ React Polym, vol. 21, pp. 65–76, 1993.
[88] N. Bothe, F. Döscher, J. Klein, and H. Widdecke, ―Thermal stability of sulphonated styrene-divinylbenzene resins,‖ Polym, vol. 20, pp. 850–854, 1979.
[89] R. Bringué, E. Ramírez, C. Fité, M. Iborra, and J. Tejero, ―Kinetics of 1-pentanol etherification without water removal,‖ Ind Eng Chem Res, vol. 50, 2011.
[90] B. L. Yang, S. B. Yang, and R. Q. Yao, ―Synthesis of ethyl tert-butyl ether from tert-butyl alcohol and ethanol on strong acid cation-exchange resins,‖ React Funct Polym, vol. 44, pp. 167–175, 2000.
[91] U. Limbeck, C. Altwicker, U. Kunz, and U. Hoffmann, ―Rate expression for THF synthesis on acidic ion exchange resin,‖ Chem Eng Sci, vol. 56, pp. 2171–2178, 2001.
[92] B. C. Gates and J. N. Johanson, ―Langmuir-Hinshelwood kinetics of the dehydration of methanol catalyzed by cation exchange resin,‖ AlChE J, vol. 17, pp. 981–983, 1971.
[93] J.G. Nunan, K. Klier, and R.G. Herman, ―Methanol and 2-methyl-1-propanol (isobutanol) coupling to ethers and dehydration over Nafion H: selectivity, kinetics, and mechanism,‖ J Catal, vol. 139, pp. 406–420, 1993.
[94] J. Gangadwala, S. Mankar, and S. Mahajani, ―Esterification of acetic acid with butanol in the presence of ion-exchange resins as catalysts,‖ Ind Eng Chem Res, vol. 42, pp. 2146–2155, 2003.
[95] A. Delion, B. Torck, and M. Hellin, ―Equilibrium constant for the liquid-phase hydration of isobutylene over ion-exchange resin,‖ Ind Eng Chem Res, vol. 25, pp. 889–893, 1986.
[96] R. Bringué, J. Tejero, M. Iborra, J. F. Izquierdo, C. Fité, and F. Cunill, ―Experimental study of the chemical equilibria in the liquid-phase dehydration of 1-pentanol to di-n-pentyl ether,‖ Ind Eng Chem Res, vol. 46, pp. 6865–6872, 2007.
[97] R. Bringué, J. Tejero, M. Iborra, C. Fité, J. F. Izquierdo, and F. Cunill, ―Study of the chemical equilibrium of the liquid-phase dehydration of 1-hexanol to dihexyl ether,‖ J Chem Eng Data, vol. 53, pp. 2854–2860, 2008.
[98] C. Casas, C. Fité, M. Iborra, J. Tejero, and F. Cunill, ―Study of the chemical equilibrium of the liquid-phase dehydration of 1-octanol to 1-(octyloxy)octane,‖ J Chem Eng Data, vol. 58, pp. 741–748, 2013.
[99] R. Wittig, J. Lohmann, and J. Gmehling, ―Vapor-Liquid Equilibria by UNIFAC Group Contribution. 6. Revision and Extension,‖ Ind Eng Chem Res, vol. 42, pp. 183–188.
[100] G. Pilcher, A. S. Pell, and D. Coleman, ―Measurements of heats of combustion by flame calorimetry,‖ J Trans Faraday Soc, vol. 60, pp. 499–505, 1963.
[101] J. B. Pedley, R. D. Naylor, and S. P. Kirby, Thermochemical data of organic compounds. New York: Chapman and Hall, 1986.
127
[102] P. Kitchaiya and R. Datta, ―Ethers from ethanol. 2. reaction equilibria of simultaneous tert-amyl ethyl ether synthesis and isoamylene isomerization,‖ Ind Eng Chem Res, vol. 34, pp. 1092–1101, 1995.
[103] ―National Instititute of Standards and Technology database (NIST), US Department of Commerce.‖ [Online]. Available: http://nist.gov/.
[104] Y. M. Naziev, M. M. Bashirov, and Y. A. Badalov, ―Experimental study of isobaric specific heat of higher alcohols at high pressures,‖ J Eng Phys, vol. 51, pp. 1459–1464, 1986.
[105] J. C. Miltenburg, H. Gabrielova, and K. Ruzicka, ―Heat capacities and derived thermodynamic functions of 1-hexanol, 1-heptanol, 1-octanol, and 1-decanol between 5 K and 390 K,‖ J Chem Eng Data, vol. 48, pp. 1323–1331, 2003.
[106] M. W. Chase, NIST-JANAF Thermochemical Tables, 4th ed. J Phys Chem Ref Data, Monogr 9, 1998.
[107] R. W. Gallant, Physical properties of hydrocarbons, vol. Chapter 28. Lousiana: Gulf Publishing Company, 1970.
[108] R. C. Reid, J. M. Prausnitz, and B. E. Poling, The properties of gases and liquids, 4th ed., vol. Chapter 5. New York: McGraw-Hill, 1987.
[109] S. P. Verevkin, ―Improved Benson increments for the estimation of standard enthalpies of formation and enthalpies of vaporization of alkyl ethers, acetals, ketals, and ortho esters,‖ J Chem Eng Data, vol. 47, pp. 1071–1097, 2002.
[110] J. M. Smith and H. C. Ness, Introduction to chemical engineering thermodynamics, vol. Chapter 15. New York: McGraw-Hill, 1987.
[111] C. Mosselman and H. Dekker, ―Enthalpies of Formation of n-Alkan-1-ols,‖ J Chem Soc, Faraday Trans 1, vol. 71, pp. 417–424, 1975.
[112] K. Pihlaja and J. Heikkil, ―Heats of combustion. Diethyl ether and 1,1-diethoxyethane,‖ Acta Chem Scand, vol. 22, pp. 2731–2732, 1968.
[113] J. W. Murrin and S. Goldenhagen, ―Determination of the C-O bond energy from the heats of combustion of four aliphatic ethers,‖ U.S. Naval Powder Factory Research and Development Department, 1965.
[114] R. González, ―Performance of Amberlyst 35 in the synthesis of ETBE from ethanol and C4 cuts,‖ University of Barcelona, 2011.
[115] K. Jerabek, J. Odnoha, and K. Setinek, ―Kinetics of the synthesis of bisphenol A,‖ Appl Catal, vol. 36, 1988.
[116] F. Cunill, J. Tejero, C. Fité, M. Iborra, and J. F. Izquierdo, ―Conversion, selectivity, and kinetics of the dehydration of 1-pentanol to di-n-pentyl ether catalyzed by a microporous ion-exchange resin.,‖ Ind Eng Chem Res, vol. 44, pp. 318–324, 2005.
[117] J. D. Kemp, ―Process for the esterification of isobutene,‖ U.S. Patent US Patent US3678099, 1972.
[118] L. P. McMaster and E. R. Gilliland, ―Preparation and characterization of a modified ion-exchange resin,‖ Ind Eng Chem Prod Res Dev, vol. 11, pp. 97–105, 1972.
[119] H. Widdecke, J. Klein, and N. Bothe, ―The influence of neighbouring group effects on the stability and reactivity of ion exchange polymers,‖ Makromol Chem Suppl, vol. 6, pp. 211– 226, 1984.
[120] E. G. Lundquist, ―Catalyzed esterification process,‖ U.S. Patent US Patent 5426199. [121] S. Blagov, S. Parada, O. Bailer, P. Moritz, D. Lam, R. Weinand, and H. Hasse,
―Influence of ion-exchange resin catalysts on side reactions of the esterification of n-butanol with acetic acid,‖ Chem Eng Sci, no. 61, pp. 753–765, 2006.
[122] M. Kotora, C. Buchaly, P. Kreis, and A. Gorak, ―Reactive distillation -experimental data for propyl propionate synthesis,‖ Chem Pap, vol. 62, pp. 65–69, 2008.
[123] J. Lange, W. D. Graff, and R. J. Haan, ―Conversion of furfuryl alcohol into ethyl levulinate using solid acid catalysts,‖ ChemSusChem, vol. 2, pp. 437–441, 2009.
[124] C. Pirola, C. L. Bianchi, D. C. Boffito, G. Carvoli, and V. Ragaini, ―Vegetable oil deacidification by Amberlyst: study of the catalyst lifetime and a suitable reactor configuration,‖ Ind Eng Chem Res, vol. 49, pp. 4601–4606, 2010.
[125] M. Cadenas, R. Bringué, C. Fité, E. Ramírez, and F. Cunill, ―Liquid-phase oligomerization of 1-hexene catalyzed by macroporous ion-exchange resins,‖ Top Catal, vol. 54, no. 998–1008, p. 2011.
[126] M. Granollers, J. F. Izquierdo, and F. Cunill, ―Effect of macroreticular acidic ion-exchange resins on 2-methyl-1-butene and 2-methyl-2-butene mixture oligomerization,‖ Appl Catal A Gen, vol. 345–346, pp. 163–171, 2012.
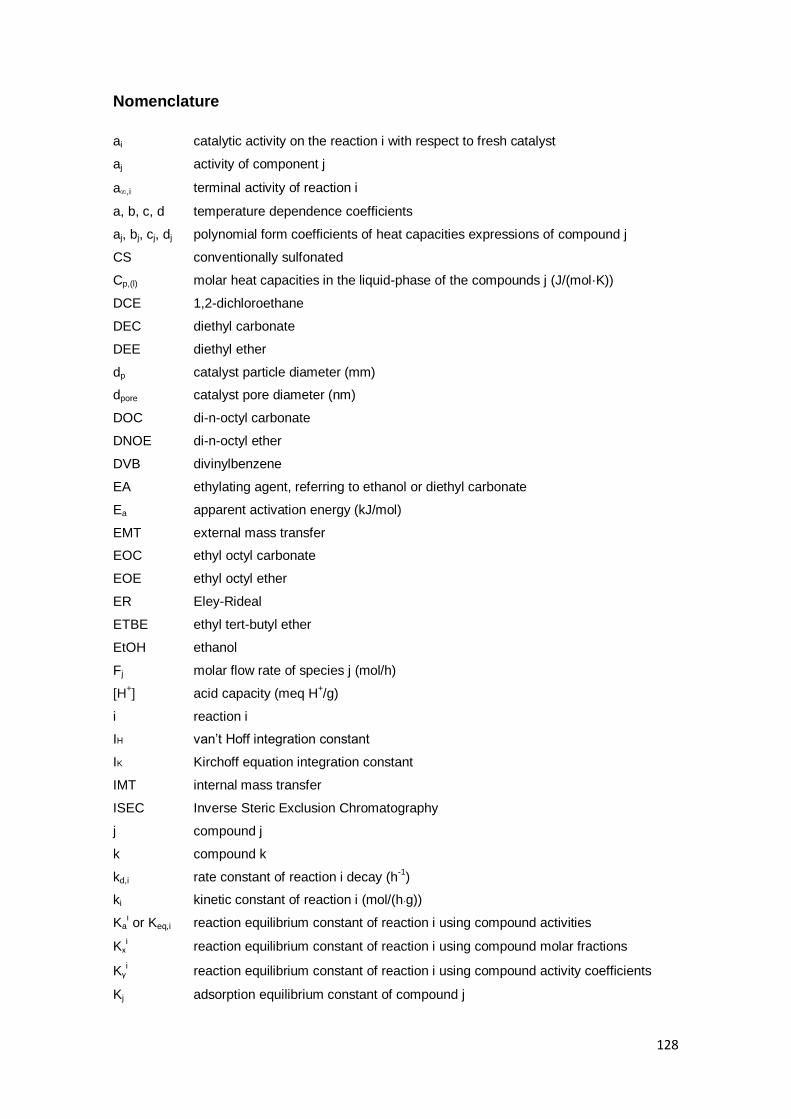
128
Nomenclature
ai catalytic activity on the reaction i with respect to fresh catalyst
aj activity of component j
a,i terminal activity of reaction i
a, b, c, d temperature dependence coefficients
aj, bj, cj, dj polynomial form coefficients of heat capacities expressions of compound j
CS conventionally sulfonated
Cp,(l) molar heat capacities in the liquid-phase of the compounds j (J/(mol·K))
DCE 1,2-dichloroethane
DEC diethyl carbonate
DEE diethyl ether
dp catalyst particle diameter (mm)
dpore catalyst pore diameter (nm)
DOC di-n-octyl carbonate
DNOE di-n-octyl ether
DVB divinylbenzene
EA ethylating agent, referring to ethanol or diethyl carbonate
Ea apparent activation energy (kJ/mol)
EMT external mass transfer
EOC ethyl octyl carbonate
EOE ethyl octyl ether
ER Eley-Rideal
ETBE ethyl tert-butyl ether
EtOH ethanol
Fj molar flow rate of species j (mol/h)
[H+] acid capacity (meq H
+/g)
i reaction i
IH van’t Hoff integration constant
IK Kirchoff equation integration constant
IMT internal mass transfer
ISEC Inverse Steric Exclusion Chromatography
j compound j
k compound k
kd,i rate constant of reaction i decay (h-1
)
ki kinetic constant of reaction i (mol/(h·g))
Kai or Keq,i reaction equilibrium constant of reaction i using compound activities
Kxi reaction equilibrium constant of reaction i using compound molar fractions
Kγi reaction equilibrium constant of reaction i using compound activity coefficients
Kj adsorption equilibrium constant of compound j
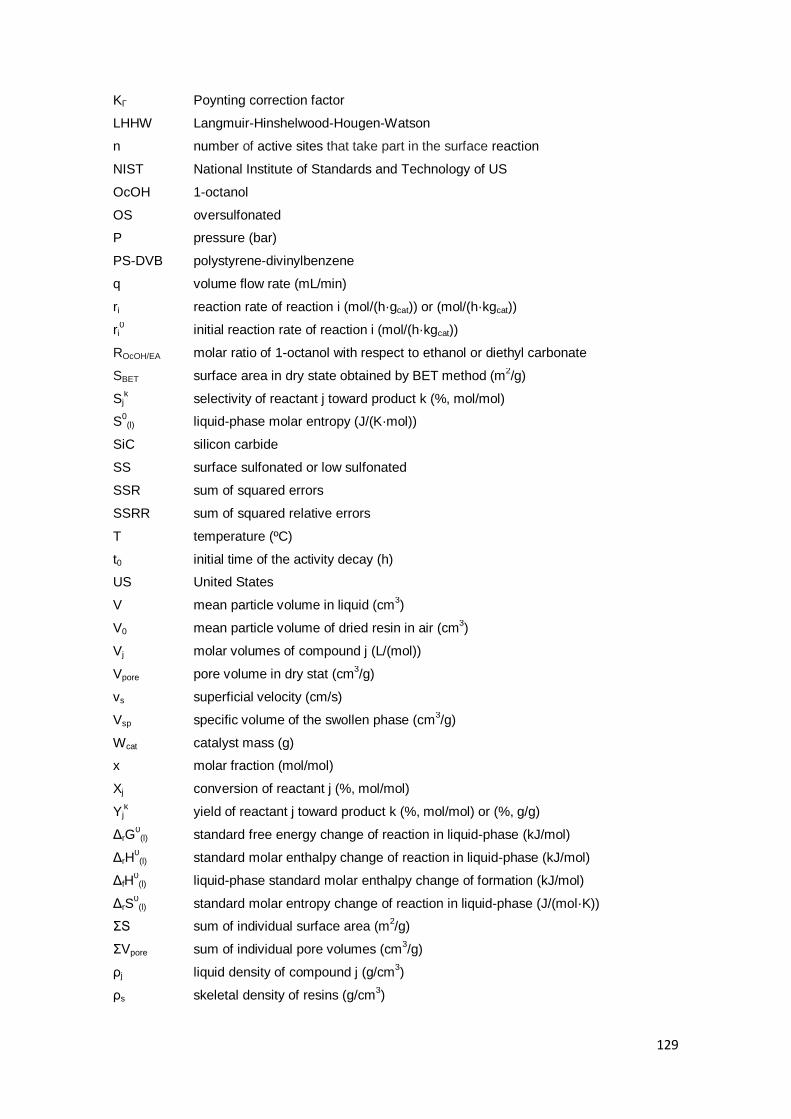
129
KΓ Poynting correction factor
LHHW Langmuir-Hinshelwood-Hougen-Watson
n number of active sites that take part in the surface reaction
NIST National Institute of Standards and Technology of US
OcOH 1-octanol
OS oversulfonated
P pressure (bar)
PS-DVB polystyrene-divinylbenzene
q volume flow rate (mL/min)
ri reaction rate of reaction i (mol/(h·gcat)) or (mol/(h·kgcat))
ri0 initial reaction rate of reaction i (mol/(h·kgcat))
ROcOH/EA molar ratio of 1-octanol with respect to ethanol or diethyl carbonate
SBET surface area in dry state obtained by BET method (m2/g)
Sjk selectivity of reactant j toward product k (%, mol/mol)
S0
(l) liquid-phase molar entropy (J/(K·mol))
SiC silicon carbide
SS surface sulfonated or low sulfonated
SSR sum of squared errors
SSRR sum of squared relative errors
T temperature (ºC)
t0 initial time of the activity decay (h)
US United States
V mean particle volume in liquid (cm3)
V0 mean particle volume of dried resin in air (cm3)
Vj molar volumes of compound j (L/(mol))
Vpore pore volume in dry stat (cm3/g)
vs superficial velocity (cm/s)
Vsp specific volume of the swollen phase (cm3/g)
Wcat catalyst mass (g)
x molar fraction (mol/mol)
Xj conversion of reactant j (%, mol/mol)
Yjk yield of reactant j toward product k (%, mol/mol) or (%, g/g)
ΔrG0(l) standard free energy change of reaction in liquid-phase (kJ/mol)
ΔrH0(l) standard molar enthalpy change of reaction in liquid-phase (kJ/mol)
ΔfH0(l) liquid-phase standard molar enthalpy change of formation (kJ/mol)
ΔrS0(l) standard molar entropy change of reaction in liquid-phase (J/(mol·K))
ΣS sum of individual surface area (m2/g)
ΣVpore sum of individual pore volumes (cm3/g)
ρj liquid density of compound j (g/cm3)
ρs skeletal density of resins (g/cm3)
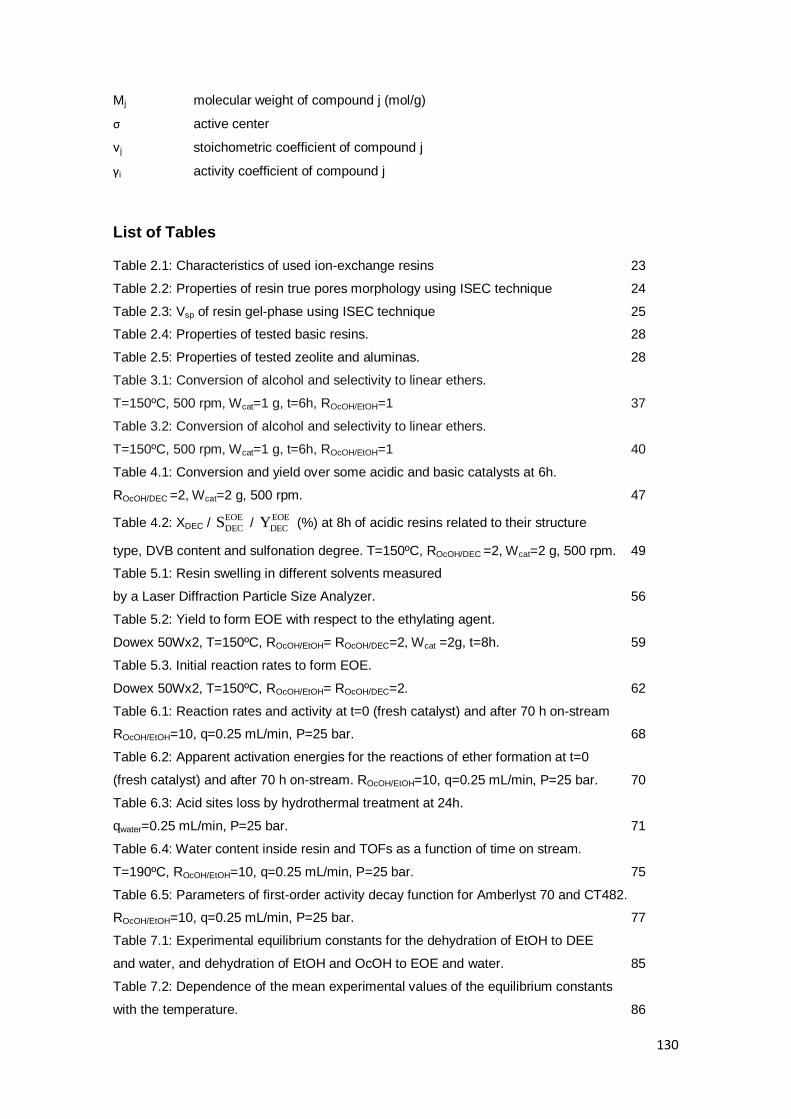
130
Mj molecular weight of compound j (mol/g)
σ active center
νj stoichometric coefficient of compound j
γi activity coefficient of compound j
List of Tables
Table 2.1: Characteristics of used ion-exchange resins 23
Table 2.2: Properties of resin true pores morphology using ISEC technique 24
Table 2.3: Vsp of resin gel-phase using ISEC technique 25
Table 2.4: Properties of tested basic resins. 28
Table 2.5: Properties of tested zeolite and aluminas. 28
Table 3.1: Conversion of alcohol and selectivity to linear ethers.
T=150ºC, 500 rpm, Wcat=1 g, t=6h, ROcOH/EtOH=1 37
Table 3.2: Conversion of alcohol and selectivity to linear ethers.
T=150ºC, 500 rpm, Wcat=1 g, t=6h, ROcOH/EtOH=1 40
Table 4.1: Conversion and yield over some acidic and basic catalysts at 6h.
ROcOH/DEC =2, Wcat=2 g, 500 rpm. 47
Table 4.2: XDEC / EOE
DECS / EOE
DECY (%) at 8h of acidic resins related to their structure
type, DVB content and sulfonation degree. T=150ºC, ROcOH/DEC =2, Wcat=2 g, 500 rpm. 49
Table 5.1: Resin swelling in different solvents measured
by a Laser Diffraction Particle Size Analyzer. 56
Table 5.2: Yield to form EOE with respect to the ethylating agent.
Dowex 50Wx2, T=150ºC, ROcOH/EtOH= ROcOH/DEC=2, Wcat =2g, t=8h. 59
Table 5.3. Initial reaction rates to form EOE.
Dowex 50Wx2, T=150ºC, ROcOH/EtOH= ROcOH/DEC=2. 62
Table 6.1: Reaction rates and activity at t=0 (fresh catalyst) and after 70 h on-stream
ROcOH/EtOH=10, q=0.25 mL/min, P=25 bar. 68
Table 6.2: Apparent activation energies for the reactions of ether formation at t=0
(fresh catalyst) and after 70 h on-stream. ROcOH/EtOH=10, q=0.25 mL/min, P=25 bar. 70
Table 6.3: Acid sites loss by hydrothermal treatment at 24h.
qwater=0.25 mL/min, P=25 bar. 71
Table 6.4: Water content inside resin and TOFs as a function of time on stream.
T=190ºC, ROcOH/EtOH=10, q=0.25 mL/min, P=25 bar. 75
Table 6.5: Parameters of first-order activity decay function for Amberlyst 70 and CT482.
ROcOH/EtOH=10, q=0.25 mL/min, P=25 bar. 77
Table 7.1: Experimental equilibrium constants for the dehydration of EtOH to DEE
and water, and dehydration of EtOH and OcOH to EOE and water. 85
Table 7.2: Dependence of the mean experimental values of the equilibrium constants
with the temperature. 86
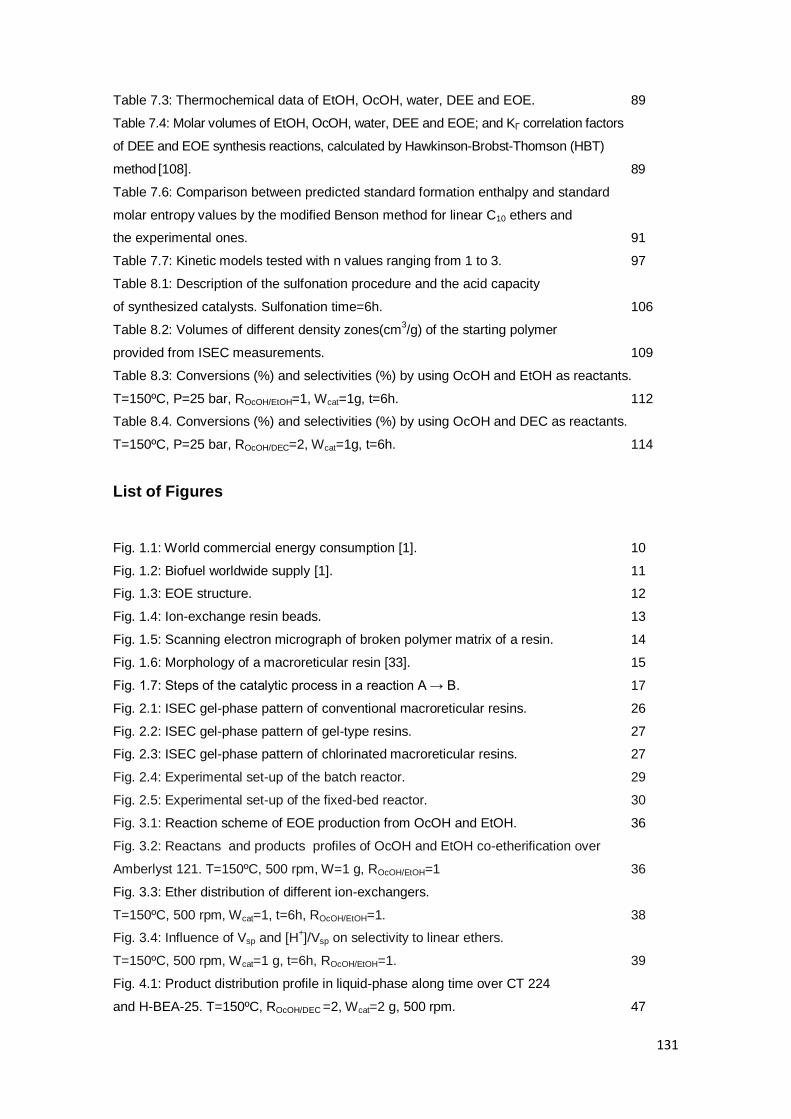
131
Table 7.3: Thermochemical data of EtOH, OcOH, water, DEE and EOE. 89
Table 7.4: Molar volumes of EtOH, OcOH, water, DEE and EOE; and KΓ correlation factors
of DEE and EOE synthesis reactions, calculated by Hawkinson-Brobst-Thomson (HBT)
method [108]. 89
Table 7.6: Comparison between predicted standard formation enthalpy and standard
molar entropy values by the modified Benson method for linear C10 ethers and
the experimental ones. 91
Table 7.7: Kinetic models tested with n values ranging from 1 to 3. 97
Table 8.1: Description of the sulfonation procedure and the acid capacity
of synthesized catalysts. Sulfonation time=6h. 106
Table 8.2: Volumes of different density zones(cm3/g) of the starting polymer
provided from ISEC measurements. 109
Table 8.3: Conversions (%) and selectivities (%) by using OcOH and EtOH as reactants.
T=150ºC, P=25 bar, ROcOH/EtOH=1, Wcat=1g, t=6h. 112
Table 8.4. Conversions (%) and selectivities (%) by using OcOH and DEC as reactants.
T=150ºC, P=25 bar, ROcOH/DEC=2, Wcat=1g, t=6h. 114
List of Figures
Fig. 1.1: World commercial energy consumption [1]. 10
Fig. 1.2: Biofuel worldwide supply [1]. 11
Fig. 1.3: EOE structure. 12
Fig. 1.4: Ion-exchange resin beads. 13
Fig. 1.5: Scanning electron micrograph of broken polymer matrix of a resin. 14
Fig. 1.6: Morphology of a macroreticular resin [33]. 15
Fig. 1.7: Steps of the catalytic process in a reaction A → B. 17
Fig. 2.1: ISEC gel-phase pattern of conventional macroreticular resins. 26
Fig. 2.2: ISEC gel-phase pattern of gel-type resins. 27
Fig. 2.3: ISEC gel-phase pattern of chlorinated macroreticular resins. 27
Fig. 2.4: Experimental set-up of the batch reactor. 29
Fig. 2.5: Experimental set-up of the fixed-bed reactor. 30
Fig. 3.1: Reaction scheme of EOE production from OcOH and EtOH. 36
Fig. 3.2: Reactans and products profiles of OcOH and EtOH co-etherification over
Amberlyst 121. T=150ºC, 500 rpm, W=1 g, ROcOH/EtOH=1 36
Fig. 3.3: Ether distribution of different ion-exchangers.
T=150ºC, 500 rpm, Wcat=1, t=6h, ROcOH/EtOH=1. 38
Fig. 3.4: Influence of Vsp and [H+]/Vsp on selectivity to linear ethers.
T=150ºC, 500 rpm, Wcat=1 g, t=6h, ROcOH/EtOH=1. 39
Fig. 4.1: Product distribution profile in liquid-phase along time over CT 224
and H-BEA-25. T=150ºC, ROcOH/DEC =2, Wcat=2 g, 500 rpm. 47
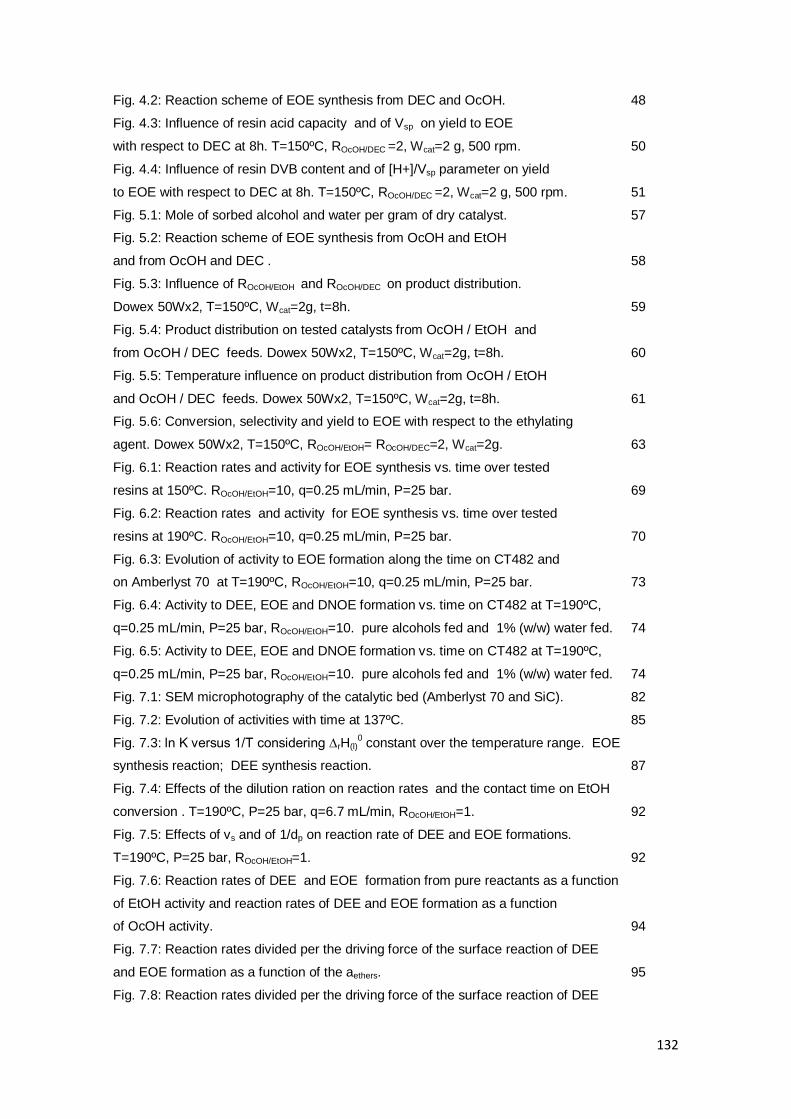
132
Fig. 4.2: Reaction scheme of EOE synthesis from DEC and OcOH. 48
Fig. 4.3: Influence of resin acid capacity and of Vsp on yield to EOE
with respect to DEC at 8h. T=150ºC, ROcOH/DEC =2, Wcat=2 g, 500 rpm. 50
Fig. 4.4: Influence of resin DVB content and of [H+]/Vsp parameter on yield
to EOE with respect to DEC at 8h. T=150ºC, ROcOH/DEC =2, Wcat=2 g, 500 rpm. 51
Fig. 5.1: Mole of sorbed alcohol and water per gram of dry catalyst. 57
Fig. 5.2: Reaction scheme of EOE synthesis from OcOH and EtOH
and from OcOH and DEC . 58
Fig. 5.3: Influence of ROcOH/EtOH and ROcOH/DEC on product distribution.
Dowex 50Wx2, T=150ºC, Wcat=2g, t=8h. 59
Fig. 5.4: Product distribution on tested catalysts from OcOH / EtOH and
from OcOH / DEC feeds. Dowex 50Wx2, T=150ºC, Wcat=2g, t=8h. 60
Fig. 5.5: Temperature influence on product distribution from OcOH / EtOH
and OcOH / DEC feeds. Dowex 50Wx2, T=150ºC, Wcat=2g, t=8h. 61
Fig. 5.6: Conversion, selectivity and yield to EOE with respect to the ethylating
agent. Dowex 50Wx2, T=150ºC, ROcOH/EtOH= ROcOH/DEC=2, Wcat=2g. 63
Fig. 6.1: Reaction rates and activity for EOE synthesis vs. time over tested
resins at 150ºC. ROcOH/EtOH=10, q=0.25 mL/min, P=25 bar. 69
Fig. 6.2: Reaction rates and activity for EOE synthesis vs. time over tested
resins at 190ºC. ROcOH/EtOH=10, q=0.25 mL/min, P=25 bar. 70
Fig. 6.3: Evolution of activity to EOE formation along the time on CT482 and
on Amberlyst 70 at T=190ºC, ROcOH/EtOH=10, q=0.25 mL/min, P=25 bar. 73
Fig. 6.4: Activity to DEE, EOE and DNOE formation vs. time on CT482 at T=190ºC,
q=0.25 mL/min, P=25 bar, ROcOH/EtOH=10. pure alcohols fed and 1% (w/w) water fed. 74
Fig. 6.5: Activity to DEE, EOE and DNOE formation vs. time on CT482 at T=190ºC,
q=0.25 mL/min, P=25 bar, ROcOH/EtOH=10. pure alcohols fed and 1% (w/w) water fed. 74
Fig. 7.1: SEM microphotography of the catalytic bed (Amberlyst 70 and SiC). 82
Fig. 7.2: Evolution of activities with time at 137ºC. 85
Fig. 7.3: ln K versus 1/T considering ∆rH(l)0 constant over the temperature range. EOE
synthesis reaction; DEE synthesis reaction. 87
Fig. 7.4: Effects of the dilution ration on reaction rates and the contact time on EtOH
conversion . T=190ºC, P=25 bar, q=6.7 mL/min, ROcOH/EtOH=1. 92
Fig. 7.5: Effects of vs and of 1/dp on reaction rate of DEE and EOE formations.
T=190ºC, P=25 bar, ROcOH/EtOH=1. 92
Fig. 7.6: Reaction rates of DEE and EOE formation from pure reactants as a function
of EtOH activity and reaction rates of DEE and EOE formation as a function
of OcOH activity. 94
Fig. 7.7: Reaction rates divided per the driving force of the surface reaction of DEE
and EOE formation as a function of the aethers. 95
Fig. 7.8: Reaction rates divided per the driving force of the surface reaction of DEE

133
and EOE formation as a function of the aw. 96
Fig. 7.9: Comparison of goodness of fit in terms of SSRRmin/SSRR of DEE and EOE
formations. 98
Fig. 7.10: Calculated reaction rates by eq. 7.25 and by eq. 7.26 versus
experimental rates. 99
Fig. 7.11: Residuals distribution for eq. 7.25 and by eq. 7.26 . 99
Fig. 7.12: Arrhenius plot of the kinetic term of DEE and of EOE formations. 100
Fig. 8.1: BET surface area of the resins versus the acid capacity. 107
Fig. 8.2: Volume resin swelling versus the acid capacity of the resins. 108
Fig. 8.3: ISEC pattern of the true pores. 110
Fig. 8.4: ISEC pattern of the gel-phase. 111
Fig. 8.5: Proposed morphological scheme of the sulfonation process. 111
Fig. 8.6: OcOH and EtOH conversion as a function of acid capacity of catalysts.
T=150ºC, P=25 bar, ROcOH/EtOH=1, W=1g, t=6h. 113
Fig. 8.7: Moles of DEE, EOE and DNOE formed from OcOH and EtOH on the
sulfonated catalysts. T=150ºC, P=25 bar, ROcOH/OcOH=1, Wcat=1g, t=6h. 114
Fig. 8.8: OcOH and DEC conversion as a function of acid capacity of catalysts.
T=150ºC, P=25 bar, ROcOH/DEC=2, W=1g, t=6h. 115
Fig. 8.9: Moles of DEE, EOE+EOC and DNOE+DOC formed from OcOH
and DEC reaction on the catalysts. T=150ºC, P=25 bar, ROcOH/DEC=1, W=1g, t=6h. 116
Fig. 8.10: TOFrel of EtOH and OcOH reaction to form EOE and TOFrel of DEC
and OcOH reaction to form EOC as a function of acid capacity of catalysts.
T=150ºC, P=25 bar, ROcOH/EtOH=1, W=1g, t=6h. 117


Resum del treball (català)
Resum curt
Des del 1900, la població mundial s’ha més que quadruplicat, els ingressos econòmics de la
qual ha augmentat en un factor de 25 i el consum d’energia per un factor de 23. En els proper
anys no s’espera un creixement de la demanda energètica dels països ja desenvolupats, però
sí de les economies emergents, amb Xina liderant majoritàriament aquesta demanda. A
conseqüència de polítiques de suport a les energies renovables, els alts preus del petroli i les
innovacions tecnològiques, es preveu que aquestes seguiran tenint una ràpida expansió. Entre
elles, el bioetanol es preveu que tindrà un creixement exponencial en els propers anys.
El bioetanol té grans propietats en motors d’ignició, i actualment és mesclat amb les gasolines
o usat directament. No obstant, utilitzar bioetanol per produir èters com l’ETBE, TAME i TAEE
millora substancialment la qualitat de la gasolina, a més de ser energèticament més eficient. De
la mateixa manera, la utilització de bioetanol per produir compostos diesel seria una forma
d’incrementar la producció de diesel (deficitària a Europa), i tan o més important, de millorar-ne
la qualitat i així reduir les emissions nocives de material particulat, òxids de nitrogen, sofre i
compostos volàtils. Un èter derivat del bioetanol que té excel·lents propietats com a
combustible diesel és l’etil octil èter.
L’objectiu d’aquest treball és l’estudi de la producció d’etil octil èter en fase líquida mitjançant
catalitzadors heterogenis. Això implica la selecció dels reactius i catalitzadors més adequats
des d’un punt de vista de rendiment i selectivitat. A més, l’estudi termodinàmic i cinètic de la
reacció en permeten tan el disseny com la optimització del procés.
Els assajos catalítics s’han realitzat en un reactor de tanc agitat operant en discontinu i en un
reactor tubular operant en continu. El reactor discontinu s’ha utilitzat per la selecció dels millors
catalitzadors i per l’estudi termodinàmic de la reacció; i el reactor tubular per estudiar l’evolució
de l’activitat catalítica al llarg del temps i per realitzar-ne l’estudi cinètic. Ambdós reactors han
treballat a 25 bars de pressió i en un rang de temperatures de 130 a 190ºC. L’anàlisi de les
mostres s’ha realitzat en un cromatògraf equipat amb un TCD, injectades directament des del
reactor. Els reactius utilitzats han sigut etanol, dietil carbonat i 1-octanol. La majoria de
catalitzadors utilitzats han sigut resines poliestirèniques de bescanvi iònic. Les resines
seleccionades tenien diferent capacitat àcida, grau d’encreuament, estructura reticular i
estabilitat tèrmica.
Els resultats experimentals han mostrat que el compost etil octil èter es pot formar mitjançant
l’etilació de 1-octanol a partir de dos reactius provinents d’origen renovable, l’etanol i el dietil
carbonat. No obstant, la mateixa problemàtica econòmica és observada en ambdós compostos,
la pèrdua de grups etils en la formació de dietil èter; el qual, tot i provenir d’una font totalment
renovable, no presenta tan bones propietats com a component diesel com l’etil octil èter.
Per tal de minimitzar la formació de dietil èter, i d’aquesta forma, maximitzar la producció d’etil
octil èter, diverses resines àcides de bescanvi iònic comercials han sigut assajades, o bé,
preparades i assajades. S’ha observat que els millors catalitzadors eren els que permeten al 1-
octanol accedir a la majoria de grups sulfònics del catalitzador. Aquest tipus de resines són les
que posseeixen un menor quantitat d’agent reticulant, concretament de divinilbenzè. Una altra
tècnica per permetre al 1-octanol accedir a la gran majoria de centres actius és col·locant els
grups sulfònics només en el domini menys reticulat de la fase gel. Ambdós tècniques impliquen
una major selectivitat cap a etil octil èter, extrapolable a altres molècules voluminoses. Tot i
això, cal tenir present que la primera tècnica implica una reducció en la eficiència per unitat de
volum del llit catalític, i la segona, per unitat màssica. Un fet molt rellevant observat en aquest
treball és que la caracterització de les resines mitjançant de cromatogràfica inversa d’exclusió
de grandaria permet predir l’activitat catalítica en un medi polar amb gran exactitud. D’aquesta
forma, les resines àcides que presenten un elevat volum específic de fase gel inflada i en les
que predomina els dominis de baixa densitat polimèrica són les més desitjades per incrementar
la selectivitat i el rendiment cap a etil octil èter.
La comparació del dos agents etilants, etanol i dietil carbonat, ha revelat que es poden obtenir
similars selectivitats i rendiments en temps de reacció elevats mitjançant resines àcides de
bescanvi iònic. Tanmateix, l’ús de dietil carbonat és menys competitiu en temps de reacció
curts, a conseqüència de la lenta descomposició de l’intermedi de la reacció, l’etil octil carbonat.
A més, la formació de CO2 via dietil carbonat i la més alta disponibilitat d’etanol suggereix que
l’ús de l’alcohol és preferit des d’un punts de vista tan industrial com ambiental.
L’estudi termodinàmic ha revelat que els valors relativament alts de la constant termodinàmica
d’equilibri químic en la formació de l’etil octil èter asseguren alts nivells de conversió en un
procés industrial. A més, s’ha observat que la constant d’equilibri de la reacció competitiva de
formació de dietil èter té valors inferiors en el rang de temperatures explorat, fet que en limitaria
la seva formació. Finalment, un exhaustiu estudi cinètic ha revelat que la velocitat de formació
d’etil octil èter a partir d’etanol i 1-octanol és altament inhibit per l’adsorció de l’aigua en els
centres actius d’Amberlyst 70. Per això, l’extracció de l’aigua provinent del bioetanol afavoriria
la producció d’etil octil èter. Finalment, s’ha observat que les velocitats de reacció són
optimitzades utilitzant una raó molar 1-octanol / etanol de 1.4, un diàmetre de partícula menor a
0.63 mm d’Amberlyst 70 i una temperatura de reactor de 190ºC. En el cas de voler maximitzar
la diferència entre la formació d’etil octil èter i dietil èter, és preferible treballar amb un excés
més elevat de 1-octanol fins a una raó molar de 1-octanol / etanol de 3.4.
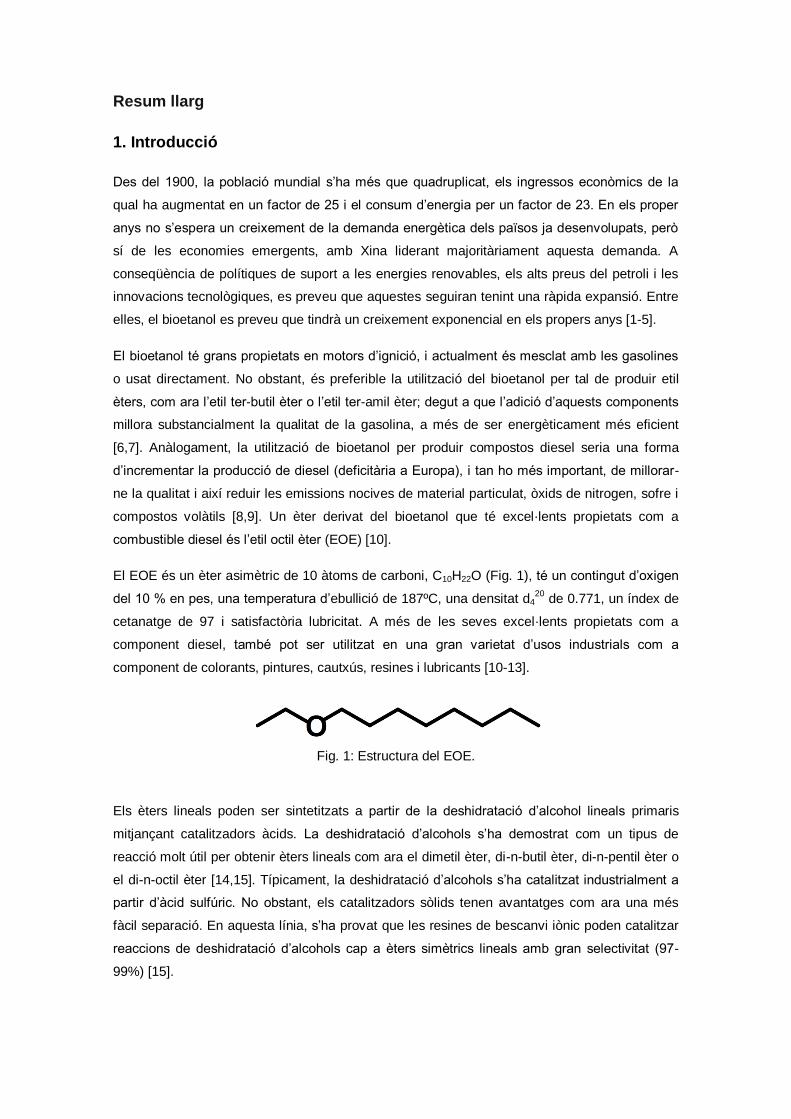
Resum llarg
1. Introducció
Des del 1900, la població mundial s’ha més que quadruplicat, els ingressos econòmics de la
qual ha augmentat en un factor de 25 i el consum d’energia per un factor de 23. En els proper
anys no s’espera un creixement de la demanda energètica dels països ja desenvolupats, però
sí de les economies emergents, amb Xina liderant majoritàriament aquesta demanda. A
conseqüència de polítiques de suport a les energies renovables, els alts preus del petroli i les
innovacions tecnològiques, es preveu que aquestes seguiran tenint una ràpida expansió. Entre
elles, el bioetanol es preveu que tindrà un creixement exponencial en els propers anys [1-5].
El bioetanol té grans propietats en motors d’ignició, i actualment és mesclat amb les gasolines
o usat directament. No obstant, és preferible la utilització del bioetanol per tal de produir etil
èters, com ara l’etil ter-butil èter o l’etil ter-amil èter; degut a que l’adició d’aquests components
millora substancialment la qualitat de la gasolina, a més de ser energèticament més eficient
[6,7]. Anàlogament, la utilització de bioetanol per produir compostos diesel seria una forma
d’incrementar la producció de diesel (deficitària a Europa), i tan ho més important, de millorar-
ne la qualitat i així reduir les emissions nocives de material particulat, òxids de nitrogen, sofre i
compostos volàtils [8,9]. Un èter derivat del bioetanol que té excel·lents propietats com a
combustible diesel és l’etil octil èter (EOE) [10].
El EOE és un èter asimètric de 10 àtoms de carboni, C10H22O (Fig. 1), té un contingut d’oxigen
del 10 % en pes, una temperatura d’ebullició de 187ºC, una densitat d420
de 0.771, un índex de
cetanatge de 97 i satisfactòria lubricitat. A més de les seves excel·lents propietats com a
component diesel, també pot ser utilitzat en una gran varietat d’usos industrials com a
component de colorants, pintures, cautxús, resines i lubricants [10-13].
Fig. 1: Estructura del EOE.
Els èters lineals poden ser sintetitzats a partir de la deshidratació d’alcohol lineals primaris
mitjançant catalitzadors àcids. La deshidratació d’alcohols s’ha demostrat com un tipus de
reacció molt útil per obtenir èters lineals com ara el dimetil èter, di-n-butil èter, di-n-pentil èter o
el di-n-octil èter [14,15]. Típicament, la deshidratació d’alcohols s’ha catalitzat industrialment a
partir d’àcid sulfúric. No obstant, els catalitzadors sòlids tenen avantatges com ara una més
fàcil separació. En aquesta línia, s’ha provat que les resines de bescanvi iònic poden catalitzar
reaccions de deshidratació d’alcohols cap a èters simètrics lineals amb gran selectivitat (97-
99%) [15].
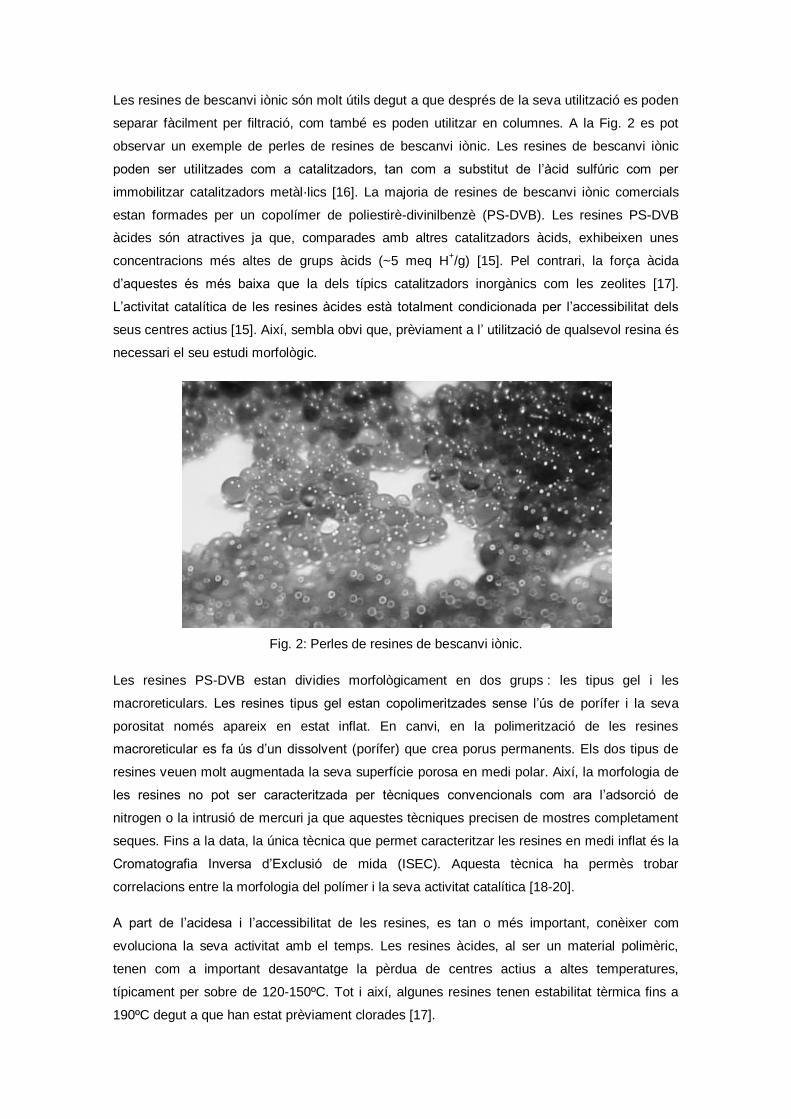
Les resines de bescanvi iònic són molt útils degut a que després de la seva utilització es poden
separar fàcilment per filtració, com també es poden utilitzar en columnes. A la Fig. 2 es pot
observar un exemple de perles de resines de bescanvi iònic. Les resines de bescanvi iònic
poden ser utilitzades com a catalitzadors, tan com a substitut de l’àcid sulfúric com per
immobilitzar catalitzadors metàl·lics [16]. La majoria de resines de bescanvi iònic comercials
estan formades per un copolímer de poliestirè-divinilbenzè (PS-DVB). Les resines PS-DVB
àcides són atractives ja que, comparades amb altres catalitzadors àcids, exhibeixen unes
concentracions més altes de grups àcids (~5 meq H+/g) [15]. Pel contrari, la força àcida
d’aquestes és més baixa que la dels típics catalitzadors inorgànics com les zeolites [17].
L’activitat catalítica de les resines àcides està totalment condicionada per l’accessibilitat dels
seus centres actius [15]. Així, sembla obvi que, prèviament a l’ utilització de qualsevol resina és
necessari el seu estudi morfològic.
Fig. 2: Perles de resines de bescanvi iònic.
Les resines PS-DVB estan dividies morfològicament en dos grups : les tipus gel i les
macroreticulars. Les resines tipus gel estan copolimeritzades sense l’ús de porífer i la seva
porositat només apareix en estat inflat. En canvi, en la polimerització de les resines
macroreticular es fa ús d’un dissolvent (porífer) que crea porus permanents. Els dos tipus de
resines veuen molt augmentada la seva superfície porosa en medi polar. Així, la morfologia de
les resines no pot ser caracteritzada per tècniques convencionals com ara l’adsorció de
nitrogen o la intrusió de mercuri ja que aquestes tècniques precisen de mostres completament
seques. Fins a la data, la única tècnica que permet caracteritzar les resines en medi inflat és la
Cromatografia Inversa d’Exclusió de mida (ISEC). Aquesta tècnica ha permès trobar
correlacions entre la morfologia del polímer i la seva activitat catalítica [18-20].
A part de l’acidesa i l’accessibilitat de les resines, es tan o més important, conèixer com
evoluciona la seva activitat amb el temps. Les resines àcides, al ser un material polimèric,
tenen com a important desavantatge la pèrdua de centres actius a altes temperatures,
típicament per sobre de 120-150ºC. Tot i així, algunes resines tenen estabilitat tèrmica fins a
190ºC degut a que han estat prèviament clorades [17].
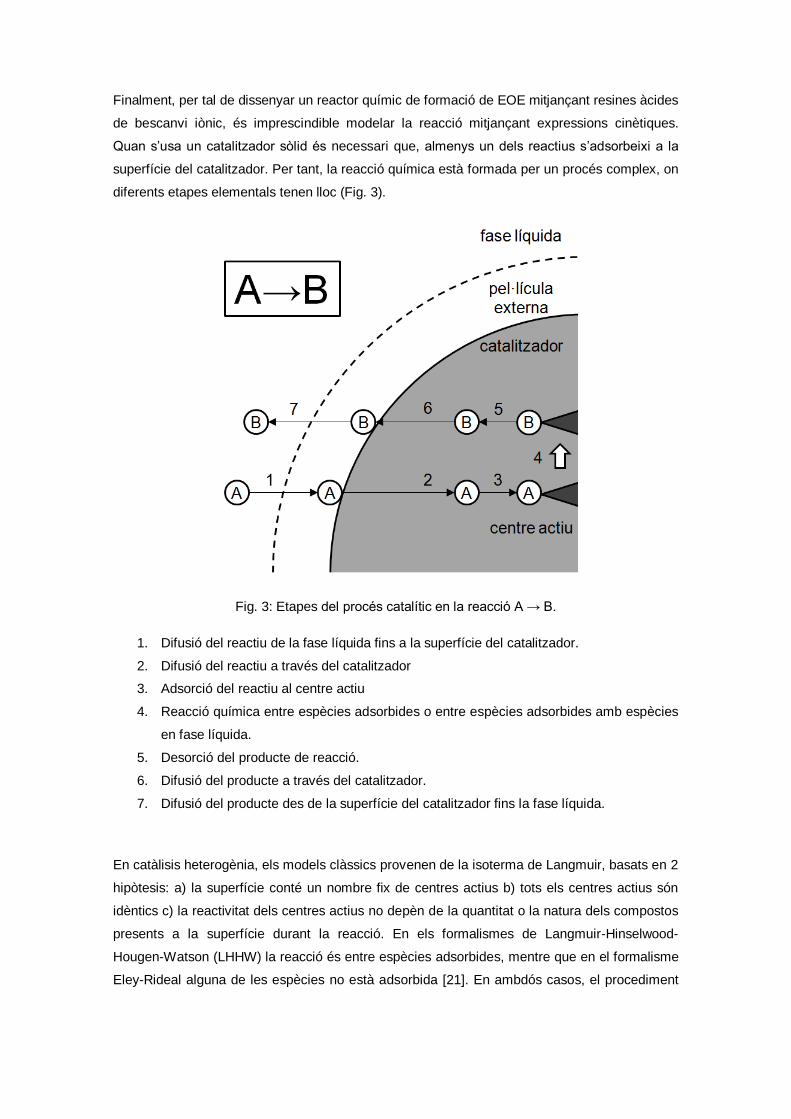
Finalment, per tal de dissenyar un reactor químic de formació de EOE mitjançant resines àcides
de bescanvi iònic, és imprescindible modelar la reacció mitjançant expressions cinètiques.
Quan s’usa un catalitzador sòlid és necessari que, almenys un dels reactius s’adsorbeixi a la
superfície del catalitzador. Per tant, la reacció química està formada per un procés complex, on
diferents etapes elementals tenen lloc (Fig. 3).
Fig. 3: Etapes del procés catalític en la reacció A → B.
1. Difusió del reactiu de la fase líquida fins a la superfície del catalitzador.
2. Difusió del reactiu a través del catalitzador
3. Adsorció del reactiu al centre actiu
4. Reacció química entre espècies adsorbides o entre espècies adsorbides amb espècies
en fase líquida.
5. Desorció del producte de reacció.
6. Difusió del producte a través del catalitzador.
7. Difusió del producte des de la superfície del catalitzador fins la fase líquida.
En catàlisis heterogènia, els models clàssics provenen de la isoterma de Langmuir, basats en 2
hipòtesis: a) la superfície conté un nombre fix de centres actius b) tots els centres actius són
idèntics c) la reactivitat dels centres actius no depèn de la quantitat o la natura dels compostos
presents a la superfície durant la reacció. En els formalismes de Langmuir-Hinselwood-
Hougen-Watson (LHHW) la reacció és entre espècies adsorbides, mentre que en el formalisme
Eley-Rideal alguna de les espècies no està adsorbida [21]. En ambdós casos, el procediment
general es basa en proposar una etapa limitant de velocitat i desenvolupar una expressió que
s’adapti als resultats experimentals.
L’objectiu d’aquest treball és estudiar el procés catalític per obtenir el compost EOE. Això
involucra la selecció de la millor forma d’obtenir aquest producte i el millor catalitzador possible.
A més, un cop seleccionat el procés òptim, es realitzarà un estudi termodinàmic i cinètic del
procés que pugui ser útil en per la industria.
Concretament, es aquest treball s’avalua la producció de EOE a partir de la deshidratació
d’etanol (EtOH) amb 1-octanol (OcOH) a partir de resines àcides PS-DVB de bescanvi iònic,
totes elles comercials. L’activitat catalítica de moltes resines es compara i s’estableixen
relacions entre l’estructura de les resines amb la seva activitat catalítica. A continuació,
s’estudia la formació de EOE a partir d’una mescla de OcOH amb dietil carbonat (DEC). De
nou, la influència de l’estructura dels catalitzadors es relaciona amb la seva activitat catalítica.
A continuació, l’eficiència dels dos agents etilants proposats, EtOH i DEC, es compara utilitzant
els millors catalitzadors trobats.
Un cop seleccionat la millor via d’obtenció del producte, s’avalua l’estabilitat dels millors
catalitzadors a alta temperatura i amb la presència d’aigua en el medi a temps de reacció llargs.
En aquest punt, es selecciona el millor catalitzador, en relació a activitat i estabilitat, s’obtenen
dades de l’equilibri químic de la reacció i d’un model cinètic capaç de predir les velocitats de
reacció. Finalment, s’explora la possibilitat d’incrementar la selectivitat cap a EOE a partir de la
preparació i utilització de catalitzadors parcialment sulfonats.
2. Experimental
En aquest treball es va fer ús de 17 resines àcides comercials de diferent estructura, contingut
de DVB, grau de sulfonació i estabilitat tèrmica. També, es van utilitzar 2 resines bàsiques, una
zeolita i dos alúmines, totes elles comercials. A part, es van preparar i assajar 6 resines àcides
parcialment sulfonades.
L’estudi de la formació de EOE es va realitzar mitjançant dos dispositius experimentals, un
reactor de tanc agitat operant en discontinu i un tubular de llit fix operant en continu. El reactor
de tanc agitat té un volum nominal de 100-mL. La temperatura va estar controlada per un forn
elèctric. La pressió de treball va ser de 25 bar, mitjançant nitrogen. Una sortida del reactor
estava connectada directament a una vàlvula de mostreig que injectava el líquid a un
cromatògraf GLC. Un esquema del reactor es pot observar en la Fig. 4.
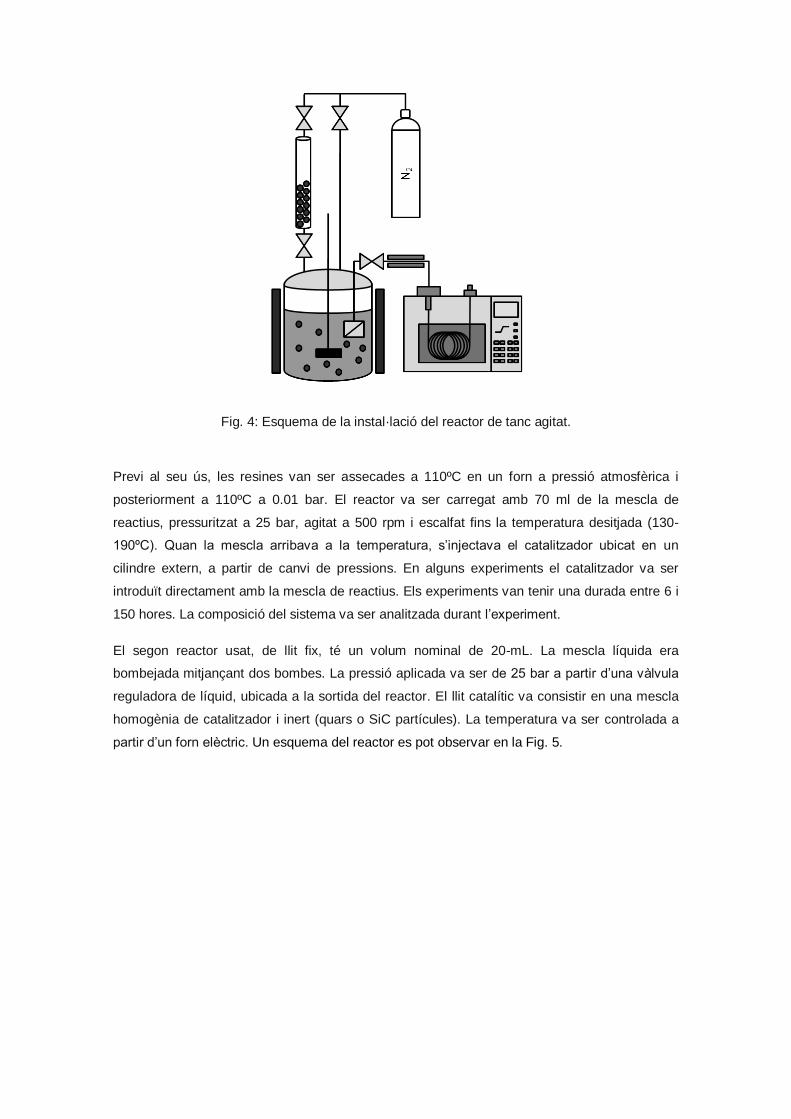
Fig. 4: Esquema de la instal·lació del reactor de tanc agitat.
Previ al seu ús, les resines van ser assecades a 110ºC en un forn a pressió atmosfèrica i
posteriorment a 110ºC a 0.01 bar. El reactor va ser carregat amb 70 ml de la mescla de
reactius, pressuritzat a 25 bar, agitat a 500 rpm i escalfat fins la temperatura desitjada (130-
190ºC). Quan la mescla arribava a la temperatura, s’injectava el catalitzador ubicat en un
cilindre extern, a partir de canvi de pressions. En alguns experiments el catalitzador va ser
introduït directament amb la mescla de reactius. Els experiments van tenir una durada entre 6 i
150 hores. La composició del sistema va ser analitzada durant l’experiment.
El segon reactor usat, de llit fix, té un volum nominal de 20-mL. La mescla líquida era
bombejada mitjançant dos bombes. La pressió aplicada va ser de 25 bar a partir d’una vàlvula
reguladora de líquid, ubicada a la sortida del reactor. El llit catalític va consistir en una mescla
homogènia de catalitzador i inert (quars o SiC partícules). La temperatura va ser controlada a
partir d’un forn elèctric. Un esquema del reactor es pot observar en la Fig. 5.
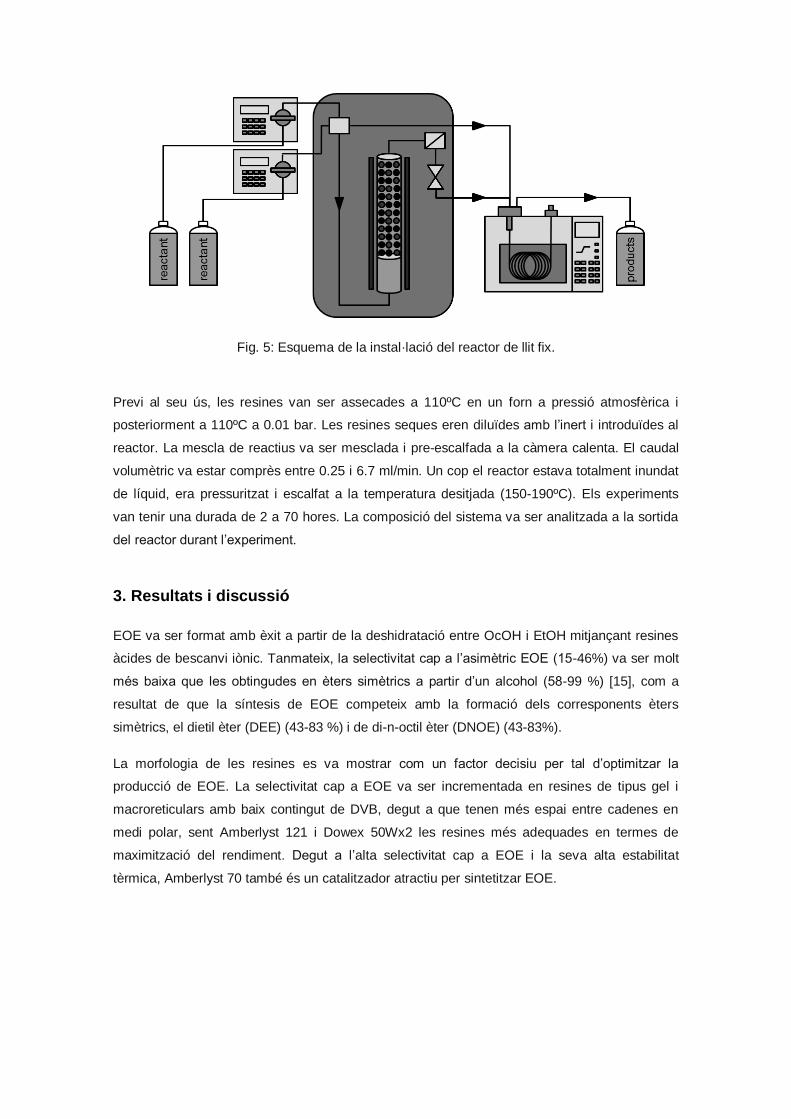
Fig. 5: Esquema de la instal·lació del reactor de llit fix.
Previ al seu ús, les resines van ser assecades a 110ºC en un forn a pressió atmosfèrica i
posteriorment a 110ºC a 0.01 bar. Les resines seques eren diluïdes amb l’inert i introduïdes al
reactor. La mescla de reactius va ser mesclada i pre-escalfada a la càmera calenta. El caudal
volumètric va estar comprès entre 0.25 i 6.7 ml/min. Un cop el reactor estava totalment inundat
de líquid, era pressuritzat i escalfat a la temperatura desitjada (150-190ºC). Els experiments
van tenir una durada de 2 a 70 hores. La composició del sistema va ser analitzada a la sortida
del reactor durant l’experiment.
3. Resultats i discussió
EOE va ser format amb èxit a partir de la deshidratació entre OcOH i EtOH mitjançant resines
àcides de bescanvi iònic. Tanmateix, la selectivitat cap a l’asimètric EOE (15-46%) va ser molt
més baixa que les obtingudes en èters simètrics a partir d’un alcohol (58-99 %) [15], com a
resultat de que la síntesis de EOE competeix amb la formació dels corresponents èters
simètrics, el dietil èter (DEE) (43-83 %) i de di-n-octil èter (DNOE) (43-83%).
La morfologia de les resines es va mostrar com un factor decisiu per tal d’optimitzar la
producció de EOE. La selectivitat cap a EOE va ser incrementada en resines de tipus gel i
macroreticulars amb baix contingut de DVB, degut a que tenen més espai entre cadenes en
medi polar, sent Amberlyst 121 i Dowex 50Wx2 les resines més adequades en termes de
maximització del rendiment. Degut a l’alta selectivitat cap a EOE i la seva alta estabilitat
tèrmica, Amberlyst 70 també és un catalitzador atractiu per sintetitzar EOE.

EOE també va ser format amb èxit a partir de DEC i OcOH. Primerament té lloc la
transesterificació de DEC amb OcOH a etil octil carbonat. Seguidament, el carbonat es
descompon a EOE. L’assaig de catalitzadors, resines àcides i bàsiques de bescanvi iònic, una
zeolita, i dos alúmines, va mostrar que les conversions, selectivitats i rendiments més alts van
ser aconseguits mitjançant resines àcides de bescanvi iònic.
Anàlogament a la formació de EOE a partir de deshidratació d’alcohols, la síntesi de EOE a
partir de DEC també va estar lligada a l’estructura de les resines, ja que com es pot observar a
la Fig. 6A, resines amb semblant capacitat àcida van mostrar diferents rendiments.
L’accessibilitat de les molècules va ser afavorida en resines amb gran capacitat d’inflament
(Vsp) com s’observa a la Fig. 6B. Així, els catalitzadors amb una fase polimèrica molt expandida
són els més adequats per tal de produir EOE. Aquests requisits es poden trobar en resines de
baix contingut de DVB.
Fig. 6: Influència de la capacitat àcida de les resines (A) i el Vsp en el rendiment cap a EOE
respecte a DEC a 8h. T=150ºC, ROcOH/DEC =2, Wcat=2 g, 500 rpm. ♦Macroreticular; ♦Tipus gel.
La formació de EOE a partir de mescles OcOH / EtOH, o bé, OcOH / DEC mitjançant l’ús de
resines àcides amb baix contingut de DVB va ser comparat. Es va observar que el major
inconvenient en ambdós reaccions és la pèrdua de grups etils per produir DEE. Com a
conseqüència, la selectivitat cap a EOE respecte a l’agent etilant, DEC o EtOH, va ser
relativament baixa (40-50 % a 8 hores de reacció).
A temps llargs (48 hores), les conversions, selectivitats i els rendiments a EOE obtinguts van
ser similar en ambdós sistemes, com es pot observar a la Figura 7 (A, B i C, respectivament).
No obstant, les velocitat de reacció de formació de EOE van ser lleugerament més altes en el
sistema OcOH / EtOH. Per tant, EtOH és considerat com l’agent etilant més adequat per formar
EOE mitjançant resines àcides a temps de reacció curts i DEC només es pot mostrar competitiu
a temps de reacció llargs, o en unitat en continu, en reactors sobredimensionats. A més a més,
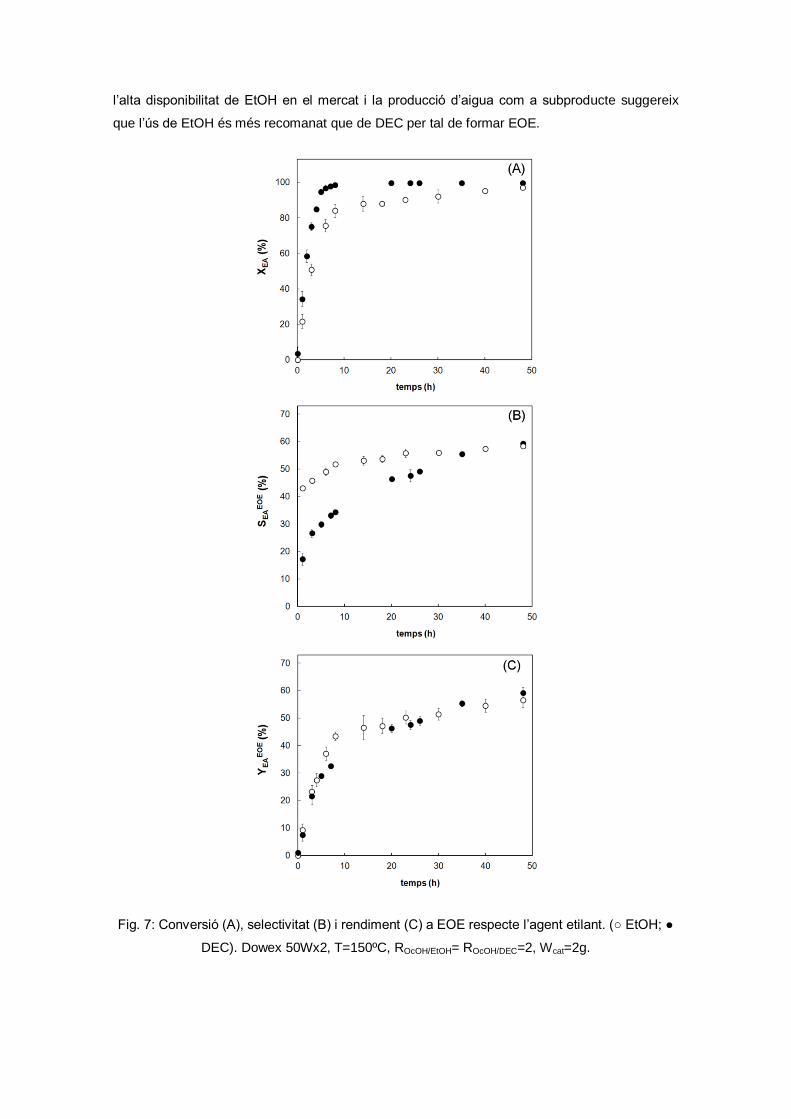
l’alta disponibilitat de EtOH en el mercat i la producció d’aigua com a subproducte suggereix
que l’ús de EtOH és més recomanat que de DEC per tal de formar EOE.
Fig. 7: Conversió (A), selectivitat (B) i rendiment (C) a EOE respecte l’agent etilant. (○ EtOH; ●
DEC). Dowex 50Wx2, T=150ºC, ROcOH/EtOH= ROcOH/DEC=2, Wcat=2g.
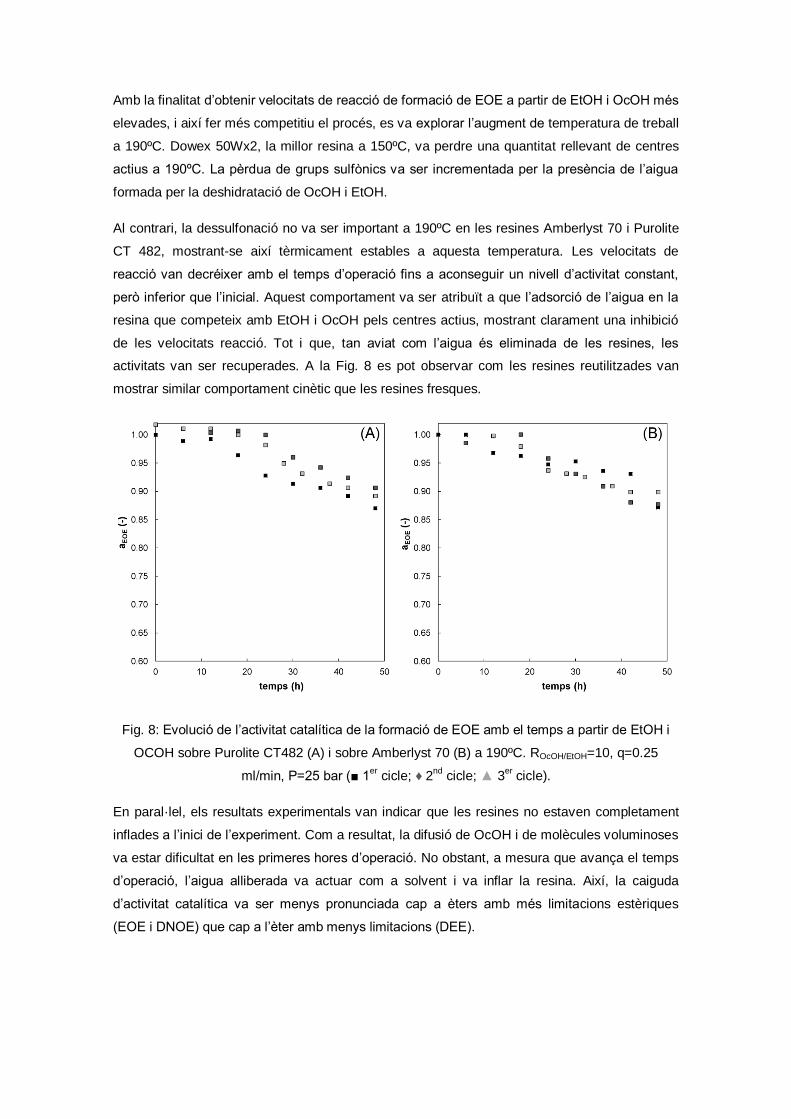
Amb la finalitat d’obtenir velocitats de reacció de formació de EOE a partir de EtOH i OcOH més
elevades, i així fer més competitiu el procés, es va explorar l’augment de temperatura de treball
a 190ºC. Dowex 50Wx2, la millor resina a 150ºC, va perdre una quantitat rellevant de centres
actius a 190ºC. La pèrdua de grups sulfònics va ser incrementada per la presència de l’aigua
formada per la deshidratació de OcOH i EtOH.
Al contrari, la dessulfonació no va ser important a 190ºC en les resines Amberlyst 70 i Purolite
CT 482, mostrant-se així tèrmicament estables a aquesta temperatura. Les velocitats de
reacció van decréixer amb el temps d’operació fins a aconseguir un nivell d’activitat constant,
però inferior que l’inicial. Aquest comportament va ser atribuït a que l’adsorció de l’aigua en la
resina que competeix amb EtOH i OcOH pels centres actius, mostrant clarament una inhibició
de les velocitats reacció. Tot i que, tan aviat com l’aigua és eliminada de les resines, les
activitats van ser recuperades. A la Fig. 8 es pot observar com les resines reutilitzades van
mostrar similar comportament cinètic que les resines fresques.
Fig. 8: Evolució de l’activitat catalítica de la formació de EOE amb el temps a partir de EtOH i
OCOH sobre Purolite CT482 (A) i sobre Amberlyst 70 (B) a 190ºC. ROcOH/EtOH=10, q=0.25
ml/min, P=25 bar (■ 1er
cicle; ♦ 2nd
cicle; ▲ 3er cicle).
En paral·lel, els resultats experimentals van indicar que les resines no estaven completament
inflades a l’inici de l’experiment. Com a resultat, la difusió de OcOH i de molècules voluminoses
va estar dificultat en les primeres hores d’operació. No obstant, a mesura que avança el temps
d’operació, l’aigua alliberada va actuar com a solvent i va inflar la resina. Així, la caiguda
d’activitat catalítica va ser menys pronunciada cap a èters amb més limitacions estèriques
(EOE i DNOE) que cap a l’èter amb menys limitacions (DEE).
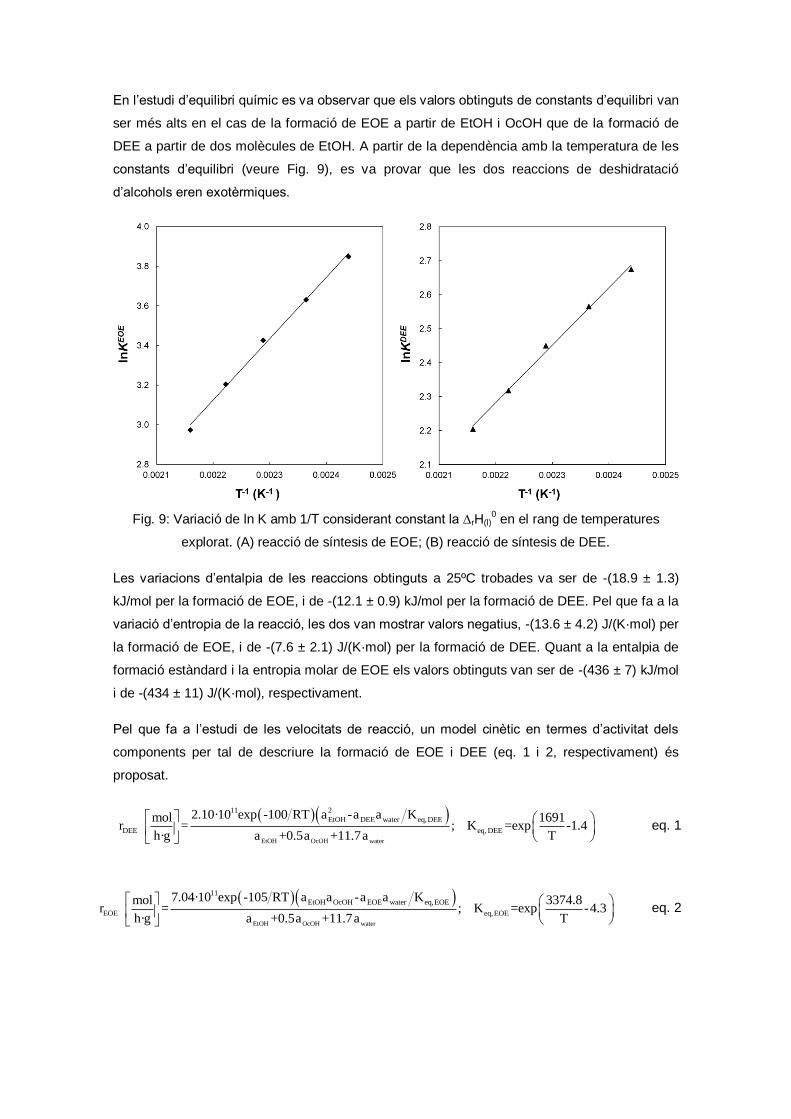
En l’estudi d’equilibri químic es va observar que els valors obtinguts de constants d’equilibri van
ser més alts en el cas de la formació de EOE a partir de EtOH i OcOH que de la formació de
DEE a partir de dos molècules de EtOH. A partir de la dependència amb la temperatura de les
constants d’equilibri (veure Fig. 9), es va provar que les dos reaccions de deshidratació
d’alcohols eren exotèrmiques.
Fig. 9: Variació de ln K amb 1/T considerant constant la ∆rH(l)0 en el rang de temperatures
explorat. (A) reacció de síntesis de EOE; (B) reacció de síntesis de DEE.
Les variacions d’entalpia de les reaccions obtinguts a 25ºC trobades va ser de -(18.9 ± 1.3)
kJ/mol per la formació de EOE, i de -(12.1 ± 0.9) kJ/mol per la formació de DEE. Pel que fa a la
variació d’entropia de la reacció, les dos van mostrar valors negatius, -(13.6 ± 4.2) J/(K·mol) per
la formació de EOE, i de -(7.6 ± 2.1) J/(K·mol) per la formació de DEE. Quant a la entalpia de
formació estàndard i la entropia molar de EOE els valors obtinguts van ser de -(436 ± 7) kJ/mol
i de -(434 ± 11) J/(K·mol), respectivament.
Pel que fa a l’estudi de les velocitats de reacció, un model cinètic en termes d’activitat dels
components per tal de descriure la formació de EOE i DEE (eq. 1 i 2, respectivament) és
proposat.
EtOH OcOH water
11 2
EtOH DEE water eq,DEE
DEE eq, DEE
2.10·10 exp -100 RT a -a a Kmol 1691r = ; K =exp -1.4
h·g a +0.5a +11.7a T
eq. 1
EtOH OcOH water
11
EtOH OcOH EOE water eq,EOE
EOE eq,EOE
7.04·10 exp -105 RT a a -a a Kmol 3374.8r = ; K =exp -4.3
h·g a +0.5a +11.7a T
eq. 2
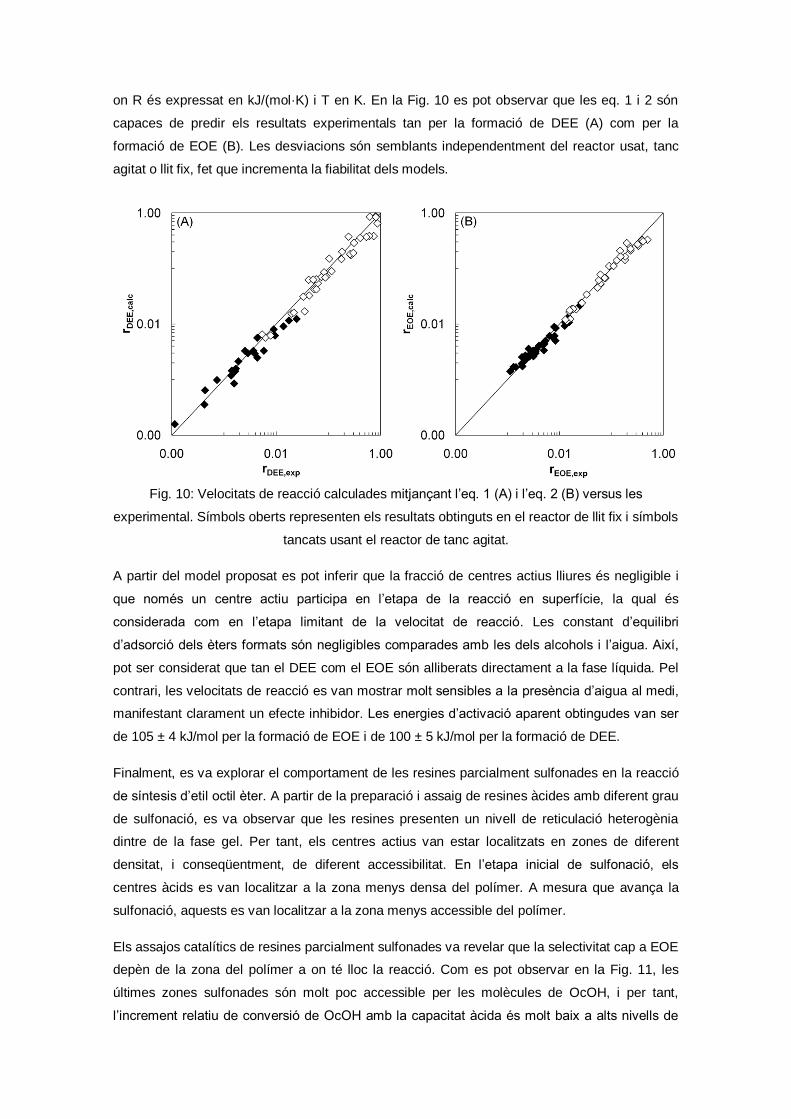
on R és expressat en kJ/(mol·K) i T en K. En la Fig. 10 es pot observar que les eq. 1 i 2 són
capaces de predir els resultats experimentals tan per la formació de DEE (A) com per la
formació de EOE (B). Les desviacions són semblants independentment del reactor usat, tanc
agitat o llit fix, fet que incrementa la fiabilitat dels models.
Fig. 10: Velocitats de reacció calculades mitjançant l’eq. 1 (A) i l’eq. 2 (B) versus les
experimental. Símbols oberts representen els resultats obtinguts en el reactor de llit fix i símbols
tancats usant el reactor de tanc agitat.
A partir del model proposat es pot inferir que la fracció de centres actius lliures és negligible i
que només un centre actiu participa en l’etapa de la reacció en superfície, la qual és
considerada com en l’etapa limitant de la velocitat de reacció. Les constant d’equilibri
d’adsorció dels èters formats són negligibles comparades amb les dels alcohols i l’aigua. Així,
pot ser considerat que tan el DEE com el EOE són alliberats directament a la fase líquida. Pel
contrari, les velocitats de reacció es van mostrar molt sensibles a la presència d’aigua al medi,
manifestant clarament un efecte inhibidor. Les energies d’activació aparent obtingudes van ser
de 105 ± 4 kJ/mol per la formació de EOE i de 100 ± 5 kJ/mol per la formació de DEE.
Finalment, es va explorar el comportament de les resines parcialment sulfonades en la reacció
de síntesis d’etil octil èter. A partir de la preparació i assaig de resines àcides amb diferent grau
de sulfonació, es va observar que les resines presenten un nivell de reticulació heterogènia
dintre de la fase gel. Per tant, els centres actius van estar localitzats en zones de diferent
densitat, i conseqüentment, de diferent accessibilitat. En l’etapa inicial de sulfonació, els
centres àcids es van localitzar a la zona menys densa del polímer. A mesura que avança la
sulfonació, aquests es van localitzar a la zona menys accessible del polímer.
Els assajos catalítics de resines parcialment sulfonades va revelar que la selectivitat cap a EOE
depèn de la zona del polímer a on té lloc la reacció. Com es pot observar en la Fig. 11, les
últimes zones sulfonades són molt poc accessible per les molècules de OcOH, i per tant,
l’increment relatiu de conversió de OcOH amb la capacitat àcida és molt baix a alts nivells de
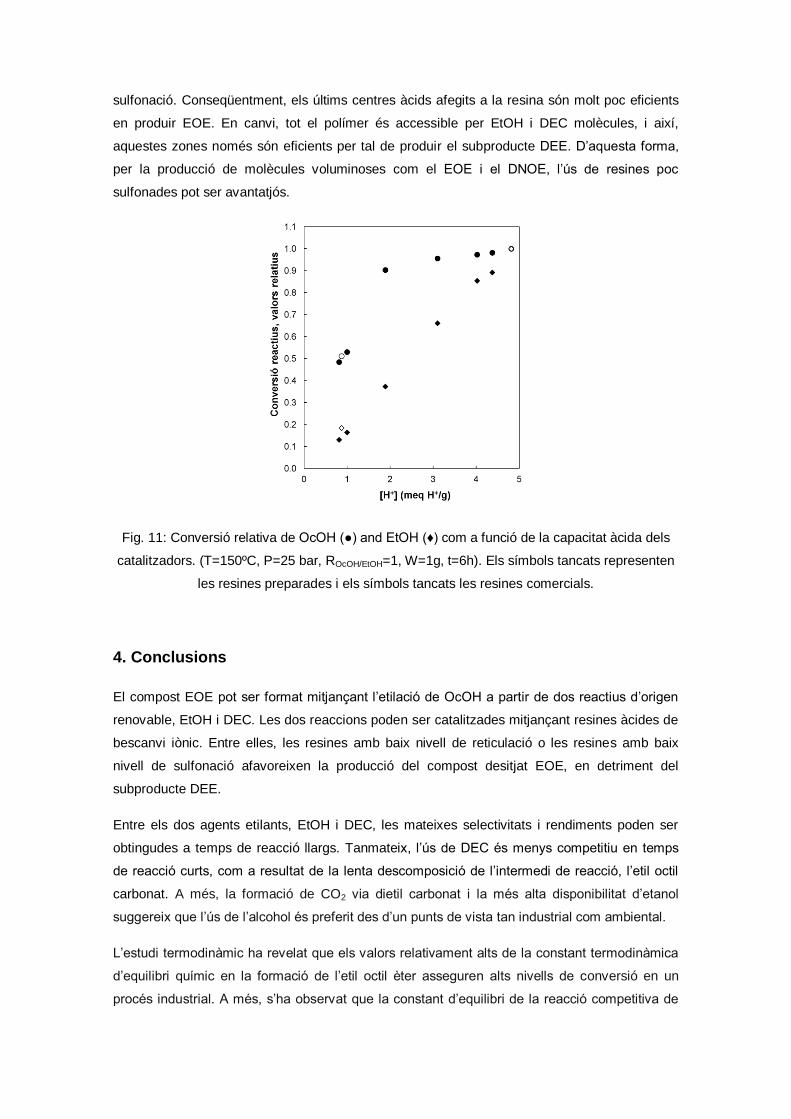
sulfonació. Conseqüentment, els últims centres àcids afegits a la resina són molt poc eficients
en produir EOE. En canvi, tot el polímer és accessible per EtOH i DEC molècules, i així,
aquestes zones només són eficients per tal de produir el subproducte DEE. D’aquesta forma,
per la producció de molècules voluminoses com el EOE i el DNOE, l’ús de resines poc
sulfonades pot ser avantatjós.
Fig. 11: Conversió relativa de OcOH (●) and EtOH (♦) com a funció de la capacitat àcida dels
catalitzadors. (T=150ºC, P=25 bar, ROcOH/EtOH=1, W=1g, t=6h). Els símbols tancats representen
les resines preparades i els símbols tancats les resines comercials.
4. Conclusions
El compost EOE pot ser format mitjançant l’etilació de OcOH a partir de dos reactius d’origen
renovable, EtOH i DEC. Les dos reaccions poden ser catalitzades mitjançant resines àcides de
bescanvi iònic. Entre elles, les resines amb baix nivell de reticulació o les resines amb baix
nivell de sulfonació afavoreixen la producció del compost desitjat EOE, en detriment del
subproducte DEE.
Entre els dos agents etilants, EtOH i DEC, les mateixes selectivitats i rendiments poden ser
obtingudes a temps de reacció llargs. Tanmateix, l’ús de DEC és menys competitiu en temps
de reacció curts, com a resultat de la lenta descomposició de l’intermedi de reacció, l’etil octil
carbonat. A més, la formació de CO2 via dietil carbonat i la més alta disponibilitat d’etanol
suggereix que l’ús de l’alcohol és preferit des d’un punts de vista tan industrial com ambiental.
L’estudi termodinàmic ha revelat que els valors relativament alts de la constant termodinàmica
d’equilibri químic en la formació de l’etil octil èter asseguren alts nivells de conversió en un
procés industrial. A més, s’ha observat que la constant d’equilibri de la reacció competitiva de
formació de dietil èter té valors inferiors en el rang de temperatures explorat, fet que en limitaria
la seva formació.
En la formació de EOE a partir de la mescla EtOH / OcOH, la resina Amberlyst 70 s’ha mostrat
com el catalitzador més adequat pel que fa a activitat i estabilitat tèrmica. L’estudi cinètic ha
permès proposar una expressió mecanístic que és capaç de predir les velocitats de reacció tan
en un reactor de tanc agitat com en un reactor de llit fix. Aquestes velocitats de reacció són
altament inhibides per la presència d’aigua en el medi.
Referències
[1] BP, ―Energy outlook 2030.‖ 2011. [2] BP, ―Statistical review of world energy 2011.‖ 2012. [3] European Union, ―DIRECTIVE 2009/28/EC.‖ 2009. [4] US Energy Information Administration, ―Annual energy review 2011.‖ 2012. [5] European Biomass Industry Association, ―Bioethanol production and use. Overview of
the European market.‖ 2007. [6] K. L. Rock and M. Korpelshoek, ―Increasing refinery biofuels production,‖ PTQ Catal, pp.
45–51, 2008. [7] ―European Fuel Oxygenates Association (EFOA),‖ 2013. [Online]. Available:
http://www.efoa.org. [8] A. C. Hansen, Q. Zhang, and P. W.L. Lyne, ―Ethanol–diesel fuel blends––a review,‖
Biores Tech, vol. 96, pp. 277–285, 2005. [9] E. Benazzi, ―Gasoline and diesel imbalances in the Atlantic basin part 1: market
outlook.‖ 2011. [10] G. C. Pecci, M. G. Clerici, F. Giavazzi, F. Ancillotti, M. Marchionna, and R. Patrini,
―Oxygenated diesel fuels-structure and properties correlation,‖ presented at the Proc IX Int Symp Alcohols Fuels, Firenze, Italy, 1991, vol. 1, pp. 321–335.
[11] R. Patrini and M. Marchionna, ―Process for the production of ethers from alcohols,‖ U.S. Patent US 6218583 B1, 2001.
[12] K. Seidel, C. Priebe, and D. Hollenberg, ―Emulsions,‖ U.S. Patent US 5830483, 1998. [13] A. Ansmann and B. Fabry, ―Cosmetic preparations,‖ U.S. Patent US 6878379B2, 2005. [14] W. K. Gray, F. R. Smail, M. G. Hitzler, S. K. Ross, and M. Poliakoff, ―The continuous
acid-catalyzed dehydration of alcohols in supercritical fluids: a new approach to the cleaner synthesis of acetals, ketals, and ethers with high selectivity,‖ J Am Chem Soc, vol. 121, pp. 10711–10718, 1999.
[15] C. Casas, R. Bringué, E. Ramírez, M. Iborra, and J. Tejero, ―Liquid-phase dehydration of 1-octanol, 1-hexanol and 1-pentanol to linear symmetrical ethers over ion exchange resins,‖ Appl Catal A Gen, vol. 1, pp. 321–335, 2011.
[16] B. Corain, M. Zecca, P. Canton, and P. Centomo, ―Synthesis and catalytic activity of metal nanoclusters inside functional resins: an endeavour lasting 15 years,‖ Phil Trans R Soc A, vol. 368, 2010.
[17] P. F. Siril, H. E. Cross, and D. R. Brown, ―New polystyrene sulfonic acid resin catalysts with enhanced acidic and catalytic properties,‖ J Mol Catal A Chem, vol. 279, pp. 63–68, 2008.
[18] K. Jerabek, Cross-evaluation of strategie, size-exclusion chromatography. (Inverse steric exclusion chromatography as a tool for morphology characterization). Washington: ACS Symposium Series 635, 1996.
[19] K. Jerabek, ―Determination of pore volume distribution chromatography data from size exclusion,‖ Anal Chem, vol. 57, pp. 1595–1597, 1985.
[20] K. Jerabek, ―Characterization of swollen polymer gels using size exclusion chromatography,‖ Anal Chem, no. 57, pp. 1598–1602, 1985.
[21] R. H. Perry and D. W. Green, Perry’s chemical engineers’ handbook, Seventh edition. McGraw-Hill, 1999.

Funding statement
This work was economically supported by the State Education, Universities, Research &
Development Office of Spain (Project CTQ2010-16047). Trainee research staff grant was
awarded by the University of Barcelona (APIF 2009-13).
Acknowledgements
This Thesis does not only describe the daily work during four years, it also reflects an awesome
period of my life. Luckily, I was not alone...
Thanks to my two supervisors Javier and Eliana, without whom the result of this work would
have been much poorer. Through these years, you taught me a lot and you would easily realize
that only by checking my first draft of the Cordova congress. I also want to express my gratitude
to Fidel because four years ago you believed in me.
I would also like to thank Montse, Carles, Roger, Marta, Madelin and Mari Ángeles and
because we have shared some nice moments (travels, meals...) and a lot of interesting
discussions during my quotidian work. Special thanks go to Carlos, from the cradle to the grave
(of my PhD period). As well, I feel really happy to have shared my lunch time (and much much
more) with Rafa, Xavi, Badia and Rodrigo. Several students contributed directly or indirectly to
this work and I would like to thank them for their input: Pros, Pere, Adrian, Carlota, Sergio and
Pedro. Of course, ―dícky moc‖ to Jerabek, and also to Liba, Ladislav and Pavel for helping me
in my short but intense Praha stage, inside and outside the lab.
Further thanks to my co-teachers María del Mar, Isabel and others already quoted to coach me
in my teaching duties. As my motivation for the research world began in The Netherlands, it’s a
pleasure to thank to the people that enthused me indirectly about doing a PhD: Celio, Joan,
Roma, Laura, Can and Katja.
Com que entendre la interacció entre molècules és molt més fàcil que entre persones, vull
acabar expressant una total gratitud per la meva família, em sap greu pels altres però la meva
és la millor! Com també el suport rebut pels meus amics en aquests quatre anys. Finalment,
gràcies, Anna, per haver-me acompanyat en aquest camí. Fa 4 anys, en els agraïments, vaig
demanar que la vida no ens allunyés dels nostres somnis. I no tan sols no ens n’ha allunyat,
sinó que n’hem complert molts i ens n’han sorgit de nous. Així que tan sols desitjo que en els
propers anys no perdem la innocència per seguir somiant, i ningú ha dit que hagi de ser fàcil...
―recte endavant és no anar gaire lluny‖ Le Petit Prince