ethiopia national food consumption survey food consumption survey... · ethiopia national food...
TRANSCRIPT
Ethiopia National Food Consumption Survey
2013
Ethiopian Public Health Institute
Addis Ababa, Ethiopia
August, 2013
www.ephi.gov.et
ii
Table of contents
Table of contents ............................................................................................................................. ii
List of tables ................................................................................................................................... iv
List of figures ................................................................................................................................. vi
Foreword ....................................................................................................................................... vii
Acknowledgements ...................................................................................................................... viii
Acronyms and Abbreviations ......................................................................................................... x
Executive Summary ....................................................................................................................... xi
CHAPTER 1: Introduction .......................................................................................................... 1
1.1 Background ........................................................................................................................... 1
1.1.1 Country profile ............................................................................................................... 1
1.1.2 Magnitude of nutrition problem ..................................................................................... 2
1.1.3 The National nutrition program with respect to food fortification ................................. 2
1.1.4 Purpose of the survey ..................................................................................................... 3
1.2 Objectives of the survey ........................................................................................................ 5
CHAPTER 2: Survey methodology ............................................................................................. 6
2.1 Survey population ................................................................................................................. 6
2.2 Scope and design of survey ................................................................................................... 6
2.3 Sample size determination and cluster selection ................................................................... 7
2.4 Survey implementation ......................................................................................................... 8
2.5 Indicators measured............................................................................................................... 9
2.6 Data collection..................................................................................................................... 10
2.6.1 Dietary recall ................................................................................................................ 10
2.6.2 Anthropometric measurements ..................................................................................... 11
2.7 Data management ................................................................................................................ 11
iii
2.8 Data Analysis ...................................................................................................................... 12
2.8.1 Food composition and food groupings ......................................................................... 12
2.8.2 Usual intakes and prevalence of inadequate intakes .................................................... 12
2.8.3 Simulating the impact of fortification .......................................................................... 14
2.8.4 Nutritional status........................................................................................................... 15
2.9 Ethical approval................................................................................................................... 15
CHAPTER 3: Results ................................................................................................................. 17
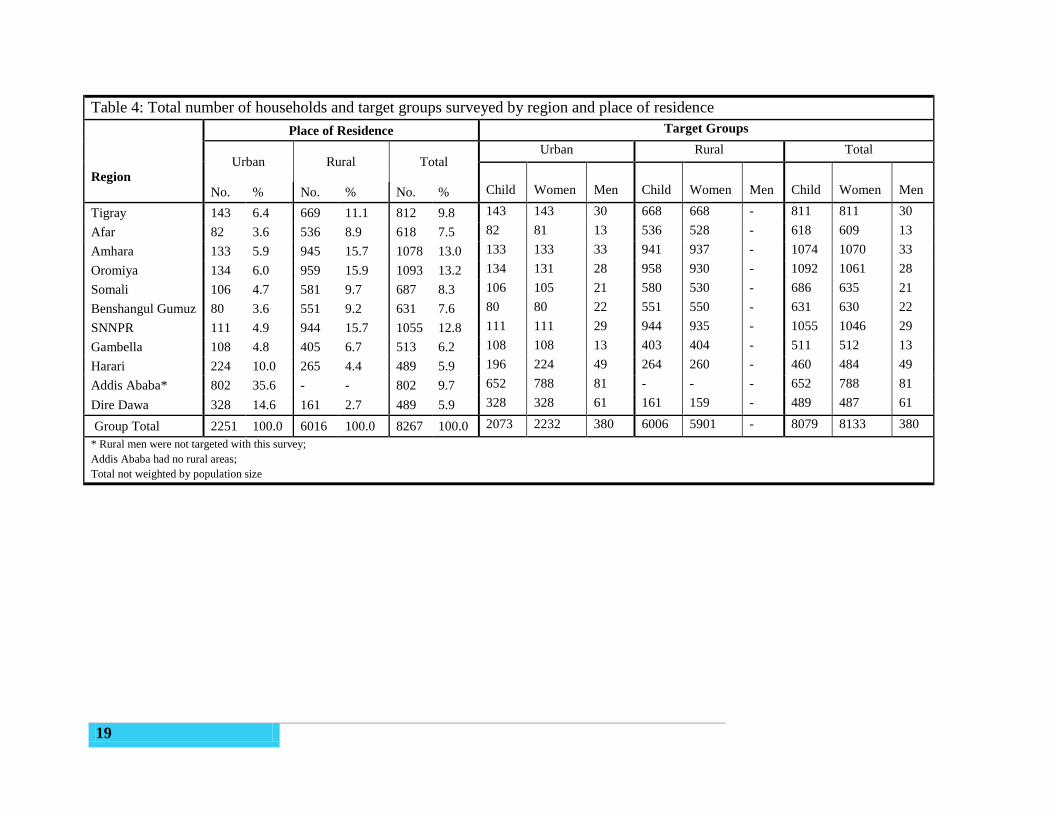
3.1 Characteristics of the study population ............................................................................... 17
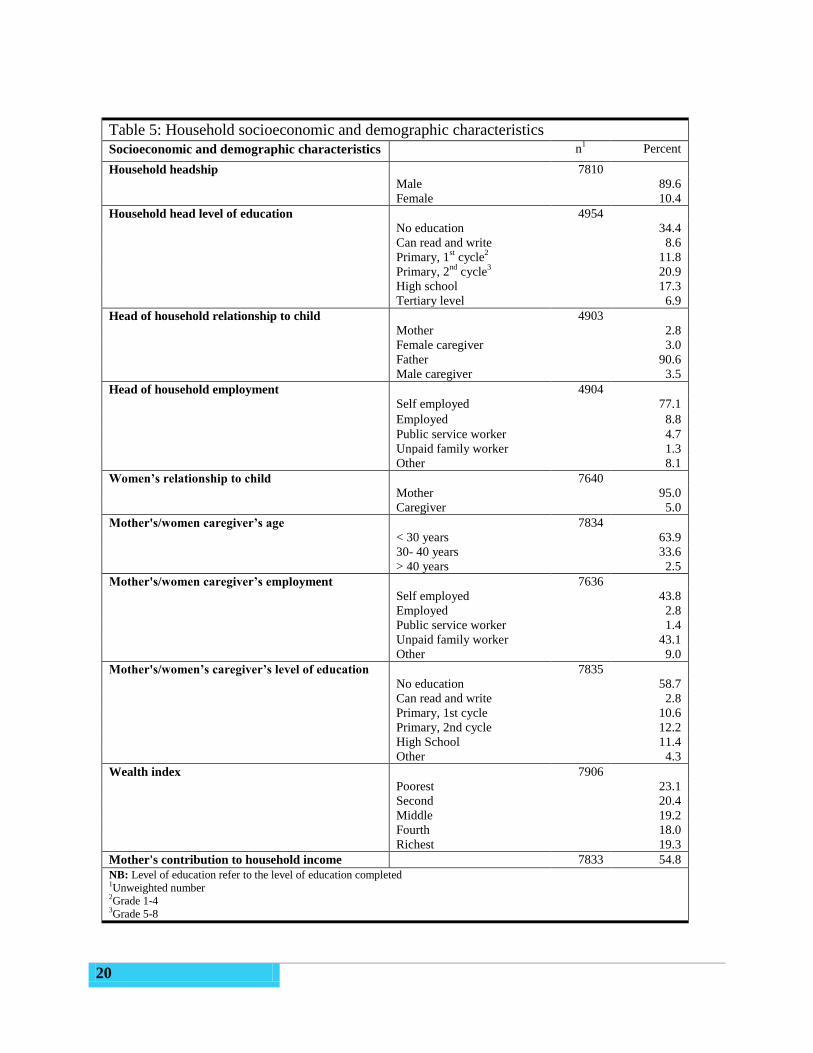
3.2 Socio-demographic and economic characteristics of the households ................................. 17
3.3 Dietary recall day collection ............................................................................................... 21
3.4 Food consumption pattern ................................................................................................... 21
3.5 Nutrient intake ..................................................................................................................... 26
3.5.1 Macronutrient intake ..................................................................................................... 26
3.5.2 Micronutrient intake ..................................................................................................... 32
3.6 Consumption of fortifiable foods ........................................................................................ 36
3.7 Simulating the impact of fortification ................................................................................. 41
3.8 Nutritional Status of mother and children ........................................................................... 47
CHAPTER FOUR: Discussion and conclusion ........................................................................ 49
4.1 Conclusion ........................................................................................................................... 53
4.2 Recommendation ................................................................................................................. 53
References ..................................................................................................................................... 55
iv
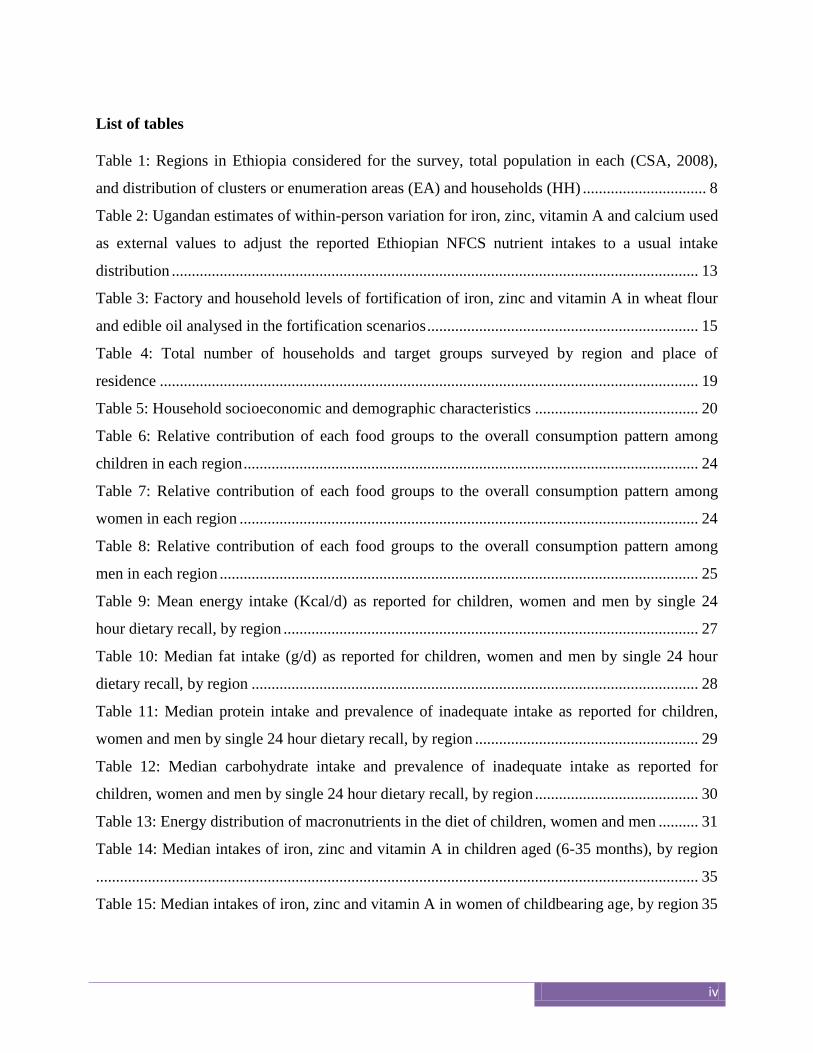
List of tables
Table 1: Regions in Ethiopia considered for the survey, total population in each (CSA, 2008),
and distribution of clusters or enumeration areas (EA) and households (HH) ............................... 8
Table 2: Ugandan estimates of within-person variation for iron, zinc, vitamin A and calcium used
as external values to adjust the reported Ethiopian NFCS nutrient intakes to a usual intake
distribution .................................................................................................................................... 13
Table 3: Factory and household levels of fortification of iron, zinc and vitamin A in wheat flour
and edible oil analysed in the fortification scenarios .................................................................... 15
Table 4: Total number of households and target groups surveyed by region and place of
residence ....................................................................................................................................... 19
Table 5: Household socioeconomic and demographic characteristics ......................................... 20
Table 6: Relative contribution of each food groups to the overall consumption pattern among
children in each region .................................................................................................................. 24
Table 7: Relative contribution of each food groups to the overall consumption pattern among
women in each region ................................................................................................................... 24
Table 8: Relative contribution of each food groups to the overall consumption pattern among
men in each region ........................................................................................................................ 25
Table 9: Mean energy intake (Kcal/d) as reported for children, women and men by single 24
hour dietary recall, by region ........................................................................................................ 27
Table 10: Median fat intake (g/d) as reported for children, women and men by single 24 hour
dietary recall, by region ................................................................................................................ 28
Table 11: Median protein intake and prevalence of inadequate intake as reported for children,
women and men by single 24 hour dietary recall, by region ........................................................ 29
Table 12: Median carbohydrate intake and prevalence of inadequate intake as reported for
children, women and men by single 24 hour dietary recall, by region ......................................... 30
Table 13: Energy distribution of macronutrients in the diet of children, women and men .......... 31
Table 14: Median intakes of iron, zinc and vitamin A in children aged (6-35 months), by region
....................................................................................................................................................... 35
Table 15: Median intakes of iron, zinc and vitamin A in women of childbearing age, by region 35
v
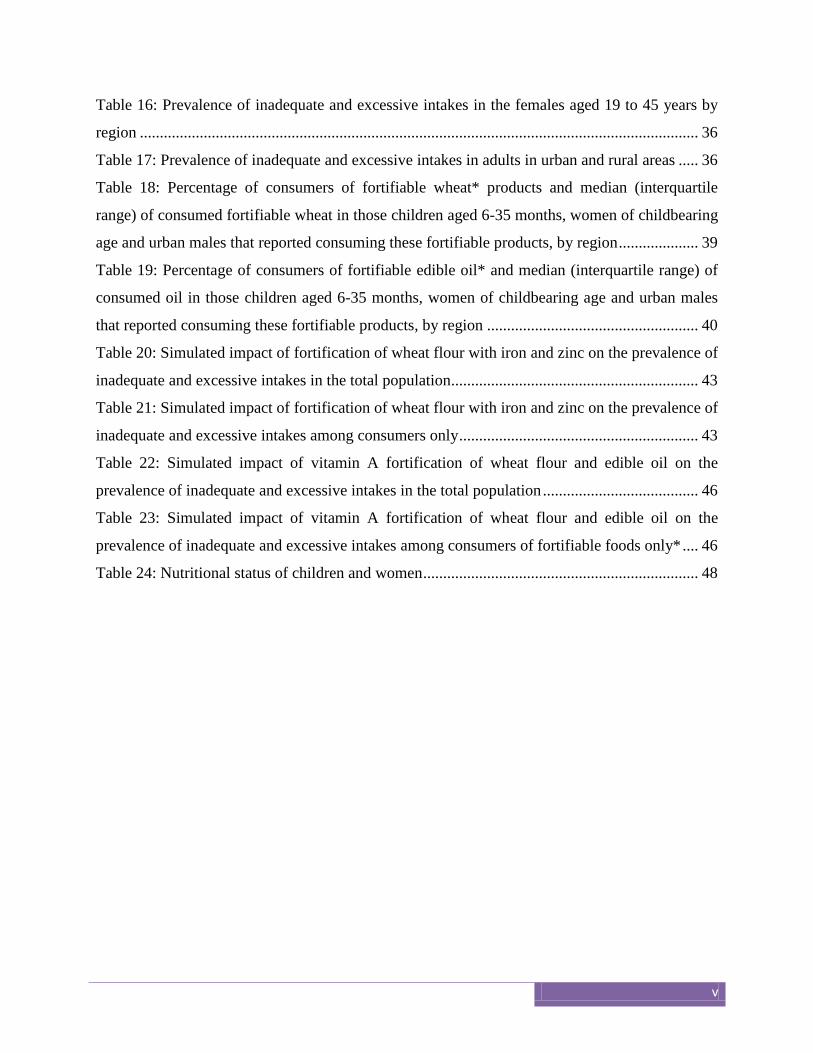
Table 16: Prevalence of inadequate and excessive intakes in the females aged 19 to 45 years by
region ............................................................................................................................................ 36
Table 17: Prevalence of inadequate and excessive intakes in adults in urban and rural areas ..... 36
Table 18: Percentage of consumers of fortifiable wheat* products and median (interquartile
range) of consumed fortifiable wheat in those children aged 6-35 months, women of childbearing
age and urban males that reported consuming these fortifiable products, by region .................... 39
Table 19: Percentage of consumers of fortifiable edible oil* and median (interquartile range) of
consumed oil in those children aged 6-35 months, women of childbearing age and urban males
that reported consuming these fortifiable products, by region ..................................................... 40
Table 20: Simulated impact of fortification of wheat flour with iron and zinc on the prevalence of
inadequate and excessive intakes in the total population.............................................................. 43
Table 21: Simulated impact of fortification of wheat flour with iron and zinc on the prevalence of
inadequate and excessive intakes among consumers only ............................................................ 43
Table 22: Simulated impact of vitamin A fortification of wheat flour and edible oil on the
prevalence of inadequate and excessive intakes in the total population ....................................... 46
Table 23: Simulated impact of vitamin A fortification of wheat flour and edible oil on the
prevalence of inadequate and excessive intakes among consumers of fortifiable foods only* .... 46
Table 24: Nutritional status of children and women ..................................................................... 48
vi
List of figures
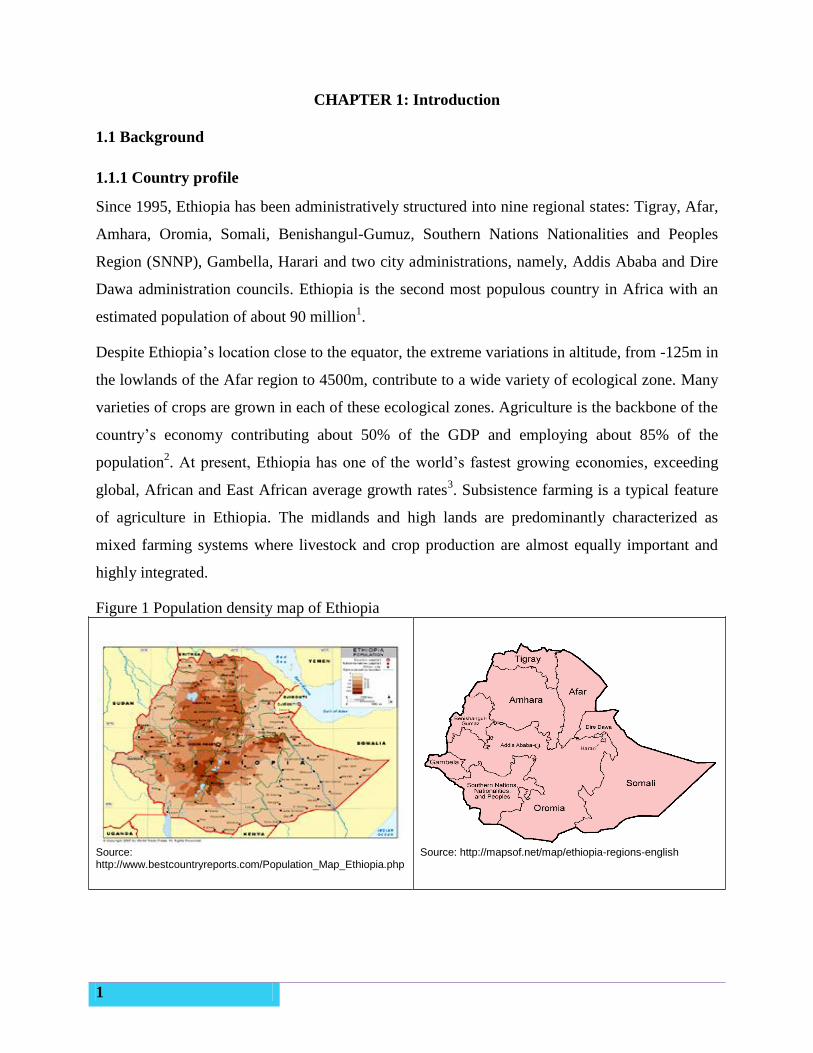
Figure 1 Population density map of Ethiopia ................................................................................. 1
Figure 2: Frequency of data collection by day of week ................................................................ 21
Figure 3: Proportion of total diet, in grams, reportedly consumed of each food group, by target
group, weighted for national population ....................................................................................... 23

vii
Foreword
Malnutrition, including micronutrient deficiencies, continues to be a major health burden in
developing countries. Children and women are among the groups most at risk. Dietary
inadequacy of consumed nutrients, low bioavailability of key micronutrients from plant based
diets and infection are major contributing factors.
For the past 10 years a significant achievement has been made in the reduction of undernutrition
in Ethiopia through the Health Extension Program (HEP) and multi-sectoral involvement. To
maximize these efforts and achievements, recently the Government revised the National
Nutrition Program (NNP) to strategically address the nutrition problem through multisectoral
linkages and focus on the life cycle approach, accelerated stunting reduction initiatives, National
Food Fortification and alignment of its objective with the Growth and Transformation Plan
(GTP).
However, the lack of national and regional based information on individual food and nutrient
intake has been an impediment to designing and implementing interventions such as national
food fortification and supplementation to alleviate the major micronutrient deficiencies in the
country. The National Food Consumption Survey is therefore both extremely valuable and
timely. The findings provided by this survey will help policy makers in developing nutrition
interventions aimed at reducing malnutrition and micronutrient deficiency in Ethiopia’s
vulnerable populations.
I would like to express my heartfelt gratitude to the research teams and advisory panel on the
food consumption survey for their useful and valuable expert advice on this survey. I also extend
my thanks to the survey respondents and experts from region and woreda who have participated
in the study and contributed to a successful outcome.
Amha Kebede (PhD)
Director General
Ethiopian Public Health Institute (EPHI)
viii
Acknowledgements
The Ethiopian Public Health Institute (EPHI) would like to acknowledge field workers, team
leaders, survey coordinators and other contributors mentioned hereunder for their commitment,
dedication, hard work and valuable contribution for the completion of the survey.
Contributors from EPHI
Dr. Amha Kebede: Overall survey coordinator
Mr. Tibebu Moges: National coordinator, Principal investigator
Ms. Aregash Samuel: National coordinator, survey developer, enumerator trainer, co-author
Mr. Biniyam Tesfaye: Regional coordinator, enumerator trainer, survey tool developer, co-author
Mr. Aweke Kebede: Regional coordinator, enumerator trainer, survey tool developer, co-author
Ms. Tsehai Assefa: Regional coordinator, enumerator trainer, co-author
Mr. Dilnesew Zerfu: Regional coordinator,
Mr. Andinet Abera: Regional coordinator, manual data editor
Mr. Berhanu Wedajo: Regional coordinator, manual data editor
Mr. Habtamu Fufa: Regional coordinator, enumerator trainer
Mr. Girma Mengistu: Regional coordinator, manual data editor
Dr. Getachew Addis: Regional coordinator
Mr. Habtamu Teklie: Regional coordinator
Dr. Cherinet Abuye: National coordinator, survey developer (now at ENGINE/ USAID)
Mr. Shimelis Tizazu: National coordinator, survey developer, enumerator trainer (now at ACF)
Mr. Mesele Mindachew: Regional coordinator
Mr. Muleneh Gizaw: Regional coordinator
Contributor from Central Statistics Agency
Aberash Tariku: Developed survey sampling design
Esayas Muleta: Developed survey sampling design
Kiflu Tesfaye: Developed data entry template with conversion of intakes into gram equivalents,
prepared population descriptive statistics
Alemtsehay Biru: Assisted with recruitment
ix
Contributors from the Micronutrient Initiative
Dr. Abdulaziz Adish: Survey development and reporting
Dr. Sara Wuehler: Senior technical advisor, co-author
Prof. Rosalind Gibson (University of Otago, New Zealand) and Prof. Ian Gibson: Technical
advisor on fortification simulations
Katherine Birks: Final data cleaning and secondary data analysis
Contributor from the Global Alliance for Improved Nutrition and the Micronutrient
Initiative
Michelle Gibbs: Co-Author, Data analyzer: fortification simulations, nutrient intakes, key
nutrients in food composition tables.
Funding for the National Food Consumption Survey was provided by the following:
World Bank through the Federal Ministry of Health
Irish Aid
The government of Canada through the Canadian International Development Agency (CIDA)
and the Micronutrient Initiative
Additional funding to complete the fortification simulations presented in this report was
provided by:
The Global Alliance for Improved Nutrition (GAIN)
x
Acronyms and Abbreviations
Abbreviation Meaning
CBN Community Based Nutrition
CDC Centers for Disease Control and
Prevention
CHP
CIDA
Community Health Promoters
Canadian International
Development Agency
CSA Central Statistical Agency
EA Enumeration Area (cluster)
EAR Estimated Average Requirement
EDHS Ethiopian Demographic and
Health Survey
EHNRI
EPHI
Ethiopian Health and Nutrition
Research Institute
Ethiopian Public Health Institute
FAO Food and Agriculture
Organization
FMoH Federal Ministry of Health
GDP
GTP
General Domestic Product
Growth and Transformation Plan
HEP Health Extension Program
HEW Health Extension Worker
HH Household
HICES Household, Income
Consumption and Expenditure
Survey
IMAPP Intake Monitoring Assessment
and Planning Program
IZiNCG International Zinc Nutrition
Consultative Group
Abbreviation Meaning
KII Key Informant Interview
MCH Maternal and Child Health
MDG Millennium Development Goals
MOH Ministry of Health
MI Micronutrient Initiative
MUAC Mid Upper Arm Circumference
NFCS National Food Consumption
Survey
NFS National Fortification Strategy
NGO Non-Governmental Organization
NNP National Nutrition Program
NNS National Nutrition Strategy
PPS Probability Proportional to Size
RAE Retinol Activity Equivalents
SERO Scientific and Ethical Review
Office
SNNPR Southern Nations, Nationalities
and People’s Region
UL Upper Level of safe intakes
WHO World Health Organization
WMS Welfare Monitoring Survey
xi
Executive Summary
Background: The Ethiopian National Food Consumption Survey (NFCS) was developed in
response to a request by the Federal Ministry of Health of Ethiopia (FMoH) to obtain evidence to
inform the National Fortification Strategy (NFS). For this purpose, dietary data were necessary
from individuals of primary interest for this strategy: 1) individuals in the population who are at
highest risk of micronutrient deficiencies, women and young children; and 2) individuals who
would likely be the highest consumers of a fortified foods, thus consumers who might be at risk
of toxicity if the fortificant level is set too high, these were considered to be men in urban areas
who would have the greatest access to the fortified foods. Due to the high variability in dietary
patterns across administrative regions in Ethiopia, it was determined that nationally and
regionally representative data were necessary to inform the NFS.
The main objective of this survey was to investigate the food consumption pattern of the
Ethiopian population in order to provide evidence-based information for National Food
Fortification programs. Specifically to,
Generate baseline information on individual level food consumption patterns of vulnerable
populations, the types of foods consumed and gaps in key nutrients, particularly for women
and young children;
Identify suitable food vehicle(s) for micronutrient fortification at regional and national
level;
Identify factors related to food consumption patterns (demography, geography, socio-
economic status);
Identify to what extent food fortification could be used to address micronutrient
deficiencies in Ethiopia, especially among vulnerable populations;
Estimate the level of fortification that must be achieved to adequately address
micronutrient deficiencies in vulnerable groups in Ethiopia without creating risks for high
consumers.
Survey methodology: The survey population was drawn from households randomly selected to
be representative of all nine regions (Afar, Amhara, Benshangul-Gumuz, Gambella, Oromia,
Somali, Southern Nations Nationalities and People’s, Tigray, Harari) and the two city
xii
administrations of Ethiopia (Addis Ababa and Dire Dawa). The clusters were selected from rural
and urban sites to ensure collection of dietary habits from a range as broad as possible of
different ethnic, geographic, socio-economic and cultural settings. The sampling strategy from
which regionally representative outcomes could be estimated include sampling 26 households in
each of 324 enumeration areas (20-40 per political or administrative region), totalling 8,424
households. The target population was young children (6-35 months of age), their closest female
caregiver (15-49 years of age) and (in ~30% of urban households) their closest male caregiver or
relative (19-45 years of age). Data collection included one reported individual level 24-hour
dietary recall per participant. The measurement of weight, length/height, and mid upper arm
circumference (MUAC) with data on age and sex were used to assess the nutritional status of
children 6-35 months while only weight and height measurements were obtained among
mothers/female caregivers.
All data were double entered using CSPRO software after at least double manual editing.
Extensive additional data cleaning was conducted to identify and correct any errors or missing
information in translation of the data to coding forms and to ensure all recipes and shared foods
were properly linked to intake data. Irreconcilable data were removed from the calculations. The
survey protocols were reviewed and approved by Ethiopian Public Health Institute’s Scientific
and Ethical Review Committee.
Main findings: Of the 8267 households visited, dietary data were collected from 8133 women,
8079 children and 380 men from the eleven administrative regions, which account a 98% and
97% response rate for women and children respectively. The difference between the projected
and actual sample size was due to lack of adequate number of target groups in some enumeration
areas.
About one in ten households was headed by women, which is common in Ethiopia. A large
portion (43%) of the heads of household had no formal education. The regions with the highest
percentage of household head that with no formal education include Somali (68.7%), Afar
(59.8%) and Amhara (51.1%), whereas Addis Ababa had the lowest percentage (10.1%).
This survey was conducted in Ethiopia’s lean season and the day of data collection was almost
equally represented throughout the week. Considering the consumption of the main food groups,
cereals/grains constitute a major part of children’s, women’s and men’s diet. Less than 10% of
xiii
respondents reported consuming any food group other than cereals/grains, except for dairy
among children and slightly more than 10% of men reporting consumption of non-vitamin A rich
fruits and vegetables. This monotonous diet may reflect both their cultural eating habits and
lower availability of a variety of foods during the survey period.
We found substantial difference in macronutrient intakes among the target groups across regions.
Within population groups, there were a statistically significant differences (p<0.001) in the mean
energy intakes across regions. The lowest mean energy intake in children was reported in
SNNPR. In adult women and men, the lowest mean intake of energy was reported in Somali, and
the highest intakes were reported in Afar and Tigray regions.
The lowest protein intakes among children were reported in SNNP, Benishangul-Gumuz, Somali
and Amhara, while the highest intakes were reported in Afar region. Similar relative patterns
were reported in the median protein intakes among adult women and men, with the lowest
reported protein intakes in the Somali region. Inadequacy of protein intakes among children and
women is associated with low consumption of flesh foods, legumes and other foods poor in
protein content. The average total calories consumed by children were below recommended
intakes by age in all regions. The lowest reported caloric intakes among children were in
Gambella region.
Nationally, most of the energy in the diet comes from carbohydrate. Carbohydrate contributes
67.2%, 73.5 %, and 68.1% of the total energy intake in children, women and men respectively.
The carbohydrate contribution to energy intake was greater than 45% in all regions and target
groups. Respective fat and protein contributions to total energy were 23% and 10.5% in children,
16.5% and 9.7% in women, and 20.7 and 10.4% in men.
Dietary modeling using data from the NFCS indicates that a higher proportion of the urban
population consume fortifiable wheat and oil, and will consequently be the main beneficiaries of
fortification programmes targeting these food. When conducting fortification simulations,
IMAPP (Intake, Monitoring, Assessment and Planning Program) was used to simulate the impact
of proposed fortification of wheat flour and oil, with external estimates of variability. The
objective was to maximize the impact on reducing inadequate intakes while minimizing the risk
of excessive intakes.
xiv
Simulations of fortification scenarios indicate that the impact of fortification of edible oil and
wheat flour varies by the micronutrient added iron, zinc and vitamin A and the population group
of interest. Fortification did not result in excessive intakes of zinc or vitamin A in urban males –
the group considered to be most likely at risk of excessive intakes. However, excessive iron
intakes were reported in adults in almost all regions and population groups pre-fortification.
The results indicated that iron intakes were high and there was limited benefit of fortification of
wheat flour on inadequate intakes, with the potential to increase the prevalence of excessive
intakes in both women of childbearing age and urban males. The fortification of wheat flour with
iron at 6 mg/100g had limited impact on the prevalence of inadequate intakes, reducing the
prevalence of inadequacy in women from 13% to 10%.
Of the two scenarios for fortification of wheat flour with zinc, the highest fortification level was
shown to have the greatest impact on inadequate intakes without exposing sub-groups of the
population to excessive intakes. At the national level, it is estimated that it could reduce
inadequate intakes from 50% to 34% in women of child-bearing age, and 29% in urban areas.
Modeling the impact on those that are consumers of fortifiable wheat flour also indicated that
inadequate intakes would virtually be eliminated in both urban and rural areas.
Fortification of both edible oil and wheat flour would further decrease the prevalence of
inadequate intakes; however fortification of wheat flour at the higher fortification level was
shown to increase the prevalence of excessive intakes in young children that were consumers of
both products. Due to potential for excessive intakes in young children, the fortification of edible
oil alone with vitamin A is recommended.
For children, because of the size of this survey, we were not able to collect direct information on
the amount of breast milk consumed by each child. Therefore, the analyses are based solely on
what recommended intakes from complementary foods. Because this assumes an average intake
of breast milk, our estimates could over or under estimate the actual needs of Ethiopian children.
The highest acute malnutrition as accounted by highest wasting was observed in Afar (26.0%)
followed by Benishangul-Gumuz region (15.1%), Gambella (13.9%) and Somali (13.1%). This
order is slightly different from the observed prevalence of wasting among children less than five
years of age in the 2011 EDHS in these regions. The lowest acute malnutrition was found in
Addis Ababa (3.2%). The prevalence of stunting in this study was highest in Tigray (47.7%)
xv
followed by Amhara (44.9%) and SNNPR (40.7%). Children in Addis Ababa, Gambella, Somali,
and Dire Dawa are the least stunted ones.
Conclusions: Based on the survey findings, we conclude that majority of children consumed a
diet deficient in energy and the nutrient density is insufficient to meet their requirements. An
improvement of diet diversity is crucial for, both quality and quantity of their intakes. The survey
also shows that children and women have intakes below the recommended amounts of vitamins
and minerals such as vitamin A, zinc and calcium. Moreover, the survey provides insight into the
food consumption which can be used to stimulate the expected impact of various fortification
strategies and to develop recommendations for food based approaches, taking into account ethnic
and cultural differences, food availability and use and agricultural practices that could alleviate
nutrient deficiencies and improve nutrition related public health initiatives in Ethiopia. Based on
current knowledge of dietary intakes and the expected bioavailability of iron from foods
commonly consumed in Ethiopia, further information is required before recommending universal
fortification with iron
Recommendation: Recommended approaches to improve nutrient consumption among
Ethiopian children and women, while avoiding risk of excesses include:
Fortification of wheat flour with zinc and fortification of edible oil alone with vitamin A
for women of childbearing age and adult men
Evaluate the bioavailability of local foods, particularly non-animal source grains and
legumes, to determine whether the estimates of high iron intakes adequately reflect actual
absorption of iron consumed
Revise the question of iron fortification following the national micronutrient survey
results are available, particularly determination of whether high anaemia rates in Ethiopia
reflect iron deficiency or if other cause are likely to have a greater impact
Promotion of diet diversity and adequate quantity, including increased consumption of
animal products, legumes, fruits and vegetables to increase intakes of protein, vitamin A,
zinc, iron and folate. This would also promote consumption of foods that are good
sources of folate, vitamin C and other micronutrients that are likely low in the reported
diets.
xvi
Nutrition education to create awareness of the impact of dietary inadequacies on health
and wellbeing of individuals and by extension the nation.
In addition to the promotion of exclusive breast feeding to 6 months and continued
breastfeeding to 2 years, adequate quantity and quality of complementary foods during
the 6-24 month transition must also be promoted.
Exploring alternatives for improving nutrient density of complementary foods through
the local production of nutrient rich complementary foods.
Dissemination of the key findings of this survey at national and regional level to the
public and different stakeholders actively engaged in nutrition as a resource for policy
and programs development.
Continue investigations of these data to expand the scope of potential use of these
findings.
To further refine our estimates related to children's complementary feeding patterns,
future studies should consider available data and/or conduct new analyses to quantify
averages and ranges of breast milk intakes among Ethiopian children.
1
CHAPTER 1: Introduction
1.1 Background
1.1.1 Country profile
Since 1995, Ethiopia has been administratively structured into nine regional states: Tigray, Afar,
Amhara, Oromia, Somali, Benishangul-Gumuz, Southern Nations Nationalities and Peoples
Region (SNNP), Gambella, Harari and two city administrations, namely, Addis Ababa and Dire
Dawa administration councils. Ethiopia is the second most populous country in Africa with an
estimated population of about 90 million1.
Despite Ethiopia’s location close to the equator, the extreme variations in altitude, from -125m in
the lowlands of the Afar region to 4500m, contribute to a wide variety of ecological zone. Many
varieties of crops are grown in each of these ecological zones. Agriculture is the backbone of the
country’s economy contributing about 50% of the GDP and employing about 85% of the
population2. At present, Ethiopia has one of the world’s fastest growing economies, exceeding
global, African and East African average growth rates3. Subsistence farming is a typical feature
of agriculture in Ethiopia. The midlands and high lands are predominantly characterized as
mixed farming systems where livestock and crop production are almost equally important and
highly integrated.
Figure 1 Population density map of Ethiopia
Source: http://www.bestcountryreports.com/Population_Map_Ethiopia.php
Source: http://mapsof.net/map/ethiopia-regions-english
2
1.1.2 Magnitude of nutrition problem
Results of the last three consecutive Ethiopia Demographic and Health Surveys (EDHS)
identified an encouraging reduction of malnutrition among children2. Stunting, underweight and
wasting were reduced from 58% to 44%, 41% to 29%, and 12% to 10% respectively between the
periods of 2000 to 2011. These encouraging reductions were achieved through improvements in
food and nutrition security, improvements in the policy landscape for nutrition and the scaling up
of nutrition programs to reach more children and women. However, malnutrition is still a public
health problem and remains a concern within the country’s rapid economic development.
Micronutrient malnutrition is a severe public health problem in Ethiopia. Although the EDHS
2011 found a 10% decrease in anaemia among both women and children in the last five years
(54% and 27% in 20054 compared to 44% and 17% in 2011 among children and women,
respectively), the overall prevalence of anaemia remains a public health concern. The iodine
results from the 2005 Micronutrient survey, conducted by the Ethiopian Health and Nutrition
Research Institute-EHNRI (recently renamed the Ethiopian Public Health Institute-EPHI) found
that goiter prevalence among children was 40% (28% for palpable and 12% for visible goiter)
and 36% among women aged 15-495. This survey also found that just 4.2% of Ethiopian
households had iodized salt, a marked deterioration from the previous decade. The 2008 National
Nutrition Program (NNP) baseline report found that nearly 40% of children were vitamin A
deficient, which is known to contribute to child mortality. Based on the high prevalence of
stunting in Ethiopia, it is also likely that zinc deficiency is a public health concern6. These data
highlighted to the Ethiopian Federal Government and particularly the Federal Ministry of Health
(FMoH) the need for immediate and concerted efforts to alleviate malnutrition in Ethiopia in
general and micronutrient deficiencies in particular.
1.1.3 The National nutrition program with respect to food fortification
In order to address the National nutrition situation, the government of Ethiopia endorsed the
country’s first-ever National Nutrition Strategy (NNS) in February 2008. This is the cornerstone
for the surveillance and evaluation of nutrition-related problems in Ethiopia, and the
implementation and monitoring of related nutrition interventions. Following this endorsement,
the FMOH, in collaboration with partner organizations, developed the National Nutrition
Program (NNP) to implement the NNS. The primary aim of this program was to reduce the
3
magnitude of malnutrition in Ethiopia, especially among children under five as well as pregnant
and lactating women.
In order to comprehensively address the nutrition problem, the NNP harmonizes government
strategies, donor assistance and NGO programs that have an impact on nutrition. The NNP will
also seek to orient the government’s large programs towards achieving “nutrition” objectives and
applying the “nutrition lens” in implementation and monitoring. The 2008 NNP contributed to a
significant reduction in the proportion of Ethiopians suffering from poverty and malnutrition
(Millennium Development Goals-MDGs I & IV).
To strengthen the nutrition action in the country, taking into account the key challenges in the
implementation of the 2008 NNP and continuation of national progress beyond the MGDs, the
2008 NNP was revised in 2014 with key rationales: strategically addressing nutrition problems
through multisectoral linkages and focusing on the life cycle approach to accelerate stunting
reduction initiatives, initiate the National Food Fortification Program and align NNP objectives
with the Growth and Transformation Plan (GTP), MDGs7 and beyond. Among the national
nutrition strategies, food diversification (food-based approach) is one highlighted approach for
the control and prevention of micronutrient deficiencies, but this remains beyond the means of
many rural and urban poor. The Ethiopian diet is mainly composed of cereals (maize, sorghum,
teff, and barley), tubers and roots (Enset, potatoes, and sweet potatoes), pulses (peas, chickpeas,
beans, lentils) and oil seeds. A more recent trend has seen a rise in wheat consumption with
Ethiopia producing a higher proportion of its own wheat than neighbouring countries8. Despite a
large livestock population, the food supply of animal products is limited in comparison to the
total population. Consumption of animal products is especially low in rural areas, with the
exception of pastoral areas where milk is a major component of the diet.
1.1.4 Purpose of the survey
Food consumption surveys, also known as food intake surveys or dietary surveys are used to
estimate food consumption patterns at the national, regional, household and individual level.
Types of data typically collected for these surveys include: amounts and types of foods
consumed, the frequencies at which these foods are consumed and factors influencing food
intake patterns. Individual food consumption patterns are affected by a number of cultural,
geographical and socio-economic factors and can be used to quantify consumption patterns from
the household level to the national level.
4
Multiple strategies are required to address food insecurity and micronutrient deficiency in a
population. Some groups, particularly pregnant and lactating women and children under two
years of age, require targeted strategies (e.g., micronutrient supplementation for pregnant and
lactating women and fortified complementary foods or micronutrient powders to improve the
nutritional value of complementary foods for children)9. To meet the needs of the general
population, interventions must address the food supply as a whole, whether by increasing
availability and utilization of a more diverse diet and/or improving the micronutrient content of
foods that are commonly consumed. Strategies to implement these changes require: adequate
availability of foods with sufficient micronutrient content, ability of the vulnerable population to
purchase high quality foods in sufficient quantity, and behaviour change to put these changes
into practice.
In Ethiopia, the capacity for dietary diversification efforts to improve the nutritional status of the
population is limited in the short term due to issues related to availability, access and behaviours.
The burden of under nutrition is very high in both peri-urban and rural areas. Programs to reach
these vulnerable groups are currently very limited. As a result, the Ethiopian government is
considering opportunities to fortify widely consumed foods with key micronutrients. Before
embarking on fortification, it is important to first identify the foods that are commonly consumed
and the amounts consumed. Based on this information, simulations can calculate the amount of
fortificant that would be potentially efficacious, appropriate levels of fortification to avoid over-
fortification, and the extent to which commercially fortified foods could be made accessible to
the most nutritionally vulnerable populations. With this in mind, the National Food Consumption
Survey was carried out to provide evidence to inform a National Food Fortification Program.
The Ethiopian National Food Consumption Survey (NFCS), conducted from June to September
2011, is the first of its kind in Ethiopia. Although food consumption surveys are conducted
among high-risk populations in many developing countries, nationally representative food
consumption surveys have rarely been conducted, particularly in developing countries. This is
one of the first nationally representative surveys to be conducted using individual-level 24-hour
dietary recall data among women and young children in developing countries and it is the first to
collect data that are representative at provincial or administrative region level.
This survey was conducted by the Ethiopian Public Health Institute (EPHI), the former Ethiopian
Health and Nutrition Research Institute (EHNRI) with technical support from the Micronutrient
5
Initiative (MI) and financial assistance from World Bank through Federal Ministry of Health
(FMOH), Irish Aid and the Canadian International Development Agency (CIDA). The Ethiopian
Central Statistical Agency (CSA) provided technical assistance with respect to sample size
determination, sample area selection and some statistical assessments. The Global Alliance for
Improved Nutrition (GAIN) provided financial support for preliminary fortification simulations.
1.2 Objectives of the survey
The main objective of this survey was to investigate the food consumption pattern of the
Ethiopian population in order to provide evidence-based information for national food
fortification programs.
The specific objectives of this survey were to:
Generate baseline information on food consumption patterns of the population (the types
of foods consumed, particularly for women and young children and nutrient intake);
Identify suitable food vehicle(s) for micronutrient fortification at regional and national
level;
Identify factors related to food consumption patterns (demography, geography, socio-
economic status);
Identify to what extent food fortification could be used to address micronutrient
deficiencies in Ethiopia, especially among vulnerable populations;
Estimate the level of fortification that must be achieved to adequately address
micronutrient deficiencies in vulnerable groups in Ethiopia without creating risks for high
consumers.
6
CHAPTER 2: Survey methodology
2.1 Survey population
The survey population was drawn from households randomly selected to be representative of
each of the nine regions (Afar, Amhara, Benshangul-Gumuz, Gambella, Oromia, Somali,
Southern Nations Nationalities and People’s Region, Tigray, Harari) and the two city
administrations of Ethiopia (Addis Ababa and Dire Dawa). The clusters were selected from rural
and urban sites to ensure collection of dietary habits from the range of different ethnic,
geographic, socio-economic and cultural settings. In addition, to increase potential comparability
to HICES data, for which data were collected spanning a full year, the NFCS clusters were
selected from a subset of the randomly selected clusters for the 2010-11 HICES10
. The most
recent estimate of total population of each region is presented in Table 1. Although they are
small in comparison to other administrative regions, the city of Dire Dawa and the Harari region
were included to conform to national survey requirements to collect data from each
administrative region. The household was the unit of selection and information was collected on
the basis of the individual. Specifically, data were collected from household members that fell
into the following groups:
A. Adult females 15-45 years: the group with greatest likelihood to benefit from the
fortification strategy.
B. Young children 6-35 months: the ages considered highest risk of food and nutrient
deficiency are 6-24 months; the upper age was extended to ensure sufficient children
were available per cluster. Although unlikely to benefit extensively from mass
fortification, information from this group is vital to explore complementary strategies that
could be implemented to reduce gaps and/or reach their micronutrient requirements. The
cost of adding this group was minimal for the great benefit gained.
C. Adult urban males 19-45 years: the group likely to have access to and consume the
highest amount of any selected fortifiable food. This group assists in setting the safe
upper level of fortification.
2.2 Scope and design of survey
A nationally-representative cross-sectional survey was conducted to provide information to the
government about food, access and utilization. It was vital to ensure that the instruments used in
7
the survey were appropriate to capture the diversity of foods and consumption patterns across the
country and within regions. More critical than the policy for all national surveys to collect from
all administrative regions, this survey was designed to collect regionally representative data due
to the expected high variability of dietary patterns across regions.
2.3 Sample size determination and cluster selection
Sample size was estimated as the number of households required to ensure representativeness at
the regional and national level, allowing comparability between rural and urban areas, and to
achieve a valid estimation of intake of key micronutrients (iron, zinc, vitamin A) for women and
children. The sample size for males was estimated to allow nationally representative selection of
urban males. Because the actual prevalence of low micronutrient intakes was unknown, the
estimated prevalence was set at 50% to maximize the sample size. In addition, a design effect of
2 was selected as recommended for nutrition surveys when the actual cluster effect is unknown.
The most recent information on expected percentage of the households that included at least one
individual of each of our key age and sex groups was used to calculate the sample size.
Using standard probability proportional to size (PPS) methodology, the Ethiopian Central
Statistics Agency (CSA) maintains a listing of all households nationally in groupings of
approximately 250 households. These groupings serve as the pool of clusters from which the
CSA randomly selects clusters for all nationally and regionally representative surveys, as the
HICES, and thus also the NFCS. Thus, in each region (strata), these clusters are found within
larger administrative units of cities, kebeles and villages, but could also potentially include a
number of very small villages or “Gotes”. Initial calculations indicated a two-stage cluster
sampling design, with 20-43 clusters per region and a minimum of 26 households from each
cluster. Based on prior experience, the CSA adjusted the regional distribution to no more than 40
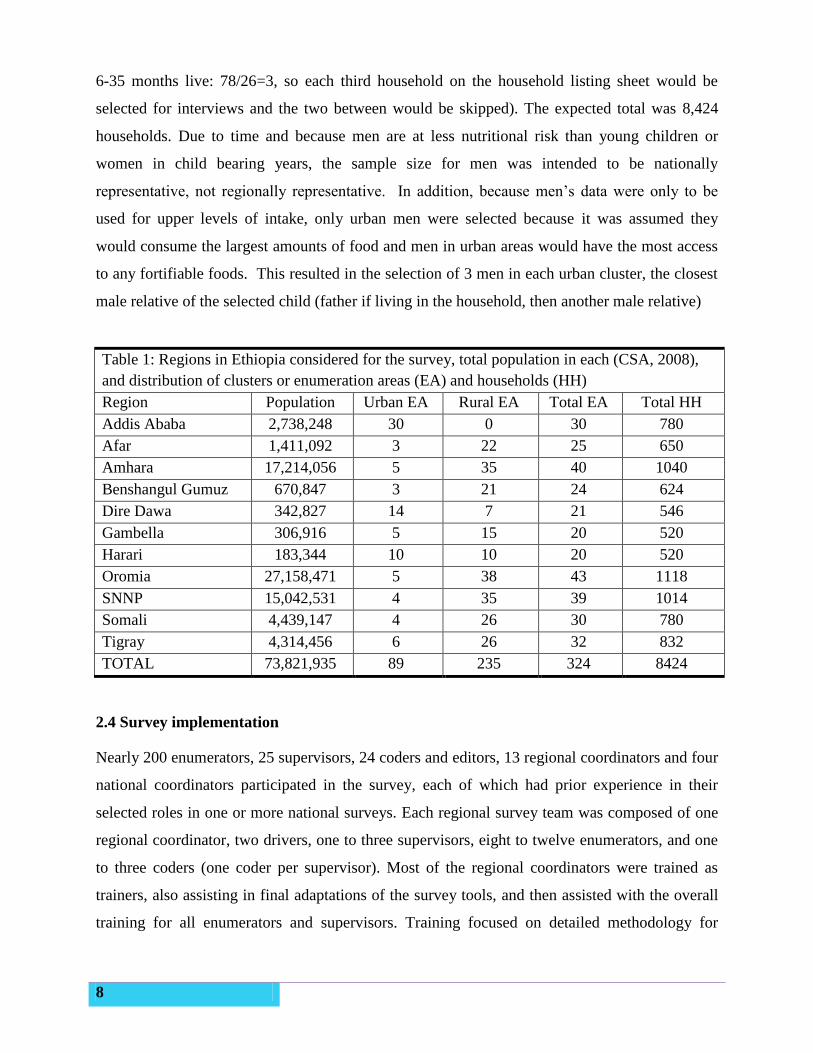
clusters in the largest regions and no less than 20 in the smaller regions, for a total of 324
enumeration areas (EAs) or clusters (20-40 clusters/EAs per region x 11 administrative regions,
see Table 1 for actual distribution of EAs by region).
Cluster or EA households were listed prior to randomly selecting households for inclusion in the
survey. Because young children were expected to be the limiting population group, these listings
identified all households in which resided at least one child 6-35 months of age. If more than 26
households contained a child, a household skip number was calculated by dividing the total
number of households with a child by 26 (e.g. EA listing with 78 households in which children
8
6-35 months live: 78/26=3, so each third household on the household listing sheet would be
selected for interviews and the two between would be skipped). The expected total was 8,424
households. Due to time and because men are at less nutritional risk than young children or
women in child bearing years, the sample size for men was intended to be nationally
representative, not regionally representative. In addition, because men’s data were only to be
used for upper levels of intake, only urban men were selected because it was assumed they
would consume the largest amounts of food and men in urban areas would have the most access
to any fortifiable foods. This resulted in the selection of 3 men in each urban cluster, the closest
male relative of the selected child (father if living in the household, then another male relative)
Table 1: Regions in Ethiopia considered for the survey, total population in each (CSA, 2008),
and distribution of clusters or enumeration areas (EA) and households (HH)
Region Population Urban EA Rural EA Total EA Total HH
Addis Ababa 2,738,248 30 0 30 780
Afar 1,411,092 3 22 25 650
Amhara 17,214,056 5 35 40 1040
Benshangul Gumuz 670,847 3 21 24 624
Dire Dawa 342,827 14 7 21 546
Gambella 306,916 5 15 20 520
Harari 183,344 10 10 20 520
Oromia 27,158,471 5 38 43 1118
SNNP 15,042,531 4 35 39 1014
Somali 4,439,147 4 26 30 780
Tigray 4,314,456 6 26 32 832
TOTAL 73,821,935 89 235 324 8424
2.4 Survey implementation
Nearly 200 enumerators, 25 supervisors, 24 coders and editors, 13 regional coordinators and four
national coordinators participated in the survey, each of which had prior experience in their
selected roles in one or more national surveys. Each regional survey team was composed of one
regional coordinator, two drivers, one to three supervisors, eight to twelve enumerators, and one
to three coders (one coder per supervisor). Most of the regional coordinators were trained as
trainers, also assisting in final adaptations of the survey tools, and then assisted with the overall
training for all enumerators and supervisors. Training focused on detailed methodology for
9
collection of 24-hour dietary recall. In support of this, additional training included survey
objectives and methodology, responsibilities of each team member, quality control,
standardization of methods, ethics and professional conduct, appropriate interview techniques
(especially for 24-hour dietary recall), anthropometry and use of cluster maps for random
household selection. The survey tool was tested and adapted during the training of trainers,
translated into Amharic and again pretested among potential participants living in non-selected
clusters prior to commencing the full survey. Based on pretesting, some additional adaptations
were made to the data collection tool to improve the interview process. Training was conducted
in May-June 2011 and data were collected June-September 2011.
Regular supervision was undertaken at various levels to ensure the quality of the data. The data
collection activities of each team were been managed by the team’s supervisor, field data editor
and regional coordinator who were responsible for supervision, field data editing and
coordination of activities. Supervisors and regional coordinators conducted repeat interviews or
truncated spot-checks among about 10% of interviewed households to confirm the quality of data
collected.
Occasionally the security status of the EA changed, residents were missing (moved for animal
pasture during seasonal changes), or the weather (rainy season with spontaneous rivers blocking
roads) made it impossible to reach the cluster within one day of travel from a passable local road.
In these situations, the central statistics agency randomly selected an alternate cluster from all
remaining clusters in that area that was expected to be as similar as possible to the replaced
cluster.
2.5 Indicators measured
The indicators measured include
Demographic characteristics, age, sex, educational status of head of household and
woman interviewed, total household size by age group
Access to safe drinking water
Health and breastfeeding status of selected child 6-35 months of age
Individual 24-hour dietary recall for selected child 6-35 months of age
Individual 24-hour dietary recall of closest female caregiver or relative 15-45 years of
age
10
Individual 24-hour dietary recall of closest male caregiver or relative 19-45 years of age
in subset of urban household
Anthropometry (height or length, weight, mid-upper arm circumference of child and
height and weight of woman interviewed)
Due to unforeseen difficulties in importing appropriate blood collection tubes, we were not able
to collect the desired subset of biochemical indicators.
2.6 Data collection
A household was defined as individuals living together and sharing meals from a common
cooking pot. If there was more than one target mother-child currently living in the selected
household, one female caregiver was randomly selected using one coloured match-stick in a bag
of plain match-sticks. If the selected female caregiver had more than one child 6-35 months-of-
age, the participating child was also randomly selected using the coloured match-sticks method.
Thus, data were collected from one adult female and one child in the selected age ranges in each
household. In urban populations, the closest male caregiver/relative was also interviewed in 3
households per EA.
2.6.1 Dietary recall
Dietary recall interview was used to collect individual level data on the specific type and amount
of food consumed by the selected participants during the full day (24 hours, sunrise to sunrise)
prior to the survey. The questionnaire was developed based on internationally recognized
multiple pass method described by Gibson and Ferguson11
, adjusted to the Ethiopian context
based on information gathered during the pre-test. Some final changes were made during the
training process as feedback from the enumerators provided their experience in situations that
would be encountered in the national setting.
Each interview involved, a stepwise series of questions, normal household utensils, food
substitutes (play dough, flour, lentils, water) and pictures of most commonly consumed foods in
the specific regions to improve the memory of the respondents and assist in completing the
questionnaires. A digital food scale was used to measure the gram amount of food consumed and
of ingredients used in food preparation.
11
As proposed by Gibson and Ferguson11
, the dietary interviews for this survey were structured in
“four passes” to maximize respondent recall of foods eaten and to minimize loss of information
due to participant fatigue (Annex).
The interviews were conducted on all seven days of the week to capture changes in intakes
across various days of the week. Collection days also included market days and holidays that
occurred while the team was present in the enumeration area. Interviews were conducted in the
first language of the person being interviewed; enumerators were selected to speak the
predominant regional first language, but local translators were used when needed.
2.6.2 Anthropometric measurements
The measurement of weight, length/height, and mid upper arm circumference (MUAC) with the
data on age and sex were used to assess the nutritional status of children 6-35 months while only
weight and height measurements were obtained among mothers/female caretakers. Each
measurement was made in duplicate and repeated when the second value was beyond the
allowable range for the given measurement (height/length, ≤0.5 cm, weight ≤0.1 kg, MUAC ≤0.5
cm). Children (6-35 months) and younger women (15-17 years) were referred to the nearest
health facilities for malnutrition treatment when identified with severe acute malnutrition: < 70%
median weight-for-height/length, and for just children <11 cm MUAC and/or bilateral oedema.
2.7 Data management
In the field, data were reviewed by supervisors and dietary data editors and coders. The
supervisors reviewed the forms for completeness and returned them to the enumerators for
correction and conducted retraining, as needed. The data coders reviewed the diets for
completeness as they transferred the reported dietary consumption into numeric coding sheets.
This transfer facilitated data transfer into the CSPro 4.0 computer program developed for data
capture. After return to the EHNRI, all data were again checked for accuracy and completeness.
Data were then double entered using CSPro 4.0 software by highly trained data entry clerks, and
entered data were checked for consistency, then re-entered as necessary. The transformation of
raw data to gram amounts consumed and simple statistical analysis were conducted in SPSS.
12
2.8 Data Analysis
2.8.1 Food composition and food groupings
The Ethiopian food composition tables were used as a basis for the food composition database to
calculate nutrient intakes in this survey12,13
. All or most values for phytate, zinc, calcium and
vitamin A (retinol equivalents) were missing from the published food composition tables and had
to be entered or imputed from supplementary datasets by the research team. For grains and
legumes that were commonly consumed, composite samples were taken (from various regions)
and the phytate and zinc contents were analysed in the EHNRI laboratory. The remaining data
gaps were addressed by borrowing values from alternative food composition databases and
published values. The first priority was to find published values for Ethiopian foods14,15
,
including recent analyses from the EHNRI laboratory; secondary sources were food composition
data from neighbouring African countries16
. When not available from these sources, values were
imported from the USDA SR24 dataset or other published datasets.
Food groups were assigned to each reported food based on the type of food consumed:
grain/cereal, legumes and nut, roots and tubers, dairy products, eggs, fats and oils, vitamin A rich
fruits and vegetables, and other fruits and vegetables. These were based on the categories
assigned by the UNICEF Infant and Young Child Feeding Indicators, 200817
, plus some extra
categories for other foods, such as sweets, spices, condiments and beverages. Children were
considered to have consumed food from a given grouping when any grams were reportedly
consumed, adults were considered to have consumed a given food group when at least 15 grams
were reportedly consumed
2.8.2 Usual intakes and prevalence of inadequate intakes
When planning dietary interventions the goal is to achieve usual intakes within the group that
meet the requirements of most individuals whilst simultaneously ensuring there is minimal risk
of excessive intakes18,19
. Assessment of population dietary intakes and planning nutrition
interventions require data on usual nutrient intakes in the population. The usual intake requires
that data are adjusted for within-person variation, also known as day-to-day variation. This
generally requires a second day of intake data from at least a sub-sample of the population so
that an adjustment can be made to the observed distribution of intakes. For population level data,
in circumstances where no second data of dietary intake has been collected, WHO/FAO19
and the
13
Institute of Medicine18
both recommend using external estimates of within-person variation to
adjust the distribution of single-day reported intakes.
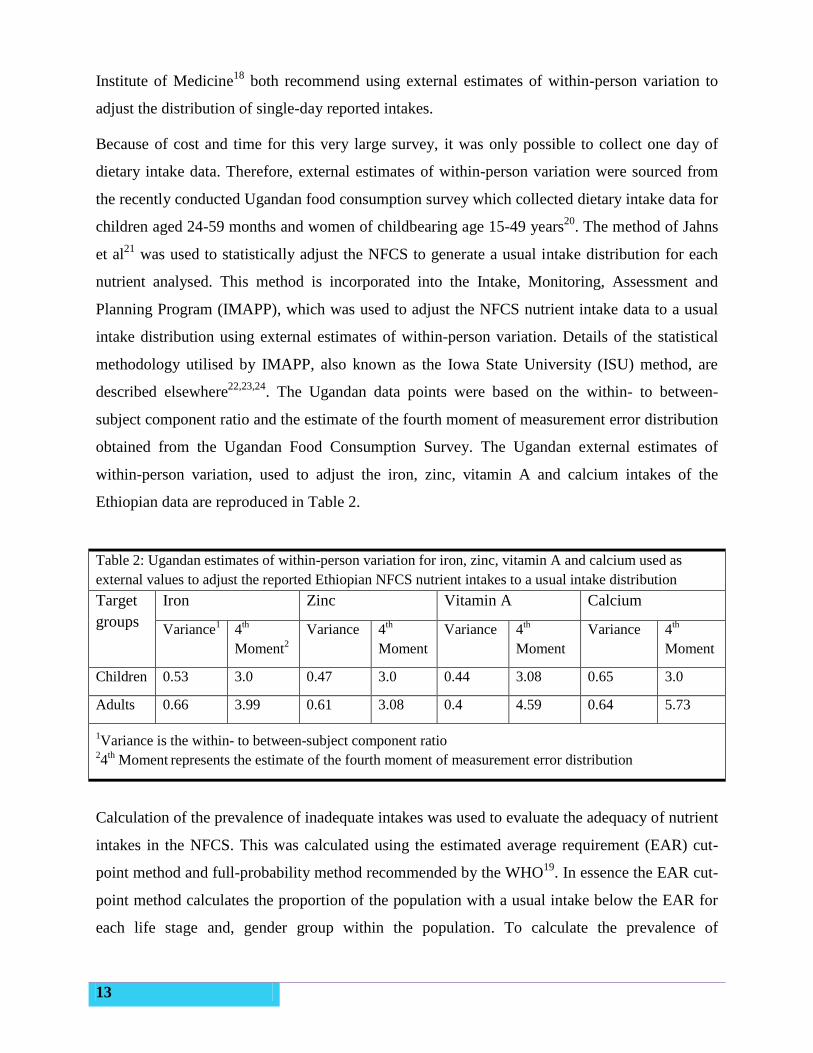
Because of cost and time for this very large survey, it was only possible to collect one day of
dietary intake data. Therefore, external estimates of within-person variation were sourced from
the recently conducted Ugandan food consumption survey which collected dietary intake data for
children aged 24-59 months and women of childbearing age 15-49 years20
. The method of Jahns
et al21
was used to statistically adjust the NFCS to generate a usual intake distribution for each
nutrient analysed. This method is incorporated into the Intake, Monitoring, Assessment and
Planning Program (IMAPP), which was used to adjust the NFCS nutrient intake data to a usual
intake distribution using external estimates of within-person variation. Details of the statistical
methodology utilised by IMAPP, also known as the Iowa State University (ISU) method, are
described elsewhere22,23,24
. The Ugandan data points were based on the within- to between-
subject component ratio and the estimate of the fourth moment of measurement error distribution
obtained from the Ugandan Food Consumption Survey. The Ugandan external estimates of
within-person variation, used to adjust the iron, zinc, vitamin A and calcium intakes of the
Ethiopian data are reproduced in Table 2.
Table 2: Ugandan estimates of within-person variation for iron, zinc, vitamin A and calcium used as
external values to adjust the reported Ethiopian NFCS nutrient intakes to a usual intake distribution
Target
groups
Iron Zinc Vitamin A Calcium
Variance1
4th
Moment2
Variance 4th
Moment
Variance 4th
Moment
Variance 4th
Moment
Children 0.53 3.0 0.47 3.0 0.44 3.08 0.65 3.0
Adults 0.66 3.99 0.61 3.08 0.4 4.59 0.64 5.73
1Variance is the within- to between-subject component ratio
24
th Moment
represents the estimate of the fourth moment of measurement error distribution
Calculation of the prevalence of inadequate intakes was used to evaluate the adequacy of nutrient
intakes in the NFCS. This was calculated using the estimated average requirement (EAR) cut-
point method and full-probability method recommended by the WHO19
. In essence the EAR cut-
point method calculates the proportion of the population with a usual intake below the EAR for
each life stage and, gender group within the population. To calculate the prevalence of
14
inadequate intakes of iron the full probability approach was used. This approach calculates the
risk of inadequacy at each level of usual intake, and is described in full in the World Health
Organization’s (WHO) Guidelines on food fortification with micronutrients19
.
The WHO EARs and recommended upper levels of safe intakes (UL) were used to evaluate the
prevalence of inadequate and excessive intakes in the NFCS, these nutrient reference values are
published in the WHO guidelines on fortification book19
. Due to the high intake of phytate in the
diet and low consumption of animal source foods, the lowest bioavailability of 5% was assumed
for all dietary iron and “low bioavailability” was assumed for all dietary zinc. The IMAPP
software was used to calculate the prevalence of inadequate intakes in each population sub-
group.
2.8.3 Simulating the impact of fortification
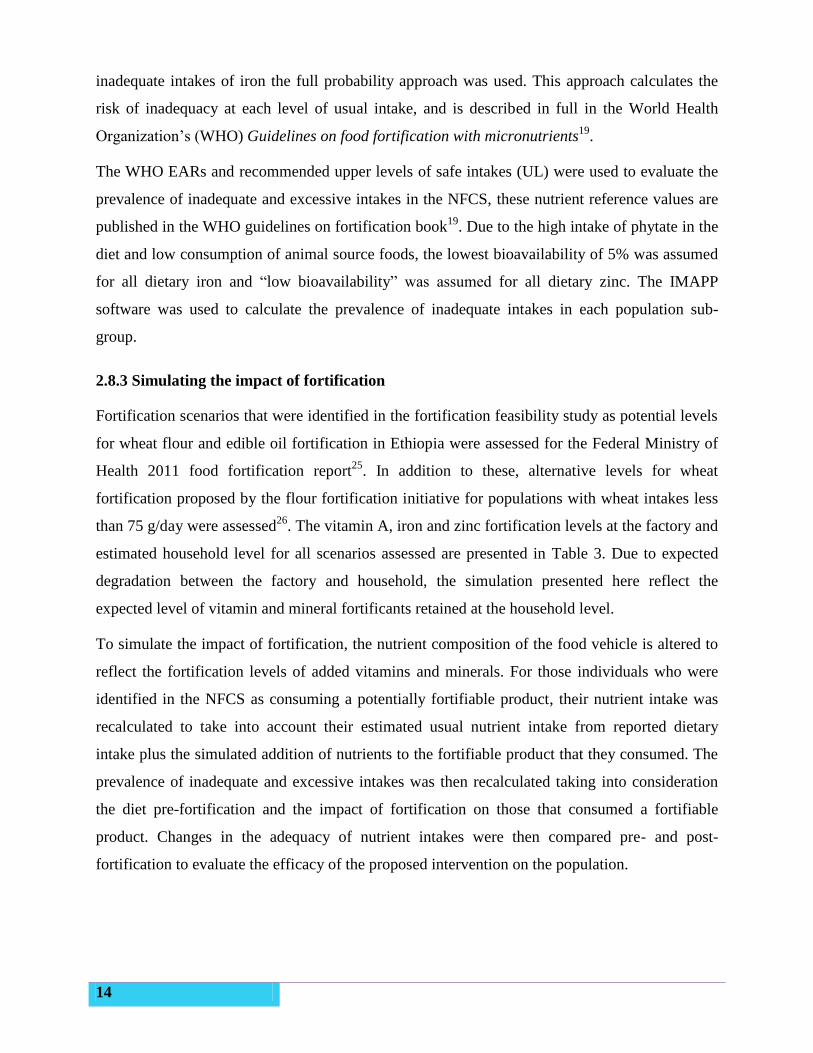
Fortification scenarios that were identified in the fortification feasibility study as potential levels
for wheat flour and edible oil fortification in Ethiopia were assessed for the Federal Ministry of
Health 2011 food fortification report25
. In addition to these, alternative levels for wheat
fortification proposed by the flour fortification initiative for populations with wheat intakes less
than 75 g/day were assessed26
. The vitamin A, iron and zinc fortification levels at the factory and
estimated household level for all scenarios assessed are presented in Table 3. Due to expected
degradation between the factory and household, the simulation presented here reflect the
expected level of vitamin and mineral fortificants retained at the household level.
To simulate the impact of fortification, the nutrient composition of the food vehicle is altered to
reflect the fortification levels of added vitamins and minerals. For those individuals who were
identified in the NFCS as consuming a potentially fortifiable product, their nutrient intake was
recalculated to take into account their estimated usual nutrient intake from reported dietary
intake plus the simulated addition of nutrients to the fortifiable product that they consumed. The
prevalence of inadequate and excessive intakes was then recalculated taking into consideration
the diet pre-fortification and the impact of fortification on those that consumed a fortifiable
product. Changes in the adequacy of nutrient intakes were then compared pre- and post-
fortification to evaluate the efficacy of the proposed intervention on the population.
15
Table 3: Factory and household levels of fortification of iron, zinc and vitamin A in wheat flour and
edible oil analysed in the fortification scenarios
Factory Level
Fortification (per 100 g)
Retention to consumer
(%)
Household level
intake (per 100 g)
Edible Oil
Retinol 2000 μg ND 2000 μg
Vitamin D 16.7 μg ND 16.7 μg
Wheat scenario 1
Iron 6.0 mg 99% 5.94 mg
Zinc 5.5 mg 99% 5.45 mg
Retinol 300 μg 65% 195 μg
Wheat scenario 2
Iron 6.0 mg 99% 5.94 mg
Zinc 9.5 mg 99% 9.41 mg
Retinol 590 μg 65% 384 μg
Note: Additional micronutrients are recommended for the national fortification program, but this set of
scenarios focus on these micronutrients.
*Fortification simulations were assessed using these levels of micronutrients, as expected to be retained
for household intakes
2.8.4 Nutritional status
For the purposes of data analyses, nutritional status was evaluated using each child weight-for-
height (or length-for-height) in comparison to the World Health Organization’s 2006 Child
Growth Standards27
. Underweight is considered to be <-2 weight-for-age z-score, stunting: <-2
height/length-for-age z-score, and wasting: <-2 weight-for-height/length z-score. For non-
pregnant women, the nutritional status was assessed using the body mass index (BMI). This is
derived from the weight in kilograms divided by the squared height in meters. BMI below 18.5 is
classified as thin (chronic energy deficiency), between 18.5-24.9 classified as normal and greater
than 25 considered as overweight.
2.9 Ethical approval
In order to ensure that the food consumption survey followed appropriate principles to ensure
informed voluntary participation and prevent unethical risk to survey subjects, the proposal of
the survey was submitted for approval to Scientific and Ethical Review Office (SERO)
committee of Ethiopian Health and Nutrition Research Institute (EHNRI), which is an
institutional ethical review board registered by Centers for Disease Control and prevention
16
(CDC) Atlanta. Final approval was obtained after incorporating the changes required by this
committee and verbal consent was allowed for this low risk survey. The five principles guiding
ethics in research were followed namely: scientific merit, equitable selection of subjects,
seeking informed consent, confidentiality and avoidance of coercion. To obtain communal
consent, the regional health bureau of each region and community leaders were informed about
the general objective and the significance of the national food consumption survey through
official letters from EHNRI. The aim of the survey, as well as the type of measurements to be
taken was also explained prior to commencing measurements and verbal consent was obtained
from the adult participants, with permission for participation of children. All participants were
informed of their option to refuse consent at any time.
17
CHAPTER 3: Results
3.1 Characteristics of the study population
Individual dietary data were collected from 8133 women, 8079 children and 380 men from an
overall total of 8267 households, which account for a 98% and 97% response rate for women and
children respectively. The difference in the actual sample size was due to lack of adequate
numbers of target groups in selected enumeration area. The majority of participants were from
rural settings (men were not surveyed in rural areas), reflecting the higher proportion of the
population found in rural compared to urban areas. The proportion of households and target
groups surveyed by region and place of residence is presented in Table 4.
3.2 Socio-demographic and economic characteristics of the households
The section presents information on selected socio-demographic and economic characteristics of
the households studied. Table 5 presents information about the household headship; household
head education level, household head relationship to child, household head employment type,
mother’s/women caregiver’s age, mother’s/women caregiver’s education, and household income
contributed by mother’s/women caregiver’s.
About one in ten households was headed by women, which is more often the case in Ethiopia2.
Many heads of household (43%) of the household head had no formal education. The regions
with the highest percentage of household head that had no formal education include Somali
(68.7%), Afar (59.8%) and Amhara (51.1%), whereas Addis Ababa had the lowest percentage
(10.1%). Three out of five household heads had attained a certain level of education, 11.8% with
primary 1st cycle, 20.9% with primary 2
nd cycle, 17.3% with high school and 6.9 with tertiary
level of education. A similar pattern was reported for the level of education among
mother/women caregiver, although a higher percentage (61.5%) had no formal education. With
the exception of Addis Ababa, where relatively low percentage (14.8%) of mother/female
caregivers was uneducated, a high percentage (more than 40%) of mother/female caregiver
reportedly had no formal education.
Irrespective of their educational status, mothers/female caregiver reported contributing to the
household income about as frequently as the head of the household. A relatively high percentage
(23.1%) of the surveyed population was classified into the poorest wealth index, as calculated for
18
national surveys in Ethiopia, and nearly 80% of the household head were engaged in self-income
generating activities. Because the majority of the household’s surveyed were from rural areas,
formal and informal employment was very low (2.8%).
19
Table 4: Total number of households and target groups surveyed by region and place of residence
Region
Place of Residence Target Groups
Urban Rural Total Urban Rural Total
No. % No. % No. % Child Women Men Child Women Men Child Women Men
Tigray 143 6.4 669 11.1 812 9.8 143 143 30 668 668 - 811 811 30
Afar 82 3.6 536 8.9 618 7.5 82 81 13 536 528 - 618 609 13
Amhara 133 5.9 945 15.7 1078 13.0 133 133 33 941 937 - 1074 1070 33
Oromiya 134 6.0 959 15.9 1093 13.2 134 131 28 958 930 - 1092 1061 28
Somali 106 4.7 581 9.7 687 8.3 106 105 21 580 530 - 686 635 21
Benshangul Gumuz 80 3.6 551 9.2 631 7.6 80 80 22 551 550 - 631 630 22
SNNPR 111 4.9 944 15.7 1055 12.8 111 111 29 944 935 - 1055 1046 29
Gambella 108 4.8 405 6.7 513 6.2 108 108 13 403 404 - 511 512 13
Harari 224 10.0 265 4.4 489 5.9 196 224 49 264 260 - 460 484 49
Addis Ababa* 802 35.6 - - 802 9.7 652 788 81 - - - 652 788 81
Dire Dawa 328 14.6 161 2.7 489 5.9 328 328 61 161 159 - 489 487 61
Group Total 2251 100.0 6016 100.0 8267 100.0 2073 2232 380 6006 5901 - 8079 8133 380
* Rural men were not targeted with this survey;
Addis Ababa had no rural areas;
Total not weighted by population size
20
Table 5: Household socioeconomic and demographic characteristics
Socioeconomic and demographic characteristics n1 Percent
Household headship 7810
Male 89.6
Female 10.4
Household head level of education 4954
No education 34.4
Can read and write 8.6
Primary, 1st cycle
2 11.8
Primary, 2nd
cycle3 20.9
High school 17.3
Tertiary level 6.9
Head of household relationship to child 4903
Mother 2.8
Female caregiver 3.0
Father 90.6
Male caregiver 3.5
Head of household employment 4904
Self employed 77.1
Employed 8.8
Public service worker 4.7
Unpaid family worker 1.3
Other 8.1
Women’s relationship to child 7640
Mother 95.0
Caregiver 5.0
Mother's/women caregiver’s age 7834
< 30 years 63.9
30- 40 years 33.6
> 40 years 2.5
Mother's/women caregiver’s employment 7636
Self employed 43.8
Employed 2.8
Public service worker 1.4
Unpaid family worker 43.1
Other 9.0
Mother's/women’s caregiver’s level of education 7835
No education 58.7
Can read and write 2.8
Primary, 1st cycle 10.6
Primary, 2nd cycle 12.2
High School 11.4
Other 4.3
Wealth index 7906
Poorest 23.1
Second 20.4
Middle 19.2
Fourth 18.0
Richest 19.3
Mother's contribution to household income 7833 54.8
NB: Level of education refer to the level of education completed 1Unweighted number
2Grade 1-4
3Grade 5-8
21
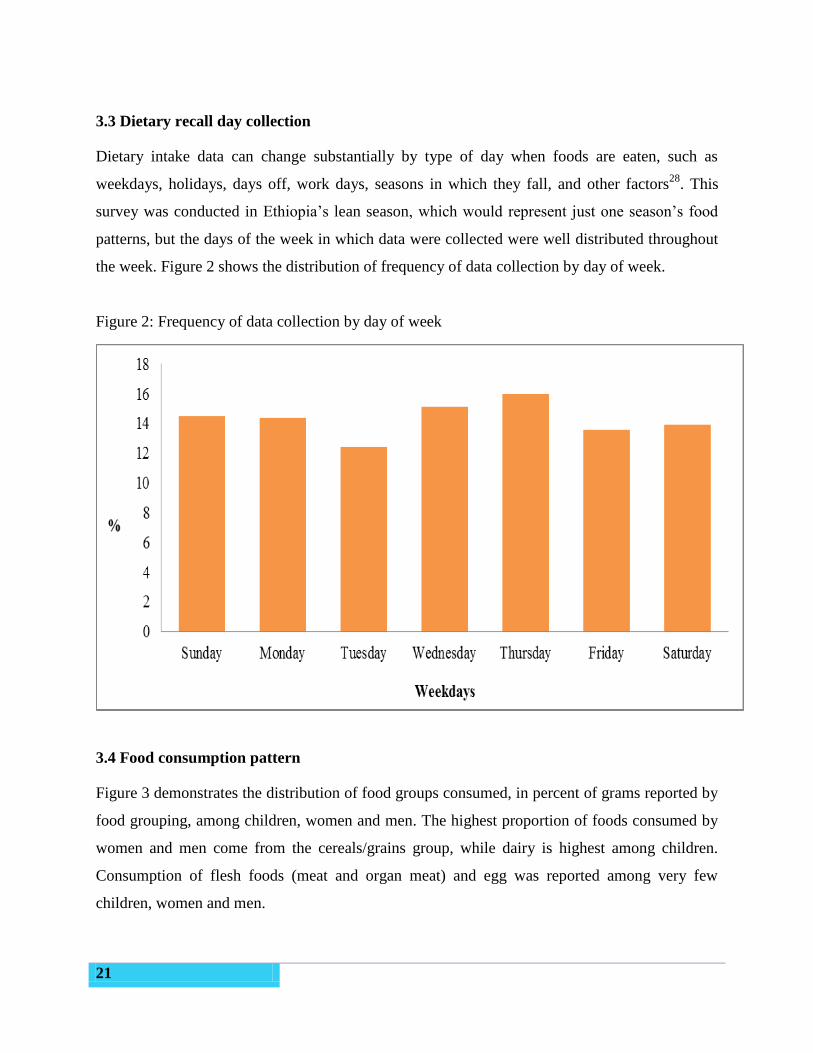
3.3 Dietary recall day collection
Dietary intake data can change substantially by type of day when foods are eaten, such as
weekdays, holidays, days off, work days, seasons in which they fall, and other factors28
. This
survey was conducted in Ethiopia’s lean season, which would represent just one season’s food
patterns, but the days of the week in which data were collected were well distributed throughout
the week. Figure 2 shows the distribution of frequency of data collection by day of week.
Figure 2: Frequency of data collection by day of week
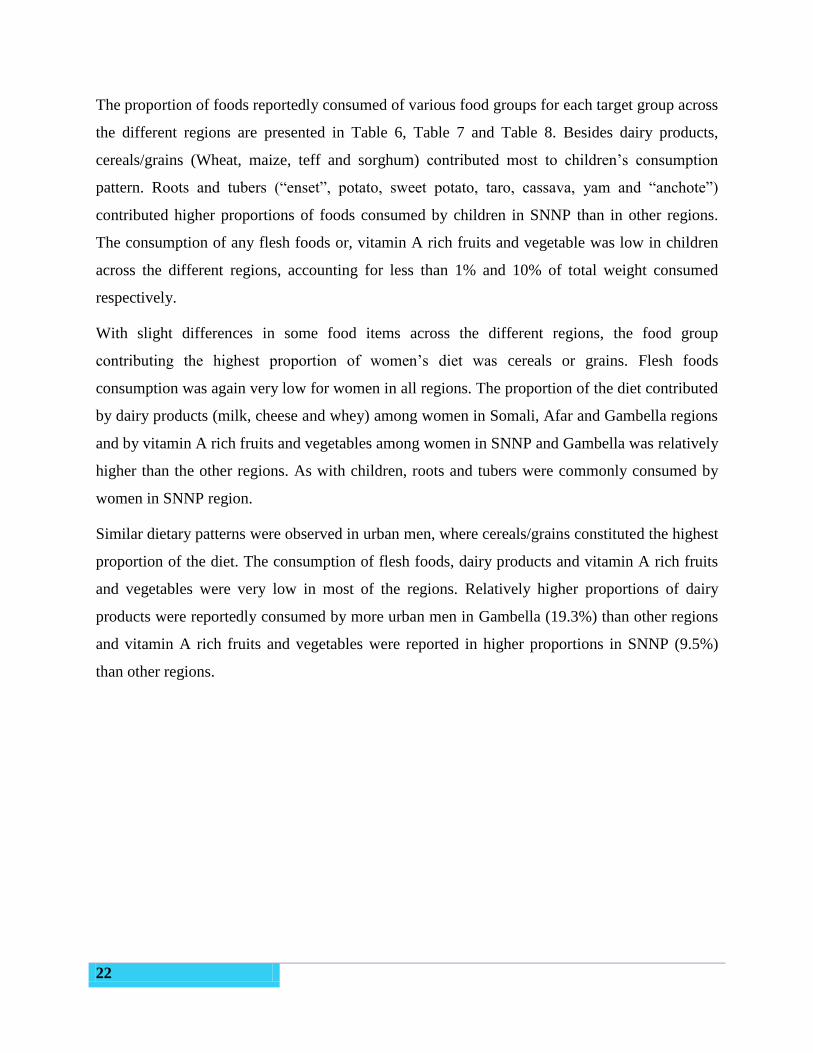
3.4 Food consumption pattern
Figure 3 demonstrates the distribution of food groups consumed, in percent of grams reported by
food grouping, among children, women and men. The highest proportion of foods consumed by
women and men come from the cereals/grains group, while dairy is highest among children.
Consumption of flesh foods (meat and organ meat) and egg was reported among very few
children, women and men.
22
The proportion of foods reportedly consumed of various food groups for each target group across
the different regions are presented in Table 6, Table 7 and Table 8. Besides dairy products,
cereals/grains (Wheat, maize, teff and sorghum) contributed most to children’s consumption
pattern. Roots and tubers (“enset”, potato, sweet potato, taro, cassava, yam and “anchote”)
contributed higher proportions of foods consumed by children in SNNP than in other regions.
The consumption of any flesh foods or, vitamin A rich fruits and vegetable was low in children
across the different regions, accounting for less than 1% and 10% of total weight consumed
respectively.
With slight differences in some food items across the different regions, the food group
contributing the highest proportion of women’s diet was cereals or grains. Flesh foods
consumption was again very low for women in all regions. The proportion of the diet contributed
by dairy products (milk, cheese and whey) among women in Somali, Afar and Gambella regions
and by vitamin A rich fruits and vegetables among women in SNNP and Gambella was relatively
higher than the other regions. As with children, roots and tubers were commonly consumed by
women in SNNP region.
Similar dietary patterns were observed in urban men, where cereals/grains constituted the highest
proportion of the diet. The consumption of flesh foods, dairy products and vitamin A rich fruits
and vegetables were very low in most of the regions. Relatively higher proportions of dairy
products were reportedly consumed by more urban men in Gambella (19.3%) than other regions
and vitamin A rich fruits and vegetables were reported in higher proportions in SNNP (9.5%)
than other regions.
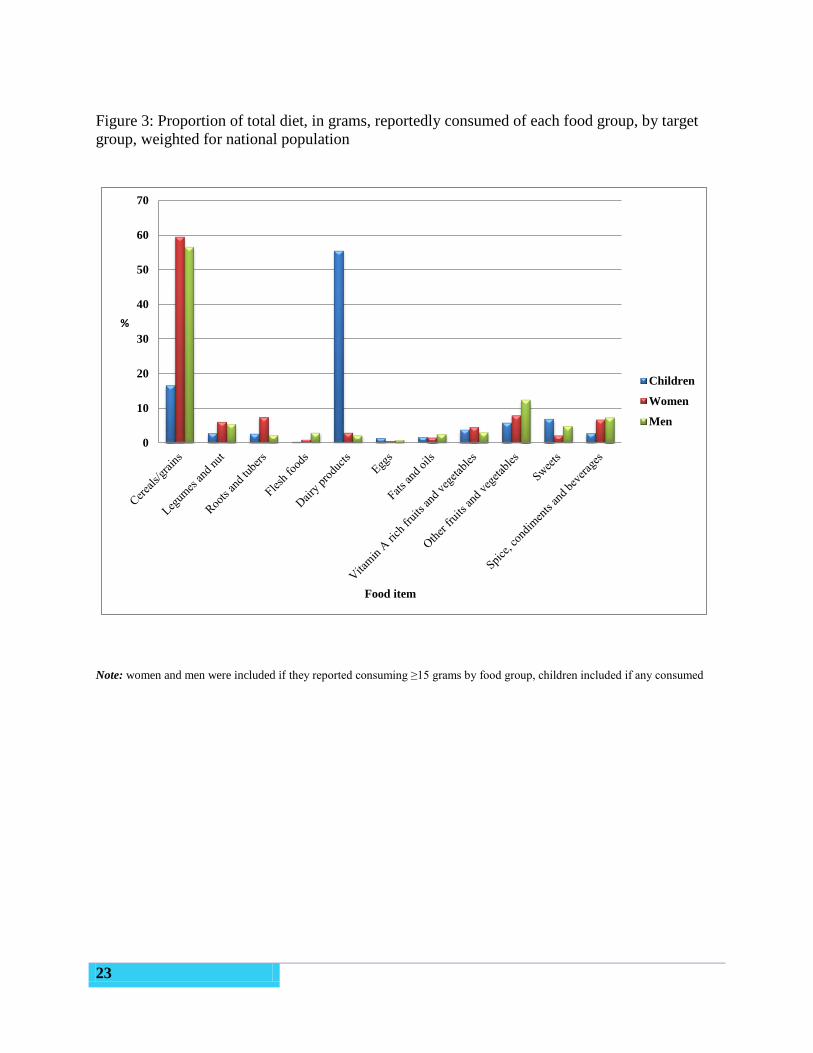
23
Figure 3: Proportion of total diet, in grams, reportedly consumed of each food group, by target
group, weighted for national population
0
10
20
30
40
50
60
70
%
Food item
Children
Women
Men
Note: women and men were included if they reported consuming ≥15 grams by food group, children included if any consumed
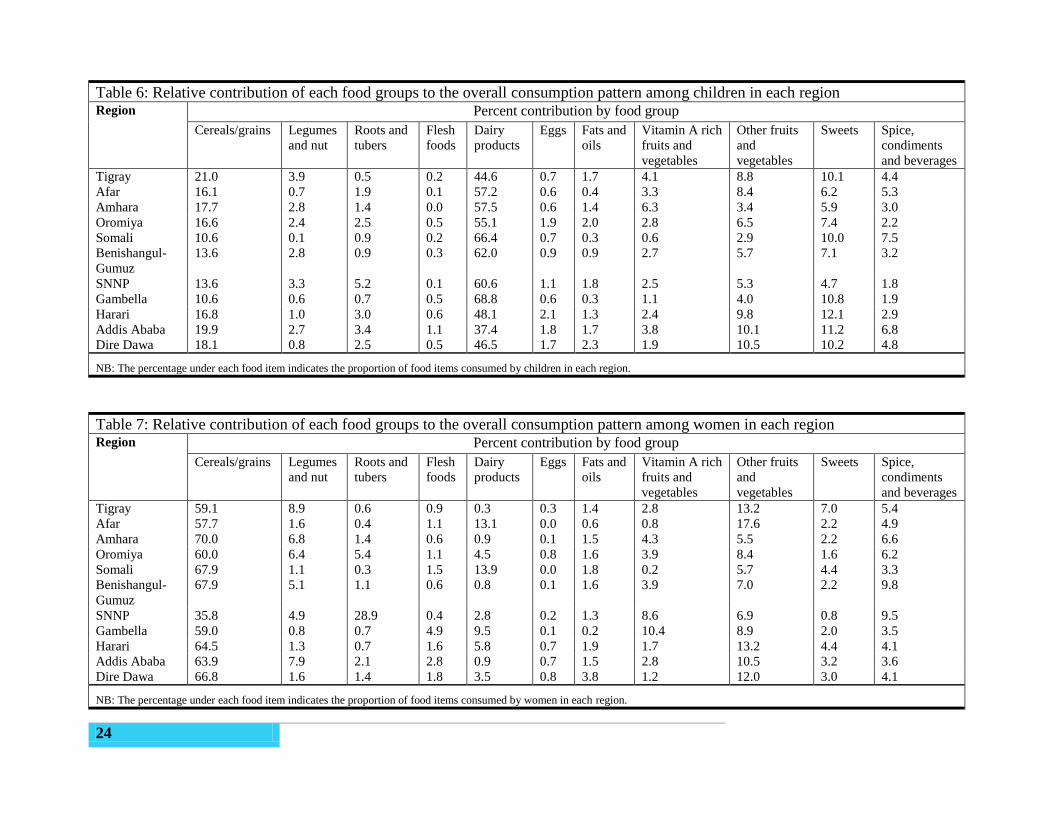
24
Table 6: Relative contribution of each food groups to the overall consumption pattern among children in each region Region Percent contribution by food group
Cereals/grains Legumes
and nut
Roots and
tubers
Flesh
foods
Dairy
products
Eggs Fats and
oils
Vitamin A rich
fruits and
vegetables
Other fruits
and
vegetables
Sweets Spice,
condiments
and beverages
Tigray 21.0 3.9 0.5 0.2 44.6 0.7 1.7 4.1 8.8 10.1 4.4
Afar 16.1 0.7 1.9 0.1 57.2 0.6 0.4 3.3 8.4 6.2 5.3
Amhara 17.7 2.8 1.4 0.0 57.5 0.6 1.4 6.3 3.4 5.9 3.0
Oromiya 16.6 2.4 2.5 0.5 55.1 1.9 2.0 2.8 6.5 7.4 2.2
Somali 10.6 0.1 0.9 0.2 66.4 0.7 0.3 0.6 2.9 10.0 7.5
Benishangul-
Gumuz
13.6 2.8 0.9 0.3 62.0 0.9 0.9 2.7 5.7 7.1 3.2
SNNP 13.6 3.3 5.2 0.1 60.6 1.1 1.8 2.5 5.3 4.7 1.8
Gambella 10.6 0.6 0.7 0.5 68.8 0.6 0.3 1.1 4.0 10.8 1.9
Harari 16.8 1.0 3.0 0.6 48.1 2.1 1.3 2.4 9.8 12.1 2.9
Addis Ababa 19.9 2.7 3.4 1.1 37.4 1.8 1.7 3.8 10.1 11.2 6.8
Dire Dawa 18.1 0.8 2.5 0.5 46.5 1.7 2.3 1.9 10.5 10.2 4.8
NB: The percentage under each food item indicates the proportion of food items consumed by children in each region.
Table 7: Relative contribution of each food groups to the overall consumption pattern among women in each region Region Percent contribution by food group
Cereals/grains Legumes
and nut
Roots and
tubers
Flesh
foods
Dairy
products
Eggs Fats and
oils
Vitamin A rich
fruits and
vegetables
Other fruits
and
vegetables
Sweets Spice,
condiments
and beverages
Tigray 59.1 8.9 0.6 0.9 0.3 0.3 1.4 2.8 13.2 7.0 5.4
Afar 57.7 1.6 0.4 1.1 13.1 0.0 0.6 0.8 17.6 2.2 4.9
Amhara 70.0 6.8 1.4 0.6 0.9 0.1 1.5 4.3 5.5 2.2 6.6
Oromiya 60.0 6.4 5.4 1.1 4.5 0.8 1.6 3.9 8.4 1.6 6.2
Somali 67.9 1.1 0.3 1.5 13.9 0.0 1.8 0.2 5.7 4.4 3.3
Benishangul-
Gumuz
67.9 5.1 1.1 0.6 0.8 0.1 1.6 3.9 7.0 2.2 9.8
SNNP 35.8 4.9 28.9 0.4 2.8 0.2 1.3 8.6 6.9 0.8 9.5
Gambella 59.0 0.8 0.7 4.9 9.5 0.1 0.2 10.4 8.9 2.0 3.5
Harari 64.5 1.3 0.7 1.6 5.8 0.7 1.9 1.7 13.2 4.4 4.1
Addis Ababa 63.9 7.9 2.1 2.8 0.9 0.7 1.5 2.8 10.5 3.2 3.6
Dire Dawa 66.8 1.6 1.4 1.8 3.5 0.8 3.8 1.2 12.0 3.0 4.1
NB: The percentage under each food item indicates the proportion of food items consumed by women in each region.
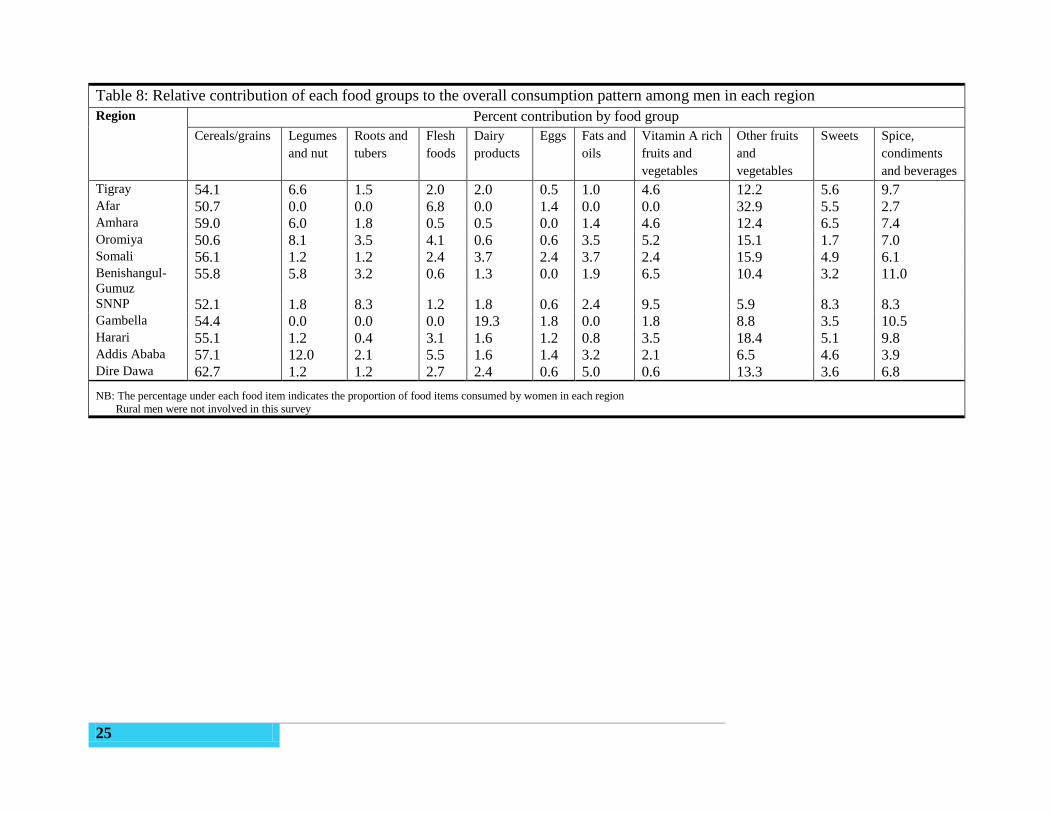
25
Table 8: Relative contribution of each food groups to the overall consumption pattern among men in each region
Region Percent contribution by food group
Cereals/grains Legumes
and nut
Roots and
tubers
Flesh
foods
Dairy
products
Eggs Fats and
oils
Vitamin A rich
fruits and
vegetables
Other fruits
and
vegetables
Sweets Spice,
condiments
and beverages
Tigray 54.1 6.6 1.5 2.0 2.0 0.5 1.0 4.6 12.2 5.6 9.7 Afar 50.7 0.0 0.0 6.8 0.0 1.4 0.0 0.0 32.9 5.5 2.7 Amhara 59.0 6.0 1.8 0.5 0.5 0.0 1.4 4.6 12.4 6.5 7.4 Oromiya 50.6 8.1 3.5 4.1 0.6 0.6 3.5 5.2 15.1 1.7 7.0 Somali 56.1 1.2 1.2 2.4 3.7 2.4 3.7 2.4 15.9 4.9 6.1 Benishangul-
Gumuz 55.8 5.8 3.2 0.6 1.3 0.0 1.9 6.5 10.4 3.2 11.0
SNNP 52.1 1.8 8.3 1.2 1.8 0.6 2.4 9.5 5.9 8.3 8.3 Gambella 54.4 0.0 0.0 0.0 19.3 1.8 0.0 1.8 8.8 3.5 10.5 Harari 55.1 1.2 0.4 3.1 1.6 1.2 0.8 3.5 18.4 5.1 9.8 Addis Ababa 57.1 12.0 2.1 5.5 1.6 1.4 3.2 2.1 6.5 4.6 3.9 Dire Dawa 62.7 1.2 1.2 2.7 2.4 0.6 5.0 0.6 13.3 3.6 6.8
NB: The percentage under each food item indicates the proportion of food items consumed by women in each region
Rural men were not involved in this survey
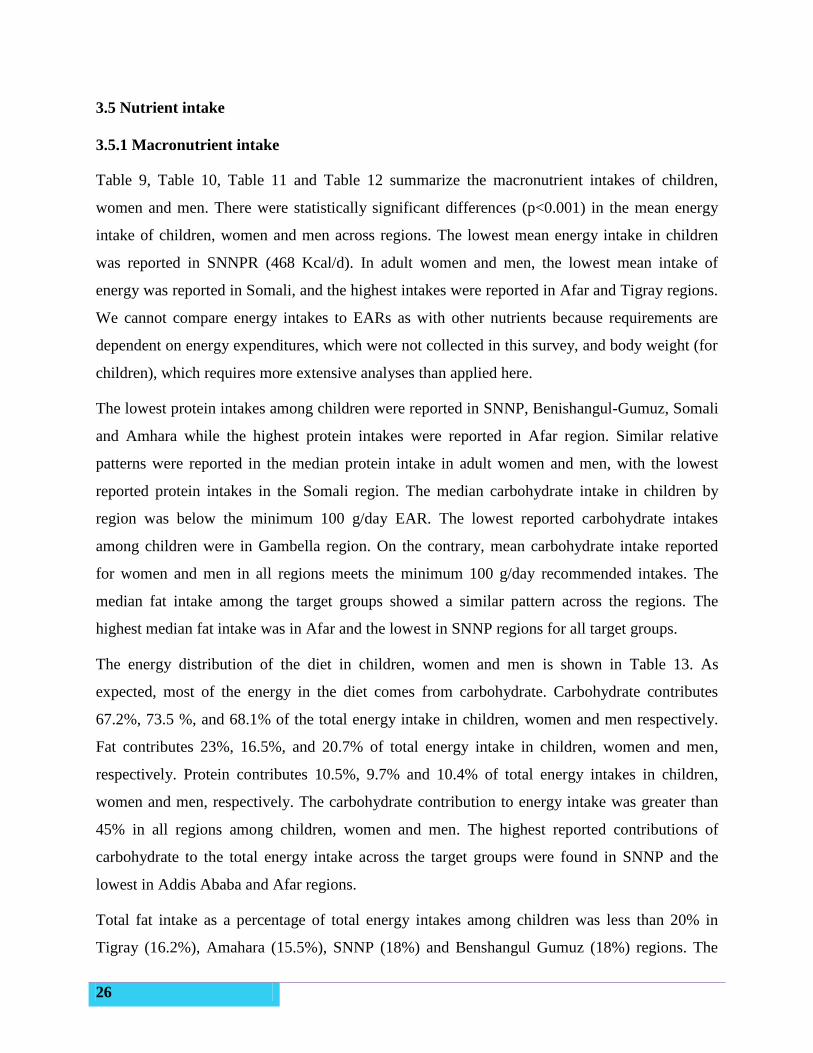
26
3.5 Nutrient intake
3.5.1 Macronutrient intake
Table 9, Table 10, Table 11 and Table 12 summarize the macronutrient intakes of children,
women and men. There were statistically significant differences (p<0.001) in the mean energy
intake of children, women and men across regions. The lowest mean energy intake in children
was reported in SNNPR (468 Kcal/d). In adult women and men, the lowest mean intake of
energy was reported in Somali, and the highest intakes were reported in Afar and Tigray regions.
We cannot compare energy intakes to EARs as with other nutrients because requirements are
dependent on energy expenditures, which were not collected in this survey, and body weight (for
children), which requires more extensive analyses than applied here.
The lowest protein intakes among children were reported in SNNP, Benishangul-Gumuz, Somali
and Amhara while the highest protein intakes were reported in Afar region. Similar relative
patterns were reported in the median protein intake in adult women and men, with the lowest
reported protein intakes in the Somali region. The median carbohydrate intake in children by
region was below the minimum 100 g/day EAR. The lowest reported carbohydrate intakes
among children were in Gambella region. On the contrary, mean carbohydrate intake reported
for women and men in all regions meets the minimum 100 g/day recommended intakes. The
median fat intake among the target groups showed a similar pattern across the regions. The
highest median fat intake was in Afar and the lowest in SNNP regions for all target groups.
The energy distribution of the diet in children, women and men is shown in Table 13. As
expected, most of the energy in the diet comes from carbohydrate. Carbohydrate contributes
67.2%, 73.5 %, and 68.1% of the total energy intake in children, women and men respectively.
Fat contributes 23%, 16.5%, and 20.7% of total energy intake in children, women and men,
respectively. Protein contributes 10.5%, 9.7% and 10.4% of total energy intakes in children,
women and men, respectively. The carbohydrate contribution to energy intake was greater than
45% in all regions among children, women and men. The highest reported contributions of
carbohydrate to the total energy intake across the target groups were found in SNNP and the
lowest in Addis Ababa and Afar regions.
Total fat intake as a percentage of total energy intakes among children was less than 20% in
Tigray (16.2%), Amahara (15.5%), SNNP (18%) and Benshangul Gumuz (18%) regions. The
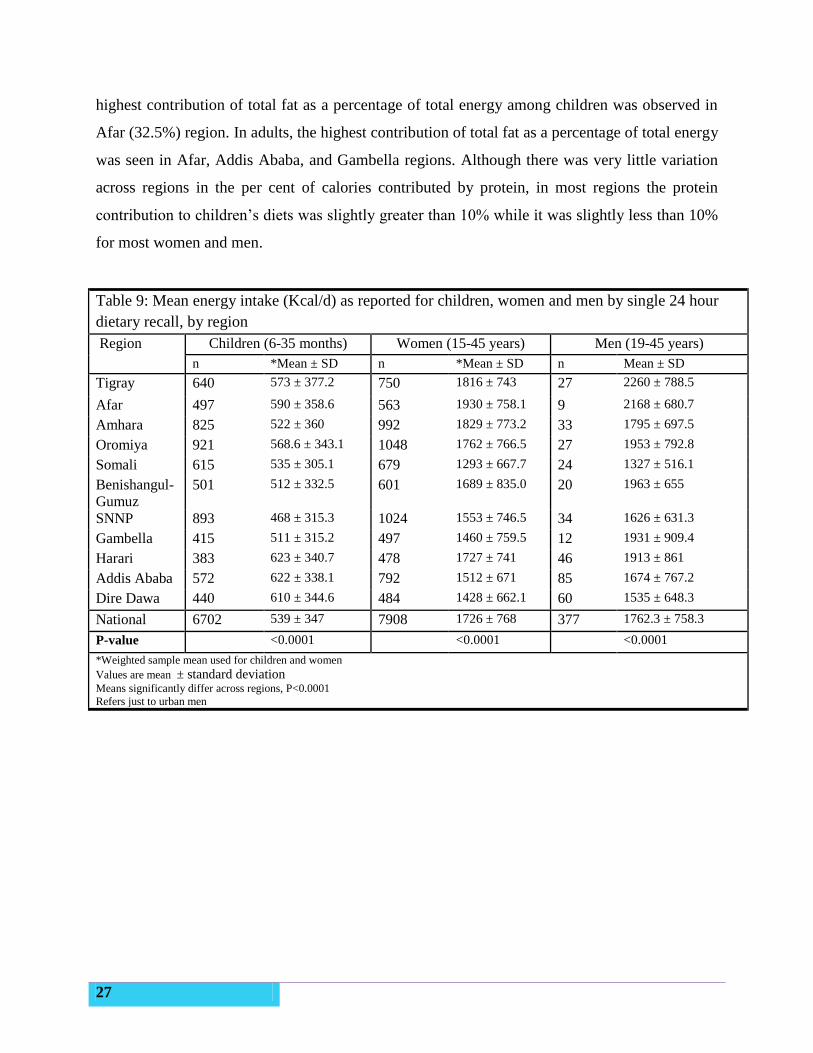
27
highest contribution of total fat as a percentage of total energy among children was observed in
Afar (32.5%) region. In adults, the highest contribution of total fat as a percentage of total energy
was seen in Afar, Addis Ababa, and Gambella regions. Although there was very little variation
across regions in the per cent of calories contributed by protein, in most regions the protein
contribution to children’s diets was slightly greater than 10% while it was slightly less than 10%
for most women and men.
Table 9: Mean energy intake (Kcal/d) as reported for children, women and men by single 24 hour
dietary recall, by region
Region Children (6-35 months) Women (15-45 years) Men (19-45 years)
n *Mean ± SD n *Mean ± SD n Mean ± SD
Tigray 640 573 ± 377.2 750 1816 ± 743 27 2260 ± 788.5
Afar 497 590 ± 358.6 563 1930 ± 758.1 9 2168 ± 680.7
Amhara 825 522 ± 360 992 1829 ± 773.2 33 1795 ± 697.5
Oromiya 921 568.6 ± 343.1 1048 1762 ± 766.5 27 1953 ± 792.8
Somali 615 535 ± 305.1 679 1293 ± 667.7 24 1327 ± 516.1
Benishangul-
Gumuz
501 512 ± 332.5 601 1689 ± 835.0 20 1963 ± 655
SNNP 893 468 ± 315.3 1024 1553 ± 746.5 34 1626 ± 631.3
Gambella 415 511 ± 315.2 497 1460 ± 759.5 12 1931 ± 909.4
Harari 383 623 ± 340.7 478 1727 ± 741 46 1913 ± 861
Addis Ababa 572 622 ± 338.1 792 1512 ± 671 85 1674 ± 767.2
Dire Dawa 440 610 ± 344.6 484 1428 ± 662.1 60 1535 ± 648.3
National 6702 539 ± 347 7908 1726 ± 768 377 1762.3 ± 758.3
P-value <0.0001 <0.0001 <0.0001
*Weighted sample mean used for children and women
Values are mean ± standard deviation
Means significantly differ across regions, P<0.0001
Refers just to urban men
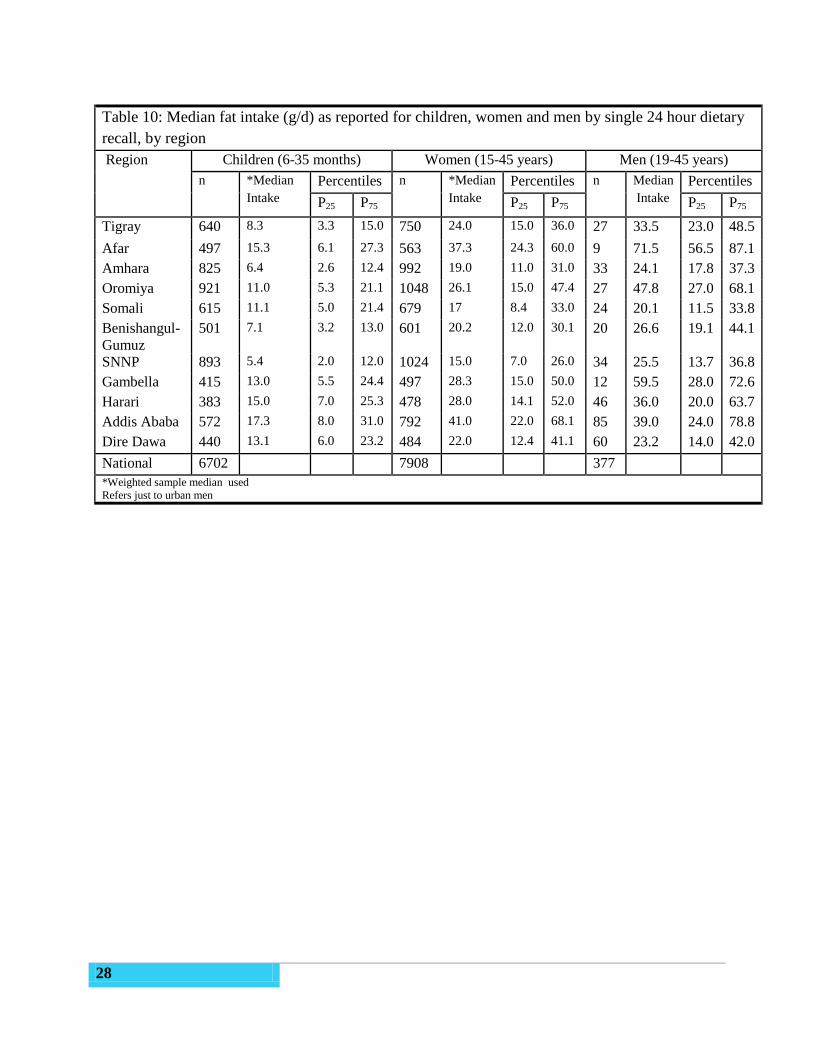
28
Table 10: Median fat intake (g/d) as reported for children, women and men by single 24 hour dietary
recall, by region
Region Children (6-35 months) Women (15-45 years) Men (19-45 years)
n *Median
Intake
Percentiles n *Median
Intake
Percentiles n Median
Intake
Percentiles
P25 P75 P25 P75 P25 P75
Tigray 640 8.3 3.3 15.0 750 24.0 15.0 36.0 27 33.5 23.0 48.5
Afar 497 15.3 6.1 27.3 563 37.3 24.3 60.0 9 71.5 56.5 87.1
Amhara 825 6.4 2.6 12.4 992 19.0 11.0 31.0 33 24.1 17.8 37.3
Oromiya 921 11.0 5.3 21.1 1048 26.1 15.0 47.4 27 47.8 27.0 68.1
Somali 615 11.1 5.0 21.4 679 17 8.4 33.0 24 20.1 11.5 33.8
Benishangul-
Gumuz
501 7.1 3.2 13.0 601 20.2 12.0 30.1 20 26.6 19.1 44.1
SNNP 893 5.4 2.0 12.0 1024 15.0 7.0 26.0 34 25.5 13.7 36.8
Gambella 415 13.0 5.5 24.4 497 28.3 15.0 50.0 12 59.5 28.0 72.6
Harari 383 15.0 7.0 25.3 478 28.0 14.1 52.0 46 36.0 20.0 63.7
Addis Ababa 572 17.3 8.0 31.0 792 41.0 22.0 68.1 85 39.0 24.0 78.8
Dire Dawa 440 13.1 6.0 23.2 484 22.0 12.4 41.1 60 23.2 14.0 42.0
National 6702 7908 377 *Weighted sample median used
Refers just to urban men
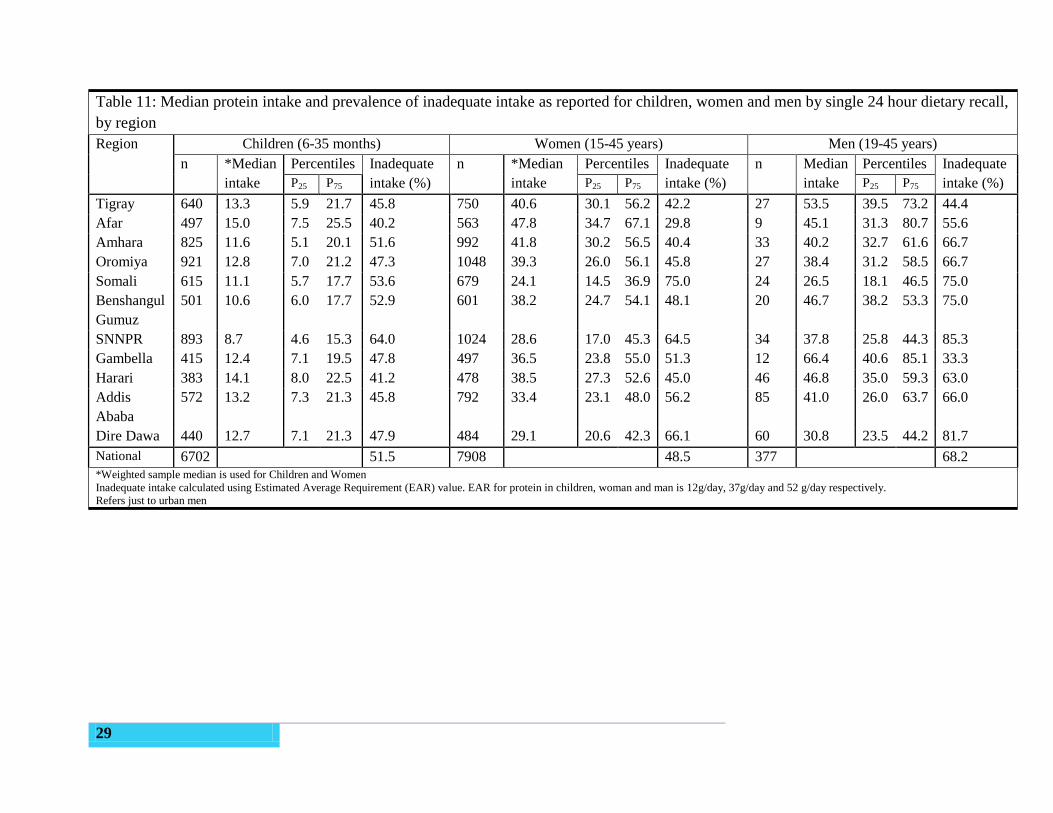
29
Table 11: Median protein intake and prevalence of inadequate intake as reported for children, women and men by single 24 hour dietary recall,
by region
Region Children (6-35 months) Women (15-45 years) Men (19-45 years)
n *Median
intake
Percentiles Inadequate
intake (%)
n *Median
intake
Percentiles Inadequate
intake (%)
n Median
intake
Percentiles Inadequate
intake (%) P25 P75 P25 P75 P25 P75
Tigray 640 13.3 5.9 21.7 45.8 750 40.6 30.1 56.2 42.2 27 53.5 39.5 73.2 44.4
Afar 497 15.0 7.5 25.5 40.2 563 47.8 34.7 67.1 29.8 9 45.1 31.3 80.7 55.6
Amhara 825 11.6 5.1 20.1 51.6 992 41.8 30.2 56.5 40.4 33 40.2 32.7 61.6 66.7
Oromiya 921 12.8 7.0 21.2 47.3 1048 39.3 26.0 56.1 45.8 27 38.4 31.2 58.5 66.7
Somali 615 11.1 5.7 17.7 53.6 679 24.1 14.5 36.9 75.0 24 26.5 18.1 46.5 75.0
Benshangul
Gumuz
501 10.6 6.0 17.7 52.9 601 38.2 24.7 54.1 48.1 20 46.7 38.2 53.3 75.0
SNNPR 893 8.7 4.6 15.3 64.0 1024 28.6 17.0 45.3 64.5 34 37.8 25.8 44.3 85.3
Gambella 415 12.4 7.1 19.5 47.8 497 36.5 23.8 55.0 51.3 12 66.4 40.6 85.1 33.3
Harari 383 14.1 8.0 22.5 41.2 478 38.5 27.3 52.6 45.0 46 46.8 35.0 59.3 63.0
Addis
Ababa
572 13.2 7.3 21.3 45.8 792 33.4 23.1 48.0 56.2 85 41.0 26.0 63.7 66.0
Dire Dawa 440 12.7 7.1 21.3 47.9 484 29.1 20.6 42.3 66.1 60 30.8 23.5 44.2 81.7
National 6702 51.5 7908 48.5 377 68.2
*Weighted sample median is used for Children and Women
Inadequate intake calculated using Estimated Average Requirement (EAR) value. EAR for protein in children, woman and man is 12g/day, 37g/day and 52 g/day respectively.
Refers just to urban men
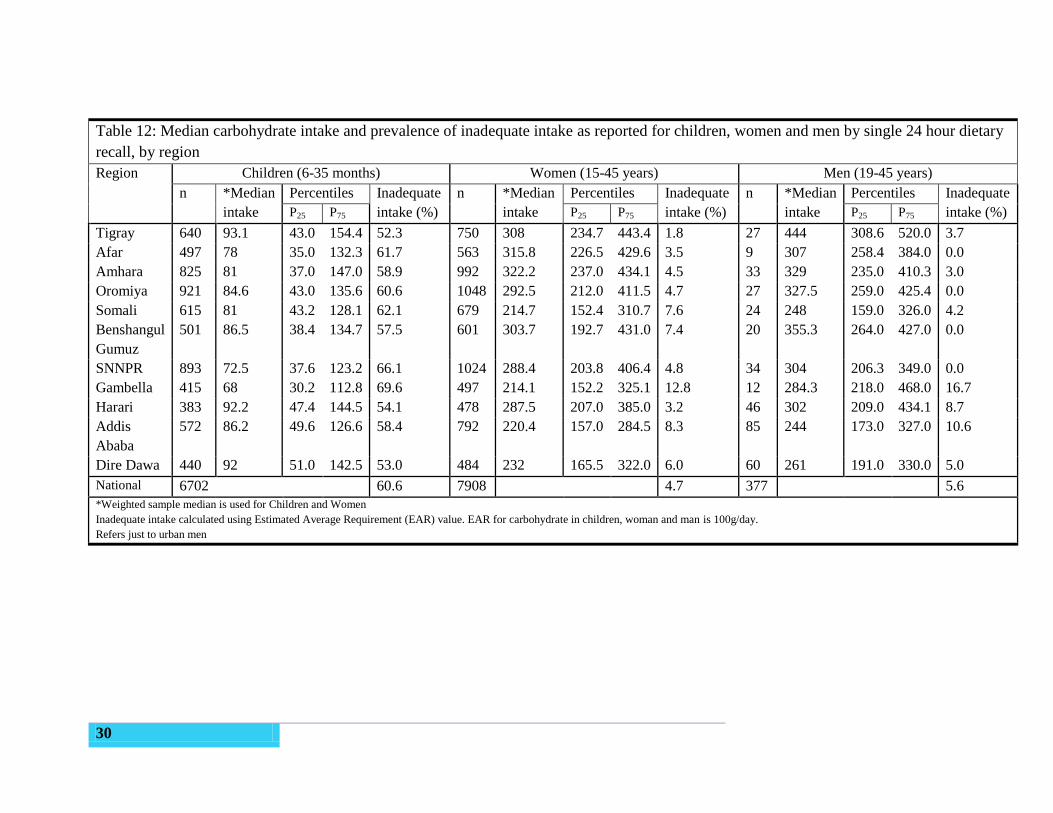
30
Table 12: Median carbohydrate intake and prevalence of inadequate intake as reported for children, women and men by single 24 hour dietary
recall, by region
Region Children (6-35 months) Women (15-45 years) Men (19-45 years)
n *Median
intake
Percentiles Inadequate
intake (%)
n *Median
intake
Percentiles Inadequate
intake (%)
n *Median
intake
Percentiles Inadequate
intake (%) P25 P75 P25 P75 P25 P75
Tigray 640 93.1 43.0 154.4 52.3 750 308 234.7 443.4 1.8 27 444 308.6 520.0 3.7
Afar 497 78 35.0 132.3 61.7 563 315.8 226.5 429.6 3.5 9 307 258.4 384.0 0.0
Amhara 825 81 37.0 147.0 58.9 992 322.2 237.0 434.1 4.5 33 329 235.0 410.3 3.0
Oromiya 921 84.6 43.0 135.6 60.6 1048 292.5 212.0 411.5 4.7 27 327.5 259.0 425.4 0.0
Somali 615 81 43.2 128.1 62.1 679 214.7 152.4 310.7 7.6 24 248 159.0 326.0 4.2
Benshangul
Gumuz
501 86.5 38.4 134.7 57.5 601 303.7 192.7 431.0 7.4 20 355.3 264.0 427.0 0.0
SNNPR 893 72.5 37.6 123.2 66.1 1024 288.4 203.8 406.4 4.8 34 304 206.3 349.0 0.0
Gambella 415 68 30.2 112.8 69.6 497 214.1 152.2 325.1 12.8 12 284.3 218.0 468.0 16.7
Harari 383 92.2 47.4 144.5 54.1 478 287.5 207.0 385.0 3.2 46 302 209.0 434.1 8.7
Addis
Ababa
572 86.2 49.6 126.6 58.4 792 220.4 157.0 284.5 8.3 85 244 173.0 327.0 10.6
Dire Dawa 440 92 51.0 142.5 53.0 484 232 165.5 322.0 6.0 60 261 191.0 330.0 5.0
National 6702 60.6 7908 4.7 377 5.6
*Weighted sample median is used for Children and Women
Inadequate intake calculated using Estimated Average Requirement (EAR) value. EAR for carbohydrate in children, woman and man is 100g/day.
Refers just to urban men
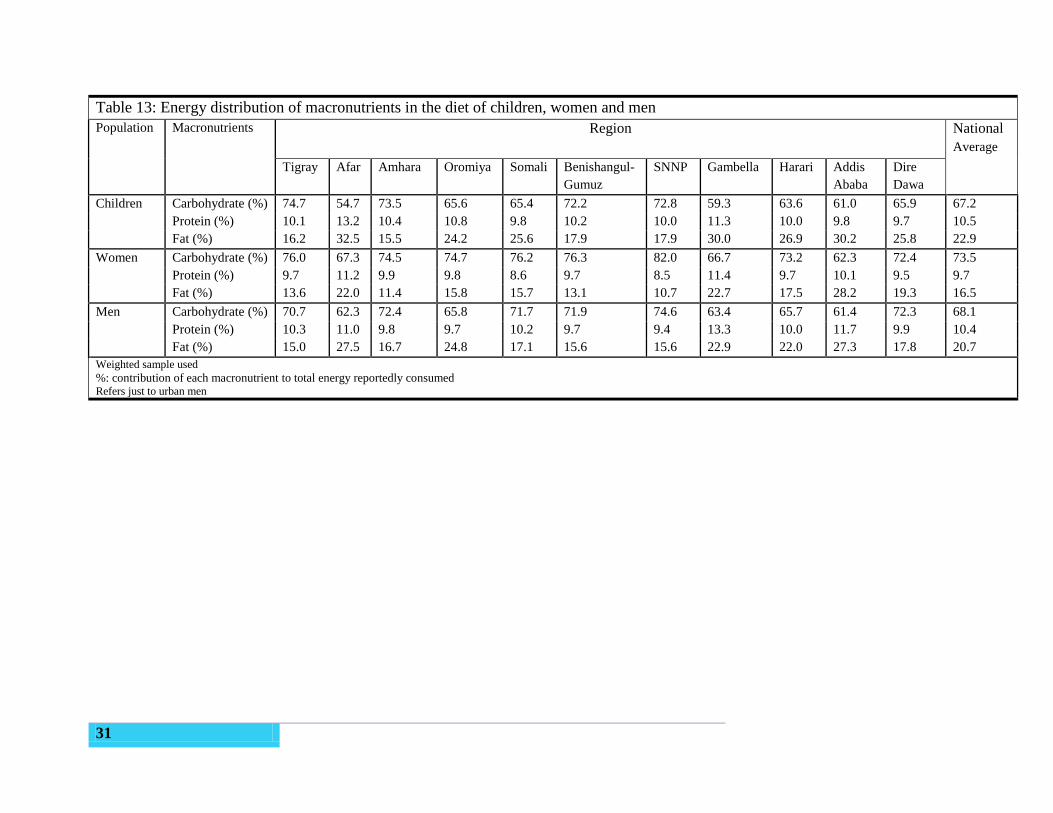
31
Table 13: Energy distribution of macronutrients in the diet of children, women and men
Population Macronutrients Region
National
Average
Tigray Afar Amhara Oromiya Somali Benishangul-
Gumuz
SNNP Gambella Harari Addis
Ababa
Dire
Dawa
Children Carbohydrate (%) 74.7 54.7 73.5 65.6 65.4 72.2 72.8 59.3 63.6 61.0
9.8
65.9 67.2
Protein (%) 10.1 13.2 10.4 10.8 9.8 10.2 10.0 11.3 10.0 9.7 10.5
Fat (%) 16.2 32.5 15.5 24.2 25.6 17.9 17.9 30.0 26.9 30.2 25.8 22.9
Women Carbohydrate (%) 76.0 67.3 74.5 74.7 76.2 76.3 82.0 66.7 73.2 62.3 72.4 73.5
Protein (%) 9.7 11.2 9.9 9.8 8.6 9.7 8.5 11.4 9.7 10.1 9.5 9.7
Fat (%) 13.6 22.0 11.4 15.8 15.7 13.1 10.7 22.7 17.5 28.2 19.3 16.5
Men Carbohydrate (%) 70.7 62.3 72.4 65.8 71.7 71.9 74.6 63.4 65.7 61.4 72.3 68.1
Protein (%) 10.3 11.0 9.8 9.7 10.2 9.7 9.4 13.3 10.0 11.7 9.9 10.4
Fat (%) 15.0 27.5 16.7 24.8 17.1 15.6 15.6 22.9 22.0 27.3 17.8 20.7
Weighted sample used
%: contribution of each macronutrient to total energy reportedly consumed Refers just to urban men
32
3.5.2 Micronutrient intake
Observed average nutrient intakes in children aged 6-35 months and women of childbearing age
at the regional and nationally level are presented in Table 14 and Table 15 respectively. As
nutrient intake data in the population is highly skewed, median intakes are presented. All data
have been weighted in order to be regionally and nationally representative. Mass fortification of
staple foods is primarily targeted to reduce micronutrient inadequacies in women of child-
bearing age, the most vulnerable group for which universal fortification is likely to have a
substantial impact. As such prevalence data on inadequate and excessive intakes at the regional
level are limited to this population group in the following sections. The purpose of collecting
dietary intake data for urban males was to ensure that fortification scenarios would not lead to
excessive intakes of nutrients in those most likely to consume the highest amounts of fortifiable
foods.
Iron
Iron intake in surveyed adults in Ethiopia appears high. The nationally weighted median
(interquartile range (IQR)) iron intake in women of childbearing age was found to be 43.7 mg
per day (26.1, 71.8). Intakes were slightly higher in urban versus rural areas (median 55.8 mg vs
39.6 mg). The highest intake was found in women from Addis Ababa (geometric mean 53.7;
IQR 33.9, 78.1), which was 2.4 times higher than intakes in women from the Somali region
(geometric mean 14.5, IQR: 8.5, 24.8 mg).
As the phytate to iron molar ratios in women of childbearing age were found to be 3.16, and
intakes of animal source foods were generally found to be very low, low percentage absorption
of iron in the diet was assumed. According to the WHO Guidelines19
, a 5% iron bioavailability
was assumed based on a diet characterised by high cereal intakes and low animal protein. This is
the lowest category of assumed bioavailability of iron.
Taking into consideration the bioavailability of the dietary iron intakes at 5% the prevalence of
inadequate intakes was calculated to be approximately 13% in women of childbearing age at the
national level. However adequacy of iron intakes varied considerably across regions, from a
prevalence of inadequacy of 84% of women in the Somali region compared to 6% in Amhara
(Table 16).
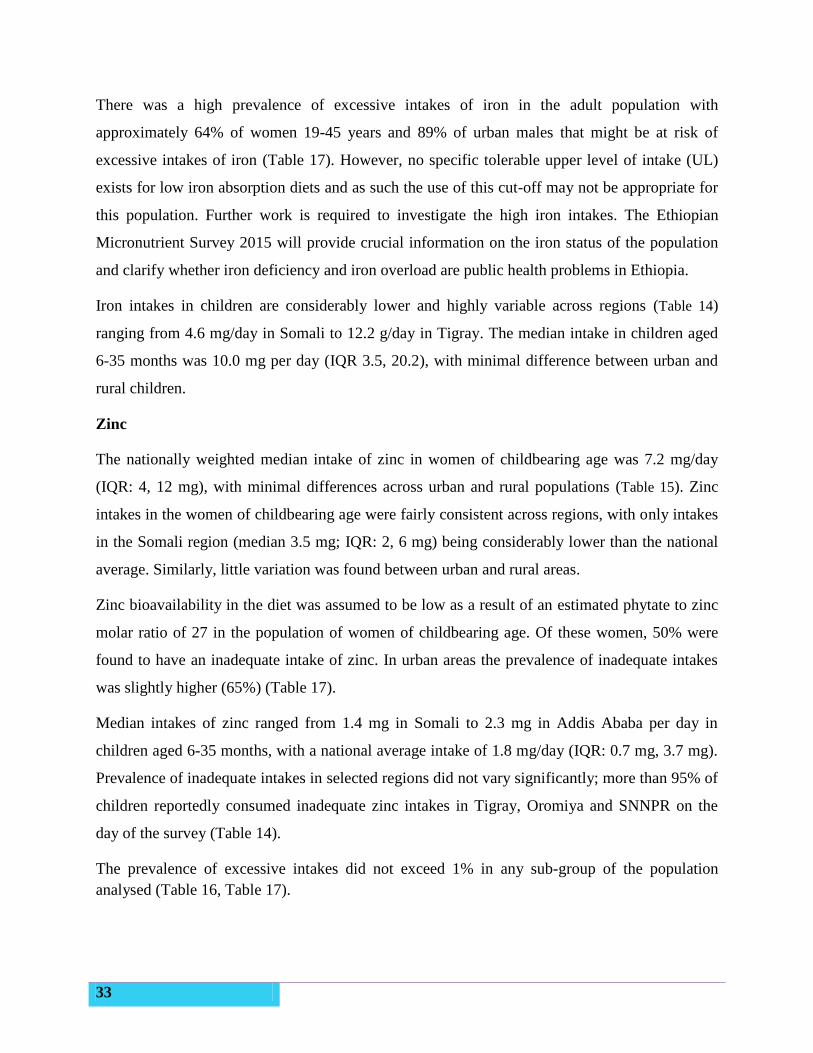
33
There was a high prevalence of excessive intakes of iron in the adult population with
approximately 64% of women 19-45 years and 89% of urban males that might be at risk of
excessive intakes of iron (Table 17). However, no specific tolerable upper level of intake (UL)
exists for low iron absorption diets and as such the use of this cut-off may not be appropriate for
this population. Further work is required to investigate the high iron intakes. The Ethiopian
Micronutrient Survey 2015 will provide crucial information on the iron status of the population
and clarify whether iron deficiency and iron overload are public health problems in Ethiopia.
Iron intakes in children are considerably lower and highly variable across regions (Table 14)
ranging from 4.6 mg/day in Somali to 12.2 g/day in Tigray. The median intake in children aged
6-35 months was 10.0 mg per day (IQR 3.5, 20.2), with minimal difference between urban and
rural children.
Zinc
The nationally weighted median intake of zinc in women of childbearing age was 7.2 mg/day
(IQR: 4, 12 mg), with minimal differences across urban and rural populations (Table 15). Zinc
intakes in the women of childbearing age were fairly consistent across regions, with only intakes
in the Somali region (median 3.5 mg; IQR: 2, 6 mg) being considerably lower than the national
average. Similarly, little variation was found between urban and rural areas.
Zinc bioavailability in the diet was assumed to be low as a result of an estimated phytate to zinc
molar ratio of 27 in the population of women of childbearing age. Of these women, 50% were
found to have an inadequate intake of zinc. In urban areas the prevalence of inadequate intakes
was slightly higher (65%) (Table 17).
Median intakes of zinc ranged from 1.4 mg in Somali to 2.3 mg in Addis Ababa per day in
children aged 6-35 months, with a national average intake of 1.8 mg/day (IQR: 0.7 mg, 3.7 mg).
Prevalence of inadequate intakes in selected regions did not vary significantly; more than 95% of
children reportedly consumed inadequate zinc intakes in Tigray, Oromiya and SNNPR on the
day of the survey (Table 14).
The prevalence of excessive intakes did not exceed 1% in any sub-group of the population
analysed (Table 16, Table 17).
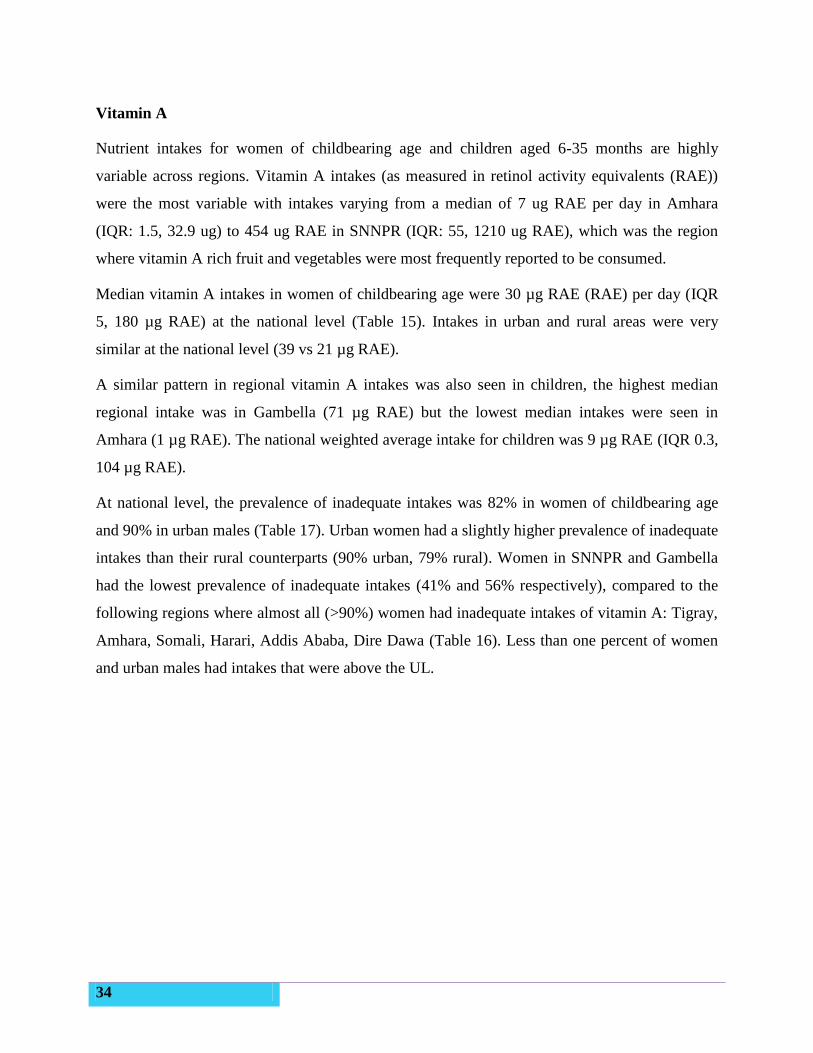
34
Vitamin A
Nutrient intakes for women of childbearing age and children aged 6-35 months are highly
variable across regions. Vitamin A intakes (as measured in retinol activity equivalents (RAE))
were the most variable with intakes varying from a median of 7 ug RAE per day in Amhara
(IQR: 1.5, 32.9 ug) to 454 ug RAE in SNNPR (IQR: 55, 1210 ug RAE), which was the region
where vitamin A rich fruit and vegetables were most frequently reported to be consumed.
Median vitamin A intakes in women of childbearing age were 30 µg RAE (RAE) per day (IQR
5, 180 µg RAE) at the national level (Table 15). Intakes in urban and rural areas were very
similar at the national level (39 vs 21 µg RAE).
A similar pattern in regional vitamin A intakes was also seen in children, the highest median
regional intake was in Gambella (71 µg RAE) but the lowest median intakes were seen in
Amhara (1 µg RAE). The national weighted average intake for children was 9 µg RAE (IQR 0.3,
104 µg RAE).
At national level, the prevalence of inadequate intakes was 82% in women of childbearing age
and 90% in urban males (Table 17). Urban women had a slightly higher prevalence of inadequate
intakes than their rural counterparts (90% urban, 79% rural). Women in SNNPR and Gambella
had the lowest prevalence of inadequate intakes (41% and 56% respectively), compared to the
following regions where almost all (>90%) women had inadequate intakes of vitamin A: Tigray,
Amhara, Somali, Harari, Addis Ababa, Dire Dawa (Table 16). Less than one percent of women
and urban males had intakes that were above the UL.
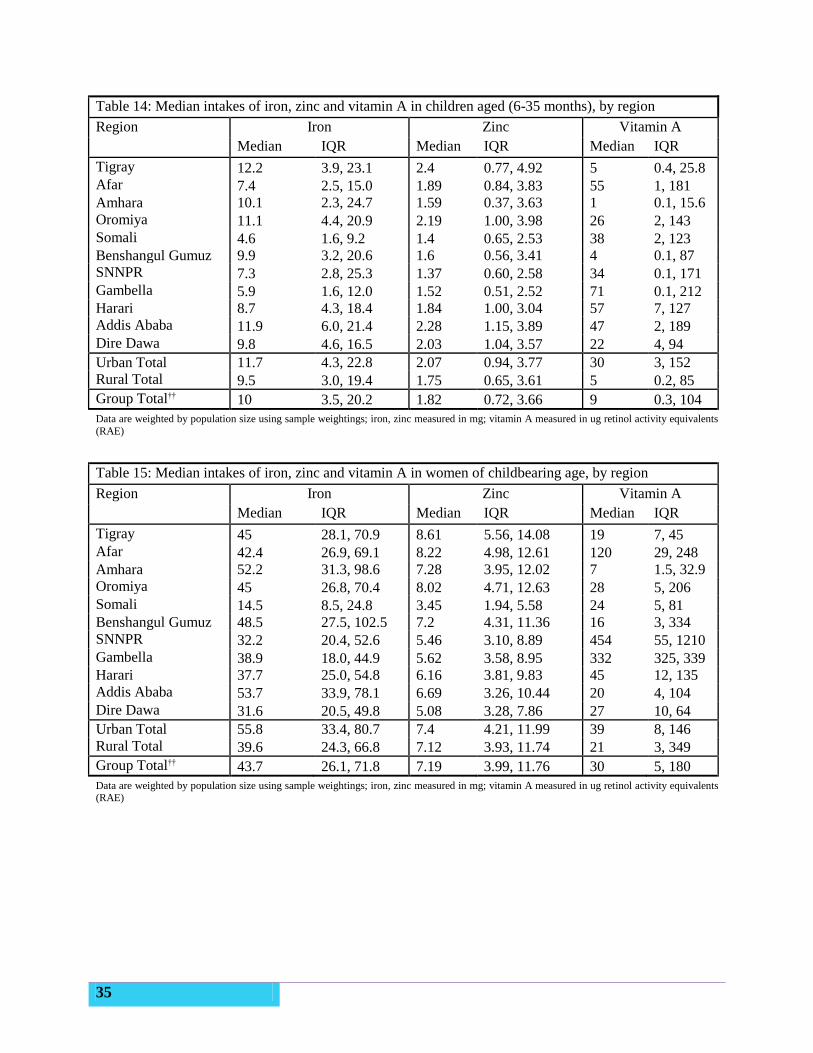
35
Table 14: Median intakes of iron, zinc and vitamin A in children aged (6-35 months), by region
Region Iron Zinc Vitamin A
Median IQR Median IQR Median IQR
Tigray 12.2 3.9, 23.1 2.4 0.77, 4.92 5 0.4, 25.8
Afar 7.4 2.5, 15.0 1.89 0.84, 3.83 55 1, 181
Amhara 10.1 2.3, 24.7 1.59 0.37, 3.63 1 0.1, 15.6
Oromiya 11.1 4.4, 20.9 2.19 1.00, 3.98 26 2, 143
Somali 4.6 1.6, 9.2 1.4 0.65, 2.53 38 2, 123
Benshangul Gumuz 9.9 3.2, 20.6 1.6 0.56, 3.41 4 0.1, 87
SNNPR 7.3 2.8, 25.3 1.37 0.60, 2.58 34 0.1, 171
Gambella 5.9 1.6, 12.0 1.52 0.51, 2.52 71 0.1, 212
Harari 8.7 4.3, 18.4 1.84 1.00, 3.04 57 7, 127
Addis Ababa 11.9 6.0, 21.4 2.28 1.15, 3.89 47 2, 189
Dire Dawa 9.8 4.6, 16.5 2.03 1.04, 3.57 22 4, 94
Urban Total 11.7 4.3, 22.8 2.07 0.94, 3.77 30 3, 152
Rural Total 9.5 3.0, 19.4 1.75 0.65, 3.61 5 0.2, 85
Group Total†† 10 3.5, 20.2 1.82 0.72, 3.66 9 0.3, 104
Data are weighted by population size using sample weightings; iron, zinc measured in mg; vitamin A measured in ug retinol activity equivalents
(RAE)
Table 15: Median intakes of iron, zinc and vitamin A in women of childbearing age, by region
Region Iron Zinc Vitamin A
Median IQR Median IQR Median IQR
Tigray 45 28.1, 70.9 8.61 5.56, 14.08 19 7, 45
Afar 42.4 26.9, 69.1 8.22 4.98, 12.61 120 29, 248
Amhara 52.2 31.3, 98.6 7.28 3.95, 12.02 7 1.5, 32.9
Oromiya 45 26.8, 70.4 8.02 4.71, 12.63 28 5, 206
Somali 14.5 8.5, 24.8 3.45 1.94, 5.58 24 5, 81
Benshangul Gumuz 48.5 27.5, 102.5 7.2 4.31, 11.36 16 3, 334
SNNPR 32.2 20.4, 52.6 5.46 3.10, 8.89 454 55, 1210
Gambella 38.9 18.0, 44.9 5.62 3.58, 8.95 332 325, 339
Harari 37.7 25.0, 54.8 6.16 3.81, 9.83 45 12, 135
Addis Ababa 53.7 33.9, 78.1 6.69 3.26, 10.44 20 4, 104
Dire Dawa 31.6 20.5, 49.8 5.08 3.28, 7.86 27 10, 64
Urban Total 55.8 33.4, 80.7 7.4 4.21, 11.99 39 8, 146
Rural Total 39.6 24.3, 66.8 7.12 3.93, 11.74 21 3, 349
Group Total†† 43.7 26.1, 71.8 7.19 3.99, 11.76 30 5, 180
Data are weighted by population size using sample weightings; iron, zinc measured in mg; vitamin A measured in ug retinol activity equivalents (RAE)
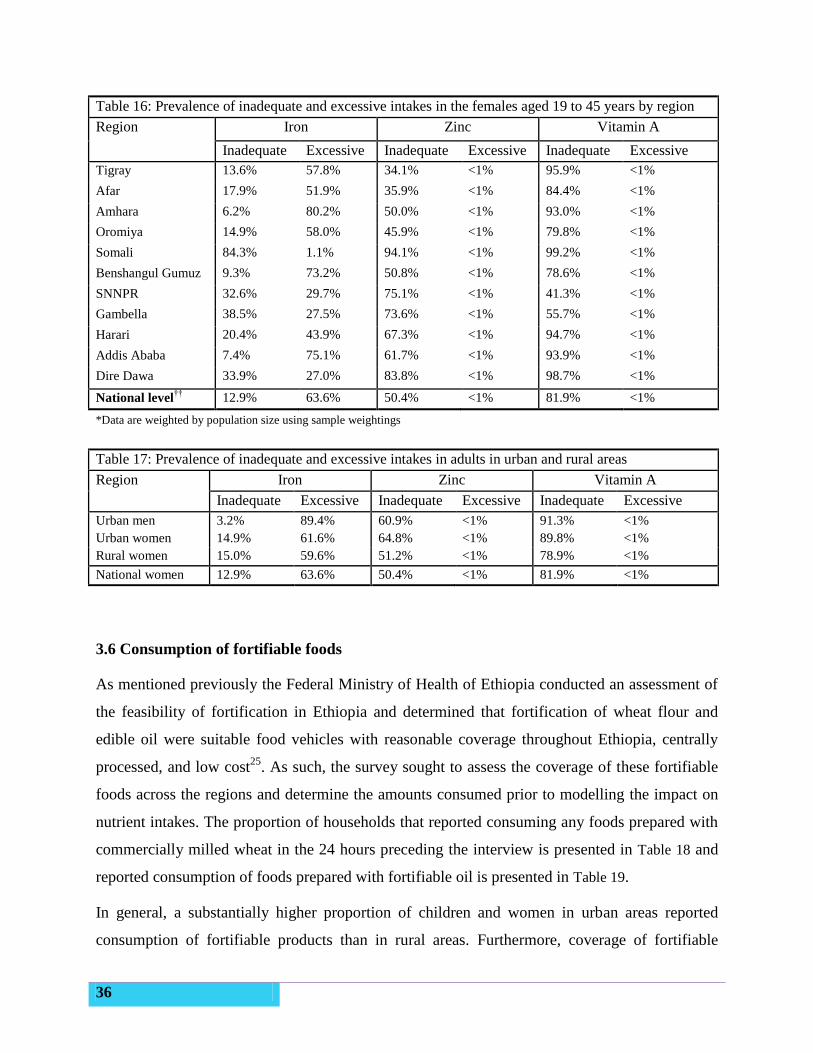
36
Table 16: Prevalence of inadequate and excessive intakes in the females aged 19 to 45 years by region
Region Iron Zinc Vitamin A
Inadequate Excessive Inadequate Excessive Inadequate Excessive
Tigray 13.6% 57.8% 34.1% <1% 95.9% <1%
Afar 17.9% 51.9% 35.9% <1% 84.4% <1%
Amhara 6.2% 80.2% 50.0% <1% 93.0% <1%
Oromiya 14.9% 58.0% 45.9% <1% 79.8% <1%
Somali 84.3% 1.1% 94.1% <1% 99.2% <1%
Benshangul Gumuz 9.3% 73.2% 50.8% <1% 78.6% <1%
SNNPR 32.6% 29.7% 75.1% <1% 41.3% <1%
Gambella 38.5% 27.5% 73.6% <1% 55.7% <1%
Harari 20.4% 43.9% 67.3% <1% 94.7% <1%
Addis Ababa 7.4% 75.1% 61.7% <1% 93.9% <1%
Dire Dawa 33.9% 27.0% 83.8% <1% 98.7% <1%
National level††
12.9% 63.6% 50.4% <1% 81.9% <1%
*Data are weighted by population size using sample weightings
Table 17: Prevalence of inadequate and excessive intakes in adults in urban and rural areas
Region Iron Zinc Vitamin A
Inadequate Excessive Inadequate Excessive Inadequate Excessive
Urban men 3.2% 89.4% 60.9% <1% 91.3% <1%
Urban women 14.9% 61.6% 64.8% <1% 89.8% <1%
Rural women 15.0% 59.6% 51.2% <1% 78.9% <1%
National women 12.9% 63.6% 50.4% <1% 81.9% <1%
3.6 Consumption of fortifiable foods
As mentioned previously the Federal Ministry of Health of Ethiopia conducted an assessment of
the feasibility of fortification in Ethiopia and determined that fortification of wheat flour and
edible oil were suitable food vehicles with reasonable coverage throughout Ethiopia, centrally
processed, and low cost25
. As such, the survey sought to assess the coverage of these fortifiable
foods across the regions and determine the amounts consumed prior to modelling the impact on
nutrient intakes. The proportion of households that reported consuming any foods prepared with
commercially milled wheat in the 24 hours preceding the interview is presented in Table 18 and
reported consumption of foods prepared with fortifiable oil is presented in Table 19.
In general, a substantially higher proportion of children and women in urban areas reported
consumption of fortifiable products than in rural areas. Furthermore, coverage of fortifiable
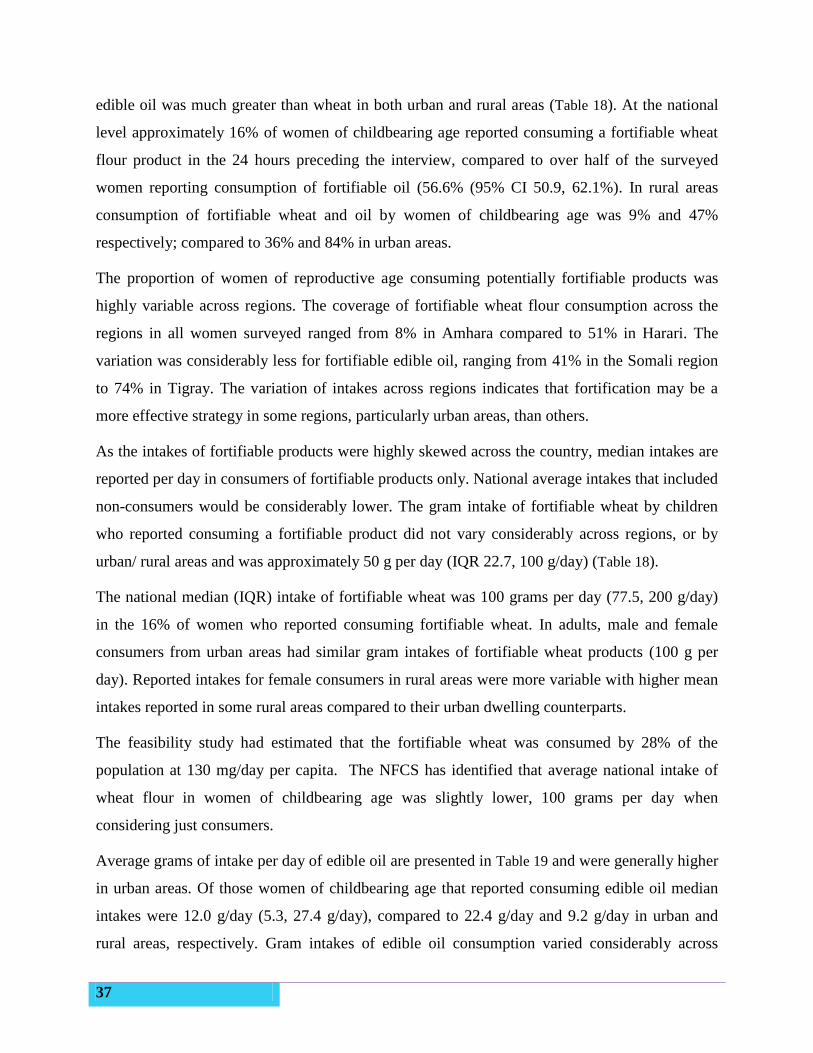
37
edible oil was much greater than wheat in both urban and rural areas (Table 18). At the national
level approximately 16% of women of childbearing age reported consuming a fortifiable wheat
flour product in the 24 hours preceding the interview, compared to over half of the surveyed
women reporting consumption of fortifiable oil (56.6% (95% CI 50.9, 62.1%). In rural areas
consumption of fortifiable wheat and oil by women of childbearing age was 9% and 47%
respectively; compared to 36% and 84% in urban areas.
The proportion of women of reproductive age consuming potentially fortifiable products was
highly variable across regions. The coverage of fortifiable wheat flour consumption across the
regions in all women surveyed ranged from 8% in Amhara compared to 51% in Harari. The
variation was considerably less for fortifiable edible oil, ranging from 41% in the Somali region
to 74% in Tigray. The variation of intakes across regions indicates that fortification may be a
more effective strategy in some regions, particularly urban areas, than others.
As the intakes of fortifiable products were highly skewed across the country, median intakes are
reported per day in consumers of fortifiable products only. National average intakes that included
non-consumers would be considerably lower. The gram intake of fortifiable wheat by children
who reported consuming a fortifiable product did not vary considerably across regions, or by
urban/ rural areas and was approximately 50 g per day (IQR 22.7, 100 g/day) (Table 18).
The national median (IQR) intake of fortifiable wheat was 100 grams per day (77.5, 200 g/day)
in the 16% of women who reported consuming fortifiable wheat. In adults, male and female
consumers from urban areas had similar gram intakes of fortifiable wheat products (100 g per
day). Reported intakes for female consumers in rural areas were more variable with higher mean
intakes reported in some rural areas compared to their urban dwelling counterparts.
The feasibility study had estimated that the fortifiable wheat was consumed by 28% of the
population at 130 mg/day per capita. The NFCS has identified that average national intake of
wheat flour in women of childbearing age was slightly lower, 100 grams per day when
considering just consumers.
Average grams of intake per day of edible oil are presented in Table 19 and were generally higher
in urban areas. Of those women of childbearing age that reported consuming edible oil median
intakes were 12.0 g/day (5.3, 27.4 g/day), compared to 22.4 g/day and 9.2 g/day in urban and
rural areas, respectively. Gram intakes of edible oil consumption varied considerably across
38
regions. The region with the highest intakes was Addis Ababa where a large proportion of the
population reported consumption of edible oils (27.8 g/day).
These data indicate that a higher proportion of the urban population consumes fortifiable wheat
and oil, and will consequently be the main beneficiaries of fortification programmes targeting
these food products. Fortification of edible oil is likely to have a greater impact as a much greater
proportion of the population, including both urban and rural dwellers, consumes it.
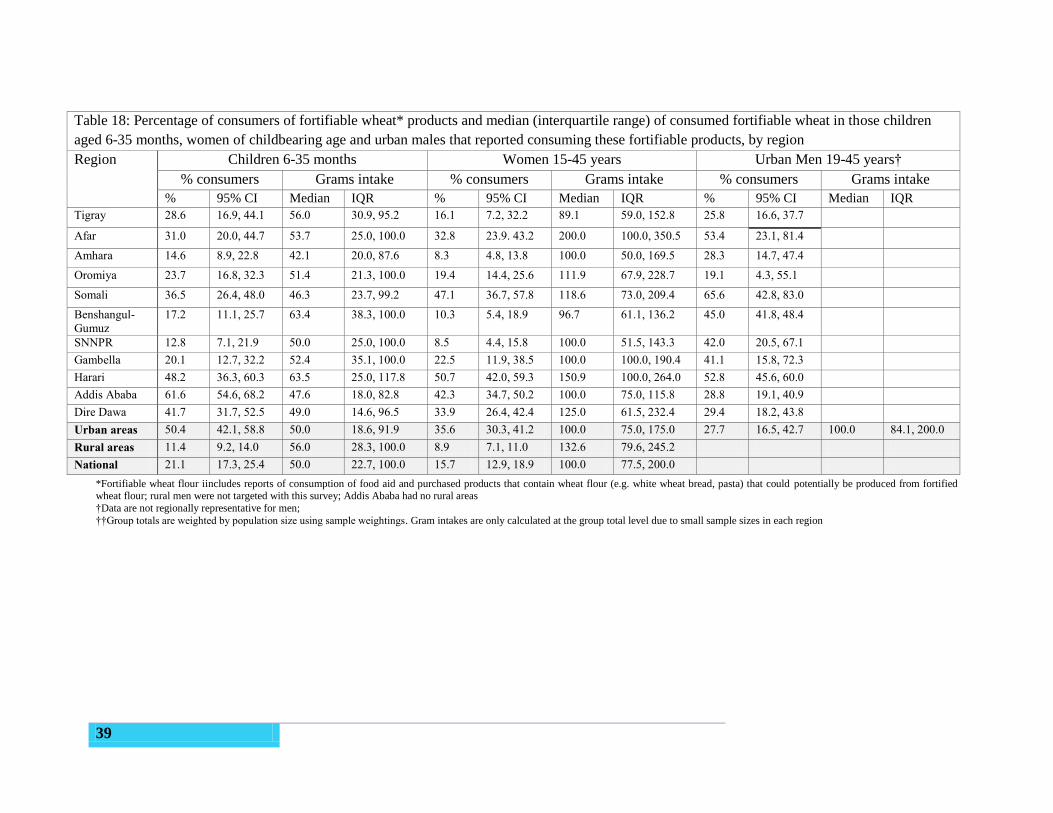
39
Table 18: Percentage of consumers of fortifiable wheat* products and median (interquartile range) of consumed fortifiable wheat in those children
aged 6-35 months, women of childbearing age and urban males that reported consuming these fortifiable products, by region
Region Children 6-35 months Women 15-45 years Urban Men 19-45 years†
% consumers Grams intake % consumers Grams intake % consumers Grams intake
% 95% CI Median IQR % 95% CI Median IQR % 95% CI Median IQR
Tigray 28.6 16.9, 44.1 56.0 30.9, 95.2 16.1 7.2, 32.2 89.1 59.0, 152.8 25.8 16.6, 37.7
Afar 31.0 20.0, 44.7 53.7 25.0, 100.0 32.8 23.9. 43.2 200.0 100.0, 350.5 53.4 23.1, 81.4
Amhara 14.6 8.9, 22.8 42.1 20.0, 87.6 8.3 4.8, 13.8 100.0 50.0, 169.5 28.3 14.7, 47.4
Oromiya 23.7 16.8, 32.3 51.4 21.3, 100.0 19.4 14.4, 25.6 111.9 67.9, 228.7 19.1 4.3, 55.1
Somali 36.5 26.4, 48.0 46.3 23.7, 99.2 47.1 36.7, 57.8 118.6 73.0, 209.4 65.6 42.8, 83.0
Benshangul-
Gumuz
17.2 11.1, 25.7 63.4 38.3, 100.0 10.3 5.4, 18.9 96.7 61.1, 136.2 45.0 41.8, 48.4
SNNPR 12.8 7.1, 21.9 50.0 25.0, 100.0 8.5 4.4, 15.8 100.0 51.5, 143.3 42.0 20.5, 67.1
Gambella 20.1 12.7, 32.2 52.4 35.1, 100.0 22.5 11.9, 38.5 100.0 100.0, 190.4 41.1 15.8, 72.3
Harari 48.2 36.3, 60.3 63.5 25.0, 117.8 50.7 42.0, 59.3 150.9 100.0, 264.0 52.8 45.6, 60.0
Addis Ababa 61.6 54.6, 68.2 47.6 18.0, 82.8 42.3 34.7, 50.2 100.0 75.0, 115.8 28.8 19.1, 40.9
Dire Dawa 41.7 31.7, 52.5 49.0 14.6, 96.5 33.9 26.4, 42.4 125.0 61.5, 232.4 29.4 18.2, 43.8
Urban areas 50.4 42.1, 58.8 50.0 18.6, 91.9 35.6 30.3, 41.2 100.0 75.0, 175.0 27.7 16.5, 42.7 100.0 84.1, 200.0
Rural areas 11.4 9.2, 14.0 56.0 28.3, 100.0 8.9 7.1, 11.0 132.6 79.6, 245.2
National 21.1 17.3, 25.4 50.0 22.7, 100.0 15.7 12.9, 18.9 100.0 77.5, 200.0
*Fortifiable wheat flour iincludes reports of consumption of food aid and purchased products that contain wheat flour (e.g. white wheat bread, pasta) that could potentially be produced from fortified wheat flour; rural men were not targeted with this survey; Addis Ababa had no rural areas
†Data are not regionally representative for men;
††Group totals are weighted by population size using sample weightings. Gram intakes are only calculated at the group total level due to small sample sizes in each region
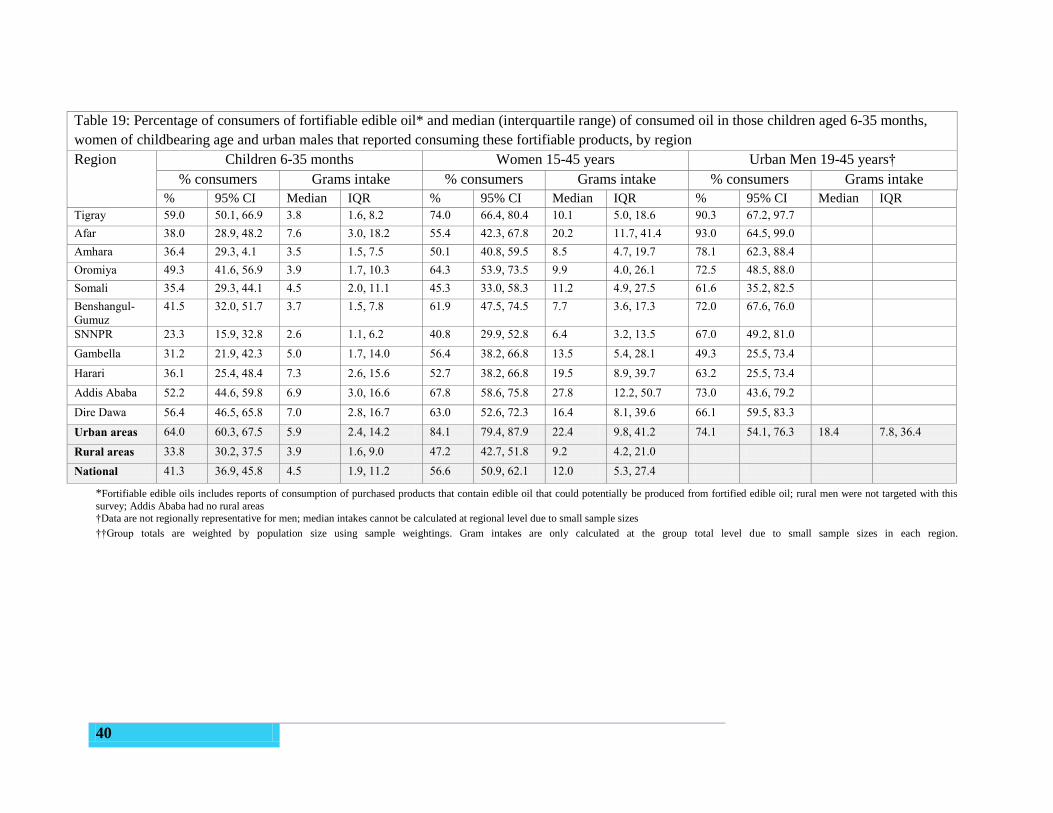
40
Table 19: Percentage of consumers of fortifiable edible oil* and median (interquartile range) of consumed oil in those children aged 6-35 months,
women of childbearing age and urban males that reported consuming these fortifiable products, by region
Region Children 6-35 months Women 15-45 years Urban Men 19-45 years†
% consumers Grams intake % consumers Grams intake % consumers Grams intake
% 95% CI Median IQR % 95% CI Median IQR % 95% CI Median IQR
Tigray 59.0 50.1, 66.9 3.8 1.6, 8.2 74.0 66.4, 80.4 10.1 5.0, 18.6 90.3 67.2, 97.7
Afar 38.0 28.9, 48.2 7.6 3.0, 18.2 55.4 42.3, 67.8 20.2 11.7, 41.4 93.0 64.5, 99.0
Amhara 36.4 29.3, 4.1 3.5 1.5, 7.5 50.1 40.8, 59.5 8.5 4.7, 19.7 78.1 62.3, 88.4
Oromiya 49.3 41.6, 56.9 3.9 1.7, 10.3 64.3 53.9, 73.5 9.9 4.0, 26.1 72.5 48.5, 88.0
Somali 35.4 29.3, 44.1 4.5 2.0, 11.1 45.3 33.0, 58.3 11.2 4.9, 27.5 61.6 35.2, 82.5
Benshangul-
Gumuz
41.5 32.0, 51.7 3.7 1.5, 7.8 61.9 47.5, 74.5 7.7 3.6, 17.3 72.0 67.6, 76.0
SNNPR 23.3 15.9, 32.8 2.6 1.1, 6.2 40.8 29.9, 52.8 6.4 3.2, 13.5 67.0 49.2, 81.0
Gambella 31.2 21.9, 42.3 5.0 1.7, 14.0 56.4 38.2, 66.8 13.5 5.4, 28.1 49.3 25.5, 73.4
Harari 36.1 25.4, 48.4 7.3 2.6, 15.6 52.7 38.2, 66.8 19.5 8.9, 39.7 63.2 25.5, 73.4
Addis Ababa 52.2 44.6, 59.8 6.9 3.0, 16.6 67.8 58.6, 75.8 27.8 12.2, 50.7 73.0 43.6, 79.2
Dire Dawa 56.4 46.5, 65.8 7.0 2.8, 16.7 63.0 52.6, 72.3 16.4 8.1, 39.6 66.1 59.5, 83.3
Urban areas 64.0 60.3, 67.5 5.9 2.4, 14.2 84.1 79.4, 87.9 22.4 9.8, 41.2 74.1 54.1, 76.3 18.4 7.8, 36.4
Rural areas 33.8 30.2, 37.5 3.9 1.6, 9.0 47.2 42.7, 51.8 9.2 4.2, 21.0
National 41.3 36.9, 45.8 4.5 1.9, 11.2 56.6 50.9, 62.1 12.0 5.3, 27.4
*Fortifiable edible oils includes reports of consumption of purchased products that contain edible oil that could potentially be produced from fortified edible oil; rural men were not targeted with this
survey; Addis Ababa had no rural areas
†Data are not regionally representative for men; median intakes cannot be calculated at regional level due to small sample sizes
††Group totals are weighted by population size using sample weightings. Gram intakes are only calculated at the group total level due to small sample sizes in each region.
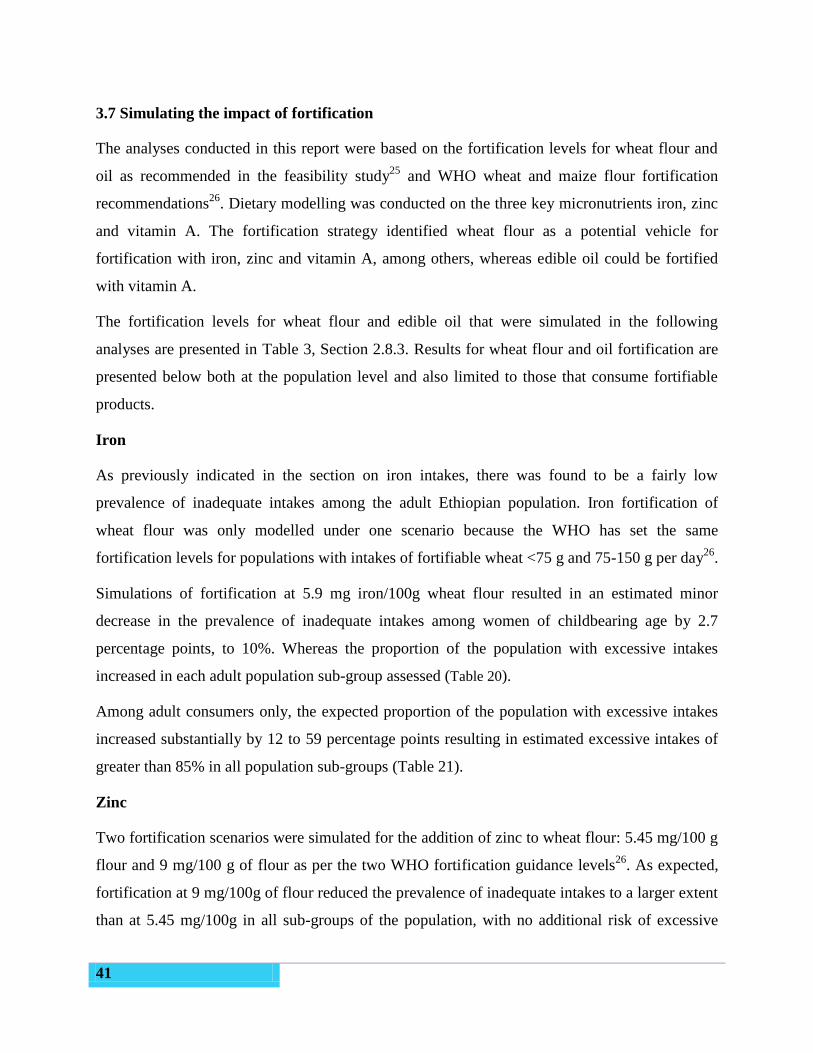
41
3.7 Simulating the impact of fortification
The analyses conducted in this report were based on the fortification levels for wheat flour and
oil as recommended in the feasibility study25
and WHO wheat and maize flour fortification
recommendations26
. Dietary modelling was conducted on the three key micronutrients iron, zinc
and vitamin A. The fortification strategy identified wheat flour as a potential vehicle for
fortification with iron, zinc and vitamin A, among others, whereas edible oil could be fortified
with vitamin A.
The fortification levels for wheat flour and edible oil that were simulated in the following
analyses are presented in Table 3, Section 2.8.3. Results for wheat flour and oil fortification are
presented below both at the population level and also limited to those that consume fortifiable
products.
Iron
As previously indicated in the section on iron intakes, there was found to be a fairly low
prevalence of inadequate intakes among the adult Ethiopian population. Iron fortification of
wheat flour was only modelled under one scenario because the WHO has set the same
fortification levels for populations with intakes of fortifiable wheat <75 g and 75-150 g per day26
.
Simulations of fortification at 5.9 mg iron/100g wheat flour resulted in an estimated minor
decrease in the prevalence of inadequate intakes among women of childbearing age by 2.7
percentage points, to 10%. Whereas the proportion of the population with excessive intakes
increased in each adult population sub-group assessed (Table 20).
Among adult consumers only, the expected proportion of the population with excessive intakes
increased substantially by 12 to 59 percentage points resulting in estimated excessive intakes of
greater than 85% in all population sub-groups (Table 21).
Zinc
Two fortification scenarios were simulated for the addition of zinc to wheat flour: 5.45 mg/100 g
flour and 9 mg/100 g of flour as per the two WHO fortification guidance levels26
. As expected,
fortification at 9 mg/100g of flour reduced the prevalence of inadequate intakes to a larger extent
than at 5.45 mg/100g in all sub-groups of the population, with no additional risk of excessive
42
intakes (Table 20). Less than 1% of the population were exposed to excessive intake under both
fortification scenarios in all population groups.
Fortification of wheat flour at 9 mg zinc/100g was estimated to reduce the prevalence of
inadequate intakes by approximately 30% in women and urban men aged 19-45 years to 34%
and 42%, respectively (Table 20). At the population level, the greatest reduction in inadequate
zinc intakes was seen in the urban population as more than a third of the adults in urban areas
consumed fortifiable wheat products. In urban women the proportion with inadequate intakes
was estimated to be halved under this scenario, reducing the overall prevalence of inadequate
intakes in urban women to 29% of the total population.
Limiting the effect of fortification to only those in the population that consume fortifiable wheat
indicates how much of an impact the intervention would have on those it would reach (Table 21).
In population groups consuming fortifiable wheat substantial decreases in the prevalence of
inadequate intakes were estimated in the adult population. Fortification simulations at 5.45
mg/100g were estimated to reduce the prevalence of inadequate intakes in women of child
bearing age to almost acceptable levels considering the survey was conducted during the lean
season. Further reductions were achieved by increasing the fortification level. In those women
who consumed wheat flour, the prevalence of inadequate intakes was estimated to decrease to
acceptable levels (<3%).
The impact of fortification of wheat with zinc would have limited impact on young children,
with results indicating that targeted nutrition programmes would be necessary for this age group.
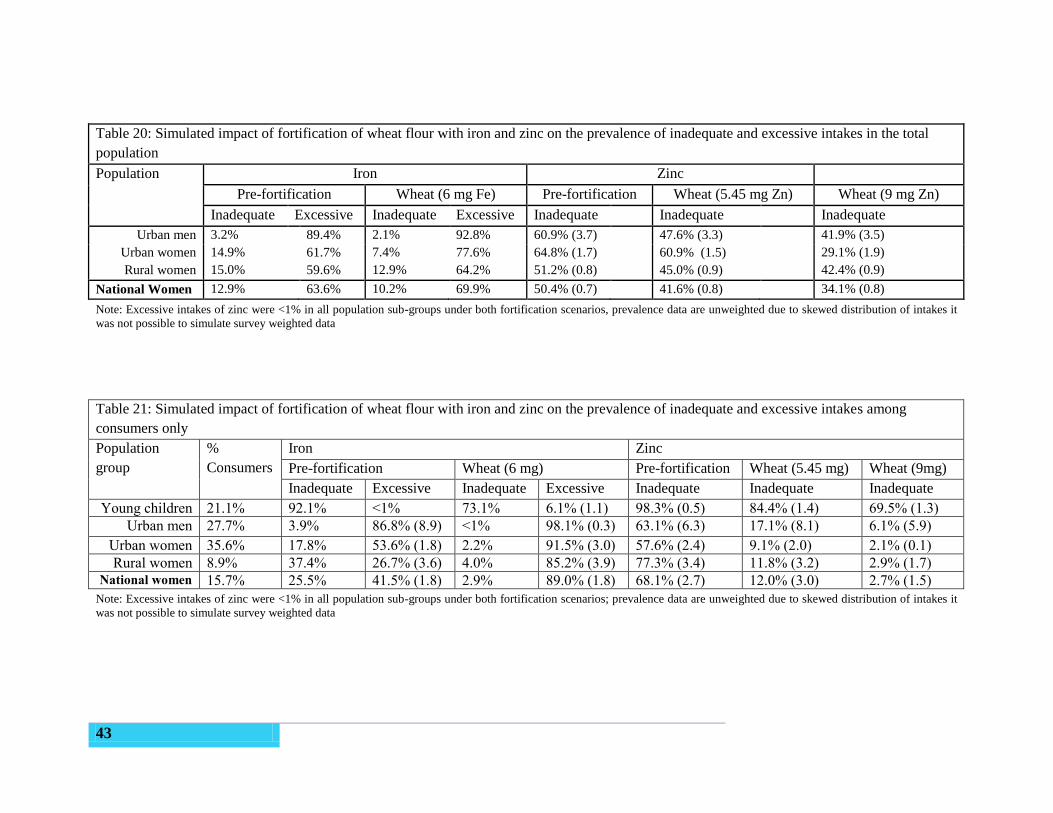
43
Table 20: Simulated impact of fortification of wheat flour with iron and zinc on the prevalence of inadequate and excessive intakes in the total
population
Population Iron Zinc
Pre-fortification Wheat (6 mg Fe) Pre-fortification Wheat (5.45 mg Zn) Wheat (9 mg Zn)
Inadequate Excessive Inadequate Excessive Inadequate Inadequate Inadequate
Urban men 3.2% 89.4% 2.1% 92.8% 60.9% (3.7) 47.6% (3.3) 41.9% (3.5)
Urban women 14.9% 61.7% 7.4% 77.6% 64.8% (1.7) 60.9% (1.5) 29.1% (1.9)
Rural women 15.0% 59.6% 12.9% 64.2% 51.2% (0.8) 45.0% (0.9) 42.4% (0.9)
National Women 12.9% 63.6% 10.2% 69.9% 50.4% (0.7) 41.6% (0.8) 34.1% (0.8)
Note: Excessive intakes of zinc were <1% in all population sub-groups under both fortification scenarios, prevalence data are unweighted due to skewed distribution of intakes it
was not possible to simulate survey weighted data
Table 21: Simulated impact of fortification of wheat flour with iron and zinc on the prevalence of inadequate and excessive intakes among
consumers only
Population
group
%
Consumers
Iron Zinc
Pre-fortification Wheat (6 mg) Pre-fortification Wheat (5.45 mg) Wheat (9mg)
Inadequate Excessive Inadequate Excessive Inadequate Inadequate Inadequate
Young children 21.1% 92.1% <1% 73.1% 6.1% (1.1) 98.3% (0.5) 84.4% (1.4) 69.5% (1.3)
Urban men 27.7% 3.9% 86.8% (8.9) <1% 98.1% (0.3) 63.1% (6.3) 17.1% (8.1) 6.1% (5.9)
Urban women 35.6% 17.8% 53.6% (1.8) 2.2% 91.5% (3.0) 57.6% (2.4) 9.1% (2.0) 2.1% (0.1)
Rural women 8.9% 37.4% 26.7% (3.6) 4.0% 85.2% (3.9) 77.3% (3.4) 11.8% (3.2) 2.9% (1.7) National women 15.7% 25.5% 41.5% (1.8) 2.9% 89.0% (1.8) 68.1% (2.7) 12.0% (3.0) 2.7% (1.5)
Note: Excessive intakes of zinc were <1% in all population sub-groups under both fortification scenarios; prevalence data are unweighted due to skewed distribution of intakes it
was not possible to simulate survey weighted data
44
Vitamin A
Vitamin A was identified as a nutrient that could be added to edible oil and wheat flour at two
levels of fortification; as such the following three scenarios were modelled in the total population
and in just consumers:
Scenario 1: Fortification of Edible oil only (2000 μg retinol per 100g oil)
Scenario 2: Fortification of edible oil and wheat flour at base levels of vitamin A (195 μg
retinol per 100 g oil)
Scenario 3: Fortification of edible oil and wheat flour at higher levels of vitamin A (384
μg retinol per 100 g oil)
General Population
As identified in Section 3.6, fortifiable oil is consumed by greater proportions of the population
than wheat flour and consequently has a larger impact on reducing the prevalence of inadequate
vitamin A intakes than only fortification of wheat flour (Table 19). As would be expected, the
fortification of both wheat flour and edible oil had a greater impact on vitamin A estimated
intakes than either food vehicle alone. Fortification of both wheat and oil were not found to
expose the adult population to excessive intakes of vitamin A. Dietary modelling showed that
less than 1% of the population exceeded the UL in all sub-groups.
As with zinc fortification, scenarios for vitamin A fortification demonstrated more benefits for
urban areas than for rural areas due to the higher consumption rates of fortifiable foods in urban
areas. Fortification under scenario 3 reduced the estimated prevalence of inadequate intakes from
almost 90% to less than a quarter of urban women and a third of urban men. Overall the
simulated impact of fortification of edible oil and wheat flour with retinol was estimated to
reduce inadequate intakes of vitamin A to 43% of women at the national level.
Due to the skewed nature of the vitamin A intake and food vehicle consumption in children it
was not possible to simulate the effects of fortification on children aged 12 to 35 months using
the IMAPP software at the population level.
Consumers only
Table 23 presents the impact of vitamin A fortification among just those in the population who
consumed the fortifiable products. At the national level the impact of fortification on those
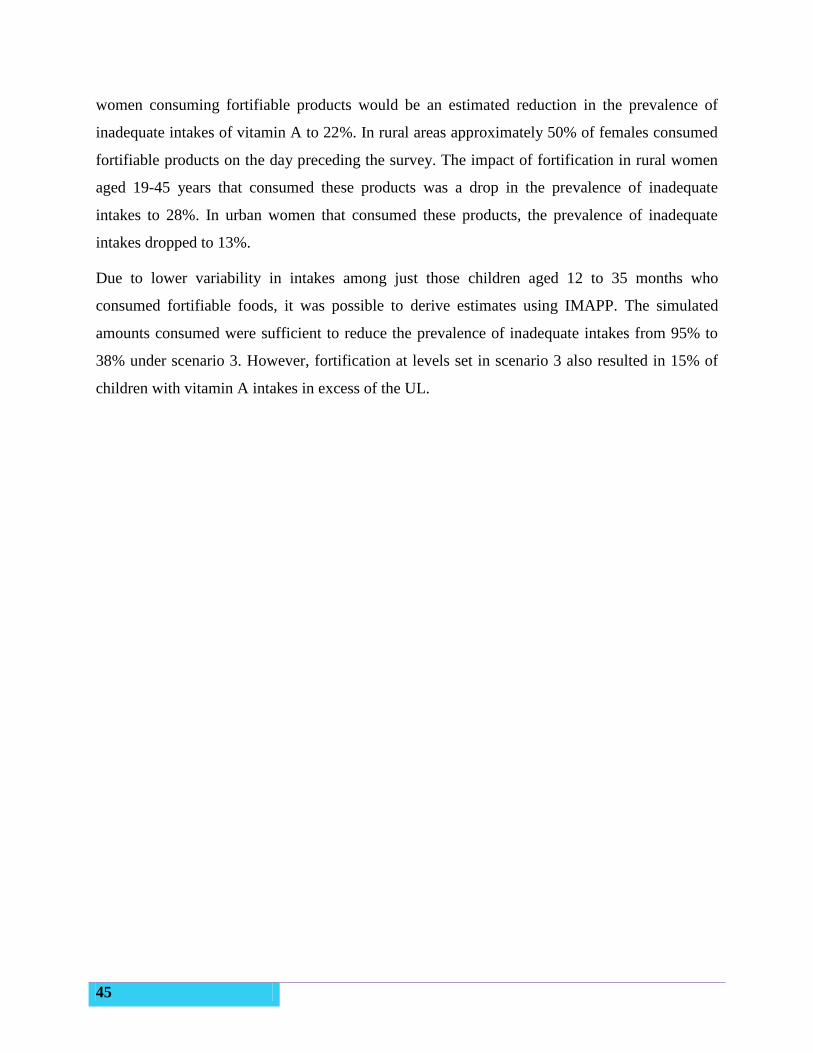
45
women consuming fortifiable products would be an estimated reduction in the prevalence of
inadequate intakes of vitamin A to 22%. In rural areas approximately 50% of females consumed
fortifiable products on the day preceding the survey. The impact of fortification in rural women
aged 19-45 years that consumed these products was a drop in the prevalence of inadequate
intakes to 28%. In urban women that consumed these products, the prevalence of inadequate
intakes dropped to 13%.
Due to lower variability in intakes among just those children aged 12 to 35 months who
consumed fortifiable foods, it was possible to derive estimates using IMAPP. The simulated
amounts consumed were sufficient to reduce the prevalence of inadequate intakes from 95% to
38% under scenario 3. However, fortification at levels set in scenario 3 also resulted in 15% of
children with vitamin A intakes in excess of the UL.
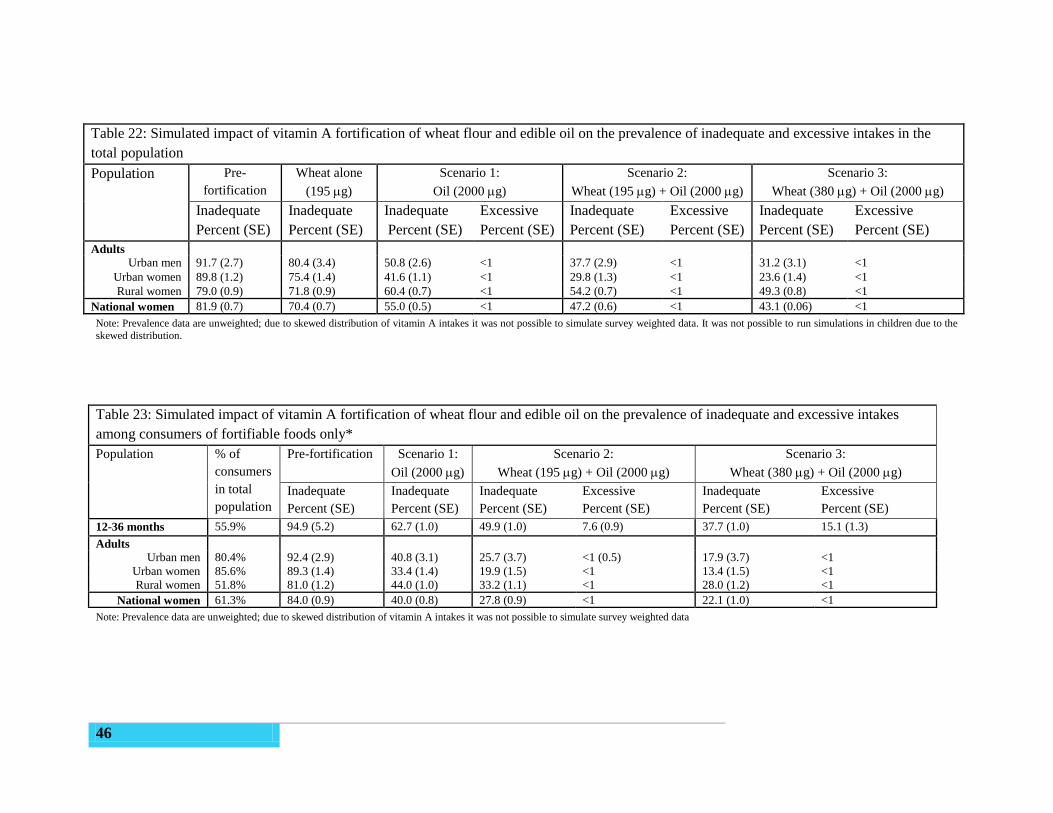
46
Table 22: Simulated impact of vitamin A fortification of wheat flour and edible oil on the prevalence of inadequate and excessive intakes in the
total population
Population Pre-
fortification
Wheat alone
(195 g)
Scenario 1:
Oil (2000 g)
Scenario 2:
Wheat (195 g) + Oil (2000 g)
Scenario 3:
Wheat (380 g) + Oil (2000 g)
Inadequate
Percent (SE)
Inadequate
Percent (SE)
Inadequate
Percent (SE)
Excessive
Percent (SE)
Inadequate
Percent (SE)
Excessive
Percent (SE)
Inadequate
Percent (SE)
Excessive
Percent (SE)
Adults
Urban men 91.7 (2.7) 80.4 (3.4) 50.8 (2.6) <1 37.7 (2.9) <1 31.2 (3.1) <1
Urban women 89.8 (1.2) 75.4 (1.4) 41.6 (1.1) <1 29.8 (1.3) <1 23.6 (1.4) <1
Rural women 79.0 (0.9) 71.8 (0.9) 60.4 (0.7) <1 54.2 (0.7) <1 49.3 (0.8) <1
National women 81.9 (0.7) 70.4 (0.7) 55.0 (0.5) <1 47.2 (0.6) <1 43.1 (0.06) <1
Note: Prevalence data are unweighted; due to skewed distribution of vitamin A intakes it was not possible to simulate survey weighted data. It was not possible to run simulations in children due to the
skewed distribution.
Table 23: Simulated impact of vitamin A fortification of wheat flour and edible oil on the prevalence of inadequate and excessive intakes
among consumers of fortifiable foods only*
Population % of
consumers
in total
population
Pre-fortification
Scenario 1:
Oil (2000 g)
Scenario 2:
Wheat (195 g) + Oil (2000 g)
Scenario 3:
Wheat (380 g) + Oil (2000 g)
Inadequate
Percent (SE)
Inadequate
Percent (SE)
Inadequate
Percent (SE)
Excessive
Percent (SE)
Inadequate
Percent (SE)
Excessive
Percent (SE)
12-36 months 55.9% 94.9 (5.2) 62.7 (1.0) 49.9 (1.0) 7.6 (0.9) 37.7 (1.0) 15.1 (1.3)
Adults
Urban men 80.4% 92.4 (2.9) 40.8 (3.1) 25.7 (3.7) <1 (0.5) 17.9 (3.7) <1
Urban women 85.6% 89.3 (1.4) 33.4 (1.4) 19.9 (1.5) <1 13.4 (1.5) <1
Rural women 51.8% 81.0 (1.2) 44.0 (1.0) 33.2 (1.1) <1 28.0 (1.2) <1
National women 61.3% 84.0 (0.9) 40.0 (0.8) 27.8 (0.9) <1 22.1 (1.0) <1
Note: Prevalence data are unweighted; due to skewed distribution of vitamin A intakes it was not possible to simulate survey weighted data
47
3.8 Nutritional Status of mother and children
For this report indicators of the nutritional status of children were calculated using growth
standards published by the World Health Organization (WHO) in 2006. The three indices are
expressed as standard deviation units from the median for the reference group. Children who fall
below minus two standard deviations (−2SD) from the median of the reference population (<-2
z-score) are regarded as moderately malnourished, while those who fall below minus three
standard deviations (−3SD) from the median of the reference population (<-3 z-score) are
considered severely malnourished.
Although the sampling framework was not developed to establish national rates of malnutrition
based on anthropometric measures, the anthropometric data collected in this survey serve as
comparison to the dietary data collected. The nutritional status of children who participated in
this study, by region is presented in Table 24. The highest prevalence of wasting was in Afar
(26.0%) followed by Benishangul-Gumuz region (15.1%), Gambella (13.9%) and Somali
(13.1%). This order is slightly different from the observed prevalence of wasting among children
less than five years of age in the 2011 EDHS in these regions (Afar 19.5%, Benshangul-Gumuz
9.9%, Gambella 12.5%, Somali 22.2%) but the breakdown by age and region is not available in
the EDHS to provide a more accurate comparison to the age range in this survey. The lowest
prevalence of acute malnutrition in the NFCS was found in Addis Ababa (3.2%); the EDHS also
found the lowest prevalence in Addis Ababa (4.6%).
More children in Afar were underweight (38.6%) compared to other regions, which was also the
case in the 2011 EDHS and the lowest prevalence of underweight was also found in Addis
Ababa, as with the EDHS.
The prevalence of stunting in this study was highest in Tigray (47.7%) followed by Amhara
(44.9%) and SNNPR (40.7%). Children in Addis Ababa, Gambella, Somali, and Dire Dawa are
the least stunted ones.
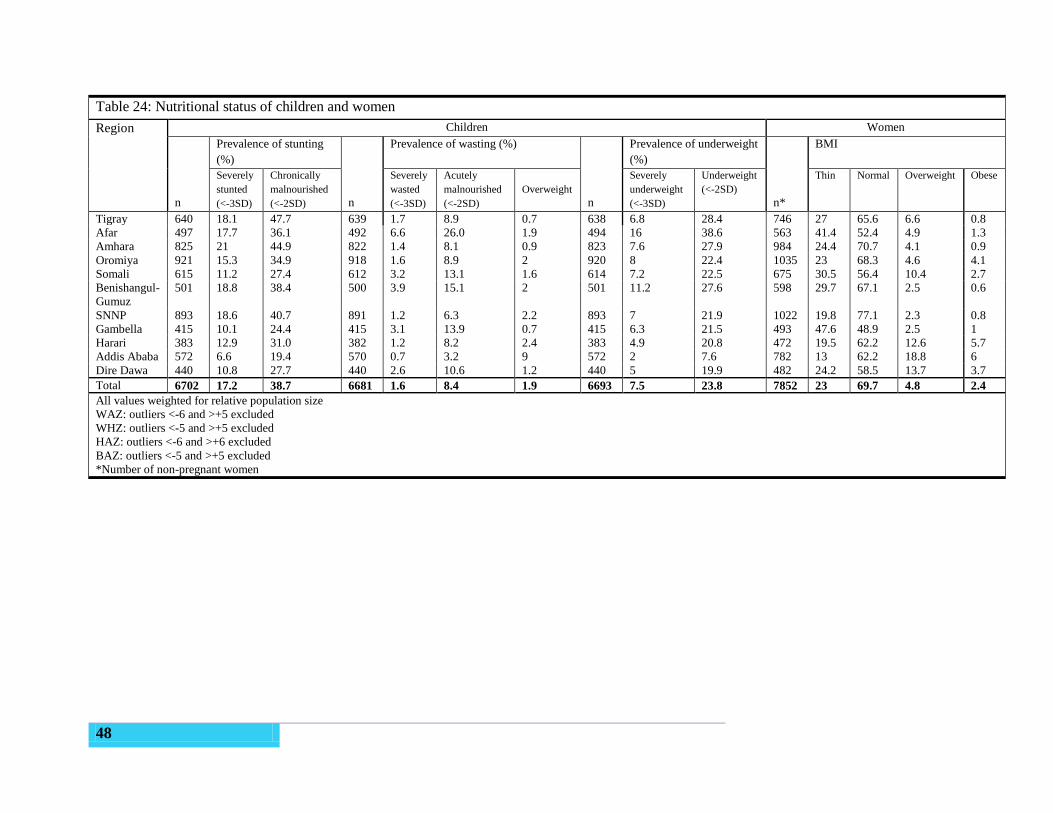
48
Table 24: Nutritional status of children and women
Region Children Women
n
Prevalence of stunting
(%)
n
Prevalence of wasting (%)
n
Prevalence of underweight
(%)
n*
BMI
Severely
stunted
(<-3SD)
Chronically
malnourished
(<-2SD)
Severely
wasted
(<-3SD)
Acutely
malnourished
(<-2SD)
Overweight
Severely
underweight
(<-3SD)
Underweight
(<-2SD)
Thin Normal Overweight Obese
Tigray 640 18.1 47.7 639 1.7 8.9 0.7 638 6.8 28.4 746 27 65.6 6.6 0.8
Afar 497 17.7 36.1 492 6.6 26.0 1.9 494 16 38.6 563 41.4 52.4 4.9 1.3
Amhara 825 21 44.9 822 1.4 8.1 0.9 823 7.6 27.9 984 24.4 70.7 4.1 0.9
Oromiya 921 15.3 34.9 918 1.6 8.9 2 920 8 22.4 1035 23 68.3 4.6 4.1
Somali 615 11.2 27.4 612 3.2 13.1 1.6 614 7.2 22.5 675 30.5 56.4 10.4 2.7
Benishangul-
Gumuz
501 18.8 38.4 500 3.9 15.1 2 501 11.2 27.6 598 29.7 67.1 2.5 0.6
SNNP 893 18.6 40.7 891 1.2 6.3 2.2 893 7 21.9 1022 19.8 77.1 2.3 0.8
Gambella 415 10.1 24.4 415 3.1 13.9 0.7 415 6.3 21.5 493 47.6 48.9 2.5 1
Harari 383 12.9 31.0 382 1.2 8.2 2.4 383 4.9 20.8 472 19.5 62.2 12.6 5.7
Addis Ababa 572 6.6 19.4 570 0.7 3.2 9 572 2 7.6 782 13 62.2 18.8 6
Dire Dawa 440 10.8 27.7 440 2.6 10.6 1.2 440 5 19.9 482 24.2 58.5 13.7 3.7
Total 6702 17.2 38.7 6681 1.6 8.4 1.9 6693 7.5 23.8 7852 23 69.7 4.8 2.4
All values weighted for relative population size
WAZ: outliers <-6 and >+5 excluded
WHZ: outliers <-5 and >+5 excluded
HAZ: outliers <-6 and >+6 excluded
BAZ: outliers <-5 and >+5 excluded
*Number of non-pregnant women
49
CHAPTER FOUR: Discussion and conclusion
Ethiopia is now one of the few countries globally and in Africa with representative data at both
national and administrative region level for individual-level dietary intake data. The dietary data
were collected from a total of 8133 women of child bearing age, 8079 children and 380 men
from the eleven administrative regions. The information collected fulfills the stated objectives
for this study related to informing the National Food Fortification program but also goes far to
provide insights into food sufficiency, dietary diversity, nutritional status and the adequacy of
macro and micronutrient intake in the Ethiopian population. Regional information on staple food
consumption may also be useful to complement information needed to inform agricultural
policies.
Socio-demographic and economic characteristics of the households like education, household
size, income, women’s autonomy, working status of parents, standard of living, place of
residence, better condition of water supply and sanitation are key measures of child and maternal
health29
. Socioeconomic and demographic indicators revealed that majority (43%) of the
household head had no formal education. Regions such as Somali (68.7%), Afar (59.8%) and
Amahara (51.1) had the highest percentage of household head with no formal education. These
factors along with a high percent of poorest wealth index among the surveyed population
probably contributed to poor dietary patterns and low nutritional status in Ethiopian women and
children.
Food groups consumed most among target groups across the different regions were
predominantly cereal/grains except in Somali, Afar and Gambella regions where dairy products
constitute a major portion of the diet. As a whole, consumption of animal products (meat, milk,
cheese, eggs and whey) and of vitamin A rich fruits and vegetables were very low. This limited
variation in food groups among the target groups may represent their cultural eating habits and
also low availability of different foods during the lean season when the survey was conducted.
The mean energy intake in children was very low across the different regions. The lowest mean
energy intake in children was observed in SNNP region. A relatively better energy intake was
observed in adult women and men, with the exception of Somali region. In general, the mean
energy intake was below the age-group specific recommended average. However, the correlation
between energy intake and energy requirements, which are related to energy expenditure, it is not
50
possible to evaluate the adequacy of energy intake without information on individual energy
requirements and expenditure.
The median protein intake in children in SNNP, Benshangul-Gumuz, Somali and Amhara were
low. Nationally, 51.5% of children consumed protein at level less than the estimated average
requirement (EAR=12g/d). The highest proportion of the inadequate intake was observed in
SNNP (64%) and Somali (53.6) regions. Relatively lower percentage (48.5%) of inadequate
protein intake at a national level were observed among women as compared to the estimated
average requirement (EAR=37g/d). However, a high proportion of inadequate protein intake was
observed in Somali (75%) and SNNP (64.5%). Majority (60.6%) of children consumed
carbohydrate at level less than the estimated average requirement (EAR=100g/d). Inadequacy of
protein and carbohydrate in children and protein in women is associated with low consumption
of flesh foods, legumes and other foods poor in protein content.
Energy providing macronutrient proportions could vary in different populations. According to
the ranges of population nutrient intake goals recommended by WHO, the percentage of energy
from total carbohydrates, fats and proteins should be 55-75%, 15-30% and 10-15%
respectively30
. Recent national food consumption survey in South Africa found that 62% of total
energy was from carbohydrates, 23% from fat, 12.1% from protein31
, whereas in Ugandan
children consumed 37.6% of their energy from carbohydrates, 27.3% from fat and 35.1% from
protein20
. In contrast to these two African countries, Ethiopian children consumed a higher
proportion of total calories from carbohydrate (>65%), 10.5% from fat and 22.9% from protein.
Due to a limited research on adult women food consumption in Africa, the comparison for these
target groups were done to western countries. A food consumption survey done in Ireland in
2001 and the Netherlands in 2010 revealed that the dietary energy of adult women was derived
from carbohydrate (44.6% in Ireland and 46.1% in Dutch), fat (37% in Ireland and 34% in
Dutch) and protein (16.2% in Ireland and 14.75% in Dutch)32,33
. In contrast to the two western
countries, larger contribution of energy was from carbohydrate (73.5%) and the rest from Protein
(9.7%) and fat (16.5) in women of child bearing age in Ethiopia.
The NFCS provides Ethiopia with the opportunity to simulate the expected impact of various
fortification strategies using individual level data with national and regional representation
51
among young children and women of child bearing years, plus national level estimates among
urban men who are expected to consume the highest amounts of fortifiable foods.
Dietary modeling using data from the NFCS indicates that a higher proportion of the urban
population consume fortifiable wheat and oil, and will consequently be the main beneficiaries of
fortification programmes targeting these food products. Although the analysis has indicated that
urban areas will be the primary beneficiaries of a national fortification program, the low intakes
of zinc and vitamin A in the urban populations mean that this could reduce inadequate intakes of
these micronutrients.
Results from the simulation of various fortification scenarios indicate that the fortification of
edible oil and wheat flour can reduce the prevalence of inadequate intakes of iron, zinc and
vitamin A. Fortification did not result in excessive intakes of zinc or vitamin A in urban males –
the group considered to be most likely at risk of excessive intakes. However, excessive iron
intakes were reported in adults in almost all regions and population groups pre-fortification.
Of the two scenarios for fortification of wheat flour with zinc, the highest fortification level was
shown to have the greatest impact on inadequate intakes without exposing sub-groups of the
population to excessive intakes. At the national level it is estimated that it could reduce
inadequate intakes from 50% to 34% in women of child-bearing age, and 29% in urban areas.
Modeling the impact on those that are consumers of fortifiable wheat flour also indicated that
inadequate intakes would virtually be eliminated in both urban and rural areas.
As the coverage of fortifiable edible oil was far greater than wheat flour in the Ethiopian
population, the fortification of edible oil was found to have a far greater impact on the adequacy
of vitamin A intakes than the fortification of wheat flour alone. Fortification of both edible oil
and wheat flour would further decrease the prevalence of inadequate intakes; however
fortification of wheat flour at the higher fortification level was shown to increase the prevalence
of excessive intakes in young children that were consumers of both products. Similar results
were also found in Cameron whereby the fortification of edible oil with vitamin A could lead to
reductions in inadequate intakes, and although the fortification of multiple food vehicles could
lead to further reductions they would also lead to increase in the prevalence of excessive intakes
in young children34
. The feasibility study highlighted that the addition of vitamin A to flour is
relatively expensive and as such it was not recommended to add to flour due to the limited
52
coverage of industrially processed flour in comparison to edible oil25
. In light of this the
additional cost and potential for excessive intakes in young children, the fortification of edible
oil alone with vitamin A is recommended.
The results of the dietary modeling signaled that further investigation is warranted as to iron
status of the population. The results indicated that iron intakes were high and there was limited
benefit of fortification of wheat flour on inadequate intakes, with the potential to increase the
prevalence of excessive intakes in both women of childbearing age and urban males. The low
national prevalence of inadequate iron intakes reported here is consistent with the high content of
iron in Ethiopian diets reported in previous surveys35,36
. High iron intakes have previously been
attributed to contaminant iron in the soil37
, and also to teff, oleaginous seeds and Ethiopian kale
which all contain relatively high levels of iron12,13
.
It is noted that the WHO/FAO have only recommended one tolerable upper level (UL) for iron.
The evidence underpinning the recommendation is based on supplemental iron which is of
higher bioavailability. Therefore the appropriateness of this UL to a dietary intake where iron is
poorly absorbed is unknown but it is likely that adjustments would need to be made for the lower
absorption of iron. Irrespective of the issue of excessive intakes, the fortification of wheat flour
with iron at 5.9 mg iron/100g had limited impact on the prevalence of inadequate intakes,
reducing the prevalence of inadequacy in women from 13% to 10%.
Although high rates of anemia exist in Ethiopia, whether this is attributed to iron is yet to be
established. Previous studies have also found surprisingly low levels of iron deficiency in
Ethiopia35
. Up to date nationally representative data are required to examine the iron status, and
determine whether iron deficiency or overload may be of public health concern in Ethiopia. The
results of the 2015 Micronutrient Survey on biochemical indices, including iron status will be
most valuable in answering this question.
This study has some limitations. The data are only representative of children 6-35 months of age
and mothers of these children or other related females 15-45 years of age. Due to the high cost of
dietary data collection among the already large sample size for regionally representative data,
only one 24-hour dietary recall was completed for each participant. Therefore, intra-individual
variation in the population was not quantifiable from survey data. However, the large number of
survey days included for each population group (children, women, men) provides an accurate
53
estimate of average intake and variability in intake at the population level. Secondly, seasonality
could alter the expected impact of fortification strategies by altering the average consumption
patterns. The NFCS was conducted in the period considered to be the longest lean season in
Ethiopia. Therefore, the number of individuals consuming these products and the amounts
consumed are likely higher during non-lean seasons. For children, because of the size of this
survey, we were not able to collect direct information on the amount of breast milk consumed by
each child. Therefore, the analyses are based solely on what recommended intakes from
complementary foods. Because this assumes an average intake of breast milk, our estimates
could over or under estimate the actual needs of Ethiopian children. The NFCS was also
conducted among HICES clusters, which was conducted across a full year, to attempt to compare
across time. However, the collection of data from sequential clusters throughout the year for the
HICES makes it difficult to determine whether fluctuations across the year are due to seasonality
of variations in cluster characteristics.
4.1 Conclusion
Acknowledging the limitations of the survey, the present study provides the first national
estimates of energy, macronutrient and micronutrient intake of Ethiopian children 6-35 months
of age and women/mothers of these children 15-45 years of age. Based on the survey findings,
we conclude that majority of children consumed a diet deficient in energy and nutrient density to
meet their nutritional requirements. An improvement of diet diversity is very crucial. The survey
also shows that children and women have intakes below the recommended amounts of vitamins
and minerals such as vitamin A, zinc, calcium, and in just children: iron. Moreover, the survey
provides insight into national food consumption patterns that can be used to stimulate the
promotion of food based approaches, taking into account cultural differences and eating patterns,
to alleviate existing nutrient deficiencies and inform current and future nutrition related public
health initiatives in Ethiopia.
4.2 Recommendation
Based on the findings in this survey, recommendations can be made on possible improvement on
dietary pattern of Ethiopians through:
Fortification of wheat flour with zinc and fortification of edible oil alone with vitamin A
for women of childbearing age and adult men
54
Evaluate the bioavailability of local foods, particularly non-animal source grains and
legumes, to determine whether the estimates of high iron intakes adequately reflect actual
absorption of iron consumed
Revise the question of iron fortification following the national micronutrient survey
results are available, particularly determination of whether high anaemia rates in Ethiopia
reflect iron deficiency or if other cause are likely to have a greater impact
Promotion of diet diversity and adequate quantity, including increased consumption of
animal products, legumes, fruits and vegetables to increase intakes of protein, vitamin A,
zinc, iron and folate. This would also promote consumption of foods that are good
sources of folate, vitamin C and other micronutrients that are likely low in the reported
diets.
Nutrition education to create awareness of the impact of dietary inadequacies on health
and wellbeing of individuals and by extension the nation.
In addition to the promotion of exclusive breast feeding to 6 months and continued
breastfeeding to 2 years, adequate quantity and quality of complementary foods during
the 6-24 month transition must also be promoted.
Exploring alternatives for improving nutrient density of complementary foods through
the local production of nutrient rich complementary foods.
Dissemination of the key findings of this survey at national and regional level to the
public and different stakeholders actively engaged in nutrition as a resource for policy
and programs development
Continue investigations of these data to expand the scope of potential use of these
findings.
To further refine our estimates related to children's complementary feeding patterns,
future studies should consider available data and/or conduct new analyses to quantify
averages and ranges of breast milk intakes among Ethiopian children.
55
References
1. Ethiopia Central Statistical Agency. Federal Demographic Republic of Ethiopia Central
Statistical Agency Population Projection of Ethiopia for All Regions At Wereda Level
from 2014 – 2017. (2014).
2. Ethiopia Central Statistical Agency. Ethiopia Demographic and Health Survey. (2012).
3. Kibret, H. African Economic Outlook: Ethiopia. (2014).
4. Ethiopia Central Statistical Agency. Ethiopia Demographic and Health Survey
Preliminary Report. (2005).
5. Ethiopian Health and Nutrition Research Institute. Report on baseline survey for national
nutrition. (2009).
6. Hotz, C. & Brown, K. H. Contents International Zinc Nutrition Consultative Group (
IZiNCG ) Technical Document # 1 Assessment of the Risk of Zinc Deficiency in
Populations and Options for Its Control.
7. Government of the Federal Democratic Republic of Ethiopia. National Nutrition
Programme. (2015).
8. Mason, N. M., Jayne, T. S. & Shiferaw, B. Wheat Consumption in Sub-Saharan Africa:
Trends, Drivers, and Policy Implications. (2012).
9. Thompson, B. & Amoroso, L. Combating Micronutrient Deficiencies : Food-based
Approaches Edited by Defi ciencies : Food-based Approaches.
10. Central Statistical Agency. Household Consumption and Expenditure Survey 2010/2011.
(2011).
11. Gibson, R. S. & Ferguson, E. L. An interactive 24-hour recall for assessing the adequacy
of iron and zinc intakes in developing countries. (HarvestPlus, 2008).
12. EHNRI. Food Composition Table for Use in Ethiopia. Part III. (1998).
13. EHNRI. Food Composition Table for Use in Ethiopia. Part IV. (1998).
14. Abebe, Y. et al. Phytate, zinc, iron and calcium content of selected raw and prepared
foods consumed in rural Sidama, Southern Ethiopia, and implications for bioavailability.
J. Food Compos. Anal. 20, 161–168 (2007).
56
15. Umeta, M., West, C. E. & Fufa, H. Content of zinc, iron, calcium and their absorption
inhibitors in foods commonly consumed in Ethiopia. J. Food Compos. Anal. 18, 803–817
(2005).
16. Elaine L. Ferguson, Rosalind S. Gibson, Lilian U. Thompson, Stephanie Ounpuu, M. B.
Phytate, Zinc and Calcium contents of 30 East African foods and their calculated
Phytate:Zn, Ca:Phytate, and [Ca] [Phytate]/[Zinc] molar ratios. J. Food Compos. Anal. 1,
316–325 (1988).
17. WHO. Global Strategy on Infant and Young Child Feeding (WHA55 A55/15). World
Heal. Organ. http://www, 19 (2008).
18. Institute of Medicine. Dietary Reference Intakes: Applications in dietary planning.
Nutrition Reviews 55, (The National Academies Press, 2003).
19. Allen, L. & Benoist, B. De. Guidelines on food fortification with micronutrients.
20. Harvey, P. Determining the Dietary Patterns of Ugandan Women and Children. (2010).
21. Jahns, L., Arab, L., Carriquiry, A. & Popkin, B. M. The use of external within-person
variance estimates to adjust nutrient intake distributions over time and across populations.
Public Health Nutr. 8, 69–76 (2007).
22. Carriquiry, A. L. Future Directions for What We Eat in America – NHANES : The
Integrated CSFII-NHANES Estimation of Usual Intake Distributions of Nutrients and
Foods 1 , 2. 601–608 (2003).
23. Guenther, P. M., Kott, P. S. & Carriquiry, A. L. Community and International Nutrition
Development of an Approach for Estimating Usual Nutrient Intake Distributions at the
Population Level 1 , 2. 1106–1112 (1997).
24. S. M. Nusser, A. L. Carriquiry, K. W. D. and W. A. F. A Semiparametric Transformation
Approach to Estimating Usual Daily Intake Distributions. J. Am. Stat. Assoc. 91, 1440–
1449 (1996).
25. Federal Ministry of Health. Assessment of Feasibility and Potential Benefits of Food
Fortification in Ethiopia. (2011).
26. Ffi, T. H. E., Technical, S., On, W. & Fortification, F. Recommendations on Wheat and
Maize Flour Fortification Meeting Report : Interim Consensus Statement. 9–11 (2008).
27. WHO. New Child Growth Standards. (2006). doi:10.1037/e569412006-008
28. Lennernas, B. M. Dietary assessment and validity : To measure what is meant to measure.
Scand. J. Nutr. 42, 63–65 (1998).
57
29. Islam, R., Hossain, M., Rahman, M. & Hossain, M. Impact of Socio- demographic Factors
on Child Mortality in Bangladesh : An Multivariate Approach. Int. J. Psychol. Behav. Sci.
3, 34–39 (2013).
30. Who, J. & Consultation, F. A. O. E. Diet , Nutrition and the prevention of chronic diseases
Report of a Joint WHO / FAO Expert Consultation. (2003).
31. Labadarios, D. et al. The National Food Consumption Survey (NFCS): South Africa,
1999. Public Health Nutr. 8, 533–543 (2007).
32. Universities, I. & Alliance, N. North / South Ireland Food Consumption Survey About the
Irish Universities Nutrition Alliance.
33. National Institute for Public Health and Environment. Dutch National Foo Consumption
Survey. (2010).
34. Engle-Stone, R., Nankap, M., Ndjebayi, A. O. & Brown, K. H. Simulations based on
representative 24-h recall data predict region specific differences in adequacy of vitamin
A intake among Carmeroonian women and young children following large scale
fortification of vegetable oil and other potential food vehicles. J. Nutr. (2014).
doi:10.3945/jn.114.195354
35. Abebe, Y. et al. Inadequate intakes of dietary zinc among pregnant women from
subsistence households in Sidama , Southern Ethiopia. Public Health Nutr. 11, 379–386
(2007).
36. Gibson, R. S. et al. Zinc , Gravida , Infection , and Iron , but Not Vitamin B-12 or Folate
Status , Predict Hemoglobin during. J. Nutr. 581–586 (2008).
37. Leif Hallberg and Erik Bjorn. Measurement contaminated of iron absorption with iron1 ’ 2
from meals. Am. J. Clin. Nutr. 34, 2808–2815 (1981).

101-Date: |__|__|/|__|__|/2003; 102-EA: |__|__|__|; 103-HH number: |__|__|; DD / MM /YYYY National Food Consumption Survey-2003 (2011)
Form A - HOUSEHOLD INFORMATION, 24-HOUR DIETARY RECALL, ANTHROPOMETRY 1) The local guide will help the enumerators find the household, but will not participate in the interview unless needed as translator. 2) Confirm there is a child (6-35 months) with a mother/female caregiver (15-45 years) living in the household. If there is none, move to
the next household. A.1 – GENERAL INFORMATION: 104-Enumerator: |__|__|__|
# Question and text answers Data entry
105-Region (2) |__|__| 109- SubCity (1) (for |__|/ |__|
urban only)
&10103 Full number for rural/urban enumeration area: 106-Zone (2) |__|__| 110-Kebele/FA (3)- |__|__|__|
5- 107-Wereda (2)- |__|__| 111- EA (2)
|__|__|
111
108-Town(1) (for |__|/ |__| 103- Household (2) |__|__|
urban only)
Region: _______________________ SubCity (for urban only): _______________
NR
Zone: ________________________ Kebele/FA: _______________
Wereda: ______________________ EA: _______________
Town(for urban only): _______________ Household: _______________
111-Time commenced interview (use Ethiopian time); 112-
112 |__|__|:|__|__|
113 112-Day or Night (1 = Day[ 12:00 M-11:59 D)] ; 2=Night[12:00 N-11:59 N]) 113-|__|
113-Time ended interview 114-
114 |__|__|:|__|__|
115 114-Day or Night (1 = Day[ 12:00 M-11:59 D)] ; 2=Night[12:00 N-11:59 N]) 115-|__|
INTRODUCTION:
My name is _{name}_ and I am from the Ethiopian Health and Nutrition Research Institute
and the Federal Ministry of Health. We are conducting a food survey all over the country in
scientifically sampled areas. As part of this survey we are collecting information on the foods
consumed by women and young children.We would like to talk to the caregivers of children 6-
35 months of age? (If yes, continue. If no, thank them and move on. If more than one child, randomly select
116 the mother and child; then continue; if no caregiver for the child 15-45 months of age, then skip this house.)
All results will be kept confidential.
Do you have any questions?(If yes, answer their questions. If no, continue)
May we continue with the survey? (If yes, continue. If no, thank them and move on. Give form to
supervisor.)
Signature of interviewer ___________________________
116-Consent obtained? (1=Yes, 0=No) 116-|__|
117-Main reason given for not participating: (this is not essential, report only when the mother provides a 117-|__|
117 reason)(1=no time; 2=don’t want to let someone into house; 3=was told not to; 4=don’t want to participate in blood draw;
8=other________________; 9=unknown/none given)
118 Questionnaire status (1=completed interview, 2=partial completion, 3=not home, 4=refused, 5= awaiting 117-Visit 1: 118-|__|
119 signed consent, 8=other: Specify other/partial: ____________________, 9= no 2nd
visit) 118-Visit 2: 119-|__|
120 120-Primary spoken language? 1=Amharigna, 2=Oromigna, 3=Tigrigna, 8=other, Specify:___________________ 120-|__|
121 121-Translator used? (0=No, 1=Yes) 121-|__|
122 122- Day of week (1=Su,2=Mo,3=Tu,4=We,5=Th,6=Fr,7=Sa) 122-|__|
NR-Name of head of household (HofH):____________________
123-Is the woman interviewed the head of household?(0=No, 1=Yes, if “yes”) 123-|__|
123
Supervisor |__|__|__| SDate: |__|__|/|__|__|/’11 Coder: |__|__|__| CDate: |__|__|/|__|__|/’11 Data2: |__|__|__|
Region. Coord: |__|__|__| RCDate: |__|__|/|__|__|/ ’11 Data1: |__|__|__| Date1: |__|__|/|__|__|/’11 Date2: |__|__|/|__|__|/’11

101-Date: |__|__|/|__|__|/2003; 102-EA: |__|__|__|; 103-HH number: |__|__|;
DD / MM /YYYY National Food Consumption Survey-2003 (2011)
Question) 124-130Mother/ female 131– 137 Head of Household or male 138-140-Child
participant (if not mother)
NR Name
DOB: OR reported 124-|__|__|/|__|__| /19|__|__| 131-|__|__|/|__|__| /19|_|__| 138-|__|__|/|__|__| /20|__|__|
years/ months: 125-|__|__| years 132-|__|__| years 139-|__|__| months
DOB confirmed: 126-|__| confirmed(1=yes, 0=no) 133-|__| confirmed(1=yes, 0=no) 140-|__| confirmed(1=yes, 0=no)
127& Relationship to 127-|__| 134-|__| (1=mother, 2=other female caregiver, 3=father, 4=male caregiver)
134 child:
128& Education 128-|__| 135-|__| 1=illiterate, 2= can read and write, 3=Primary school , Cycle1 (G:1-4),
135 completed: 4= primary school cycle2 (G:5-8), = High school, = other (Specify)
______________
129& Did you contribute 129-|__| 136-|__| This refers to the past 12 months
136 to the HH income (0=No, 1=Yes,9=unknown)
this past year?
130& What type of 130-|__|__| 137-|__|__| (01=Self-employed (formal), 02=Self-employed (informal),
137 employment? 03=Employed (formal), 04=Employed (informal), 05=Public
enterprise, 06=Public service, 07=NGO/International
org,08=Household, 09=unpaid family worker,
88=Other_______________________,99=unknown)
A.2 – HOUSEHOLD INFORMATION
141 |__| 141- What is your source of drinking water?(1=pipe/ treated with chemicals; 2=protected river/ stream;3=river, not protected;
4=stagnant water, 5=rain water collection/ plastic covered,6= well, 7=Municipal vehicle, 8=other: specify: _____________, 9=unknown)
142 |__| 142-How far is itto your source of water?(0= in the house, 1=less than 15 minutes, 2=15-30 minutes, 3=30-60 minutes, 4= more
than 1 hour, 8=other:__________________ 9=unknown) OR answer #143:
|__| 143- If time to water source unknown (#142), estimate the distance Used if cannot answer #142 codes: 0=no time required, in the
143 house; 1=extremely short time, in the compound; 2=short distance to local source; 3=requires a significant amount of time, but close enough
for daily access; 4= too far for daily access; 9=unknown
|__| 144- How do you light your house?
144 (0=no light, 1=fire, 2=lantern/ beer can with gas/candle, 3=battery, 4=generator, 5=biogas, 6=electricity, 8=other:_________________,
9=unknown)
145 145-|__| What are the building 145- Floor(specify if 8:______________) 0=none, 1=dirt, 2=plastic, 3=local brick, 4=wood,
-
146-|__| materials for the
146- Walls(specify if 8:______________)
5=cement/cement brick, 6=improved cement/wood
147 (e.g. painted, etc.), 7=tile/ rug/ wall paper, 8=other
147-|__| house?
147- Inside ceiling (specify if 8:___________)
(specify beside floor, walls or ceiling), 9=unknown
1=no roof, 2=plastic, 3=thatch, 4=wood,
148 148-|__|
148- Roof (specify if 8___________) 5=cement/cement brick, 6=improved cement/
wood(e.g. waterproofed), 7=tile, 8=other(specify
beside “roof”), 9=unknown
149 149- |__| What cooking methods do you use? Enter up to 3 main methods used.
- 150- |__| 1=gathered dung/wood, 2=purchased wood/charcoal, 3=kerosene/ other liquid fuel, 4=electricity, 5=gas, 8=other(specify if
151 151- |__| 8:___________________), 9=unknown
152 |__| Do you cook in the same room as your living quarters? (0= No, 1=Yes)
153 |__| Where do the animals sleep? 1=inside the family living quarters, 2= outside/ no specific shelter, 3= outside, open shelter (just
walls), 4= outside/ with a covering overhead, 9=unknown
154- |__|
Do you own any of the following items? (yes=1, no=0) 158-|__| 158- Vehicle that works
154– 154- Radio that works 159-|__| 159- Electric Injera baker that works
155- |__| 155- Television that works
160-|__| 160- Stove that works
161
156- |__| 156- Cellular phone that works 161-|__| 161- Electric oven that works
157- |__| 157- Bicycle that works
A.3 – HEALTH/SUPPLEMENTARY QUESTIONS
1= yes; 2 =
No; 9
=unknown
170 Is your child currently breastfeeding? |__|
171 Was your child sick in the past day? |__| If “yes” continue, if “no” skip to number 177(only yesterday
to today)
Supervisor |__|__|__| SDate: |__|__|/|__|__|/’11 Coder: |__|__|__| CDate: |__|__|/|__|__|/’11 Data2: |__|__|__|
Region. Coord: |__|__|__| RCDate: |__|__|/|__|__|/ ’11 Data1: |__|__|__| Date1: |__|__|/|__|__|/’11 Date2: |__|__|/|__|__|/’11
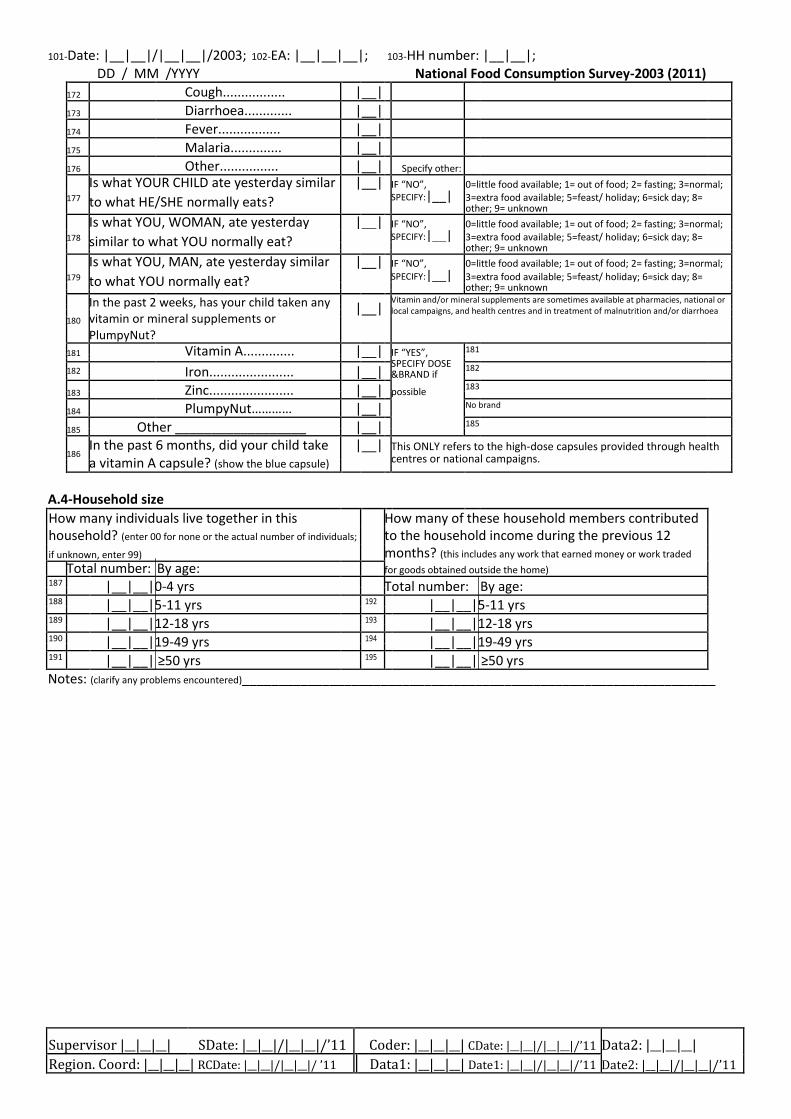
101-Date: |__|__|/|__|__|/2003; 102-EA: |__|__|__|; 103-HH number: |__|__|;
DD / MM /YYYY National Food Consumption Survey-2003 (2011)
172 Cough................. |__|
173 Diarrhoea............. |__|
174 Fever................. |__|
175 Malaria.............. |__|
176 Other................ |__| Specify other:
Is what YOUR CHILD ate yesterday similar |__| IF “NO”, 0=little food available; 1= out of food; 2= fasting; 3=normal;
177 to what HE/SHE normally eats? SPECIFY:|__| 3=extra food available; 5=feast/ holiday; 6=sick day; 8=
other; 9= unknown
Is what YOU, WOMAN, ate yesterday |__| IF “NO”, 0=little food available; 1= out of food; 2= fasting; 3=normal;
178 similar to what YOU normally eat? SPECIFY:|__| 3=extra food available; 5=feast/ holiday; 6=sick day; 8=
other; 9= unknown
Is what YOU, MAN, ate yesterday similar |__| IF “NO”, 0=little food available; 1= out of food; 2= fasting; 3=normal;
179 to what YOU normally eat? SPECIFY:|__| 3=extra food available; 5=feast/ holiday; 6=sick day; 8=
other; 9= unknown
In the past 2 weeks, has your child taken any |__| Vitamin and/or mineral supplements are sometimes available at pharmacies, national or
local campaigns, and health centres and in treatment of malnutrition and/or diarrhoea
180 vitamin or mineral supplements or
PlumpyNut?
181 Vitamin A.............. |__| IF “YES”, 181
SPECIFY DOSE
182
Iron....................... |__| 182
&BRAND if
183 Zinc....................... |__| possible 183
184 PlumpyNut………… |__| No brand
185 Other __________________ |__| 185
186 In the past 6 months, did your child take |__| This ONLY refers to the high-dose capsules provided through health
a vitamin A capsule? (show the blue capsule) centres or national campaigns.
A.4-Household size
How many individuals live together in this How many of these household members contributed
household? (enter 00 for none or the actual number of individuals; to the household income during the previous 12
if unknown, enter 99) months? (this includes any work that earned money or work traded
Total number: By age: for goods obtained outside the home)
187 |__|__|0-4 yrs Total number: By age:
188 |__|__|5-11 yrs 192 |__|__|5-11 yrs
189 |__|__|12-18 yrs 193 |__|__|12-18 yrs
190 |__|__|19-49 yrs 194 |__|__|19-49 yrs
191 |__|__| ≥50 yrs 195 |__|__| ≥50 yrs
Notes: (clarify any problems encountered)_________________________________________________________________
Supervisor |__|__|__| SDate: |__|__|/|__|__|/’11 Coder: |__|__|__| CDate: |__|__|/|__|__|/’11 Data2: |__|__|__|
Region. Coord: |__|__|__| RCDate: |__|__|/|__|__|/ ’11 Data1: |__|__|__| Date1: |__|__|/|__|__|/’11 Date2: |__|__|/|__|__|/’11
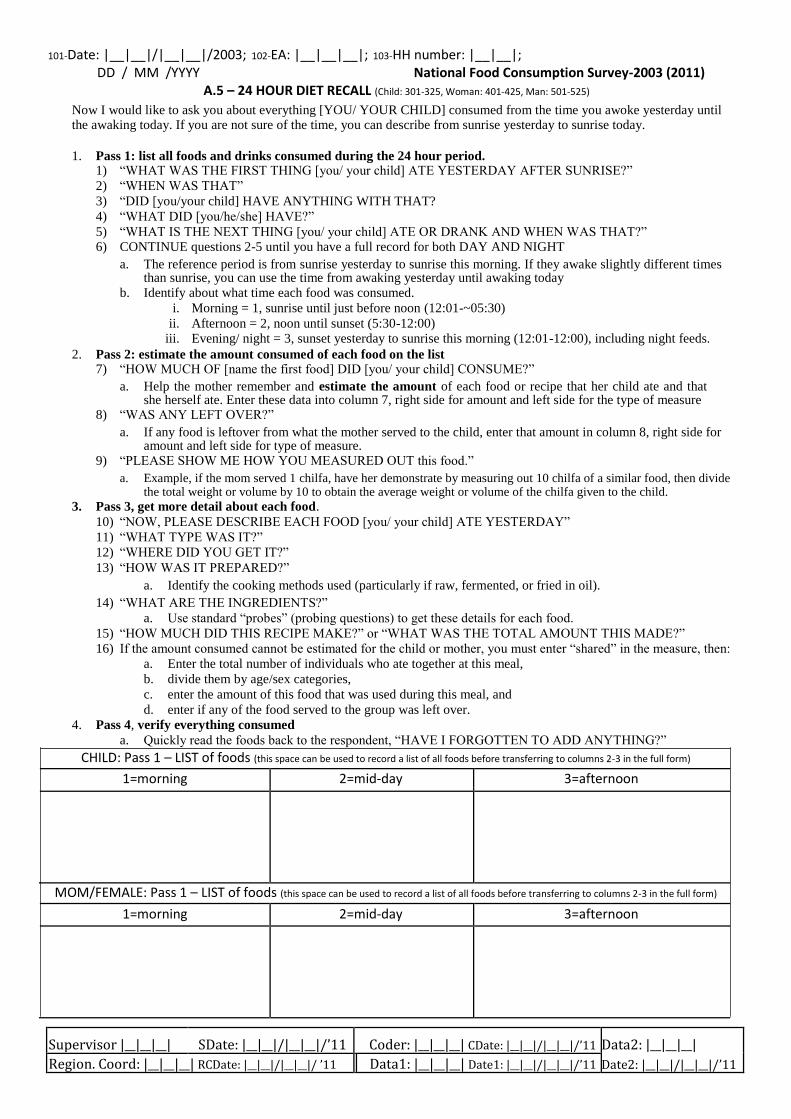
101-Date: |__|__|/|__|__|/2003; 102-EA: |__|__|__|; 103-HH number: |__|__|; DD / MM /YYYY National Food Consumption Survey-2003 (2011)
A.5 – 24 HOUR DIET RECALL (Child: 301-325, Woman: 401-425, Man: 501-525) Now I would like to ask you about everything [YOU/ YOUR CHILD] consumed from the time you awoke yesterday until the awaking today. If you are not sure of the time, you can describe from sunrise yesterday to sunrise today.
1. Pass 1: list all foods and drinks consumed during the 24 hour period.
1) “WHAT WAS THE FIRST THING [you/ your child] ATE YESTERDAY AFTER SUNRISE?”
2) “WHEN WAS THAT” 3) “DID [you/your child] HAVE ANYTHING WITH THAT? 4) “WHAT DID [you/he/she] HAVE?” 5) “WHAT IS THE NEXT THING [you/ your child] ATE OR DRANK AND WHEN WAS THAT?” 6) CONTINUE questions 2-5 until you have a full record for both DAY AND NIGHT
a. The reference period is from sunrise yesterday to sunrise this morning. If they awake slightly different times than sunrise, you can use the time from awaking yesterday until awaking today
b. Identify about what time each food was consumed. i. Morning = 1, sunrise until just before noon (12:01-~05:30)
ii. Afternoon = 2, noon until sunset (5:30-12:00) iii. Evening/ night = 3, sunset yesterday to sunrise this morning (12:01-12:00), including night feeds.
2. Pass 2: estimate the amount consumed of each food on the list 7) “HOW MUCH OF [name the first food] DID [you/ your child] CONSUME?”
a. Help the mother remember and estimate the amount of each food or recipe that her child ate and that she herself ate. Enter these data into column 7, right side for amount and left side for the type of measure
8) “WAS ANY LEFT OVER?” a. If any food is leftover from what the mother served to the child, enter that amount in column 8, right side for
amount and left side for type of measure. 9) “PLEASE SHOW ME HOW YOU MEASURED OUT this food.”
a. Example, if the mom served 1 chilfa, have her demonstrate by measuring out 10 chilfa of a similar food, then divide the total weight or volume by 10 to obtain the average weight or volume of the chilfa given to the child.
3. Pass 3, get more detail about each food. 10) “NOW, PLEASE DESCRIBE EACH FOOD [you/ your child] ATE YESTERDAY” 11) “WHAT TYPE WAS IT?” 12) “WHERE DID YOU GET IT?” 13) “HOW WAS IT PREPARED?”
a. Identify the cooking methods used (particularly if raw, fermented, or fried in oil). 14) “WHAT ARE THE INGREDIENTS?”
a. Use standard “probes” (probing questions) to get these details for each food. 15) “HOW MUCH DID THIS RECIPE MAKE?” or “WHAT WAS THE TOTAL AMOUNT THIS MADE?” 16) If the amount consumed cannot be estimated for the child or mother, you must enter “shared” in the measure, then:
a. Enter the total number of individuals who ate together at this meal, b. divide them by age/sex categories, c. enter the amount of this food that was used during this meal, and d. enter if any of the food served to the group was left over.
4. Pass 4, verify everything consumed a. Quickly read the foods back to the respondent, “HAVE I FORGOTTEN TO ADD ANYTHING?”
CHILD: Pass 1 – LIST of foods (this space can be used to record a list of all foods before transferring to columns 2-3 in the full form) 1=morning 2=mid-day 3=afternoon
MOM/FEMALE: Pass 1 – LIST of foods (this space can be used to record a list of all foods before transferring to columns 2-3 in the full form) 1=morning 2=mid-day 3=afternoon
Supervisor |__|__|__| SDate: |__|__|/|__|__|/’11 Coder: |__|__|__| CDate: |__|__|/|__|__|/’11 Data2: |__|__|__|
Region. Coord: |__|__|__| RCDate: |__|__|/|__|__|/ ’11 Data1: |__|__|__| Date1: |__|__|/|__|__|/’11 Date2: |__|__|/|__|__|/’11
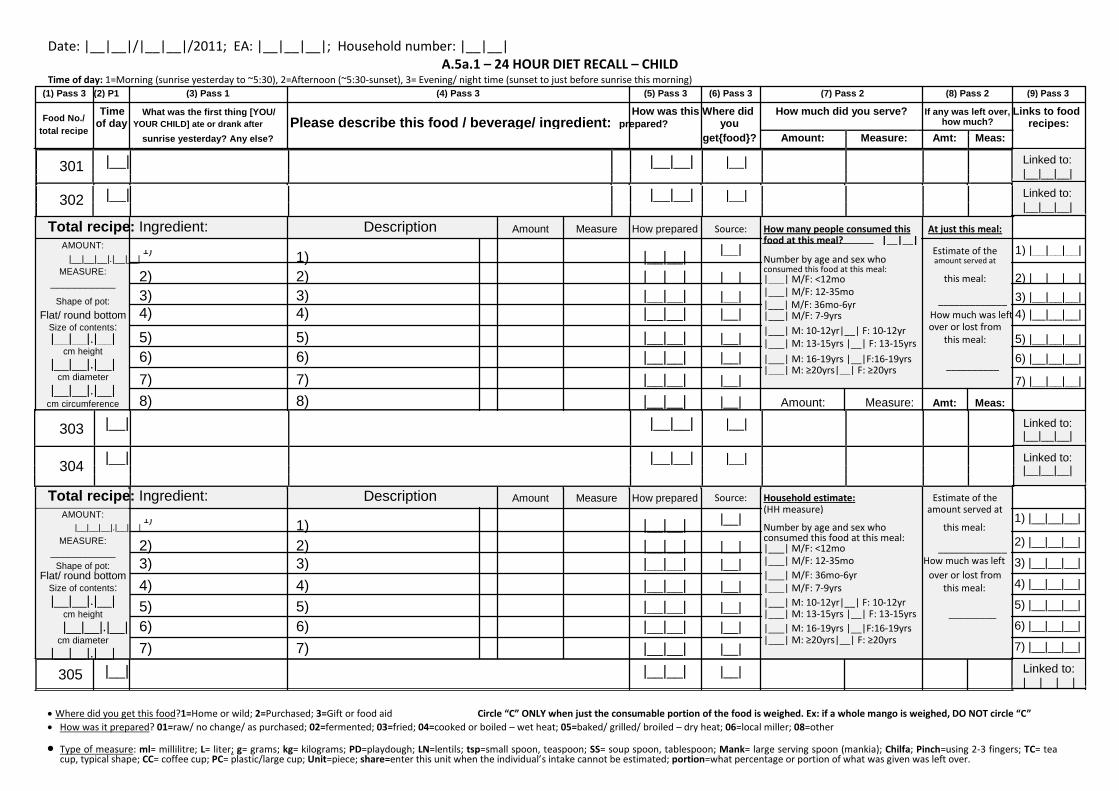
Date: |__|__|/|__|__|/2011; EA: |__|__|__|; Household number: |__|__| A.5a.1 – 24 HOUR DIET RECALL – CHILD
Time of day: 1=Morning (sunrise yesterday to ~5:30), 2=Afternoon (~5:30-sunset), 3= Evening/ night time (sunset to just before sunrise this morning) (1) Pass 3 (2) P1 (3) Pass 1 (4) Pass 3 (5) Pass 3 (6) Pass 3 (7) Pass 2 (8) Pass 2 (9) Pass 3
Food No./ Time What was the first thing [YOU/ How was this Where did How much did you serve? If any was left over, Links to food
of day YOUR CHILD] ate or drank after Please describe this food / beverage/ ingredient: prepared? you how much? recipes:
total recipe
sunrise yesterday? Any else?
get{food}? Amount: Measure: Amt: Meas:
301 |__| |__|__| |__|
302
|__| |__|__| |__|
Linked to: |__|__|__| Linked to: |__|__|__|
Total recipe: Ingredient: Description Amount Measure How prepared Source: How many people consumed this At just this meal:
AMOUNT:
|__|__| |__|
food at this meal? |__|__| Estimate of the 1) |__|__|__|
|__|__|__|.|__|__| 1)
1)
Number by age and sex who
amount served at
MEASURE: 2) 2)
|__|__| |__| consumed this food at this meal:
this meal: 2) |__|__|__|
|___| M/F: <12mo
___________
|___| M/F: 12-35mo
Shape of pot: 3) 3) |__|__| |__| _____________ 3) |__|__|__|
|___| M/F: 36mo-6yr
Flat/ round bottom 4) 4)
|__|__| |__|
How much was left 4) |__|__|__|
|___| M/F: 7-9yrs
Size of contents: 5) 5)
|__|__| |__| |___| M: 10-12yr|__| F: 10-12yr over or lost from
5) |__|__|__|
|__|__|.|__|
this meal:
|___| M: 13-15yrs |__| F: 13-15yrs
cm height
6) 6) |__|__| |__| |___| M: 16-19yrs |__|F:16-19yrs
6) |__|__|__| |__|__|.|__|
__________
|___| M: ≥20yrs|__| F: ≥20yrs
cm diameter 7) 7)
|__|__| |__|
7) |__|__|__|
|__|__|.|__|
8) 8)
|__|__| |__| Amount: Measure: Amt: Meas:
cm circumference
303 |__| |__|__| |__|
304 |__| |__|__| |__|
Total recipe: Ingredient: Description Amount Measure How prepared Source: Household estimate: Estimate of the
AMOUNT:
|__|__| |__| (HH measure) amount served at
|__|__|__|.|__|__| 1)
1) Number by age and sex who this meal:
MEASURE: 2) 2)
|__|__| |__| consumed this food at this meal:
|___| M/F: <12mo _____________ ___________
|___| M/F: 12-35mo How much was left
Shape of pot: 3) 3) |__|__| |__|
|___| M/F: 36mo-6yr over or lost from
Flat/ round bottom 4) 4)
|__|__| |__|
Size of contents: |___| M/F: 7-9yrs this meal:
|__|__|.|__| 5) 5) |__|__| |__| |___| M: 10-12yr|__| F: 10-12yr
cm height |___| M: 13-15yrs |__| F: 13-15yrs _________
|__|__|.|__| 6) 6) |__|__| |__| |___| M: 16-19yrs |__|F:16-19yrs
cm diameter 7) 7)
|__|__| |__|
|___| M: ≥20yrs|__| F: ≥20yrs
|__|__|.|__|
305 |__| |__|__| |__|
Linked to: |__|__|__|
Linked to: |__|__|__|
1) |__|__|__| 2) |__|__|__| 3) |__|__|__| 4) |__|__|__| 5) |__|__|__| 6) |__|__|__| 7) |__|__|__|
Linked to: |__|__|__|
Where did you get this food?1=Home or wild; 2=Purchased; 3=Gift or food aid Circle “C” ONLY when just the consumable portion of the food is weighed. Ex: if a whole mango is weighed, DO NOT circle “C” How was it prepared? 01=raw/ no change/ as purchased; 02=fermented; 03=fried; 04=cooked or boiled – wet heat; 05=baked/ grilled/ broiled – dry heat; 06=local miller; 08=other
Type of measure: ml= millilitre; L= liter; g= grams; kg= kilograms; PD=playdough; LN=lentils; tsp=small spoon, teaspoon; SS= soup spoon, tablespoon; Mank= large serving spoon (mankia); Chilfa; Pinch=using 2-3 fingers; TC= tea cup, typical shape; CC= coffee cup; PC= plastic/large cup; Unit=piece; share=enter this unit when the individual’s intake cannot be estimated; portion=what percentage or portion of what was given was left over.
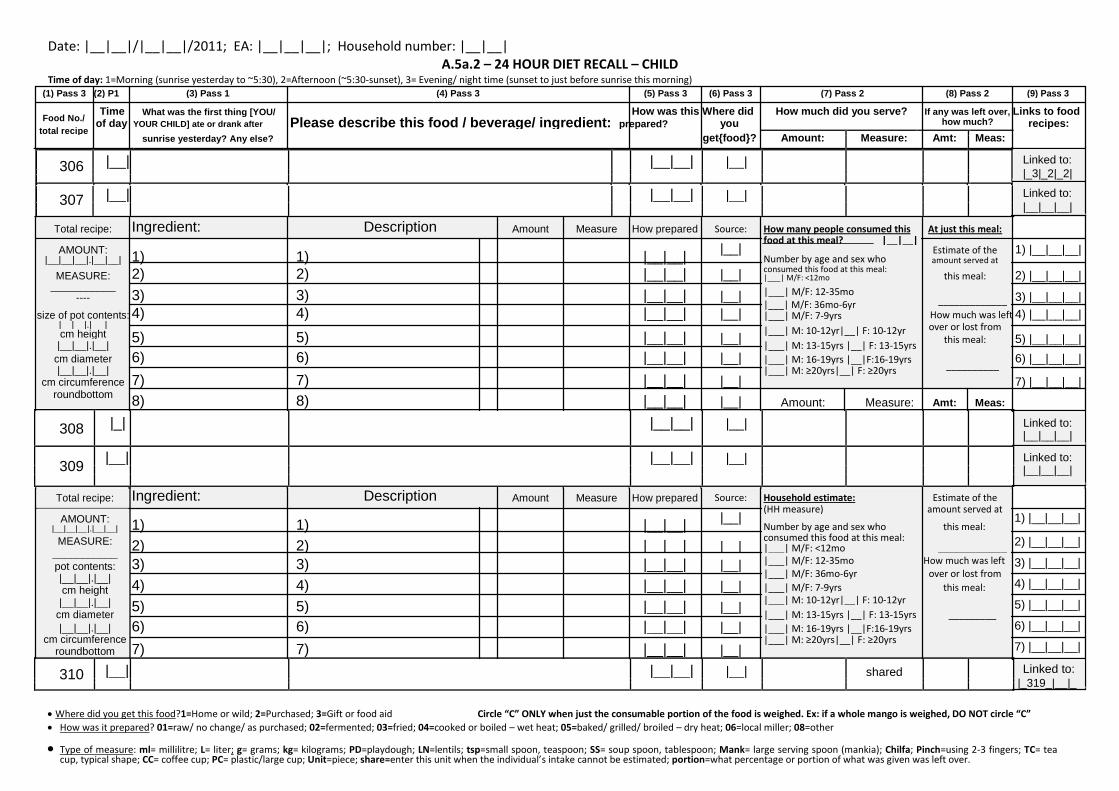
Date: |__|__|/|__|__|/2011; EA: |__|__|__|; Household number: |__|__| A.5a.2 – 24 HOUR DIET RECALL – CHILD
Time of day: 1=Morning (sunrise yesterday to ~5:30), 2=Afternoon (~5:30-sunset), 3= Evening/ night time (sunset to just before sunrise this morning) (1) Pass 3 (2) P1 (3) Pass 1 (4) Pass 3 (5) Pass 3 (6) Pass 3 (7) Pass 2 (8) Pass 2 (9) Pass 3
Food No./ Time What was the first thing [YOU/ How was this Where did How much did you serve? If any was left over, Links to food
of day YOUR CHILD] ate or drank after Please describe this food / beverage/ ingredient: prepared? you how much? recipes:
total recipe
sunrise yesterday? Any else?
get{food}? Amount: Measure: Amt: Meas:
306 |__| |__|__| |__|
307
|__| |__|__| |__|
Linked to: |_3|_2|_2| Linked to: |__|__|__|
Total recipe: Ingredient: Description Amount Measure How prepared Source: How many people consumed this At just this meal:
AMOUNT: 1) 1)
|__|__| |__|
food at this meal? |__|__| Estimate of the 1) |__|__|__|
Number by age and sex who
|__|__|__|.|__|__| amount served at
MEASURE: 2) 2) |__|__| |__| consumed this food at this meal: this meal: 2) |__|__|__| |___| M/F: <12mo
___________ 3) 3)
|__|__| |__| |___| M/F: 12-35mo
3) |__|__|__|
----
_____________
|___| M/F: 36mo-6yr
size of pot contents:
4) 4)
|__|__| |__|
How much was left 4) |__|__|__|
|___| M/F: 7-9yrs
|__|__|.|__ | |___| M: 10-12yr|__| F: 10-12yr over or lost from
cm height 5) 5)
|__|__| |__| 5) |__|__|__|
this meal:
|___| M: 13-15yrs |__| F: 13-15yrs
|__|__|.|__|
cm diameter 6) 6) |__|__| |__| |___| M: 16-19yrs |__|F:16-19yrs __________ 6) |__|__|__|
|__|__|.|__| |___| M: ≥20yrs|__| F: ≥20yrs
7) 7)
|__|__| |__|
7) |__|__|__|
cm circumference
roundbottom 8) 8)
|__|__| |__| Amount: Measure: Amt: Meas:
308 |_| |__|__| |__|
309 |__| |__|__| |__|
Total recipe: Ingredient: Description Amount Measure How prepared Source: Household estimate: Estimate of the
AMOUNT: 1) 1)
|__|__| |__|
(HH measure) amount served at
Number by age and sex who this meal:
|__|__|__|.|__|__|
MEASURE: 2) 2)
|__|__| |__| consumed this food at this meal:
|___| M/F: <12mo _____________ ___________
3) 3)
|__|__| |__| |___| M/F: 12-35mo How much was left
pot contents:
|___| M/F: 36mo-6yr over or lost from
|__|__|.|__| 4) 4)
|__|__| |__|
|___| M/F: 7-9yrs this meal:
cm height
|___| M: 10-12yr|__| F: 10-12yr
|__|__|.|__| 5) 5)
|__|__| |__|
|___| M: 13-15yrs |__| F: 13-15yrs _________
cm diameter
|__|__|.|__| 6) 6) |__|__| |__| |___| M: 16-19yrs |__|F:16-19yrs
cm circumference 7) 7)
|__|__| |__| |___| M: ≥20yrs|__| F: ≥20yrs
roundbottom
Linked to: |__|__|__|
Linked to: |__|__|__|
1) |__|__|__| 2) |__|__|__| 3) |__|__|__| 4) |__|__|__| 5) |__|__|__| 6) |__|__|__| 7) |__|__|__|
310 |__| |__|__| |__| shared
Linked to:
|_319_|__|_ Where did you get this food?1=Home or wild; 2=Purchased; 3=Gift or food aid Circle “C” ONLY when just the consumable portion of the food is weighed. Ex: if a whole mango is weighed, DO NOT circle “C” How was it prepared? 01=raw/ no change/ as purchased; 02=fermented; 03=fried; 04=cooked or boiled – wet heat; 05=baked/ grilled/ broiled – dry heat; 06=local miller; 08=other
Type of measure: ml= millilitre; L= liter; g= grams; kg= kilograms; PD=playdough; LN=lentils; tsp=small spoon, teaspoon; SS= soup spoon, tablespoon; Mank= large serving spoon (mankia); Chilfa; Pinch=using 2-3 fingers; TC= tea cup, typical shape; CC= coffee cup; PC= plastic/large cup; Unit=piece; share=enter this unit when the individual’s intake cannot be estimated; portion=what percentage or portion of what was given was left over.
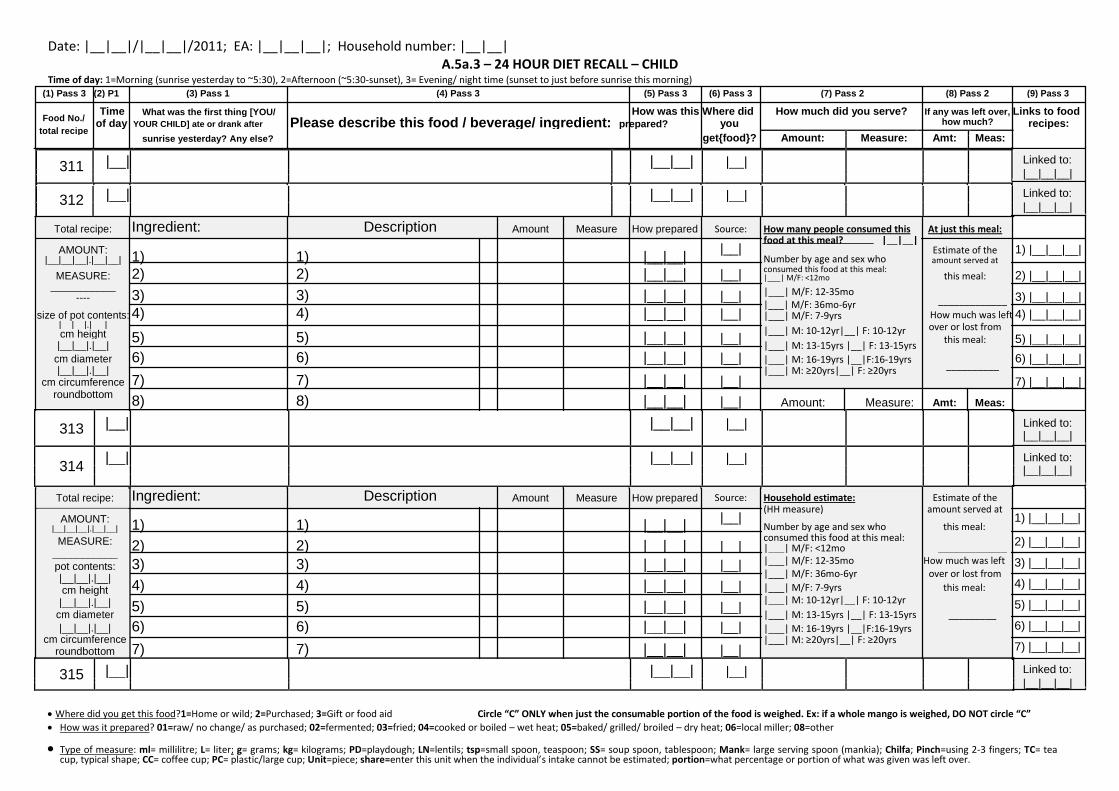
Date: |__|__|/|__|__|/2011; EA: |__|__|__|; Household number: |__|__| A.5a.3 – 24 HOUR DIET RECALL – CHILD
Time of day: 1=Morning (sunrise yesterday to ~5:30), 2=Afternoon (~5:30-sunset), 3= Evening/ night time (sunset to just before sunrise this morning) (1) Pass 3 (2) P1 (3) Pass 1 (4) Pass 3 (5) Pass 3 (6) Pass 3 (7) Pass 2 (8) Pass 2 (9) Pass 3
Food No./ Time What was the first thing [YOU/ How was this Where did How much did you serve? If any was left over, Links to food
of day YOUR CHILD] ate or drank after Please describe this food / beverage/ ingredient: prepared? you how much? recipes:
total recipe
sunrise yesterday? Any else?
get{food}? Amount: Measure: Amt: Meas:
311 |__| |__|__| |__|
312
|__| |__|__| |__|
Linked to: |__|__|__| Linked to: |__|__|__|
Total recipe: Ingredient: Description Amount Measure How prepared Source: How many people consumed this At just this meal:
AMOUNT: 1) 1)
|__|__| |__|
food at this meal? |__|__| Estimate of the 1) |__|__|__|
Number by age and sex who
|__|__|__|.|__|__| amount served at
MEASURE: 2) 2) |__|__| |__| consumed this food at this meal: this meal: 2) |__|__|__| |___| M/F: <12mo
___________ 3) 3)
|__|__| |__| |___| M/F: 12-35mo
3) |__|__|__|
----
_____________
|___| M/F: 36mo-6yr
size of pot contents:
4) 4)
|__|__| |__|
How much was left 4) |__|__|__|
|___| M/F: 7-9yrs
|__|__|.|__ | |___| M: 10-12yr|__| F: 10-12yr over or lost from
cm height 5) 5)
|__|__| |__| 5) |__|__|__|
this meal:
|___| M: 13-15yrs |__| F: 13-15yrs
|__|__|.|__|
cm diameter 6) 6) |__|__| |__| |___| M: 16-19yrs |__|F:16-19yrs __________ 6) |__|__|__|
|__|__|.|__| |___| M: ≥20yrs|__| F: ≥20yrs
7) 7)
|__|__| |__|
7) |__|__|__|
cm circumference
roundbottom 8) 8)
|__|__| |__| Amount: Measure: Amt: Meas:
313 |__| |__|__| |__|
314 |__| |__|__| |__|
Total recipe: Ingredient: Description Amount Measure How prepared Source: Household estimate: Estimate of the
AMOUNT: 1) 1)
|__|__| |__|
(HH measure) amount served at
Number by age and sex who this meal:
|__|__|__|.|__|__|
MEASURE: 2) 2)
|__|__| |__| consumed this food at this meal:
|___| M/F: <12mo _____________ ___________
3) 3)
|__|__| |__| |___| M/F: 12-35mo How much was left
pot contents:
|___| M/F: 36mo-6yr over or lost from
|__|__|.|__| 4) 4)
|__|__| |__|
|___| M/F: 7-9yrs this meal:
cm height
|___| M: 10-12yr|__| F: 10-12yr
|__|__|.|__| 5) 5)
|__|__| |__|
|___| M: 13-15yrs |__| F: 13-15yrs _________
cm diameter
|__|__|.|__| 6) 6) |__|__| |__| |___| M: 16-19yrs |__|F:16-19yrs
cm circumference 7) 7)
|__|__| |__| |___| M: ≥20yrs|__| F: ≥20yrs
roundbottom
Linked to: |__|__|__|
Linked to: |__|__|__|
1) |__|__|__| 2) |__|__|__| 3) |__|__|__| 4) |__|__|__| 5) |__|__|__| 6) |__|__|__| 7) |__|__|__|
315 |__| |__|__| |__|
Linked to: |__|__|__|
Where did you get this food?1=Home or wild; 2=Purchased; 3=Gift or food aid Circle “C” ONLY when just the consumable portion of the food is weighed. Ex: if a whole mango is weighed, DO NOT circle “C” How was it prepared? 01=raw/ no change/ as purchased; 02=fermented; 03=fried; 04=cooked or boiled – wet heat; 05=baked/ grilled/ broiled – dry heat; 06=local miller; 08=other
Type of measure: ml= millilitre; L= liter; g= grams; kg= kilograms; PD=playdough; LN=lentils; tsp=small spoon, teaspoon; SS= soup spoon, tablespoon; Mank= large serving spoon (mankia); Chilfa; Pinch=using 2-3 fingers; TC= tea cup, typical shape; CC= coffee cup; PC= plastic/large cup; Unit=piece; share=enter this unit when the individual’s intake cannot be estimated; portion=what percentage or portion of what was given was left over.

Date: |__|__|/|__|__|/2011; EA: |__|__|__|; Household number: |__|__| A.5a.4 – 24 HOUR DIET RECALL – CHILD
Time of day: 1=Morning (sunrise yesterday to ~5:30), 2=Afternoon (~5:30-sunset), 3= Evening/ night time (sunset to just before sunrise this morning) (1) Pass 3 (2) P1 (3) Pass 1 (4) Pass 3 (5) Pass 3 (6) Pass 3 (7) Pass 2 (8) Pass 2 (9) Pass 3
Food No./ Time What was the first thing [YOU/ How was this Where did How much did you serve? If any was left over, Links to food
of day YOUR CHILD] ate or drank after Please describe this food / beverage/ ingredient: prepared? you how much? recipes:
total recipe
sunrise yesterday? Any else?
get{food}? Amount: Measure: Amt: Meas:
316 |__| |__|__| |__|
317
|__| |__|__| |__|
Linked to: |__|__|__| Linked to: |__|__|__|
Total recipe: Ingredient: Description Amount Measure How prepared Source: How many people consumed this At just this meal:
AMOUNT: 1) 1)
|__|__| |__|
food at this meal? |__|__| Estimate of the 1) |__|__|__|
Number by age and sex who
|__|__|__|.|__|__| amount served at
MEASURE: 2) 2) |__|__| |__| consumed this food at this meal: this meal: 2) |__|__|__| |___| M/F: <12mo
___________ 3) 3)
|__|__| |__| |___| M/F: 12-35mo
3) |__|__|__|
----
_____________
|___| M/F: 36mo-6yr
size of pot contents:
4) 4)
|__|__| |__|
How much was left 4) |__|__|__|
|___| M/F: 7-9yrs
|__|__|.|__ | |___| M: 10-12yr|__| F: 10-12yr over or lost from
cm height 5) 5)
|__|__| |__| 5) |__|__|__|
this meal:
|___| M: 13-15yrs |__| F: 13-15yrs
|__|__|.|__|
cm diameter 6) 6) |__|__| |__| |___| M: 16-19yrs |__|F:16-19yrs __________ 6) |__|__|__|
|__|__|.|__| |___| M: ≥20yrs|__| F: ≥20yrs
7) 7)
|__|__| |__|
7) |__|__|__|
cm circumference
roundbottom 8) 8)
|__|__| |__| Amount: Measure: Amt: Meas:
318 |__| |__|__| |__|
319 |__| |__|__| |__|
Total recipe: Ingredient: Description Amount Measure How prepared Source: Household estimate: Estimate of the
AMOUNT: 1) 1)
|__|__| |__|
(HH measure) amount served at
Number by age and sex who this meal:
|__|__|__|.|__|__|
MEASURE: 2) 2)
|__|__| |__| consumed this food at this meal:
|___| M/F: <12mo _____________ ___________
3) 3)
|__|__| |__| |___| M/F: 12-35mo How much was left
pot contents:
|___| M/F: 36mo-6yr over or lost from
|__|__|.|__| 4) 4)
|__|__| |__|
|___| M/F: 7-9yrs this meal:
cm height
|___| M: 10-12yr|__| F: 10-12yr
|__|__|.|__| 5) 5)
|__|__| |__|
|___| M: 13-15yrs |__| F: 13-15yrs _________
cm diameter
|__|__|.|__| 6) 6) |__|__| |__| |___| M: 16-19yrs |__|F:16-19yrs
cm circumference 7) 7)
|__|__| |__| |___| M: ≥20yrs|__| F: ≥20yrs
roundbottom
Linked to: |__|__|__|
Linked to: |__|__|__|
1) |__|__|__| 2) |__|__|__| 3) |__|__|__| 4) |__|__|__| 5) |__|__|__| 6) |__|__|__| 7) |__|__|__|
320 |__| |__|__| |__|
Linked to: |__|__|__|
Where did you get this food?1=Home or wild; 2=Purchased; 3=Gift or food aid Circle “C” ONLY when just the consumable portion of the food is weighed. Ex: if a whole mango is weighed, DO NOT circle “C” How was it prepared? 01=raw/ no change/ as purchased; 02=fermented; 03=fried; 04=cooked or boiled – wet heat; 05=baked/ grilled/ broiled – dry heat; 06=local miller; 08=other
Type of measure: ml= millilitre; L= liter; g= grams; kg= kilograms; PD=playdough; LN=lentils; tsp=small spoon, teaspoon; SS= soup spoon, tablespoon; Mank= large serving spoon (mankia); Chilfa; Pinch=using 2-3 fingers; TC= tea cup, typical shape; CC= coffee cup; PC= plastic/large cup; Unit=piece; share=enter this unit when the individual’s intake cannot be estimated; portion=what percentage or portion of what was given was left over.
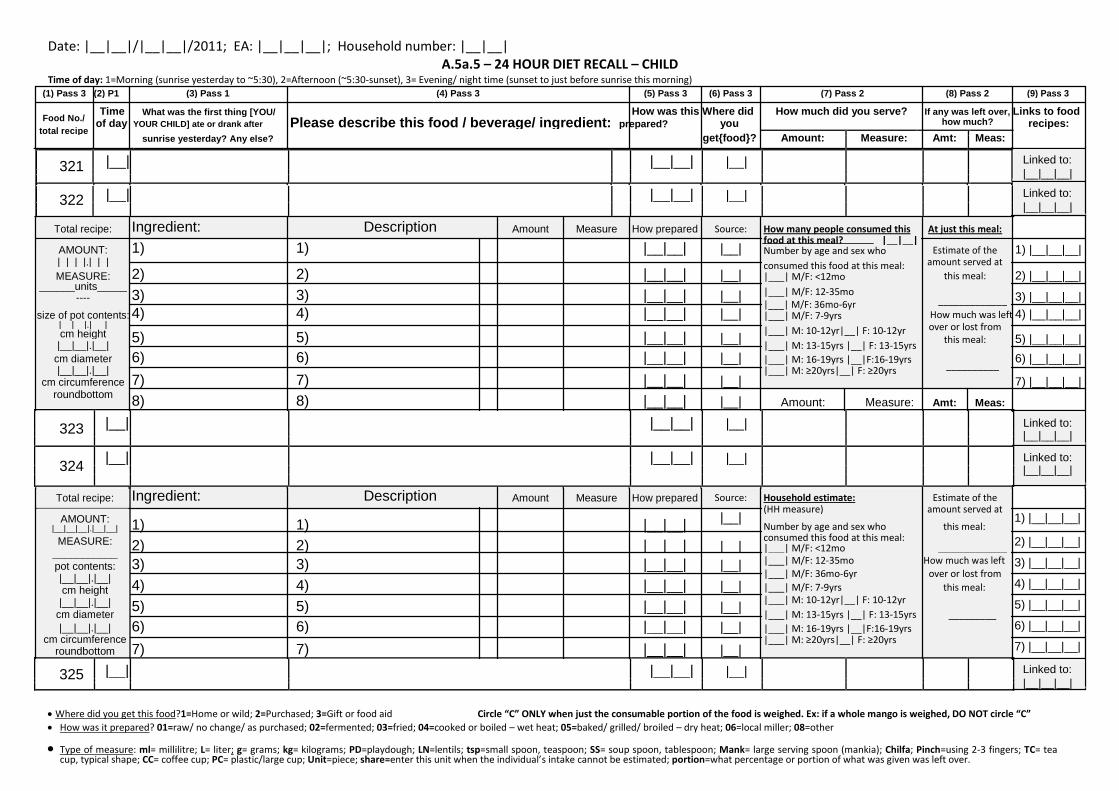
Date: |__|__|/|__|__|/2011; EA: |__|__|__|; Household number: |__|__| A.5a.5 – 24 HOUR DIET RECALL – CHILD
Time of day: 1=Morning (sunrise yesterday to ~5:30), 2=Afternoon (~5:30-sunset), 3= Evening/ night time (sunset to just before sunrise this morning) (1) Pass 3 (2) P1 (3) Pass 1 (4) Pass 3 (5) Pass 3 (6) Pass 3 (7) Pass 2 (8) Pass 2 (9) Pass 3
Food No./ Time What was the first thing [YOU/ How was this Where did How much did you serve? If any was left over, Links to food
of day YOUR CHILD] ate or drank after Please describe this food / beverage/ ingredient: prepared? you how much? recipes:
total recipe
sunrise yesterday? Any else?
get{food}? Amount: Measure: Amt: Meas:
321 |__| |__|__| |__|
322
|__| |__|__| |__|
Linked to: |__|__|__| Linked to: |__|__|__|
Total recipe: Ingredient: Description Amount Measure How prepared Source: How many people consumed this At just this meal:
AMOUNT: 1) 1)
|__|__| |__| food at this meal? |__|__|
Estimate of the 1) |__|__|__|
Number by age and sex who
|_|_|_|.|_|_| consumed this food at this meal: amount served at
MEASURE: 2) 2)
|__|__| |__| this meal: 2) |__|__|__|
|___| M/F: <12mo
______units_____ 3) 3)
|__|__| |__| |___| M/F: 12-35mo
3) |__|__|__|
----
_____________
|___| M/F: 36mo-6yr
size of pot contents:
4) 4)
|__|__| |__|
How much was left 4) |__|__|__|
|___| M/F: 7-9yrs
|__|__|.|__ | |___| M: 10-12yr|__| F: 10-12yr over or lost from
cm height 5) 5)
|__|__| |__| 5) |__|__|__|
this meal:
|___| M: 13-15yrs |__| F: 13-15yrs
|__|__|.|__|
cm diameter 6) 6) |__|__| |__| |___| M: 16-19yrs |__|F:16-19yrs __________ 6) |__|__|__|
|__|__|.|__| |___| M: ≥20yrs|__| F: ≥20yrs
7) 7)
|__|__| |__|
7) |__|__|__|
cm circumference
roundbottom 8) 8)
|__|__| |__| Amount: Measure: Amt: Meas:
323 |__| |__|__| |__|
324 |__| |__|__| |__|
Total recipe: Ingredient: Description Amount Measure How prepared Source: Household estimate: Estimate of the
AMOUNT: 1) 1)
|__|__| |__|
(HH measure) amount served at
Number by age and sex who this meal:
|__|__|__|.|__|__|
MEASURE: 2) 2)
|__|__| |__| consumed this food at this meal:
|___| M/F: <12mo _____________ ___________
3) 3)
|__|__| |__| |___| M/F: 12-35mo How much was left
pot contents:
|___| M/F: 36mo-6yr over or lost from
|__|__|.|__| 4) 4)
|__|__| |__|
|___| M/F: 7-9yrs this meal:
cm height
|___| M: 10-12yr|__| F: 10-12yr
|__|__|.|__| 5) 5)
|__|__| |__|
|___| M: 13-15yrs |__| F: 13-15yrs _________
cm diameter
|__|__|.|__| 6) 6) |__|__| |__| |___| M: 16-19yrs |__|F:16-19yrs
cm circumference 7) 7)
|__|__| |__| |___| M: ≥20yrs|__| F: ≥20yrs
roundbottom
Linked to: |__|__|__|
Linked to: |__|__|__|
1) |__|__|__| 2) |__|__|__| 3) |__|__|__| 4) |__|__|__| 5) |__|__|__| 6) |__|__|__| 7) |__|__|__|
325 |__| |__|__| |__|
Linked to: |__|__|__|
Where did you get this food?1=Home or wild; 2=Purchased; 3=Gift or food aid Circle “C” ONLY when just the consumable portion of the food is weighed. Ex: if a whole mango is weighed, DO NOT circle “C” How was it prepared? 01=raw/ no change/ as purchased; 02=fermented; 03=fried; 04=cooked or boiled – wet heat; 05=baked/ grilled/ broiled – dry heat; 06=local miller; 08=other
Type of measure: ml= millilitre; L= liter; g= grams; kg= kilograms; PD=playdough; LN=lentils; tsp=small spoon, teaspoon; SS= soup spoon, tablespoon; Mank= large serving spoon (mankia); Chilfa; Pinch=using 2-3 fingers; TC= tea cup, typical shape; CC= coffee cup; PC= plastic/large cup; Unit=piece; share=enter this unit when the individual’s intake cannot be estimated; portion=what percentage or portion of what was given was left over.

Date: |__|__|/|__|__|/2011; EA: |__|__|__|; Household number: |__|__| A.5b.1 – 24 HOUR DIET RECALL – WOMAN
Time of day: 1=Morning (sunrise yesterday to ~5:30), 2=Afternoon (~5:30-sunset), 3= Evening/ night time (sunset to just before sunrise this morning) (1) Pass 3 (2) P1 (3) Pass 1 (4) Pass 3 (5) Pass 3 (6) Pass 3 (7) Pass 2 (8) Pass 2 (9) Pass 3
Food No./ Time What was the first thing [YOU/ How was this Where did How much did you serve? If any was left over, Links to food
of day YOUR CHILD] ate or drank after Please describe this food / beverage/ ingredient: prepared? you how much? recipes:
total recipe
sunrise yesterday? Any else?
get{food}? Amount: Measure: Amt: Meas:
401 |__| |__|__| |__|
402
|__| |__|__| |__|
Linked to: |__|__|__| Linked to: |__|__|__|
Total recipe: Ingredient: Description Amount Measure How prepared Source: How many people consumed this At just this meal:
AMOUNT: 1) 1)
|__|__| |__|
food at this meal? |__|__| Estimate of the 1) |__|__|__|
Number by age and sex who
|__|__|__|.|__|__| amount served at
MEASURE: 2) 2) |__|__| |__| consumed this food at this meal: this meal: 2) |__|__|__| |___| M/F: <12mo
___________ 3) 3)
|__|__| |__| |___| M/F: 12-35mo
3) |__|__|__|
----
_____________
|___| M/F: 36mo-6yr
size of pot contents:
4) 4)
|__|__| |__|
How much was left 4) |__|__|__|
|___| M/F: 7-9yrs
|__|__|.|__ | |___| M: 10-12yr|__| F: 10-12yr over or lost from
cm height 5) 5)
|__|__| |__| 5) |__|__|__|
this meal:
|___| M: 13-15yrs |__| F: 13-15yrs
|__|__|.|__|
cm diameter 6) 6) |__|__| |__| |___| M: 16-19yrs |__|F:16-19yrs __________ 6) |__|__|__|
|__|__|.|__| |___| M: ≥20yrs|__| F: ≥20yrs
7) 7)
|__|__| |__|
7) |__|__|__|
cm circumference
roundbottom 8) 8)
|__|__| |__| Amount: Measure: Amt: Meas:
403 |__| |__|__| |__|
404 |__| |__|__| |__|
Total recipe: Ingredient: Description Amount Measure How prepared Source: Household estimate: Estimate of the
AMOUNT: 1) 1)
|__|__| |__|
(HH measure) amount served at
Number by age and sex who this meal:
|__|__|__|.|__|__|
MEASURE: 2) 2)
|__|__| |__| consumed this food at this meal:
|___| M/F: <12mo _____________ ___________
3) 3)
|__|__| |__| |___| M/F: 12-35mo How much was left
pot contents:
|___| M/F: 36mo-6yr over or lost from
|__|__|.|__| 4) 4)
|__|__| |__|
|___| M/F: 7-9yrs this meal:
cm height
|___| M: 10-12yr|__| F: 10-12yr
|__|__|.|__| 5) 5)
|__|__| |__|
|___| M: 13-15yrs |__| F: 13-15yrs _________
cm diameter
|__|__|.|__| 6) 6) |__|__| |__| |___| M: 16-19yrs |__|F:16-19yrs
cm circumference 7) 7)
|__|__| |__| |___| M: ≥20yrs|__| F: ≥20yrs
roundbottom
Linked to: |__|__|__|
Linked to: |__|__|__|
1) |__|__|__| 2) |__|__|__| 3) |__|__|__| 4) |__|__|__| 5) |__|__|__| 6) |__|__|__| 7) |__|__|__|
405 |__| |__|__| |__|
Linked to: |__|__|__|
Where did you get this food?1=Home or wild; 2=Purchased; 3=Gift or food aid Circle “C” ONLY when just the consumable portion of the food is weighed. Ex: if a whole mango is weighed, DO NOT circle “C” How was it prepared? 01=raw/ no change/ as purchased; 02=fermented; 03=fried; 04=cooked or boiled – wet heat; 05=baked/ grilled/ broiled – dry heat; 06=local miller; 08=other
Type of measure: ml= millilitre; L= liter; g= grams; kg= kilograms; PD=playdough; LN=lentils; tsp=small spoon, teaspoon; SS= soup spoon, tablespoon; Mank= large serving spoon (mankia); Chilfa; Pinch=using 2-3 fingers; TC= tea cup, typical shape; CC= coffee cup; PC= plastic/large cup; Unit=piece; share=enter this unit when the individual’s intake cannot be estimated; portion=what percentage or portion of what was given was left over.
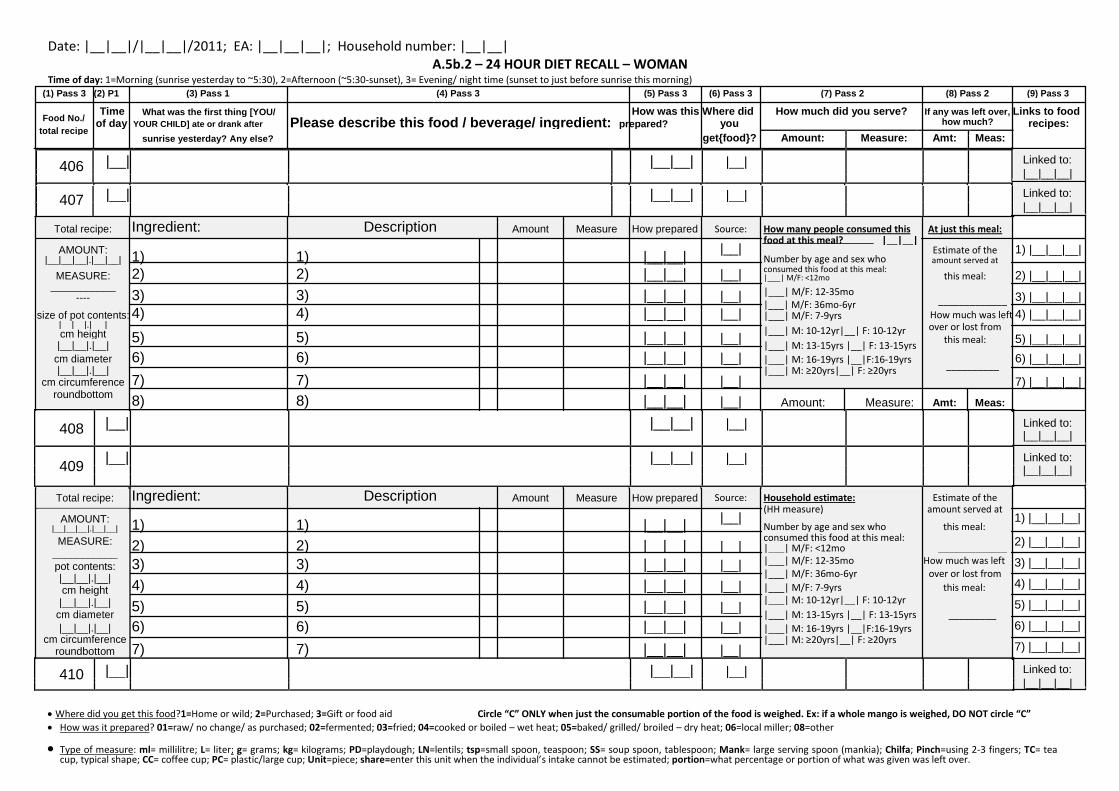
Date: |__|__|/|__|__|/2011; EA: |__|__|__|; Household number: |__|__| A.5b.2 – 24 HOUR DIET RECALL – WOMAN
Time of day: 1=Morning (sunrise yesterday to ~5:30), 2=Afternoon (~5:30-sunset), 3= Evening/ night time (sunset to just before sunrise this morning) (1) Pass 3 (2) P1 (3) Pass 1 (4) Pass 3 (5) Pass 3 (6) Pass 3 (7) Pass 2 (8) Pass 2 (9) Pass 3
Food No./ Time What was the first thing [YOU/ How was this Where did How much did you serve? If any was left over, Links to food
of day YOUR CHILD] ate or drank after Please describe this food / beverage/ ingredient: prepared? you how much? recipes:
total recipe
sunrise yesterday? Any else?
get{food}? Amount: Measure: Amt: Meas:
406 |__| |__|__| |__|
407
|__| |__|__| |__|
Linked to: |__|__|__| Linked to: |__|__|__|
Total recipe: Ingredient: Description Amount Measure How prepared Source: How many people consumed this At just this meal:
AMOUNT: 1) 1)
|__|__| |__|
food at this meal? |__|__| Estimate of the 1) |__|__|__|
Number by age and sex who
|__|__|__|.|__|__| amount served at
MEASURE: 2) 2) |__|__| |__| consumed this food at this meal: this meal: 2) |__|__|__| |___| M/F: <12mo
___________ 3) 3)
|__|__| |__| |___| M/F: 12-35mo
3) |__|__|__|
----
_____________
|___| M/F: 36mo-6yr
size of pot contents:
4) 4)
|__|__| |__|
How much was left 4) |__|__|__|
|___| M/F: 7-9yrs
|__|__|.|__ | |___| M: 10-12yr|__| F: 10-12yr over or lost from
cm height 5) 5)
|__|__| |__| 5) |__|__|__|
this meal:
|___| M: 13-15yrs |__| F: 13-15yrs
|__|__|.|__|
cm diameter 6) 6) |__|__| |__| |___| M: 16-19yrs |__|F:16-19yrs __________ 6) |__|__|__|
|__|__|.|__| |___| M: ≥20yrs|__| F: ≥20yrs
7) 7)
|__|__| |__|
7) |__|__|__|
cm circumference
roundbottom 8) 8)
|__|__| |__| Amount: Measure: Amt: Meas:
408 |__| |__|__| |__|
409 |__| |__|__| |__|
Total recipe: Ingredient: Description Amount Measure How prepared Source: Household estimate: Estimate of the
AMOUNT: 1) 1)
|__|__| |__|
(HH measure) amount served at
Number by age and sex who this meal:
|__|__|__|.|__|__|
MEASURE: 2) 2)
|__|__| |__| consumed this food at this meal:
|___| M/F: <12mo _____________ ___________
3) 3)
|__|__| |__| |___| M/F: 12-35mo How much was left
pot contents:
|___| M/F: 36mo-6yr over or lost from
|__|__|.|__| 4) 4)
|__|__| |__|
|___| M/F: 7-9yrs this meal:
cm height
|___| M: 10-12yr|__| F: 10-12yr
|__|__|.|__| 5) 5)
|__|__| |__|
|___| M: 13-15yrs |__| F: 13-15yrs _________
cm diameter
|__|__|.|__| 6) 6) |__|__| |__| |___| M: 16-19yrs |__|F:16-19yrs
cm circumference 7) 7)
|__|__| |__| |___| M: ≥20yrs|__| F: ≥20yrs
roundbottom
Linked to: |__|__|__|
Linked to: |__|__|__|
1) |__|__|__| 2) |__|__|__| 3) |__|__|__| 4) |__|__|__| 5) |__|__|__| 6) |__|__|__| 7) |__|__|__|
410 |__| |__|__| |__|
Linked to: |__|__|__|
Where did you get this food?1=Home or wild; 2=Purchased; 3=Gift or food aid Circle “C” ONLY when just the consumable portion of the food is weighed. Ex: if a whole mango is weighed, DO NOT circle “C” How was it prepared? 01=raw/ no change/ as purchased; 02=fermented; 03=fried; 04=cooked or boiled – wet heat; 05=baked/ grilled/ broiled – dry heat; 06=local miller; 08=other
Type of measure: ml= millilitre; L= liter; g= grams; kg= kilograms; PD=playdough; LN=lentils; tsp=small spoon, teaspoon; SS= soup spoon, tablespoon; Mank= large serving spoon (mankia); Chilfa; Pinch=using 2-3 fingers; TC= tea cup, typical shape; CC= coffee cup; PC= plastic/large cup; Unit=piece; share=enter this unit when the individual’s intake cannot be estimated; portion=what percentage or portion of what was given was left over.

Date: |__|__|/|__|__|/2011; EA: |__|__|__|; Household number: |__|__| A.5b.3 – 24 HOUR DIET RECALL – WOMAN
Time of day: 1=Morning (sunrise yesterday to ~5:30), 2=Afternoon (~5:30-sunset), 3= Evening/ night time (sunset to just before sunrise this morning) (1) Pass 3 (2) P1 (3) Pass 1 (4) Pass 3 (5) Pass 3 (6) Pass 3 (7) Pass 2 (8) Pass 2 (9) Pass 3
Food No./ Time What was the first thing [YOU/ How was this Where did How much did you serve? If any was left over, Links to food
of day YOUR CHILD] ate or drank after Please describe this food / beverage/ ingredient: prepared? you how much? recipes:
total recipe
sunrise yesterday? Any else?
get{food}? Amount: Measure: Amt: Meas:
411 |__| |__|__| |__|
412
|__| |__|__| |__|
Linked to: |__|__|__| Linked to: |__|__|__|
Total recipe: Ingredient: Description Amount Measure How prepared Source: How many people consumed this At just this meal:
AMOUNT: 1) 1)
|__|__| |__|
food at this meal? |__|__| Estimate of the 1) |__|__|__|
Number by age and sex who
|__|__|__|.|__|__| amount served at
MEASURE: 2) 2) |__|__| |__| consumed this food at this meal: this meal: 2) |__|__|__| |___| M/F: <12mo
___________ 3) 3)
|__|__| |__| |___| M/F: 12-35mo
3) |__|__|__|
----
_____________
|___| M/F: 36mo-6yr
size of pot contents:
4) 4)
|__|__| |__|
How much was left 4) |__|__|__|
|___| M/F: 7-9yrs
|__|__|.|__ | |___| M: 10-12yr|__| F: 10-12yr over or lost from
cm height 5) 5)
|__|__| |__| 5) |__|__|__|
this meal:
|___| M: 13-15yrs |__| F: 13-15yrs
|__|__|.|__|
cm diameter 6) 6) |__|__| |__| |___| M: 16-19yrs |__|F:16-19yrs __________ 6) |__|__|__|
|__|__|.|__| |___| M: ≥20yrs|__| F: ≥20yrs
7) 7)
|__|__| |__|
7) |__|__|__|
cm circumference
roundbottom 8) 8)
|__|__| |__| Amount: Measure: Amt: Meas:
413 |__| |__|__| |__|
414 |__| |__|__| |__|
Total recipe: Ingredient: Description Amount Measure How prepared Source: Household estimate: Estimate of the
AMOUNT: 1) 1)
|__|__| |__|
(HH measure) amount served at
Number by age and sex who this meal:
|__|__|__|.|__|__|
MEASURE: 2) 2)
|__|__| |__| consumed this food at this meal:
|___| M/F: <12mo _____________ ___________
3) 3)
|__|__| |__| |___| M/F: 12-35mo How much was left
pot contents:
|___| M/F: 36mo-6yr over or lost from
|__|__|.|__| 4) 4)
|__|__| |__|
|___| M/F: 7-9yrs this meal:
cm height
|___| M: 10-12yr|__| F: 10-12yr
|__|__|.|__| 5) 5)
|__|__| |__|
|___| M: 13-15yrs |__| F: 13-15yrs _________
cm diameter
|__|__|.|__| 6) 6) |__|__| |__| |___| M: 16-19yrs |__|F:16-19yrs
cm circumference 7) 7)
|__|__| |__| |___| M: ≥20yrs|__| F: ≥20yrs
roundbottom
Linked to: |__|__|__|
Linked to: |__|__|__|
1) |__|__|__| 2) |__|__|__| 3) |__|__|__| 4) |__|__|__| 5) |__|__|__| 6) |__|__|__| 7) |__|__|__|
415 |__| |__|__| |__|
Linked to: |__|__|__|
Where did you get this food?1=Home or wild; 2=Purchased; 3=Gift or food aid Circle “C” ONLY when just the consumable portion of the food is weighed. Ex: if a whole mango is weighed, DO NOT circle “C” How was it prepared? 01=raw/ no change/ as purchased; 02=fermented; 03=fried; 04=cooked or boiled – wet heat; 05=baked/ grilled/ broiled – dry heat; 06=local miller; 08=other
Type of measure: ml= millilitre; L= liter; g= grams; kg= kilograms; PD=playdough; LN=lentils; tsp=small spoon, teaspoon; SS= soup spoon, tablespoon; Mank= large serving spoon (mankia); Chilfa; Pinch=using 2-3 fingers; TC= tea cup, typical shape; CC= coffee cup; PC= plastic/large cup; Unit=piece; share=enter this unit when the individual’s intake cannot be estimated; portion=what percentage or portion of what was given was left over.

Date: |__|__|/|__|__|/2011; EA: |__|__|__|; Household number: |__|__| A.5b.4 – 24 HOUR DIET RECALL – WOMAN
Time of day: 1=Morning (sunrise yesterday to ~5:30), 2=Afternoon (~5:30-sunset), 3= Evening/ night time (sunset to just before sunrise this morning) (1) Pass 3 (2) P1 (3) Pass 1 (4) Pass 3 (5) Pass 3 (6) Pass 3 (7) Pass 2 (8) Pass 2 (9) Pass 3
Food No./ Time What was the first thing [YOU/ How was this Where did How much did you serve? If any was left over, Links to food
of day YOUR CHILD] ate or drank after Please describe this food / beverage/ ingredient: prepared? you how much? recipes:
total recipe
sunrise yesterday? Any else?
get{food}? Amount: Measure: Amt: Meas:
416 |__| |__|__| |__|
417
|__| |__|__| |__|
Linked to: |__|__|__| Linked to: |__|__|__|
Total recipe: Ingredient: Description Amount Measure How prepared Source: How many people consumed this At just this meal:
AMOUNT: 1) 1)
|__|__| |__|
food at this meal? |__|__| Estimate of the 1) |__|__|__|
Number by age and sex who
|__|__|__|.|__|__| amount served at
MEASURE: 2) 2) |__|__| |__| consumed this food at this meal: this meal: 2) |__|__|__| |___| M/F: <12mo
___________ 3) 3)
|__|__| |__| |___| M/F: 12-35mo
3) |__|__|__|
----
_____________
|___| M/F: 36mo-6yr
size of pot contents:
4) 4)
|__|__| |__|
How much was left 4) |__|__|__|
|___| M/F: 7-9yrs
|__|__|.|__ | |___| M: 10-12yr|__| F: 10-12yr over or lost from
cm height 5) 5)
|__|__| |__| 5) |__|__|__|
this meal:
|___| M: 13-15yrs |__| F: 13-15yrs
|__|__|.|__|
cm diameter 6) 6) |__|__| |__| |___| M: 16-19yrs |__|F:16-19yrs __________ 6) |__|__|__|
|__|__|.|__| |___| M: ≥20yrs|__| F: ≥20yrs
7) 7)
|__|__| |__|
7) |__|__|__|
cm circumference
roundbottom 8) 8)
|__|__| |__| Amount: Measure: Amt: Meas:
418 |__| |__|__| |__|
419 |__| |__|__| |__|
Total recipe: Ingredient: Description Amount Measure How prepared Source: Household estimate: Estimate of the
AMOUNT: 1) 1)
|__|__| |__|
(HH measure) amount served at
Number by age and sex who this meal:
|__|__|__|.|__|__|
MEASURE: 2) 2)
|__|__| |__| consumed this food at this meal:
|___| M/F: <12mo _____________ ___________
3) 3)
|__|__| |__| |___| M/F: 12-35mo How much was left
pot contents:
|___| M/F: 36mo-6yr over or lost from
|__|__|.|__| 4) 4)
|__|__| |__|
|___| M/F: 7-9yrs this meal:
cm height
|___| M: 10-12yr|__| F: 10-12yr
|__|__|.|__| 5) 5)
|__|__| |__|
|___| M: 13-15yrs |__| F: 13-15yrs _________
cm diameter
|__|__|.|__| 6) 6) |__|__| |__| |___| M: 16-19yrs |__|F:16-19yrs
cm circumference 7) 7)
|__|__| |__| |___| M: ≥20yrs|__| F: ≥20yrs
roundbottom
Linked to: |__|__|__|
Linked to: |__|__|__|
1) |__|__|__| 2) |__|__|__| 3) |__|__|__| 4) |__|__|__| 5) |__|__|__| 6) |__|__|__| 7) |__|__|__|
420 |__| |__|__| |__|
Linked to: |__|__|__|
Where did you get this food?1=Home or wild; 2=Purchased; 3=Gift or food aid Circle “C” ONLY when just the consumable portion of the food is weighed. Ex: if a whole mango is weighed, DO NOT circle “C” How was it prepared? 01=raw/ no change/ as purchased; 02=fermented; 03=fried; 04=cooked or boiled – wet heat; 05=baked/ grilled/ broiled – dry heat; 06=local miller; 08=other
Type of measure: ml= millilitre; L= liter; g= grams; kg= kilograms; PD=playdough; LN=lentils; tsp=small spoon, teaspoon; SS= soup spoon, tablespoon; Mank= large serving spoon (mankia); Chilfa; Pinch=using 2-3 fingers; TC= tea cup, typical shape; CC= coffee cup; PC= plastic/large cup; Unit=piece; share=enter this unit when the individual’s intake cannot be estimated; portion=what percentage or portion of what was given was left over.
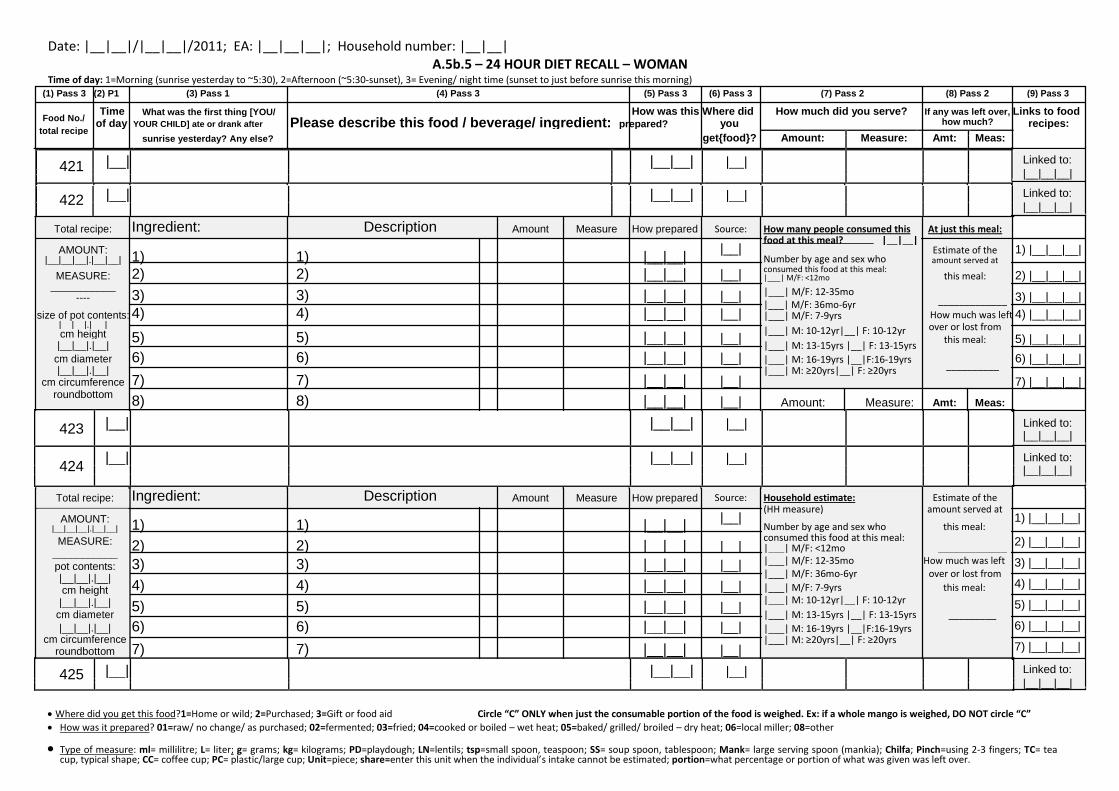
Date: |__|__|/|__|__|/2011; EA: |__|__|__|; Household number: |__|__| A.5b.5 – 24 HOUR DIET RECALL – WOMAN
Time of day: 1=Morning (sunrise yesterday to ~5:30), 2=Afternoon (~5:30-sunset), 3= Evening/ night time (sunset to just before sunrise this morning) (1) Pass 3 (2) P1 (3) Pass 1 (4) Pass 3 (5) Pass 3 (6) Pass 3 (7) Pass 2 (8) Pass 2 (9) Pass 3
Food No./ Time What was the first thing [YOU/ How was this Where did How much did you serve? If any was left over, Links to food
of day YOUR CHILD] ate or drank after Please describe this food / beverage/ ingredient: prepared? you how much? recipes:
total recipe
sunrise yesterday? Any else?
get{food}? Amount: Measure: Amt: Meas:
421 |__| |__|__| |__|
422
|__| |__|__| |__|
Linked to: |__|__|__| Linked to: |__|__|__|
Total recipe: Ingredient: Description Amount Measure How prepared Source: How many people consumed this At just this meal:
AMOUNT: 1) 1)
|__|__| |__|
food at this meal? |__|__| Estimate of the 1) |__|__|__|
Number by age and sex who
|__|__|__|.|__|__| amount served at
MEASURE: 2) 2) |__|__| |__| consumed this food at this meal: this meal: 2) |__|__|__| |___| M/F: <12mo
___________ 3) 3)
|__|__| |__| |___| M/F: 12-35mo
3) |__|__|__|
----
_____________
|___| M/F: 36mo-6yr
size of pot contents:
4) 4)
|__|__| |__|
How much was left 4) |__|__|__|
|___| M/F: 7-9yrs
|__|__|.|__ | |___| M: 10-12yr|__| F: 10-12yr over or lost from
cm height 5) 5)
|__|__| |__| 5) |__|__|__|
this meal:
|___| M: 13-15yrs |__| F: 13-15yrs
|__|__|.|__|
cm diameter 6) 6) |__|__| |__| |___| M: 16-19yrs |__|F:16-19yrs __________ 6) |__|__|__|
|__|__|.|__| |___| M: ≥20yrs|__| F: ≥20yrs
7) 7)
|__|__| |__|
7) |__|__|__|
cm circumference
roundbottom 8) 8)
|__|__| |__| Amount: Measure: Amt: Meas:
423 |__| |__|__| |__|
424 |__| |__|__| |__|
Total recipe: Ingredient: Description Amount Measure How prepared Source: Household estimate: Estimate of the
AMOUNT: 1) 1)
|__|__| |__|
(HH measure) amount served at
Number by age and sex who this meal:
|__|__|__|.|__|__|
MEASURE: 2) 2)
|__|__| |__| consumed this food at this meal:
|___| M/F: <12mo _____________ ___________
3) 3)
|__|__| |__| |___| M/F: 12-35mo How much was left
pot contents:
|___| M/F: 36mo-6yr over or lost from
|__|__|.|__| 4) 4)
|__|__| |__|
|___| M/F: 7-9yrs this meal:
cm height
|___| M: 10-12yr|__| F: 10-12yr
|__|__|.|__| 5) 5)
|__|__| |__|
|___| M: 13-15yrs |__| F: 13-15yrs _________
cm diameter
|__|__|.|__| 6) 6) |__|__| |__| |___| M: 16-19yrs |__|F:16-19yrs
cm circumference 7) 7)
|__|__| |__| |___| M: ≥20yrs|__| F: ≥20yrs
roundbottom
Linked to: |__|__|__|
Linked to: |__|__|__|
1) |__|__|__| 2) |__|__|__| 3) |__|__|__| 4) |__|__|__| 5) |__|__|__| 6) |__|__|__| 7) |__|__|__|
425 |__| |__|__| |__|
Linked to: |__|__|__|
Where did you get this food?1=Home or wild; 2=Purchased; 3=Gift or food aid Circle “C” ONLY when just the consumable portion of the food is weighed. Ex: if a whole mango is weighed, DO NOT circle “C” How was it prepared? 01=raw/ no change/ as purchased; 02=fermented; 03=fried; 04=cooked or boiled – wet heat; 05=baked/ grilled/ broiled – dry heat; 06=local miller; 08=other
Type of measure: ml= millilitre; L= liter; g= grams; kg= kilograms; PD=playdough; LN=lentils; tsp=small spoon, teaspoon; SS= soup spoon, tablespoon; Mank= large serving spoon (mankia); Chilfa; Pinch=using 2-3 fingers; TC= tea cup, typical shape; CC= coffee cup; PC= plastic/large cup; Unit=piece; share=enter this unit when the individual’s intake cannot be estimated; portion=what percentage or portion of what was given was left over.

Date: |__|__|/|__|__|/2011; EA: |__|__|__|; Household number: |__|__| A.5c.1 – 24 HOUR DIET RECALL – MAN
Time of day: 1=Morning (sunrise yesterday to ~5:30), 2=Afternoon (~5:30-sunset), 3= Evening/ night time (sunset to just before sunrise this morning) (1) Pass 3 (2) P1 (3) Pass 1 (4) Pass 3 (5) Pass 3 (6) Pass 3 (7) Pass 2 (8) Pass 2 (9) Pass 3
Food No./ Time What was the first thing [YOU/ How was this Where did How much did you serve? If any was left over, Links to food
of day YOUR CHILD] ate or drank after Please describe this food / beverage/ ingredient: prepared? you how much? recipes:
total recipe
sunrise yesterday? Any else?
get{food}? Amount: Measure: Amt: Meas:
501 |__| |__|__| |__|
502
|__| |__|__| |__|
Linked to: |__|__|__| Linked to: |__|__|__|
Total recipe: Ingredient: Description Amount Measure How prepared Source: How many people consumed this At just this meal:
AMOUNT: 1) 1)
|__|__| |__|
food at this meal? |__|__| Estimate of the 1) |__|__|__|
Number by age and sex who
|__|__|__|.|__|__| amount served at
MEASURE: 2) 2) |__|__| |__| consumed this food at this meal: this meal: 2) |__|__|__| |___| M/F: <12mo
___________ 3) 3)
|__|__| |__| |___| M/F: 12-35mo
3) |__|__|__|
----
_____________
|___| M/F: 36mo-6yr
size of pot contents:
4) 4)
|__|__| |__|
How much was left 4) |__|__|__|
|___| M/F: 7-9yrs
|__|__|.|__ | |___| M: 10-12yr|__| F: 10-12yr over or lost from
cm height 5) 5)
|__|__| |__| 5) |__|__|__|
this meal:
|___| M: 13-15yrs |__| F: 13-15yrs
|__|__|.|__|
cm diameter 6) 6) |__|__| |__| |___| M: 16-19yrs |__|F:16-19yrs __________ 6) |__|__|__|
|__|__|.|__| |___| M: ≥20yrs|__| F: ≥20yrs
7) 7)
|__|__| |__|
7) |__|__|__|
cm circumference
roundbottom 8) 8)
|__|__| |__| Amount: Measure: Amt: Meas:
503 |__| |__|__| |__|
504 |__| |__|__| |__|
Total recipe: Ingredient: Description Amount Measure How prepared Source: Household estimate: Estimate of the
AMOUNT: 1) 1)
|__|__| |__|
(HH measure) amount served at
Number by age and sex who this meal:
|__|__|__|.|__|__|
MEASURE: 2) 2)
|__|__| |__| consumed this food at this meal:
|___| M/F: <12mo _____________ ___________
3) 3)
|__|__| |__| |___| M/F: 12-35mo How much was left
pot contents:
|___| M/F: 36mo-6yr over or lost from
|__|__|.|__| 4) 4)
|__|__| |__|
|___| M/F: 7-9yrs this meal:
cm height
|___| M: 10-12yr|__| F: 10-12yr
|__|__|.|__| 5) 5)
|__|__| |__|
|___| M: 13-15yrs |__| F: 13-15yrs _________
cm diameter
|__|__|.|__| 6) 6) |__|__| |__| |___| M: 16-19yrs |__|F:16-19yrs
cm circumference 7) 7)
|__|__| |__| |___| M: ≥20yrs|__| F: ≥20yrs
roundbottom
Linked to: |__|__|__|
Linked to: |__|__|__|
1) |__|__|__| 2) |__|__|__| 3) |__|__|__| 4) |__|__|__| 5) |__|__|__| 6) |__|__|__| 7) |__|__|__|
505 |__| |__|__| |__|
Linked to: |__|__|__|
Where did you get this food?1=Home or wild; 2=Purchased; 3=Gift or food aid Circle “C” ONLY when just the consumable portion of the food is weighed. Ex: if a whole mango is weighed, DO NOT circle “C” How was it prepared? 01=raw/ no change/ as purchased; 02=fermented; 03=fried; 04=cooked or boiled – wet heat; 05=baked/ grilled/ broiled – dry heat; 06=local miller; 08=other
Type of measure: ml= millilitre; L= liter; g= grams; kg= kilograms; PD=playdough; LN=lentils; tsp=small spoon, teaspoon; SS= soup spoon, tablespoon; Mank= large serving spoon (mankia); Chilfa; Pinch=using 2-3 fingers; TC= tea cup, typical shape; CC= coffee cup; PC= plastic/large cup; Unit=piece; share=enter this unit when the individual’s intake cannot be estimated; portion=what percentage or portion of what was given was left over.

Date: |__|__|/|__|__|/2011; EA: |__|__|__|; Household number: |__|__| A.5c.2 – 24 HOUR DIET RECALL – MAN
Time of day: 1=Morning (sunrise yesterday to ~5:30), 2=Afternoon (~5:30-sunset), 3= Evening/ night time (sunset to just before sunrise this morning) (1) Pass 3 (2) P1 (3) Pass 1 (4) Pass 3 (5) Pass 3 (6) Pass 3 (7) Pass 2 (8) Pass 2 (9) Pass 3
Food No./ Time What was the first thing [YOU/ How was this Where did How much did you serve? If any was left over, Links to food
of day YOUR CHILD] ate or drank after Please describe this food / beverage/ ingredient: prepared? you how much? recipes:
total recipe
sunrise yesterday? Any else?
get{food}? Amount: Measure: Amt: Meas:
506 |__| |__|__| |__|
507
|__| |__|__| |__|
Linked to: |__|__|__| Linked to: |__|__|__|
Total recipe: Ingredient: Description Amount Measure How prepared Source: How many people consumed this At just this meal:
AMOUNT: 1) 1)
|__|__| |__|
food at this meal? |__|__| Estimate of the 1) |__|__|__|
Number by age and sex who
|__|__|__|.|__|__| amount served at
MEASURE: 2) 2) |__|__| |__| consumed this food at this meal: this meal: 2) |__|__|__| |___| M/F: <12mo
___________ 3) 3)
|__|__| |__| |___| M/F: 12-35mo
3) |__|__|__|
----
_____________
|___| M/F: 36mo-6yr
size of pot contents:
4) 4)
|__|__| |__|
How much was left 4) |__|__|__|
|___| M/F: 7-9yrs
|__|__|.|__ | |___| M: 10-12yr|__| F: 10-12yr over or lost from
cm height 5) 5)
|__|__| |__| 5) |__|__|__|
this meal:
|___| M: 13-15yrs |__| F: 13-15yrs
|__|__|.|__|
cm diameter 6) 6) |__|__| |__| |___| M: 16-19yrs |__|F:16-19yrs __________ 6) |__|__|__|
|__|__|.|__| |___| M: ≥20yrs|__| F: ≥20yrs
7) 7)
|__|__| |__|
7) |__|__|__|
cm circumference
roundbottom 8) 8)
|__|__| |__| Amount: Measure: Amt: Meas:
508 |__| |__|__| |__|
509 |__| |__|__| |__|
Total recipe: Ingredient: Description Amount Measure How prepared Source: Household estimate: Estimate of the
AMOUNT: 1) 1)
|__|__| |__|
(HH measure) amount served at
Number by age and sex who this meal:
|__|__|__|.|__|__|
MEASURE: 2) 2)
|__|__| |__| consumed this food at this meal:
|___| M/F: <12mo _____________ ___________
3) 3)
|__|__| |__| |___| M/F: 12-35mo How much was left
pot contents:
|___| M/F: 36mo-6yr over or lost from
|__|__|.|__| 4) 4)
|__|__| |__|
|___| M/F: 7-9yrs this meal:
cm height
|___| M: 10-12yr|__| F: 10-12yr
|__|__|.|__| 5) 5)
|__|__| |__|
|___| M: 13-15yrs |__| F: 13-15yrs _________
cm diameter
|__|__|.|__| 6) 6) |__|__| |__| |___| M: 16-19yrs |__|F:16-19yrs
cm circumference 7) 7)
|__|__| |__| |___| M: ≥20yrs|__| F: ≥20yrs
roundbottom
Linked to: |__|__|__|
Linked to: |__|__|__|
1) |__|__|__| 2) |__|__|__| 3) |__|__|__| 4) |__|__|__| 5) |__|__|__| 6) |__|__|__| 7) |__|__|__|
510 |__| |__|__| |__|
Linked to: |__|__|__|
Where did you get this food?1=Home or wild; 2=Purchased; 3=Gift or food aid Circle “C” ONLY when just the consumable portion of the food is weighed. Ex: if a whole mango is weighed, DO NOT circle “C” How was it prepared? 01=raw/ no change/ as purchased; 02=fermented; 03=fried; 04=cooked or boiled – wet heat; 05=baked/ grilled/ broiled – dry heat; 06=local miller; 08=other
Type of measure: ml= millilitre; L= liter; g= grams; kg= kilograms; PD=playdough; LN=lentils; tsp=small spoon, teaspoon; SS= soup spoon, tablespoon; Mank= large serving spoon (mankia); Chilfa; Pinch=using 2-3 fingers; TC= tea cup, typical shape; CC= coffee cup; PC= plastic/large cup; Unit=piece; share=enter this unit when the individual’s intake cannot be estimated; portion=what percentage or portion of what was given was left over.
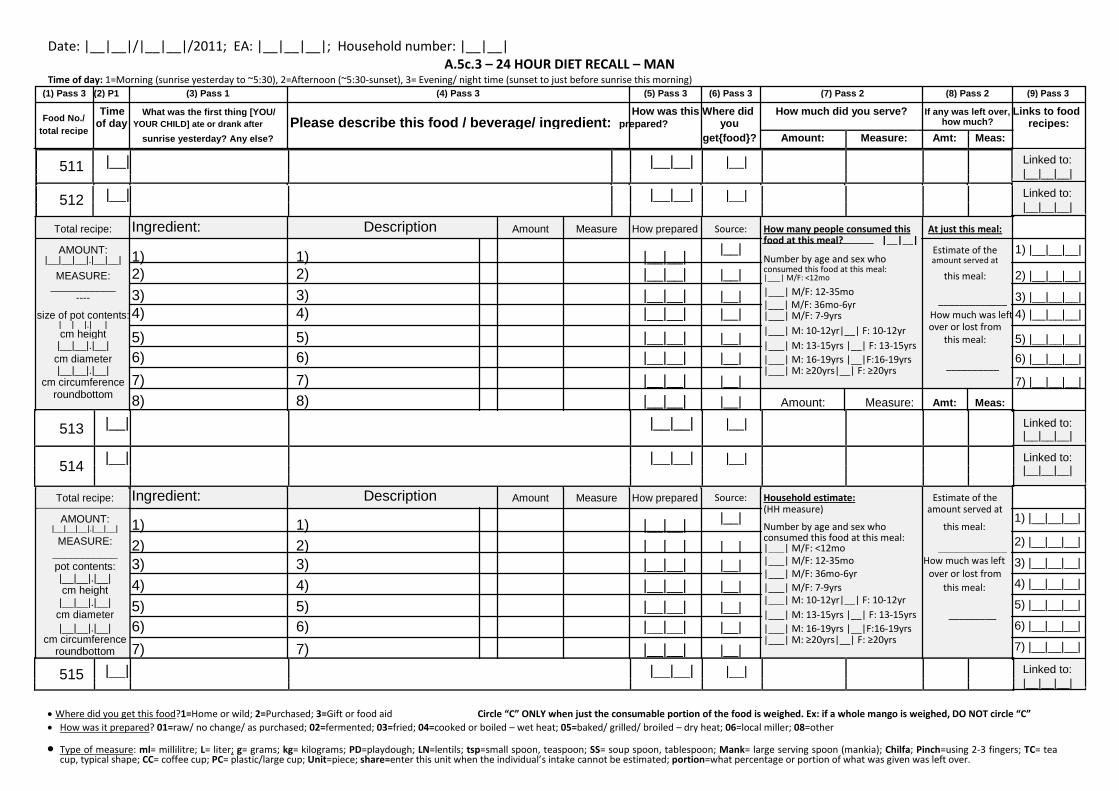
Date: |__|__|/|__|__|/2011; EA: |__|__|__|; Household number: |__|__| A.5c.3 – 24 HOUR DIET RECALL – MAN
Time of day: 1=Morning (sunrise yesterday to ~5:30), 2=Afternoon (~5:30-sunset), 3= Evening/ night time (sunset to just before sunrise this morning) (1) Pass 3 (2) P1 (3) Pass 1 (4) Pass 3 (5) Pass 3 (6) Pass 3 (7) Pass 2 (8) Pass 2 (9) Pass 3
Food No./ Time What was the first thing [YOU/ How was this Where did How much did you serve? If any was left over, Links to food
of day YOUR CHILD] ate or drank after Please describe this food / beverage/ ingredient: prepared? you how much? recipes:
total recipe
sunrise yesterday? Any else?
get{food}? Amount: Measure: Amt: Meas:
511 |__| |__|__| |__|
512
|__| |__|__| |__|
Linked to: |__|__|__| Linked to: |__|__|__|
Total recipe: Ingredient: Description Amount Measure How prepared Source: How many people consumed this At just this meal:
AMOUNT: 1) 1)
|__|__| |__|
food at this meal? |__|__| Estimate of the 1) |__|__|__|
Number by age and sex who
|__|__|__|.|__|__| amount served at
MEASURE: 2) 2) |__|__| |__| consumed this food at this meal: this meal: 2) |__|__|__| |___| M/F: <12mo
___________ 3) 3)
|__|__| |__| |___| M/F: 12-35mo
3) |__|__|__|
----
_____________
|___| M/F: 36mo-6yr
size of pot contents:
4) 4)
|__|__| |__|
How much was left 4) |__|__|__|
|___| M/F: 7-9yrs
|__|__|.|__ | |___| M: 10-12yr|__| F: 10-12yr over or lost from
cm height 5) 5)
|__|__| |__| 5) |__|__|__|
this meal:
|___| M: 13-15yrs |__| F: 13-15yrs
|__|__|.|__|
cm diameter 6) 6) |__|__| |__| |___| M: 16-19yrs |__|F:16-19yrs __________ 6) |__|__|__|
|__|__|.|__| |___| M: ≥20yrs|__| F: ≥20yrs
7) 7)
|__|__| |__|
7) |__|__|__|
cm circumference
roundbottom 8) 8)
|__|__| |__| Amount: Measure: Amt: Meas:
513 |__| |__|__| |__|
514 |__| |__|__| |__|
Total recipe: Ingredient: Description Amount Measure How prepared Source: Household estimate: Estimate of the
AMOUNT: 1) 1)
|__|__| |__|
(HH measure) amount served at
Number by age and sex who this meal:
|__|__|__|.|__|__|
MEASURE: 2) 2)
|__|__| |__| consumed this food at this meal:
|___| M/F: <12mo _____________ ___________
3) 3)
|__|__| |__| |___| M/F: 12-35mo How much was left
pot contents:
|___| M/F: 36mo-6yr over or lost from
|__|__|.|__| 4) 4)
|__|__| |__|
|___| M/F: 7-9yrs this meal:
cm height
|___| M: 10-12yr|__| F: 10-12yr
|__|__|.|__| 5) 5)
|__|__| |__|
|___| M: 13-15yrs |__| F: 13-15yrs _________
cm diameter
|__|__|.|__| 6) 6) |__|__| |__| |___| M: 16-19yrs |__|F:16-19yrs
cm circumference 7) 7)
|__|__| |__| |___| M: ≥20yrs|__| F: ≥20yrs
roundbottom
Linked to: |__|__|__|
Linked to: |__|__|__|
1) |__|__|__| 2) |__|__|__| 3) |__|__|__| 4) |__|__|__| 5) |__|__|__| 6) |__|__|__| 7) |__|__|__|
515 |__| |__|__| |__|
Linked to: |__|__|__|
Where did you get this food?1=Home or wild; 2=Purchased; 3=Gift or food aid Circle “C” ONLY when just the consumable portion of the food is weighed. Ex: if a whole mango is weighed, DO NOT circle “C” How was it prepared? 01=raw/ no change/ as purchased; 02=fermented; 03=fried; 04=cooked or boiled – wet heat; 05=baked/ grilled/ broiled – dry heat; 06=local miller; 08=other
Type of measure: ml= millilitre; L= liter; g= grams; kg= kilograms; PD=playdough; LN=lentils; tsp=small spoon, teaspoon; SS= soup spoon, tablespoon; Mank= large serving spoon (mankia); Chilfa; Pinch=using 2-3 fingers; TC= tea cup, typical shape; CC= coffee cup; PC= plastic/large cup; Unit=piece; share=enter this unit when the individual’s intake cannot be estimated; portion=what percentage or portion of what was given was left over.

Date: |__|__|/|__|__|/2011; EA: |__|__|__|; Household number: |__|__| A.5c.4 – 24 HOUR DIET RECALL – MAN
Time of day: 1=Morning (sunrise yesterday to ~5:30), 2=Afternoon (~5:30-sunset), 3= Evening/ night time (sunset to just before sunrise this morning) (1) Pass 3 (2) P1 (3) Pass 1 (4) Pass 3 (5) Pass 3 (6) Pass 3 (7) Pass 2 (8) Pass 2 (9) Pass 3
Food No./ Time What was the first thing [YOU/ How was this Where did How much did you serve? If any was left over, Links to food
of day YOUR CHILD] ate or drank after Please describe this food / beverage/ ingredient: prepared? you how much? recipes:
total recipe
sunrise yesterday? Any else?
get{food}? Amount: Measure: Amt: Meas:
516 |__| |__|__| |__|
517
|__| |__|__| |__|
Linked to: |__|__|__| Linked to: |__|__|__|
Total recipe: Ingredient: Description Amount Measure How prepared Source: How many people consumed this At just this meal:
AMOUNT: 1) 1)
|__|__| |__|
food at this meal? |__|__| Estimate of the 1) |__|__|__|
Number by age and sex who
|__|__|__|.|__|__| amount served at
MEASURE: 2) 2) |__|__| |__| consumed this food at this meal: this meal: 2) |__|__|__| |___| M/F: <12mo
___________ 3) 3)
|__|__| |__| |___| M/F: 12-35mo
3) |__|__|__|
----
_____________
|___| M/F: 36mo-6yr
size of pot contents:
4) 4)
|__|__| |__|
How much was left 4) |__|__|__|
|___| M/F: 7-9yrs
|__|__|.|__ | |___| M: 10-12yr|__| F: 10-12yr over or lost from
cm height 5) 5)
|__|__| |__| 5) |__|__|__|
this meal:
|___| M: 13-15yrs |__| F: 13-15yrs
|__|__|.|__|
cm diameter 6) 6) |__|__| |__| |___| M: 16-19yrs |__|F:16-19yrs __________ 6) |__|__|__|
|__|__|.|__| |___| M: ≥20yrs|__| F: ≥20yrs
7) 7)
|__|__| |__|
7) |__|__|__|
cm circumference
roundbottom 8) 8)
|__|__| |__| Amount: Measure: Amt: Meas:
518 |__| |__|__| |__|
519 |__| |__|__| |__|
Total recipe: Ingredient: Description Amount Measure How prepared Source: Household estimate: Estimate of the
AMOUNT: 1) 1)
|__|__| |__|
(HH measure) amount served at
Number by age and sex who this meal:
|__|__|__|.|__|__|
MEASURE: 2) 2)
|__|__| |__| consumed this food at this meal:
|___| M/F: <12mo _____________ ___________
3) 3)
|__|__| |__| |___| M/F: 12-35mo How much was left
pot contents:
|___| M/F: 36mo-6yr over or lost from
|__|__|.|__| 4) 4)
|__|__| |__|
|___| M/F: 7-9yrs this meal:
cm height
|___| M: 10-12yr|__| F: 10-12yr
|__|__|.|__| 5) 5)
|__|__| |__|
|___| M: 13-15yrs |__| F: 13-15yrs _________
cm diameter
|__|__|.|__| 6) 6) |__|__| |__| |___| M: 16-19yrs |__|F:16-19yrs
cm circumference 7) 7)
|__|__| |__| |___| M: ≥20yrs|__| F: ≥20yrs
roundbottom
Linked to: |__|__|__|
Linked to: |__|__|__|
1) |__|__|__| 2) |__|__|__| 3) |__|__|__| 4) |__|__|__| 5) |__|__|__| 6) |__|__|__| 7) |__|__|__|
520 |__| |__|__| |__|
Linked to: |__|__|__|
Where did you get this food?1=Home or wild; 2=Purchased; 3=Gift or food aid Circle “C” ONLY when just the consumable portion of the food is weighed. Ex: if a whole mango is weighed, DO NOT circle “C” How was it prepared? 01=raw/ no change/ as purchased; 02=fermented; 03=fried; 04=cooked or boiled – wet heat; 05=baked/ grilled/ broiled – dry heat; 06=local miller; 08=other
Type of measure: ml= millilitre; L= liter; g= grams; kg= kilograms; PD=playdough; LN=lentils; tsp=small spoon, teaspoon; SS= soup spoon, tablespoon; Mank= large serving spoon (mankia); Chilfa; Pinch=using 2-3 fingers; TC= tea cup, typical shape; CC= coffee cup; PC= plastic/large cup; Unit=piece; share=enter this unit when the individual’s intake cannot be estimated; portion=what percentage or portion of what was given was left over.

Date: |__|__|/|__|__|/2011; EA: |__|__|__|; Household number: |__|__| A.5c.5 – 24 HOUR DIET RECALL – MAN
Time of day: 1=Morning (sunrise yesterday to ~5:30), 2=Afternoon (~5:30-sunset), 3= Evening/ night time (sunset to just before sunrise this morning) (1) Pass 3 (2) P1 (3) Pass 1 (4) Pass 3 (5) Pass 3 (6) Pass 3 (7) Pass 2 (8) Pass 2 (9) Pass 3
Food No./ Time What was the first thing [YOU/ How was this Where did How much did you serve? If any was left over, Links to food
of day YOUR CHILD] ate or drank after Please describe this food / beverage/ ingredient: prepared? you how much? recipes:
total recipe
sunrise yesterday? Any else?
get{food}? Amount: Measure: Amt: Meas:
521 |__| |__|__| |__|
522
|__| |__|__| |__|
Linked to: |__|__|__| Linked to: |__|__|__|
Total recipe: Ingredient: Description Amount Measure How prepared Source: How many people consumed this At just this meal:
AMOUNT: 1) 1)
|__|__| |__|
food at this meal? |__|__| Estimate of the 1) |__|__|__|
Number by age and sex who
|__|__|__|.|__|__| amount served at
MEASURE: 2) 2) |__|__| |__| consumed this food at this meal: this meal: 2) |__|__|__| |___| M/F: <12mo
___________ 3) 3)
|__|__| |__| |___| M/F: 12-35mo
3) |__|__|__|
----
_____________
|___| M/F: 36mo-6yr
size of pot contents:
4) 4)
|__|__| |__|
How much was left 4) |__|__|__|
|___| M/F: 7-9yrs
|__|__|.|__ | |___| M: 10-12yr|__| F: 10-12yr over or lost from
cm height 5) 5)
|__|__| |__| 5) |__|__|__|
this meal:
|___| M: 13-15yrs |__| F: 13-15yrs
|__|__|.|__|
cm diameter 6) 6) |__|__| |__| |___| M: 16-19yrs |__|F:16-19yrs __________ 6) |__|__|__|
|__|__|.|__| |___| M: ≥20yrs|__| F: ≥20yrs
7) 7)
|__|__| |__|
7) |__|__|__|
cm circumference
roundbottom 8) 8)
|__|__| |__| Amount: Measure: Amt: Meas:
523 |__| |__|__| |__|
524 |__| |__|__| |__|
Total recipe: Ingredient: Description Amount Measure How prepared Source: Household estimate: Estimate of the
AMOUNT: 1) 1)
|__|__| |__|
(HH measure) amount served at
Number by age and sex who this meal:
|__|__|__|.|__|__|
MEASURE: 2) 2)
|__|__| |__| consumed this food at this meal:
|___| M/F: <12mo _____________ ___________
3) 3)
|__|__| |__| |___| M/F: 12-35mo How much was left
pot contents:
|___| M/F: 36mo-6yr over or lost from
|__|__|.|__| 4) 4)
|__|__| |__|
|___| M/F: 7-9yrs this meal:
cm height
|___| M: 10-12yr|__| F: 10-12yr
|__|__|.|__| 5) 5)
|__|__| |__|
|___| M: 13-15yrs |__| F: 13-15yrs _________
cm diameter
|__|__|.|__| 6) 6) |__|__| |__| |___| M: 16-19yrs |__|F:16-19yrs
cm circumference 7) 7)
|__|__| |__| |___| M: ≥20yrs|__| F: ≥20yrs
roundbottom
Linked to: |__|__|__|
Linked to: |__|__|__|
1) |__|__|__| 2) |__|__|__| 3) |__|__|__| 4) |__|__|__| 5) |__|__|__| 6) |__|__|__| 7) |__|__|__|
525 |__| |__|__| |__|
Linked to: |__|__|__|
Where did you get this food?1=Home or wild; 2=Purchased; 3=Gift or food aid Circle “C” ONLY when just the consumable portion of the food is weighed. Ex: if a whole mango is weighed, DO NOT circle “C” How was it prepared? 01=raw/ no change/ as purchased; 02=fermented; 03=fried; 04=cooked or boiled – wet heat; 05=baked/ grilled/ broiled – dry heat; 06=local miller; 08=other
Type of measure: ml= millilitre; L= liter; g= grams; kg= kilograms; PD=playdough; LN=lentils; tsp=small spoon, teaspoon; SS= soup spoon, tablespoon; Mank= large serving spoon (mankia); Chilfa; Pinch=using 2-3 fingers; TC= tea cup, typical shape; CC= coffee cup; PC= plastic/large cup; Unit=piece; share=enter this unit when the individual’s intake cannot be estimated; portion=what percentage or portion of what was given was left over.
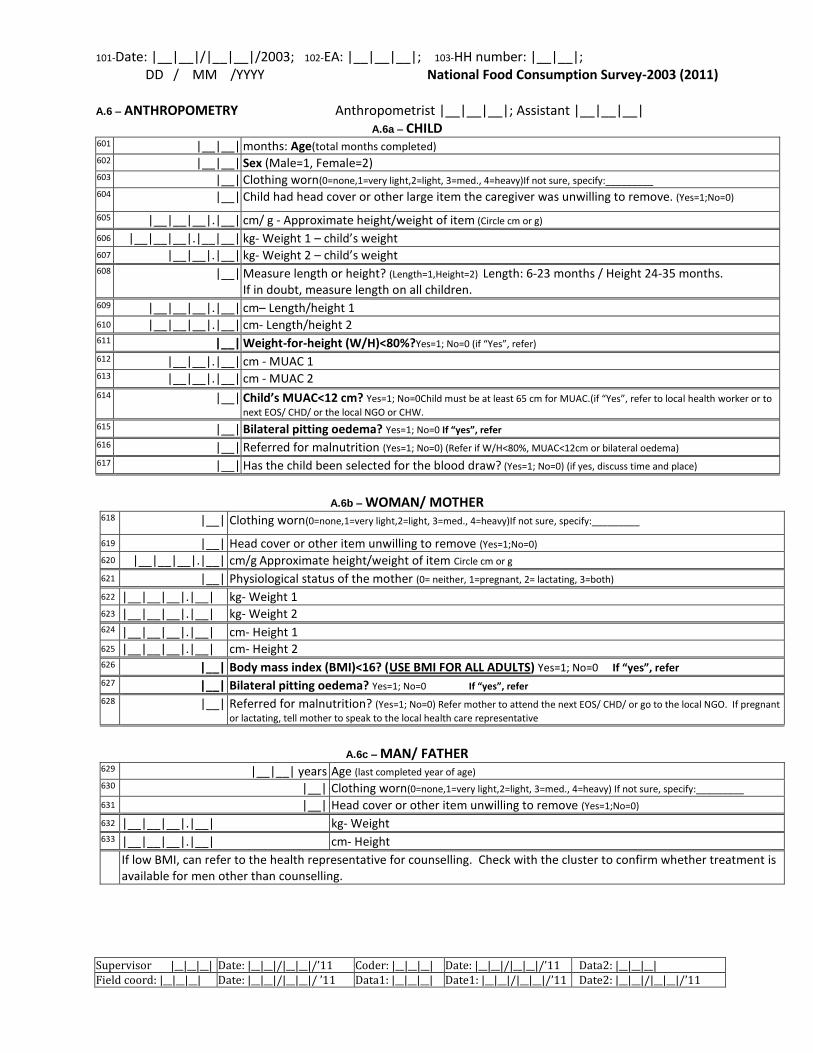
101-Date: |__|__|/|__|__|/2003; 102-EA: |__|__|__|; 103-HH number: |__|__|; DD / MM /YYYY National Food Consumption Survey-2003 (2011)
Supervisor |__|__|__| Date: |__|__|/|__|__|/’11 Coder: |__|__|__| Date: |__|__|/|__|__|/’11 Data2: |__|__|__| Field coord: |__|__|__| Date: |__|__|/|__|__|/ ’11 Data1: |__|__|__| Date1: |__|__|/|__|__|/’11 Date2: |__|__|/|__|__|/’11
A.6 – ANTHROPOMETRY Anthropometrist |__|__|__|; Assistant |__|__|__| A.6a – CHILD
601 |__|__| months: Age(total months completed) 602 |__|__| Sex (Male=1, Female=2) 603 |__| Clothing worn(0=none,1=very light,2=light, 3=med., 4=heavy)If not sure, specify:_________ 604
|__| Child had head cover or other large item the caregiver was unwilling to remove. (Yes=1;No=0)
605 |__|__|__|.|__| cm/ g - Approximate height/weight of item (Circle cm or g)
606 |__|__|__|.|__|__| kg- Weight 1 – child’s weight 607 |__|__|.|__| kg- Weight 2 – child’s weight 608 |__| Measure length or height? (Length=1,Height=2) Length: 6-23 months / Height 24-35 months.
If in doubt, measure length on all children. 609 |__|__|__|.|__| cm– Length/height 1
610 |__|__|__|.|__| cm- Length/height 2 611 |__| Weight-for-height (W/H)<80%?Yes=1; No=0 (if “Yes”, refer) 612 |__|__|.|__| cm - MUAC 1 613 |__|__|.|__| cm - MUAC 2 614 |__| Child’s MUAC<12 cm? Yes=1; No=0Child must be at least 65 cm for MUAC.(if “Yes”, refer to local health worker or to
next EOS/ CHD/ or the local NGO or CHW. 615 |__| Bilateral pitting oedema? Yes=1; No=0 If “yes”, refer 616 |__| Referred for malnutrition (Yes=1; No=0) (Refer if W/H<80%, MUAC<12cm or bilateral oedema)
617 |__| Has the child been selected for the blood draw? (Yes=1; No=0) (if yes, discuss time and place)
A.6b – WOMAN/ MOTHER
618
|__| Clothing worn(0=none,1=very light,2=light, 3=med., 4=heavy)If not sure, specify:_________
619 |__| Head cover or other item unwilling to remove (Yes=1;No=0) 620 |__|__|__|.|__| cm/g Approximate height/weight of item Circle cm or g
621 |__| Physiological status of the mother (0= neither, 1=pregnant, 2= lactating, 3=both)
622 |__|__|__|.|__| kg- Weight 1 623 |__|__|__|.|__| kg- Weight 2 624 |__|__|__|.|__| cm- Height 1 625 |__|__|__|.|__| cm- Height 2 626 |__| Body mass index (BMI)<16? (USE BMI FOR ALL ADULTS) Yes=1; No=0 If “yes”, refer 627 |__| Bilateral pitting oedema? Yes=1; No=0 If “yes”, refer
628 |__| Referred for malnutrition? (Yes=1; No=0) Refer mother to attend the next EOS/ CHD/ or go to the local NGO. If pregnant
or lactating, tell mother to speak to the local health care representative
A.6c – MAN/ FATHER
629 |__|__| years Age (last completed year of age) 630 |__| Clothing worn(0=none,1=very light,2=light, 3=med., 4=heavy) If not sure, specify:_________ 631 |__| Head cover or other item unwilling to remove (Yes=1;No=0)
632 |__|__|__|.|__| kg- Weight 633 |__|__|__|.|__| cm- Height If low BMI, can refer to the health representative for counselling. Check with the cluster to confirm whether treatment is
available for men other than counselling.