estymacje, testowanie i sprawdzanie założeńprac.im.pwr.wroc.pl/~legut/listy/ps-11.pdf · wykład...
TRANSCRIPT

Wykład 11
Wydział Matematyki
Regresja liniowa wielorakaEstymacje, testowanie i sprawdzanie założeń

Example 1
The president of a large chain of fast-food restaurants has randomly selected10 franchises and recorded for each franchise the following information on lastyear’s net profit and sales activity.
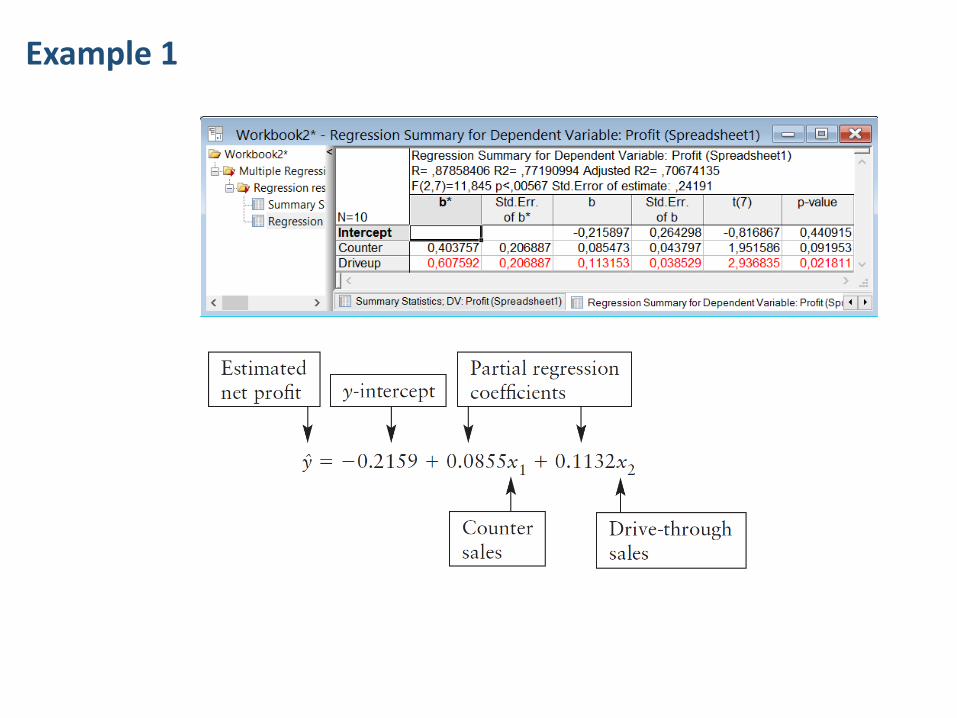
For these data, there will be one dependent variable (y net profit) and two independent variables (𝑥1 counter sales; 𝑥2 drive-through sales). The form ofthe sample regression equation will be 𝑦 = 𝑏0 + 𝑏1 𝑥1 + 𝑏2 𝑥2.

The multiple linear regression model
The multiple linear regression model
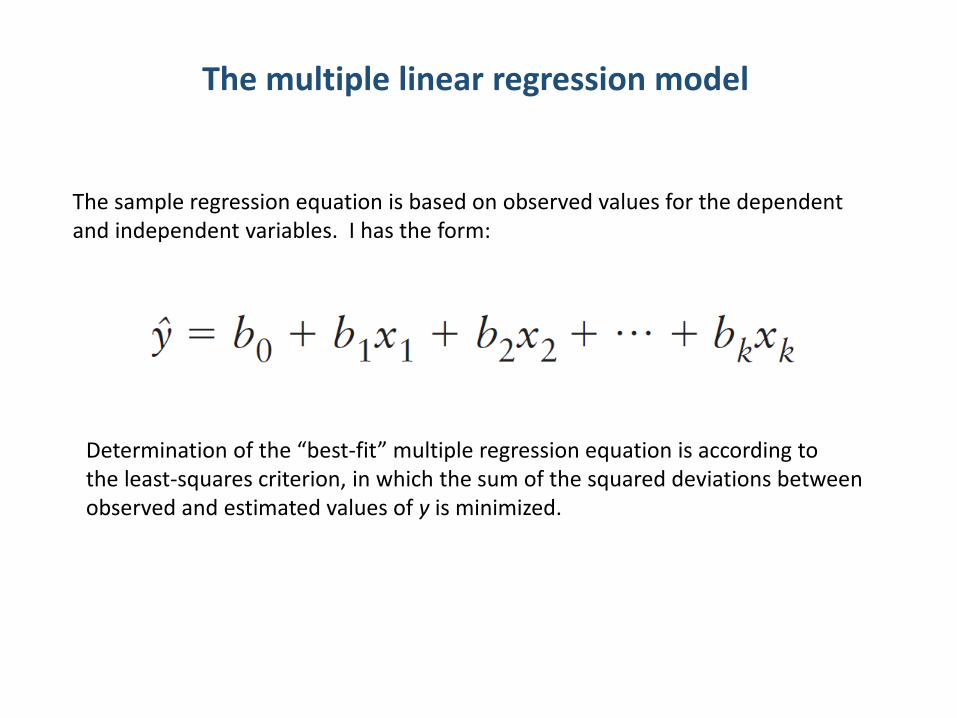
The sample regression equation is based on observed values for the dependentand independent variables. I has the form:
Determination of the “best-fit” multiple regression equation is according tothe least-squares criterion, in which the sum of the squared deviations betweenobserved and estimated values of y is minimized.

Assumptions for multiple linear regression
1. Linear relationship between the independent and dependent variables2. All variables are normally distributed3. No multicollinearity – independent variables must not be highly
correlated4. Independence of random errors (residuals)5. Homoscedasticity (homogeneity of variance)6. Normally distributed errors

Example 1
Solution in Excel

Example 1
Solution in Statistica

Example 1
1
2
3
Example 1
1
2
3
4
5
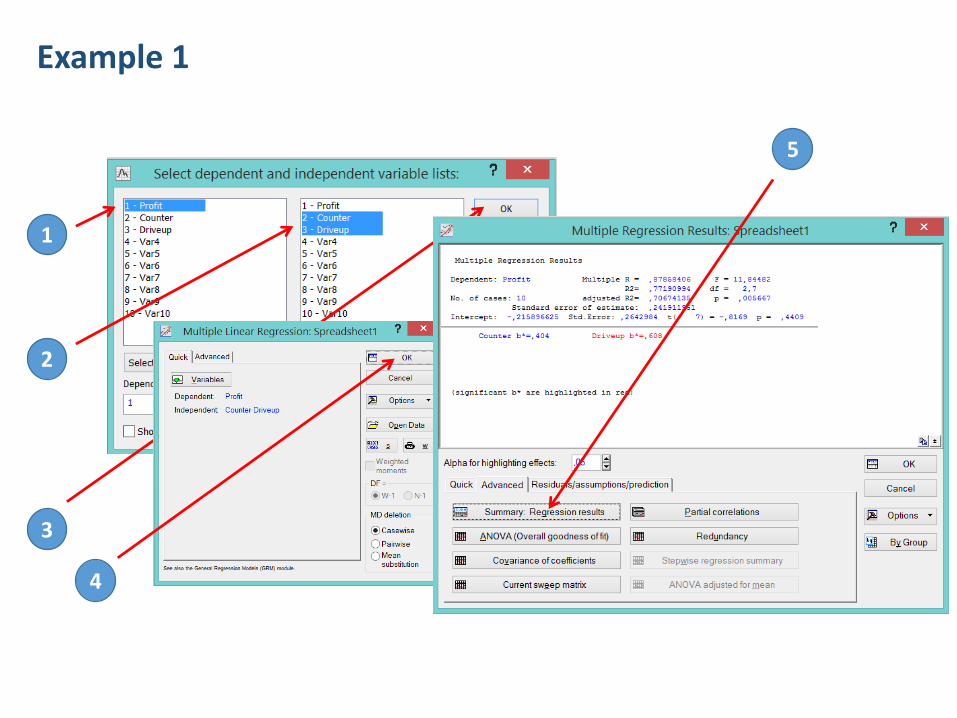
Example 1

Example 1
The scatter diagram for thefast-food data can be visualizedas a room where each of 10 helium-filled balloons is held to the floor by a string. The length of each string is the observed value of y for that data point. Theleast-squares regressionequation (not shown) passesthrough the data and takes the form of atwo-dimensional surface, orplane.

Example 1 - Point Estimation Using the Regression Equation
Point estimates are made by substituting a set of x values into the regression equationand calculating the estimated value of y. For example, if a franchise had sold 𝑥1= $5.0 million over the counter and 𝑥2 = $7.4 million at the drive-through, we would estimate its net profit as $1.05 million:
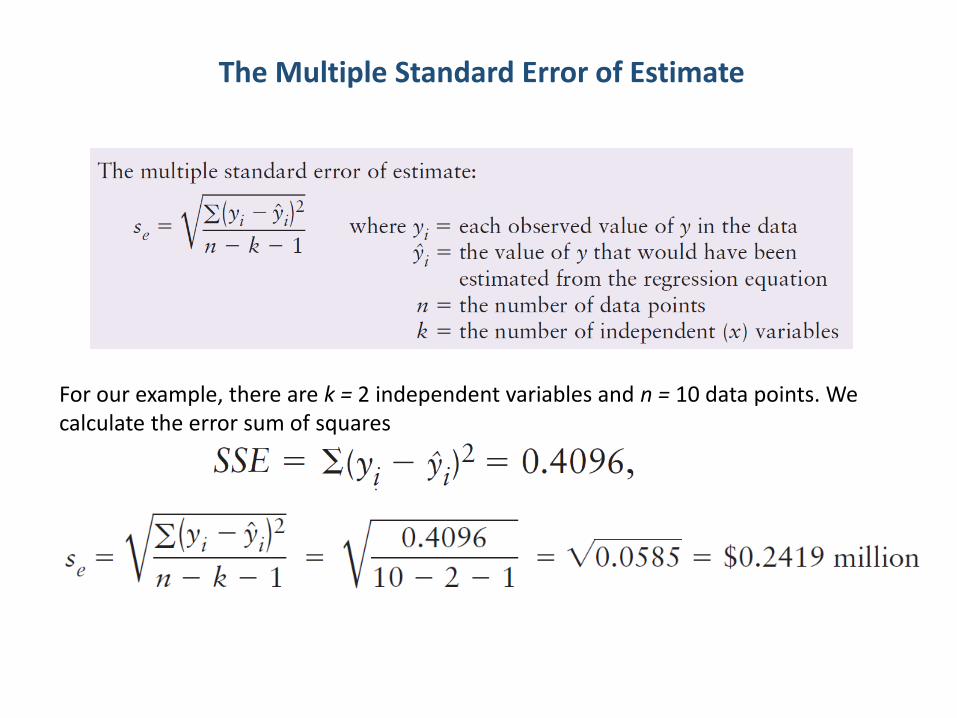
The Multiple Standard Error of Estimate
For our example, there are k = 2 independent variables and n = 10 data points. We calculate the error sum of squares

Example 1 - Confidence Interval for the Conditional Mean of y
For the sample of 10fastfood franchises, thesummary results from these calculations areimportant in determiningboth the multiple standard error of estimate and thecoefficients of multiplecorrelation and determination.(Data are in millionsof dollars.)
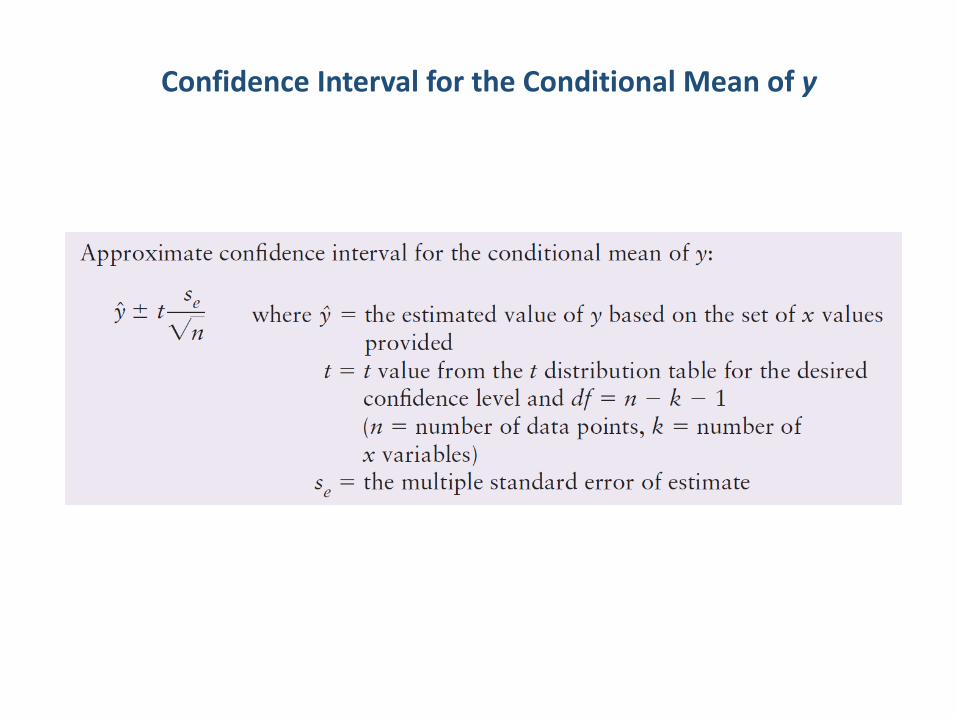
Confidence Interval for the Conditional Mean of y

Example 1 - Confidence Interval for the Conditional Mean of y

Example 1 - Confidence Interval for the Conditional Mean of y
Solution in Statistica
1
2
4
3

Example 1 - Confidence Interval for the Conditional Mean of y
Solution in Statistica
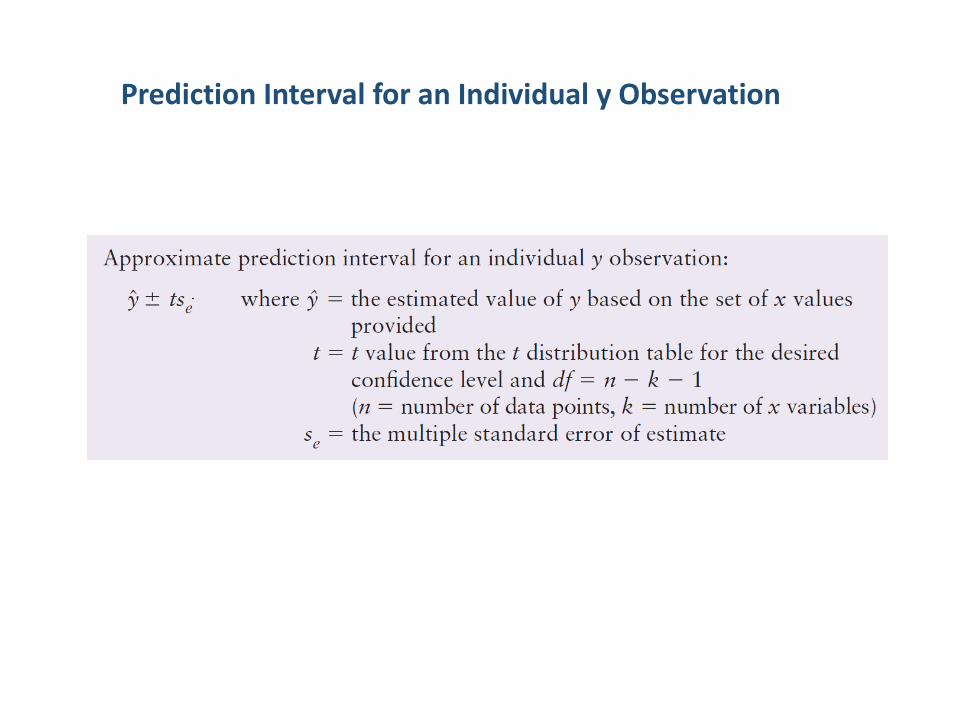
Prediction Interval for an Individual y Observation
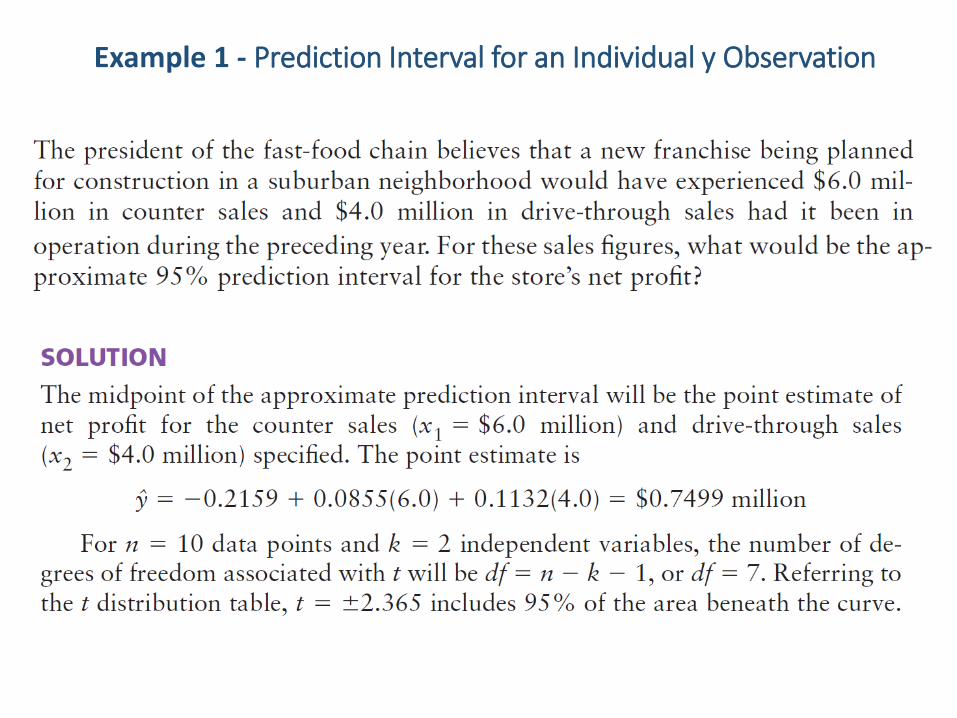
Example 1 - Prediction Interval for an Individual y Observation

Example 1 - Prediction Interval for an Individual y Observation

Example 1 - Prediction Interval for an Individual y Observation
Solution in Statistica

Testing the Partial Regression Coefficients

Example 1 - Testing the Partial Regression Coefficients
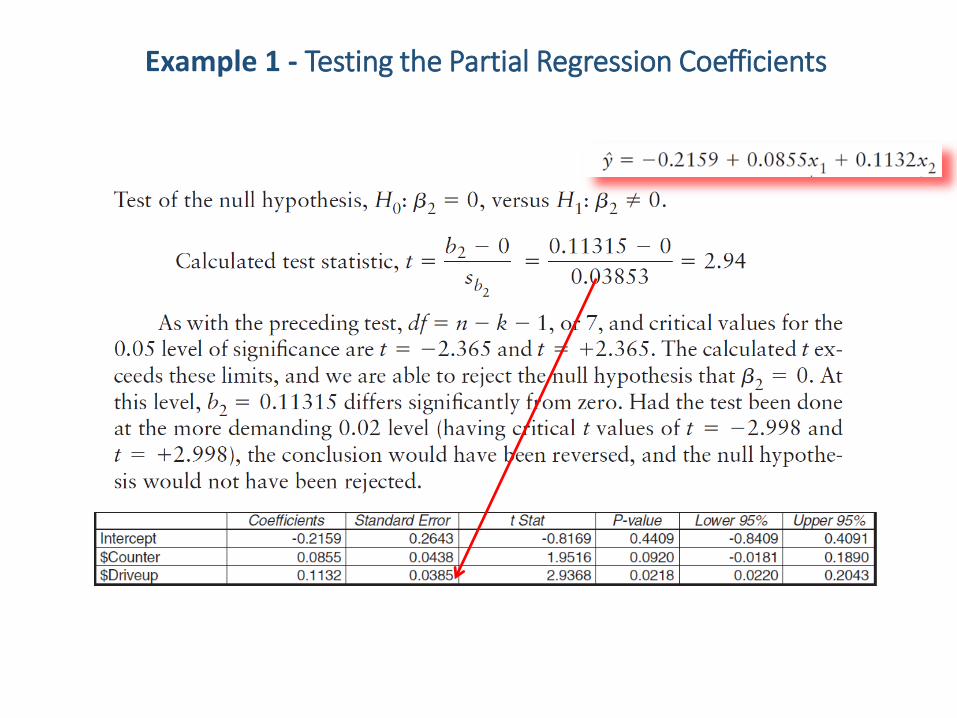
Example 1 - Testing the Partial Regression Coefficients
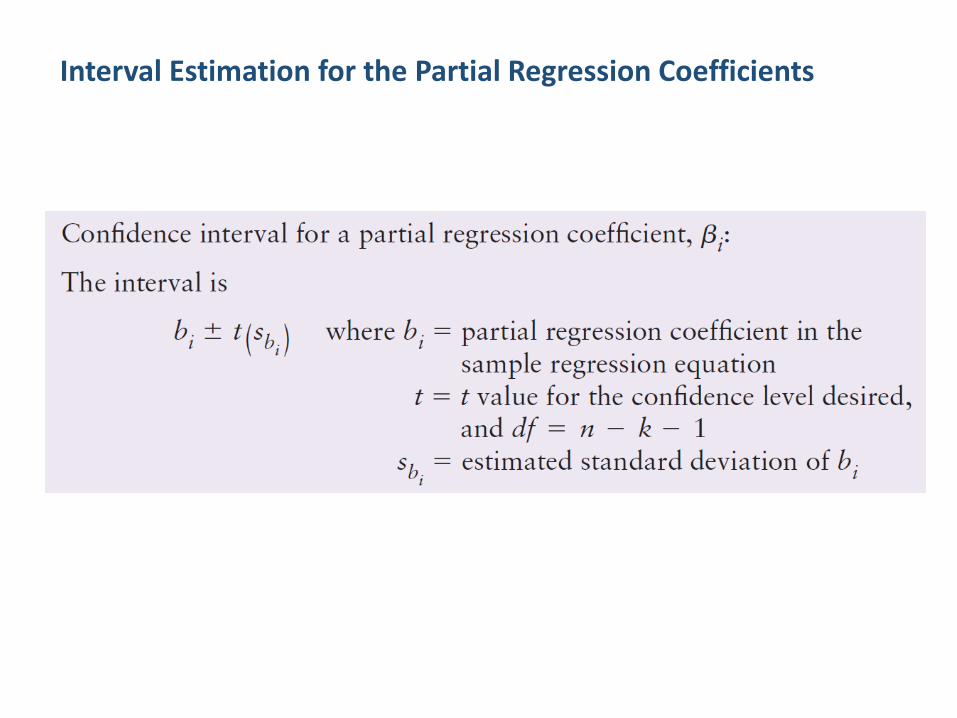
Interval Estimation for the Partial Regression Coefficients

Example 1 - Interval Estimation for the Partial Regression Coefficients
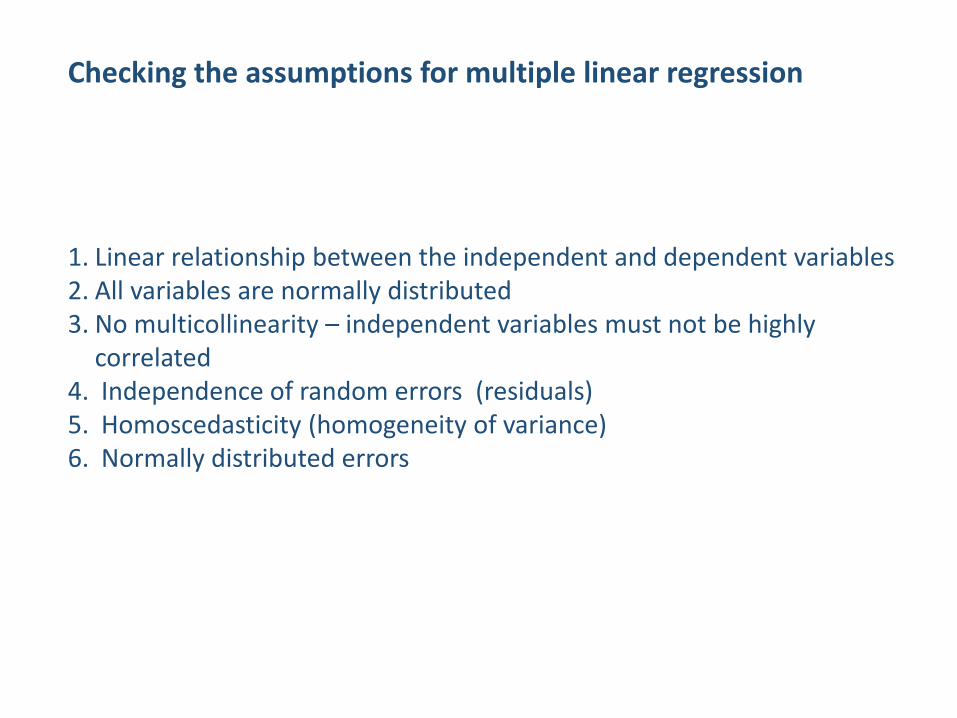
Checking the assumptions for multiple linear regression
1. Linear relationship between the independent and dependent variables2. All variables are normally distributed3. No multicollinearity – independent variables must not be highly
correlated4. Independence of random errors (residuals)5. Homoscedasticity (homogeneity of variance)6. Normally distributed errors

Example 2 - Checking the assumptions for multiple linear regression
Solution in Statistica

Example 2 - Linear relationship between the independent and dependent variables
1
2
3

Example 2 - Linear relationship between the independent and dependent variables
1
2
3

Example 2 - Linear relationship between the independent and dependent variables
1
2 Checking the linear relationship between Y and X1 – X7

Example 2 - Linear relationship between the independent and dependent variables
1

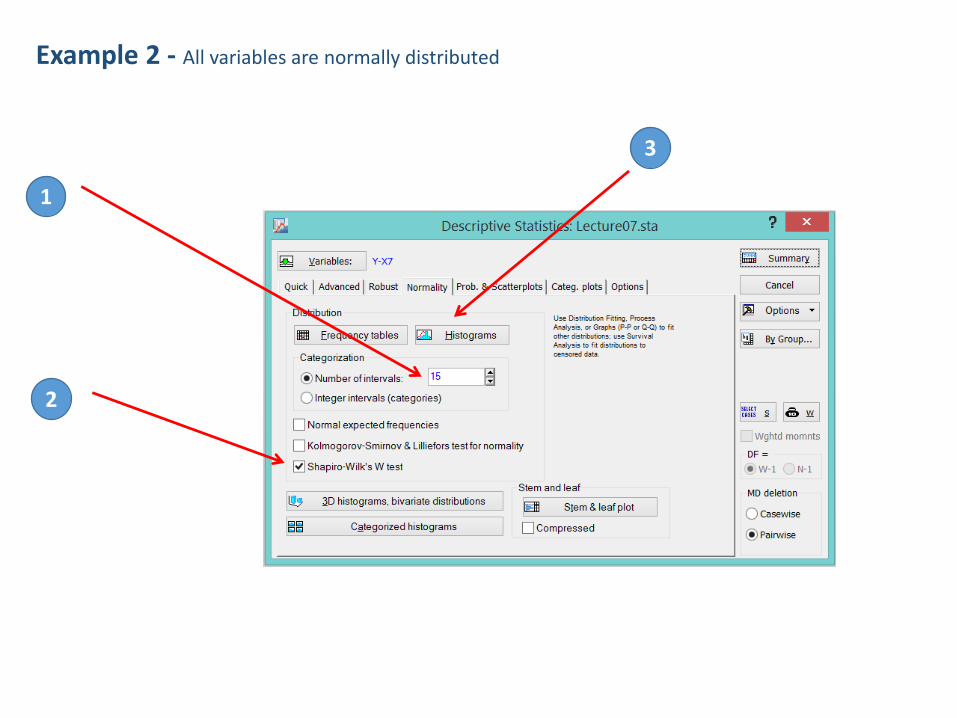
Example 2 - All variables are normally distributed
1
2
3
4
Example 2 - All variables are normally distributed
1
2
3
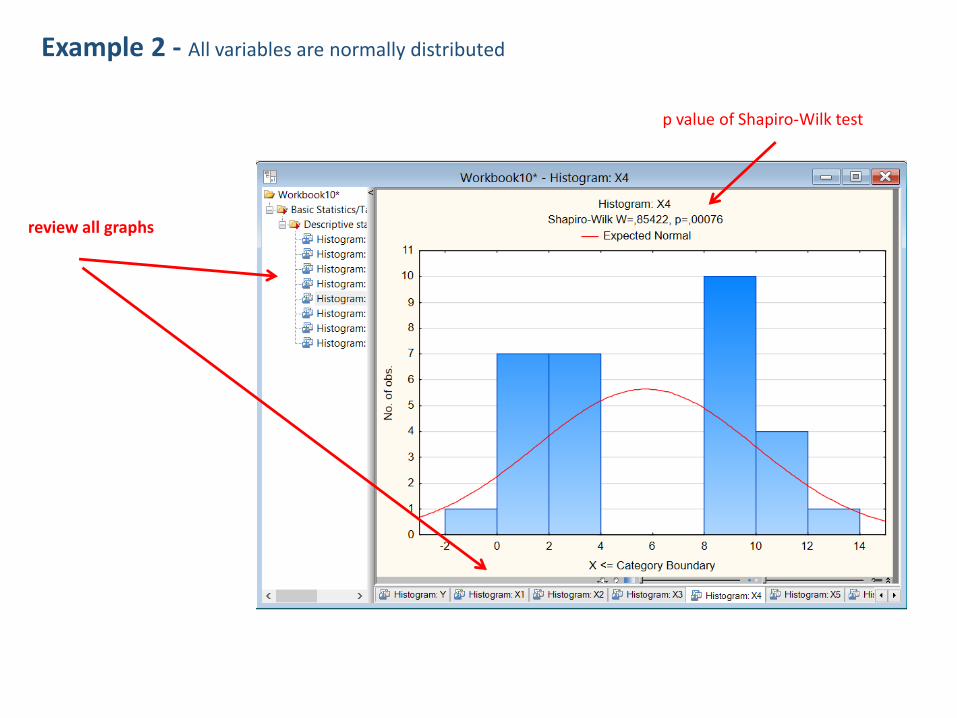
Example 2 - All variables are normally distributed
p value of Shapiro-Wilk test
review all graphs

Example 2 - No multicollinearity
1
2
3

Example 2 - No multicollinearity
1
2
3

Example 2 - No multicollinearity
1
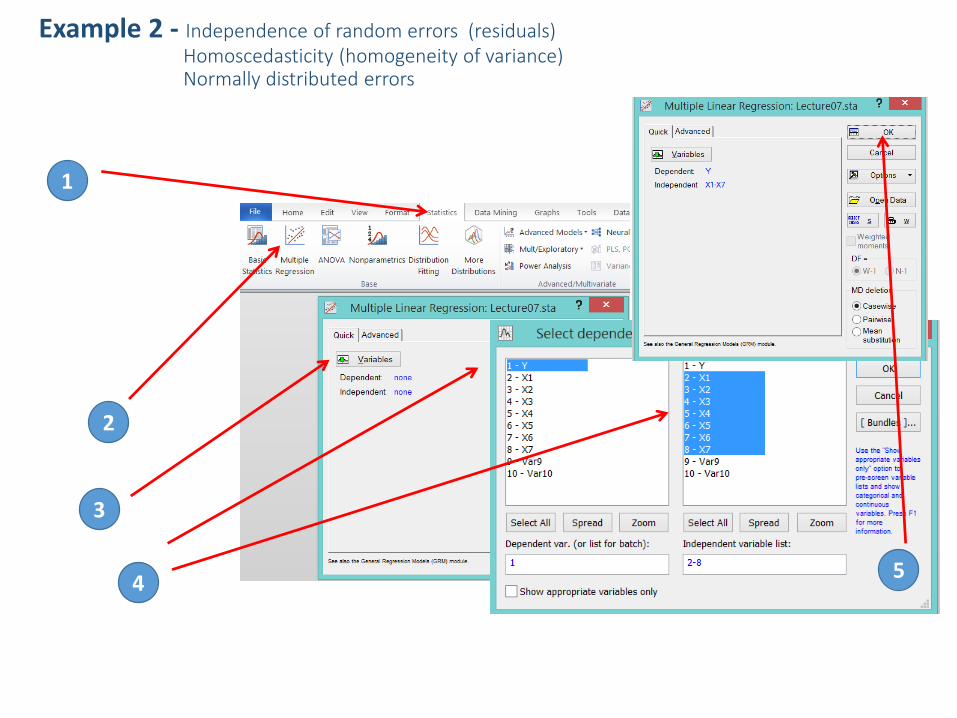
Example 2 - Independence of random errors (residuals)Homoscedasticity (homogeneity of variance)Normally distributed errors
1
2
3
45
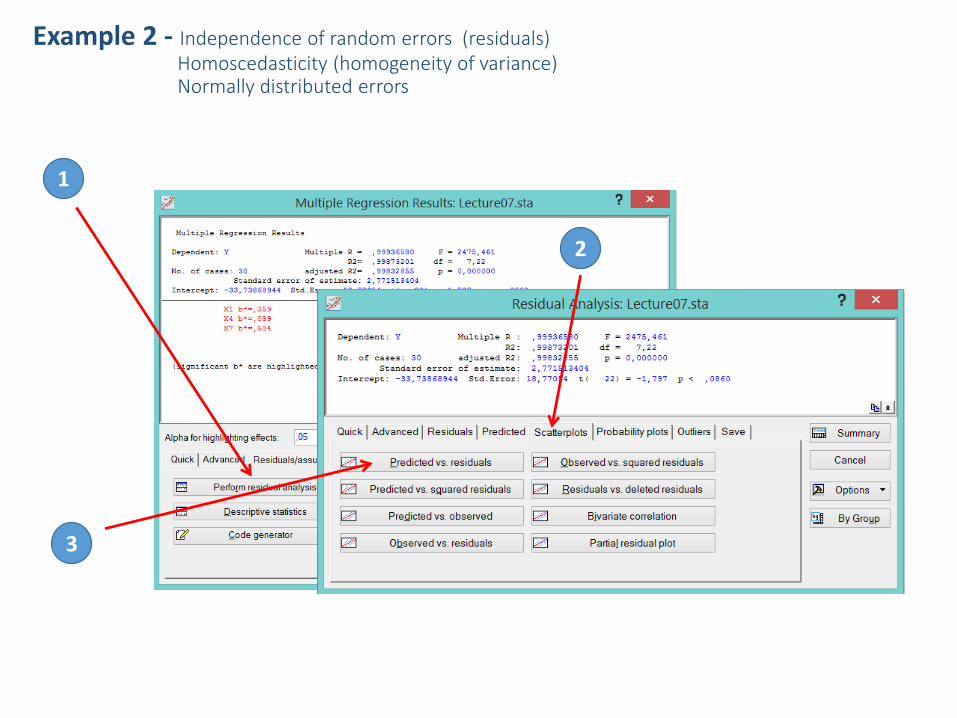
Example 2 - Independence of random errors (residuals)Homoscedasticity (homogeneity of variance)Normally distributed errors
1
2
3

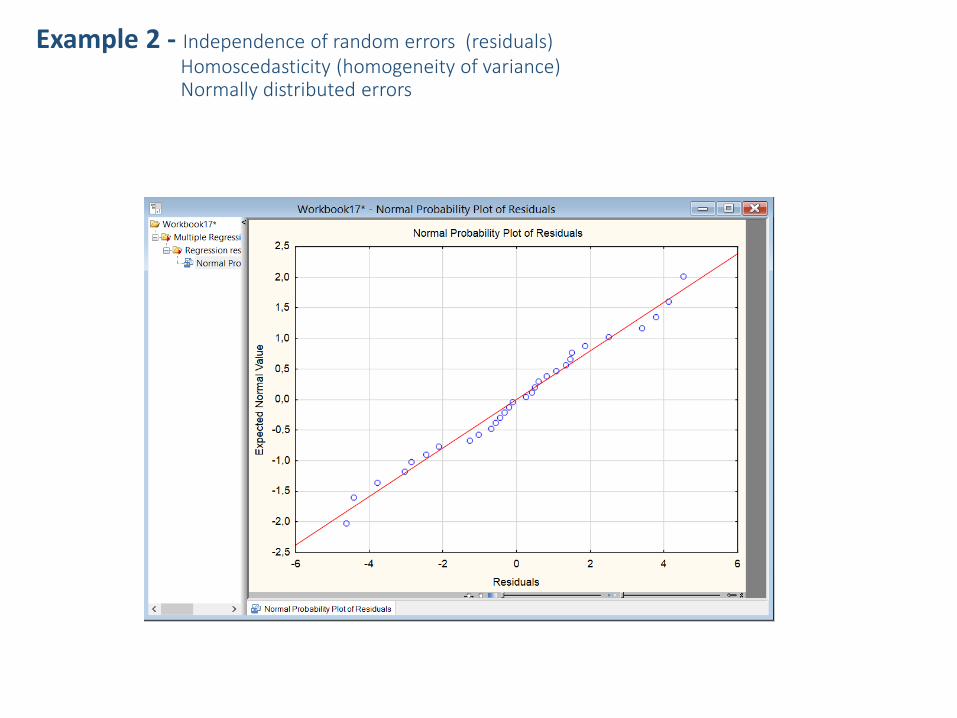
Example 2 - Independence of random errors (residuals)Homoscedasticity (homogeneity of variance)Normally distributed errors

Example 2 - Independence of random errors (residuals)Homoscedasticity (homogeneity of variance)Normally distributed errors
12
Example 2 - Independence of random errors (residuals)Homoscedasticity (homogeneity of variance)Normally distributed errors

Example 2 - Checking the assumptions for multiple linear regression
Solution in Excel

Example 2 - Linear relationship between the independent and dependent variables
1
2
3

Example 2 - Linear relationship between the independent and dependent variables
1
2
3

Example 2 - All variables are normally distributed
1
2
34

Example 2 - All variables are normally distributed
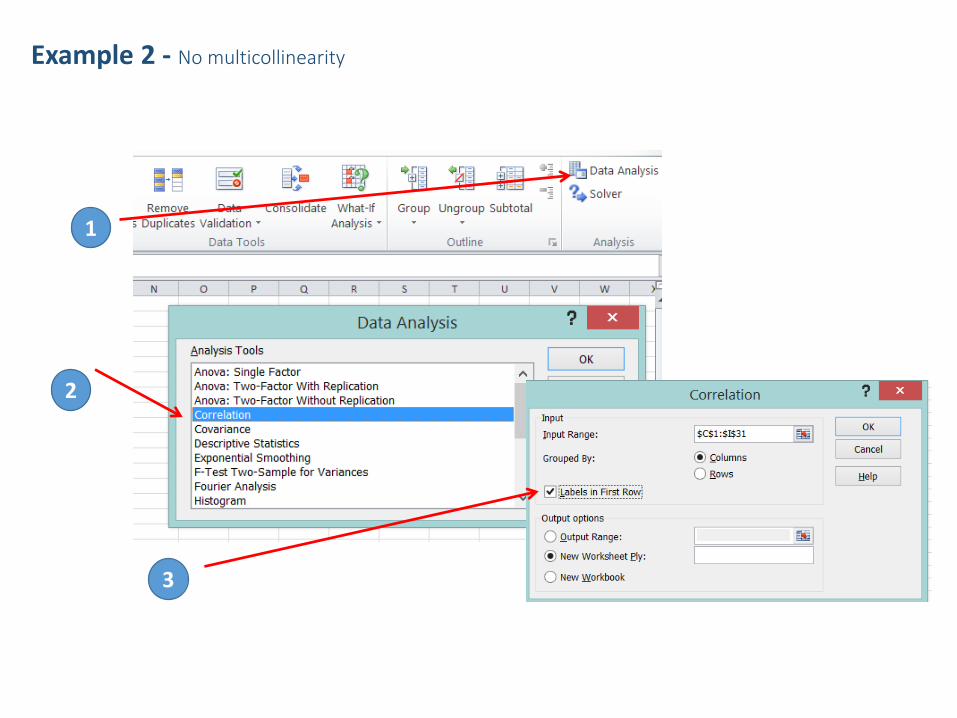
Example 2 - No multicollinearity
1
2
3

Example 2 - No multicollinearity

Example 2 - Independence of random errors (residuals)Homoscedasticity (homogeneity of variance)Normally distributed errors
1
2
3
4 5

Example 2 - Independence of random errors (residuals)Homoscedasticity (homogeneity of variance)Normally distributed errors
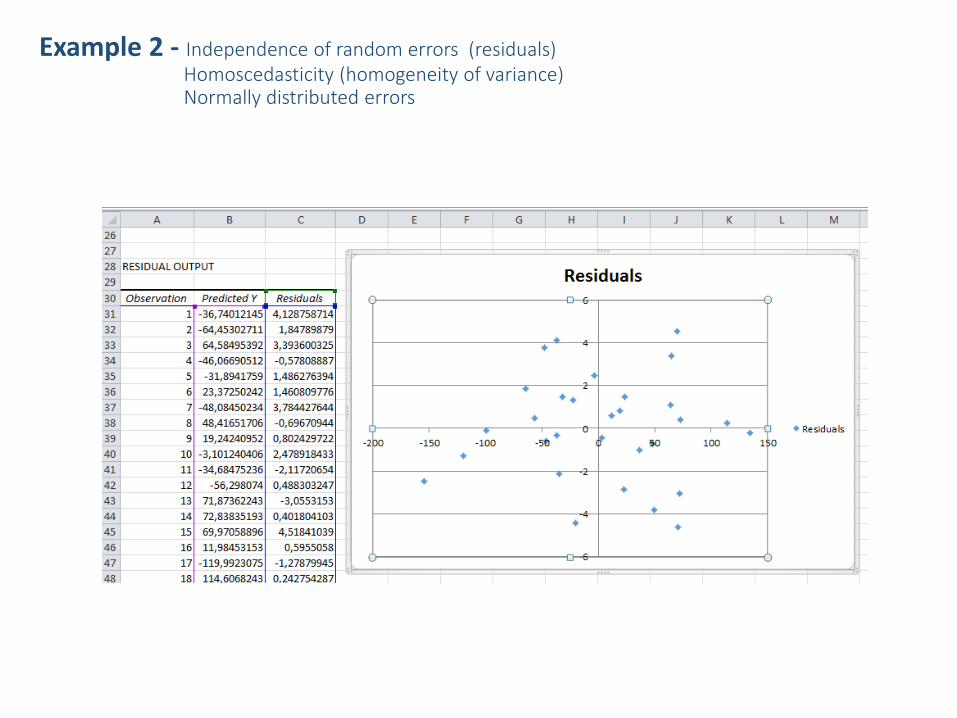
Example 2 - Independence of random errors (residuals)Homoscedasticity (homogeneity of variance)Normally distributed errors

Example 2 - Independence of random errors (residuals)Homoscedasticity (homogeneity of variance)Normally distributed errors