estonia, latvia, lithuania - labour relations and social...
TRANSCRIPT
1
Regional Project on Labour Relations and Social Dialogue Warsaw in February 2013
Annual Review 2012
Estonia, Latvia, Lithuania - Labour Relations and Social Dialogue Author: Aija Lulle1, PhD candidate and researcher at the University of Latvia Executive Summary
After the collapse of the Soviet Union all three Baltic countries adopted open economy approach and have liberal market economies. Baltic states entered the EU in 2004. Although all three states are similar, Estonia has better development trends and economic achievements. Estonia also joined the euro zone in 2011; Lat-via plans to join the euro zone in 2014, while in Lithuania discussions have been continued throughout 2012 and the decision, when to join the Euro zone should be made in 2013. At the macro level, development in the Baltic states has been radically uneven with high economic growth rates and low unemployment levels in 2004-2007 and high unemployment and deep economic and financial crisis from late 2008 onwards. Economic and financial crisis, which started in late 2008 had the profound influence on the Baltic states‘ economies and social dialogue characteristics. Latvia was hit the hardest among the three countries; Latvia and Lithuania also experienced large amount emigration due to crisis and strict austerity measures and rapidly rising unemployment. Latvia was also forced to seek for the interna-tional financial help from International Monitory Fund (IMF) and the European Commission (EC). Shadow economy is seen as a major problem, in particular undeclared or partially undeclared work, with estimates suggesting that it accounts for 20-30 or more per cent of GDP. In 2012 all three states exhibit re-covery trends with GDP growth and employment rate increase among the highest in the EU. According to the UNDP Human development reports in 2011 and 2012 Estonia was placed among a Very High Human Development countries’ group giving a 34th place among 42 most developed World economies in 2010 and 2011. In the meantime Lithuania remained in a High Human Development group, occupying 44th and 40th place, while Latvia was at 48th and 43rd places in the respective years. Trade unions (TU) in the Baltic states are generally weak and carry stigma attached to them as ‚Soviet style‘ organisations. TU’s are in particularly difficult situation in Estonia. Social dialoge in the Baltic states is rather weak and declarative, especially during the crisis years; sectorial level social dialogue is largely absent.
1 Aija Lulle, born in Latvia in 1975, is the PhD candidate and researcher at the University of Latvia, depart-ment of Human geography. She has studied also at the Stockholm University (2011) and was a visiting re-searcher at the London Metropolitan University, Working Lives Research Institute (2012). She strongly sup-ports interdisciplinary approach and has an extensive research background in Latvia and Europe. She coop-erates with the Working Lives Research Institute, the International Organization for Migration, and others, as a national expert on migration and labour market issues.
2
1. Report
1.1 Executive Summary
After the collapse of the Soviet Union all three Baltic countries adopted open economy approach and have liberal market economies. Baltic states entered the EU in 2004. Although all three states are similar, Estonia has better development trends and economic achievements. Estonia also joined the euro zone in 2011; Latvia plans to join the euro zone in 2014, while in Lithuania discussions have been continued throughout 2012 and the decision, when to join the Euro zone should be made in 2013. At the macro level, development in the Baltic states has been radically uneven with high eco-nomic growth rates and low unemployment levels in 2004-2007 and high unemployment and deep economic and financial crisis from late 2008 on-wards. Economic and financial crisis, which started in late 2008 had the profound influence on the Baltic states‘ economies and social dialogue characteristics. Latvia was hit the hardest among the three countries; Latvia and Lithuania also ex-perienced large amount emigration due to crisis and strict austerity measures and rapidly rising unemployment. Latvia was also forced to seek for the international financial help from International Monitory Fund (IMF) and the European Commis-sion (EC). Shadow economy is seen as a major problem, in particular undeclared or partially undeclared work, with estimates suggesting that it accounts for 20-30 or more per cent of GDP. In 2012 all three
states exhibit recovery trends with GDP growth and employment rate increase among the highest in the EU. According to the UNDP Human development re-ports in 2011 and 2012 Estonia was placed among a Very High Human Development coun-tries’ group giving a 34th place among 42 most developed World economies in 2010 and 2011. In the meantime Lithuania remained in a High Hu-man Development group, occupying 44th and 40 th place, while Latvia was at 48th and 43rd places in the respective years. Trade unions (TU) in the Baltic states are gener-ally weak and carry stigma attached to them as ‚Soviet style‘ organisations. TU’s are in particularly difficult situation in Estonia. Social dialoge in the Baltic states is rather weak and declarative, espe-cially during the crisis years; sectorial level social dialogue is largely absent. 1.2 Socio-economic developments
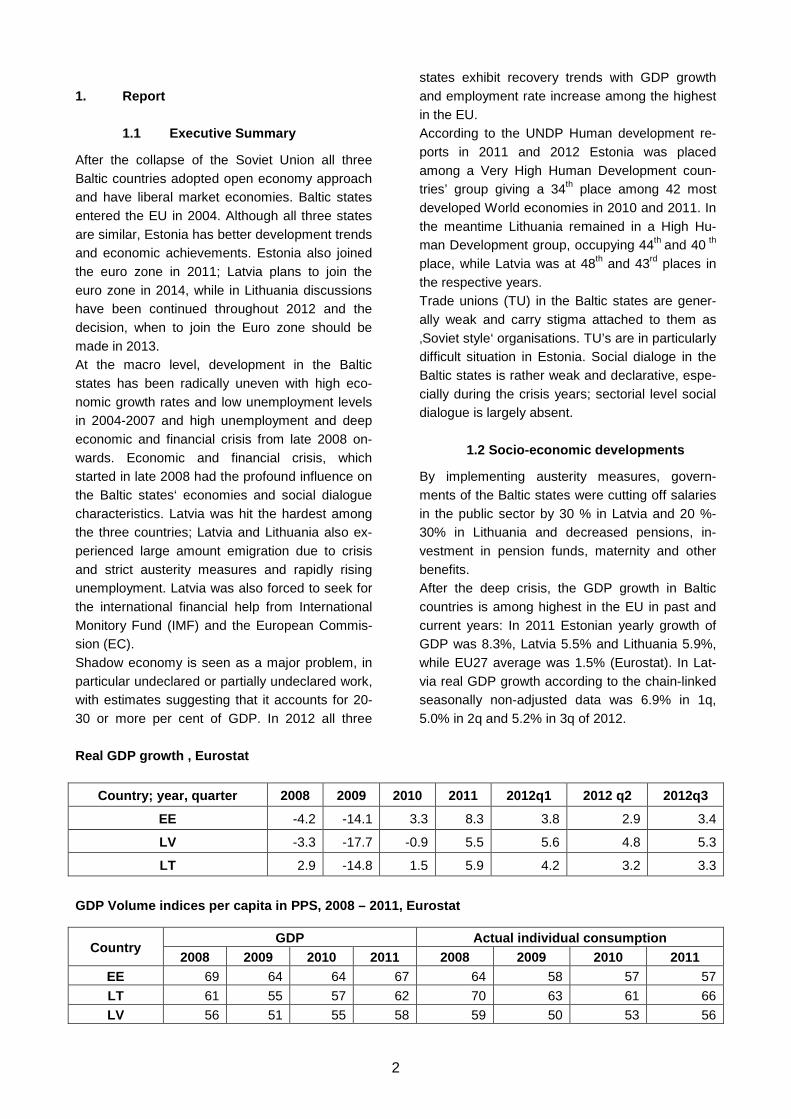
By implementing austerity measures, govern-ments of the Baltic states were cutting off salaries in the public sector by 30 % in Latvia and 20 %-30% in Lithuania and decreased pensions, in-vestment in pension funds, maternity and other benefits. After the deep crisis, the GDP growth in Baltic countries is among highest in the EU in past and current years: In 2011 Estonian yearly growth of GDP was 8.3%, Latvia 5.5% and Lithuania 5.9%, while EU27 average was 1.5% (Eurostat). In Lat-via real GDP growth according to the chain-linked seasonally non-adjusted data was 6.9% in 1q, 5.0% in 2q and 5.2% in 3q of 2012.
Real GDP growth , Eurostat
Country; year, quarter 2008 2009 2010 2011 2012q1 2 012 q2 2012q3
EE -4.2 -14.1 3.3 8.3 3.8 2.9 3.4
LV -3.3 -17.7 -0.9 5.5 5.6 4.8 5.3
LT 2.9 -14.8 1.5 5.9 4.2 3.2 3.3
GDP Volume indices per capita in PPS, 2008 – 2011, Eurostat
Country GDP Actual individual consumption
2008 2009 2010 2011 2008 2009 2010 2011 EE 69 64 64 67 64 58 57 57
LT 61 55 57 62 70 63 61 66
LV 56 51 55 58 59 50 53 56
3
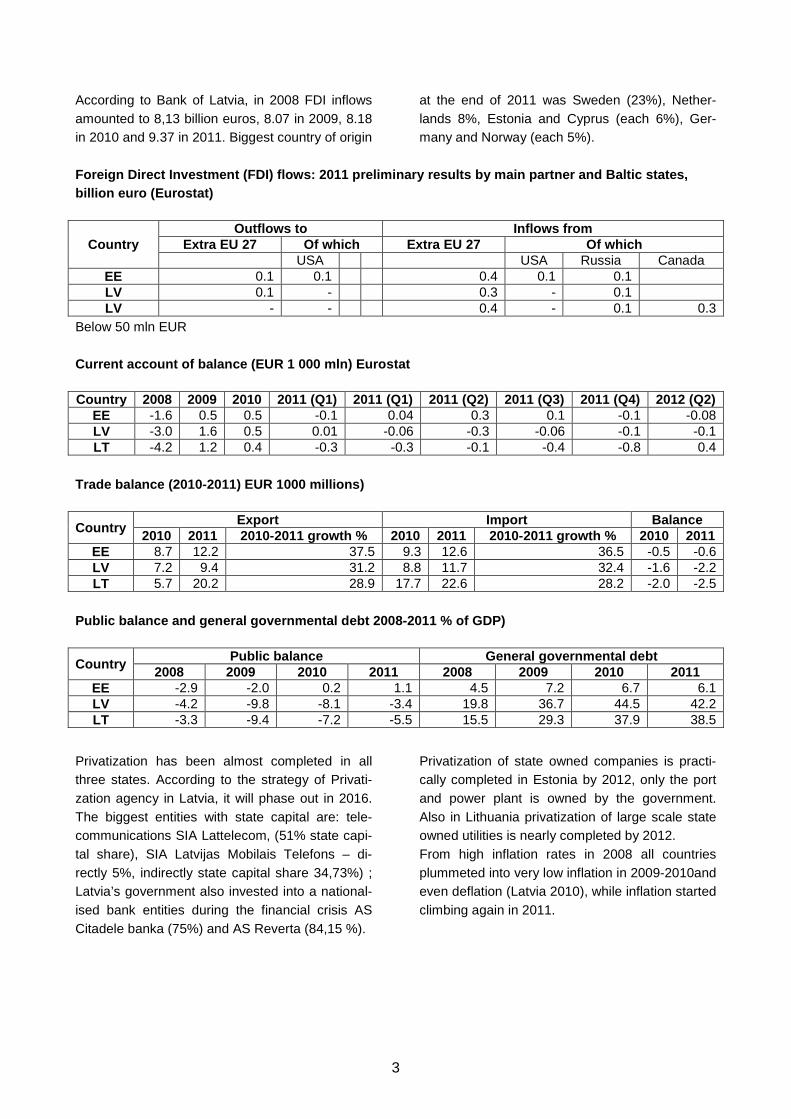
According to Bank of Latvia, in 2008 FDI inflows amounted to 8,13 billion euros, 8.07 in 2009, 8.18 in 2010 and 9.37 in 2011. Biggest country of origin
at the end of 2011 was Sweden (23%), Nether-lands 8%, Estonia and Cyprus (each 6%), Ger-many and Norway (each 5%).
Foreign Direct Investment (FDI) flows: 2011 prelimi nary results by main partner and Baltic states, billion euro (Eurostat)
Country Outflows to Inflows from
Extra EU 27 Of which Extra EU 27 Of which USA USA Russia Canada
EE 0.1 0.1 0.4 0.1 0.1 LV 0.1 - 0.3 - 0.1 LV - - 0.4 - 0.1 0.3
Below 50 mln EUR Current account of balance (EUR 1 000 mln) Eurostat
Country 2008 2009 2010 2011 (Q1) 2011 (Q1) 2011 (Q2) 2011 (Q3) 2011 (Q4) 2012 (Q2)
EE -1.6 0.5 0.5 -0.1 0.04 0.3 0.1 -0.1 -0.08 LV -3.0 1.6 0.5 0.01 -0.06 -0.3 -0.06 -0.1 -0.1 LT -4.2 1.2 0.4 -0.3 -0.3 -0.1 -0.4 -0.8 0.4
Trade balance (2010-2011) EUR 1000 millions)
Country Export Import Balance
2010 2011 2010-2011 growth % 2010 2011 2010-2011 gr owth % 2010 2011 EE 8.7 12.2 37.5 9.3 12.6 36.5 -0.5 -0.6 LV 7.2 9.4 31.2 8.8 11.7 32.4 -1.6 -2.2 LT 5.7 20.2 28.9 17.7 22.6 28.2 -2.0 -2.5
Public balance and general governmental debt 2008-2 011 % of GDP)
Country Public balance General governmental debt
2008 2009 2010 2011 2008 2009 2010 2011 EE -2.9 -2.0 0.2 1.1 4.5 7.2 6.7 6.1 LV -4.2 -9.8 -8.1 -3.4 19.8 36.7 44.5 42.2 LT -3.3 -9.4 -7.2 -5.5 15.5 29.3 37.9 38.5
Privatization has been almost completed in all three states. According to the strategy of Privati-zation agency in Latvia, it will phase out in 2016. The biggest entities with state capital are: tele-communications SIA Lattelecom, (51% state capi-tal share), SIA Latvijas Mobilais Telefons – di-rectly 5%, indirectly state capital share 34,73%) ; Latvia’s government also invested into a national-ised bank entities during the financial crisis AS Citadele banka (75%) and AS Reverta (84,15 %).
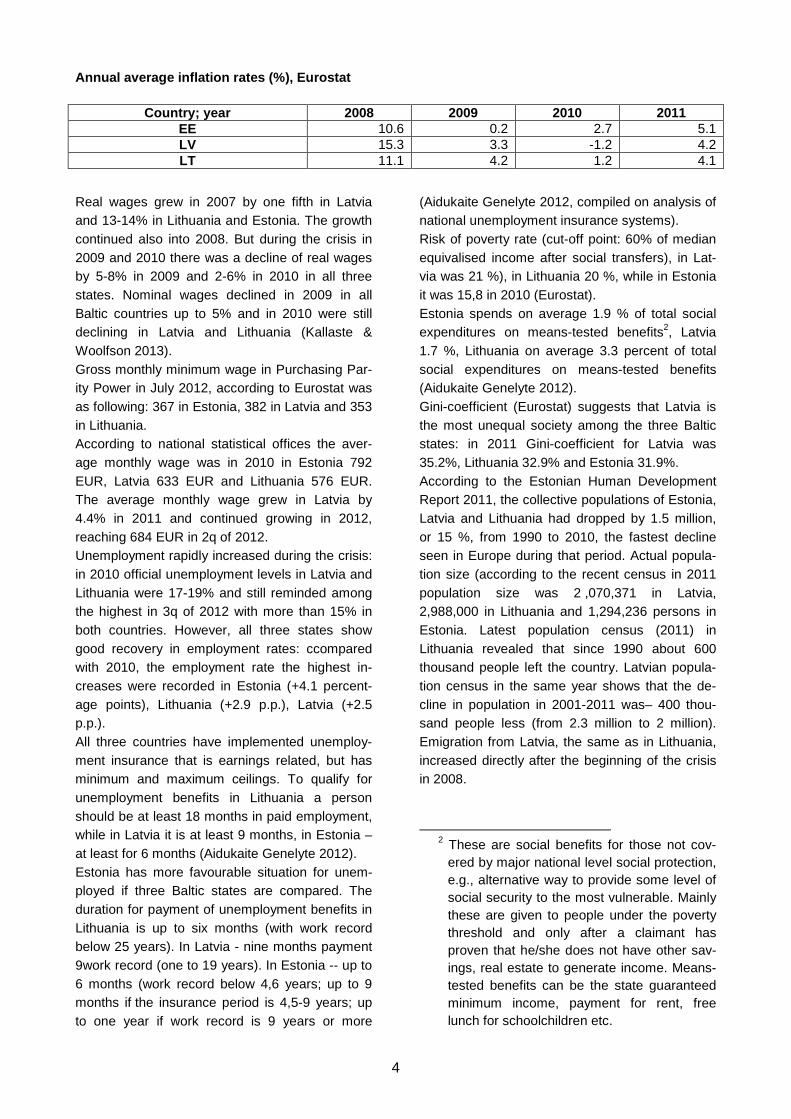
Privatization of state owned companies is practi-cally completed in Estonia by 2012, only the port and power plant is owned by the government. Also in Lithuania privatization of large scale state owned utilities is nearly completed by 2012. From high inflation rates in 2008 all countries plummeted into very low inflation in 2009-2010and even deflation (Latvia 2010), while inflation started climbing again in 2011.
4
Annual average inflation rates (%), Eurostat
Country; year 2008 2009 2010 2011 EE 10.6 0.2 2.7 5.1 LV 15.3 3.3 -1.2 4.2 LT 11.1 4.2 1.2 4.1
Real wages grew in 2007 by one fifth in Latvia and 13-14% in Lithuania and Estonia. The growth continued also into 2008. But during the crisis in 2009 and 2010 there was a decline of real wages by 5-8% in 2009 and 2-6% in 2010 in all three states. Nominal wages declined in 2009 in all Baltic countries up to 5% and in 2010 were still declining in Latvia and Lithuania (Kallaste & Woolfson 2013). Gross monthly minimum wage in Purchasing Par-ity Power in July 2012, according to Eurostat was as following: 367 in Estonia, 382 in Latvia and 353 in Lithuania. According to national statistical offices the aver-age monthly wage was in 2010 in Estonia 792 EUR, Latvia 633 EUR and Lithuania 576 EUR. The average monthly wage grew in Latvia by 4.4% in 2011 and continued growing in 2012, reaching 684 EUR in 2q of 2012. Unemployment rapidly increased during the crisis: in 2010 official unemployment levels in Latvia and Lithuania were 17-19% and still reminded among the highest in 3q of 2012 with more than 15% in both countries. However, all three states show good recovery in employment rates: ccompared with 2010, the employment rate the highest in-creases were recorded in Estonia (+4.1 percent-age points), Lithuania (+2.9 p.p.), Latvia (+2.5 p.p.). All three countries have implemented unemploy-ment insurance that is earnings related, but has minimum and maximum ceilings. To qualify for unemployment benefits in Lithuania a person should be at least 18 months in paid employment, while in Latvia it is at least 9 months, in Estonia – at least for 6 months (Aidukaite Genelyte 2012). Estonia has more favourable situation for unem-ployed if three Baltic states are compared. The duration for payment of unemployment benefits in Lithuania is up to six months (with work record below 25 years). In Latvia - nine months payment 9work record (one to 19 years). In Estonia -- up to 6 months (work record below 4,6 years; up to 9 months if the insurance period is 4,5-9 years; up to one year if work record is 9 years or more
(Aidukaite Genelyte 2012, compiled on analysis of national unemployment insurance systems). Risk of poverty rate (cut-off point: 60% of median equivalised income after social transfers), in Lat-via was 21 %), in Lithuania 20 %, while in Estonia it was 15,8 in 2010 (Eurostat). Estonia spends on average 1.9 % of total social expenditures on means-tested benefits2, Latvia 1.7 %, Lithuania on average 3.3 percent of total social expenditures on means-tested benefits (Aidukaite Genelyte 2012). Gini-coefficient (Eurostat) suggests that Latvia is the most unequal society among the three Baltic states: in 2011 Gini-coefficient for Latvia was 35.2%, Lithuania 32.9% and Estonia 31.9%. According to the Estonian Human Development Report 2011, the collective populations of Estonia, Latvia and Lithuania had dropped by 1.5 million, or 15 %, from 1990 to 2010, the fastest decline seen in Europe during that period. Actual popula-tion size (according to the recent census in 2011 population size was 2 ,070,371 in Latvia, 2,988,000 in Lithuania and 1,294,236 persons in Estonia. Latest population census (2011) in Lithuania revealed that since 1990 about 600 thousand people left the country. Latvian popula-tion census in the same year shows that the de-cline in population in 2001-2011 was– 400 thou-sand people less (from 2.3 million to 2 million). Emigration from Latvia, the same as in Lithuania, increased directly after the beginning of the crisis in 2008.
2 These are social benefits for those not cov-
ered by major national level social protection, e.g., alternative way to provide some level of social security to the most vulnerable. Mainly these are given to people under the poverty threshold and only after a claimant has proven that he/she does not have other sav-ings, real estate to generate income. Means-tested benefits can be the state guaranteed minimum income, payment for rent, free lunch for schoolchildren etc.
5
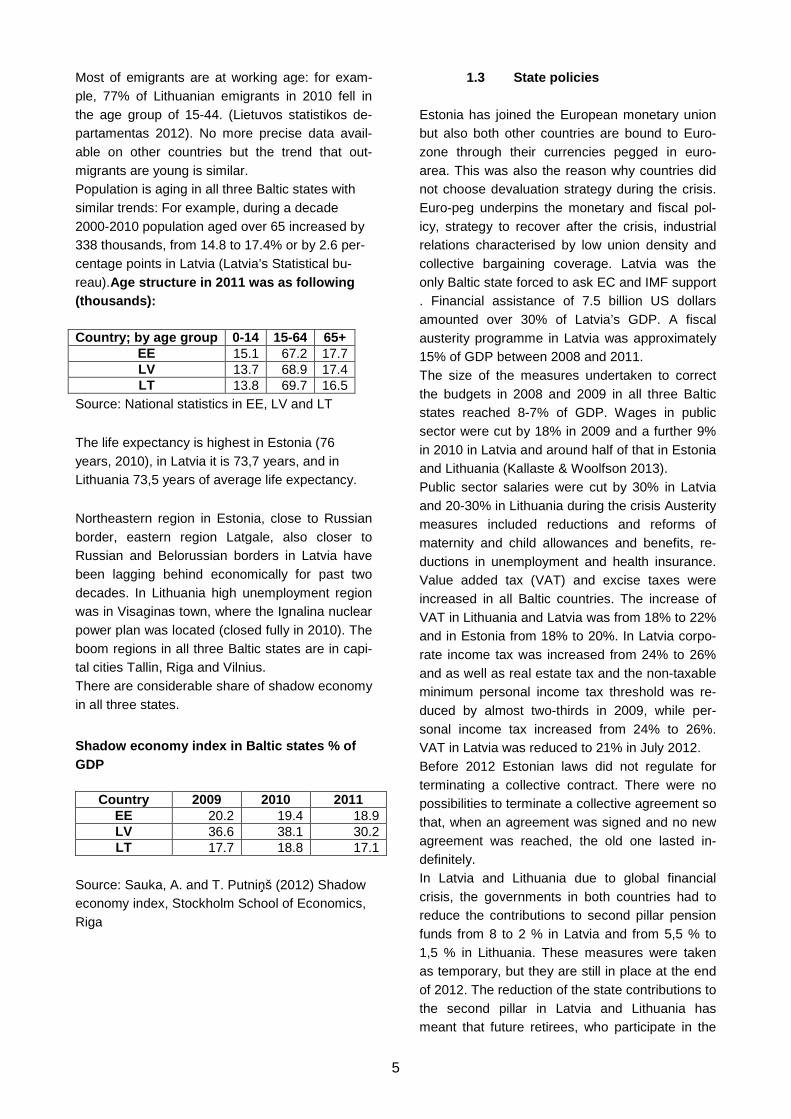
Most of emigrants are at working age: for exam-ple, 77% of Lithuanian emigrants in 2010 fell in the age group of 15-44. (Lietuvos statistikos de-partamentas 2012). No more precise data avail-able on other countries but the trend that out-migrants are young is similar. Population is aging in all three Baltic states with similar trends: For example, during a decade 2000-2010 population aged over 65 increased by 338 thousands, from 14.8 to 17.4% or by 2.6 per-centage points in Latvia (Latvia’s Statistical bu-reau).Age structure in 2011 was as following (thousands):
Country; by age group 0-14 15-64 65+ EE 15.1 67.2 17.7 LV 13.7 68.9 17.4 LT 13.8 69.7 16.5
Source: National statistics in EE, LV and LT
The life expectancy is highest in Estonia (76 years, 2010), in Latvia it is 73,7 years, and in Lithuania 73,5 years of average life expectancy.
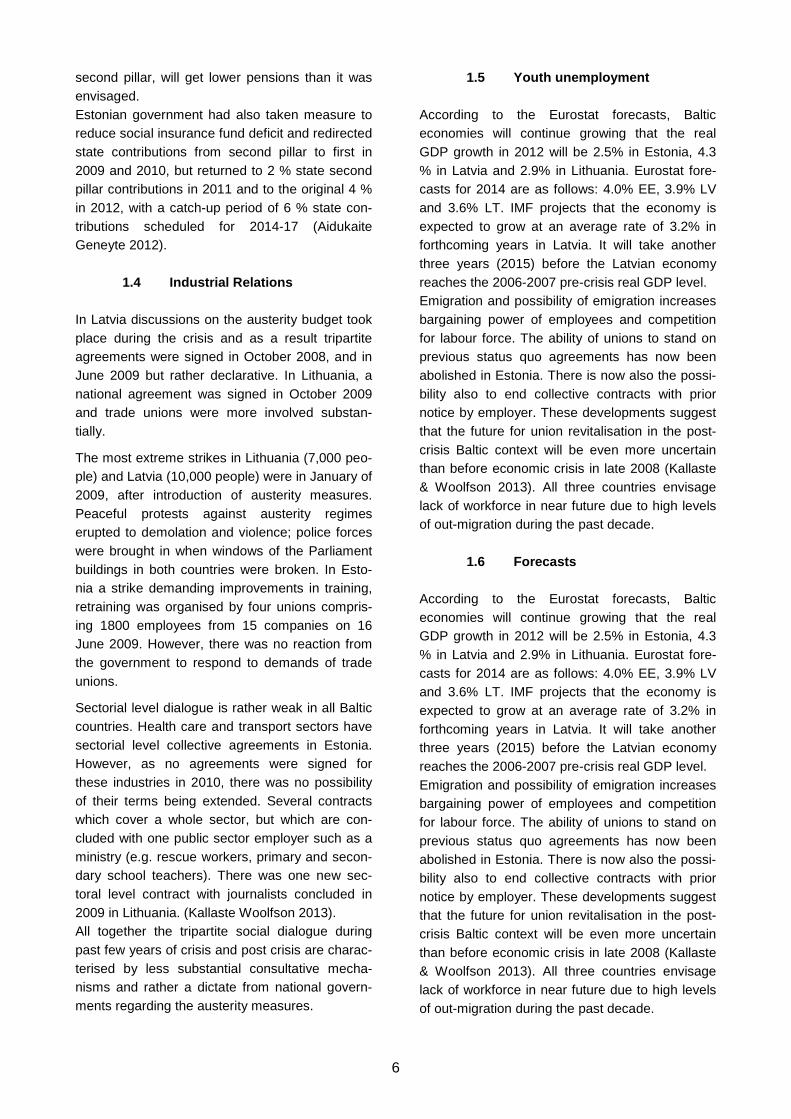
Northeastern region in Estonia, close to Russian border, eastern region Latgale, also closer to Russian and Belorussian borders in Latvia have been lagging behind economically for past two decades. In Lithuania high unemployment region was in Visaginas town, where the Ignalina nuclear power plan was located (closed fully in 2010). The boom regions in all three Baltic states are in capi-tal cities Tallin, Riga and Vilnius. There are considerable share of shadow economy in all three states.
Shadow economy index in Baltic states % of GDP
Country 2009 2010 2011 EE 20.2 19.4 18.9 LV 36.6 38.1 30.2 LT 17.7 18.8 17.1
Source: Sauka, A. and T. Putniņš (2012) Shadow economy index, Stockholm School of Economics, Riga
1.3 State policies Estonia has joined the European monetary union but also both other countries are bound to Euro-zone through their currencies pegged in euro-area. This was also the reason why countries did not choose devaluation strategy during the crisis. Euro-peg underpins the monetary and fiscal pol-icy, strategy to recover after the crisis, industrial relations characterised by low union density and collective bargaining coverage. Latvia was the only Baltic state forced to ask EC and IMF support . Financial assistance of 7.5 billion US dollars amounted over 30% of Latvia’s GDP. A fiscal austerity programme in Latvia was approximately 15% of GDP between 2008 and 2011. The size of the measures undertaken to correct the budgets in 2008 and 2009 in all three Baltic states reached 8-7% of GDP. Wages in public sector were cut by 18% in 2009 and a further 9% in 2010 in Latvia and around half of that in Estonia and Lithuania (Kallaste & Woolfson 2013). Public sector salaries were cut by 30% in Latvia and 20-30% in Lithuania during the crisis Austerity measures included reductions and reforms of maternity and child allowances and benefits, re-ductions in unemployment and health insurance. Value added tax (VAT) and excise taxes were increased in all Baltic countries. The increase of VAT in Lithuania and Latvia was from 18% to 22% and in Estonia from 18% to 20%. In Latvia corpo-rate income tax was increased from 24% to 26% and as well as real estate tax and the non-taxable minimum personal income tax threshold was re-duced by almost two-thirds in 2009, while per-sonal income tax increased from 24% to 26%. VAT in Latvia was reduced to 21% in July 2012. Before 2012 Estonian laws did not regulate for terminating a collective contract. There were no possibilities to terminate a collective agreement so that, when an agreement was signed and no new agreement was reached, the old one lasted in-definitely. In Latvia and Lithuania due to global financial crisis, the governments in both countries had to reduce the contributions to second pillar pension funds from 8 to 2 % in Latvia and from 5,5 % to 1,5 % in Lithuania. These measures were taken as temporary, but they are still in place at the end of 2012. The reduction of the state contributions to the second pillar in Latvia and Lithuania has meant that future retirees, who participate in the
6
second pillar, will get lower pensions than it was envisaged. Estonian government had also taken measure to reduce social insurance fund deficit and redirected state contributions from second pillar to first in 2009 and 2010, but returned to 2 % state second pillar contributions in 2011 and to the original 4 % in 2012, with a catch-up period of 6 % state con-tributions scheduled for 2014-17 (Aidukaite Geneyte 2012).
1.4 Industrial Relations
In Latvia discussions on the austerity budget took place during the crisis and as a result tripartite agreements were signed in October 2008, and in June 2009 but rather declarative. In Lithuania, a national agreement was signed in October 2009 and trade unions were more involved substan-tially.
The most extreme strikes in Lithuania (7,000 peo-ple) and Latvia (10,000 people) were in January of 2009, after introduction of austerity measures. Peaceful protests against austerity regimes erupted to demolation and violence; police forces were brought in when windows of the Parliament buildings in both countries were broken. In Esto-nia a strike demanding improvements in training, retraining was organised by four unions compris-ing 1800 employees from 15 companies on 16 June 2009. However, there was no reaction from the government to respond to demands of trade unions.
Sectorial level dialogue is rather weak in all Baltic countries. Health care and transport sectors have sectorial level collective agreements in Estonia. However, as no agreements were signed for these industries in 2010, there was no possibility of their terms being extended. Several contracts which cover a whole sector, but which are con-cluded with one public sector employer such as a ministry (e.g. rescue workers, primary and secon-dary school teachers). There was one new sec-toral level contract with journalists concluded in 2009 in Lithuania. (Kallaste Woolfson 2013). All together the tripartite social dialogue during past few years of crisis and post crisis are charac-terised by less substantial consultative mecha-nisms and rather a dictate from national govern-ments regarding the austerity measures.
1.5 Youth unemployment
According to the Eurostat forecasts, Baltic economies will continue growing that the real GDP growth in 2012 will be 2.5% in Estonia, 4.3 % in Latvia and 2.9% in Lithuania. Eurostat fore-casts for 2014 are as follows: 4.0% EE, 3.9% LV and 3.6% LT. IMF projects that the economy is expected to grow at an average rate of 3.2% in forthcoming years in Latvia. It will take another three years (2015) before the Latvian economy reaches the 2006-2007 pre-crisis real GDP level. Emigration and possibility of emigration increases bargaining power of employees and competition for labour force. The ability of unions to stand on previous status quo agreements has now been abolished in Estonia. There is now also the possi-bility also to end collective contracts with prior notice by employer. These developments suggest that the future for union revitalisation in the post-crisis Baltic context will be even more uncertain than before economic crisis in late 2008 (Kallaste & Woolfson 2013). All three countries envisage lack of workforce in near future due to high levels of out-migration during the past decade.
1.6 Forecasts
According to the Eurostat forecasts, Baltic economies will continue growing that the real GDP growth in 2012 will be 2.5% in Estonia, 4.3 % in Latvia and 2.9% in Lithuania. Eurostat fore-casts for 2014 are as follows: 4.0% EE, 3.9% LV and 3.6% LT. IMF projects that the economy is expected to grow at an average rate of 3.2% in forthcoming years in Latvia. It will take another three years (2015) before the Latvian economy reaches the 2006-2007 pre-crisis real GDP level. Emigration and possibility of emigration increases bargaining power of employees and competition for labour force. The ability of unions to stand on previous status quo agreements has now been abolished in Estonia. There is now also the possi-bility also to end collective contracts with prior notice by employer. These developments suggest that the future for union revitalisation in the post-crisis Baltic context will be even more uncertain than before economic crisis in late 2008 (Kallaste & Woolfson 2013). All three countries envisage lack of workforce in near future due to high levels of out-migration during the past decade.
7
2. Annex of data
Acronym Full Name CDEFOP European Centre for the Development of Vocational Training
EIRO European Industrial Relations Observatory
ETUI European Trade Union Institute
ES Eurostat
IOM International Organization for Migration
ML Ministry of Labour
ND National Data
OECD Organisation for Economic Co-operation and Development (OECD)
UN United Nations
U Universities
WB Worldbank
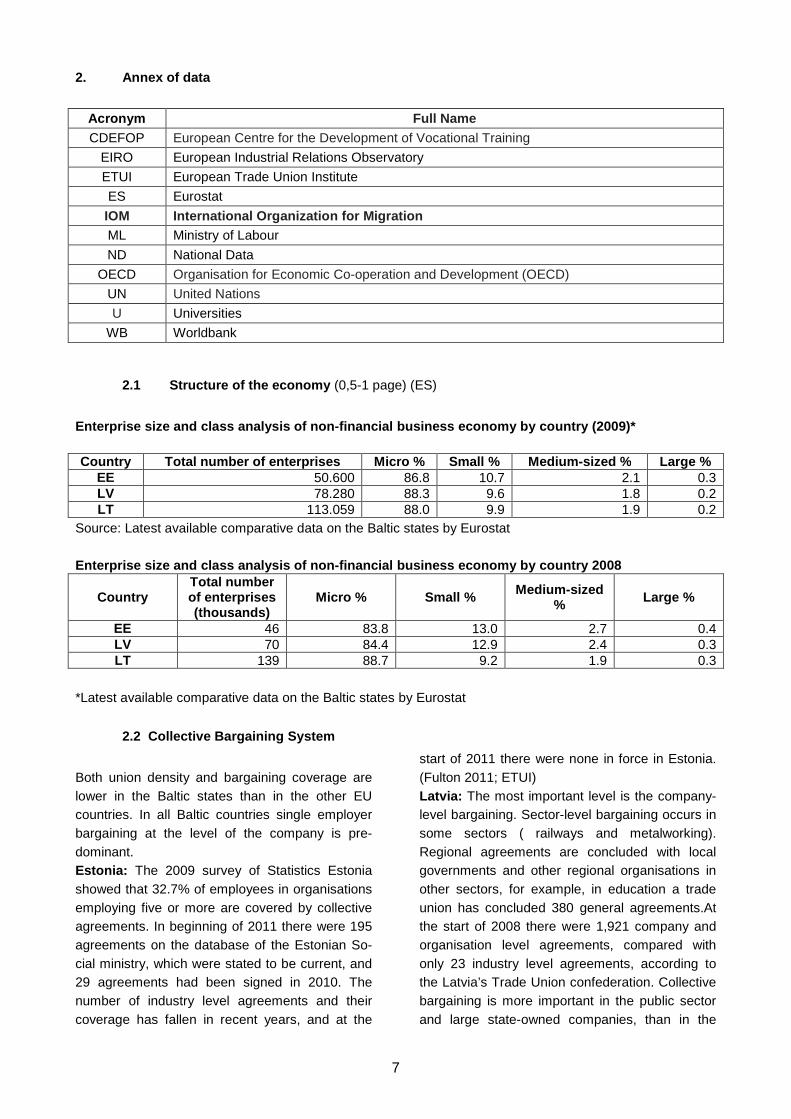
2.1 Structure of the economy (0,5-1 page) (ES)
Enterprise size and class analysis of non-financial business economy by country (2009)* Country Total number of enterprises Micro % Small % Medium -sized % Large %
EE 50.600 86.8 10.7 2.1 0.3 LV 78.280 88.3 9.6 1.8 0.2 LT 113.059 88.0 9.9 1.9 0.2
Source: Latest available comparative data on the Baltic states by Eurostat Enterprise size and class analysis of non-financial business economy by country 2008
Country Total number of enterprises (thousands)
Micro % Small % Medium-sized % Large %
EE 46 83.8 13.0 2.7 0.4 LV 70 84.4 12.9 2.4 0.3 LT 139 88.7 9.2 1.9 0.3
*Latest available comparative data on the Baltic states by Eurostat
2.2 Collective Bargaining System
Both union density and bargaining coverage are lower in the Baltic states than in the other EU countries. In all Baltic countries single employer bargaining at the level of the company is pre-dominant. Estonia: The 2009 survey of Statistics Estonia showed that 32.7% of employees in organisations employing five or more are covered by collective agreements. In beginning of 2011 there were 195 agreements on the database of the Estonian So-cial ministry, which were stated to be current, and 29 agreements had been signed in 2010. The number of industry level agreements and their coverage has fallen in recent years, and at the
start of 2011 there were none in force in Estonia. (Fulton 2011; ETUI) Latvia: The most important level is the company-level bargaining. Sector-level bargaining occurs in some sectors ( railways and metalworking). Regional agreements are concluded with local governments and other regional organisations in other sectors, for example, in education a trade union has concluded 380 general agreements.At the start of 2008 there were 1,921 company and organisation level agreements, compared with only 23 industry level agreements, according to the Latvia’s Trade Union confederation. Collective bargaining is more important in the public sector and large state-owned companies, than in the
8
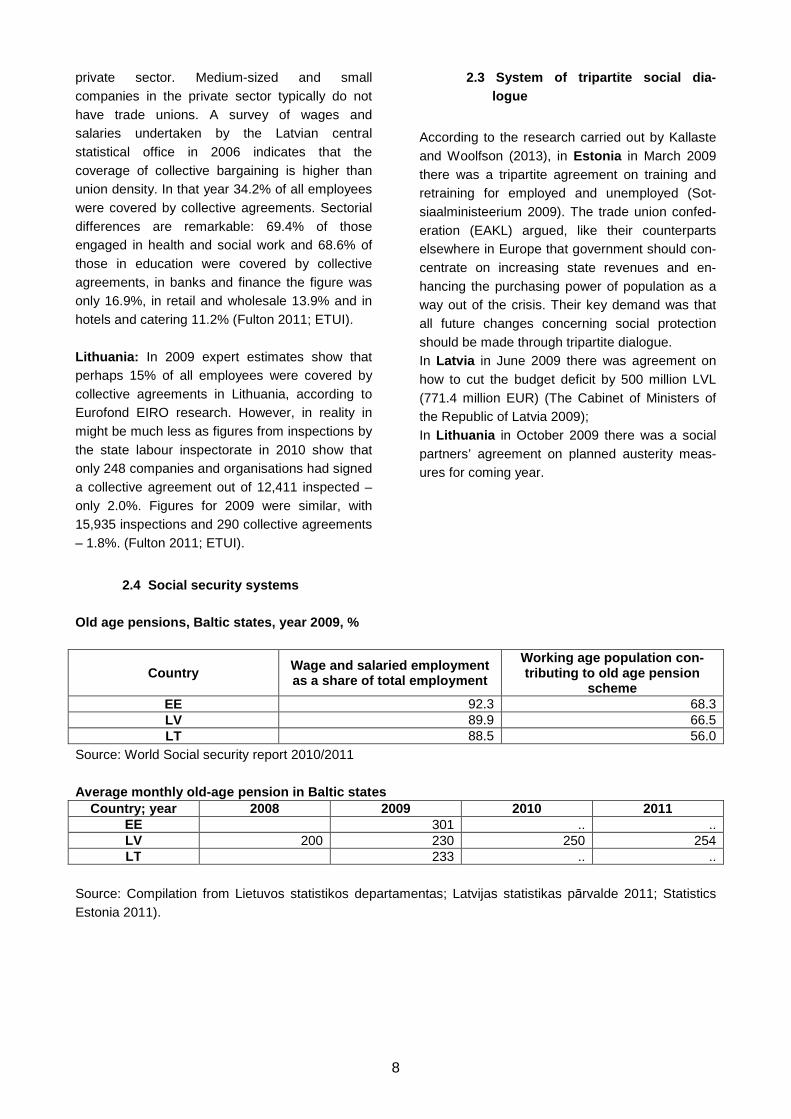
private sector. Medium-sized and small companies in the private sector typically do not have trade unions. A survey of wages and salaries undertaken by the Latvian central statistical office in 2006 indicates that the coverage of collective bargaining is higher than union density. In that year 34.2% of all employees were covered by collective agreements. Sectorial differences are remarkable: 69.4% of those engaged in health and social work and 68.6% of those in education were covered by collective agreements, in banks and finance the figure was only 16.9%, in retail and wholesale 13.9% and in hotels and catering 11.2% (Fulton 2011; ETUI).
Lithuania: In 2009 expert estimates show that perhaps 15% of all employees were covered by collective agreements in Lithuania, according to Eurofond EIRO research. However, in reality in might be much less as figures from inspections by the state labour inspectorate in 2010 show that only 248 companies and organisations had signed a collective agreement out of 12,411 inspected – only 2.0%. Figures for 2009 were similar, with 15,935 inspections and 290 collective agreements – 1.8%. (Fulton 2011; ETUI).
2.3 System of tripartite social dia-logue
According to the research carried out by Kallaste and Woolfson (2013), in Estonia in March 2009 there was a tripartite agreement on training and retraining for employed and unemployed (Sot-siaalministeerium 2009). The trade union confed-eration (EAKL) argued, like their counterparts elsewhere in Europe that government should con-centrate on increasing state revenues and en-hancing the purchasing power of population as a way out of the crisis. Their key demand was that all future changes concerning social protection should be made through tripartite dialogue. In Latvia in June 2009 there was agreement on how to cut the budget deficit by 500 million LVL (771.4 million EUR) (The Cabinet of Ministers of the Republic of Latvia 2009); In Lithuania in October 2009 there was a social partners’ agreement on planned austerity meas-ures for coming year.
2.4 Social security systems
Old age pensions, Baltic states, year 2009, %
Country Wage and salaried employment as a share of total employment
Working age population con-tributing to old age pension
scheme EE 92.3 68.3 LV 89.9 66.5 LT 88.5 56.0
Source: World Social security report 2010/2011 Average monthly old-age pension in Baltic states
Country; year 2008 2009 2010 2011 EE 301 .. .. LV 200 230 250 254 LT 233 .. ..
Source: Compilation from Lietuvos statistikos departamentas; Latvijas statistikas pārvalde 2011; Statistics Estonia 2011).
9
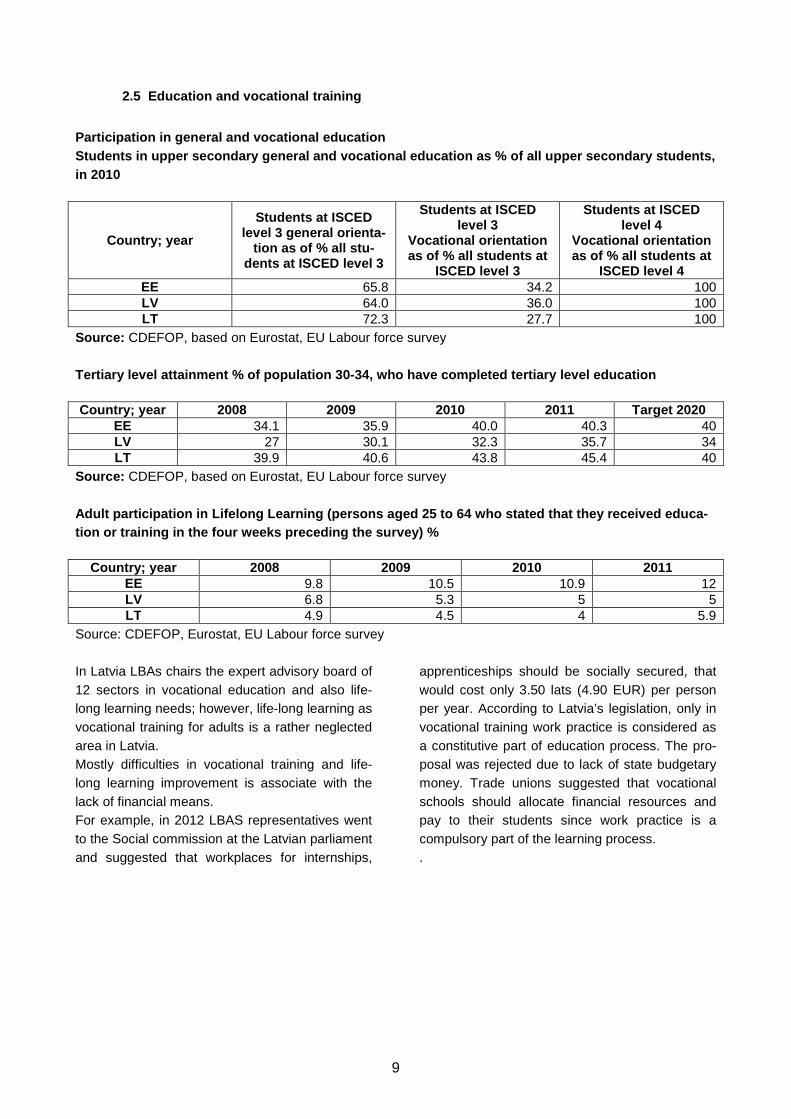
2.5 Education and vocational training
Participation in general and vocational education Students in upper secondary general and vocational education as % of all upper secondary students, in 2010
Country; year
Students at ISCED level 3 general orienta-
tion as of % all stu-dents at ISCED level 3
Students at ISCED level 3
Vocational orientation as of % all students at
ISCED level 3
Students at ISCED level 4
Vocational orientation as of % all students at
ISCED level 4 EE 65.8 34.2 100 LV 64.0 36.0 100 LT 72.3 27.7 100
Source: CDEFOP, based on Eurostat, EU Labour force survey Tertiary level attainment % of population 30-34, wh o have completed tertiary level education Country; year 2008 2009 2010 2011 Target 2020
EE 34.1 35.9 40.0 40.3 40 LV 27 30.1 32.3 35.7 34 LT 39.9 40.6 43.8 45.4 40
Source: CDEFOP, based on Eurostat, EU Labour force survey Adult participation in Lifelong Learning (persons a ged 25 to 64 who stated that they received educa-tion or training in the four weeks preceding the su rvey) %
Country; year 2008 2009 2010 2011 EE 9.8 10.5 10.9 12 LV 6.8 5.3 5 5 LT 4.9 4.5 4 5.9
Source: CDEFOP, Eurostat, EU Labour force survey In Latvia LBAs chairs the expert advisory board of 12 sectors in vocational education and also life-long learning needs; however, life-long learning as vocational training for adults is a rather neglected area in Latvia. Mostly difficulties in vocational training and life- long learning improvement is associate with the lack of financial means. For example, in 2012 LBAS representatives went to the Social commission at the Latvian parliament and suggested that workplaces for internships,
apprenticeships should be socially secured, that would cost only 3.50 lats (4.90 EUR) per person per year. According to Latvia’s legislation, only in vocational training work practice is considered as a constitutive part of education process. The pro-posal was rejected due to lack of state budgetary money. Trade unions suggested that vocational schools should allocate financial resources and pay to their students since work practice is a compulsory part of the learning process. .
10
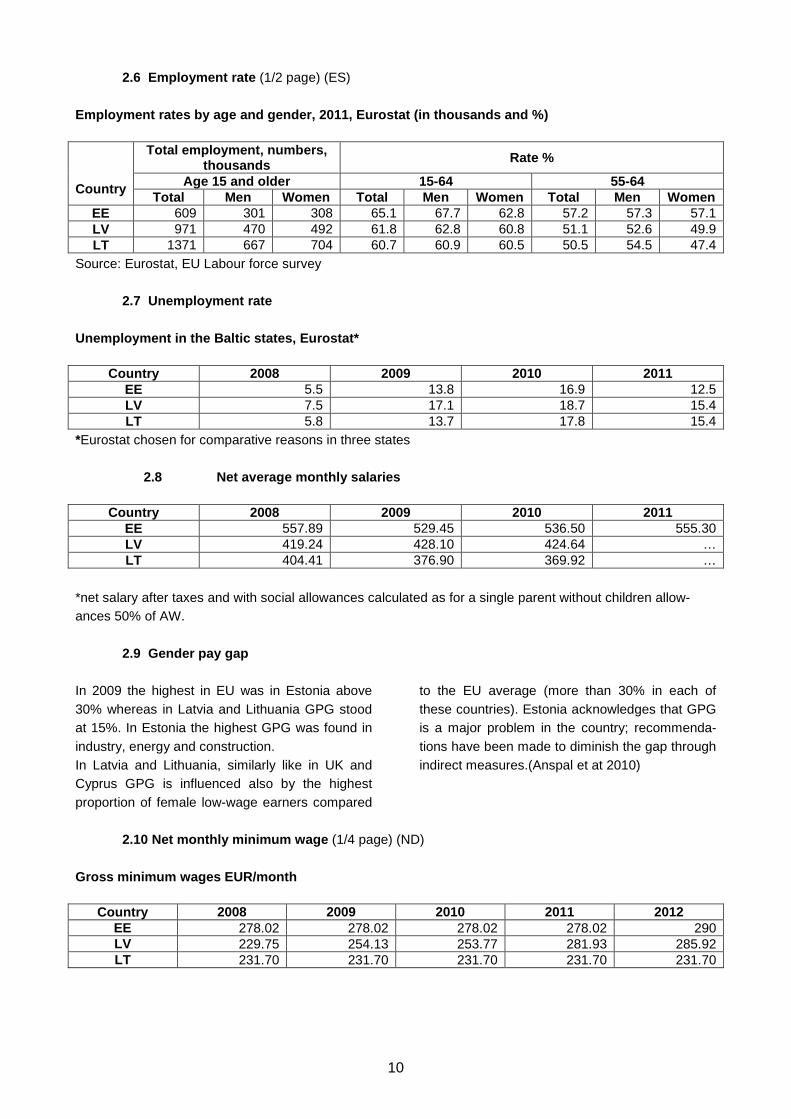
2.6 Employment rate (1/2 page) (ES) Employment rates by age and gender, 2011, Eurostat (in thousands and %)
Country
Total employment, numbers, thousands Rate %
Age 15 and older 15-64 55-64 Total Men Women Total Men Women Total Men Women
EE 609 301 308 65.1 67.7 62.8 57.2 57.3 57.1 LV 971 470 492 61.8 62.8 60.8 51.1 52.6 49.9 LT 1371 667 704 60.7 60.9 60.5 50.5 54.5 47.4
Source: Eurostat, EU Labour force survey
2.7 Unemployment rate
Unemployment in the Baltic states, Eurostat*
Country 2008 2009 2010 2011 EE 5.5 13.8 16.9 12.5 LV 7.5 17.1 18.7 15.4 LT 5.8 13.7 17.8 15.4
*Eurostat chosen for comparative reasons in three states
2.8 Net average monthly salaries
Country 2008 2009 2010 2011 EE 557.89 529.45 536.50 555.30 LV 419.24 428.10 424.64 … LT 404.41 376.90 369.92 …
*net salary after taxes and with social allowances calculated as for a single parent without children allow-ances 50% of AW.
2.9 Gender pay gap
In 2009 the highest in EU was in Estonia above 30% whereas in Latvia and Lithuania GPG stood at 15%. In Estonia the highest GPG was found in industry, energy and construction. In Latvia and Lithuania, similarly like in UK and Cyprus GPG is influenced also by the highest proportion of female low-wage earners compared
to the EU average (more than 30% in each of these countries). Estonia acknowledges that GPG is a major problem in the country; recommenda-tions have been made to diminish the gap through indirect measures.(Anspal et at 2010)
2.10 Net monthly minimum wage (1/4 page) (ND)
Gross minimum wages EUR/month
Country 2008 2009 2010 2011 2012 EE 278.02 278.02 278.02 278.02 290 LV 229.75 254.13 253.77 281.93 285.92 LT 231.70 231.70 231.70 231.70 231.70
11
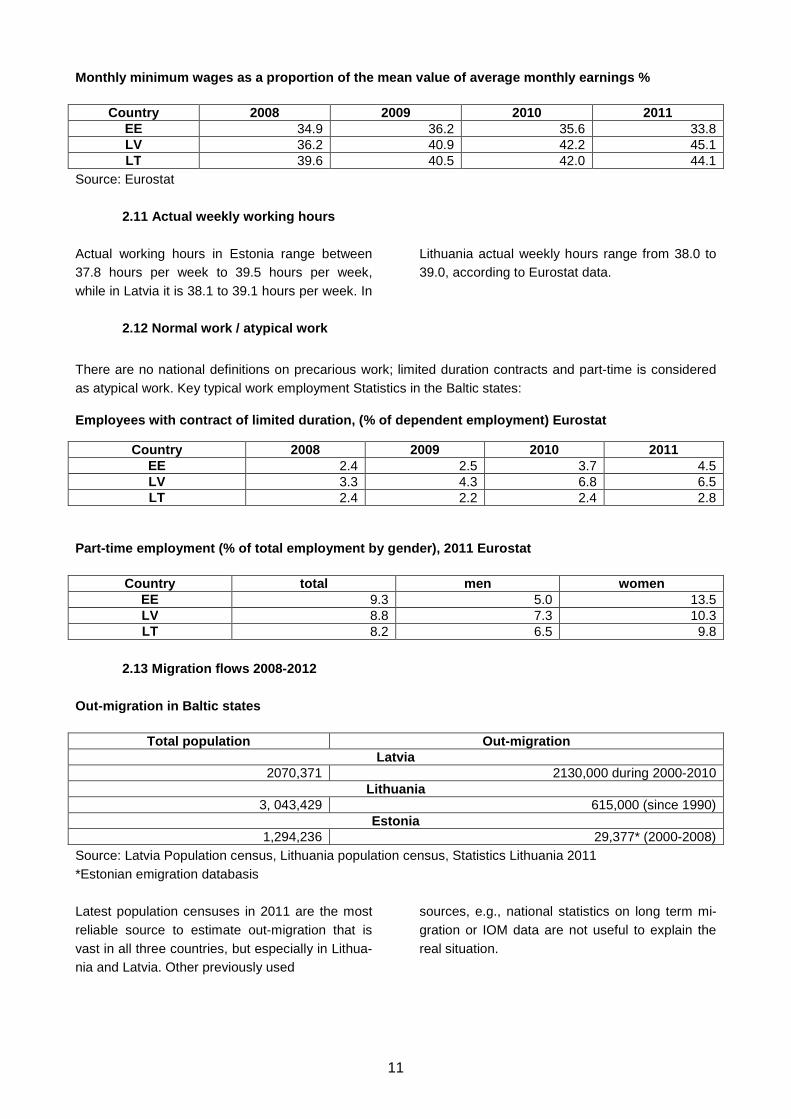
Monthly minimum wages as a proportion of the mean v alue of average monthly earnings %
Country 2008 2009 2010 2011 EE 34.9 36.2 35.6 33.8 LV 36.2 40.9 42.2 45.1 LT 39.6 40.5 42.0 44.1
Source: Eurostat 2.11 Actual weekly working hours
Actual working hours in Estonia range between 37.8 hours per week to 39.5 hours per week, while in Latvia it is 38.1 to 39.1 hours per week. In
Lithuania actual weekly hours range from 38.0 to 39.0, according to Eurostat data.
2.12 Normal work / atypical work
There are no national definitions on precarious work; limited duration contracts and part-time is considered as atypical work. Key typical work employment Statistics in the Baltic states:
Employees with contract of limited duration, (% of dependent employment) Eurostat
Country 2008 2009 2010 2011 EE 2.4 2.5 3.7 4.5 LV 3.3 4.3 6.8 6.5 LT 2.4 2.2 2.4 2.8
Part-time employment (% of total employment by gend er), 2011 Eurostat
Country total men women EE 9.3 5.0 13.5 LV 8.8 7.3 10.3 LT 8.2 6.5 9.8
2.13 Migration flows 2008-2012
Out-migration in Baltic states
Total population Out-migration Latvia
2070,371 2130,000 during 2000-2010 Lithuania
3, 043,429 615,000 (since 1990) Estonia
1,294,236 29,377* (2000-2008) Source: Latvia Population census, Lithuania population census, Statistics Lithuania 2011 *Estonian emigration databasis
Latest population censuses in 2011 are the most reliable source to estimate out-migration that is vast in all three countries, but especially in Lithua-nia and Latvia. Other previously used
sources, e.g., national statistics on long term mi-gration or IOM data are not useful to explain the real situation.
12
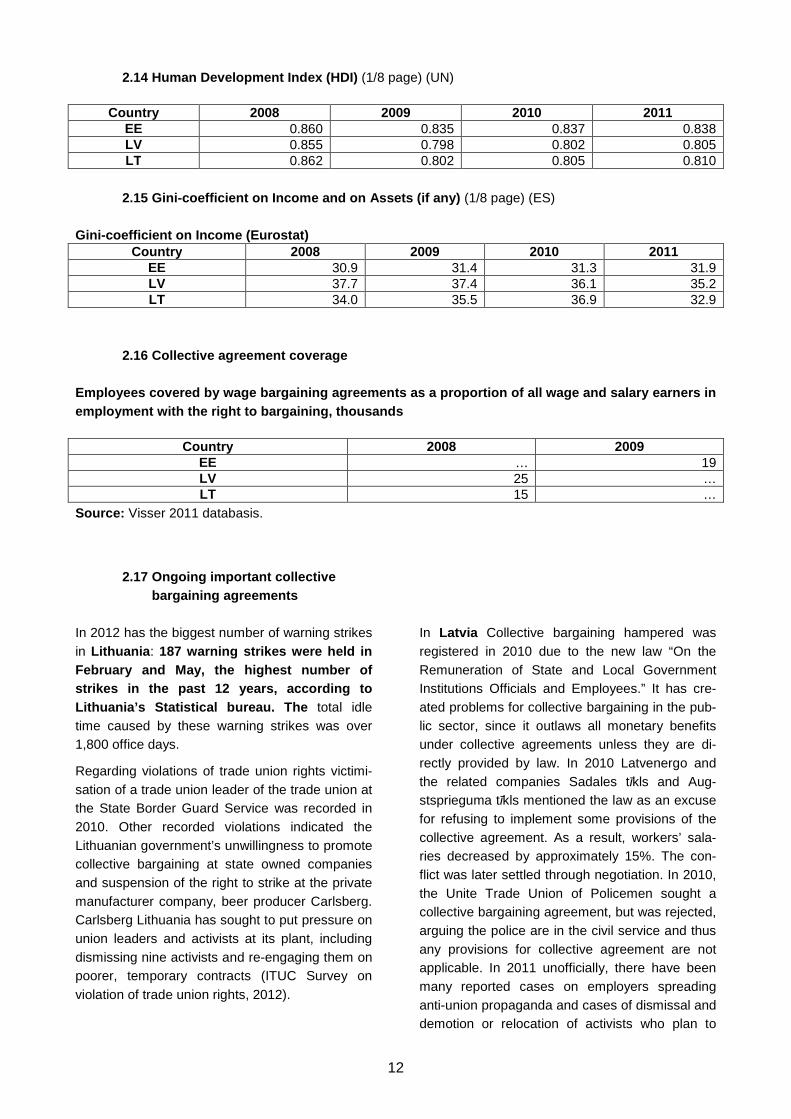
2.14 Human Development Index (HDI) (1/8 page) (UN)
Country 2008 2009 2010 2011 EE 0.860 0.835 0.837 0.838 LV 0.855 0.798 0.802 0.805 LT 0.862 0.802 0.805 0.810 2.15 Gini-coefficient on Income and on Assets (if a ny) (1/8 page) (ES)
Gini-coefficient on Income (Eurostat)
Country 2008 2009 2010 2011 EE 30.9 31.4 31.3 31.9 LV 37.7 37.4 36.1 35.2 LT 34.0 35.5 36.9 32.9
2.16 Collective agreement coverage
Employees covered by wage bargaining agreements as a proportion of all wage and salary earners in employment with the right to bargaining, thousands
Country 2008 2009 EE … 19 LV 25 … LT 15 …
Source: Visser 2011 databasis.
2.17 Ongoing important collective bargaining agreements
In 2012 has the biggest number of warning strikes in Lithuania : 187 warning strikes were held in February and May, the highest number of strikes in the past 12 years, according to Lithuania’s Statistical bureau. The total idle time caused by these warning strikes was over 1,800 office days.
Regarding violations of trade union rights victimi-sation of a trade union leader of the trade union at the State Border Guard Service was recorded in 2010. Other recorded violations indicated the Lithuanian government’s unwillingness to promote collective bargaining at state owned companies and suspension of the right to strike at the private manufacturer company, beer producer Carlsberg. Carlsberg Lithuania has sought to put pressure on union leaders and activists at its plant, including dismissing nine activists and re-engaging them on poorer, temporary contracts (ITUC Survey on violation of trade union rights, 2012).
In Latvia Collective bargaining hampered was registered in 2010 due to the new law “On the Remuneration of State and Local Government Institutions Officials and Employees.” It has cre-ated problems for collective bargaining in the pub-lic sector, since it outlaws all monetary benefits under collective agreements unless they are di-rectly provided by law. In 2010 Latvenergo and the related companies Sadales tīkls and Aug-stsprieguma tīkls mentioned the law as an excuse for refusing to implement some provisions of the collective agreement. As a result, workers’ sala-ries decreased by approximately 15%. The con-flict was later settled through negotiation. In 2010, the Unite Trade Union of Policemen sought a collective bargaining agreement, but was rejected, arguing the police are in the civil service and thus any provisions for collective agreement are not applicable. In 2011 unofficially, there have been many reported cases on employers spreading anti-union propaganda and cases of dismissal and demotion or relocation of activists who plan to
13
establish a trade union in an enterprise or of exist-ing trade union representatives in order to break trade union activity. However, these cases have no official evidence. These cases are mostly re-ported in the trade union branches in the wood manufacturing, civil aviation and industry sectors.
In January 2011, the Communication Workers Trade Union (CWTU) discovered that the man-agement of Lattelecom was failing to comply with its responsibilities provided for by a collective agreement, particularly in relation to the company pension fund. A compromise was reached by the Conciliation Commission and on 16 March the parties signed an agreement reducing Lattele-com’s contributions by half. However, after signing the employer embarked on an anti-union cam-paign with the intention of damaging the image of the trade union. A positive and effective interven-tion by the State Labour Inspectorate improved the situation. (ITUC Survey on violation of trade union rights, 2012 Latvia)
Estonia : The Confederation of Estonian Trade Unions (EAKL) reported that anti-union behaviour is rife in the private sector in 2010. In some enter-prises, workers are advised against forming trade unions, threatened with dismissal or a reduction in wages, or promised benefits if they do not join unions. “Yellow unions” are sometimes formed. The economic crisis made negotiations difficult,
and even profitable companies demanded con-cessions or failed to honour agreements. For ex-ample, in May, shipping company Tallink stopped paying wage supplements provided for in the col-lective agreement, and only asked the trade union for new negotiations afterwards.
Strikes are not common in Estonia. Just before the general strike, many companies abruptly changed work schedules so that trade union members would not be on duty on the day of the strike. Some employers also threatened workers with dismissal. Tallinna Autobussikoondis (a pub-lic transport company) intimidated trade union members, prevented union leaders from contact-ing workers and removed strike leaflets. (ITUC Survey on violation of trade union rights, 2012 Estonia)
There was a large, unprecedented doctors' strike in Estonia in 2012. The government was stressing the need to keep the budgetary balance and said that there would be no more money, but the doctors did not retreat either. Finally the compromise was found and the minimum wage for doctors and nurses was raised. In addition, the doctors were not required to work as much as before, e.g their working time was changed shorter, but the salary remained the same.
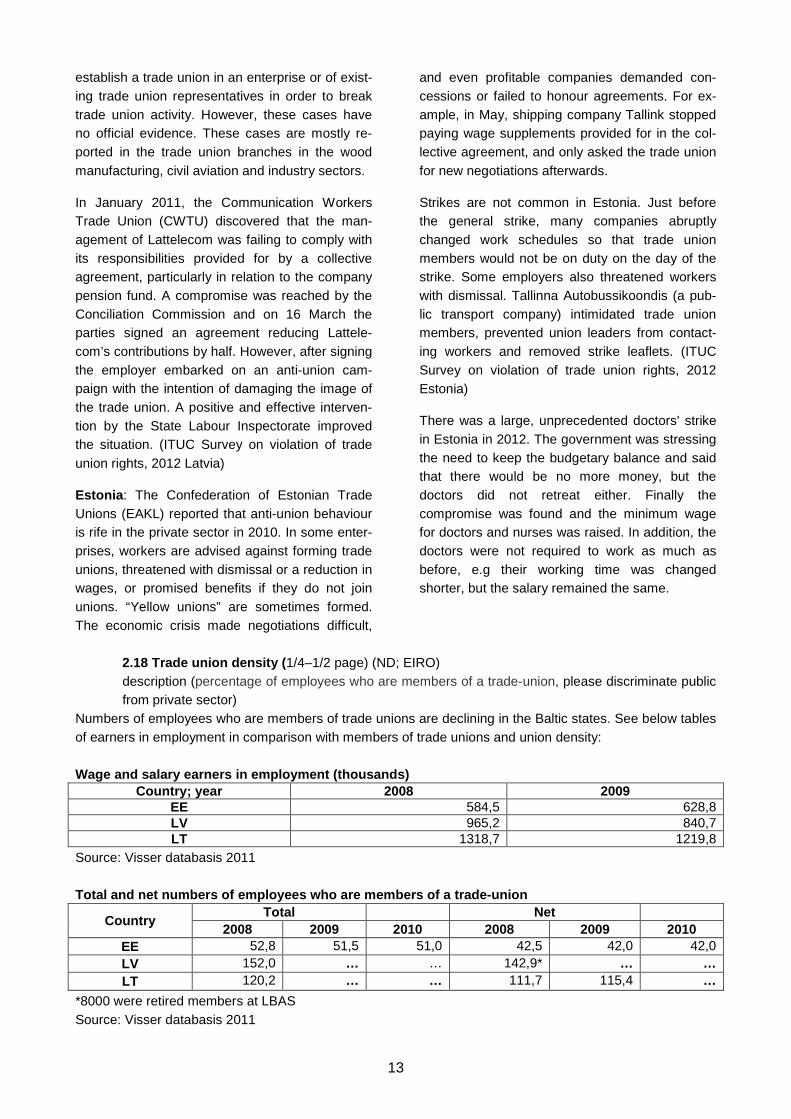
2.18 Trade union density ( 1/4–1/2 page) (ND; EIRO) description (percentage of employees who are members of a trade-union, please discriminate public from private sector)
Numbers of employees who are members of trade unions are declining in the Baltic states. See below tables of earners in employment in comparison with members of trade unions and union density:
Wage and salary earners in employment (thousands)
Country; year 2008 2009 EE 584,5 628,8 LV 965,2 840,7 LT 1318,7 1219,8
Source: Visser databasis 2011
Total and net numbers of employees who are members of a trade-union
Country Total Net
2008 2009 2010 2008 2009 2010 EE 52,8 51,5 51,0 42,5 42,0 42,0 LV 152,0 … … 142,9* … … LT 120,2 … … 111,7 115,4 …
*8000 were retired members at LBAS Source: Visser databasis 2011
14
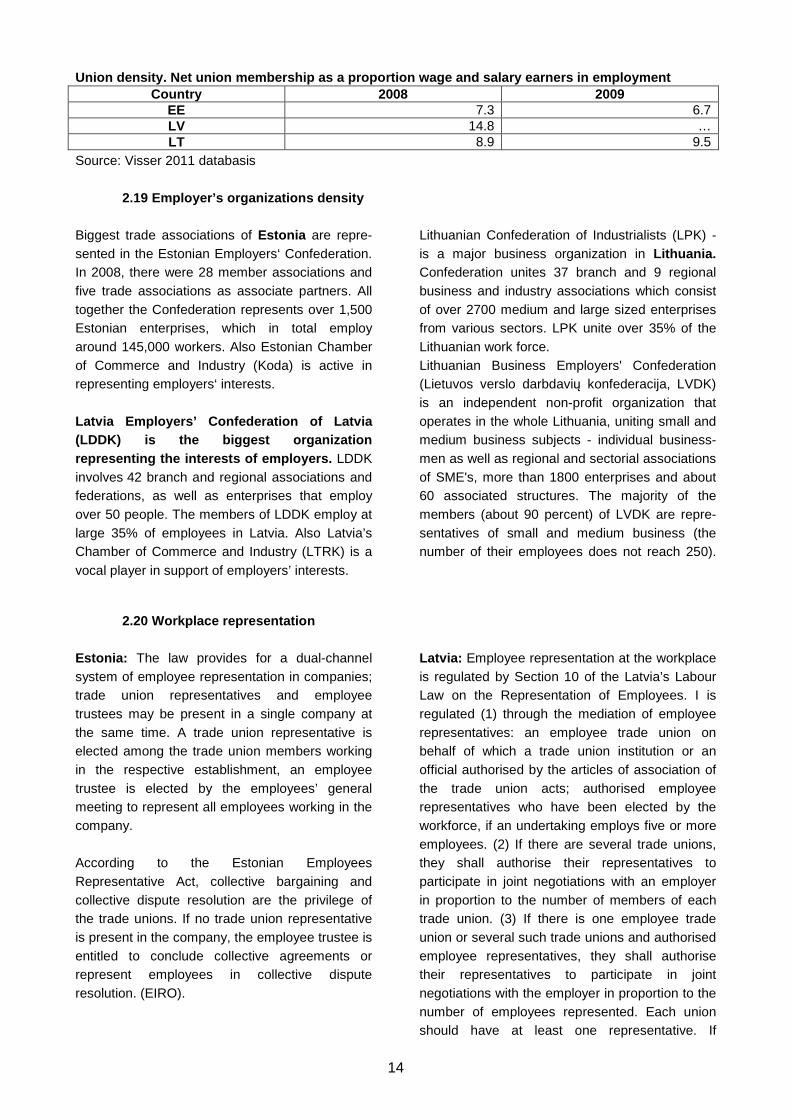
Union density. Net union membership as a proportion wage and salary earners in employment Country 2008 2009
EE 7.3 6.7 LV 14.8 … LT 8.9 9.5
Source: Visser 2011 databasis
2.19 Employer’s organizations density Biggest trade associations of Estonia are repre-sented in the Estonian Employers‘ Confederation. In 2008, there were 28 member associations and five trade associations as associate partners. All together the Confederation represents over 1,500 Estonian enterprises, which in total employ around 145,000 workers. Also Estonian Chamber of Commerce and Industry (Koda) is active in representing employers‘ interests.
Latvia Employers’ Confederation of Latvia (LDDK) is the biggest organization representing the interests of employers. LDDK involves 42 branch and regional associations and federations, as well as enterprises that employ over 50 people. The members of LDDK employ at large 35% of employees in Latvia. Also Latvia’s Chamber of Commerce and Industry (LTRK) is a vocal player in support of employers’ interests.
Lithuanian Confederation of Industrialists (LPK) - is a major business organization in Lithuania. Confederation unites 37 branch and 9 regional business and industry associations which consist of over 2700 medium and large sized enterprises from various sectors. LPK unite over 35% of the Lithuanian work force. Lithuanian Business Employers' Confederation (Lietuvos verslo darbdavių konfederacija, LVDK) is an independent non-profit organization that operates in the whole Lithuania, uniting small and medium business subjects - individual business-men as well as regional and sectorial associations of SME's, more than 1800 enterprises and about 60 associated structures. The majority of the members (about 90 percent) of LVDK are repre-sentatives of small and medium business (the number of their employees does not reach 250).
2.20 Workplace representation
Estonia: The law provides for a dual-channel system of employee representation in companies; trade union representatives and employee trustees may be present in a single company at the same time. A trade union representative is elected among the trade union members working in the respective establishment, an employee trustee is elected by the employees’ general meeting to represent all employees working in the company.
According to the Estonian Employees Representative Act, collective bargaining and collective dispute resolution are the privilege of the trade unions. If no trade union representative is present in the company, the employee trustee is entitled to conclude collective agreements or represent employees in collective dispute resolution. (EIRO).
Latvia: Employee representation at the workplace is regulated by Section 10 of the Latvia’s Labour Law on the Representation of Employees. I is regulated (1) through the mediation of employee representatives: an employee trade union on behalf of which a trade union institution or an official authorised by the articles of association of the trade union acts; authorised employee representatives who have been elected by the workforce, if an undertaking employs five or more employees. (2) If there are several trade unions, they shall authorise their representatives to participate in joint negotiations with an employer in proportion to the number of members of each trade union. (3) If there is one employee trade union or several such trade unions and authorised employee representatives, they shall authorise their representatives to participate in joint negotiations with the employer in proportion to the number of employees represented. Each union should have at least one representative. If
15
representatives of one employee trade union or representatives of several such trade unions and authorised employee representatives have been appointed for negotiations with an employer, they shall express a united view.
Lithuania: According to the Lithuania’s Labour Code, in labour relations the rights and interests of employees may be represented and protected by the trade unions. Where a company, agency or organisation has no functioning trade union and the staff meeting has not transferred the function
of employee representation and protection of em-ployees to the trade union of the appropriate sec-tor of economic activity, the workers shall be rep-resented by the works council elected by secret ballot at a general staff meeting. The activities of works councils are regulated by the law on works councils. A works council shall be established for a term of three years, which shall begin when a works council starts its operaterations. The works council has the same rights and obligations in the company as the trade union, including the right to call a strike. (EIRO)
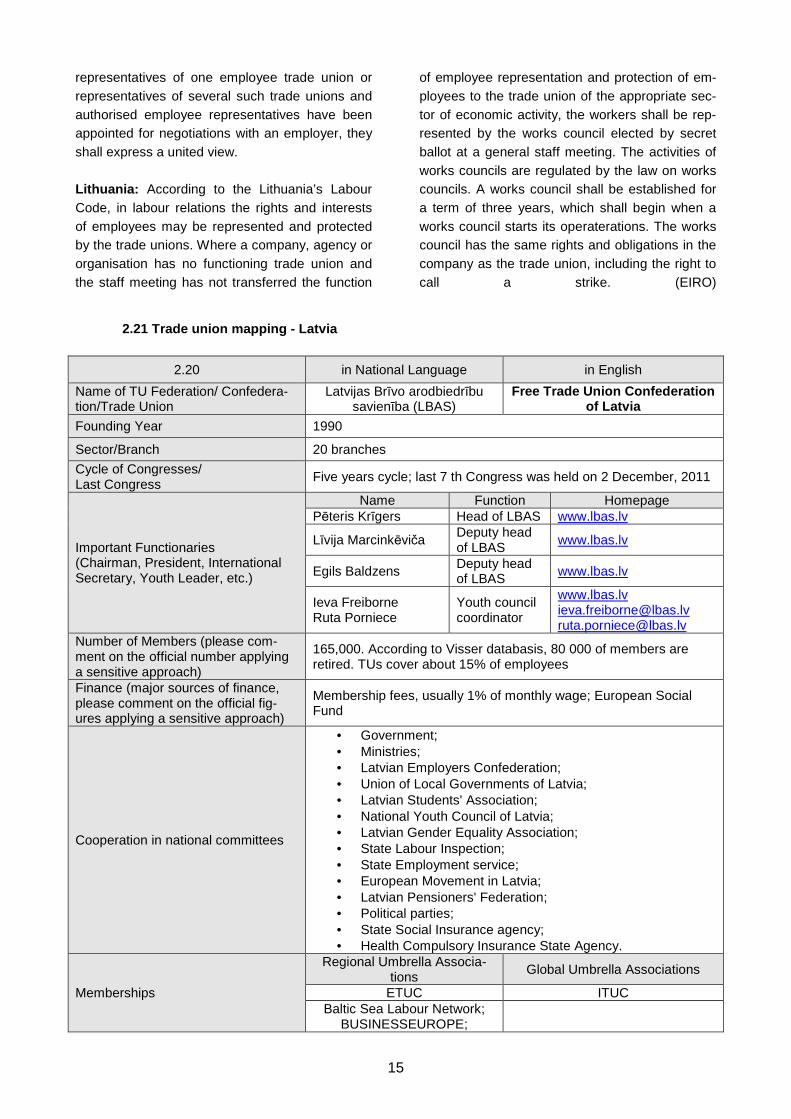
2.21 Trade union mapping - Latvia
2.20 in National Language in English
Name of TU Federation/ Confedera-tion/Trade Union
Latvijas Brīvo arodbiedrību savienība (LBAS)
Free Trade Union Confederation of Latvia
Founding Year 1990
Sector/Branch 20 branches
Cycle of Congresses/ Last Congress
Five years cycle; last 7 th Congress was held on 2 December, 2011
Important Functionaries (Chairman, President, International Secretary, Youth Leader, etc.)
Name Function Homepage Pēteris Krīgers Head of LBAS www.lbas.lv
Līvija Marcinkēviča Deputy head of LBAS
www.lbas.lv
Egils Baldzens Deputy head of LBAS www.lbas.lv
Ieva Freiborne Ruta Porniece
Youth council coordinator
www.lbas.lv [email protected] [email protected]
Number of Members (please com-ment on the official number applying a sensitive approach)
165,000. According to Visser databasis, 80 000 of members are retired. TUs cover about 15% of employees
Finance (major sources of finance, please comment on the official fig-ures applying a sensitive approach)
Membership fees, usually 1% of monthly wage; European Social Fund
Cooperation in national committees
• Government; • Ministries; • Latvian Employers Confederation; • Union of Local Governments of Latvia; • Latvian Students' Association; • National Youth Council of Latvia; • Latvian Gender Equality Association; • State Labour Inspection; • State Employment service; • European Movement in Latvia; • Latvian Pensioners' Federation; • Political parties; • State Social Insurance agency; • Health Compulsory Insurance State Agency.
Memberships
Regional Umbrella Associa-tions
Global Umbrella Associations
ETUC ITUC Baltic Sea Labour Network;
BUSINESSEUROPE;
16
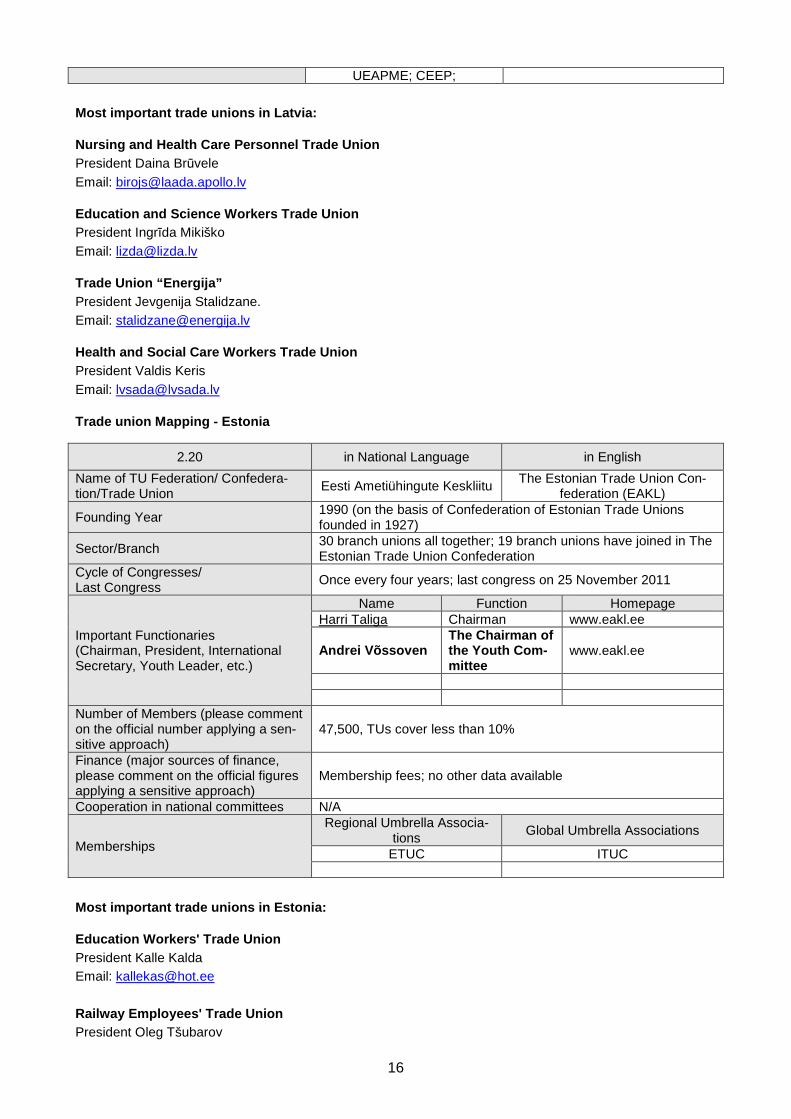
UEAPME; CEEP;
Most important trade unions in Latvia:
Nursing and Health Care Personnel Trade Union President Daina Brūvele Email: [email protected]
Education and Science Workers Trade Union President Ingrīda Mikiško Email: [email protected]
Trade Union “Energija” President Jevgenija Stalidzane. Email: [email protected]
Health and Social Care Workers Trade Union President Valdis Keris Email: [email protected]
Trade union Mapping - Estonia
2.20 in National Language in English
Name of TU Federation/ Confedera-tion/Trade Union
Eesti Ametiühingute Keskliitu The Estonian Trade Union Con-
federation (EAKL)
Founding Year 1990 (on the basis of Confederation of Estonian Trade Unions founded in 1927)
Sector/Branch 30 branch unions all together; 19 branch unions have joined in The Estonian Trade Union Confederation
Cycle of Congresses/ Last Congress
Once every four years; last congress on 25 November 2011
Important Functionaries (Chairman, President, International Secretary, Youth Leader, etc.)
Name Function Homepage Harri Taliga Chairman www.eakl.ee
Andrei Võssoven The Chairman of the Youth Com-mittee
www.eakl.ee
Number of Members (please comment on the official number applying a sen-sitive approach)
47,500, TUs cover less than 10%
Finance (major sources of finance, please comment on the official figures applying a sensitive approach)
Membership fees; no other data available
Cooperation in national committees N/A
Memberships
Regional Umbrella Associa-tions
Global Umbrella Associations
ETUC ITUC
Most important trade unions in Estonia:
Education Workers' Trade Union President Kalle Kalda Email: [email protected]
Railway Employees' Trade Union President Oleg Tšubarov
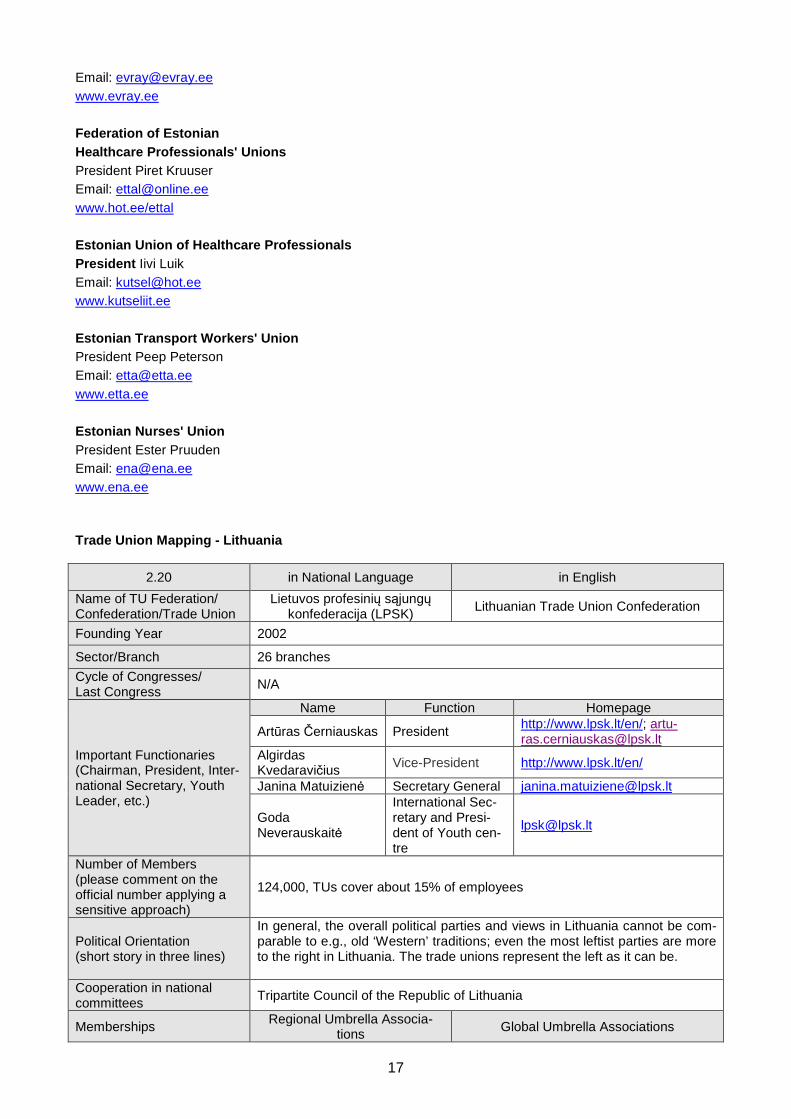
17
Email: [email protected] www.evray.ee
Federation of Estonian Healthcare Professionals' Unions President Piret Kruuser Email: [email protected] www.hot.ee/ettal
Estonian Union of Healthcare Professionals President Iivi Luik Email: [email protected] www.kutseliit.ee
Estonian Transport Workers' Union President Peep Peterson Email: [email protected] www.etta.ee
Estonian Nurses' Union President Ester Pruuden Email: [email protected] www.ena.ee
Trade Union Mapping - Lithuania
2.20 in National Language in English
Name of TU Federation/ Confederation/Trade Union
Lietuvos profesinių sąjungų konfederacija (LPSK)
Lithuanian Trade Union Confederation
Founding Year 2002
Sector/Branch 26 branches
Cycle of Congresses/ Last Congress
N/A
Important Functionaries (Chairman, President, Inter-national Secretary, Youth Leader, etc.)
Name Function Homepage
Artūras Černiauskas President http://www.lpsk.lt/en/; [email protected]
Algirdas Kvedaravičius Vice-President http://www.lpsk.lt/en/
Janina Matuizienė Secretary General [email protected]
Goda Neverauskaitė
International Sec-retary and Presi-dent of Youth cen-tre
Number of Members (please comment on the official number applying a sensitive approach)
124,000, TUs cover about 15% of employees
Political Orientation (short story in three lines)
In general, the overall political parties and views in Lithuania cannot be com-parable to e.g., old ‘Western’ traditions; even the most leftist parties are more to the right in Lithuania. The trade unions represent the left as it can be.
Cooperation in national committees
Tripartite Council of the Republic of Lithuania
Memberships Regional Umbrella Associa-
tions Global Umbrella Associations
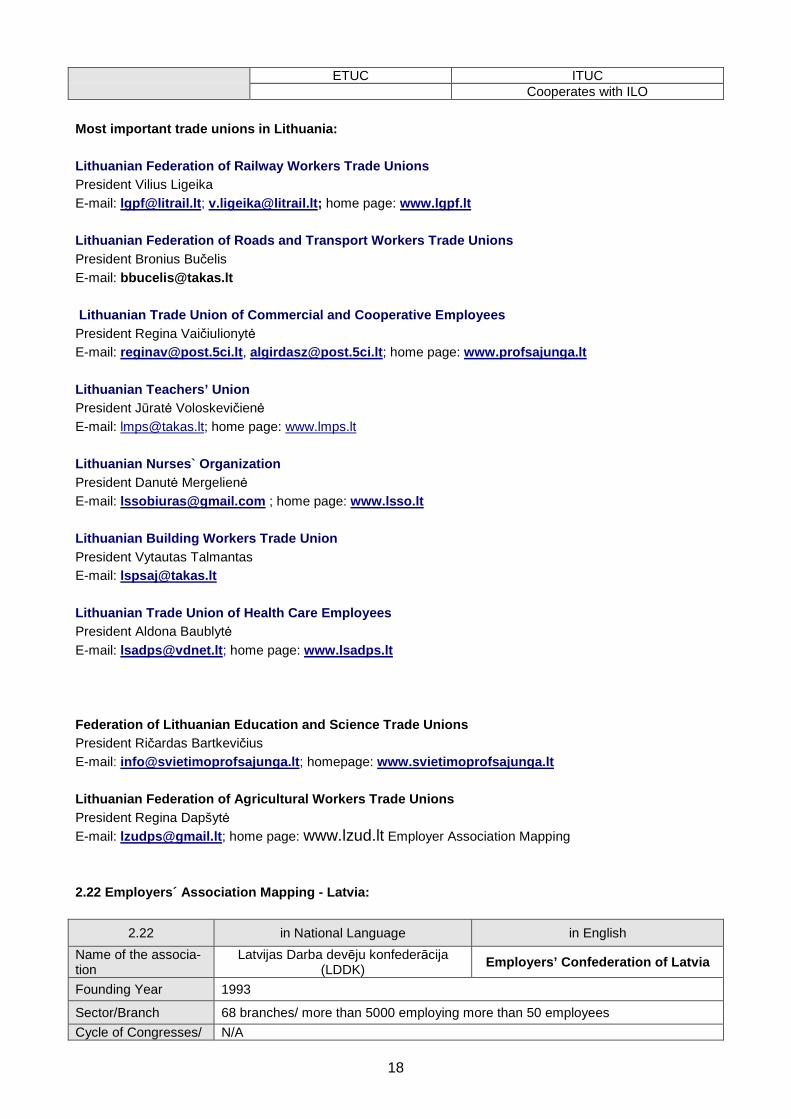
18
ETUC ITUC Cooperates with ILO
Most important trade unions in Lithuania:
Lithuanian Federation of Railway Workers Trade Unio ns President Vilius Ligeika E-mail: [email protected] ; [email protected] ; home page: www.lgpf.lt
Lithuanian Federation of Roads and Transport Worker s Trade Unions President Bronius Bučelis E-mail: [email protected]
Lithuanian Trade Union of Commercial and Cooperativ e Employees President Regina Vaičiulionytė E-mail: [email protected] , [email protected] ; home page: www.profsajunga.lt
Lithuanian Teachers’ Union President Jūratė Voloskevičienė E-mail: [email protected]; home page: www.lmps.lt
Lithuanian Nurses` Organization President Danutė Mergelienė E-mail: [email protected] ; home page: www.lsso.lt
Lithuanian Building Workers Trade Union President Vytautas Talmantas E-mail: [email protected]
Lithuanian Trade Union of Health Care Employees President Aldona Baublytė E-mail: [email protected] ; home page: www.lsadps.lt
Federation of Lithuanian Education and Science Trad e Unions President Ričardas Bartkevičius E-mail: [email protected] ; homepage: www.svietimoprofsajunga.lt
Lithuanian Federation of Agricultural Workers Trade Unions President Regina Dapšytė E-mail: [email protected] ; home page: www.lzud.lt Employer Association Mapping
2.22 Employers´ Association Mapping - Latvia:
2.22 in National Language in English
Name of the associa-tion
Latvijas Darba devēju konfederācija (LDDK)
Employers’ Confederation of Latvia
Founding Year 1993
Sector/Branch 68 branches/ more than 5000 employing more than 50 employees
Cycle of Congresses/ N/A
19
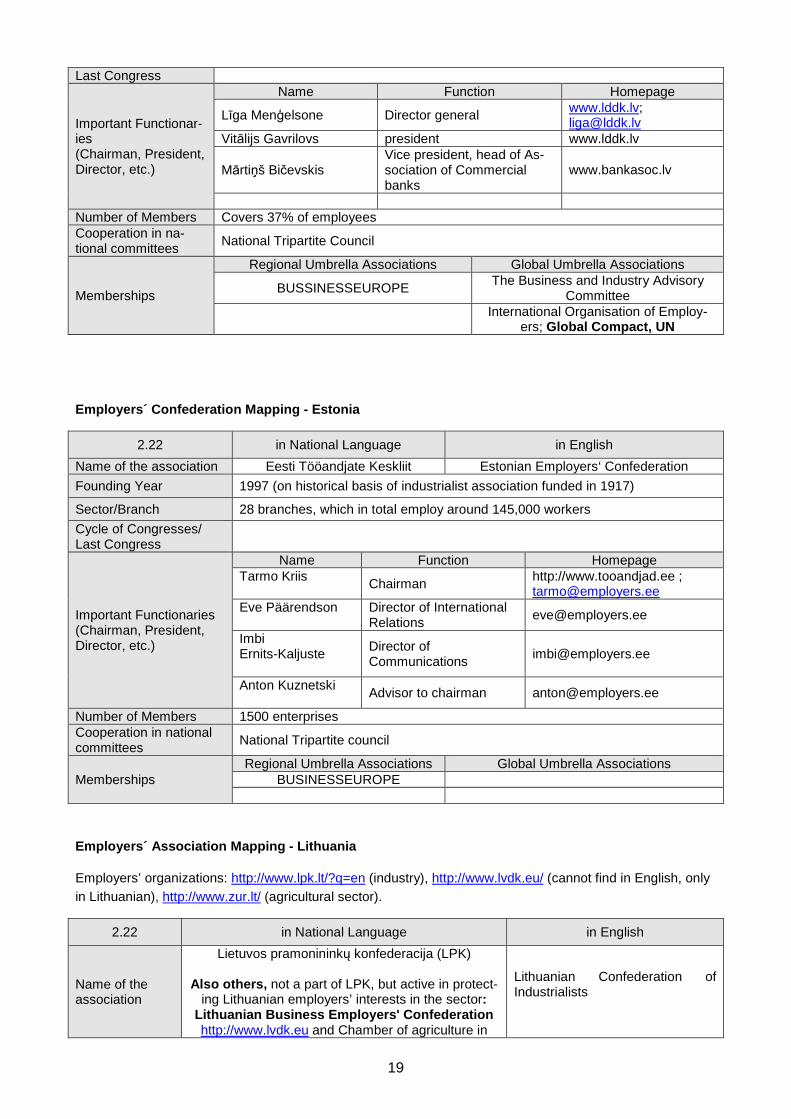
Last Congress
Important Functionar-ies (Chairman, President, Director, etc.)
Name Function Homepage
Līga Menģelsone Director general www.lddk.lv; [email protected]
Vitālijs Gavrilovs president www.lddk.lv
Mārtiņš Bičevskis Vice president, head of As-sociation of Commercial banks
www.bankasoc.lv
Number of Members Covers 37% of employees Cooperation in na-tional committees
National Tripartite Council
Memberships
Regional Umbrella Associations Global Umbrella Associations
BUSSINESSEUROPE The Business and Industry Advisory
Committee
International Organisation of Employ-
ers; Global Compact, UN
Employers´ Confederation Mapping - Estonia
2.22 in National Language in English
Name of the association Eesti Tööandjate Keskliit Estonian Employers‘ Confederation Founding Year 1997 (on historical basis of industrialist association funded in 1917)
Sector/Branch 28 branches, which in total employ around 145,000 workers
Cycle of Congresses/ Last Congress
Important Functionaries (Chairman, President, Director, etc.)
Name Function Homepage Tarmo Kriis Chairman
http://www.tooandjad.ee ; [email protected]
Eve Päärendson
Director of International Relations
Imbi Ernits-Kaljuste
Director of Communications
Anton Kuznetski
Advisor to chairman [email protected]
Number of Members 1500 enterprises Cooperation in national committees
National Tripartite council
Memberships Regional Umbrella Associations Global Umbrella Associations
BUSINESSEUROPE
Employers´ Association Mapping - Lithuania
Employers’ organizations: http://www.lpk.lt/?q=en (industry), http://www.lvdk.eu/ (cannot find in English, only in Lithuanian), http://www.zur.lt/ (agricultural sector).
2.22 in National Language in English
Name of the association
Lietuvos pramonininkų konfederacija (LPK)
Also others, not a part of LPK, but active in protect-ing Lithuanian employers’ interests in the sector:
Lithuanian Business Employers' Confederation http://www.lvdk.eu and Chamber of agriculture in
Lithuanian Confederation of Industrialists
20
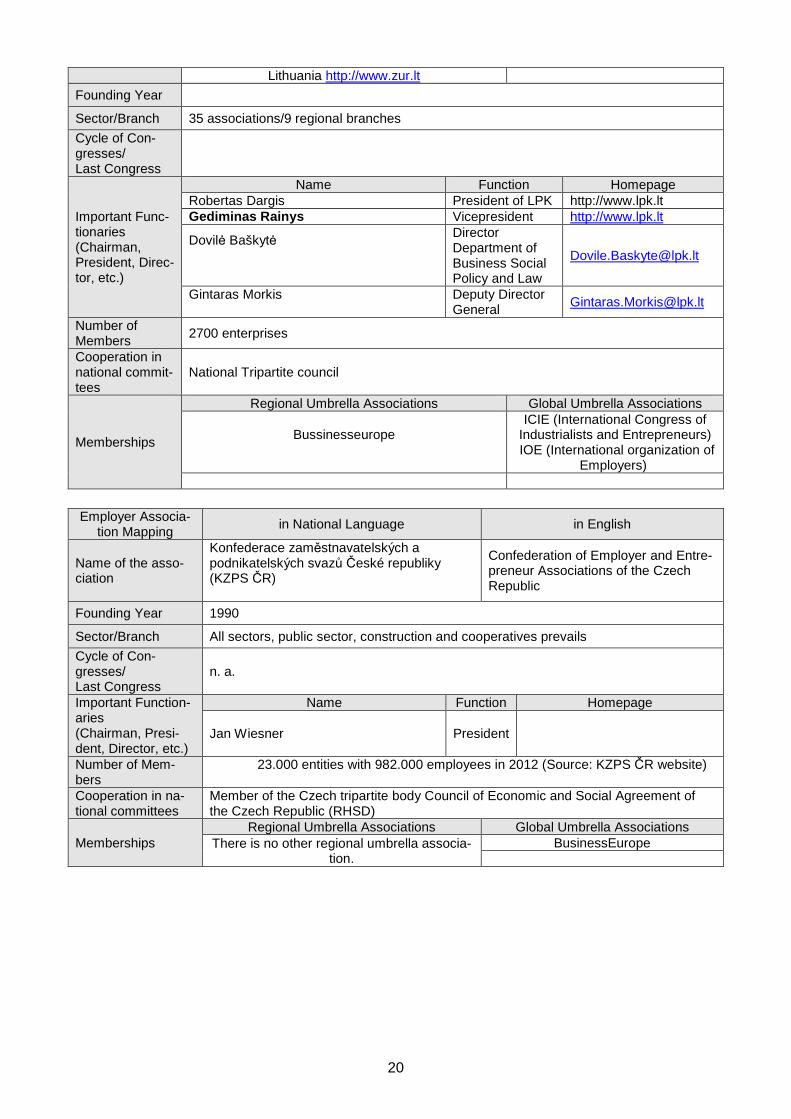
Lithuania http://www.zur.lt
Founding Year
Sector/Branch 35 associations/9 regional branches
Cycle of Con-gresses/ Last Congress
Important Func-tionaries (Chairman, President, Direc-tor, etc.)
Name Function Homepage Robertas Dargis President of LPK http://www.lpk.lt Gediminas Rainys Vicepresident http://www.lpk.lt
Dovilė Baškytė
Director Department of Business Social Policy and Law
Gintaras Morkis
Deputy Director General
Number of Members
2700 enterprises
Cooperation in national commit-tees
National Tripartite council
Memberships
Regional Umbrella Associations Global Umbrella Associations
Bussinesseurope
ICIE (International Congress of Industrialists and Entrepreneurs) IOE (International organization of
Employers)
Employer Associa-
tion Mapping in National Language in English
Name of the asso-ciation
Konfederace zaměstnavatelských a podnikatelských svazů České republiky (KZPS ČR)
Confederation of Employer and Entre-preneur Associations of the Czech Republic
Founding Year 1990
Sector/Branch All sectors, public sector, construction and cooperatives prevails
Cycle of Con-gresses/ Last Congress
n. a.
Important Function-aries (Chairman, Presi-dent, Director, etc.)
Name Function Homepage
Jan Wiesner President
Number of Mem-bers
23.000 entities with 982.000 employees in 2012 (Source: KZPS ČR website)
Cooperation in na-tional committees
Member of the Czech tripartite body Council of Economic and Social Agreement of the Czech Republic (RHSD)
Memberships Regional Umbrella Associations Global Umbrella Associations
There is no other regional umbrella associa-tion.
BusinessEurope
21
References:
Aidukaite, J. and Genelyte, I. (2012)Social policy and Migration in the Baltic States Paper to be presented at the Annual RC 19 Conference Welfare States Facing Global Turbulence, Ageing and Migration. Rising to the Occasion, Coping or Adjusting Downwards?, 23-25 August, 2012, Oslo, Norway; Aidukaite, J. (2011) “Welfare Reforms and Socio-economic Trends in the Ten New EU Member States of Central and Eastern Europe”, Journal of Communist and Post-Communist Studies 44 (3): 211-219.
Ahlberg, K., Bruun, N. (2009) The Future of Extension of Collective Agreements in Estonia, Ministry of Social Affairs, ESF http://www.sm.ee/fileadmin/meedia/Dokumendid/Toovaldkond/Extension_of_collective_agreements.Bruun_Ahlberg_2009.pdf
Anspal, S., Kallaste, E., Karu, M. (2010). Sooline palgalõhe Eestis: poliitikameetmete analüüs. Uuringuraport. Eesti Rakendusuuringute Keskus CentAR, Poliitikauuringute Keskus PRAXIS, Sotsiaalministeerium. Available: http://www.sm.ee/fileadmin/meedia/Dokumendid/V2ljaanded/Publikatsioonid/2011/Gender_pay_gap_Estonia_recommendations.pdf
Fulton, L. (2011) Worker representation in Europe. Labour Research Department and ETUI (online publication). http://www.worker-participation.eu/
Kallaste, E. and Woolfson, C. (2013) “Negotiated responses to the crisis in the Baltic countries” TRANSFER Special issue (forthcoming) Visser, J. (2011) ICTWSS database, Amsterdam Institute of Advanced Labour Studies, University of Amster-dam. http://www.uva-aias.net/208
JANICKO, Pavel: The Youth Unemployment Situation in the Czech Republic. Social Europe Journal. Availa-ble at: http://www.social-europe.eu/2012/08/the-youth-unemployment-situation-in-the-czech-republic/
PFEIFEROVÁ, Štěpánka: Development of collectively agreed working conditions from 1993 to 2011.
PFEIFEROVÁ, Štepánka: Low interest by companies in flexible forms of work. Dublin: European Foundation for Improvement of Living and Working Conditions. 14. 11. 2011. Available at: http://www.eurofound.europa.eu/ewco/2011/08/CZ1108019I.htm
POJER, Petr: Czech Republic: Industrial relations profile. Dublin: European Foundation for Improvement of Living and Working Conditions. 2012. Not published yet.
Ministry of Finance of the Czech Republic: Macroeconomic Forecast, October 2012, ISSN 1804-7971. Available at: http://www.mfcr.cz/cps/rde/xbcr/mfcr/Macroeconomic-Forecast_2012-Q4.pdf
VEVERKOVÁ, Soňa: Eiro CAR on impact of the crisis on industrial relations. Dublin: European Foundation for Improvement of Living and Working Conditions. 13. 11. 2012. Not published yet.