estimating optimal landfill - agecon searchageconsearch.umn.edu/bitstream/23366/1/aer294.pdf ·...
TRANSCRIPT
Agricultural Economics Report No. 294
Estimating Optimal LandfillSizes and Locations
in North Dakota
Department of Agricultural EconomicsAgricultural Experiment Station
North Dakota State University
Fargo, North Dakota 58105
I ~IIWY I L1I I 1= I ,1 , L L_ · 111 ~ ~I r- IIC I - - _ L _ L1, I _ Jl
14s11·'111 ' I II I r I·a~·~' - I 1 -% "
March 1993
Acknowledgments
The authors wish to acknowledge Martin Schock, Steven Tillotson, and BobWetsch, North Dakota State Department of Health and Consolidated Laboratories, fortheir help in providing information and editorial comments.
Thanks also are given to Rita Hamm and Charlene Lucken who edited thedocument and Jim Baltezore, David Givers, Mark Krause, and Jay Leitch who reviewedthe document. Finally, thanks to Lucy Radke and Shelly Swandal who assisted indocument preparation.
Financial support for the study was provided in part by the EnvironmentalProtection Agency under contract with the North Dakota State Department of Health and
Consolidated Laboratories.
The authors assume responsibility for any errors of omission, logic, or otherwise.
List of Tables
Table Page
1. LAND REQUIREMENTS FOR DIFFERENT SIZED LANDFILLS, NORTHDAKOTA, 1992 ................................................ 8
2. PREDEVELOPMENT COSTS FOR DIFFERENT SIZED LANDFILLS, NORTHDAKOTA ..................................................... 9
3. CONSTRUCTION COSTS FOR DIFFERENT SIZED LANDFILLS, NORTHDAKOTA .................................................. .10
4. TOTAL FIXED COSTS FOR DIFFERENT SIZED LANDFILLS, NORTHDAKOTA ........... .................................. .... . 11
5. VARIABLE OPERATING COSTS FOR DIFFERENT SIZED LANDFILLS,NORTH DAKOTA .............................................. 12
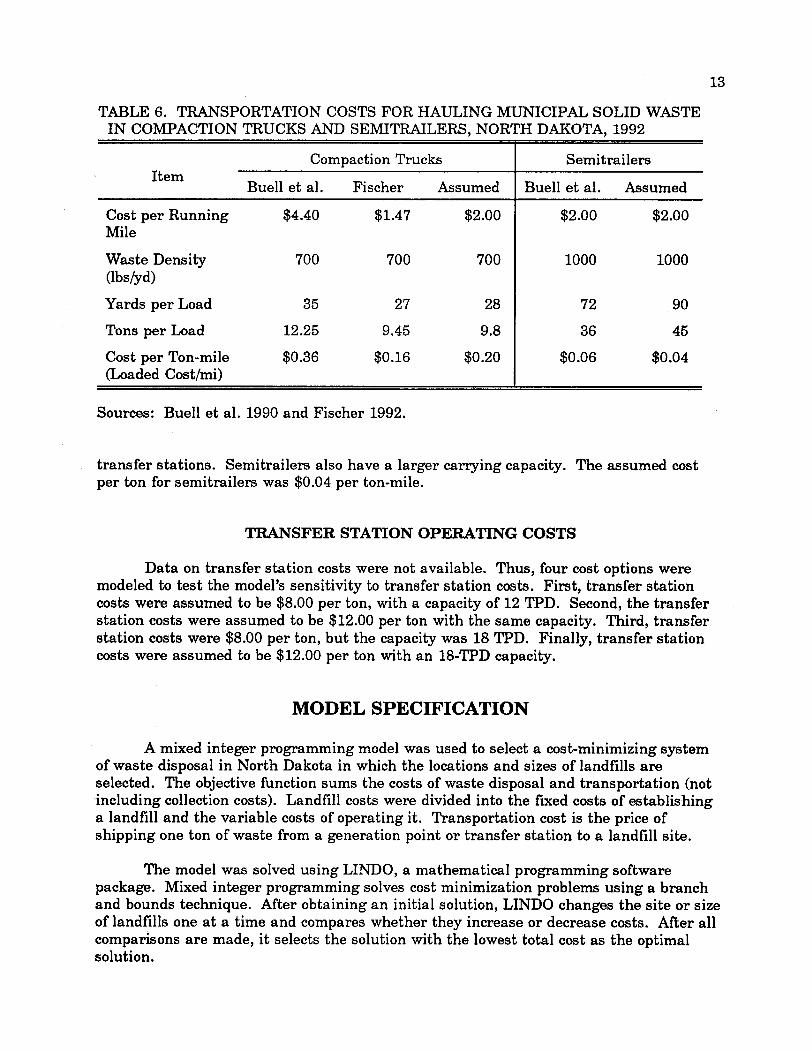
6. TRANSPORTATION COSTS FOR HAULING MUNICIPAL SOLID WASTE INCOMPACTION TRUCKS AND SEMITRAILERS ...................... 13
7. ANNUALIZED COST ESTIMATES, VOLUME OF WASTE, NUMBER OFLANDFILLS, AND AVERAGE TOTAL COST FOR SCENARIOS Al, A2, B,AND C, 1992 ................................................. 19
8. SITES, UTILIZATION, TOTAL AND AVERAGE TOTAL COST ESTIMATESFOR SCENARIO B, 1992 ........................................ 23
9. ASSUMPTIONS AND VOLUME OF WASTE HANDLED FOR SCENARIO D,TRANSSHIPMENT ............................................ 25
10. WASTE HANDLED AT LANDFILLS FOR SCENARIOS B, D1, E, F, G,AND H ...................................................... 27
11. ANNUALIZED COST ESTIMATES, VOLUME OF WASTE, NUMBER OFLANDFILLS, AND AVERAGE TOTAL COST FOR SCENARIOS Dl, D2,D3, AND D4, 1992 ............................................. 28
12. ANNUALIZED COST ESTIMATES, VOLUME OF WASTE, NUMBER OFLANDFILLS, AND AVERAGE TOTAL COST FOR SCENARIOS E, F, G,AND H, 1992 ................................................. 30
iii
List of Figures
Figure Page
1. Permitted Landfills in North Dakota, 1991 .............................. 4
2. Composite Liner Design Criteria for Municipal Solid Waste Landfills ......... 4
3. Acreage Requirements for Landfills Given Solid Waste Generation, In-placeCompacted Density, and Depth of Landfill ........................... 7
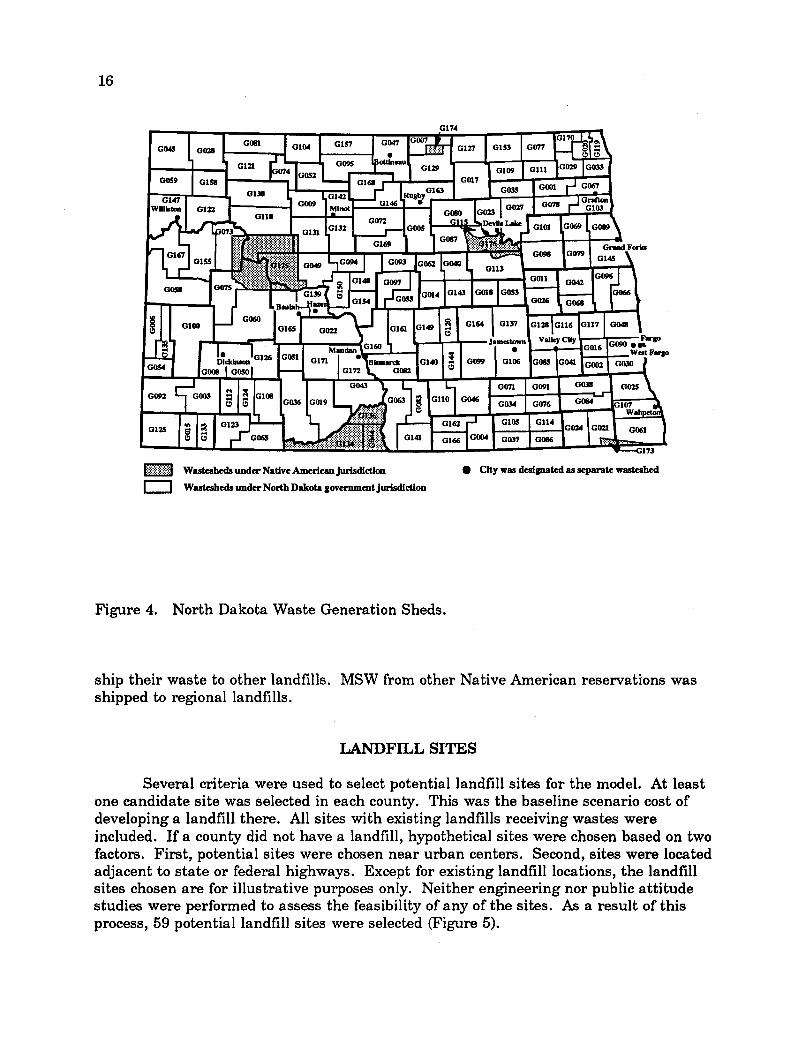
4. North Dakota Waste Generation Sheds ................................ 16
5. Possible Landfill Sites in North Dakota, 1992 ........................... 17
6. Distribution of County-level Waste Disposal Costs Under the BaselineScenario (Al), 1992 ............................................. 20
7. Waste Draw Areas and Landfill Locations for Scenario B, 1992 .............. 22
8. Distribution of County-level Waste Disposal Costs Under Scenario B, 1992 ..... 24
9. Waste Draw Areas and Landfill Locations Under Scenario H, 1992 ........... 31
10. Distribution of County-level Waste Disposal Costs Under Scenario H, 1992 .... 32
iv
List of Appendix TablesTable Page
Al. COUNTY LANDFILL SITES, 1992 AND AVERAGE LAND COST PER ACRE,1990-1992, NORTH DAKOTA ..................................... 39
Bl. WASTESHED POPULATION AND WASTESHED GENERATION RATES,NORTH DAKOTA, 1992 ......................................... 43
C1. SCENARIO Al, COUNTY-LEVEL WASTE DISPOSAL COSTS UNDERBASELINE SCENARIO, NORTH DAKOTA, 1992 ..................... 49
C2. SCENARIO A2, COUNTY-LEVEL WASTE DISPOSAL COSTS UNDERBASELINE SCENARIO WITH ONE-HALF WASTE COLLECTION FROMRURAL POPULATION, NORTH DAKOTA, 1992 ...................... 50
C3. SCENARIO B, COUNTY-LEVEL WASTE DISPOSAL COSTS UNDEROPTIMUM SIZE AND LOCATION SCENARIO, NORTH DAKOTA, 1992 ... 51
C4. SCENARIO C, COUNTY-LEVEL WASTE DISPOSAL COSTS UNDERSCENARIO B WITH ONE-THIRD LESS WASTE COLLECTION, NORTHDAKOTA, 1992 ................................ ............... . 52
C5. SCENARIO Dl, COUNTY-LEVEL WASTE DISPOSAL COSTS WITHTRANSFER STATIONS OPERATING WITH 50 MILE BREAK-EVENDISTANCE AND 12 TONS PER DAY CAPACITY, NORTH DAKOTA, 1992.. 53
C6. SCENARIO D2, COUNTY-LEVEL WASTE DISPOSAL COSTS WITHTRANSFER STATIONS OPERATING WITH 75 MILE BREAK-EVENDISTANCE AND 12 TONS PER DAY CAPACITY, NORTH DAKOTA, 1992 .. 54
C7. SCENARIO D3, COUNTY-LEVEL WASTE DISPOSAL COSTS WITHTRANSFER STATIONS OPERATING WITH 50 MILE BREAK-EVENDISTANCE AND 18 TONS PER DAY CAPACITY, NORTH DAKOTA, 1992.. 55
C8. SCENARIO D4, COUNTY-LEVEL WASTE DISPOSAL COSTS WITHTRANSFER STATIONS OPERATING WITH 75 MILE BREAK-EVENDISTANCE AND 18 TONS PER DAY CAPACITY, NORTH DAKOTA, 1992 .. 56
C9. SCENARIO E, COUNTY-LEVEL WASTE DISPOSAL COSTS WITH WASTEINCINERATOR LOCATED AT GRAFTON, NORTH DAKOTA, 1992 ....... 57
C10. SCENARIO F, COUNTY-LEVEL WASTE DISPOSAL COSTS WITH FARGO-WEST FARGO, BISMARCK-MANDAN, AND MCKENZIE COUNTYRECEIVING WASTE ONLY FROM THEIR OWN JURISDICTION, NORTHDAKOTA, 1992 .......... ...................................... 58
v
Table of Appendix Tables (Continued)Table Page
C11. SCENARIO G, COUNTY-LEVEL WASTE DISPOSAL COSTS WITHOUTELLENDALE, NORTH DAKOTA, 1992 ............................. 59
C12. SCENARIO H, COUNTY-LEVEL WASTE DISPOSAL COSTS WITHIMPORTS AND ASSUMPTIONS FROM SCENARIOS E, F, AND G, INNORTH DAKOTA, 1992 ......................................... 60
vi
HIGHLIGHTS
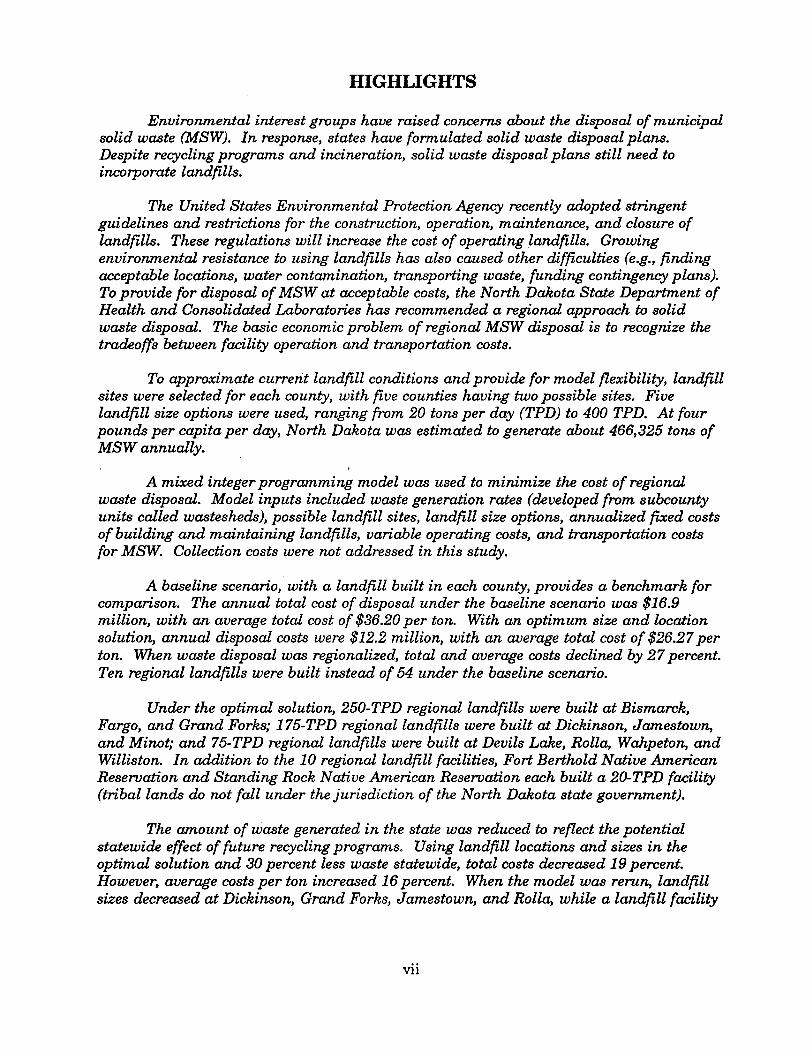
Environmental interest groups have raised concerns about the disposal of municipalsolid waste (MSW). In response, states have formulated solid waste disposal plans.Despite recycling programs and incineration, solid waste disposal plans still need toincorporate landfills.
The United States Environmental Protection Agency recently adopted stringentguidelines and restrictions for the construction, operation, maintenance, and closure oflandfills. These regulations will increase the cost of operating landfills. Growingenvironmental resistance to using landfills has also caused other difficulties (e.g., findingacceptable locations, water contamination, transporting waste, funding contingency plans).To provide for disposal of MSW at acceptable costs, the North Dakota State Department ofHealth and Consolidated Laboratories has recommended a regional approach to solidwaste disposal. The basic economic problem of regional MSW disposal is to recognize thetradeoffs between facility operation and transportation costs.
To approximate current landfill conditions and provide for model flexibility, landfillsites were selected for each county, with five counties having two possible sites. Fivelandfill size options were used, ranging from 20 tons per day (TPD) to 400 TPD. At fourpounds per capita per day, North Dakota was estimated to generate about 466,325 tons ofMSW annually.
A mixed integer programming model was used to minimize the cost of regionalwaste disposal. Model inputs included waste generation rates (developed from subcountyunits called wastesheds), possible landfill sites, landfill size options, annualized fixed costsof building and maintaining landfills, variable operating costs, and transportation costsfor MSW. Collection costs were not addressed in this study.
A baseline scenario, with a landfill built in each county, provides a benchmark forcomparison. The annual total cost of disposal under the baseline scenario was $16.9million, with an average total cost of $36.20 per ton. With an optimum size and locationsolution, annual disposal costs were $12.2 million, with an average total cost of $26.27 perton. When waste disposal was regionalized, total and average costs declined by 27 percent.Ten regional landfills were built instead of 54 under the baseline scenario.
Under the optimal solution, 250-TPD regional landfills were built at Bismarck,Fargo, and Grand Forks; 175-TPD regional landfills were built at Dickinson, Jamestown,and Minot; and 75-TPD regional landfills were built at Devils Lake, Rolla, Wahpeton, andWilliston. In addition to the 10 regional landfill facilities, Fort Berthold Native AmericanReservation and Standing Rock Native American Reservation each built a 20-TPD facility(tribal lands do not fall under the jurisdiction of the North Dakota state government).
The amount of waste generated in the state was reduced to reflect the potentialstatewide effect of future recycling programs. Using landfill locations and sizes in theoptimal solution and 30 percent less waste statewide, total costs decreased 19 percent.However, average costs per ton increased 16 percent. When the model was rerun, landfillsizes decreased at Dickinson, Grand Forks, Jamestown, and Rolla, while a landfill facility
vii
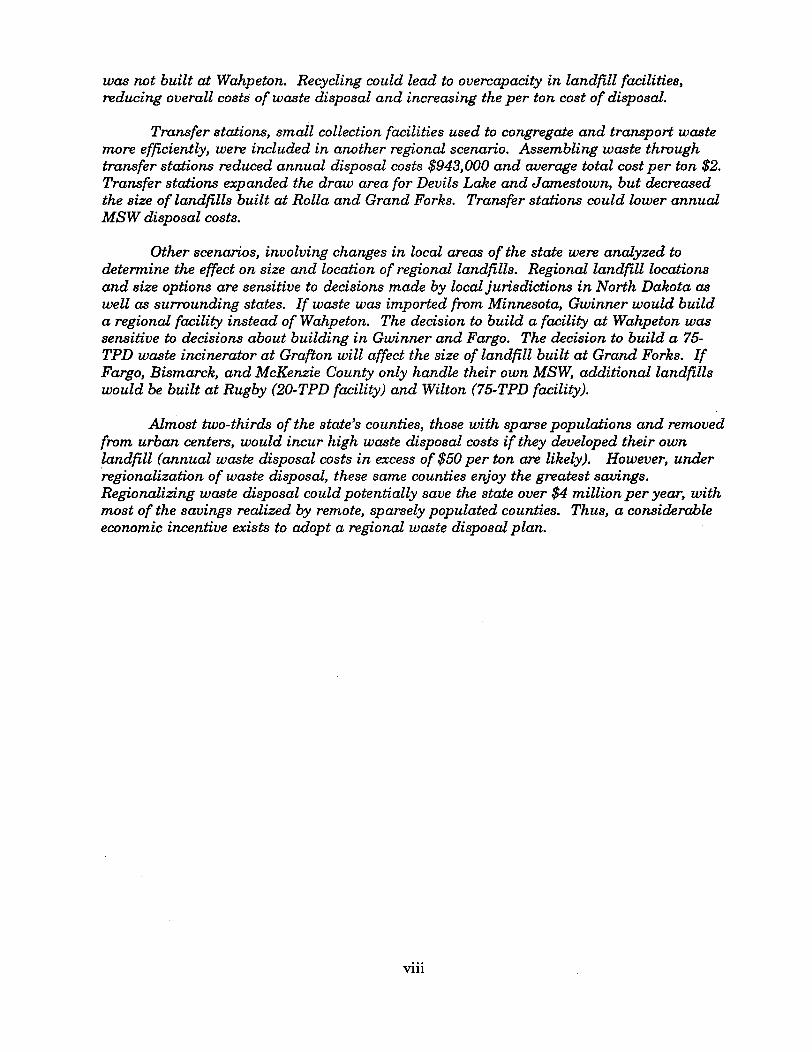
was not built at Wahpeton. Recycling could lead to overcapacity in landfill facilities,reducing overall costs of waste disposal and increasing the per ton cost of disposal.
Transfer stations, small collection facilities used to congregate and transport wastemore efficiently, were included in another regional scenario. Assembling waste throughtransfer stations reduced annual disposal costs $943,000 and average total cost per ton $2.Transfer stations expanded the draw area for Devils Lake and Jamestown, but decreasedthe size of landfills built at Rolla and Grand Forks. Transfer stations could lower annualMSW disposal costs.
Other scenarios, involving changes in local areas of the state were analyzed todetermine the effect on size and location of regional landfills. Regional landfill locationsand size options are sensitive to decisions made by local jurisdictions in North Dakota aswell as surrounding states. If waste was imported from Minnesota, Gwinner would builda regional facility instead of Wahpeton. The decision to build a facility at Wahpeton wassensitive to decisions about building in Gwinner and Fargo. The decision to build a 75-TPD waste incinerator at Grafton will affect the size of landfill built at Grand Forks. IfFargo, Bismarck, and McKenzie County only handle their own MSW, additional landfillswould be built at Rugby (20-TPD facility) and Wilton (75-TPD facility).
Almost two-thirds of the state's counties, those with sparse populations and removedfrom urban centers, would incur high waste disposal costs if they developed their ownlandfill (annual waste disposal costs in excess of $50 per ton are likely). However, underregionalization of waste disposal, these same counties enjoy the greatest savings.Regionalizing waste disposal could potentially save the state over $4 million per year, withmost of the savings realized by remote, sparsely populated counties. Thus, a considerableeconomic incentive exists to adopt a regional waste disposal plan.
viii
ESTIMATING OPTIMAL LANDFILL SIZESAND LOCATIONS IN NORTH DAKOTA
Frank J. Dooley, Dean A. Bangsund, F. Larry Leistritz, William R. Fischer*
INTRODUCTION
Managing municipal solid waste (MSW) is a growing problem in North Dakota andnationwide. Households, businesses, and industry generate municipal solid waste at a percapita rate of about four pounds per day (U.S. Environmental Protection Agency 1990b).The per capita rate of MSW generation is expected to continue increasing into the nextcentury.
To cope with growing quantities of municipal solid waste, an integrated solid wastemanagement hierarchy has been recommended. The hierarchy has four tiers: sourcereduction, recycling, incineration, and landfilling (U.S. Environmental Protection Agency1989). Source reduction is changing resource use to reduce waste generation. Recyclingincludes separating and collecting recyclable materials and processing and returning thosematerials to the marketplace. Incineration of municipal solid waste involves burninggarbage to reduce its volume and/or to recover energy for electric power generation.Landfilling will continue to be necessary even if the other three techniques are usedeffectively.
While additional landfill space is needed, mounting concern about protectinggroundwater and other environmental resources has led to stringent regulationsgoverning the design and operation of these facilities. Pursuant to the ResourceConservation and Recovery Act, regulations have been adopted for the operation (SubtitleC) and design (Subtitle D) of municipal solid waste landfills.' These regulations becomeeffective October 1993. Among the most salient changes from previous requirements arethose that mandate synthetic liners and leachate collection systems for most landfills(Walsh 1988). While these environmental protection devices are designed to preventgroundwater contamination by leachate, they make new landfills expensive relative to olddesigns. Thus, Subtitle D requirements will substantially increase the economies of sizein landfill development and operation. That is, large capacity landfills will have costadvantages over smaller capacity landfills.
Existing landfills in most North Dakota communities will soon need to be replacedor upgraded to comply with Environmental Protection Agency (EPA) requirements.However, the requirements of Subtitle D will make small community-based landfillsprohibitively expensive to develop and operate. To provide MSW management atacceptable costs, regions throughout the state are developing solid waste managementplans. While a variety of factors must be considered in developing regional plans for
'Assistant professor, research associate, and professor, respectively, Department of AgriculturalEconomics, North Dakota State University, Fargo. Fischer is research associate, Center forEconomic Development, University of Wisconsin-Superior.
'The regulations, which are found in 40 CFR § 258, were adopted as part of theResource Conservation and Recovery Act (42 United States Code § 6944 (1984)).
2
MSW management, the basic economic problem is one of selecting optimum sites for andsizes of landfill facilities. Solutions to this problem must consider the regional pattern ofMSW generation and the trade-off between facility operation costs and MSWtransportation costs. Landfill costs are lower on a per ton basis for larger capacityfacilities because of economies of size. MSW transportation costs increase when MSWmust be transported greater distances to larger facilities. An additional factor in landfillsite and size selection is the role of transfer stations.
PURPOSE
The purpose of this project was to estimate the number, location, and capacity ofMSW landfill facilities that would minimize the total cost of waste transportation anddisposal for North Dakota communities. To accomplish this, it was necessary to estimate:
1. the amount of waste generated annually in North Dakota,
2. the fixed costs of establishing and variable costs of operating landfills ofdifferent sizes, under Subtitle D constraints,
3. the operating costs of transfer stations, and
4. the cost of transporting solid waste from generation location to disposalfacility.
Transportation and disposal costs did not include the collection phase of solid wastedisposal (i.e., curbside pickup costs). This information was then used in a cost-minimizing, mixed integer programming model to find the optimum size and location oflandfill facilities.
The model was used to estimate the disposal and transportation costs for the eightscenarios. In some cases, several options were run for a particular scenario.
Scenario A - One landfill in every county. This model provides a baseline. Twooptions are considered, one with all waste and the other with only half the wastefrom rural areas. The second option assumes that some rural residents continue toburn or dispose waste on their own.
Scenario B - Regional cost optimization. This model provides a regional solution tositing and sizing landfills.
Scenario C - Impact of recycling. The sites from Scenario B are fixed, but themodel is re-estimated with 30 percent less waste to evaluate the effect of recyclingprograms.
Scenario D - Transfer stations. Sites not selected for landfills in Scenario B aresites for possible transfer stations. This model evaluates collecting trash attransfer stations and then reshipping by semitrailers to landfills.
3
Scenario E - the Grafton incinerator. The Grafton area is considering building a75-ton per day incinerator. This will identify their assembly area and the effect onother landfills in the state.
Scenario F - Local options. Bismarck, Fargo-West Fargo, and McKenzie Countyare assumed to "go alone," building landfills for only their immediate area. Thismodel considers the effect on landfill requirements for the rest of the state.
Scenario G - Exclude Ellendale. At the time the study was conducted, Ellendaleshipped their waste to South Dakota. However, as of January 1993, Ellendalecontracted to ship their waste to a site in North Dakota.
Scenario H - Combines Scenarios E, F, and G. In addition, landfills at Fargo,Grand Forks, and Gwinner are allowed to accept waste imports.
MUNICIPAL SOLID WASTE MANAGEMENT IN NORTH DAKOTA
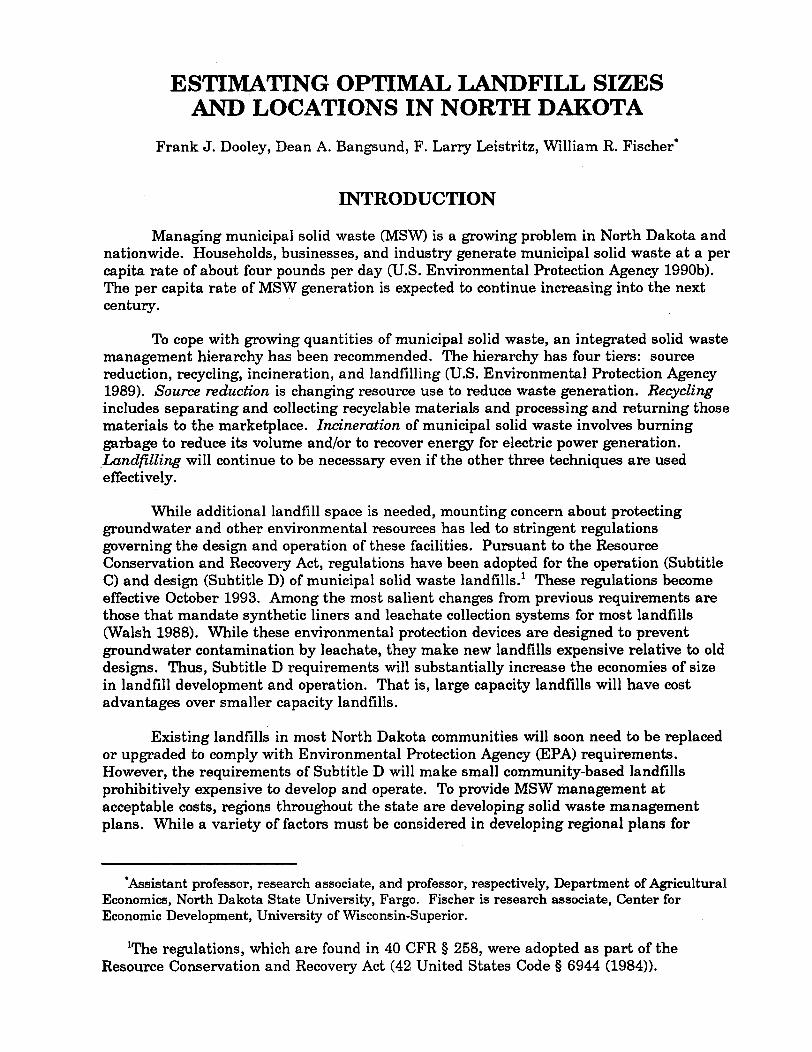
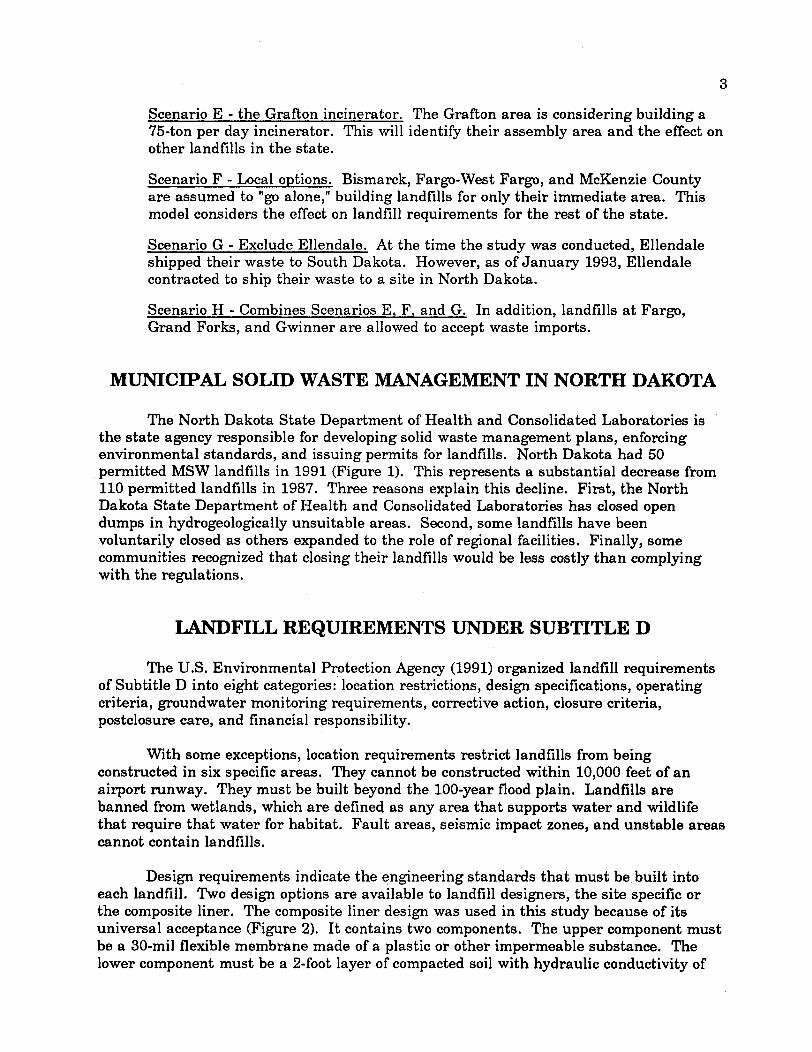
The North Dakota State Department of Health and Consolidated Laboratories isthe state agency responsible for developing solid waste management plans, enforcingenvironmental standards, and issuing permits for landfills. North Dakota had 50permitted MSW landfills in 1991 (Figure 1). This represents a substantial decrease from110 permitted landfills in 1987. Three reasons explain this decline. First, the NorthDakota State Department of Health and Consolidated Laboratories has closed opendumps in hydrogeologically unsuitable areas. Second, some landfills have beenvoluntarily closed as others expanded to the role of regional facilities. Finally, somecommunities recognized that closing their landfills would be less costly than complyingwith the regulations.
LANDFILL REQUIREMENTS UNDER SUBTITLE D
The U.S. Environmental Protection Agency (1991) organized landfill requirementsof Subtitle D into eight categories: location restrictions, design specifications, operatingcriteria, groundwater monitoring requirements, corrective action, closure criteria,postclosure care, and financial responsibility.
With some exceptions, location requirements restrict landfills from beingconstructed in six specific areas. They cannot be constructed within 10,000 feet of anairport runway. They must be built beyond the 100-year flood plain. Landfills arebanned from wetlands, which are defined as any area that supports water and wildlifethat require that water for habitat. Fault areas, seismic impact zones, and unstable areascannot contain landfills.
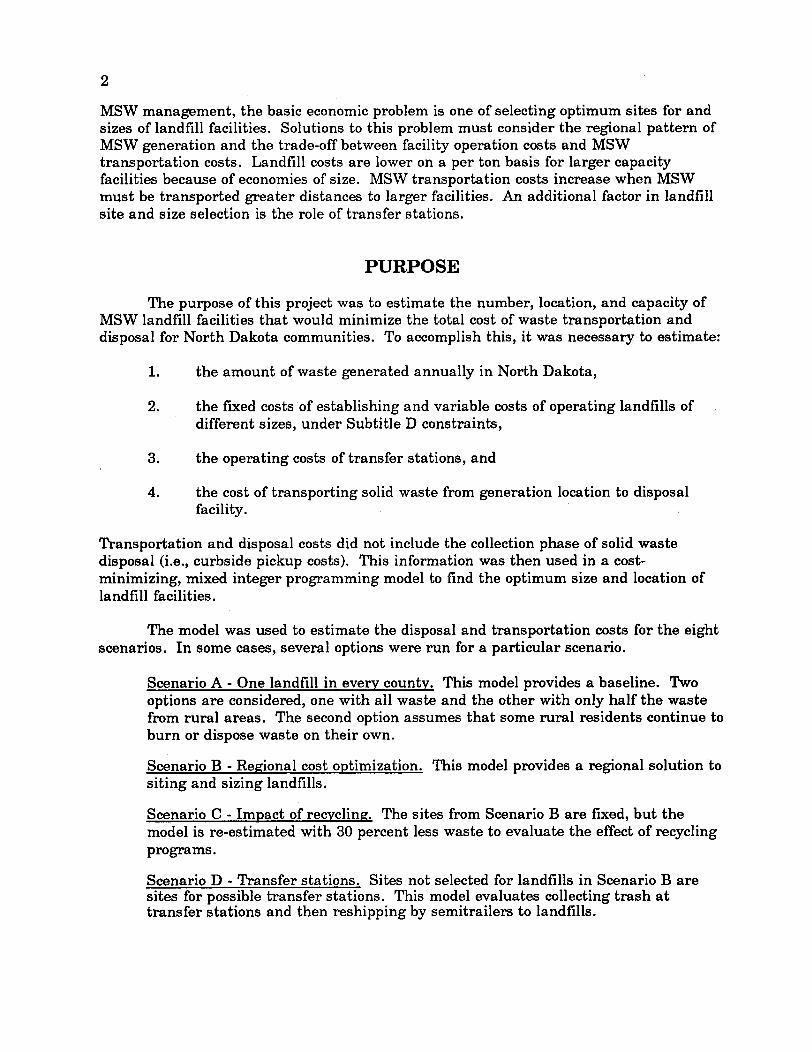
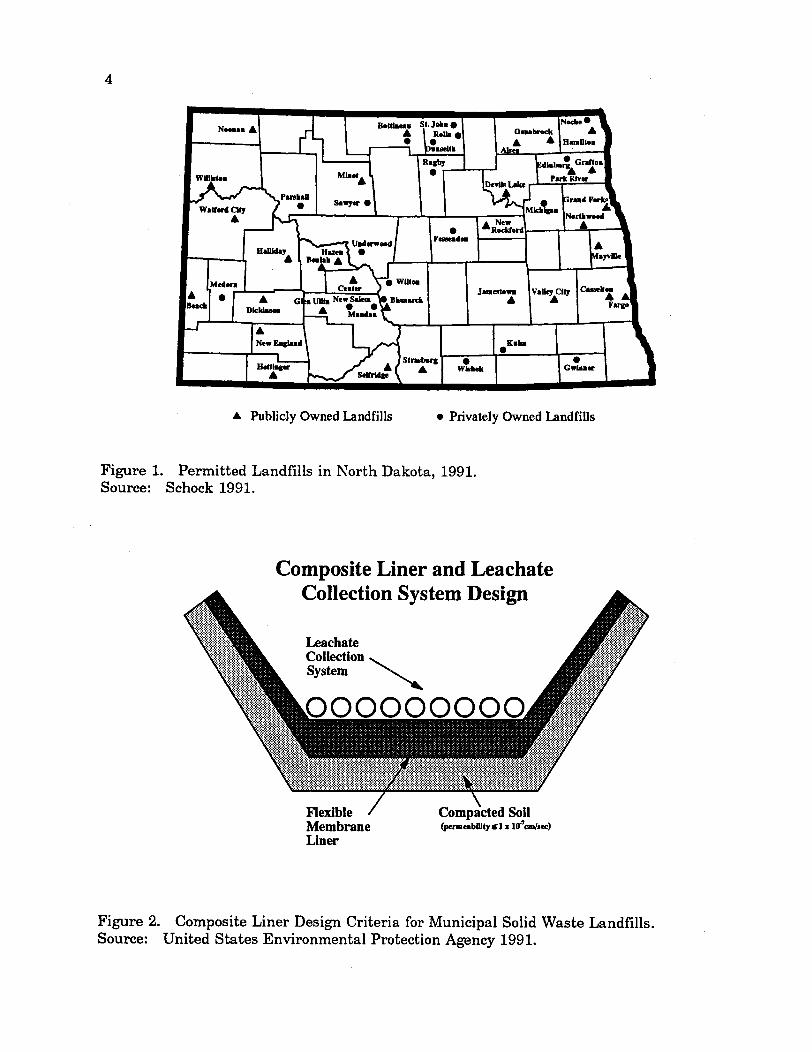
Design requirements indicate the engineering standards that must be built intoeach landfill. Two design options are available to landfill designers, the site specific orthe composite liner. The composite liner design was used in this study because of itsuniversal acceptance (Figure 2). It contains two components. The upper component mustbe a 30-mil flexible membrane made of a plastic or other impermeable substance. Thelower component must be a 2-foot layer of compacted soil with hydraulic conductivity of
4
A Publicly Owned Landfills * Privately Owned Landfills
Figure 1. Permitted Landfills in North Dakota, 1991.Source: Schock 1991.
Composite Liner and Leachate
LeachateCollectionSystem
Flexible Compacted SoilMembrane (penreabiity 1 x lOAcm/sec)Liner
Figure 2. Composite Liner Design Criteria for Municipal Solid Waste Landfills.Source: United States Environmental Protection Agency 1991.
5
not more than 1x10⁻⁷ centimeters per second. Other engineering standards are designedaccording to site specific conditions.
Landfill operators are required to follow certain criteria when receiving waste andkeeping records. They must prevent the dumping of hazardous waste. A plan fordetecting hazardous waste must be formulated and implemented. Six inches of earthenmaterial must cover the waste at the end of each day's activities or more frequently ifdeemed necessary. Measures must be taken to control disease vectors and explosive gasaccumulation. Landfill operators must comply with state laws governing air pollution asrequired by the federal Clean Air Act. Open burning at landfills is prohibited except incertain circumstances. The operators of a landfill must control run-on and prevent run-offof surface water. They must not accept liquid wastes, and access to the facility must becontrolled to prevent unauthorized dumping. Records must be kept of inspections soaudits can be performed.
The groundwater around landfills must be monitored to detect any contaminationthat may occur from leachate. To do this, appropriately located wells must be drilled nearthe facility perimeter. A separate monitoring system for each unit well must be used.Background concentrations of contaminants in the groundwater must be sampled andanalyzed before wastes can be received.
A corrective action plan must be formulated and implemented in case groundwatercontamination is detected. The plan must include procedures to correct the contaminationand to compensate those who may suffer as a result.
When a landfill reaches design capacity, its useful life is said to have expired.Operators must then follow closure requirements to seal the landfill. A compacted layer,consisting of 18 inches of earthen material with a hydraulic conductivity not more than
xl10-15 centimeters per second, must cover the landfill. An erosion layer of six inches ofearthen material that can sustain native plant growth must cover the compacted layer.These activities must begin within 30 days after waste receiving has stopped.
The landfill facility must be maintained for 30 years postclosure. The final coverintegrity and effectiveness must be sustained to prevent any excess leachate fromaccumulating. Groundwater monitoring and methane gas control also must continue.
To ensure funding to carry out postclosure activities, a financial responsibilityaccount must be set up at the onset of a landfill project. A cost estimate for a third partyto conduct postclosure activities must be contained in the operating records of a landfill.Funds for postclosure activities must be set aside throughout its useful life.
ESTIMATES OF MODEL COEFFICIENTS
The mixed integer programming model requires coefficient estimates of (1) theamounts of MSW generated at different locations in North Dakota, (2) landfillestablishment and operation costs, (3) transfer station operating costs, and (4) MSWtransportation costs. Data sources and assumptions applicable to each of these topics arediscussed here.
6
QUANTITIES OF MUNICIPAL SOLID WASTE GENERATED
The quantity of MSW generated in various North Dakota communities wasestimated as the product of population and per capita waste generation. Population for176 wastesheds was obtained from 1990 Census data (U.S. Bureau of the Census 1991).Some waste planners have adopted different waste generation rates for rural and urbanpopulations. The estimate of 4 pounds of MSW per person per day was recommended bythe North Dakota State Department of Health and Consolidated Laboratories (1992) foruse in developing regional solid waste plans in the state. The rate of 4 pounds per personper day was used for both rural and urban populations. The total generation of MSW wasabout 1,300 tons per day (TPD) or 466,325 tons per year (TPY) based on the state's 1990population of 638,800.
All waste generated in rural areas may not end up in landfills. Thus, the baselinesolution (Scenario A) is solved both with the 4 pound per day rate and with a rateadjusted for rural collection. The adjustment assumes that rural waste could only becollected from half of the residents. Rural residents are defined as anyone living in ruralareas (farms, ranches, or in towns with less than 75 persons). The total generation ofMSW was about 1,100 TPD or 399,208 TPY under this assumption.
LANDFILL COST ESTIMATES
Landfill 2 capital and operating cost estimates were developed for five landfill sizes-- 20, 75, 175, 250, and 400 TPD. The cost estimates were synthesized from four prioreconomic-engineering studies. They are Minnesota Department of Natural Resources1992 (15 TPD landfill); Halbach 1990 (75-TPD landfill); Sebesta 1989 (175-TPD landfill);and Joyce 1990 (250- and 400-TPD landfill). Buell et al. (1990) developed the relationshipof costs among different sized landfills, which was used to validate the consistency of thecost estimates.
Landfill costs consist of two types of costs, fixed and variable. Fixed costs varywith landfill size. The fixed costs for a big landfill will be more than those for a smalllandfill because the big landfill requires more land, more excavation, a larger liner, etc.However, once a landfill is built, the fixed costs are constant over time (for any sizedlandfill). Variable costs are costs per ton cost. Variable costs per ton vary with landfillsize. Larger landfills have lower variable costs because labor and equipment are usedmore efficiently. Variable costs per ton do not vary during operation.
Landfill costs are categorized into four stages: predevelopment, initial construction,annual operations, and closure and postclosure care (Joyce 1990). Location restrictionsand design requirements affect predevelopment and initial construction costs. Operatingcriteria, groundwater monitoring requirements, corrective action, and financialresponsibility all affect the annual operation and continued development cost stages. To
2 The term 'landfill' as used in this report, refers to the site where MSW is buried. Itdoes not necessarily refer to the actual hole in the ground where waste may be buried. Alandfill site may actually contain several waste burial holes.
7
the extent possible, the assumptions of the prior studies were standardized to reflect theoperation of landfills in North Dakota.
Land Requirements
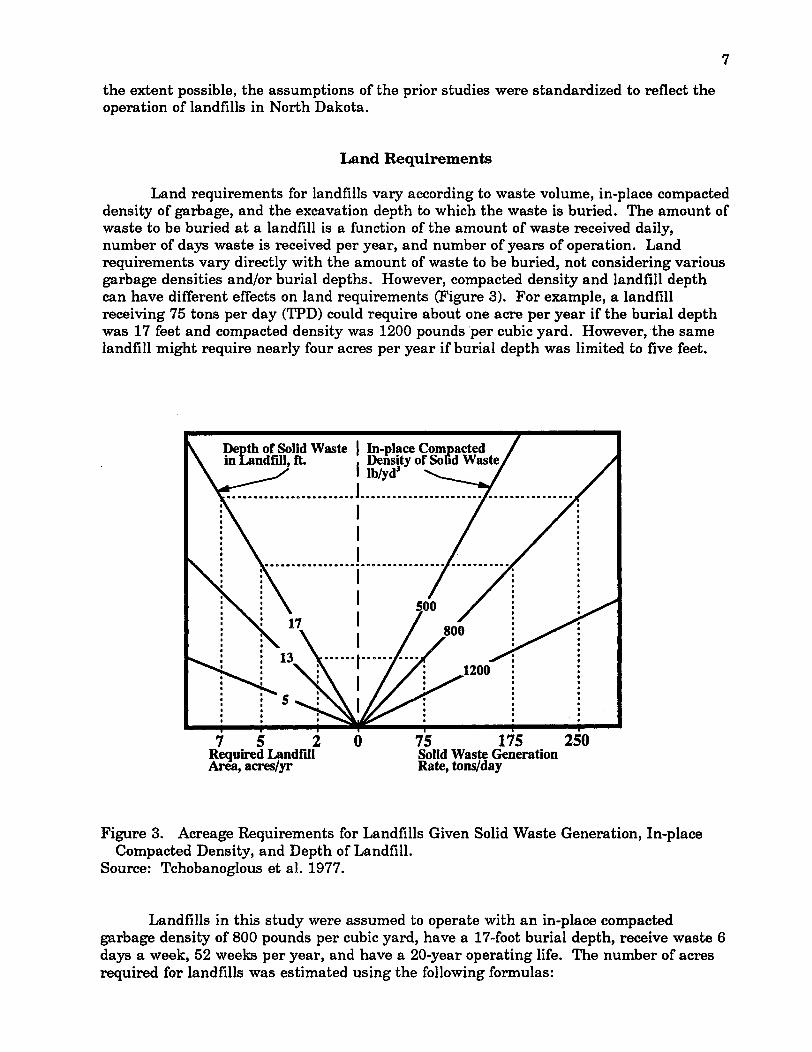
Land requirements for landfills vary according to waste volume, in-place compacteddensity of garbage, and the excavation depth to which the waste is buried. The amount ofwaste to be buried at a landfill is a function of the amount of waste received daily,number of days waste is received per year, and number of years of operation. Landrequirements vary directly with the amount of waste to be buried, not considering variousgarbage densities and/or burial depths. However, compacted density and landfill depthcan have different effects on land requirements (Figure 3). For example, a landfillreceiving 75 tons per day (TPD) could require about one acre per year if the burial depthwas 17 feet and compacted density was 1200 pounds per cubic yard. However, the samelandfill might require nearly four acres per year if burial depth was limited to five feet.
7 5 2Required LandfillArea, acres/yr
Figure 3. Acreage Requirements for Landfills Given Solid Waste Generation, In-placeCompacted Density, and Depth of Landfill.
Source: Tchobanoglous et al. 1977.
Landfills in this study were assumed to operate with an in-place compactedgarbage density of 800 pounds per cubic yard, have a 17-foot burial depth, receive waste 6days a week, 52 weeks per year, and have a 20-year operating life. The number of acresrequired for landfills was estimated using the following formulas:
8
VOLUME/DAY TPD * 2,000 Ib/toncompacted density (lb/yd 3)
FILL ACRES = VOLUME/DAY. 365 days * 27ft3/yd 3 (2)LANDFILL DEPTH (ft) * 43,560ft2/acre
In addition to land required for garbage burial, a buffer zone of 500 feet around a landfillperimeter was assumed. Buffer zones are needed to construct buildings and roads, andfor groundwater monitoring wells. The wells must be about 500 feet from the landfillboundary on land owned by the project (U.S. Environmental Protection Agency 1991).
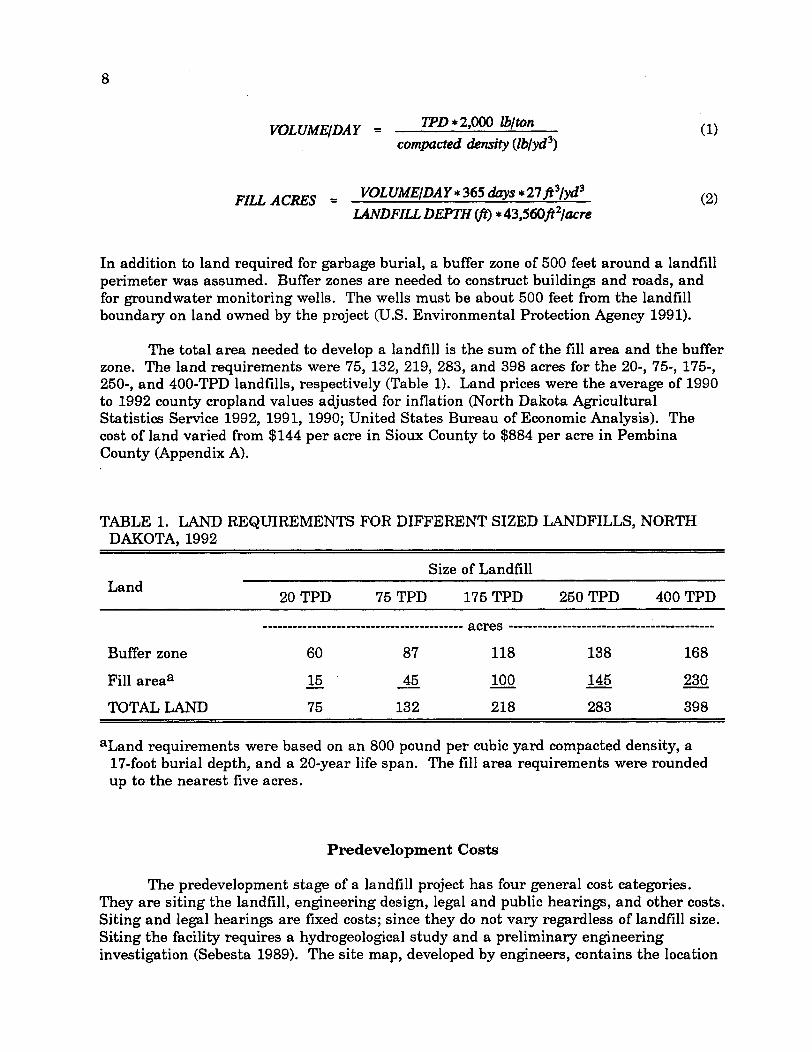
The total area needed to develop a landfill is the sum of the fill area and the bufferzone. The land requirements were 75, 132, 219, 283, and 398 acres for the 20-, 75-, 175-,250-, and 400-TPD landfills, respectively (Table 1). Land prices were the average of 1990to 1992 county cropland values adjusted for inflation (North Dakota AgriculturalStatistics Service 1992, 1991, 1990; United States Bureau of Economic Analysis). Thecost of land varied from $144 per acre in Sioux County to $884 per acre in PembinaCounty (Appendix A).
TABLE 1. LAND REQUIREMENTS FOR DIFFERENT SIZED LANDFILLS, NORTHDAKOTA, 1992
Size of LandfillLand
Land20 TPD 75 TPD 175 TPD 250 TPD 400 TPD
------------ acres -----------------------------------
Buffer zone 60 87 118 138 168
Fill areaa 15 45 100 145 230
TOTAL LAND 75 132 218 283 398
aLand requirements were based on an 800 pound per cubic yard compacted density, a17-foot burial depth, and a 20-year life span. The fill area requirements were roundedup to the nearest five acres.
Predevelopment Costs
The predevelopment stage of a landfill project has four general cost categories.They are siting the landfill, engineering design, legal and public hearings, and other costs.Siting and legal hearings are fixed costs; since they do not vary regardless of landfill size.Siting the facility requires a hydrogeological study and a preliminary engineeringinvestigation (Sebesta 1989). The site map, developed by engineers, contains the location
9
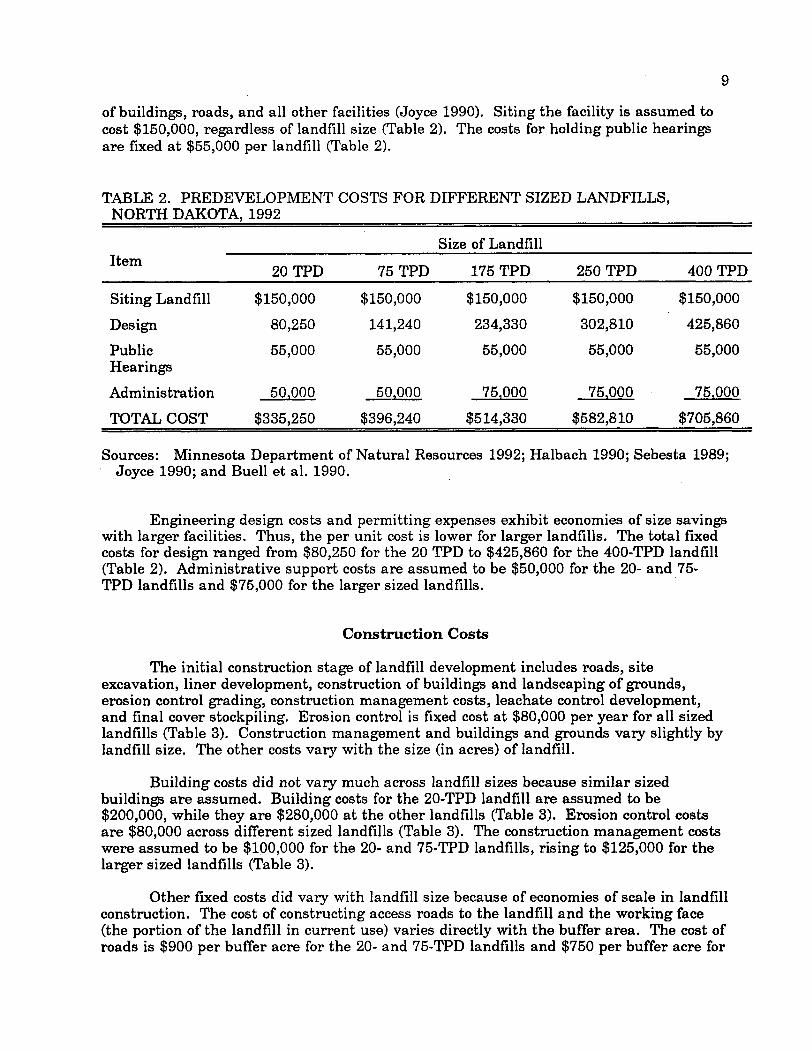
of buildings, roads, and all other facilities (Joyce 1990). Siting the facility is assumed tocost $150,000, regardless of landfill size (Table 2). The costs for holding public hearingsare fixed at $55,000 per landfill (Table 2).
TABLE 2. PREDEVELOPMENT COSTS FOR DIFFERENT SIZED LANDFILLS,NORTH DAKOTA, 1992
Size of LandfillItem20 TPD 75 TPD 175 TPD 250 TPD 400 TPD
Siting Landfill $150,000 $150,000 $150,000 $150,000 $150,000
Design 80,250 141,240 234,330 302,810 425,860
Public 55,000 55,000 55,000 55,000 55,000Hearings
Administration 50,000 50,000 75,000 75,000 75,000
TOTAL COST $335,250 $396,240 $514,330 $582,810 $705,860
Sources: Minnesota Department of Natural Resources 1992; Halbach 1990; Sebesta 1989;Joyce 1990; and Buell et al. 1990.
Engineering design costs and permitting expenses exhibit economies of size savingswith larger facilities. Thus, the per unit cost is lower for larger landfills. The total fixedcosts for design ranged from $80,250 for the 20 TPD to $425,860 for the 400-TPD landfill(Table 2). Administrative support costs are assumed to be $50,000 for the 20- and 75-TPD landfills and $75,000 for the larger sized landfills.
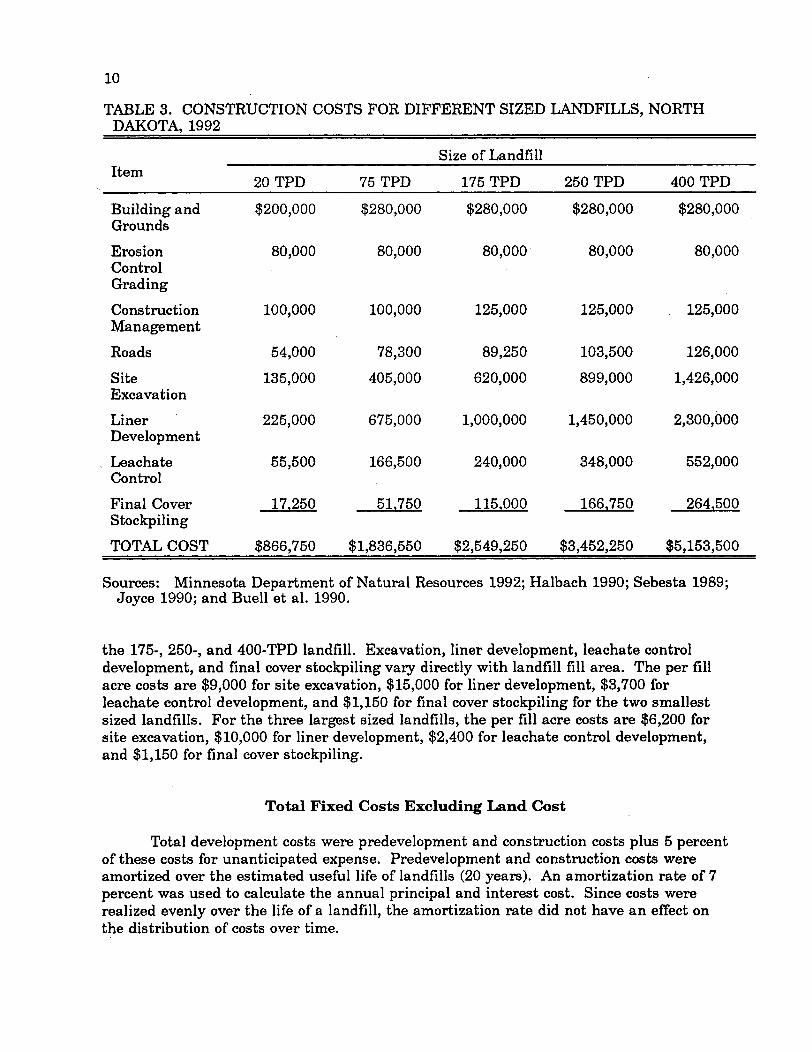
Construction Costs
The initial construction stage of landfill development includes roads, siteexcavation, liner development, construction of buildings and landscaping of grounds,erosion control grading, construction management costs, leachate control development,and final cover stockpiling. Erosion control is fixed cost at $80,000 per year for all sizedlandfills (Table 3). Construction management and buildings and grounds vary slightly bylandfill size. The other costs vary with the size (in acres) of landfill.
Building costs did not vary much across landfill sizes because similar sizedbuildings are assumed. Building costs for the 20-TPD landfill are assumed to be$200,000, while they are $280,000 at the other landfills (Table 3). Erosion control costsare $80,000 across different sized landfills (Table 3). The construction management costswere assumed to be $100,000 for the 20- and 75-TPD landfills, rising to $125,000 for thelarger sized landfills (Table 3).
Other fixed costs did vary with landfill size because of economies of scale in landfillconstruction. The cost of constructing access roads to the landfill and the working face(the portion of the landfill in current use) varies directly with the buffer area. The cost ofroads is $900 per buffer acre for the 20- and 75-TPD landfills and $750 per buffer acre for
10
TABLE 3. CONSTRUCTION COSTS FOR DIFFERENT SIZED LANDFILLS, NORTHDAKOTA, 1992
Size of LandfillItem 20 TPD 75 TPD 175 TPD 250 TPD 400 TPD
Building and $200,000 $280,000 $280,000 $280,000 $280,000Grounds
Erosion 80,000 80,000 80,000 80,000 80,000ControlGrading
Construction 100,000 100,000 125,000 125,000 125,000Management
Roads 54,000 78,300 89,250 103,500 126,000
Site 135,000 405,000 620,000 899,000 1,426,000Excavation
Liner 225,000 675,000 1,000,000 1,450,000 2,300,000Development
Leachate 55,500 166,500 240,000 348,000 552,000Control
Final Cover 17,250 51,750 115,000 166,750 264,500Stockpiling
TOTAL COST $866,750 $1,836,550 $2,549,250 $3,452,250 $5,153,500
Sources: Minnesota Department of Natural Resources 1992; Halbach 1990; Sebesta 1989;Joyce 1990; and Buell et al. 1990.
the 175-, 250-, and 400-TPD landfill. Excavation, liner development, leachate controldevelopment, and final cover stockpiling vary directly with landfill fill area. The per fillacre costs are $9,000 for site excavation, $15,000 for liner development, $3,700 forleachate control development, and $1,150 for final cover stockpiling for the two smallestsized landfills. For the three largest sized landfills, the per fill acre costs are $6,200 forsite excavation, $10,000 for liner development, $2,400 for leachate control development,and $1,150 for final cover stockpiling.
Total Fixed Costs Excluding Land Cost
Total development costs were predevelopment and construction costs plus 5 percentof these costs for unanticipated expense. Predevelopment and construction costs wereamortized over the estimated useful life of landfills (20 years). An amortization rate of 7percent was used to calculate the annual principal and interest cost. Since costs wererealized evenly over the life of a landfill, the amortization rate did not have an effect onthe distribution of costs over time.
11
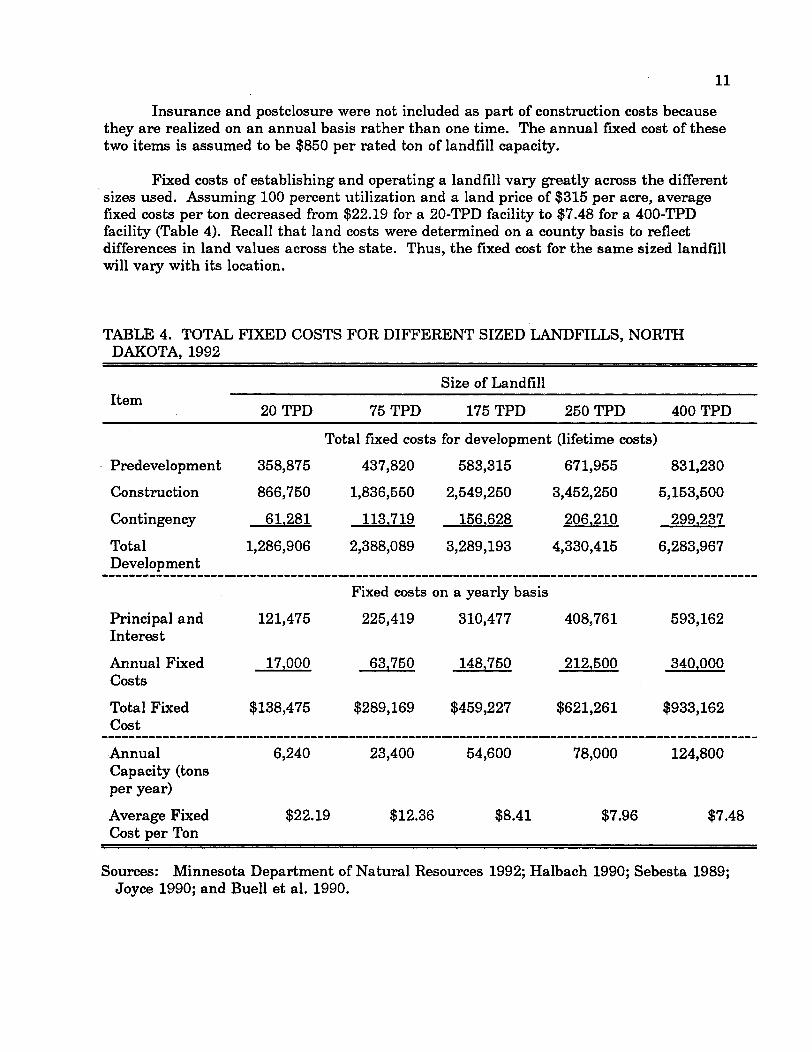
Insurance and postclosure were not included as part of construction costs becausethey are realized on an annual basis rather than one time. The annual fixed cost of thesetwo items is assumed to be $850 per rated ton of landfill capacity.
Fixed costs of establishing and operating a landfill vary greatly across the differentsizes used. Assuming 100 percent utilization and a land price of $315 per acre, averagefixed costs per ton decreased from $22.19 for a 20-TPD facility to $7.48 for a 400-TPDfacility (Table 4). Recall that land costs were determined on a county basis to reflectdifferences in land values across the state. Thus, the fixed cost for the same sized landfillwill vary with its location.
TABLE 4. TOTAL FIXED COSTS FOR DIFFERENT SIZED LANDFILLS, NORTHDAKOTA, 1992
Size of LandfillItem 20 TPD 75 TPD 175 TPD 250 TPD 400 TPD
Total fixed costs for development (lifetime costs)
Predevelopment 358,875 437,820 583,315 671,955 831,230
Construction 866,750 1,836,550 2,549,250 3,452,250 5,153,500
Contingency 61,281 113,719 156,628 206,210 299,237
Total 1,286,906 2,388,089 3,289,193 4,330,415 6,283,967Development
Fixed costs on a yearly basis
Principal and 121,475 225,419 310,477 408,761 593,162Interest
Annual Fixed 17,000 63,750 148,750 212,500 340.000Costs
Total Fixed $138,475 $289,169 $459,227 $621,261 $933,162Cost
Annual 6,240 23,400 54,600 78,000 124,800Capacity (tonsper year)
Average Fixed $22.19 $12.36 $8.41 $7.96 $7.48Cost per Ton
Sources: Minnesota Department of Natural Resources 1992; Halbach 1990; Sebesta 1989;Joyce 1990; and Buell et al. 1990.
12
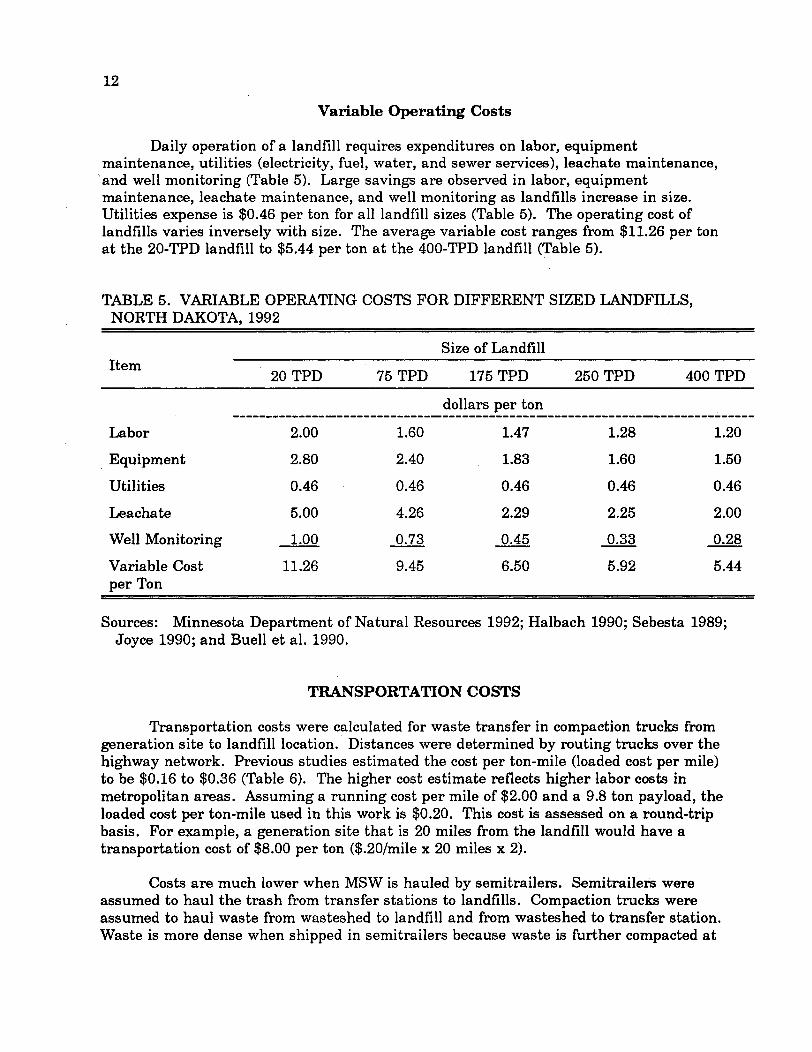
Variable Operating Costs
Daily operation of a landfill requires expenditures on labor, equipmentmaintenance, utilities (electricity, fuel, water, and sewer services), leachate maintenance,and well monitoring (Table 5). Large savings are observed in labor, equipmentmaintenance, leachate maintenance, and well monitoring as landfills increase in size.Utilities expense is $0.46 per ton for all landfill sizes (Table 5). The operating cost oflandfills varies inversely with size. The average variable cost ranges from $11.26 per tonat the 20-TPD landfill to $5.44 per ton at the 400-TPD landfill (Table 5).
TABLE 5. VARIABLE OPERATING COSTS FOR DIFFERENT SIZED LANDFILLS,NORTH DAKOTA, 1992
Size of LandfillItem 20 TPD 75 TPD 175 TPD 250 TPD 400 TPD
dollars per ton
Labor 2.00 1.60 1.47 1.28 1.20
Equipment 2.80 2.40 1.83 1.60 1.50
Utilities 0.46 0.46 0.46 0.46 0.46
Leachate 5.00 4.26 2.29 2.25 2.00
Well Monitoring 1.00 0.73 0.45 0.33 0.28
Variable Cost 11.26 9.45 6.50 5.92 5.44per Ton
Sources: Minnesota Department of Natural Resources 1992; Halbach 1990; Sebesta 1989;Joyce 1990; and Buell et al. 1990.
TRANSPORTATION COSTS
Transportation costs were calculated for waste transfer in compaction trucks fromgeneration site to landfill location. Distances were determined by routing trucks over thehighway network. Previous studies estimated the cost per ton-mile (loaded cost per mile)to be $0.16 to $0.36 (Table 6). The higher cost estimate reflects higher labor costs inmetropolitan areas. Assuming a running cost per mile of $2.00 and a 9.8 ton payload, theloaded cost per ton-mile used in this work is $0.20. This cost is assessed on a round-tripbasis. For example, a generation site that is 20 miles from the landfill would have atransportation cost of $8.00 per ton ($.20/mile x 20 miles x 2).
Costs are much lower when MSW is hauled by semitrailers. Semitrailers wereassumed to haul the trash from transfer stations to landfills. Compaction trucks wereassumed to haul waste from wasteshed to landfill and from wasteshed to transfer station.Waste is more dense when shipped in semitrailers because waste is further compacted at
13
TABLE 6. TRANSPORTATION COSTS FOR HAULING MUNICIPAL SOLID WASTEIN COMPACTION TRUCKS AND SEMITRAILERS, NORTH DAKOTA, 1992
Compaction Trucks SemitrailersItem Buell et al. Fischer Assumed Buell et al. Assumed
Cost per Running $4.40 $1.47 $2.00 $2.00 $2.00Mile
Waste Density 700 700 700 1000 1000(lbs/yd)
Yards per Load 35 27 28 72 90
Tons per Load 12.25 9.45 9.8 36 45
Cost per Ton-mile $0.36 $0.16 $0.20 $0.06 $0.04(Loaded Cost/mi)
Sources: Buell et al. 1990 and Fischer 1992.
transfer stations. Semitrailers also have a larger carrying capacity. The assumed costper ton for semitrailers was $0.04 per ton-mile.
TRANSFER STATION OPERATING COSTS
Data on transfer station costs were not available. Thus, four cost options weremodeled to test the model's sensitivity to transfer station costs. First, transfer stationcosts were assumed to be $8.00 per ton, with a capacity of 12 TPD. Second, the transferstation costs were assumed to be $12.00 per ton with the same capacity. Third, transferstation costs were $8.00 per ton, but the capacity was 18 TPD. Finally, transfer stationcosts were assumed to be $12.00 per ton with an 18-TPD capacity.
MODEL SPECIFICATION
A mixed integer programming model was used to select a cost-minimizing systemof waste disposal in North Dakota in which the locations and sizes of landfills areselected. The objective function sums the costs of waste disposal and transportation (notincluding collection costs). Landfill costs were divided into the fixed costs of establishinga landfill and the variable costs of operating it. Transportation cost is the price ofshipping one ton of waste from a generation point or transfer station to a landfill site.
The model was solved using LINDO, a mathematical programming softwarepackage. Mixed integer programming solves cost minimization problems using a branchand bounds technique. After obtaining an initial solution, LINDO changes the site or sizeof landfills one at a time and compares whether they increase or decrease costs. After allcomparisons are made, it selects the solution with the lowest total cost as the optimalsolution.
14
In general, the objective function form was
Minimize Cost = FCu IS, + E VCU VSU + TCk GSj (3)Sj i j k j
where:
Cost is the annual total cost of waste disposal in North Dakota.
The value of i denotes the different sized landfills possible at each site, i = 1, 2, 3,4, 5.
The value of j identifies the different landfill sites, j = 1, 2, ... , 59.
The value of k denotes different wastesheds in North Dakota, k = 1, 2, ..., 176.
FCU is the annualized fixed cost of constructing and operating a landfill of size i atsite j.
IS, is a binary integer variable that allows the annual fixed costs of a landfill ofsize i at site j to be added to total cost.
VC, is the variable cost per ton of operating a landfill of size i.
VSi is the number of tons transported to landfill size i at site j.
TC, is the cost of transporting one ton of waste from wasteshed k to landfill site j.
GSj is the annual number of tons of waste transported from wasteshed k tolandfill site j.
Equation 3 is minimized subject to four constraints. The first constraint (Equation4) requires that all waste generated annually in North Dakota be transported to a landfill.The value, WASTEk, is the waste generated annually in wasteshed k. This constraintsatisfies the study objective of disposing of all wastes in a timely manner. Ideally, themodel would require all waste from a particular wasteshed to go to the same landfill.However, this restriction would prevent the model from generating a solution. Whilewaste may go to more than one landfill, this will not be a widespread problem.
SGSkj WASTE., for all k (4)j
The second constraint (Equation 5) is a transfer row that transports waste to alandfill. Wastes are disposed of upon receipt and variable landfill costs are realized in theobjective function.
E GS = VSy, for allj and all i (5)k
15
Equation 6 is the capacity constraint for landfill size i. CAPACITYi is the amountof waste that can be accepted at a landfill of a particular size (i.e., 20, 75, 175, 250 or 400TPD). The amount will vary depending on the size of landfill selected by the model.
E CAPACITY, * ISu a VS, (6)i j
The final constraint (Equation 7) only allows one landfill to be built at anyparticular site. IS, is a binary integer. This forces the model to either build a landfill ornot. Landfills were assumed to be of a definite size (20, 75, 175, 250, or 400 TPD).Potentially landfills could be of any size. However, the increase in modelling complexitythat would result from using a continuous landfill cost function was judged to beunnecessary.
IS, s 1, {0,1} for all j (7)
WASTE GENERATION SITES
Specific waste generation sites and potential landfill sites must be specified andthe distances between them must be calculated to make the model operational. SinceMSW is generated wherever people live, there could potentially be as many wastegeneration sites as households. Therefore, it was necessary to develop a method ofattributing waste quantities to a reasonable number of discrete locations. The state wasdivided into wastesheds for two primary reasons. First, transportation costs aredisaggregated with small geographic units. Second, population distribution was handledmore accurately with small geographic units. Costs were more accurate with thecombination of geographic breakdown of population and refined transportation costs.
The 17 urban centers (cities of 2,500 or greater population) were identified asdiscrete waste generation sites. The remainder of the state was divided into 159subcounty wastesheds (Figure 4). The waste generation for each was based on itspopulation (Appendix B). The location of the wastes within each wasteshed was assumedto be a city central to the wasteshed or the city with the largest population.
The number of wastesheds per county ranged from one to eight. Three counties,Billings, Oliver, and Eddy, had one wasteshed because of their small area and/orpopulation (Figure 4). Cass County had the most wastesheds (eight), with two urbancenters plus six other subcounty wastesheds. Waste was identified for Native Americanreservations as requested by the North Dakota State Department of Health andConsolidated Laboratories (Figure 4). The reservations at Fort Berthold (wasteshedG175) and Fort Yates (wastesheds G044, G134, and G136) were assumed to operate theirown landfills. Thus, they disposed of the waste generated on the reservation in areservation landfill. They were not allowed to receive waste from other wastesheds or to
16
igl Wastesheds under Native American jurisdiction 4 City was designated as separate wasteshed
I I Wastesheds under North Dakota government Jurisdiction
Figure 4. North Dakota Waste Generation Sheds.
ship their waste to other landfills. MSW from other Native American reservations wasshipped to regional landfills.
LANDFILL SITES
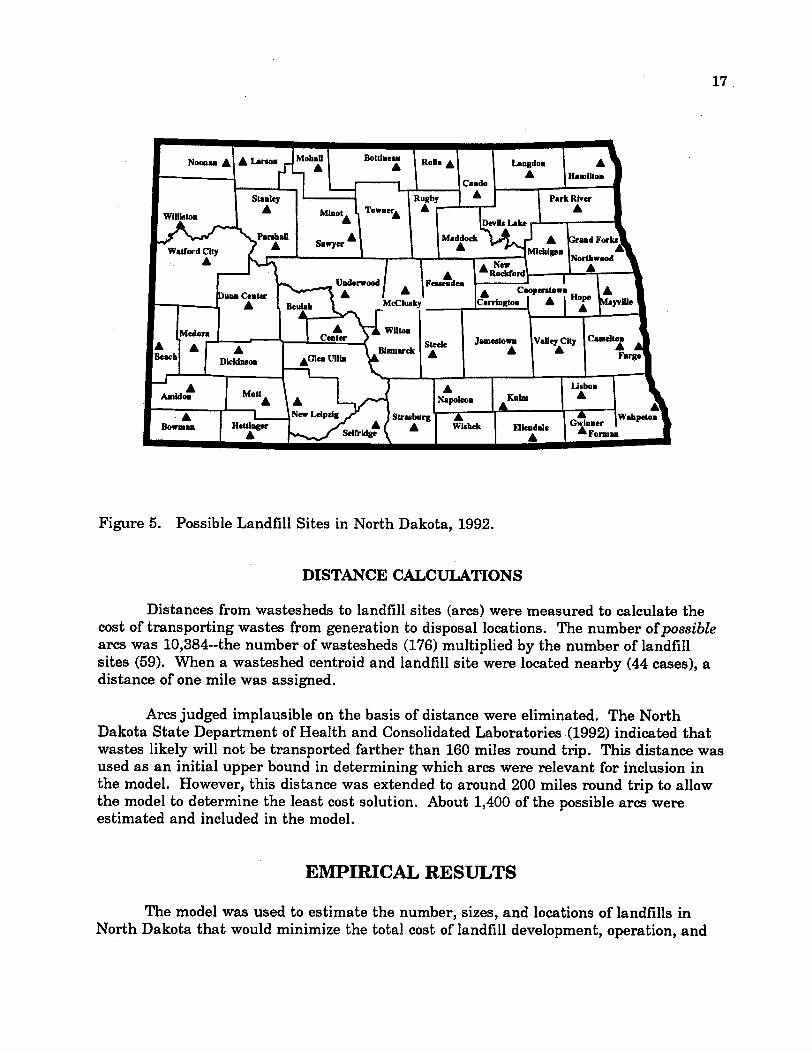
Several criteria were used to select potential landfill sites for the model. At leastone candidate site was selected in each county. This was the baseline scenario cost ofdeveloping a landfill there. All sites with existing landfills receiving wastes wereincluded. If a county did not have a landfill, hypothetical sites were chosen based on twofactors. First, potential sites were chosen near urban centers. Second, sites were locatedadjacent to state or federal highways. Except for existing landfill locations, the landfillsites chosen are for illustrative purposes only. Neither engineering nor public attitudestudies were performed to assess the feasibility of any of the sites. As a result of thisprocess, 59 potential landfill sites were selected (Figure 5).
17
Figure 5. Possible Landfill Sites in North Dakota, 1992.
DISTANCE CALCULATIONS
Distances from wastesheds to landfill sites (arcs) were measured to calculate thecost of transporting wastes from generation to disposal locations. The number of possiblearcs was 10,384--the number of wastesheds (176) multiplied by the number of landfillsites (59). When a wasteshed centroid and landfill site were located nearby (44 cases), adistance of one mile was assigned.
Arcs judged implausible on the basis of distance were eliminated. The NorthDakota State Department of Health and Consolidated Laboratories (1992) indicated thatwastes likely will not be transported farther than 160 miles round trip. This distance wasused as an initial upper bound in determining which arcs were relevant for inclusion inthe model. However, this distance was extended to around 200 miles round trip to allowthe model to determine the least cost solution. About 1,400 of the possible arcs wereestimated and included in the model.
EMPIRICAL RESULTS
The model was used to estimate the number, sizes, and locations of landfills inNorth Dakota that would minimize the total cost of landfill development, operation, and
18
waste transportation, excluding collection costs. Results for each scenario aresummarized. Detailed cost information at the county level is included (Appendix C).
SCENARIO A - BASELINE
An initial scenario with a landfill in each county was specified to provide abenchmark or basis for comparison.3 The initial scenario with a landfill in each countyprobably represents an upper limit with which to compare the costs associated withvarious model solutions. This benchmark case is similar to the current situation (thestate had 50 permitted landfills in 1991).
The landfill size in the initial scenario provided adequate capacity for the annualquantity of wastes generated in the county. In the five counties with two landfill sites,the site nearest the largest city was arbitrarily chosen for the initial scenario. Waste wasnot allowed to cross county lines. Three counties (Burleigh, Grand Forks, and Ward)required 175-TPD landfills, while Cass County needed a 250-TPD facility (Table 7).Thirteen counties had 75-TPD landfills while the other 37 sites had 20-TPD landfills.
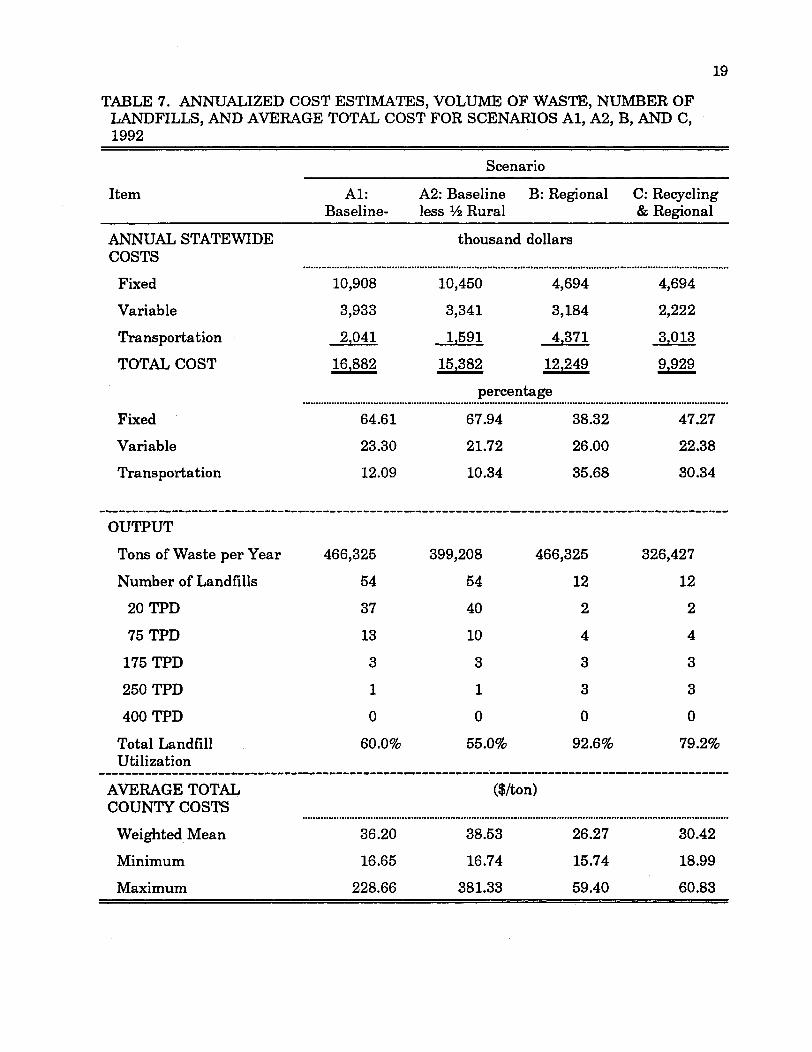
The estimated total annual cost of MSW transportation and disposal for thebaseline scenario was $16.9 million (Table 7). Fixed costs of $10.9 million made up about65 percent of total costs. Variable costs accounted for 23.3 percent of total cost andtransportation costs for 12.1 percent (Table 7).
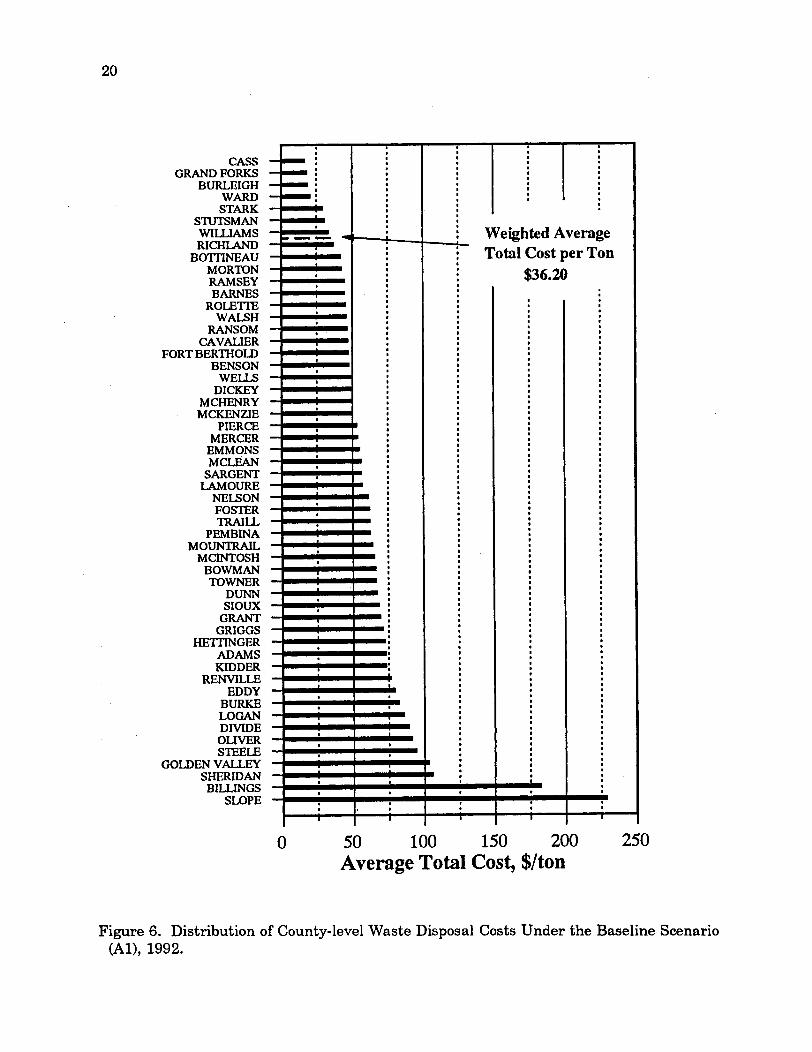
For the baseline scenario, the weighted average total cost (ATC) was $36.20 perton (Table 7). Perhaps more noteworthy than the statewide ATC was the variation incosts among counties (Figure 6). The ATC per ton ranged from $17 in Cass County to$229 in Slope County (Appendix Table C1). Of the state's 53 counties, ATC was greaterthan $50 in 33 counties, while four counties had ATC less than $21 (Appendix Table Cl).Rural counties with small populations had higher costs. The state's four largest urbancenters had lower costs. High ATC for many of the state's less populous counties supportthe need for a regional approach in developing MSW facilities.
A modification of Scenario A was to reduce the assumed waste generation rates forrural residents. Rural residents are defined as those living in or outside of towns with
3The landfill site for the Fort Berthold Reservation was assumed to be at Parshall inMountrail County, although the Fort Berthold Reservation has an existing landfill on thewestern edge of the reservation. Also, waste from all towns within the boundaries of FortBerthold Reservation was assumed to go to the reservation landfill, even though Parshall,and other cities within the reservation may fall under jurisdiction of the North DakotaState Government. Mountrail County was given another site at Stanley for wastegenerated outside the reservation.
By request from the North Dakota State Department of Health and ConsolidatedLaboratories, waste at Fort Berthold and Standing Rock jurisdictions was constrained toonly go to the reservation landfill. Costs at Parshall and Selfridge are constant in allsolutions. Since they do not change, they are not discussed in detail in the otherscenarios.
19
TABLE 7. ANNUALIZED COST ESTIMATES, VOLUME OF WASTE, NUMBER OFLANDFILLS, AND AVERAGE TOTAL COST FOR SCENARIOS Al, A2, B, AND C,1992
Scenario
Item Al: A2: Baseline B: Regional C: RecyclingBaseline- less 2 Rural & Regional
ANNUAL STATEWIDE thousand dollarsCOSTS
Fixed 10,908 10,450 4,694 4,694
Variable 3,933 3,341 3,184 2,222
Transportation 2041 1,591 4371 39013
TOTAL COST 16,882 15382 12249 9929
percentage
Fixed 64.61 67.94 38.32 47.27
Variable 23.30 21.72 26.00 22.38
Transportation 12.09 10.34 35.68 30.34
OUTPUT
Tons of Waste per Year 466,325 399,208 466,325 326,427
Number of Landfills 54 54 12 12
20 TPD 37 40 2 2
75 TPD 13 10 4 4
175 TPD 3 3 3 3
250 TPD 1 1 3 3
400 TPD 0 0 0 0
Total Landfill 60.0% 55.0% 92.6% 79.2%Utilization
AVERAGE TOTAL ($/ton)COUNTY COSTS
Weighted Mean 36.20 38.53 26.27 30.42
Minimum 16.65 16.74 15.74 18.99
Maximum 228.66 381.33 59.40 60.83
CASSGRAND FORKS
BURLEIGHWARDSTARK
STUTSMANWILLIAMSRICHLAND
BOTTINEAUMORTONRAMSEYBARNES
ROLETTEWALSH
RANSOMCAVALIER
FORT BERTHOLDBENSON
WELLSDICKEY
MCHENRYMCKENZIE
PIERCEMERCEREMMONSMCLEAN
SARGENTLAMOURE
NELSONFOSTERTRAILL
PEMBINAMOUNTRAIL
MCINTOSHBOWMANTOWNER
DUNNSIOUX
GRANTGRIGGS
HETTINGERADAMSKIDDER
RENVILLEEDDY
BURKELOGANDIVIDEOLIVERSTEELE
GOLDEN VALLEYSHERIDANBILLINGS
SLOPE
Iii
=**
- )
emI
i
S*
I
I
!
I
1 -
i
! ..m..I
S I
| -
I
I
I
U
U
U
mm-
m
|I
I
i
|
- S
-
I
I
I
i
-s
-S
-S
--i
-g
-S
Weighted AverageTotal Cost per Ton
$36.20
1
i
Ii
iIi
Iii
iii
i-_ I_|r
seo8
s
r
o
|r
rs
I|so|s
|
or|
os|e
Io
o
r
e
o
e
r
o|e
e|
oo|ee
||e
50 100 150 200Average Total Cost, $/ton
Figure 6. Distribution of County-level Waste Disposal Costs(Al), 1992.
Under the Baseline Scenario
20
0 250
1 I.r
-
-
-
II
r
r
I
I
I
I
I
rI
II
I
I
I
I
I
I
I
r
r
OI
I
r
I
I
rr
I
I
|
Iiii
ii
I
ii
ii
II I I
21
less than 75 in population. Less waste was assumed to be collected from rural residentsbecause they dispose of their own waste.
With waste generation rates adjusted for rural residents, the tons of waste in needof disposal in the state fell 14 percent to 399,208 tons per year (Table 7). Total costs fellby $1.5 million to $15.4 million (Table 7). Costs declined for two reasons. First, lesswaste was handled, reducing variable and transportation costs. Second, fixed costsdeclined because three counties (McLean, Pembina, and Traill) built 20-TPD landfillsinstead of 75-TPD landfills (Appendix Tables Cl and C2).
While total cost fell, ATC rose to $38.53 per ton (Table 7). The range also widened,from a minimum of $17 to a maximum of $381 per ton (Table 7). The ATC increasedbecause there was less waste to support the fixed cost of the landfills. ATC rose more incounties with large rural populations because their total volume of waste disposeddecreased more.
SCENARIO B - REGIONALIZATION
In Scenario B, waste was allowed to move across county lines to larger, lower costregional landfills. Some sites also were allowed to choose among different sized landfills.Compared to Scenario A, the solution to Scenario B represents the cost savings fromregionalizing landfills.
The solution to Scenario B was obtained in a piecemeal fashion because thecomputer could not solve the statewide model with multiple sizes at 59 sites.4 Thesolution to Scenario B was obtained by first solving for Regions 5 7 and 8 in southwesternNorth Dakota. Most sites that did not build a landfill in the regional solution wereeliminated as potential sites, thereby reducing the number of integer variables. Anotherregion was then added and the model was solved again, eliminating more sites.
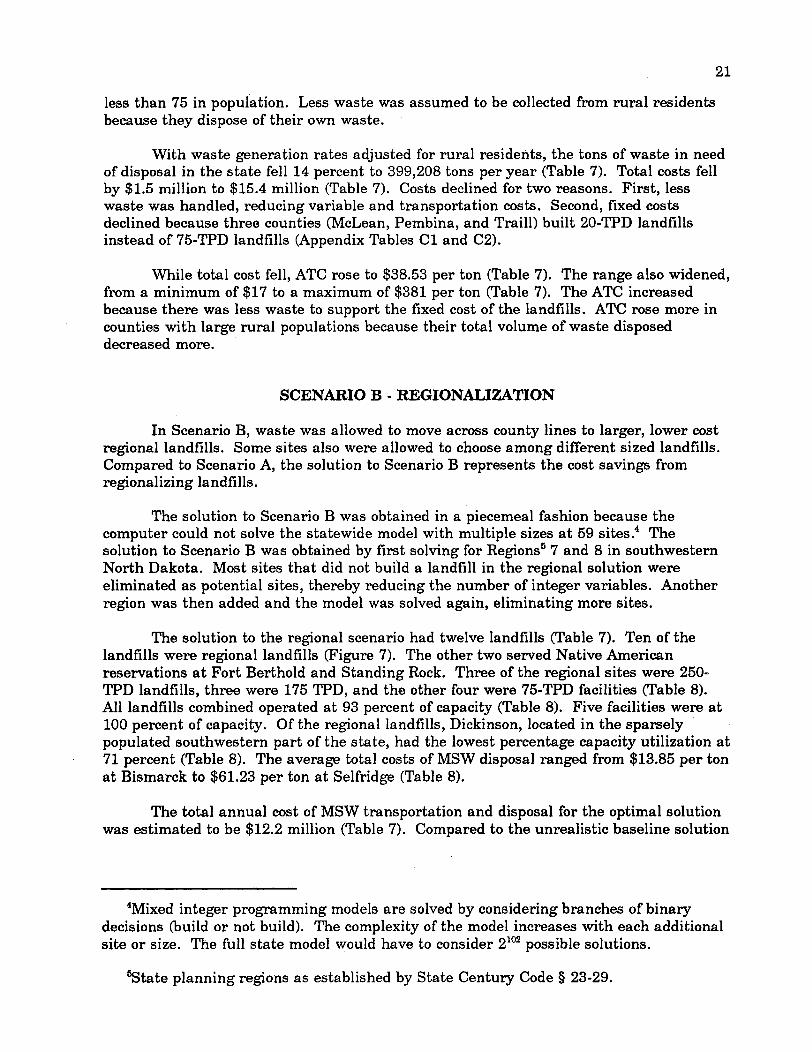
The solution to the regional scenario had twelve landfills (Table 7). Ten of thelandfills were regional landfills (Figure 7). The other two served Native Americanreservations at Fort Berthold and Standing Rock. Three of the regional sites were 250-TPD landfills, three were 175 TPD, and the other four were 75-TPD facilities (Table 8).All landfills combined operated at 93 percent of capacity (Table 8). Five facilities were at100 percent of capacity. Of the regional landfills, Dickinson, located in the sparselypopulated southwestern part of the state, had the lowest percentage capacity utilization at71 percent (Table 8). The average total costs of MSW disposal ranged from $13.85 per tonat Bismarck to $61.23 per ton at Selfridge (Table 8).
The total annual cost of MSW transportation and disposal for the optimal solutionwas estimated to be $12.2 million (Table 7). Compared to the unrealistic baseline solution
4Mixed integer programming models are solved by considering branches of binarydecisions (build or not build). The complexity of the model increases with each additionalsite or size. The full state model would have to consider 2102 possible solutions.
5State planning regions as established by State Century Code § 23-29.
22
Figure 7. Waste Draw Areas and Landfill Locations for Scenario B, 1992.
(i.e., one landfill per county), the total cost of MSW transportation and disposal in theregional solution fell by 27 percent (Table 7).
Total fixed costs fell 57 percent between the baseline and optimal solution to $4.7million (Table 7). Total fixed costs decreased between the two solutions because thenumber of landfills constructed fell from 53 to 12 (Table 7). Variable costs fell 19 percentto $3.2 million. Variable costs per ton were lower at the larger sized landfills.Transportation costs increased substantially (114 percent) to $4.4 million, reflecting theincreased distance when shipping MSW to regional facilities. Fixed costs were lessdominant in terms of total cost, accounting for 38 percent instead of 65 percent (Table 7).
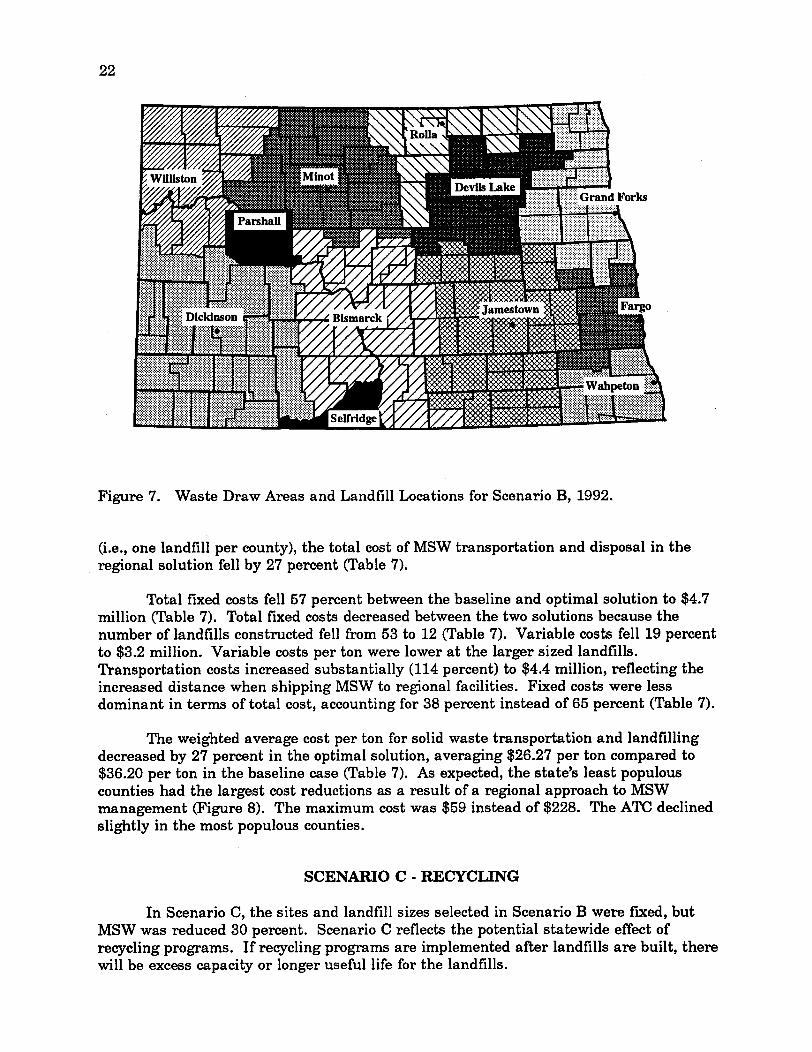
The weighted average cost per ton for solid waste transportation and landfillingdecreased by 27 percent in the optimal solution, averaging $26.27 per ton compared to$36.20 per ton in the baseline case (Table 7). As expected, the state's least populouscounties had the largest cost reductions as a result of a regional approach to MSWmanagement (Figure 8). The maximum cost was $59 instead of $228. The ATC declinedslightly in the most populous counties.
SCENARIO C - RECYCLING
In Scenario C, the sites and landfill sizes selected in Scenario B were fixed, butMSW was reduced 30 percent. Scenario C reflects the potential statewide effect ofrecycling programs. If recycling programs are implemented after landfills are built, therewill be excess capacity or longer useful life for the landfills.

23
TABLE 8. SITES, UTILIZATION, TOTAL AND AVERAGE TOTAL COST ESTIMATESFOR SCENARIO B, 1992
MSW Landfill Capacity Annualized AverageSite Capacity Utilization Total Cost Total Cost
-tons/year- -tons/year- --percent- ---- 000 $---- ---($/ton)---
Bismarck 78,000 78,000 100.0 1,080.7 13.85
Fargo 78,000 78,000 100.0 1,093.1 14.01
Minot 54,600 54,600 100.0 815.2 14.93
Devils Lake 23,400 23,400 100.0 510.5 21.82
Williston 23,400 23,400 100.0 509.5 21.77
Grand Forks 77,648 78,000 99.6 1,089.0 14.02
Rolla 21,221 23,400 90.7 489.1 23.05
Jamestown 45,646 54,600 83.6 755.7 16.56
Wahpeton 19,095 23,400 81.6 475.7 24.91
Dickinson 38,631 54,600 70.8 708.9 18.35
Ft. Berthold 3,938 6,240 63.1 182.5 46.35
Selfridge 2,746 6,240 44.0 168.1 61.23
TOTALS 466,325 503,880 92.6 7,878.0 16.89
Compared to Scenario B, total costs declined by 19 percent to $9.9 million (Table7). Variable and transportation costs both fell because less waste was handled. Fixedcosts remained the same because the landfill sites were fixed. The ATC of landfill costsincreased 16 percent, or $4.15 per ton to $30.42 per ton (Table 7). Other costs alsoincreased because the solution did not consider recycling program costs.
The utilization of landfills fell from 92.6 to 79.2 percent (Table 7). The model wasre-estimated allowing the sites to choose the appropriate size landfill with recycling.Smaller landfills could be built at Dickinson, Grand Forks, Jamestown, and Rolla ifrecycling programs reduce waste 30 percent. In the re-estimated model, the landfill atWahpeton was not built.
SCENARIO D - TRANSSHIPMENT
In Scenario D, waste management complexity increased as transfer stations wereadded. Landfill sites that did not enter the solution in Scenario B were converted topossible transfer stations since transfer links between wastesheds and those sites alreadyexisted. Additional links from transfer stations (unused landfill sites) to regional landfillsites were included. Due to programming complexities and time constraints, all possiblelocations for transfer stations were not addressed. To determine the location and size oftransfer stations throughout the state in a method similar to that employed for landfills
BURLEIGHCASS
GRAND FORKSWARD
STTISMANSTARK
MORTONRAMSEY
WILLIAMSROLETTE
RICHLANDOLIVER
RENVILLETRAILL
BARNESBILLINGS
BENSONFOSTER
LAMOURETOWNER
KIDDERWALSH
MCHENRYDUNN
NELSONMCLEAN
HETTINGEREDDY
MCKENZIEMOUNTRAIL
EMMONSLOGANSTEELE
BOTTINEAUPEMBINA
GRIGGSGOLDEN VALLEY
ADAMSSHERIDAN
RANSOMCAVALIER
PIERCEGRANTDICKEY
MERCERDIVIDESLOPE
FORT BERTHOLDSARGENTBOWMAN
WELLSMCINTOSH
BURKESIOUX
0 10 20 30 40 50 60 70 80Average Total Cost, $/ton
Figure 8. Distribution of County-level Waste Disposal Costs Under Scenario B, 1992.
24
25
was beyond the scope of the study. Thus, the solution to Scenario C should not beinterpreted to mean that transfer stations should be built at these sites, but rather, thattransfer stations might be feasible at these locations. The results from Scenario Dindicate if transfer stations, given current costs and capacities, can generate additionalsavings by transporting waste through transfer facilities rather than shipping directly tolandfills.
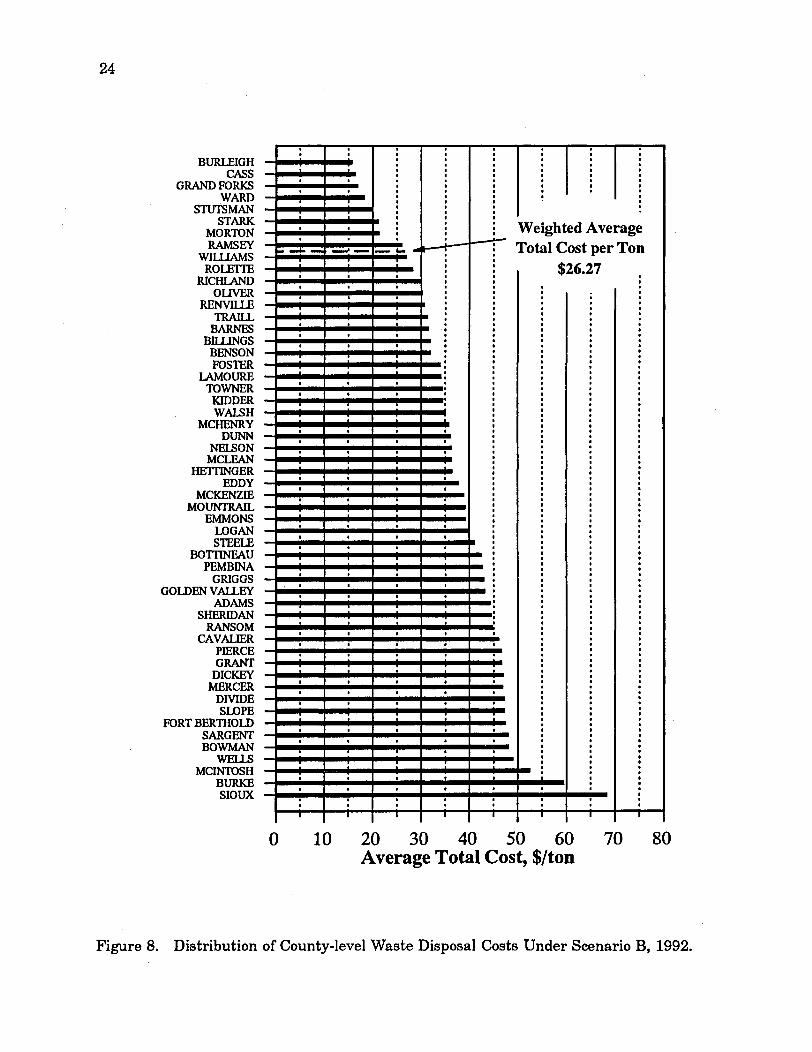
Four different options were considered in Scenario D to test model sensitivity totransfer costs (Table 9). Changing the transfer station operating cost varies the break-even point between shipping direct to a landfill or through a transfer station. With
TABLE 9. ASSUMPTIONS AND VOLUMETRANSSHIPMENT
OF WASTE HANDLED FOR SCENARIO D,
Item Scenario D1 Scenario D2 Scenario D3 Scenario D4
ASSUMPTIONS
Compaction Truck Cost per $0.20 $0.20 $0.20 $0.20Ton-Mile
Semitrailer Cost per Ton- $0.04 $0.04 $0.04 $0.04Mile
Transfer Station Operating $8.00 $12.00 $8.00 $12.00Cost per Ton
Break-even Point (in miles) 50 75 50 75
Transfer Station Capacity 3,744 3,744 5,616 5,616(Tons per year)
WASTE HANDLED
Number of Transfer 15 10 5 3Stations at Capacity
Number of Transfer 16 14 25 20Stations Receiving 2,000TPY to Capacity
Number of Transfer 11 14 11 15Stations Receiving lessthan 2,000 TPY
Number of Transfer 42 38 41 38Stations Handling Waste
Tons of Waste per Year 356,134 372,889 347,645 368,372Hauled Direct to Landfills
Tons of Waste per Year 110,191 93,436 118,680 97,953Transshipped
Total Tons of Waste per 466,325 466,325 466,325 466,325Year
26
compaction truck costs of $0.20 per ton-mile, semi-truck costs of $0.04 per ton-mile, andtransfer station costs of $8 per ton, the break-even point was 50 miles (Scenario Dl). If awasteshed was within 50 miles of the landfill, it was cheaper to ship directly to thelandfill. Wastesheds farther than 50 miles should use transfer stations. Increasing thetransfer station cost to $12 per ton and leaving transportation costs the same increasedthe break-even point to 75 miles (Scenario D2). Scenario D was also solved with two sizesof transfer stations, 12 TPD (Scenarios D1 and D2) and 18 TPD (Scenarios D3 and D4).Unlike the landfill sites, the model did not separately consider the fixed and variable costsof transfer stations.
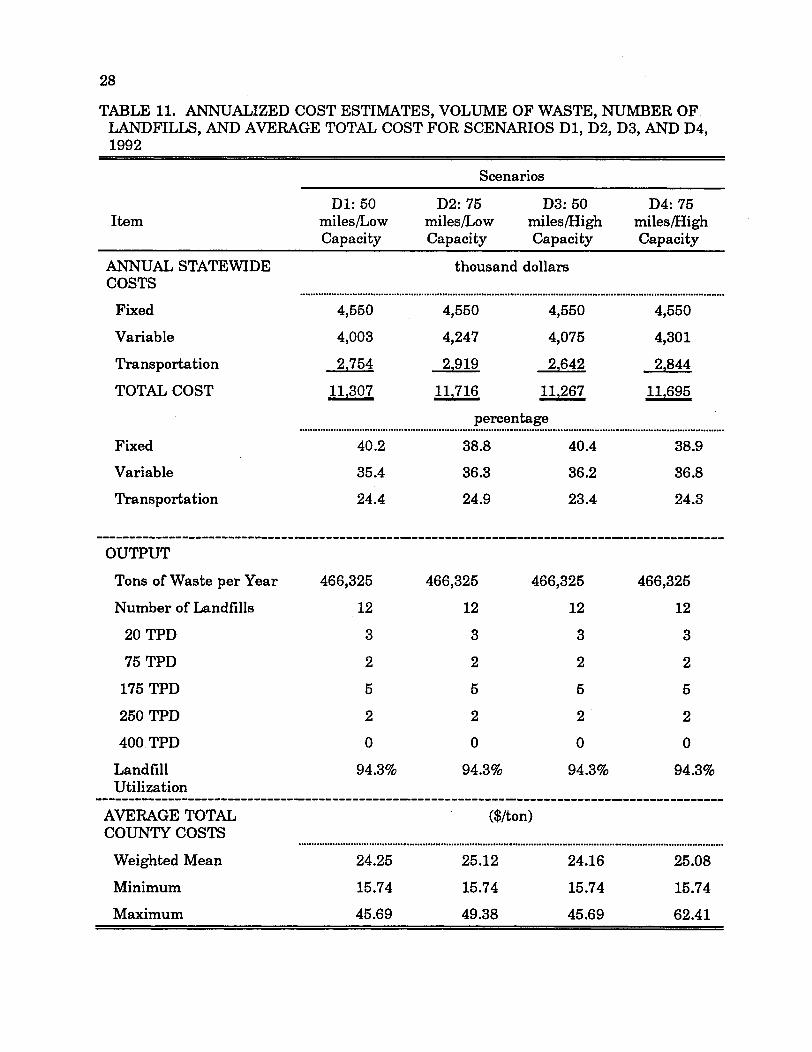
Compared to Scenario B, the number and sites of landfills were the same.However, different sized landfills were built. By adding transfer stations, the landfill atDevils Lake was larger (175 TPD versus 75 TPD), while landfills at Grand Forks (175TPD from 250 TPD) and Rolla (20 TPD from 75 TPD) were smaller (Table 10). Transferstations increased the draw area for some landfills. The solution was quite stable, withthe sizes and sites remaining constant in all four options (Table 11).
In comparison to Scenario B, total costs decreased by 7 percent to $11.3 million(Tables 7 and 11). Fixed costs were less because different sized landfills were built.Variable costs increased 26 percent to $4.0 million because it included the operating costsat transfer stations. Transportation costs decreased 37 percent to $2.8 million becausesome waste was shipped by semitrailers rather than compaction trucks.
In the four options, waste was handled at 38 to 42 of the 47 possible transferstations (Table 9). However, the number of transfer stations operating at capacity waslower, between 3 and 15 (Table 9). On average, 25 percent of the transfer stations shipless than 2,000 TPY or 6 TPD. The amount of waste transshipped was between 20 and 25percent of the total waste.
SCENARIO E - INCINERATOR
Grafton might build a 75- to 100-TPD incinerator 6 (Schock 1992). Park River,which is 22 miles west of Grafton, was the landfill site for Walsh County. Since therewere no transportation links to Grafton, Scenario E was solved assuming the incineratorwas built at Park River rather than Grafton. The model was solved assuming that atleast 75 TPD of MSW must be received at Park River. The incinerator could receive up to175 TPD.
In Scenario E all waste generated and shipped to Park River was assumed to beincinerated. However, some MSW cannot be incinerated and must be buried. Thus, themodel results underestimated the draw area for the incinerator. In addition, issuesrelated to the disposal of incinerator ash were not addressed.
6Secondary cost estimates for building and operating an incinerator were not found.Thus, the incinerator was assumed to have the same fixed and operating costs as alandfill of the same size.

27
TABLE 10. WASTE HANDLED AT LANDFILLS FOR SCENARIOS B, D1, E, F, G,AND H
Scenarios
B: D1: E: F: Fargo, G: H:Regional Transship Grafton Bismarck, Exclude Scenarios
Inciner- McKenzie Ellendale E, F, G,Landfill ator County and
"go alone" Imports
----------- --------------- tons/year ----------------------
Bismarck 78,000 78,000 78,000 4 7 ,0 3 6 s 78,000 47,036s
Devils Lake 23,400 5 4 ,6 0 0L 23,400 23,400 23,400 23,400
Dickinson 38,631 38,415 38,631 43,015 38,631 41,239
Fargo 78,000 78,000 78,000 63,071 78,000 78,000
Grand Forks 77,648 54,600S 54,600s 78,000 77,648 75,039
Jamestown 45,646 54,600 48,386 54,600 43,911 46,208
Minot 54,600 54,600 54,600 54,600 54,600 54,600
Parshall 3,938 3,938 3,938 3,938 3,938 3,938
Rolla 21,221 6,240s 18,129 6,240s 21,221 6,240s
Selfridge 2,746 2,746 2,746 2,746 2,746 2,746
Wahpeton 19,095 17,283 19,095 3 3 ,3 6 4L 19,095 0
Williston 23,400 23,303 23,400 22,655 23,400 22,643
Park River 0 0 23,400 0 0 23,400
Rugby 0 0 0 6,240 0 6,240
Watford City 0 0 0 4,020 0 4,020
Wilton 0 0 0 23,400 0 23,400
Gwinner 0 0 0 0 0 50,301
TOTAL 466,325 466,325 466,325 433,325 464,590 508,450
NOTE: The s means the landfill was a smaller size than in the Scenario B solution, whileLmeans a larger landfill.
The model selected a 75-TPD incinerator at Park River. Compared to Scenario B,the only major difference was that Grand Forks built a 175-TPD landfill rather than a250-TPD landfill (Table 10). All other landfills were the same size and received about thesame volume of MSW as in Scenario B (Table 10).
28
TABLE 11. ANNUALIZED COST ESTIMATES, VOLUME OF WASTE, NUMBER OFLANDFILLS, AND AVERAGE TOTAL COST FOR SCENARIOS Dl, D2, D3, AND D4,1992
Scenarios
Dl: 50 D2: 75 D3: 50 D4: 75Item miles/Low miles/Low miles/High miles/High
Capacity Capacity Capacity Capacity
ANNUAL STATEWIDE thousand dollarsCOSTS
Fixed 4,550 4,550 4,550 4,550
Variable 4,003 4,247 4,075 4,301
Transportation 2754 2919 2,642 2,844
TOTAL COST 11307 11716 11.267 11695
percentage
Fixed 40.2 38.8 40.4 38.9
Variable 35.4 36.3 36.2 36.8
Transportation 24.4 24.9 23.4 24.3
OUTPUT
Tons of Waste per Year 466,325 466,325 466,325 466,325
Number of Landfills 12 12 12 12
20 TPD 3 3 3 3
75 TPD 2 2 2 2
175 TPD 5 5 5 5
250 TPD 2 2 2 2
400 TPD 0 0 0 0
Landfill 94.3% 94.3% 94.3% 94.3%Utilization
AVERAGE TOTAL ($/ton)COUNTY COSTS
Weighted Mean 24.25 25.12 24.16 25.08
Minimum 15.74 15.74 15.74 15.74
Maximum 45.69 49.38 45.69 62.41
29
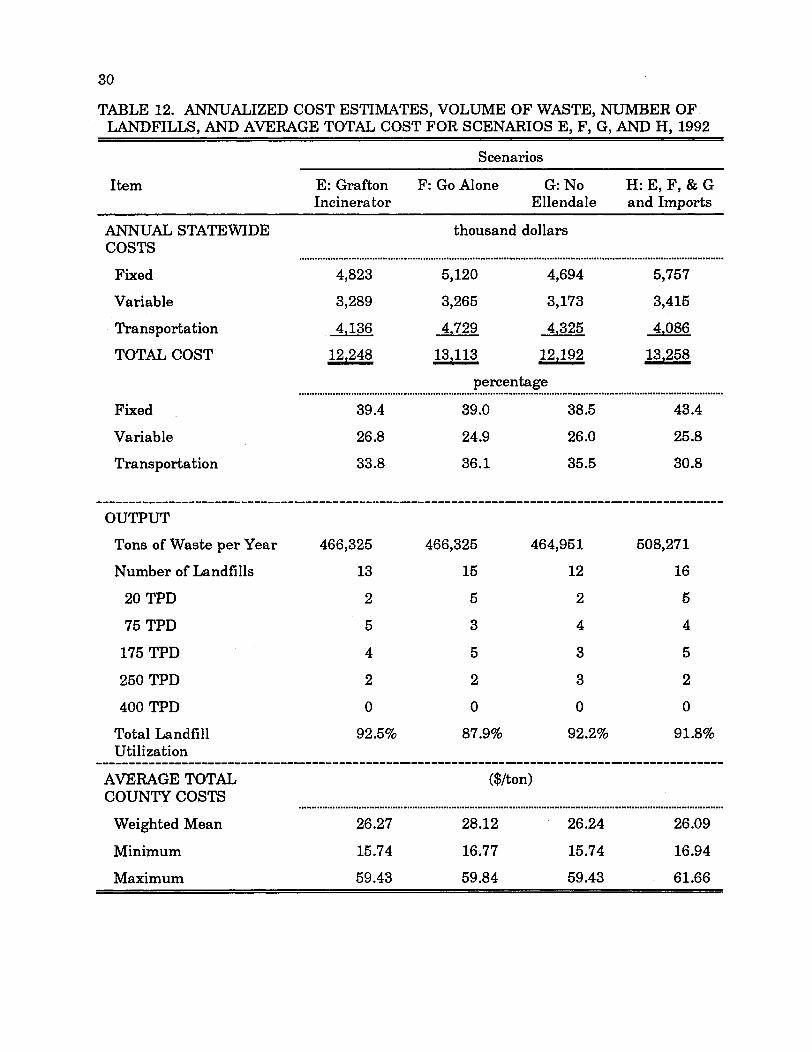
Compared to Scenario B, total costs and ATC were almost identical (Tables 7 and12). The composition of costs was slightly different. Fixed and variable costs weresomewhat higher in Scenario E, primarily because an additional facility was operating.However, an additional facility decreased transportation costs. If ash and unburnedwaste disposal costs were to be included, total costs for this scenario would likely increase.
SCENARIO F - GO ALONE
Rather than participate in regional landfills, some communities might build andoperate their own landfill. In Scenario F, Bismarck-Mandan, Fargo-West Fargo, andMcKenzie County were assumed to only receive waste from their jurisdiction.In the solution to Scenario F, Bismarck built a 175-TPD landfill instead of a 250-TPDlandfill (Table 10). Rolla also built a smaller landfill (20 TPD instead of 75 PD), whileWahpeton built a larger landfill (175 TPD instead of 75 TPD). If the three sites "goalone," the state will open three additional landfills. Rugby and Watford City built 20-TPD landfills and Wilton built a 75-TPD landfill. Wilton receives waste from the areaformerly served by Bismarck. Statewide, the landfill utilization rate dropped to 88percent (Table 12).
A decision to "go-alone" by the three jurisdictions mentioned would increase totalcosts by 7 percent to $13.1 million (Tables 7 and 12). Fixed costs increased 9 percent to$5.1 million because more landfills were built (Table 12). Variable costs increased slightlyto $3.2 million. Transportation costs also increased 8 percent to $4.7 million (Table 12).ATC rose $1.85 per ton to $28.12 per ton (Table 12).
SCENARIO G - NO WASTE FROM ELLENDALE
Ellendale, at the time this study was conducted, shipped its waste to SouthDakota. Scenario G was identical to Scenario B except that the 1,735 tons of waste peryear generated at Ellendale are not included.' The solution was almost identical toScenario B, except Jamestown received less waste (Table 10).
SCENARIO H - COMBINE E, F, AND G AND IMPORTS
The final scenario combines most of the assumptions of Scenarios E, F, and G. Inaddition, out-of-state waste was imported to Fargo, Grand Forks, and Gwinner. Linkswere added requiring a certain level of waste be shipped to particular landfills. Fargowas assumed to receive 10 TPD, Grand Forks receive 20 TPD, and Gwinner receive 40TPD. No trucking cost was assigned to the imported waste since that cost is borne out-of-state. One modification to the Scenario F assumptions was required. Since Fargo couldreceive waste from out-of-state, it also was free to collect MSW from North Dakotawastesheds.
7Ellendale has since contracted to ship its MSW to a landfill in North Dakota, effectivein January 1993.
30
TABLE 12. ANNUALIZED COST ESTIMATES, VOLUME OF WASTE, NUMBER OFLANDFILLS, AND AVERAGE TOTAL COST FOR SCENARIOS E, F, G, AND H, 1992
Scenarios
Item E: Grafton F: Go Alone G: No H: E, F, & GIncinerator Ellendale and Imports
ANNUAL STATEWIDE thousand dollarsCOSTS
Fixed 4,823 5,120 4,694 5,757
Variable 3,289 3,265 3,173 3,415
Transportation 4,136 4.729 4,325 4,086
TOTAL COST 13,13 12,192 13.258
percentage
Fixed 39.4 39.0 38.5 43.4
Variable 26.8 24.9 26.0 25.8
Transportation 33.8 36.1 35.5 30.8
OUTPUT
Tons of Waste per Year 466,325 466,325 464,951 508,271
Number of Landfills 13 15 12 16
20 TPD 2 5 2 5
75 TPD 5 3 4 4
175 TPD 4 5 3 5
250 TPD 2 2 3 2
400 TPD 0 0 0 0
Total Landfill 92.5% 87.9% 92.2% 91.8%Utilization
AVERAGE TOTAL ($/ton)COUNTY COSTS
Weighted Mean 26.27 28.12 26.24 26.09
Minimum 15.74 16.77 15.74 16.94
Maximum 59.43 59.84 59.43 61.66
31
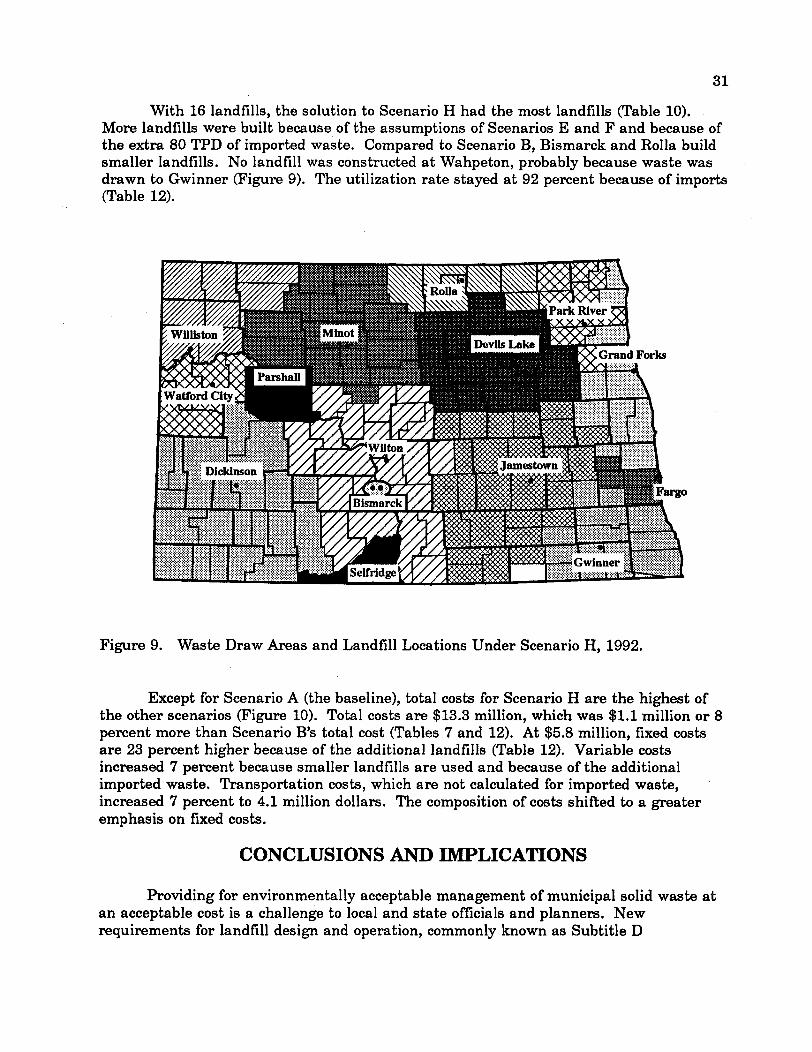
With 16 landfills, the solution to Scenario H had the most landfills (Table 10).More landfills were built because of the assumptions of Scenarios E and F and because ofthe extra 80 TPD of imported waste. Compared to Scenario B, Bismarck and Rolla buildsmaller landfills. No landfill was constructed at Wahpeton, probably because waste wasdrawn to Gwinner (Figure 9). The utilization rate stayed at 92 percent because of imports(Table 12).
Figure 9. Waste Draw Areas and Landfill Locations Under Scenario H, 1992.
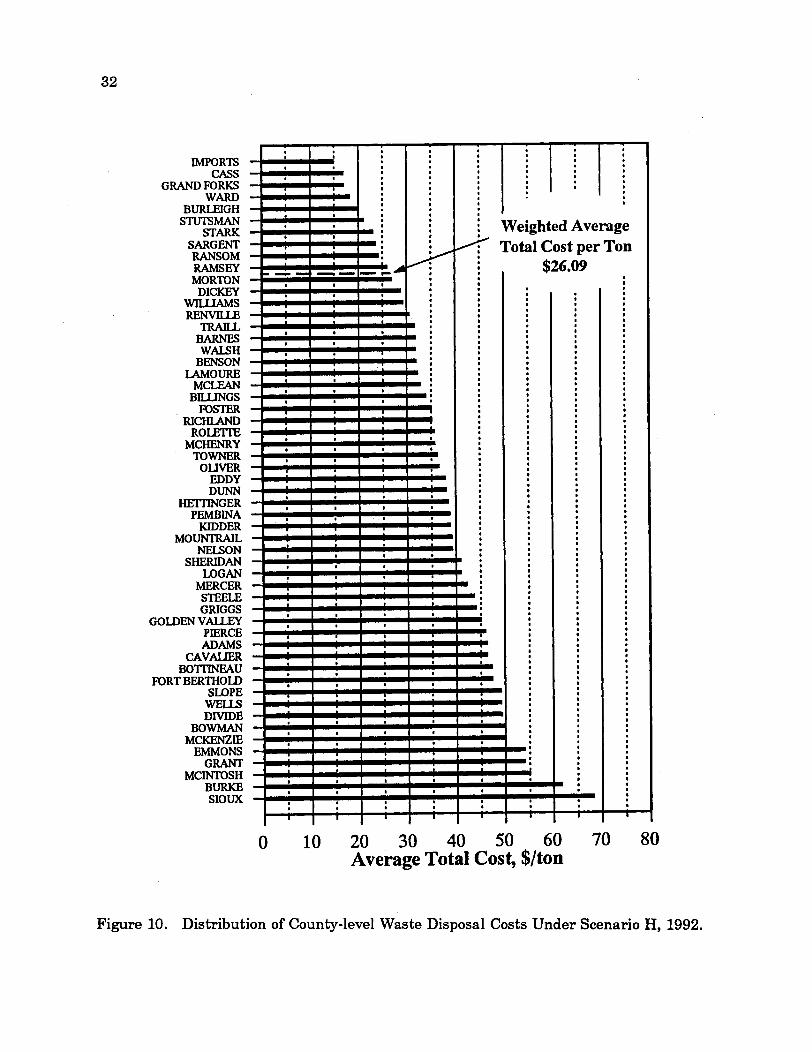
Except for Scenario A (the baseline), total costs for Scenario H are the highest ofthe other scenarios (Figure 10). Total costs are $13.3 million, which was $1.1 million or 8percent more than Scenario B's total cost (Tables 7 and 12). At $5.8 million, fixed costsare 23 percent higher because of the additional landfills (Table 12). Variable costsincreased 7 percent because smaller landfills are used and because of the additionalimported waste. Transportation costs, which are not calculated for imported waste,increased 7 percent to 4.1 million dollars. The composition of costs shifted to a greateremphasis on fixed costs.
CONCLUSIONS AND IMPLICATIONS
Providing for environmentally acceptable management of municipal solid waste atan acceptable cost is a challenge to local and state officials and planners. Newrequirements for landfill design and operation, commonly known as Subtitle D
IMPORTSCASS
GRAND FORKSWARD
BURLEIGHSTUTSMAN
STARKSARGENTRANSOMRAMSEYMORTON
DICKEYWILLIAMSRENVILLE
TRAILLBARNESWALSH
BENSONLAMOURE
MCLEANBILIJNGS
FOSTERRICHLAND
ROLETITEMCHENRY
TOWNEROLIVER
EDDYDUNN
HET'TINGERPEMBINA
KIDDERMOUNTRAIL
NELSONSHERIDAN
LOGANMERCERSTEELEGRIGGS
GOLDEN VALLEYPIERCEADAMS
CAVALIERBO'TINEAU
FORT BERTHOLDSLOPEWELLSDIVIDE
BOWMANMCKENZIE
EMMONSGRANT
MCINTOSHBURKESIOUX
0 10 20 30 40 50 60 70 80Average Total Cost, $/ton
Figure 10. Distribution of County-level Waste Disposal Costs Under Scenario H, 1992.
32
33
regulations, will require most existing facilities to be replaced or extensively redesigned.A major effect of the Subtitle D regulations is to place more emphasis upon economies ofsize in landfill development and operation. Small, community-based landfills will nolonger be economically feasible.
The findings of this study highlight waste disposal costs facing North Dakota'ssmaller communities, particularly those remote from urban centers. If each county wasrequired (or elected) to develop its own landfill facility, MSW disposal costs would be morethan $50 per ton to comply with Subtitle D, in almost half of the state's counties. Thetotal cost was even higher because this model does not include collection expenses. Forthese counties in particular, a considerable economic incentive exists for arriving at anacceptable regional plan for MSW management.
The results of the various models are stable.
* Regardless of the scenario, no 400-TPD landfill was built. North Dakotadoes not appear to have sufficient levels of MSW generated in close proximity which couldallow a 400-TPD landfill to be built. In order to operate a 400-TPD landfill at capacity,waste would have to be shipped from long distances, which generates transportation coststhat more than offset any savings (economies of scale) realized by building and operatinga larger landfill.
* The same size landfill was built in the solutions to Scenarios B - H atDickinson, Fargo, Jamestown, Minot, and Williston.
* If Bismarck-Mandan built a local landfill rather than a regional one, theyshould build a 175 TPD rather than a 250-TPD landfill. However, another landfill willhave to be built in the vicinity.
* Devils Lake increases the size of its landfill with transshipment, drawingwaste from Grand Forks and Rolla.
* The decision of what size of landfill to build at Grand Forks depends ondecisions made at Devils Lake and Grafton.
* A landfill is required at Rolla because there is a concentrated amount ofwaste far from regional landfills.
* In Scenario H, Wahpeton does not build a landfill. The decision to build atWahpeton was contingent on decisions at Fargo and Gwinner.
* If the rural population disposes of their own waste, the total cost of wastedisposal will fall. However, the average total cost per ton will increase because landfillutilization will fall.
* Statewide recycling programs could result in excess landfill capacity. Underthe recycling scenario, total costs decreased, but average costs per ton increased.
34
S Building landfills on the reservations at Fort Berthold and Fort Yates wascostly. The ATC was $47.35 at Fort Berthold and $68.28 per ton at Fort Yates. In
comparison, the ATC in the rest of the state was $26 to $28 per ton.
In summary, the numbers and locations of landfills and disposal costs were stablefrom model to model. However, Scenario H demonstrates that local jurisdiction decisionsaffect regional landfills statewide. Thus, when permitting landfills, the presence of otherlandfills is an important factor.
This analysis was limited to cost tradeoffs between disposal and transportation.Other landfill costs (e.g., externalities, truck traffic, aesthetics, local opinion) were ignoredbecause they are difficult to objectively quantify. Nevertheless, this analysis provides abasis to consider these other issues.
35
REFERENCES
Buell, Deems, Kevin Dietly, Ron Burke, Patricia Robertson, and Sara Rasmussen. 1990."Economic Incentives and Trends for Regionalization of Municipal Solid WasteLandfills." Paper presented at the First U.S. Conference on Municipal Solid WasteManagement, June 13-26, Washington, D.C.
Fischer, William R. 1992. "Minimizing the Cost of Solid Waste Landfilling in NorthDakota." M.S. Thesis, Department of Agricultural Economics, North Dakota StateUniversity, Fargo.
Halbach, Myrna M. 1990. Financial Assurance for Land Disposal Facilities: The NorthDakota Solid Waste Symposium. U.S. Environmental Protection Agency,Bismarck, North Dakota.
Joyce, Leonard E. Jr. 1990. "How to Calculate Waste Disposal Costs." GovernmentFinance Review. August, pp. 20-21, 48.
Lobb, Everett. 1970. Solid Waste in North Dakota. North Dakota State Department ofHealth, Division of Environmental Sanitation and Food Protection, Bismarck,North Dakota.
Minnesota Department of Natural Resources. 1992. "Landfill Cost AnalysisSpreadsheet." St. Paul, MN.
North Dakota Agricultural Statistics Service. 1992. 1992 North Dakota County LevelRents. North Dakota Agricultural Statistics Service and United States Departmentof Agriculture. Fargo.
_ 1991. County Level Rents for Agricultural Land, North Dakota, 1991. NorthDakota Agricultural Statistics Service and United States Department ofAgriculture. Fargo.
. 1990. County Level Rents for Agricultural Land, North Dakota, 1990. NorthDakota Agricultural Statistics Service and United States Department ofAgriculture. Fargo.
North Dakota State Department of Health and Consolidated Laboratories. 1992."Guidelines for Solid Waste Management Planning in North Dakota." Bismarck.
. 1989. "A Proposed Plan for Solid Waste Management in North Dakota."Bismarck, North Dakota.
Schock, Martin R. 1992. Personal communication. North Dakota State Department ofHealth and Consolidated Laboratories. Bismarck.
Schock, Martin R. 1991. "North Dakota's Municipal Waste Situation." In Waste-To-Energy: An Integrated Approach, Proceedings of the Waste-To-Energy Conference,Western Regional Biomass Energy Program, Denver, Colorado, #2.
36
Sebesta, James J. 1989. "Landfill Costs." Unpublished engineering study. OSM &Assoc., Minneapolis, Minnesota.
Tchobanoglous, George, Hilary Theisen, and Rolf Eliassen. 1977. Solid Wastes:Engineering Principles and Management Issues. McGraw-Hill PublishingCompany. New York, New York.
U.S. Bureau of Economic Analysis. Various Years. Survey of Current Business. U.S.Government Printing Office, Washington, D.C.
U.S. Department of Commerce, Economics and Statistics Administration, Bureau of theCensus. 1991. 1990 Census of Population and Housing: Summary Population andHousing Characteristics for North Dakota. U.S. Department of Commerce.Economics and Statistics Administration, Washington, D.C.
U.S. Environmental Protection Agency. 1990b. Characterization of Municipal SolidWaste in the United States: 1990 Update; Executive Summary. GovernmentPrinting Office, Washington, D.C.
. 1989. Decision-Makers Guide To Solid Waste Management. GovernmentPrinting Office, Washington, D.C.
. 1990a. North Dakota Solid Waste Symposium: Rural Solutions for the 1990s.Bismarck, North Dakota.
_ . 1991. "Solid Waste Disposal Criteria; Final Rule." In Federal Register, 40CFR Parts 257 and 258:50978-51119, Washington, D.C.
Walsh, Patrick. 1988. "A Brief Synopsis of EPA'S Proposed Subtitle D LandfillRegulations." Community Dynamics Institute, University of Wisconsin-Madison,Madison.
................................................................ ........ .. ..... ... ... ..... ........ ................................................................................................................................... ................................................ ........ .... ....... ................. ......... ............
.......... ............ ......................................................... ........... ........................................ ........ .-A P P E N D A................................................. . ...........I ., .............................I x ........................................................................ ....... .. ........................................................................................ .. ........................ ......................................................................................... ............................................................................... ... ....................................................... .............................. .. ........................ .......... s .................. .a.:* 08ývv......... . ...... ..... .. i e s ...... -1771............. .......... ................................... ........ .... .... ..... ........ ........ .............................. ....................... ......... ........................ ........ ............. .......................... ............. .......................................... ....... ............................... .......... ................. ................. ...... ........ .............. ..... .................... ... ............................... ................... ............. ................... ........................ ................ ............ .... .......... ..................................................... ................... ...... ....................... ...... .......................... ............. .................................... .................... ....... .. ........ .......... . ........................ ..... ................................ ................................................ ... .. .......... .............. ............................................................. .................................... ........................... .........o' k -t h 'A -: .................. .............. ..................... ........... ................................ .......................... ...... ......................... ....... ..... ..... ........... ...... ................. . .......................... ... ..... .... ....... ................ .................... .................................... .......... .............. .............. .... ........ ............. - ............................. ..................... . ............ ................ ........... ... ............ ......... ......... ........................ ................... . .................. ................... ...... ........................... *.*. ...... ............................. ................. ............ ........................... ................................ ............ ................................................................ .................... ....... ...... ............. ............................... ................. ............ ...... .. ........ ...................... ................... .................. .. .... ................. ... .................. .... ....................................................................... .......... .... ........ .........
............ ............... ..... ............................... ...... ..................................... ....................... ...... .................... .. ....... ............. .. .... ............... ........
.............. ............. .... .. ..... ............................. .......... .......... .........
........ .................... .................... ............................
..................... ...... .............. ........... .................... ............................................................................................. ....... .... .... ... ..... ............... ............................ .. ... ...... ....... ......................
.. ................... ................. .... ....... .............. ...................... ............. ........ ............. ... .......... ... ............... .... ...............
............................... .... ...................... ................................ ......... ........ ..................................................... .........................

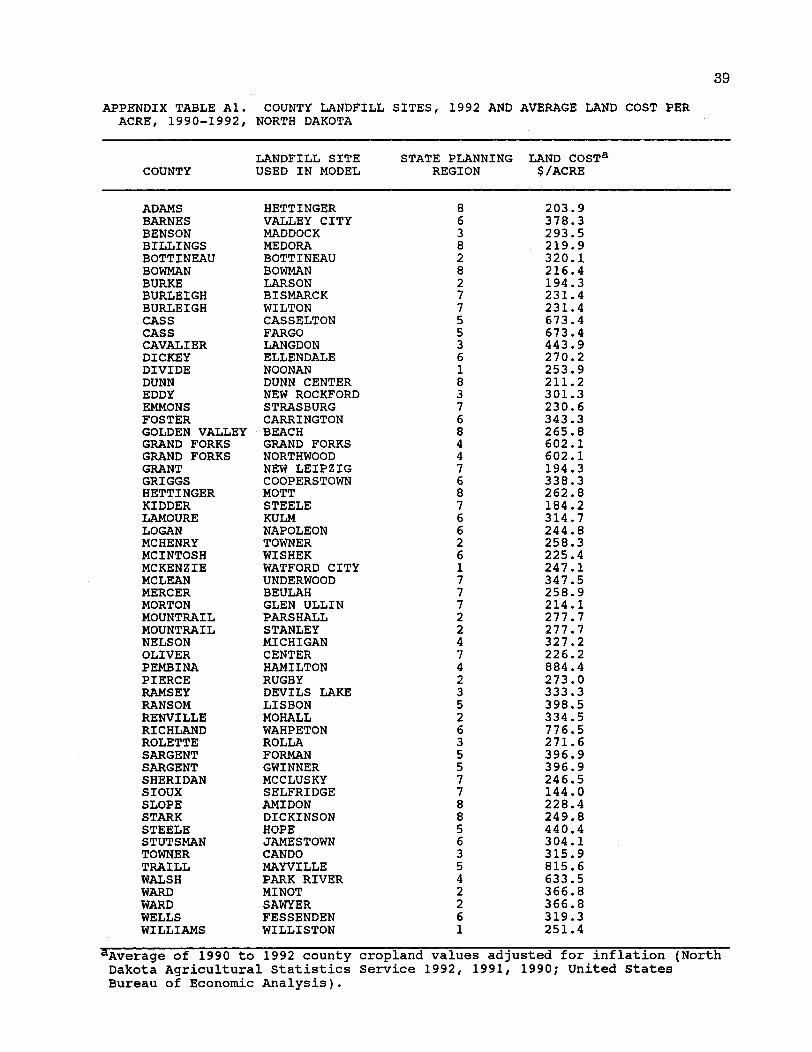
APPENDIX TABLE Al. COUNTY LANDFILLACRE, 1990-1992, NORTH DAKOTA
SITES, 1992 AND AVERAGE LAND COST PER
LANDFILL SITE STATE PLANNING LAND COSTaCOUNTY USED IN MODEL REGION $/ACRE
ADAMSBARNESBENSONBILLINGSBOTTINEAUBOWMANBURKEBURLEIGHBURLEIGHCASSCASSCAVALIERDICKEYDIVIDEDUNNEDDYEMMONSFOSTERGOLDEN VALLEYGRAND FORKSGRAND FORKSGRANTGRIGGSHETTINGERKIDDERLAMOURELOGANMCHENRYMCINTOSHMCKENZIEMCLEANMERCERMORTONMOUNTRAILMOUNTRAILNELSONOLIVERPEMBINAPIERCERAMSEYRANSOMRENVILLERICHLANDROLETTESARGENTSARGENTSHERIDANSIOUXSLOPESTARKSTEELESTUTSMANTOWNERTRAILLWALSHWARDWARDWELLSWILLIAMS
HETTINGERVALLEY CITYMADDOCKMEDORABOTTINEAUBOWMANLARSONBISMARCKWILTONCASSELTONFARGOLANGDONELLENDALENOONANDUNN CENTERNEW ROCKFORDSTRASBURGCARRINGTONBEACHGRAND FORKSNORTHWOODNEW LEIPZIGCOOPERSTOWNMOTTSTEELEKULMNAPOLEONTOWNERWISHEKWATFORD CITYUNDERWOODBEULAHGLEN ULLINPARSHALLSTANLEYMICHIGANCENTERHAMILTONRUGBYDEVILS LAKELISBONMOHALLWAHPETONROLLAFORMANGWINNERMCCLUSKYSELFRIDGEAMIDONDICKINSONHOPEJAMESTOWNCANDOMAYVILLEPARK RIVERMINOTSAWYERFESSENDENWILLISTON
aAverage of 1990 to 1992 countyDakota Agricultural StatisticsBureau of Economic Analysis).
cropland values adjusted for inflation (NorthService 1992, 1991, 1990; United States
39
86382827755361837684476876626177722474235263557788563542261
203.9378.3293.5219.9320.1216.4194.3231.4231.4673.4673.4443.9270.2253.9211.2301.3230.6343.3265.8602.1602.1194.3338.3262.8184.2314.7244.8258.3225.4247.1347.5258.9214.1277.7277.7327.2226.2884.4273.0333.3398.5334.5776.5271.6396.9396.9246.5144.0228.4249.8440.4304.1315.9815.6633.5366.8366.8319.3251.4
- I, c~

APPENDIX

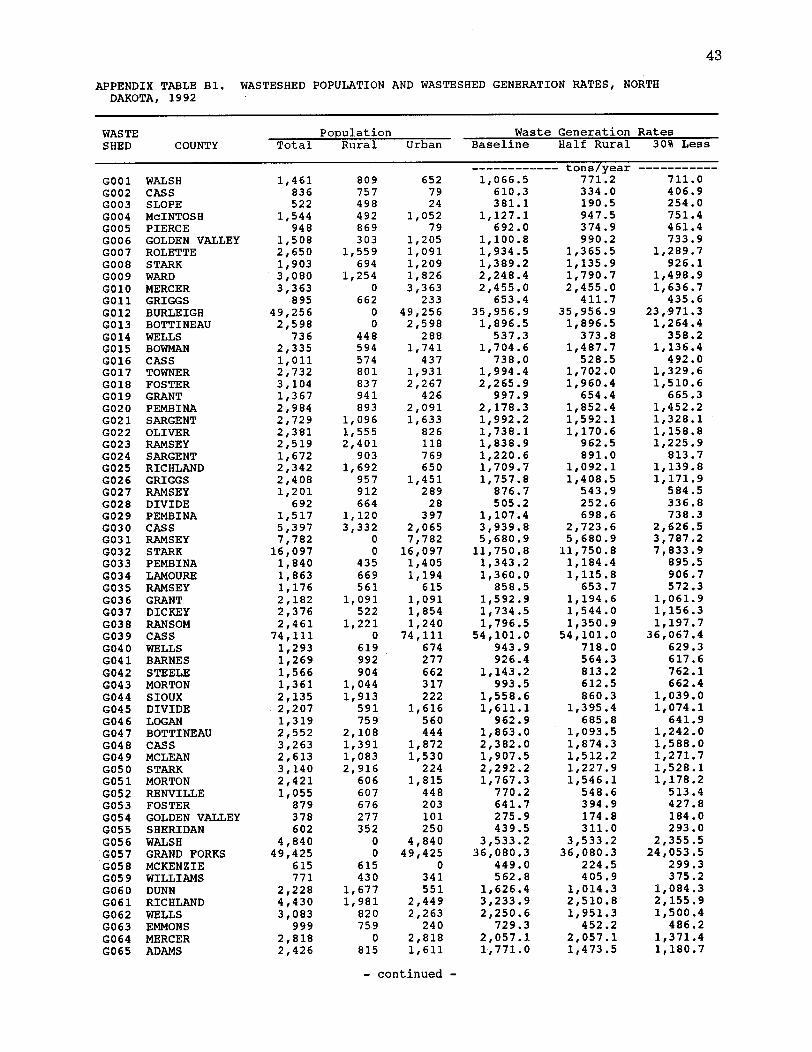
43
APPENDIX TABLE Bl. WASTESHED POPULATION AND WASTESHED GENERATION RATES, NORTHDAKOTA, 1992
WASTE Population Waste Generation RatesSHED COUNTY Total Rural Urban Baseline Half Rural 30% Less
G001G002G003G004G005G006G007G008G009G010G011G012G013GO 14G015G016G017G018G019G020G021G022G023G024G025G026G027G028G029G030G031G032G033G034G035G036G037G038G039G040G041G042G043G044G045G046G047G048G049GO50G051G052G053G054G055G056G057G058G059G060G061G062G063G064G065
WALSHCASSSLOPEMcINTOSHPIERCEGOLDEN VALLEYROLETTESTARKWARDMERCERGRIGGSBURLEIGHBOTTINEAUWELLSBOWMANCASSTOWNERFOSTERGRANTPEMBINASARGENTOLIVERRAMSEYSARGENTRICHLANDGRIGGSRAMSEYDIVIDEPEMBINACASSRAMSEYSTARKPEMBINALAMOURERAMSEYGRANTDICKEYRANSOMCASSWELLSBARNESSTEELEMORTONSIOUXDIVIDELOGANBOTTINEAUCASSMCLEANSTARKMORTONRENVILLEFOSTERGOLDEN VALLEYSHERIDANWALSHGRAND FORKSMCKENZIEWILLIAMSDUNNRICHLANDWELLSEMMONSMERCERADAMS
1,461836522
1,544948
1,5082,6501,9033,0803,363
89549,2562,598
7362,3351,0112,7323,1041,3672,9842,7292,3812,5191,6722,3422,4081,201
6921,5175,3977,78216,0971,8401,8631,1762,1822,3762,46174,1111,2931,2691,5661,3612,1352,2071,3192,5523,2632,6133,1402,4211,055
879378602
4,84049,425
615771
2,2284,4303,083
9992,8182,426
809757498492869303
1,559694
1,2540
66200
448594574801837941893
1,0961,5552,401
9031,692
957912664
1,1203,332
00
435669561
1,091522
1,2210
619992904
1,0441,913
591759
2,1081,3911,0832,916
606607676277352
00
615430
1,6771,981
820759
0815
6527924
1,05279
1,2051,0911,2091,8263,363
23349,2562,598
2881,741
4371,9312,267
4262,0911,633
826118769650
1,45128928
3972,0657,78216,0971,4051,194
6151,0911,8541,24074,111
674277662317222
1,616560444
1,8721,530
2241,815
448203101250
4,84049,425
0341551
2,4492,263
2402,8181,611
1,066.5610.3381.1
1,127.1692.0
1,100.81,934.51,389.22,248.42,455.0
653.435,956.91,896.5
537.31,704.6
738.01,994.42,265.9
997.92,178.31,992.21,738.11,838.91,220.61,709.71,757.8
876.7505.2
1,107.43,939.85,680.911,750.81,343.21,360.0
858.51,592.91,734.51,796.554,101.0
943.9926.4
1,143.2993.5
1,558.61,611.1
962.91,863.02,382.01,907.52,292.21,767.3
770.2641.7275.9439.5
3,533.236,080.3
449.0562.8
1,626.43,233.92,250.6
729.32,057.11,771.0
- continued -
------------ tons/year771.2334.0190.5947.5374.9990.2
1,365.51,135.91,790.72,455.0
411.735,956.91,896.5
373.81,487.7
528.51,702.01,960.4
654.41,852.41,592.11,170.6
962.5891.0
1,092.11,408.5
543.9252.6698.6
2,723.65,680.911,750.81,184.41,115.8
653.71,194.61,544.01,350.9
54,101.0718.0564.3813.2612.5860.3
1,395.4685.8
1,093.51,874.31,512.21,227.91,546.1
548.6394.9174.8311.0
3,533.236,080.3
224.5405.9
1,014.32,510.81,951.3
452.22,057.11,473.5
-----------711.0406.9254.0751.4461.4733.9
1,289.7926.1
1,498.91,636.7
435.623,971.31,264.4358.2
1,136.4492.0
1,329.61,510.6
665.31,452.21,328.11,158.81,225.9
813.71,139.81,171.9
584.5336.8738.3
2,626.53,787.27,833.9
895.5906.7572.3
1,061.91,156.31,197.7
36,067.4629.3617.6762.1662.4
1,039.01,074.1
641.91,242.01,588.01,271.71,528.11,178.2
513.4427.8184.0293.0
2,355.524,053.5
299.3375.2
1,084.32,155.91,500.4
486.21,371.41,180.7
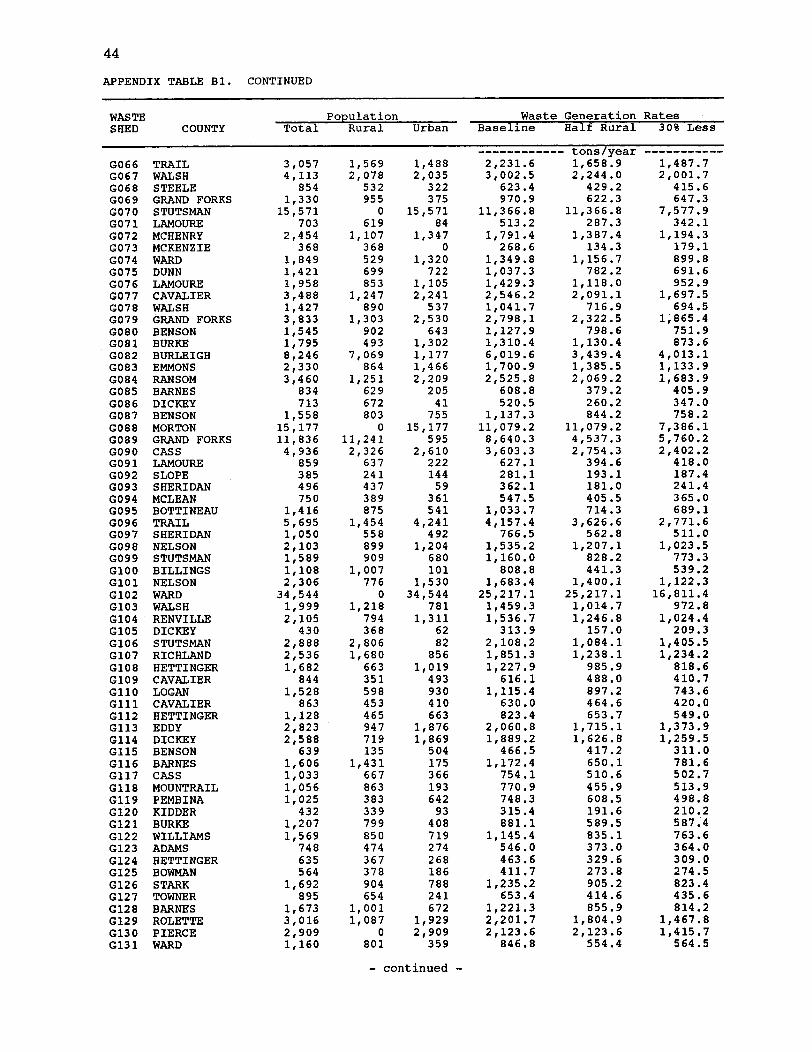
44
APPENDIX TABLE B1. CONTINUED
WASTE Population Waste Generation RatesSHED COUNTY Total Rural Urban Baseline Half Rural 30% Less
---------- tons/year -----------
G066 TRAIL 3,057 1,569 1,488 2,231.6 1,658.9 1,487.7G067 WALSH 4,113 2,078 2,035 3,002.5 2,244.0 2,001.7G068 STEELE 854 532 322 623.4 429.2 415.6G069 GRAND FORKS 1,330 955 375 970.9 622.3 647.3G070 STUTSMAN 15,571 0 15,571 11,366.8 11,366.8 7,577.9G071 LAMOURE 703 619 84 513.2 287.3 342.1G072 MCHENRY 2,454 1,107 1,347 1,791.4 1,387.4 1,194.3G073 MCKENZIE 368 368 0 268.6 134.3 179.1G074 WARD 1,849 529 1,320 1,349.8 1,156.7 899.8G075 DUNN 1,421 699 722 1,037.3 782.2 691.6G076 LAMOURE 1,958 853 1,105 1,429.3 1,118.0 952.9G077 CAVALIER 3,488 1,247 2,241 2,546.2 2,091.1 1,697.5G078 WALSH 1,427 890 537 1,041.7 716.9 694.5G079 GRAND FORKS 3,833 1,303 2,530 2,798.1 2,322.5 1,865.4G080 BENSON 1,545 902 643 1,127.9 798.6 751.9G081 BURKE 1,795 493 1,302 1,310.4 1,130.4 873.6G082 BURLEIGH 8,246 7,069 1,177 6,019.6 3,439.4 4,013.1G083 EMMONS 2,330 864 1,466 1,700.9 1,385.5 1,133.9G084 RANSOM 3,460 1,251 2,209 2,525.8 2,069.2 1,683.9G085 BARNES 834 629 205 608.8 379.2 405.9G086 DICKEY 713 672 41 520.5 260.2 347.0G087 BENSON 1,558 803 755 1,137.3 844.2 758.2G088 MORTON 15,177 0 15,177 11,079.2 11,079.2 7,386.1G089 GRAND FORKS 11,836 11,241 595 8,640.3 4,537.3 5,760.2G090 CASS 4,936 2,326 2,610 3,603.3 2,754.3 2,402.2G091 LAMOURE 859 637 222 627.1 394.6 418.0G092 SLOPE 385 241 144 281.1 193.1 187.4G093 SHERIDAN 496 437 59 362.1 181.0 241.4G094 MCLEAN 750 389 361 547.5 405.5 365.0G095 BOTTINEAU 1,416 875 541 1,033.7 714.3 689.1G096 TRAIL 5,695 1,454 4,241 4,157.4 3,626.6 2,771.6G097 SHERIDAN 1,050 558 492 766.5 562.8 511.0G098 NELSON 2,103 899 1,204 1,535.2 1,207.1 1,023.5G099 STUTSMAN 1,589 909 680 1,160.0 828.2 773.3G100 BILLINGS 1,108 1,007 101 808.8 441.3 539.2G101 NELSON 2,306 776 1,530 1,683.4 1,400.1 1,122.3G102 WARD 34,544 0 34,544 25,217.1 25,217.1 16,811.4G103 WALSH 1,999 1,218 781 1,459.3 1,014.7 972.8G104 RENVILLE 2,105 794 1,311 1,536.7 1,246.8 1,024.4G105 DICKEY 430 368 62 313.9 157.0 209.3G106 STUTSMAN 2,888 2,806 82 2,108.2 1,084.1 1,405.5G107 RICHLAND 2,536 1,680 856 1,851.3 1,238.1 1,234.2G108 HETTINGER 1,682 663 1,019 1,227.9 985.9 818.6G109 CAVALIER 844 351 493 616.1 488.0 410.7G110 LOGAN 1,528 598 930 1,115.4 897.2 743.6G111 CAVALIER 863 453 410 630.0 464.6 420.0G112 HETTINGER 1,128 465 663 823.4 653.7 549.0G113 EDDY 2,823 947 1,876 2,060.8 1,715.1 1,373.9G114 DICKEY 2,588 719 1,869 1,889.2 1,626.8 1,259.5G115 BENSON 639 135 504 466.5 417.2 311.0G116 BARNES 1,606 1,431 175 1,172.4 650.1 781.6G117 CASS 1,033 667 366 754.1 510.6 502.70118 MOUNTRAIL 1,056 863 193 770.9 455.9 513.90119 PEMBINA 1,025 383 642 748.3 608.5 498.8G120 KIDDER 432 339 93 315.4 191.6 210.20121 BURKE 1,207 799 408 881.1 589.5 587.40122 WILLIAMS 1,569 850 719 1,145.4 835.1 763.6G123 ADAMS 748 474 274 546.0 373.0 364.00124 HETTINGER 635 367 268 463.6 329.6 309.00125 BOWMAN 564 378 186 411.7 273.8 274.50126 STARK 1,692 904 788 1,235.2 905.2 823.40127 TOWNER 895 654 241 653.4 414.6 435.60128 BARNES 1,673 1,001 672 1,221.3 855.9 814.20129 ROLETTE 3,016 1,087 1,929 2,201.7 1,804.9 1,467.80130 PIERCE 2,909 0 2,909 2,123.6 2,123.6 1,415.7G131 WARD 1,160 801 359 846.8 554.4 564.5
- continued -
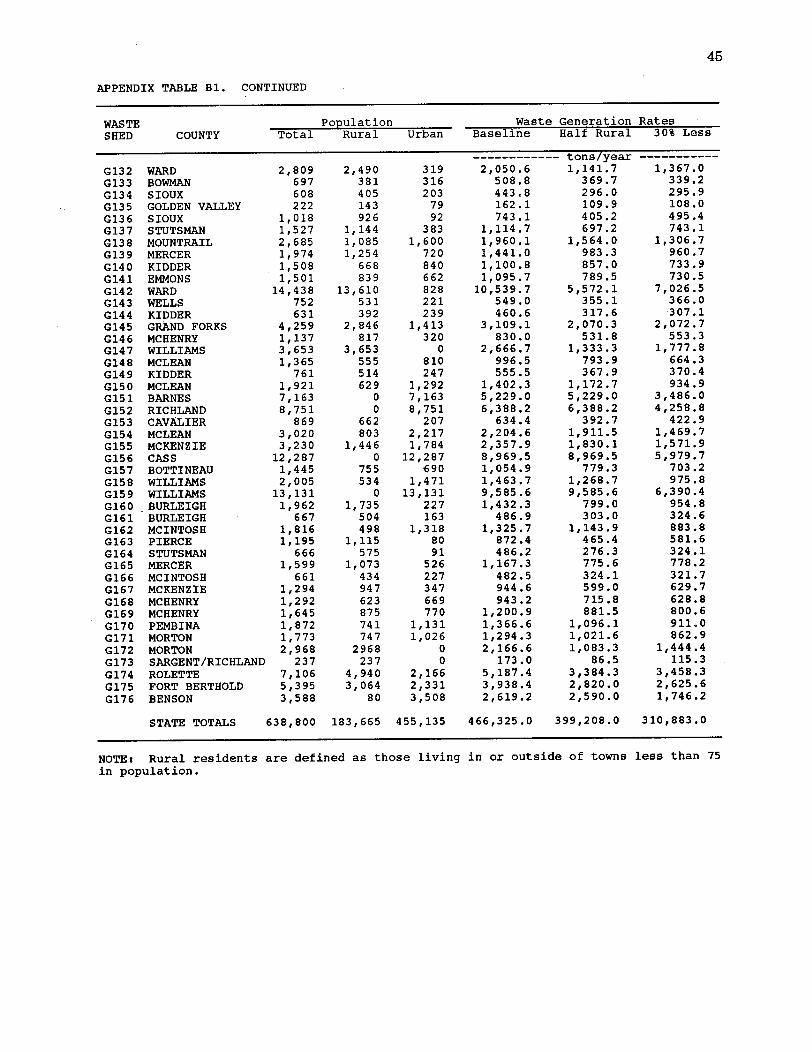
45
APPENDIX TABLE B1. CONTINUED
WASTE Population Waste Generation RatesSHED COUNTY Total Rural Urban Baseline Half Rural 30% Less
G132G133G134G135G136G137G138G139G140G141G142G143G144G145G146G147G148G149G150G151G152G153G154G155G156G157G158G159G160G161G162G163G164G165G166G167G168G169G170G171G172G173G174G175G176
WARDBOWMANSIOUXGOLDEN VALLEYSIOUXSTUTSMANMOUNTRAILMERCERKIDDEREMMONSWARDWELLSKIDDERGRAND FORKSMCHENRYWILLIAMSMCLEANKIDDERMCLEANBARNESRICHLANDCAVALIERMCLEANMCKENZIECASSBOTTINEAUWILLIAMSWILLIAMSBURLEIGHBURLEIGHMCINTOSHPIERCESTUTSMANMERCERMCINTOSHMCKENZIEMCHENRYMCHENRYPEMBINAMORTONMORTONSARGENT/RICHLANDROLETTEFORT BERTHOLDBENSON
2,809697608222
1,0181,5272,6851,9741,5081,50114,438
752631
4,2591,1373,6531,365
7611,9217,1638,751
8693,0203,230
12,2871,4452,00513,1311,962
6671,8161,195
6661,599
6611,2941,2921,6451,8721,7732,968
2377,1065,3953,588
2,490381405143926
1,1441,0851,254
668839
13,610531392
2,846817
3,653555514629
00
662803
1,4460
755534
01,735
504498
1,115575
1,073434947623875741747
2968237
4,9403,064
80
3193162037992
3831,600
720840662828221239
1,413320
0810247
1,2927,1638,751
2072,2171,78412,287
6901,47113,131
227163
1,3188091
526227347669770
1,1311,026
00
2,1662,3313,508
2,050.6508.8443.8162.1743.1
1,114.71,960.11,441.01,100.81,095.710,539.7
549.0460.6
3,109.1830.0
2,666.7996.5555.5
1,402.35,229.06,388.2
634.42,204.62,357.98,969.51,054.91,463.79,585.61,432.3
486.91,325.7
872.4486.2
1,167.3482.5944.6943.2
1,200.91,366.61,294.32,166.6
173.05,187.43,938.42,619.2
STATE TOTALS 638,800 183,665 455,135 466,325.0 399,208.0 310,883.0
NOTE: Rural residents are defined as those livingin population.
in or outside of towns less than 75
tons/year1,141.7
369.7296.0109.9405.2697.2
1,564.0983.3857.0789.5
5,572.1355.1317.6
2,070.3531.8
1,333.3793.9367.9
1,172.75,229.06,388.2
392.71,911.51,830.18,969.5
779.31,268.79,585.6
799.0303.0
1,143.9465.4276.3775.6324.1599.0715.8881.5
1,096.11,021.61,083.3
86.53,384.32,820.02,590.0
-----------1,367.0339.2295.9108.0495.4743.1
1,306.7960.7733.9730.5
7,026.5366.0307.1
2,072.7553.3
1,777.8664.3370.4934.9
3,486.04,258.8
422.91,469.71,571.95,979.7
703.2975.8
6,390.4954.8324.6883.8581.6324.1778.2321.7629.7628.8800.6911.0862.9
1,444.4115.3
3,458.32,625.61,746.2


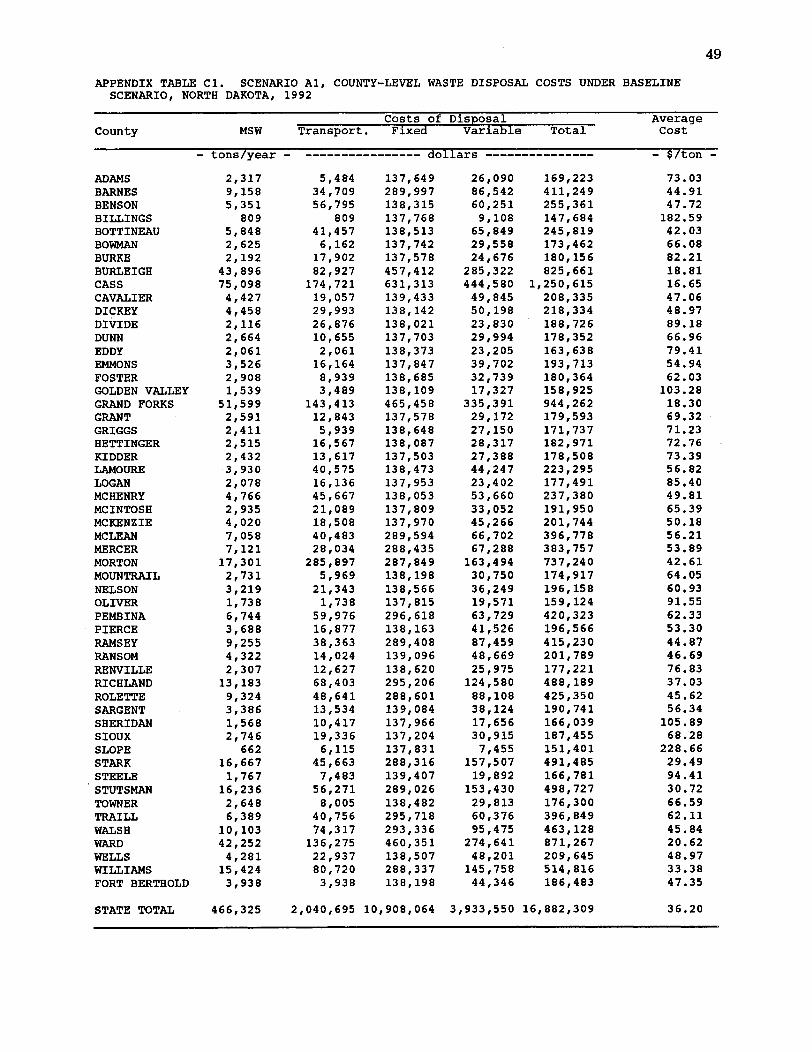
49
APPENDIX TABLE Cl. SCENARIO Al, COUNTY-LEVEL WASTE DISPOSAL COSTS UNDER BASELINESCENARIO, NORTH DAKOTA, 1992
Costs of Disposal AverageCounty MSW Transport. Fixed Variable Total Cost
- tons/year - -------------- dollars ------------ -- - $/ton -
ADAMSBARNESBENSONBILLINGSBOTTINEAUBOWMANBURKEBURLEIGHCASSCAVALIERDICKEYDIVIDEDUNNEDDYEMMONSFOSTERGOLDEN VALLEYGRAND FORKSGRANTGRIGGSHETTINGERKIDDERLAMOURELOGANMCHENRYMCINTOSHMCKENZIEMCLEANMERCERMORTONMOUNTRAILNELSONOLIVERPEMBINAPIERCERAMSEYRANSOMRENVILLERICHLANDROLETTESARGENTSHERIDANSIOUXSLOPESTARKSTEELESTUTSMANTOWNERTRAILLWALSHWARDWELLSWILLIAMSFORT BERTHOLD
STATE TOTAL
2,3179,1585,351
8095,8482,6252,192
43,89675,0984,4274,4582,1162,6642,0613,5262,9081,539
51,5992,5912,4112,5152,4323,9302,0784,7662,9354,0207,0587,12117,3012,7313,2191,7386,7443,6889,2554,3222,30713,1839,3243,3861,5682,746
66216,6671,76716,2362,6486,38910,10342,2524,28115,4243,938
5,48434,70956,795
80941,4576,162
17,90282,927
174,72119,05729,99326,87610,6552,06116,1648,9393,489
143,41312,8435,93916,56713,61740,57516,13645,66721,08918,50840,48328,034285,897
5,96921,3431,73859,97616,87738,36314,02412,62768,40348,64113,53410,41719,3366,115
45,6637,48356,2718,005
40,75674,317
136,27522,93780,7203,938
137,649289,997138,315137,768138,513137,742137,578457,412631,313139,433138,142138,021137,703138,373137,847138,685138,109465,458137,578138,648138,087137,503138,473137,953138,053137,809137,970289,594288,435287,849138,198138,566137,815296,618138,163289,408139,096138,620295,206288,601139,084137,966137,204137,831288,316139,407289,026138,482295,718293,336460,351138,507288,337138,198
26,09086,54260,2519,10865,84929,55824,676285,322444,58049,84550,19823,83029,99423,20539,70232,73917,327
335,39129,17227,15028,31727,38844,24723,40253,66033,05245,26666,70267,288
163,49430,75036,24919,57163,72941,52687,45948,66925,975124,58088,10838,12417,65630,9157,455
157,50719,892153,43029,81360,37695,475
274,64148,201145,75844,346
169,223411,249255,361147,684245,819173,462180,156825,661
1,250,615208,335218,334188,726178,352163,638193,713180,364158,925944,262179,593171,737182,971178,508223,295177,491237,380191,950201,744396,778383,757737,240174,917196,158159,124420,323196,566415,230201,789177,221488,189425,350190,741166,039187,455151,401491,485166,781498,727176,300396,849463,128871,267209,645514,816186,483
466,325 2,040,695 10,908,064 3,933,550 16,882,309
73.0344.9147.72182.5942.0366.0882.2118.8116.6547.0648.9789.1866.9679.4154.9462.03
103.2818.3069.3271.2372.7673.3956.8285.4049.8165.3950.1856.2153.8942.6164.0560.9391.5562.3353.3044.8746.6976.8337.0345.6256.34105.8968.28228.6629.4994.4130.7266.5962.1145.8420.6248.9733.3847.35
36.20
,, II
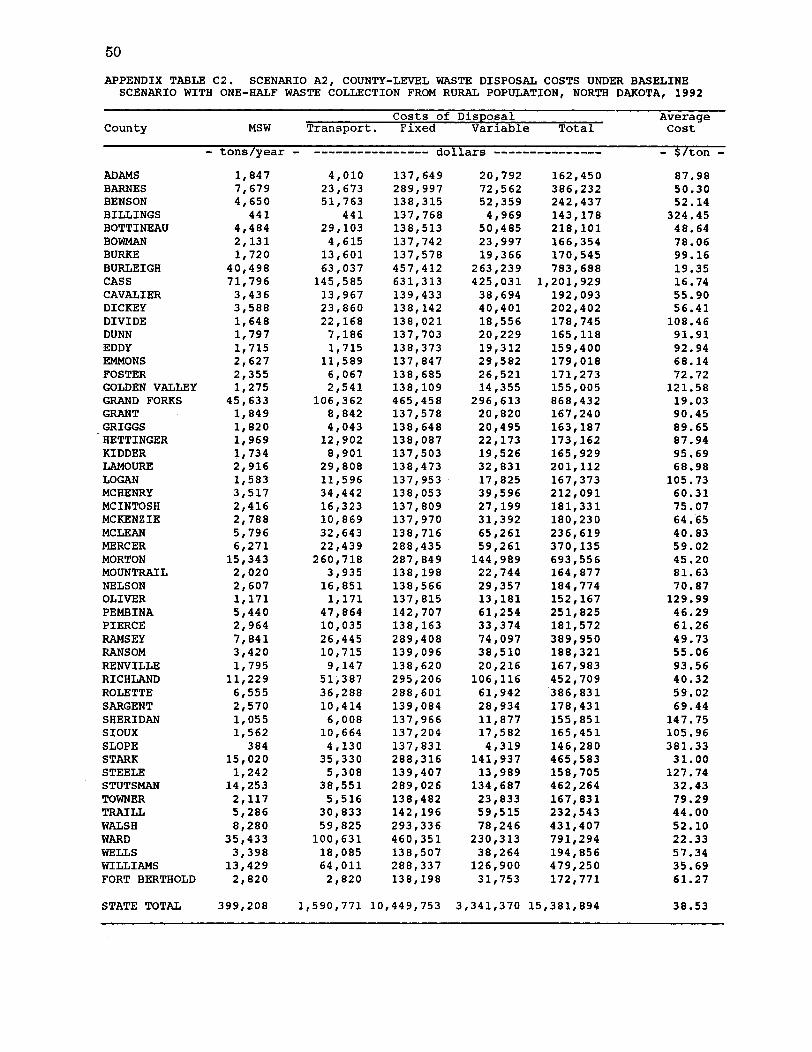
50
APPENDIX TABLE C2. SCENARIO A2, COUNTY-LEVEL WASTE DISPOSAL COSTS UNDER BASELINESCENARIO WITH ONE-HALF WASTE COLLECTION FROM RURAL POPULATION, NORTH DAKOTA, 1992
Costs of Disposal AverageCounty MSW Transport. Fixed Variable Total Cost
- tons/year - ------------- dollars ------------- - $/ton -
ADAMS 1,847 4,010 137,649 20,792 162,450 87.98BARNES 7,679 23,673 289,997 72,562 386,232 50.30BENSON 4,650 51,763 138,315 52,359 242,437 52.14BILLINGS 441 441 137,768 4,969 143,178 324.45BOTTINEAU 4,484 29,103 138,513 50,485 218,101 48.64BOWMAN 2,131 4,615 137,742 23,997 166,354 78.06BURKE 1,720 13,601 137,578 19,366 170,545 99.16BURLEIGH 40,498 63,037 457,412 263,239 783,688 19.35CASS 71,796 145,585 631,313 425,031 1,201,929 16.74CAVALIER 3,436 13,967 139,433 38,694 192,093 55.90DICKEY 3,588 23,860 138,142 40,401 202,402 56.41DIVIDE 1,648 22,168 138,021 18,556 178,745 108.46DUNN 1,797 7,186 137,703 20,229 165,118 91.91EDDY 1,715 1,715 138,373 19,312 159,400 92.94EMMONS 2,627 11,589 137,847 29,582 179,018 68.14FOSTER 2,355 6,067 138,685 26,521 171,273 72.72GOLDEN VALLEY 1,275 2,541 138,109 14,355 155,005 121.58GRAND FORKS 45,633 106,362 465,458 296,613 868,432 19.03GRANT 1,849 8,842 137,578 20,820 167,240 90.45GRIGGS 1,820 4,043 138,648 20,495 163,187 89.65HETTINGER 1,969 12,902 138,087 22,173 173,162 87.94KIDDER 1,734 8,901 137,503 19,526 165,929 95.69LAMOURE 2,916 29,808 138,473 32,831 201,112 68.98LOGAN 1,583 11,596 137,953 17,825 167,373 105.73MCHENRY 3,517 34,442 138,053 39,596 212,091 60.31MCINTOSH 2,416 16,323 137,809 27,199 181,331 75.07MCKENZIE 2,788 10,869 137,970 31,392 180,230 64.65MCLEAN 5,796 32,643 138,716 65,261 236,619 40.83MERCER 6,271 22,439 288,435 59,261 370,135 59.02MORTON 15,343 260,718 287,849 144,989 693,556 45.20MOUNTRAIL 2,020 3,935 138,198 22,744 164,877 81.63NELSON 2,607 16,851 138,566 29,357 184,774 70.87OLIVER 1,171 1,171 137,815 13,181 152,167 129.99PEMBINA 5,440 47,864 142,707 61,254 251,825 46.29PIERCE 2,964 10,035 138,163 33,374 181,572 61.26RAMSEY 7,841 26,445 289,408 74,097 389,950 49.73RANSOM 3,420 10,715 139,096 38,510 188,321 55.06RENVILLE 1,795 9,147 138,620 20,216 167,983 93.56RICHLAND 11,229 51,387 295,206 106,116 452,709 40.32ROLETTE 6,555 36,288 288,601 61,942 386,831 59.02SARGENT 2,570 10,414 139,084 28,934 178,431 69.44SHERIDAN 1,055 6,008 137,966 11,877 155,851 147.75SIOUX 1,562 10,664 137,204 17,582 165,451 105.96SLOPE 384 4,130 137,831 4,319 146,280 381.33STARK 15,020 35,330 288,316 141,937 465,583 31.00STEELE 1,242 5,308 139,407 13,989 158,705 127.74STUTSMAN 14,253 38,551 289,026 134,687 462,264 32.43TOWNER 2,117 5,516 138,482 23,833 167,831 79.29TRAILL 5,286 30,833 142,196 59,515 232,543 44.00WALSH 8,280 59,825 293,336 78,246 431,407 52.10WARD 35,433 100,631 460,351 230,313 791,294 22.33WELLS 3,398 18,085 138,507 38,264 194,856 57.34WILLIAMS 13,429 64,011 288,337 126,900 479,250 35.69FORT BERTHOLD 2,820 2,820 138,198 31,753 172,771 61.27
399,208 1,590,771 10,449,753 3,341,370 15,381,894STATE TOTAL 38.53
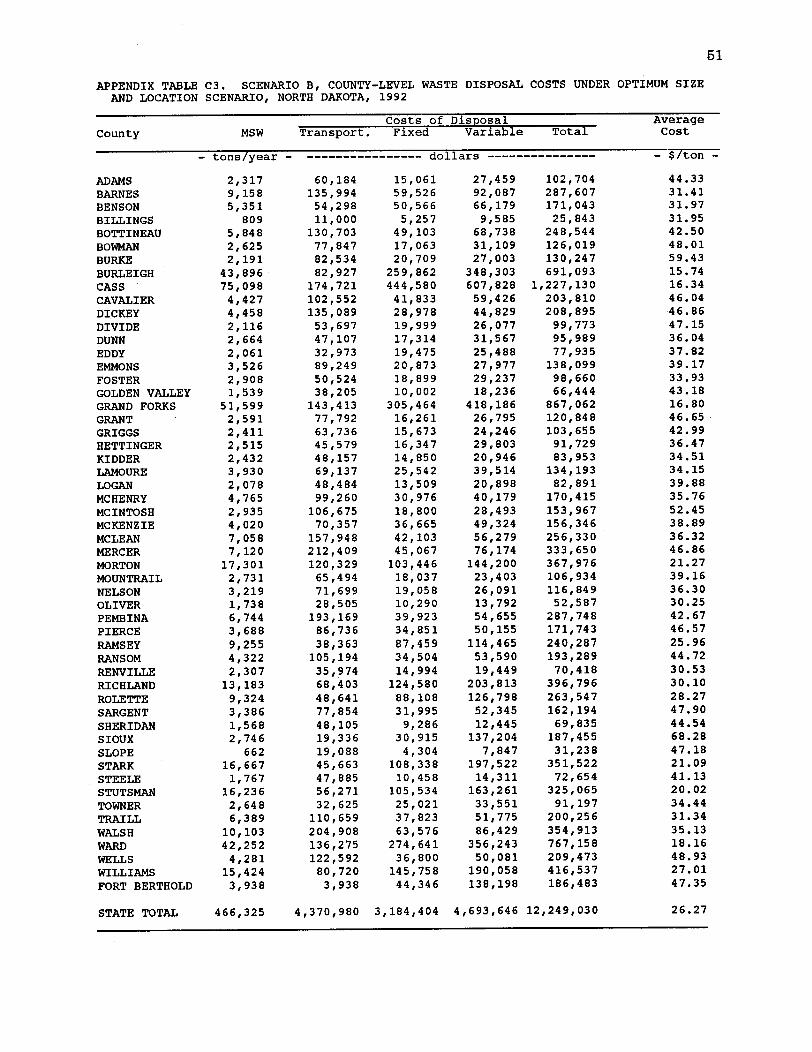
51
APPENDIX TABLE C3. SCENARIO B, COUNTY-LEVEL WASTE DISPOSAL COSTS UNDER OPTIMUM SIZEAND LOCATION SCENARIO, NORTH DAKOTA, 1992
Costs of Disposal AverageCounty MSW Transport. Fixed Variable Total Cost
- tons/year - -------------- dollars ------------ - S$/ton -
ADAMS 2,317 60,184 15,061 27,459 102,704 44.33BARNES 9,158 135,994 59,526 92,087 287,607 31.41BENSON 5,351 54,298 50,566 66,179 171,043 31.97BILLINGS 809 11,000 5,257 9,585 25,843 31.95BOTTINEAU 5,848 130,703 49,103 68,738 248,544 42.50BOWMAN 2,625 77,847 17,063 31,109 126,019 48.01BURKE 2,191 82,534 20,709 27,003 130,247 59.43
BURLEIGH 43,896 82,927 259,862 348,303 691,093 15.74CASS 75,098 174,721 444,580 607,828 1,227,130 16.34
CAVALIER 4,427 102,552 41,833 59,426 203,810 46.04DICKEY 4,458 135,089 28,978 44,829 208,895 46.86
DIVIDE 2,116 53,697 19,999 26,077 99,773 47.15DUNN 2,664 47,107 17,314 31,567 95,989 36.04
EDDY 2,061 32,973 19,475 25,488 77,935 37.82EMMONS 3,526 89,249 20,873 27,977 138,099 39.17
FOSTER 2,908 50,524 18,899 29,237 98,660 33.93GOLDEN VALLEY 1,539 38,205 10,002 18,236 66,444 43.18
GRAND FORKS 51,599 143,413 305,464 418,186 867,062 16.80GRANT 2,591 77,792 16,261 26,795 120,848 46.65GRIGGS 2,411 63,736 15,673 24,246 103,655 42.99HETTINGER 2,515 45,579 16,347 29,803 91,729 36.47KIDDER 2,432 48,157 14,850 20,946 83,953 34.51LAMOURE 3,930 69,137 25,542 39,514 134,193 34.15
LOGAN 2,078 48,484 13,509 20,898 82,891 39.88
MCHENRY 4,765 99,260 30,976 40,179 170,415 35.76
MCINTOSH 2,935 106,675 18,800 28,493 153,967 52.45MCKENZIE 4,020 70,357 36,665 49,324 156,346 38.89
MCLEAN 7,058 157,948 42,103 56,279 256,330 36.32MERCER 7,120 212,409 45,067 76,174 333,650 46.86
MORTON 17,301 120,329 103,446 144,200 367,976 21.27
MOUNTRAIL 2,731 65,494 18,037 23,403 106,934 39.16
NELSON 3,219 71,699 19,058 26,091 116,849 36.30OLIVER 1,738 28,505 10,290 13,792 52,587 30.25
PEMBINA 6,744 193,169 39,923 54,655 287,748 42.67
PIERCE 3,688 86,736 34,851 50,155 171,743 46.57
RAMSEY 9,255 38,363 87,459 114,465 240,287 25.96
RANSOM 4,322 105,194 34,504 53,590 193,289 44.72
RENVILLE 2,307 35,974 14,994 19,449 70,418 30.53
RICHLAND 13,183 68,403 124,580 203,813 396,796 30.10
ROLETTE 9,324 48,641 88,108 126,798 263,547 28.27
SARGENT 3,386 77,854 31,995 52,345 162,194 47.90
SHERIDAN 1,568 48,105 9,286 12,445 69,835 44.54
SIOUX 2,746 19,336 30,915 137,204 187,455 68.28
SLOPE 662 19,088 4,304 7,847 31,238 47.18
STARK 16,667 45,663 108,338 197,522 351,522 21.09
STEELE 1,767 47,885 10,458 14,311 72,654 41.13STUTSMAN 16,236 56,271 105,534 163,261 325,065 20.02
TOWNER 2,648 32,625 25,021 33,551 91,197 34.44
TRAILL 6,389 110,659 37,823 51,775 200,256 31.34
WALSH 10,103 204,908 63,576 86,429 354,913 35.13
WARD 42,252 136,275 274,641 356,243 767,158 18.16
WELLS 4,281 122,592 36,800 50,081 209,473 48.93
WILLIAMS 15,424 80,720 145,758 190,058 416,537 27.01
FORT BERTHOLD 3,938 3,938 44,346 138,198 186,483 47.35
466,325 4,370,980 3,184,404 4,693,646 12,249,030 26.27STATE TOTAL
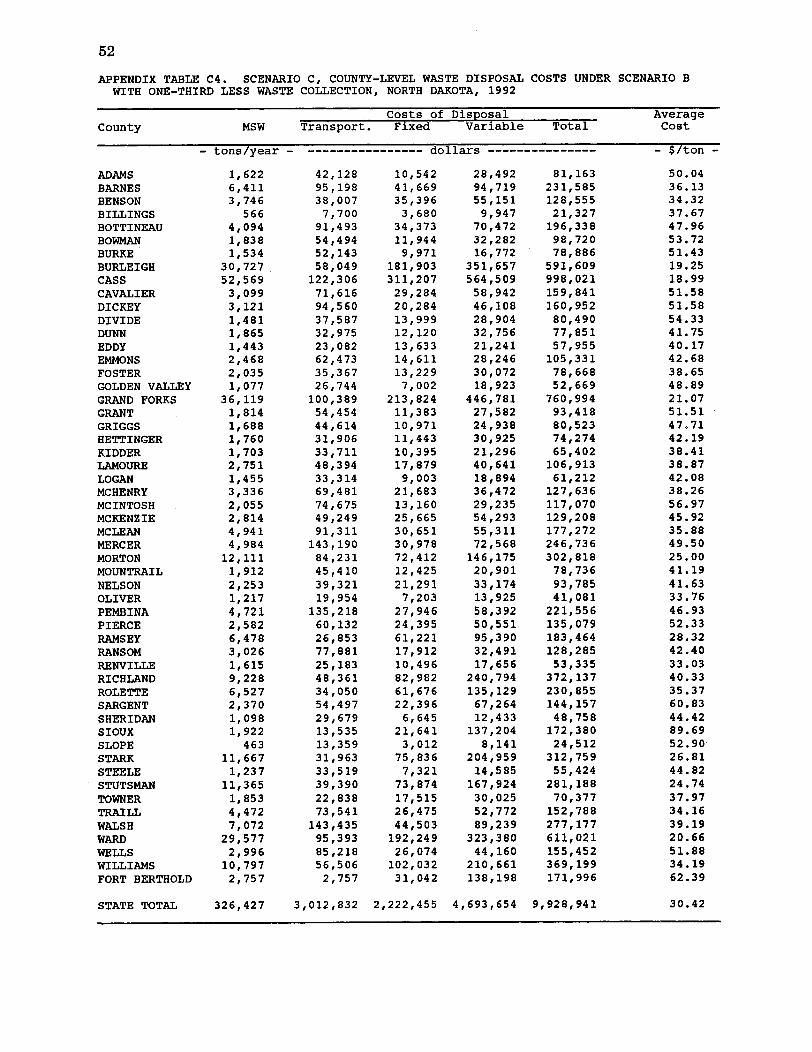
52
APPENDIX TABLE C4. SCENARIO C, COUNTY-LEVEL WASTE DISPOSAL COSTS UNDER SCENARIO BWITH ONE-THIRD LESS WASTE COLLECTION, NORTH DAKOTA, 1992
Costs of Disposal AverageCounty MSW Transport. Fixed Variable Total Cost
- tons/year - -------------- dollars ------------- - $/ton -
ADAMS 1,622 42,128 10,542 28,492 81,163 50.04BARNES 6,411 95,198 41,669 94,719 231,585 36.13BENSON 3,746 38,007 35,396 55,151 128,555 34.32BILLINGS 566 7,700 3,680 9,947 21,327 37.67BOTTINEAU 4,094 91,493 34,373 70,472 196,338 47.96BOWMAN 1,838 54,494 11,944 32,282 98,720 53.72BURKE 1,534 52,143 9,971 16,772 78,886 51.43BURLEIGH 30,727 58,049 181,903 351,657 591,609 19.25CASS 52,569 122,306 311,207 564,509 998,021 18.99CAVALIER 3,099 71,616 29,284 58,942 159,841 51.58DICKEY 3,121 94,560 20,284 46,108 160,952 51.58DIVIDE 1,481 37,587 13,999 28,904 80,490 54.33DUNN 1,865 32,975 12,120 32,756 77,851 41.75EDDY 1,443 23,082 13,633 21,241 57,955 40.17EMMONS 2,468 62,473 14,611 28,246 105,331 42.68FOSTER 2,035 35,367 13,229 30,072 78,668 38.65GOLDEN VALLEY 1,077 26,744 7,002 18,923 52,669 48.89GRAND FORKS 36,119 100,389 213,824 446,781 760,994 21.07GRANT 1,814 54,454 11,383 27,582 93,418 51.51GRIGGS 1,688 44,614 10,971 24,938 80,523 47.71HETTINGER 1,760 31,906 11,443 30,925 74,274 42.19KIDDER 1,703 33,711 10,395 21,296 65,402 38.41LAMOURE 2,751 48,394 17,879 40,641 106,913 38.87LOGAN 1,455 33,314 9,003 18,894 61,212 42.08MCHENRY 3,336 69,481 21,683 36,472 127,636 38.26MCINTOSH 2,055 74,675 13,160 29,235 117,070 56.97MCKENZIE 2,814 49,249 25,665 54,293 129,208 45.92MCLEAN 4,941 91,311 30,651 55,311 177,272 35.88MERCER 4,984 143,190 30,978 72,568 246,736 49.50MORTON 12,111 84,231 72,412 146,175 302,818 25.00MOUNTRAIL 1,912 45,410 12,425 20,901 78,736 41.19NELSON 2,253 39,321 21,291 33,174 93,785 41.63OLIVER 1,217 19,954 7,203 13,925 41,081 33.76PEMBINA 4,721 135,218 27,946 58,392 221,556 46.93PIERCE 2,582 60,132 24,395 50,551 135,079 52.33RAMSEY 6,478 26,853 61,221 95,390 183,464 28.32RANSOM 3,026 77,881 17,912 32,491 128,285 42.40RENVILLE 1,615 25,183 10,496 17,656 53,335 33.03RICHLAND 9,228 48,361 82,982 240,794 372,137 40.33ROLETTE 6,527 34,050 61,676 135,129 230,855 35.37SARGENT 2,370 54,497 22,396 67,264 144,157 60.83SHERIDAN 1,098 29,679 6,645 12,433 48,758 44.42SIOUX 1,922 13,535 21,641 137,204 172,380 89.69SLOPE 463 13,359 3,012 8,141 24,512 52.90STARK 11,667 31,963 75,836 204,959 312,759 26.81STEELE 1,237 33,519 7,321 14,585 55,424 44.82STUTSMAN 11,365 39,390 73,874 167,924 281,188 24.74TOWNER 1,853 22,838 17,515 30,025 70,377 37.97TRAILL 4,472 73,541 26,475 52,772 152,788 34.16WALSH 7,072 143,435 44,503 89,239 277,177 39.19WARD 29,577 95,393 192,249 323,380 611,021 20.66WELLS 2,996 85,218 26,074 44,160 155,452 51.88WILLIAMS 10,797 56,506 102,032 210,661 369,199 34.19FORT BERTHOLD 2,757 2,757 31,042 138,198 171,996 62.39
326,427 3,012,832 2,222,455 4,693,654 9,928,941 30.42STATE TOTAL
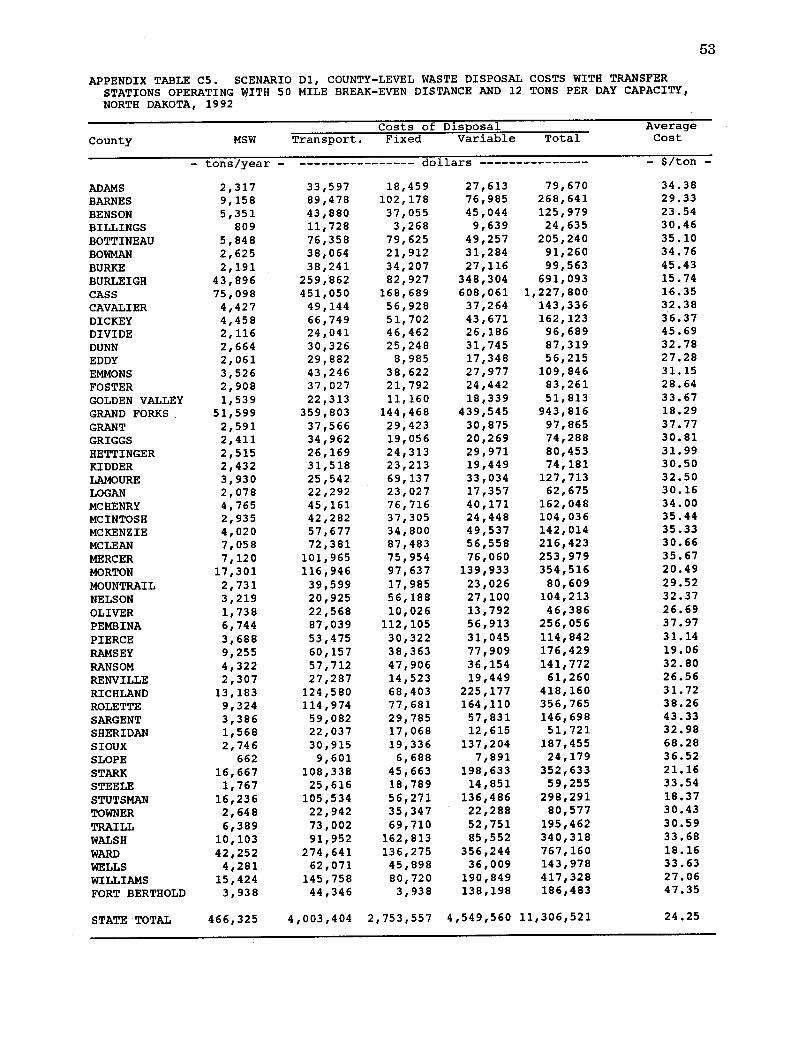
53
APPENDIX TABLE C5. SCENARIO D1, COUNTY-LEVEL WASTE DISPOSAL COSTS WITH TRANSFERSTATIONS OPERATING WITH 50 MILE BREAK-EVEN DISTANCE AND 12 TONS PER DAY CAPACITY,NORTH DAKOTA, 1992
Costs of Disposal AverageCounty MSW Transport. Fixed Variable Total Cost
- tons/year - --------------- dollars ------------- -- $/ton -
ADAMS 2,317 33,597 18,459 27,613 79,670 34.38BARNES 9,158 89,478 102,178 76,985 268,641 29.33
BENSON 5,351 43,880 37,055 45,044 125,979 23.54
BILLINGS 809 11,728 3,268 9,639 24,635 30.46
BOTTINEAU 5,848 76,358 79,625 49,257 205,240 35.10
BOWMAN 2,625 38,064 21,912 31,284 91,260 34.76
BURKE 2,191 38,241 34,207 27,116 99,563 45.43
BURLEIGH 43,896 259,862 82,927 348,304 691,093 15.74
CASS 75,098 451,050 168,689 608,061 1,227,800 16.35
CAVALIER 4,427 49,144 56,928 37,264 143,336 32.38
DICKEY 4,458 66,749 51,702 43,671 162,123 36.37
DIVIDE 2,116 24,041 46,462 26,186 96,689 45.69
DUNN 2,664 30,326 25,248 31,745 87,319 32.78
EDDY 2,061 29,882 8,985 17,348 56,215 27.28
EMMONS 3,526 43,246 38,622 27,977 109,846 31.15
FOSTER 2,908 37,027 21,792 24,442 83,261 28.64
GOLDEN VALLEY 1,539 22,313 11,160 18,339 51,813 33.67
GRAND FORKS 51,599 359,803 144,468 439,545 943,816 18.29
GRANT 2,591 37,566 29,423 30,875 97,865 37.77
GRIGGS 2,411 34,962 19,056 20,269 74,288 30.81
HETTINGER 2,515 26,169 24,313 29,971 80,453 31.99
KIDDER 2,432 31,518 23,213 19,449 74,181 30.50
LAMOURE 3,930 25,542 69,137 33,034 127,713 32.50
LOGAN 2,078 22,292 23,027 17,357 62,675 30.16
MCHENRY 4,765 45,161 76,716 40,171 162,048 34.00MCINTOSH 2,935 42,282 37,305 24,448 104,036 35.44
MCKENZIE 4,020 57,677 34,800 49,537 142,014 35.33
MCLEAN 7,058 72,381 87,483 56,558 216,423 30.66
MERCER 7,120 101,965 75,954 76,060 253,979 35.67
MORTON 17,301 116,946 97,637 139,933 354,516 20.49
MOUNTRAIL 2,731 39,599 17,985 23,026 80,609 29.52
NELSON 3,219 20,925 56,188 27,100 104,213 32.37
OLIVER 1,738 22,568 10,026 13,792 46,386 26.69
PEMBINA 6,744 87,039 112,105 56,913 256,056 37.97
PIERCE 3,688 53,475 30,322 31,045 114,842 31.14
RAMSEY 9,255 60,157 38,363 77,909 176,429 19.06
RANSOM 4,322 57,712 47,906 36,154 141,772 32.80
RENVILLE 2,307 27,287 14,523 19,449 61,260 26.56
RICHLAND 13,183 124,580 68,403 225,177 418,160 31.72
ROLETTE 9,324 114,974 77,681 164,110 356,765 38.26
SARGENT 3,386 59,082 29,785 57,831 146,698 43.33
SHERIDAN 1,568 22,037 17,068 12,615 51,721 32.98
SIOUX 2,746 30,915 19,336 137,204 187,455 68.28
SLOPE 662 9,601 6,688 7,891 24,179 36.52
STARK 16,667 108,338 45,663 198,633 352,633 21.16
STEELE 1,767 25,616 18,789 14,851 59,255 33.54
STUTSMAN 16,236 105,534 56,271 136,486 298,291 18.37
TOWNER 2,648 22,942 35,347 22,288 80,577 30.43
TRAILL 6,389 73,002 69,710 52,751 195,462 30.59
WALSH 10,103 91,952 162,813 85,552 340,318 33.68
WARD 42,252 274,641 136,275 356,244 767,160 18.16
WELLS 4,281 62,071 45,898 36,009 143,978 33.63
WILLIAMS 15,424 145,758 80,720 190,849 417,328 27.06
FORT BERTHOLD 3,938 44,346 3,938 138,198 186,483 47.35
466,325 4,003,404 2,753,557 4,549,560 11,306,521
-
24.25STATE TOTAL
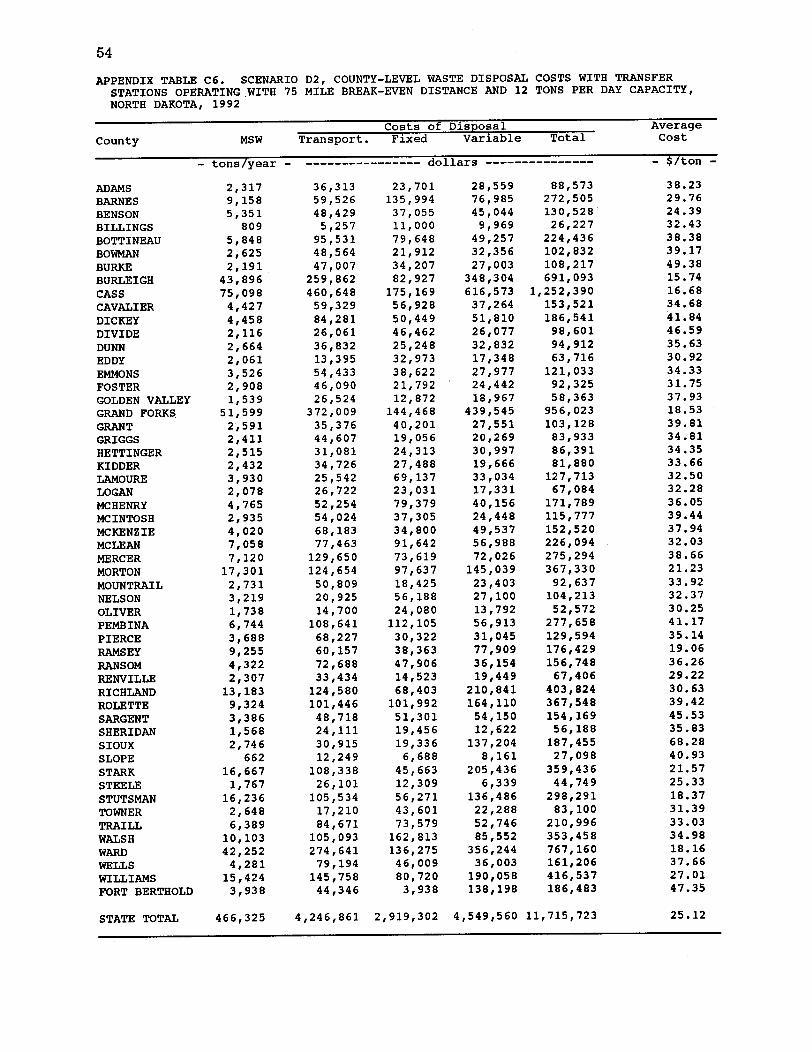
54
APPENDIX TABLE C6. SCENARIO D2, COUNTY-LEVEL WASTE DISPOSAL COSTS WITH TRANSFERSTATIONS OPERATING WITH 75 MILE BREAK-EVEN DISTANCE AND 12 TONS PER DAY CAPACITY,NORTH DAKOTA, 1992
Costs of Disposal AverageCounty MSW Transport. Fixed Variable Total Cost
- tons/year - --------------- dollars -------------- - $/ton -
ADAMSBARNESBENSONBILLINGSBOTTINEAUBOWMANBURKEBURLEIGHCASSCAVALIERDICKEYDIVIDEDUNNEDDYEMMONSFOSTERGOLDEN VALLEYGRAND FORKSGRANTGRIGGSHETTINGERKIDDERLAMOURELOGANMCHENRYMCINTOSHMCKENZIEMCLEANMERCERMORTONMOUNTRAILNELSONOLIVERPEMBINAPIERCERAMSEYRANSOMRENVILLERICHLANDROLETTESARGENTSHERIDANSIOUXSLOPESTARKSTEELESTUTSMANTOWNERTRAILLWALSHWARDWELLSWILLIAMSFORT BERTHOLD
STATE TOTAL
2,3179,1585,351
8095,8482,6252,191
43,89675,0984,4274,4582,1162,6642,0613,5262,9081,539
51,5992,5912,4112,5152,4323,9302,0784,7652,9354,0207,0587,12017,3012,7313,2191,7386,7443,6889,2554,3222,30713,1839,3243,3861,5682,746
66216,6671,76716,2362,6486,38910,10342,2524,28115,4243,938
36,31359,52648,4295,25795,53148,56447,007
259,862460,64859,32984,28126,06136,83213,39554,43346,09026,524372,00935,37644,60731,08134,72625,54226,72252,25454,02468,18377,463129,650124,65450,80920,92514,700
108,64168,22760,15772,68833,434
124,580101,44648,71824,11130,91512,249108,33826,101105,53417,21084,671105,093274,64179,194145,75844,346
23,701135,99437,05511,00079,64821,91234,20782,927175,16956,92850,44946,46225,24832,97338,62221,79212,872144,46840,20119,05624,31327,48869,13723,03179,37937,30534,80091,64273,61997,63718,42556,18824,080112,10530,32238,36347,90614,52368,403101,99251,30119,45619,3366,688
45,66312,30956,27143,60173,579162,813136,27546,00980,7203,938
28,55976,98545,0449,96949,25732,35627,003
348,304616,57337,26451,81026,07732,83217,34827,97724,44218,967
439,54527,55120,26930,99719,66633,03417,33140,15624,44849,53756,98872,026145,03923,40327,10013,79256,91331,04577,90936,15419,449
210,841164,11054,15012,622137,204
8,161205,436
6,339136,48622,28852,74685,552356,24436,003190,058138,198
88,573272,505130,52826,227224,436102,832108,217691,093
1,252,390153,521186,54198,60194,91263,716121,03392,32558,363956,023103,12883,93386,39181,880127,71367,084171,789115,777152,520226,094275,294367,33092,637104,21352,572277,658129,594176,429156,74867,406403,824367,548154,16956,188187,45527,098359,43644,749298,29183,100
210,996353,458767,160161,206416,537186,483
466,325 4,246,861 2,919,302 4,549,560 11,715,723
38.2329.7624.3932.4338.3839.1749.3815.7416.6834.6841.8446.5935.6330.9234.3331.7537.9318.5339.8134.8134.3533.6632.5032.2836.0539.4437.9432.0338.6621.2333.9232.3730.2541.1735.1419.0636.2629.2230.6339.4245.5335.8368.2840.9321.5725.3318.3731.3933.0334.9818.1637.6627.0147.35
25.12
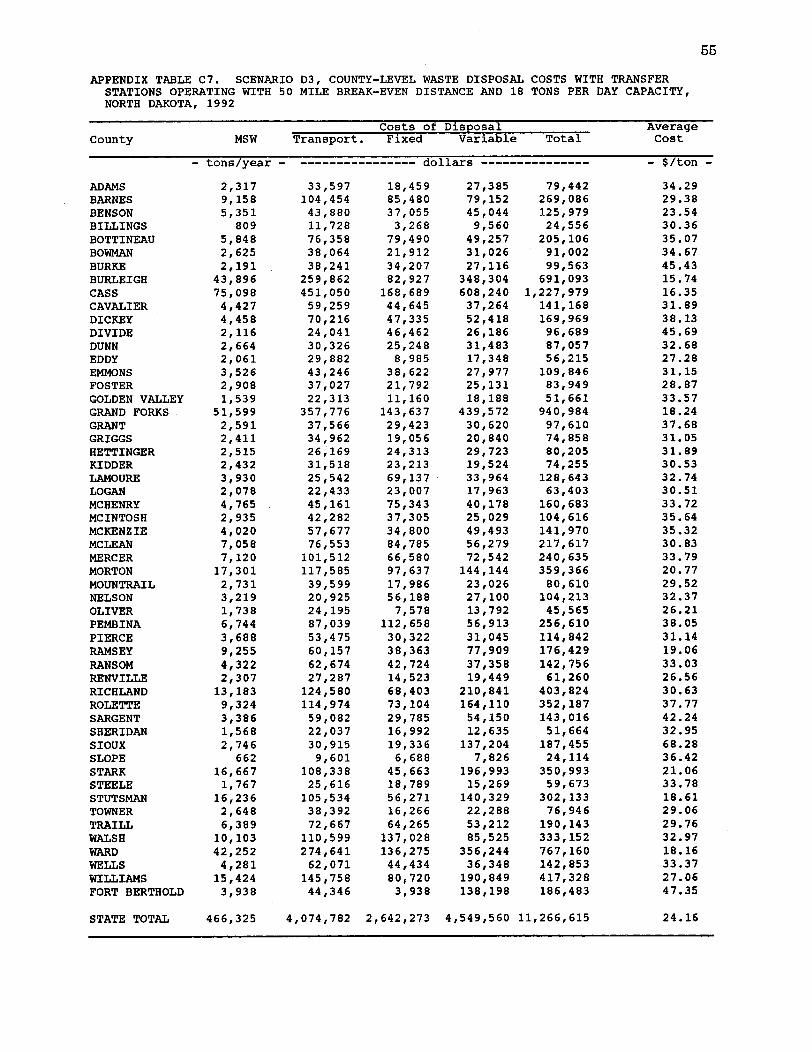
55
APPENDIX TABLE C7. SCENARIO D3, COUNTY-LEVEL WASTE DISPOSAL COSTS WITH TRANSFERSTATIONS OPERATING WITH 50 MILE BREAK-EVEN DISTANCE AND 18 TONS PER DAY CAPACITY,NORTH DAKOTA, 1992
Costs of Disposal AverageCounty MSW Transport. Fixed Variable Total Cost
- tons/year - --------------- dollars ------------- -- $/ton -
ADAMS 2,317 33,597 18,459 27,385 79,442 34.29BARNES 9,158 104,454 85,480 79,152 269,086 29.38BENSON 5,351 43,880 37,055 45,044 125,979 23.54BILLINGS 809 11,728 3,268 9,560 24,556 30.36BOTTINEAU 5,848 76,358 79,490 49,257 205,106 35.07BOWMAN 2,625 38,064 21,912 31,026 91,002 34.67BURKE 2,191 38,241 34,207 27,116 99,563 45.43BURLEIGH 43,896 259,862 82,927 348,304 691,093 15.74CASS 75,098 451,050 168,689 608,240 1,227,979 16.35CAVALIER 4,427 59,259 44,645 37,264 141,168 31.89DICKEY 4,458 70,216 47,335 52,418 169,969 38.13DIVIDE 2,116 24,041 46,462 26,186 96,689 45.69DUNN 2,664 30,326 25,248 31,483 87,057 32.68EDDY 2,061 29,882 8,985 17,348 56,215 27.28EMMONS 3,526 43,246 38,622 27,977 109,846 31.15FOSTER 2,908 37,027 21,792 25,131 83,949 28.87GOLDEN VALLEY 1,539 22,313 11,160 18,188 51,661 33.57GRAND FORKS 51,599 357,776 143,637 439,572 940,984 18.24GRANT 2,591 37,566 29,423 30,620 97,610 37.68GRIGGS 2,411 34,962 19,056 20,840 74,858 31.05HETTINGER 2,515 26,169 24,313 29,723 80,205 31.89KIDDER 2,432 31,518 23,213 19,524 74,255 30.53LAMOURE 3,930 25,542 69,137 33,964 128,643 32.74LOGAN 2,078 22,433 23,007 17,963 63,403 30.51MCHENRY 4,765 45,161 75,343 40,178 160,683 33.72MCINTOSH 2,935 42,282 37,305 25,029 104,616 35.64MCKENZIE 4,020 57,677 34,800 49,493 141,970 35.32MCLEAN 7,058 76,553 84,785 56,279 217,617 30.83MERCER 7,120 101,512 66,580 72,542 240,635 33.79MORTON 17,301 117,585 97,637 144,144 359,366 20.77MOUNTRAIL 2,731 39,599 17,986 23,026 80,610 29.52NELSON 3,219 20,925 56,188 27,100 104,213 32.37OLIVER 1,738 24,195 7,578 13,792 45,565 26.21PEMBINA 6,744 87,039 112,658 56,913 256,610 38.05PIERCE 3,688 53,475 30,322 31,045 114,842 31.14RAMSEY 9,255 60,157 38,363 77,909 176,429 19.06RANSOM 4,322 62,674 42,724 37,358 142,756 33.03RENVILLE 2,307 27,287 14,523 19,449 61,260 26.56RICHLAND 13,183 124,580 68,403 210,841 403,824 30.63ROLETTE 9,324 114,974 73,104 164,110 352,187 37.77SARGENT 3,386 59,082 29,785 54,150 143,016 42.24SHERIDAN 1,568 22,037 16,992 12,635 51,664 32.95SIOUX 2,746 30,915 19,336 137,204 187,455 68.28SLOPE 662 9,601 6,688 7,826 24,114 36.42STARK 16,667 108,338 45,663 196,993 350,993 21.06STEELE 1,767 25,616 18,789 15,269 59,673 33.78STUTSMAN 16,236 105,534 56,271 140,329 302,133 18.61TOWNER 2,648 38,392 16,266 22,288 76,946 29.06TRAILL 6,389 72,667 64,265 53,212 190,143 29.76WALSH 10,103 110,599 137,028 85,525 333,152 32.97WARD 42,252 274,641 136,275 356,244 767,160 18.16WELLS 4,281 62,071 44,434 36,348 142,853 33.37WILLIAMS 15,424 145,758 80,720 190,849 417,328 27.06FORT BERTHOLD 3,938 44,346 3,938 138,198 186,483 47.35
466,325 4,074,782 2,642,273 4,549,560 11,266,615
_ _I I _ __ _ I
24.16STATE TOTAL

56
APPENDIX TABLE C8. SCENARIO D4, COUNTY-LEVEL WASTE DISPOSAL COSTS WITH TRANSFERSTATIONS OPERATING WITH 75 MILE BREAK-EVEN DISTANCE AND 18 TONS PER DAY CAPACITY,NORTH DAKOTA, 1992
Costs of Disposal AverageCounty MSW Transport. Fixed Variable Total Cost
- tons/year - ---------------- dollars -------------- - $/ton -
ADAMSBARNESBENSONBILLINGSBOTTINEAUBOWMANBURKEBURLEIGHCASSCAVALIERDICKEYDIVIDEDUNNEDDYEMMONSFOSTERGOLDEN VALLEYGRAND FORKSGRANTGRIGGSHETTINGERKIDDERLAMOURELOGANMCHENRYMCINTOSHMCKENZIEMCLEANMERCERMORTONMOUNTRAILNELSONOLIVERPEMBINAPIERCERAMSEYRANSOMRENVILLERICHLANDROLETTESARGENTSHERIDANSIOUXSLOPESTARKSTEELESTUTSMANTOWNERTRAILLWALSHWARDWELLSWILLIAMSFORT BERTHOLD
STATE TOTAL
2,3179,1585,351
8095,8482,6252,19143,89675,0984,4274,4582,1162,6642,0613,5262,9081,539
51,5992,5912,4112,5152,4323,9302,0784,7652,9354,0207,0587,12017,3012,7313,2191,7386,7443,6889,2554,3222,307
13,1839,3243,3861,5682,746
66216,6671,767
16,2362,6486,38910,10342,2524,28115,4243,938
36,313 23,70159,526 135,99448,429 37,0555,257 11,00095,531 79,49048,564 21,91247,007 34,207259,862 82,927454,067 168,68959,329 56,92866,428 41,38126,061 46,46236,832 25,24813,395 32,97354,433 38,62246,090 21,79226,524 12,872
344,040 143,47035,376 40,20144,607 19,05631,081 24,31334,726 27,48825,542 69,13726,519 23,05952,254 79,37954,024 37,30568,183 34,80073,468 93,321129,650 66,580124,654 97,63750,809 18,11720,925 56,18831,147 7,578108,641 112,65868,227 30,32260,157 38,36379,963 42,72433,434 14,523124,580 68,403127,309 73,10466,571 60,36928,309 17,15830,915 19,33612,249 6,688108,338 45,66332,682 18,789
105,534 56,27117,210 43,60189,296 64,265
133,063 155,727274,641 136,27579,194 46,151
145,758 80,72044,346 3,938
466,325 4,301,071 2,843,934 4,549,560 11,694,565
28,55976,98545,0449,969
49,25732,35627,003348,304608,06137,26421,59526,07732,83217,34827,97724,44218,967439,79427,55120,26930,99719,66633,03417,16640,15624,44849,53757,16272,026145,03923,40327,10013,79256,91331,04577,90936,33519,449
210,841164,11084,36512,614137,204
8,161205,43614,851136,48622,28852,56585,303
356,24436,002190,058138,198
88,573272,505130,52826,227224,278102,832108,217691,093
1,230,817153,521129,40498,60194,91263,716121,03392,32558,363927,305103,12883,93386,39181,880127,71366,744171,789115,777152,520223,951268,256367,33092,328104,21352,517
278,212129,594176,429159,02267,406
403,824364,522211,30658,082187,45527,098359,43666,322
298,29183,100
206,126374,093767,160161,346416,537186,483
38.2329.7624.3932.4338.3539.1749.3815.7416.3934.6829.0346.5935.6330.9234.3331.7537.9317.9739.8134.8134.3533.6632.5032.1136.0539.4437.9431.7337.6721.2333.8132.3730.2141.2535.1419.0636.7929.2230.6339.1062.4137.0468.2840.9321.5737.5418.3731.3932.2637.0318.1637.6927.0147.35
25.08
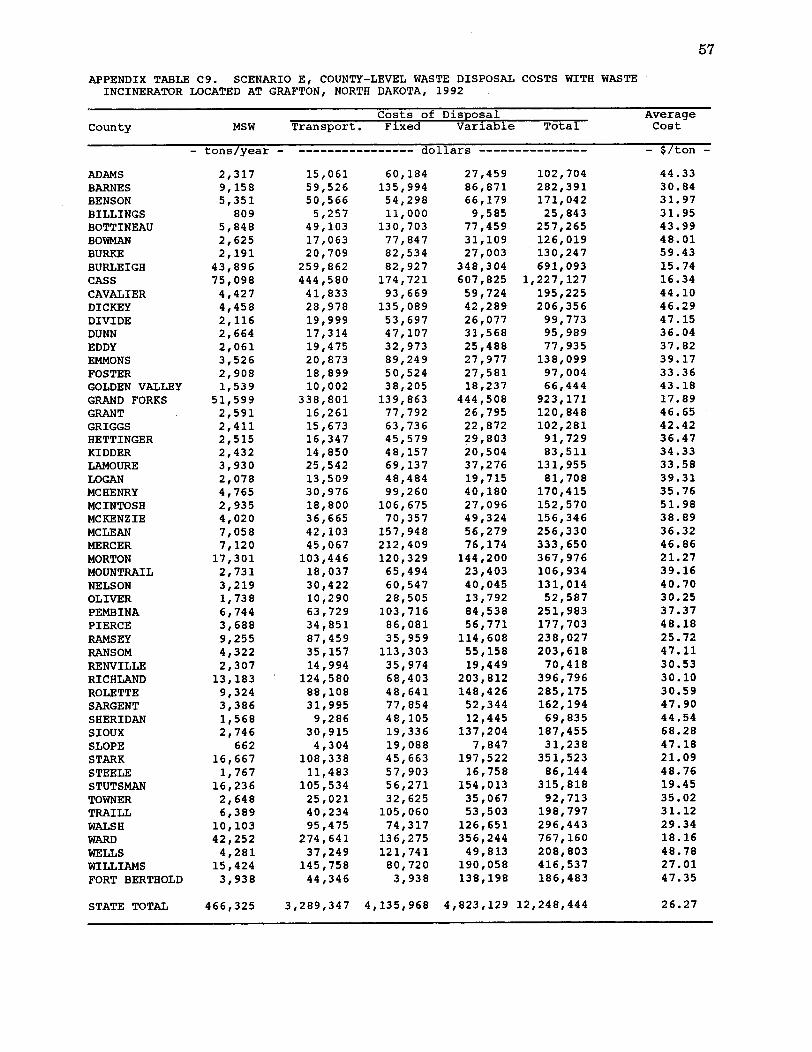
57
APPENDIX TABLE C9. SCENARIO E, COUNTY-LEVEL WASTE DISPOSAL COSTS WITH WASTEINCINERATOR LOCATED AT GRAFTON, NORTH DAKOTA, 1992
Costs of Disposal AverageCounty MSW Transport. Fixed Variable Total Cost
- tons/year - --------------- dollars ------------ - $/ton -
ADAMS 2,317 15,061 60,184 27,459 102,704 44.33
BARNES 9,158 59,526 135,994 86,871 282,391 30.84
BENSON 5,351 50,566 54,298 66,179 171,042 31.97
BILLINGS 809 5,257 11,000 9,585 25,843 31.95
BOTTINEAU 5,848 49,103 130,703 77,459 257,265 43.99
BOWMAN 2,625 17,063 77,847 31,109 126,019 48.01
BURKE 2,191 20,709 82,534 27,003 130,247 59.43
BURLEIGH 43,896 259,862 82,927 348,304 691,093 15.74
CASS 75,098 444,580 174,721 607,825 1,227,127 16.34
CAVALIER 4,427 41,833 93,669 59,724 195,225 44.10
DICKEY 4,458 28,978 135,089 42,289 206,356 46.29
DIVIDE 2,116 19,999 53,697 26,077 99,773 47.15
DUNN 2,664 17,314 47,107 31,568 95,989 36.04
EDDY 2,061 19,475 32,973 25,488 77,935 37.82
EMMONS 3,526 20,873 89,249 27,977 138,099 39.17
FOSTER 2,908 18,899 50,524 27,581 97,004 33.36
GOLDEN VALLEY 1,539 10,002 38,205 18,237 66,444 43.18
GRAND FORKS 51,599 338,801 139,863 444,508 923,171 17.89
GRANT 2,591 16,261 77,792 26,795 120,848 46.65
GRIGGS 2,411 15,673 63,736 22,872 102,281 42.42
HETTINGER 2,515 16,347 45,579 29,803 91,729 36.47
KIDDER 2,432 14,850 48,157 20,504 83,511 34.33
LAMOURE 3,930 25,542 69,137 37,276 131,955 33.58
LOGAN 2,078 13,509 48,484 19,715 81,708 39.31
MCHENRY 4,765 30,976 99,260 40,180 170,415 35.76
MCINTOSH 2,935 18,800 106,675 27,096 152,570 51.98
MCKENZIE 4,020 36,665 70,357 49,324 156,346 38.89
MCLEAN 7,058 42,103 157,948 56,279 256,330 36.32
MERCER 7,120 45,067 212,409 76,174 333,650 46.86
MORTON 17,301 103,446 120,329 144,200 367,976 21.27
MOUNTRAIL 2,731 18,037 65,494 23,403 106,934 39.16
NELSON 3,219 30,422 60,547 40,045 131,014 40.70
OLIVER 1,738 10,290 28,505 13,792 52,587 30.25
PEMBINA 6,744 63,729 103,716 84,538 251,983 37.37
PIERCE 3,688 34,851 86,081 56,771 177,703 48.18
RAMSEY 9,255 87,459 35,959 114,608 238,027 25.72
RANSOM 4,322 35,157 113,303 55,158 203,618 47.11
RENVILLE 2,307 14,994 35,974 19,449 70,418 30.53
RICHLAND 13,183 124,580 68,403 203,812 396,796 30.10
ROLETTE 9,324 88,108 48,641 148,426 285,175 30.59
SARGENT 3,386 31,995 77,854 52,344 162,194 47.90
SHERIDAN 1,568 9,286 48,105 12,445 69,835 44.54
SIOUX 2,746 30,915 19,336 137,204 187,455 68.28
SLOPE 662 4,304 19,088 7,847 31,238 47.18
STARK 16,667 108,338 45,663 197,522 351,523 21.09
STEELE 1,767 11,483 57,903 16,758 86,144 48.76
STUTSMAN 16,236 105,534 56,271 154,013 315,818 19.45
TOWNER 2,648 25,021 32,625 35,067 92,713 35.02
TRAILL 6,389 40,234 105,060 53,503 198,797 31.12
WALSH 10,103 95,475 74,317 126,651 296,443 29.34
WARD 42,252 274,641 136,275 356,244 767,160 18.16
WELLS 4,281 37,249 121,741 49,813 208,803 48.78
WILLIAMS 15,424 145,758 80,720 190,058 416,537 27.01
FORT BERTHOLD 3,938 44,346 3,938 138,198 186,483 47.35
466,325 3,289,347 4,135,968 4,823,129 12,248,444 26.27STATE TOTAL
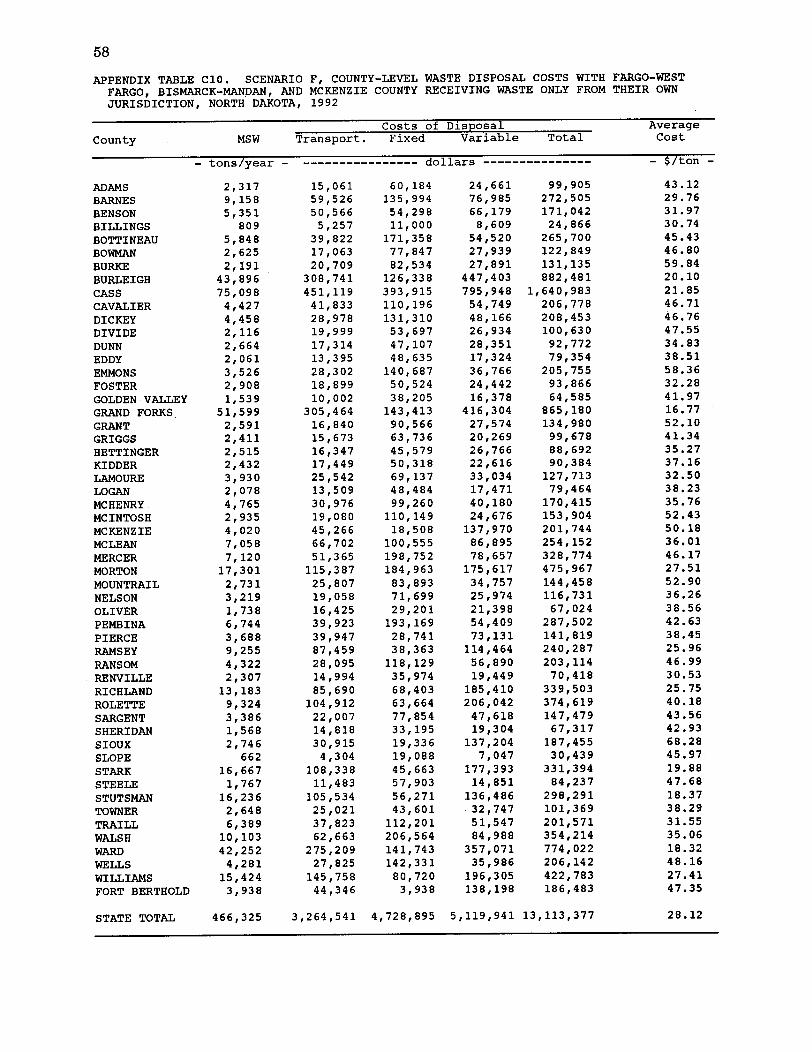
58
APPENDIX TABLE C10. SCENARIO F, COUNTY-LEVEL WASTE DISPOSAL COSTS WITHFARGO, BISMARCK-MANDAN, AND MCKENZIE COUNTY RECEIVING WASTE ONLY FROMJURISDICTION, NORTH DAKOTA, 1992
FARGO-WESTTHEIR OWN
Costs of Disposal AverageCounty MSW Transport. Fixed Variable Total Cost
- tons/year - --------------- dollars ---- ------- - $/ton -
ADAMSBARNESBENSONBILLINGSBOTTINEAUBOWMANBURKEBURLEIGHCASSCAVALIERDICKEYDIVIDEDUNNEDDYEMMONSFOSTERGOLDEN VALLEYGRAND FORKSGRANTGRIGGSHETTINGERKIDDERLAMOURELOGANMCHENRYMCINTOSHMCKENZIEMCLEANMERCERMORTONMOUNTRAILNELSONOLIVERPEMBINAPIERCERAMSEYRANSOMRENVILLERICHLANDROLETTESARGENTSHERIDANSIOUXSLOPESTARKSTEELESTUTSMANTOWNERTRAILLWALSHWARDWELLSWILLIAMSFORT BERTHOLD
STATE TOTAL
2,3179,1585,351
8095,8482,6252,191
43,89675,098
4,4274,4582,1162,6642,0613,5262,9081,539
51,5992,5912,4112,5152,4323,9302,0784,7652,9354,0207,0587,120
17,3012,7313,2191,7386,7443,6889,2554,3222,30713,1839,3243,3861,5682,746
66216,6671,767
16,2362,6486,389
10,10342,2524,28115,4243,938
15,061 60,18459,526 135,99450,566 54,2985,257 11,000
39,822 171,35817,063 77,84720,709 82,534
308,741 126,338451,119 393,915
41,833 110,19628,978 131,31019,999 53,69717,314 47,10713,395 48,63528,302 140,68718,899 50,52410,002 38,205
305,464 143,41316,840 90,56615,673 63,73616,347 45,57917,449 50,31825,542 69,13713,509 48,48430,976 99,26019,080 110,14945,266 18,50866,702 100,55551,365 198,752
115,387 184,96325,807 83,89319,058 71,69916,425 29,20139,923 193,16939,947 28,74187,459 38,36328,095 118,12914,994 35,97485,690 68,403
104,912 63,66422,007 77,85414,818 33,19530,915 19,3364,304 19,088
108,338 45,66311,483 57,903
105,534 56,27125,021 43,60137,823 112,20162,663 206,564
275,209 141,74327,825 142,331
145,758 80,72044,346 3,938
466,325 3,264,541 4,728,895 5,119,941 13,113,377
24,66176,98566,1798,60954,52027,93927,891
447,403795,94854,74948,16626,93428,35117,32436,76624,44216,378
416,30427,57420,26926,76622,61633,03417,47140,18024,676137,97086,89578,657
175,61734,75725,97421,39854,40973,131114,46456,89019,449
185,410206,04247,61819,304137,2047,047
177,39314,851136,48632,74751,54784,988
357,07135,986196,305138,198
99,905272,505171,04224,866265,700122,849131,135882,481
1,640,983206,778208,453100,63092,77279,354
205,75593,86664,585865,180134,98099,67888,69290,384127,71379,464170,415153,904201,744254,152328,774475,967144,458116,73167,024
287,502141,819240,287203,11470,418339,503374,619147,47967,317187,45530,439331,39484,237
298,291101,369201,571354,214774,022206,142422,783186,483
43.1229.7631.9730.7445.4346.8059.8420.1021.8546.7146.7647.5534.8338.5158.3632.2841.9716.7752.1041.3435.2737.1632.5038.2335.7652.4350.1836.0146.1727.5152.9036.2638.5642.6338.4525.9646.9930.5325.7540.1843.5642.9368.2845.9719.8847.6818.3738.2931.5535.0618.3248.1627.4147.35
28.12
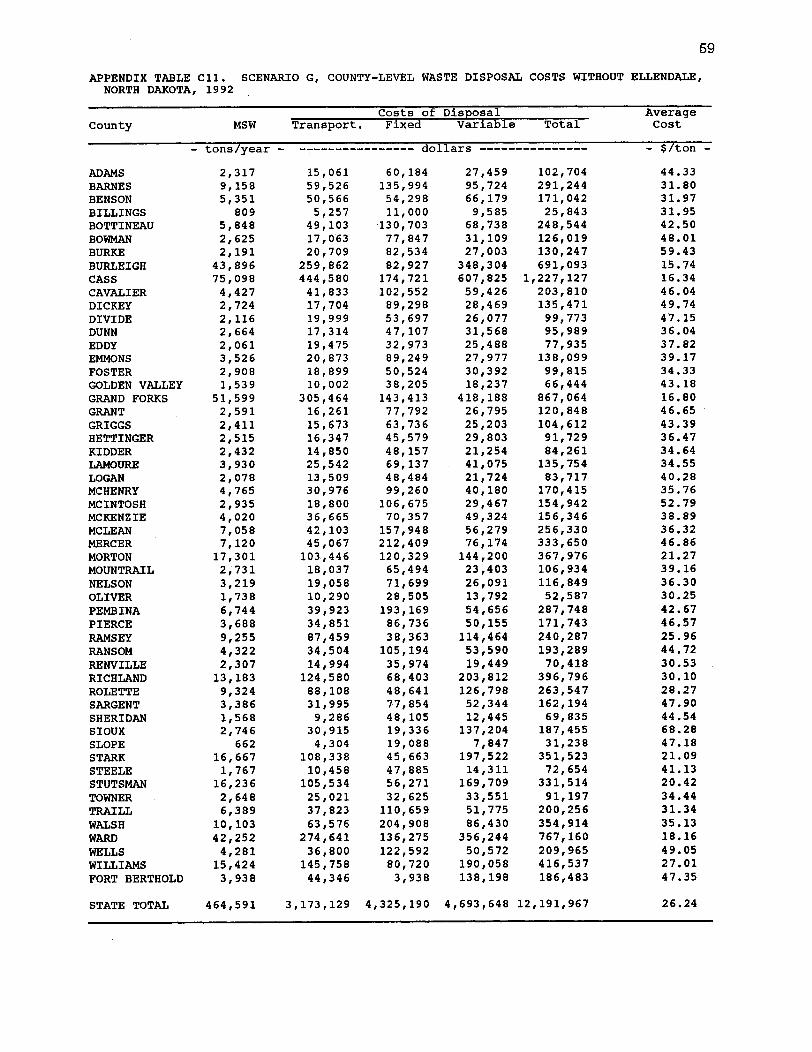
59
APPENDIX TABLE C11. SCENARIO G, COUNTY-LEVEL WASTE DISPOSAL COSTS WITHOUT ELLENDALE,NORTH DAKOTA, 1992
Costs of Disposal AverageCounty MSW Transport. Fixed Variable Total Cost
- tons/year - --------------- dollars ------------- - $/ton-
ADAMS 2,317 15,061 60,184 27,459 102,704 44.33BARNES 9,158 59,526 135,994 95,724 291,244 31.80BENSON 5,351 50,566 54,298 66,179 171,042 31.97BILLINGS 809 5,257 11,000 9,585 25,843 31.95BOTTINEAU 5,848 49,103 130,703 68,738 248,544 42.50BOWMAN 2,625 17,063 77,847 31,109 126,019 48.01BURKE 2,191 20,709 82,534 27,003 130,247 59.43BURLEIGH 43,896 259,862 82,927 348,304 691,093 15.74CASS 75,098 444,580 174,721 607,825 1,227,127 16.34CAVALIER 4,427 41,833 102,552 59,426 203,810 46.04DICKEY 2,724 17,704 89,298 28,469 135,471 49.74DIVIDE 2,116 19,999 53,697 26,077 99,773 47.15DUNN 2,664 17,314 47,107 31,568 95,989 36.04EDDY 2,061 19,475 32,973 25,488 77,935 37.82EMMONS 3,526 20,873 89,249 27,977 138,099 39.17FOSTER 2,908 18,899 50,524 30,392 99,815 34.33GOLDEN VALLEY 1,539 10,002 38,205 18,237 66,444 43.18GRAND FORKS 51,599 305,464 143,413 418,188 867,064 16.80GRANT 2,591 16,261 77,792 26,795 120,848 46.65GRIGGS 2,411 15,673 63,736 25,203 104,612 43.39HETTINGER 2,515 16,347 45,579 29,803 91,729 36.47KIDDER 2,432 14,850 48,157 21,254 84,261 34.64LAMOURE 3,930 25,542 69,137 41,075 135,754 34.55LOGAN 2,078 13,509 48,484 21,724 83,717 40.28MCHENRY 4,765 30,976 99,260 40,180 170,415 35.76MCINTOSH 2,935 18,800 106,675 29,467 154,942 52.79MCKENZIE 4,020 36,665 70,357 49,324 156,346 38.89MCLEAN 7,058 42,103 157,948 56,279 256,330 36.32MERCER 7,120 45,067 212,409 76,174 333,650 46.86MORTON 17,301 103,446 120,329 144,200 367,976 21.27MOUNTRAIL 2,731 18,037 65,494 23,403 106,934 39.16NELSON 3,219 19,058 71,699 26,091 116,849 36.30OLIVER 1,738 10,290 28,505 13,792 52,587 30.25PEMBINA 6,744 39,923 193,169 54,656 287,748 42.67PIERCE 3,688 34,851 86,736 50,155 171,743 46.57RAMSEY 9,255 87,459 38,363 114,464 240,287 25.96RANSOM 4,322 34,504 105,194 53,590 193,289 44.72RENVILLE 2,307 14,994 35,974 19,449 70,418 30.53RICHLAND 13,183 124,580 68,403 203,812 396,796 30.10ROLETTE 9,324 88,108 48,641 126,798 263,547 28.27SARGENT 3,386 31,995 77,854 52,344 162,194 47.90SHERIDAN 1,568 9,286 48,105 12,445 69,835 44.54SIOUX 2,746 30,915 19,336 137,204 187,455 68.28SLOPE 662 4,304 19,088 7,847 31,238 47.18STARK 16,667 108,338 45,663 197,522 351,523 21.09STEELE 1,767 10,458 47,885 14,311 72,654 41.13STUTSMAN 16,236 105,534 56,271 169,709 331,514 20.42TOWNER 2,648 25,021 32,625 33,551 91,197 34.44TRAILL 6,389 37,823 110,659 51,775 200,256 31.34WALSH 10,103 63,576 204,908 86,430 354,914 35.13WARD 42,252 274,641 136,275 356,244 767,160 18.16WELLS 4,281 36,800 122,592 50,572 209,965 49.05WILLIAMS 15,424 145,758 80,720 190,058 416,537 27.01FORT BERTHOLD 3,938 44,346 3,938 138,198 186,483 47.35
464,591 3,173,129 4,325,190 4,693,648 12,191,967 26.24STATE TOTAL
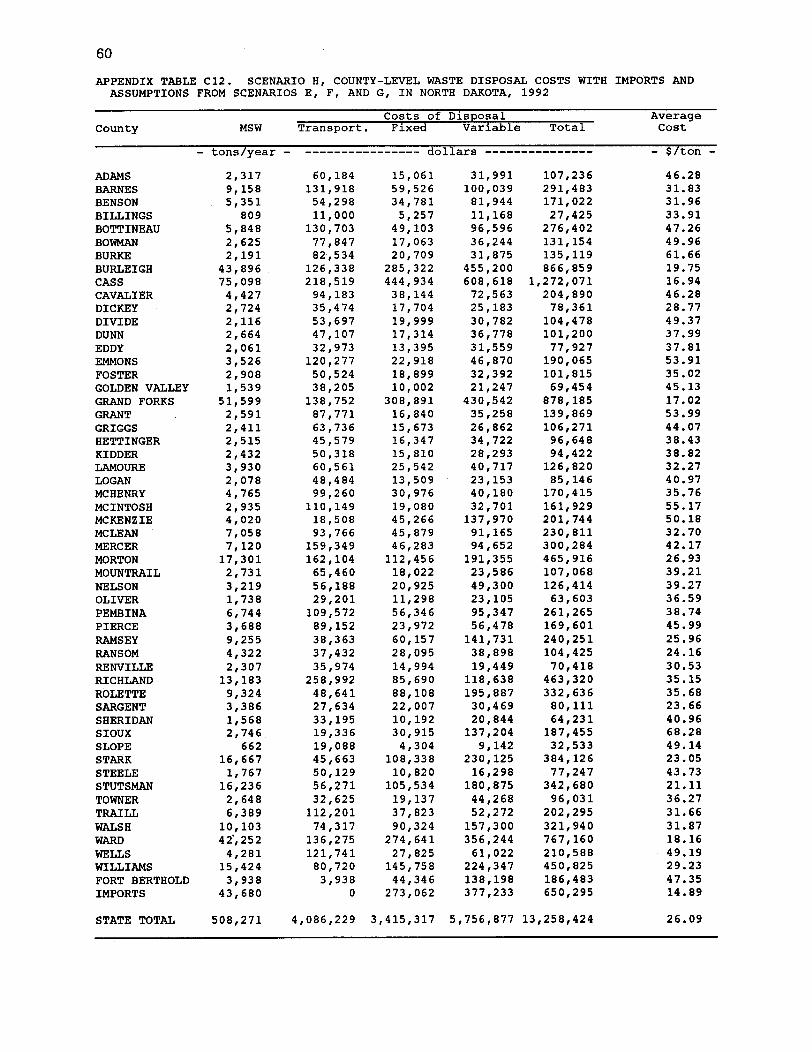
60
APPENDIX TABLE C12. SCENARIO H, COUNTY-LEVEL WASTE DISPOSAL COSTS WITHASSUMPTIONS FROM SCENARIOS E, F, AND G, IN NORTH DAKOTA, 1992
IMPORTS AND
Costs of Disposal AverageCounty MSW Transport. Fixed Variable Total Cost
- tons/year - --------------- dollars ----- ------ $/ton -
ADAMSBARNESBENSONBILLINGSBOTTINEAUBOWMANBURKEBURLEIGHCASSCAVALIERDICKEYDIVIDEDUNNEDDYEMMONSFOSTERGOLDEN VALLEYGRAND FORKSGRANTGRIGGSHETTINGERKIDDERLAMOURELOGANMCHENRYMCINTOSHMCKENZIEMCLEANMERCERMORTONMOUNTRAILNELSONOLIVERPEMBINAPIERCERAMSEYRANSOMRENVILLERICHLANDROLETTESARGENTSHERIDANSIOUXSLOPESTARKSTEELESTUTSMANTOWNERTRAILLWALSHWARDWELLSWILLIAMSFORT BERTHOLDIMPORTS
STATE TOTAL
2,3179,1585,351
8095,8482,6252,191
43,89675,0984,4272,7242,1162,6642,0613,5262,9081,539
51,5992,5912,4112,5152,4323,9302,0784,7652,9354,0207,0587,12017,3012,7313,2191,7386,7443,6889,2554,3222,30713,1839,3243,3861,5682,746
66216,6671,767
16,2362,6486,389
10,10342, 2524,28115,4243,93843,680
60,184131,91854,29811,000
130,70377,84782,534126,338218,51994,18335,47453,69747,10732,973120,27750,52438,205138,75287,77163,73645,57950,31860,56148,48499,260110,14918,50893,766
159,349162,10465,46056,18829,201
109,57289,15238,36337,43235,974
258,99248,64127,63433,19519,33619,08845,66350,12956,27132,625
112,20174,317136,275121,74180,7203,938
0
15,06159,52634,7815,25749,10317,06320,709285,322444,93438,14417,70419,99917,31413,39522,91818,89910,002
308,89116,84015,67316,34715,81025,54213,50930,97619,08045,26645,87946,283112,45618,02220,92511,29856,34623,97260,15728,09514,99485,69088,10822,00710,19230,9154,304
108,33810,820105,53419,13737,82390,324274,64127,825145,75844,346273,062
31,991100,03981,94411,16896,59636,24431,875455,200608,61872,56325,18330,78236,77831,55946,87032,39221,247
430,54235,25826,86234,72228,29340,71723,15340,18032,701137,97091,16594,652191,35523,58649,30023,10595,34756,478141,73138,89819,449118,638195,88730,46920,844137,204
9,142230,12516,298180,87544,26852,272157,300356,24461,022
224,347138,198377,233
107,236291,483171,02227,425276,402131,154135,119866,859
1,272,071204,89078,361104,478101,20077,927190,065101,81569,454
878,185139,869106,27196,64894,422126,82085,146170,415161,929201,744230,811300,284465,916107,068126,41463,603261,265169,601240,251104,42570,418463,320332,63680,11164,231187,45532,533384,12677,247342,68096,031202,295321,940767,160210,588450,825186,483650,295
508,271 4,086,229 3,415,317 5,756,877 13,258,424
46.2831.8331.9633.9147.2649.9661.6619.7516.9446.2828.7749.3737.9937.8153.9135.0245.1317.0253.9944.0738.4338.8232.2740.9735.7655.1750.1832.7042.1726.9339.2139.2736.5938.7445.9925.9624.1630.5335.1535.6823.6640.9668.2849.1423.0543.7321.1136.2731.6631.8718.1649.1929.2347.3514.89
26.09