estimates of connecticut municipal solid waste … of connecticut municipal solid waste generated...
TRANSCRIPT
Page 1 of 14
Estimates of Connecticut Municipal Solid Waste Generated (MSW), Disposed, and Recycled FY2014 Rev 2/23/2017
The following MSW statistics are based primarily on data reported to the Connecticut Department of Energy and Environmental Protection (CTDEEP) by Connecticut municipalities and by Connecticut permitted solid waste facilities. A listing of data qualifiers can be found at the end of this webpage. MSW disposed includes “regular trash” and some larger trash items such as furniture, mattresses, etc. (buried in landfills or processed at a waste-to-energy or other incinerator) by both the residential and non-residential sectors. It does not knowingly include construction and demolition wastes, industrial sludges, or land-clearing debris. MSW recycled includes: CT designated recyclable items; other types of MSW recyclables (e.g. food waste, 3-7 plastics, textiles, anti-freeze; etc.); and material reported reused through municipal swap areas. On July 31, 2014 CT scrap metal processors started submitting annual reports with more complete scrap metal recycling data to DEEP. The preliminary analysis of the first year’s data (FY2014) indicated much higher tonnages of scrap metal recycled than under their old reporting paradigm. The 2014 scrap metal processor data (highlighted in turquoise) is presented in the tables and figures below to illustrate the degree of under reporting in the past.
Questions? Contact Judy Belaval at the DEEP Bureau of Materials Management &Compliance Assurance (860) 424-3237
Figures: Figure 1 - Summary – Connecticut (CT) MSW Generated, Disposed, and Recycled FY2014;
Figure 2 - Summary - Types of Connecticut MSW Recycled FY2014;
Figure 3 - MSW Reported Recycled and Disposed – Historic Perspective;
Figure 4 - Types of Materials Found in MSW Disposed
Figure 5 - National Recycling Rates of Selected Products, 2014
Tables:
Table 1 - Trends in Types of MSW Material Generated in the United States;
Table 2 - Connecticut MSW – Detailed Statistics FY2014;
Table 3 – Additional Comments Regarding Data for Specific Material Types FY2014
Estimates of Connecticut Municipal Solid Waste (MSW) Generated, Disposed, and Recycled FY2014
Page 2 of 14
Estimates of Connecticut Municipal Solid Waste Generated (MSW), Disposed, and Recycled FY2014 Rev 2/23/2017
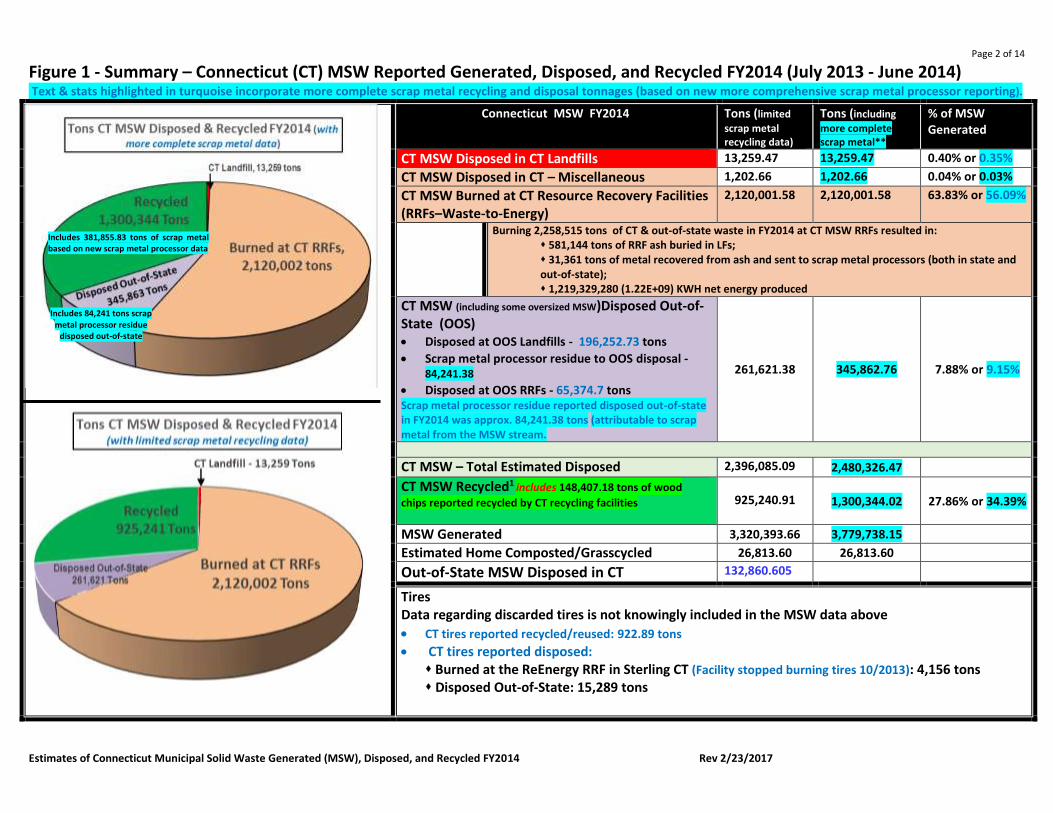
Figure 1 - Summary – Connecticut (CT) MSW Reported Generated, Disposed, and Recycled FY2014 (July 2013 - June 2014) Text & stats highlighted in turquoise incorporate more complete scrap metal recycling and disposal tonnages (based on new more comprehensive scrap metal processor reporting).
Connecticut MSW FY2014 Tons (limited
scrap metal recycling data)
Tons (including
more complete scrap metal**
% of MSW Generated
CT MSW Disposed in CT Landfills 13,259.47 13,259.47 0.40% or 0.35%
CT MSW Disposed in CT – Miscellaneous 1,202.66 1,202.66 0.04% or 0.03%
CT MSW Burned at CT Resource Recovery Facilities (RRFs–Waste-to-Energy)
2,120,001.58 2,120,001.58 63.83% or 56.09%
Burning 2,258,515 tons of CT & out-of-state waste in FY2014 at CT MSW RRFs resulted in: 581,144 tons of RRF ash buried in LFs; 31,361 tons of metal recovered from ash and sent to scrap metal processors (both in state and out-of-state); 1,219,329,280 (1.22E+09) KWH net energy produced
CT MSW (including some oversized MSW)Disposed Out-of-State (OOS) Disposed at OOS Landfills - 196,252.73 tons
Scrap metal processor residue to OOS disposal - 84,241.38
Disposed at OOS RRFs - 65,374.7 tons Scrap metal processor residue reported disposed out-of-state in FY2014 was approx. 84,241.38 tons (attributable to scrap metal from the MSW stream.
261,621.38 345,862.76 7.88% or 9.15%
CT MSW – Total Estimated Disposed 2,396,085.09 2,480,326.47
CT MSW Recycled1 includes 148,407.18 tons of wood
chips reported recycled by CT recycling facilities
925,240.91 1,300,344.02 27.86% or 34.39%
MSW Generated 3,320,393.66 3,779,738.15
Estimated Home Composted/Grasscycled 26,813.60 26,813.60
Out-of-State MSW Disposed in CT 132,860.605
Tires Data regarding discarded tires is not knowingly included in the MSW data above
CT tires reported recycled/reused: 922.89 tons CT tires reported disposed:
Burned at the ReEnergy RRF in Sterling CT (Facility stopped burning tires 10/2013): 4,156 tons
Disposed Out-of-State: 15,289 tons
Includes 381,855.83 tons of scrap metal based on new scrap metal processor data
Includes 84,241 tons scrap metal processor residue
disposed out-of-state
Page 3 of 14
Estimates of Connecticut Municipal Solid Waste Generated (MSW), Disposed, and Recycled FY2014 Rev 2/23/2017
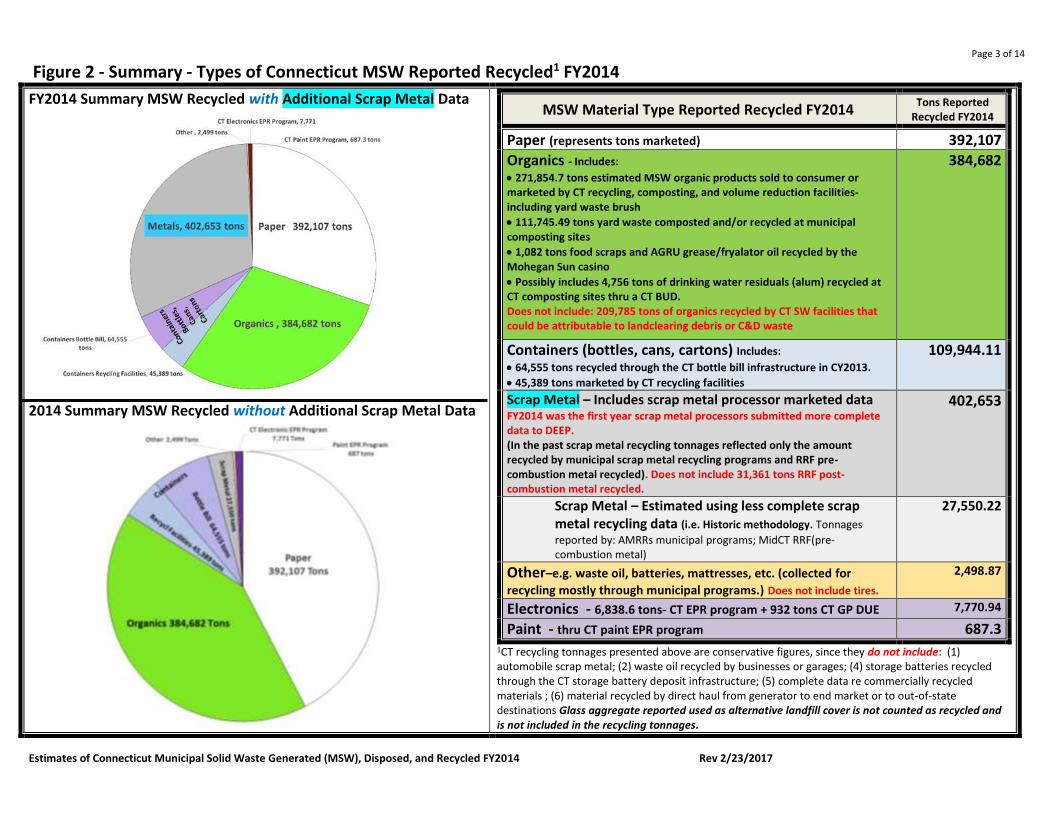
Figure 2 - Summary - Types of Connecticut MSW Reported Recycled1 FY2014
FY2014 Summary MSW Recycled with Additional Scrap Metal Data
2014 Summary MSW Recycled without Additional Scrap Metal Data
MSW Material Type Reported Recycled FY2014 Tons Reported
Recycled FY2014
Paper (represents tons marketed) 392,107
Organics - Includes:
271,854.7 tons estimated MSW organic products sold to consumer or marketed by CT recycling, composting, and volume reduction facilities- including yard waste brush
111,745.49 tons yard waste composted and/or recycled at municipal composting sites
1,082 tons food scraps and AGRU grease/fryalator oil recycled by the Mohegan Sun casino
Possibly includes 4,756 tons of drinking water residuals (alum) recycled at CT composting sites thru a CT BUD. Does not include: 209,785 tons of organics recycled by CT SW facilities that could be attributable to landclearing debris or C&D waste
384,682
Containers (bottles, cans, cartons) Includes:
64,555 tons recycled through the CT bottle bill infrastructure in CY2013.
45,389 tons marketed by CT recycling facilities
109,944.11
Scrap Metal – Includes scrap metal processor marketed data FY2014 was the first year scrap metal processors submitted more complete data to DEEP. (In the past scrap metal recycling tonnages reflected only the amount recycled by municipal scrap metal recycling programs and RRF pre-combustion metal recycled). Does not include 31,361 tons RRF post-combustion metal recycled.
402,653
Scrap Metal – Estimated using less complete scrap metal recycling data (i.e. Historic methodology. Tonnages
reported by: AMRRs municipal programs; MidCT RRF(pre-combustion metal)
27,550.22
Other–e.g. waste oil, batteries, mattresses, etc. (collected for
recycling mostly through municipal programs.) Does not include tires. 2,498.87
Electronics - 6,838.6 tons- CT EPR program + 932 tons CT GP DUE 7,770.94
Paint - thru CT paint EPR program 687.3 1CT recycling tonnages presented above are conservative figures, since they do not include: (1) automobile scrap metal; (2) waste oil recycled by businesses or garages; (4) storage batteries recycled through the CT storage battery deposit infrastructure; (5) complete data re commercially recycled materials ; (6) material recycled by direct haul from generator to end market or to out-of-state destinations Glass aggregate reported used as alternative landfill cover is not counted as recycled and is not included in the recycling tonnages.
Page 4 of 14
Estimates of Connecticut Municipal Solid Waste Generated (MSW), Disposed, and Recycled FY2014 Rev 2/23/2017
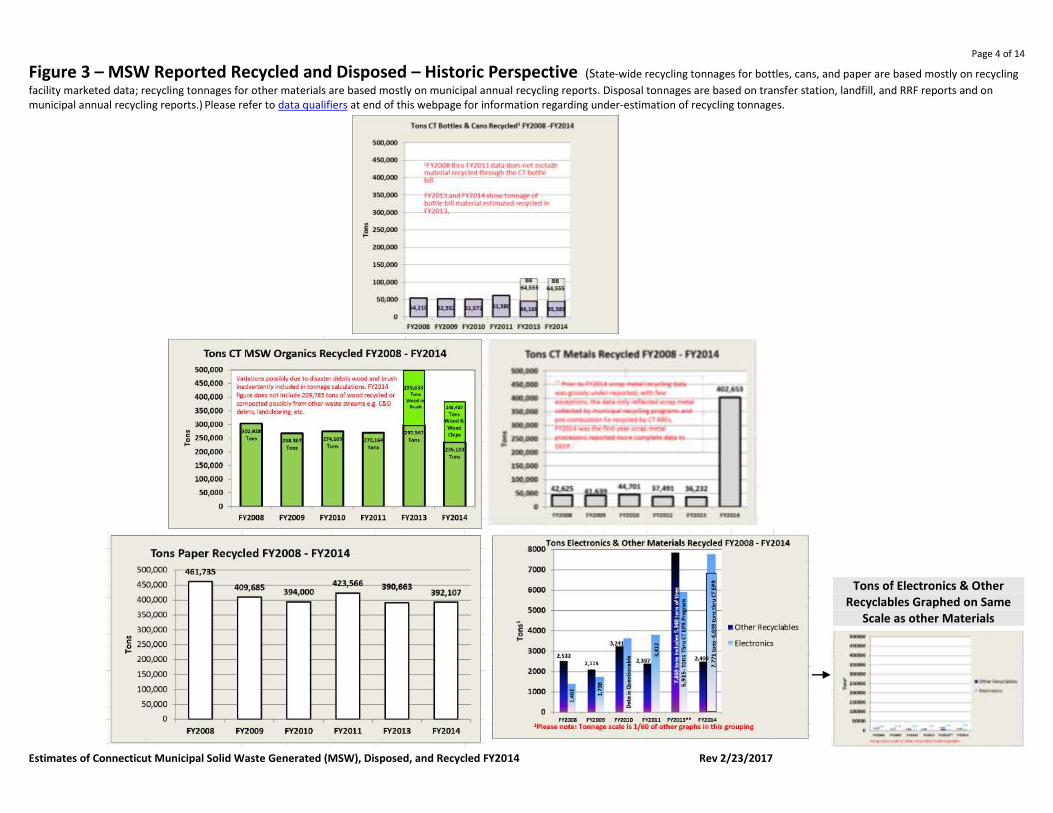
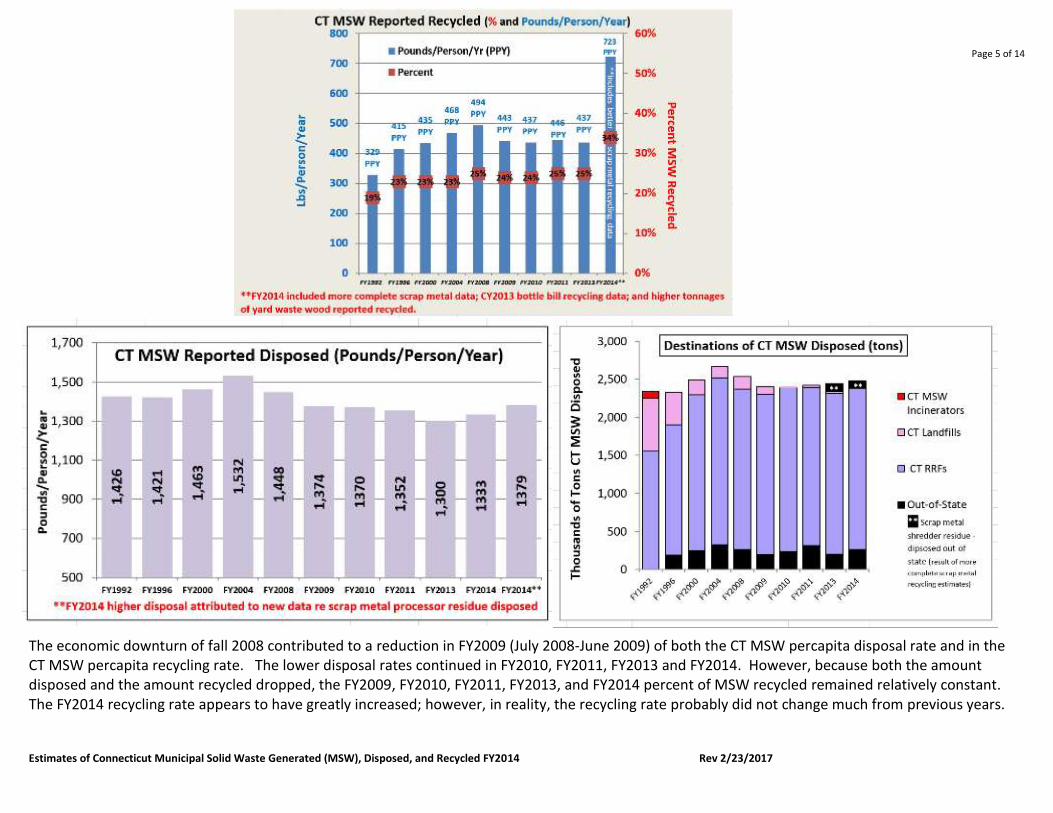
Figure 3 – MSW Reported Recycled and Disposed – Historic Perspective (State-wide recycling tonnages for bottles, cans, and paper are based mostly on recycling
facility marketed data; recycling tonnages for other materials are based mostly on municipal annual recycling reports. Disposal tonnages are based on transfer station, landfill, and RRF reports and on municipal annual recycling reports.) Please refer to data qualifiers at end of this webpage for information regarding under-estimation of recycling tonnages.
Tons of Electronics & Other Recyclables Graphed on Same
Scale as other Materials
Page 5 of 14
Estimates of Connecticut Municipal Solid Waste Generated (MSW), Disposed, and Recycled FY2014 Rev 2/23/2017
The economic downturn of fall 2008 contributed to a reduction in FY2009 (July 2008-June 2009) of both the CT MSW percapita disposal rate and in the CT MSW percapita recycling rate. The lower disposal rates continued in FY2010, FY2011, FY2013 and FY2014. However, because both the amount disposed and the amount recycled dropped, the FY2009, FY2010, FY2011, FY2013, and FY2014 percent of MSW recycled remained relatively constant. The FY2014 recycling rate appears to have greatly increased; however, in reality, the recycling rate probably did not change much from previous years.
Page 6 of 14
Estimates of Connecticut Municipal Solid Waste Generated (MSW), Disposed, and Recycled FY2014 Rev 2/23/2017
What did change was better reporting of scrap metal recycled (although still not complete) and variability in annual tons of organics composted or recycled. Factors related specifically to recent amounts of material recycled include the following:
Economic Factors o Prior to the 2008 economic downturn demand for finished product was at an all-time high and as a result, so was the demand for feedstock
(including recyclables) used to manufacture those products. Often manufacturers and paper mills were forced to accept poorly prepared recyclables in order to meet the increased demand for their products.
o In 2008, when the demand for finished product dropped due to the poor economy, manufacturers and paper mills (especially those in China) either stopped buying recyclables and/or became more selective about the quality of the recyclables they were purchasing. Recycling facilities that were churning out poorly processed recyclables could no longer market their material. Those recycling facilities that had maintained the quality of their recyclables during times of greater demand, were able to market their recyclables, albeit at a lower price.
o Other issues effecting the economics of recycling since 2011 include the increased contamination rate of bottles, cans and paper collected single stream, economic slowdown in China, a changing waste stream, and the devaluation of the Chinese currency.
Many recycling markets experienced a slight rebound in FY2010 and FY2011. However in FY2013 China implemented a program at Chinese ports known at “green fence” (see 2013 article in The Christian Science Monitor) and started rejecting loads of recyclables which contain unacceptable levels of contamination. This program has negatively impacted mainly those U.S. recycling processors which send a large percentage of their recyclables to China without really preparing the recyclables to meet market specifications. It remains to be seen how long operation green fence will continue and how that will affect the way recyclables are collected and processed in the U.S. (Waste & Recycling News 7/15/2013). It appears that China stepped up green fence type of inspections again in 2015.
Changing Nature of Waste Streams: Over the years the types of materials found in the U.S. MSW stream have evolved, in part due to cultural changes related to the types of media used to provide information, changes in packaging and marketing products, relocation of major manufacturing centers, etc.
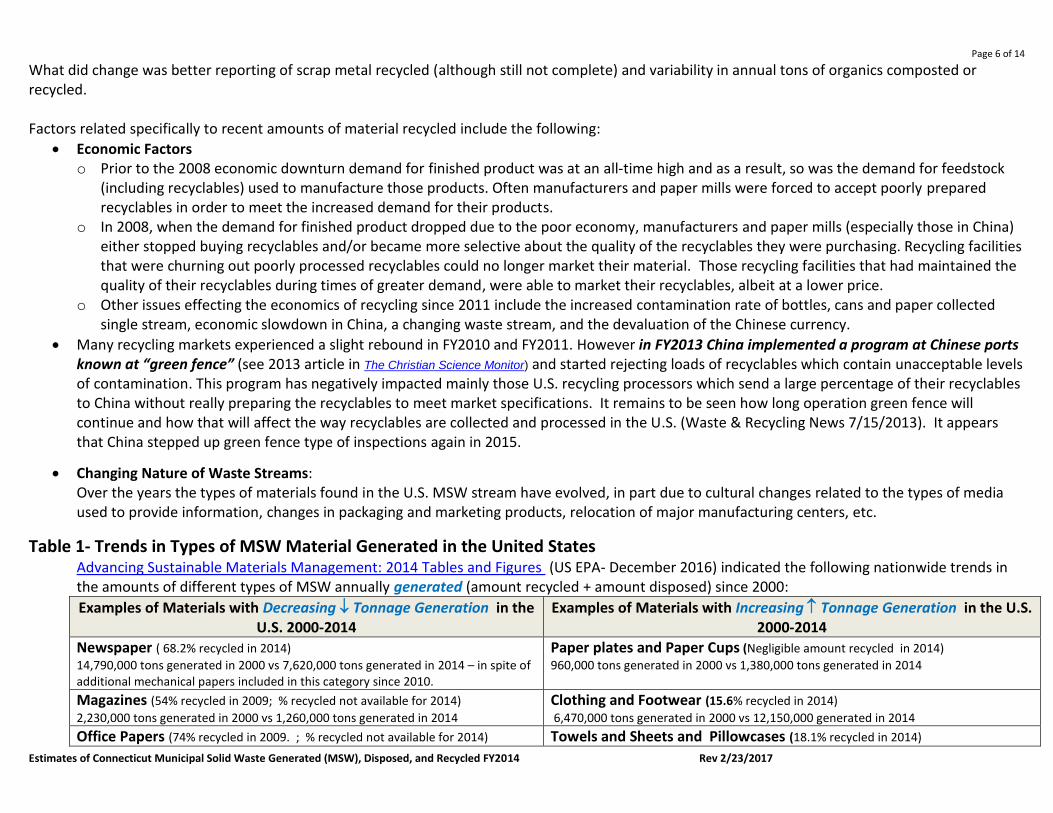
Table 1- Trends in Types of MSW Material Generated in the United States
Advancing Sustainable Materials Management: 2014 Tables and Figures (US EPA- December 2016) indicated the following nationwide trends in the amounts of different types of MSW annually generated (amount recycled + amount disposed) since 2000:
Examples of Materials with Decreasing Tonnage Generation in the U.S. 2000-2014
Examples of Materials with Increasing Tonnage Generation in the U.S. 2000-2014
Newspaper ( 68.2% recycled in 2014)
14,790,000 tons generated in 2000 vs 7,620,000 tons generated in 2014 – in spite of additional mechanical papers included in this category since 2010.
Paper plates and Paper Cups (Negligible amount recycled in 2014)
960,000 tons generated in 2000 vs 1,380,000 tons generated in 2014
Magazines (54% recycled in 2009; % recycled not available for 2014)
2,230,000 tons generated in 2000 vs 1,260,000 tons generated in 2014
Clothing and Footwear (15.6% recycled in 2014)
6,470,000 tons generated in 2000 vs 12,150,000 generated in 2014
Office Papers (74% recycled in 2009. ; % recycled not available for 2014) Towels and Sheets and Pillowcases (18.1% recycled in 2014)
Page 7 of 14
Estimates of Connecticut Municipal Solid Waste Generated (MSW), Disposed, and Recycled FY2014 Rev 2/23/2017
Examples of Materials with Decreasing Tonnage Generation in the U.S. 2000-2014
Examples of Materials with Increasing Tonnage Generation in the U.S. 2000-2014
7,420,000 tons generated in 2000 vs 4,530,000 generated in 2014 820,000 tons generated in 2000 vs 1,270,000 tons generated in 2014 (leveling off since 2010)
Standard Mail Papers (35.8 % recycled in 2005; % recycled not available for
2014) 5,570,000 tons generated in 2000 vs 4,050,000 tons generated in 2014
Plastic Packaging (14.8% recycled in 2014)
11,190,000 tons generated in 2000 vs 14,320,000 tons generated in 2014
Glass Packaging (32.5% recycled in 2014 – decreased from 2013)
11.040,000 tons generated in 2000 vs 9,200,000 tons generated in 2014 (leveling off since 2010)
Carpets and Rugs (5.6% recycled in 2014 - % recycled has decreased since 2000)
2,460,000 tons generated in 2000 vs 3,73,000 tons generated in 2014 (decrease from 2012 & 2013)
Food Scraps (5.1% recycled in 2014)
30,700,000 tons generated in 2000 vs 38,400,000 tons generated in 2014
Furniture and Furnishings (0.1% recycled in 2014) 8,120,000 tons generated in 2000 vs 11,860,000 tons generated in 2014
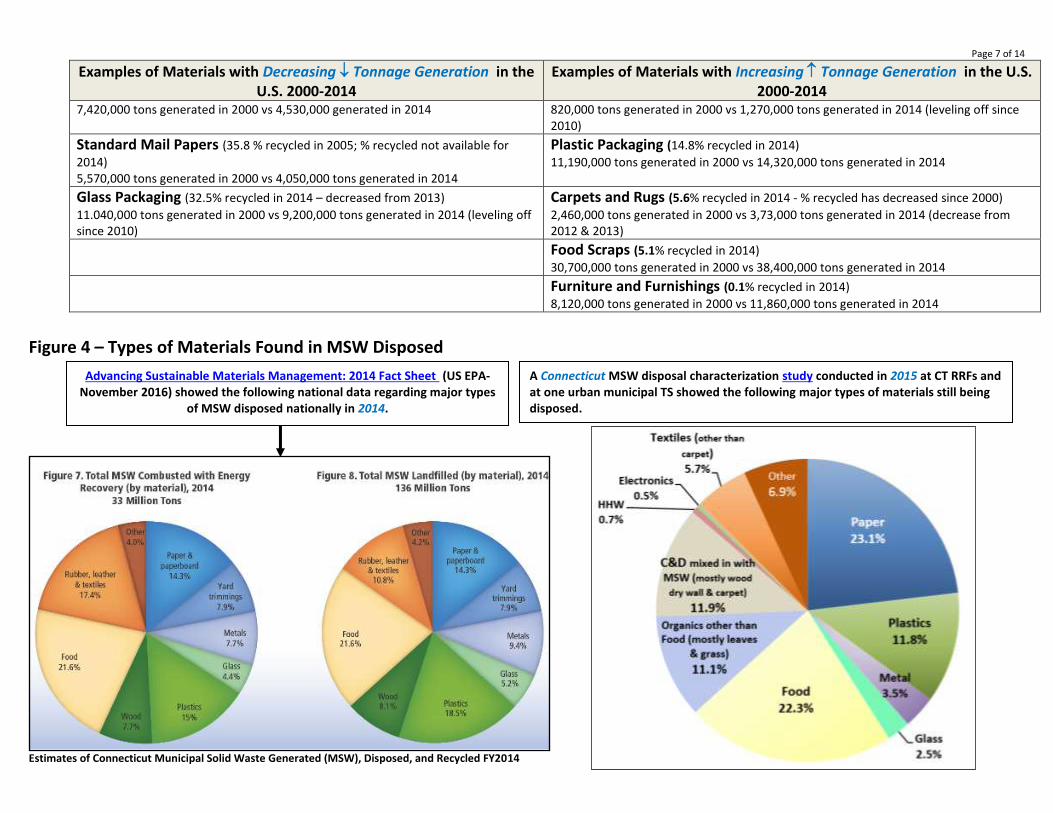
Figure 4 – Types of Materials Found in MSW Disposed
A Connecticut MSW disposal characterization study conducted in 2015 at CT RRFs and at one urban municipal TS showed the following major types of materials still being disposed.
Advancing Sustainable Materials Management: 2014 Fact Sheet (US EPA- November 2016) showed the following national data regarding major types
of MSW disposed nationally in 2014.
Page 8 of 14
Estimates of Connecticut Municipal Solid Waste Generated (MSW), Disposed, and Recycled FY2014 Rev 2/23/2017
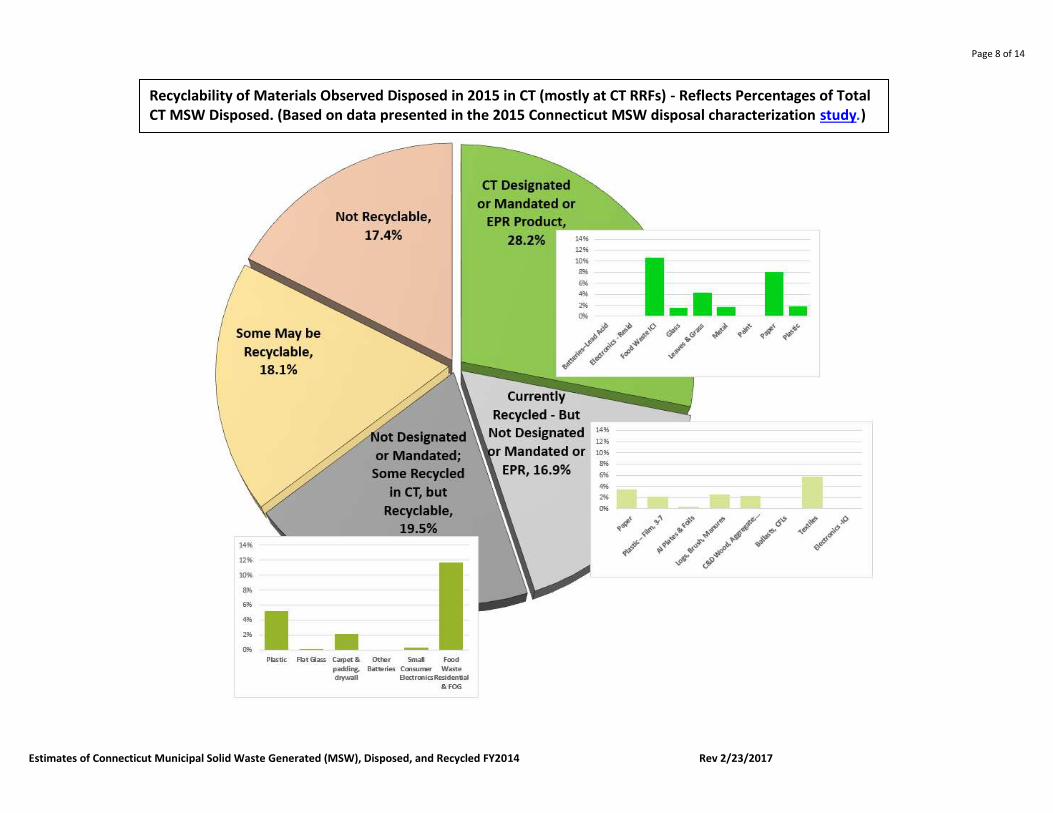
Recyclability of Materials Observed Disposed in 2015 in CT (mostly at CT RRFs) - Reflects Percentages of Total CT MSW Disposed. (Based on data presented in the 2015 Connecticut MSW disposal characterization study.)
Page 9 of 14
Estimates of Connecticut Municipal Solid Waste Generated (MSW), Disposed, and Recycled FY2014 Rev 2/23/2017
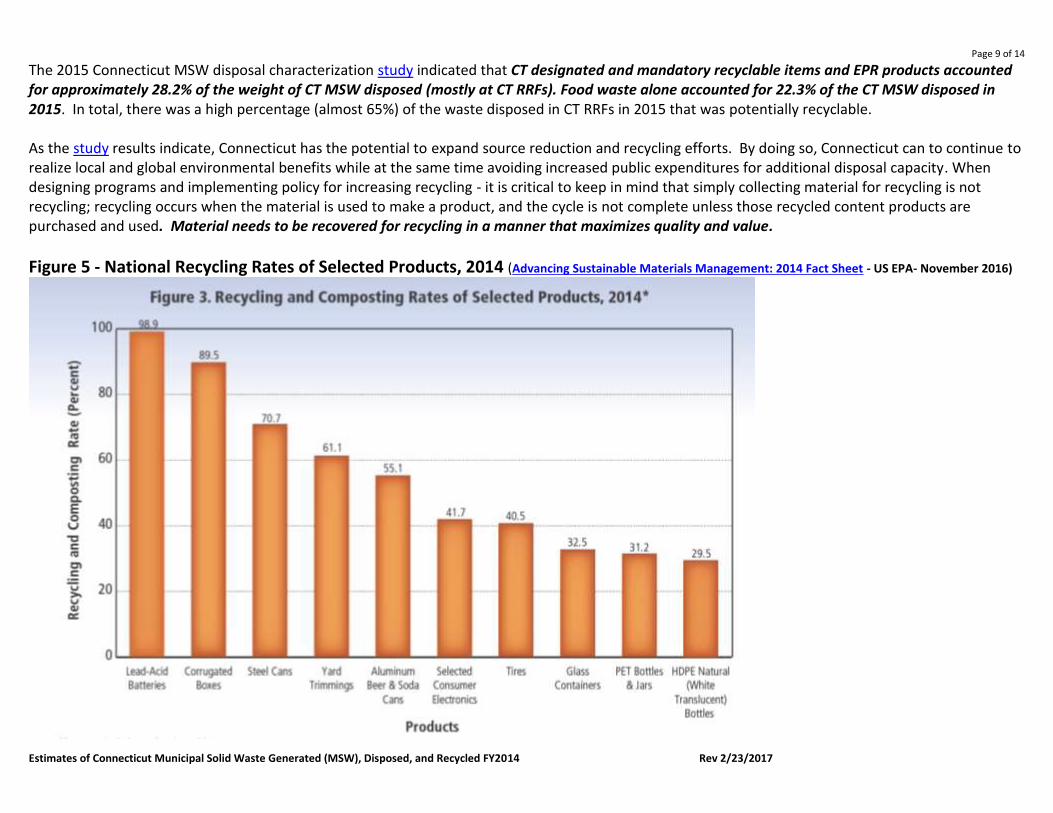
The 2015 Connecticut MSW disposal characterization study indicated that CT designated and mandatory recyclable items and EPR products accounted for approximately 28.2% of the weight of CT MSW disposed (mostly at CT RRFs). Food waste alone accounted for 22.3% of the CT MSW disposed in 2015. In total, there was a high percentage (almost 65%) of the waste disposed in CT RRFs in 2015 that was potentially recyclable. As the study results indicate, Connecticut has the potential to expand source reduction and recycling efforts. By doing so, Connecticut can to continue to realize local and global environmental benefits while at the same time avoiding increased public expenditures for additional disposal capacity. When designing programs and implementing policy for increasing recycling - it is critical to keep in mind that simply collecting material for recycling is not recycling; recycling occurs when the material is used to make a product, and the cycle is not complete unless those recycled content products are purchased and used. Material needs to be recovered for recycling in a manner that maximizes quality and value.
Figure 5 - National Recycling Rates of Selected Products, 2014 (Advancing Sustainable Materials Management: 2014 Fact Sheet - US EPA- November 2016)
Page 10 of 14
Estimates of Connecticut Municipal Solid Waste Generated (MSW), Disposed, and Recycled FY2014 Rev 2/23/2017
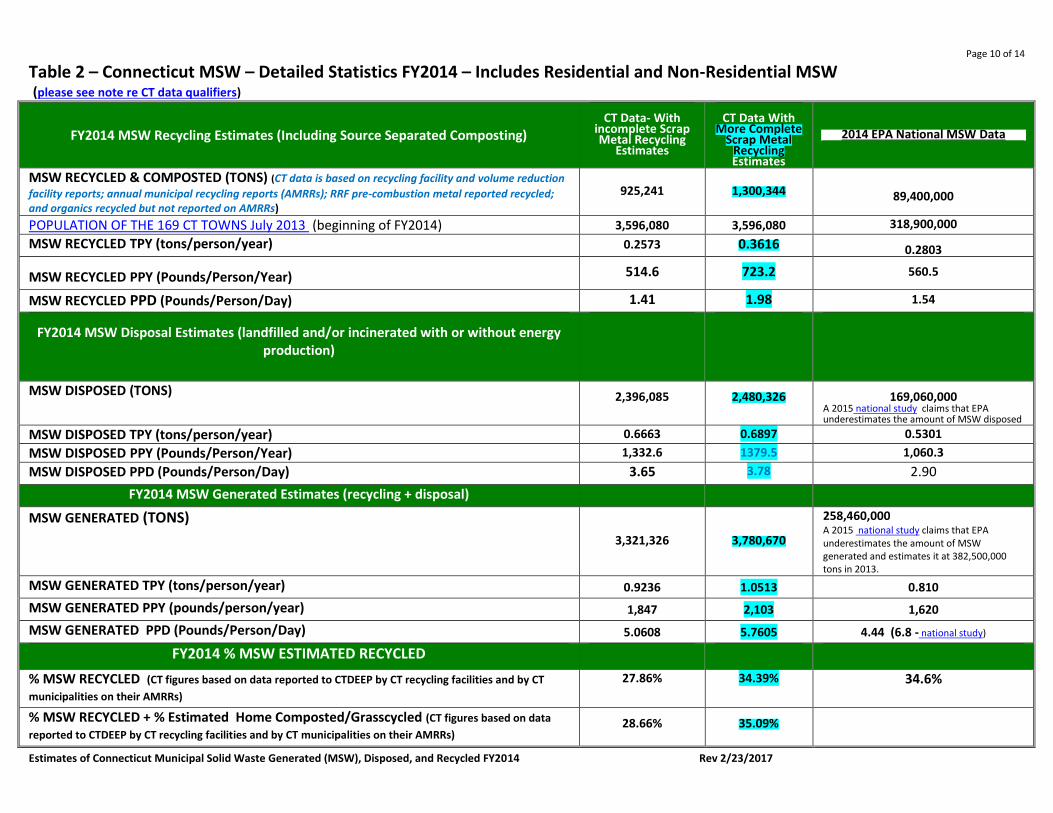
Table 2 – Connecticut MSW – Detailed Statistics FY2014 – Includes Residential and Non-Residential MSW (please see note re CT data qualifiers)
FY2014 MSW Recycling Estimates (Including Source Separated Composting)
CT Data- With
incomplete Scrap Metal Recycling
Estimates
CT Data With
More Complete Scrap Metal
Recycling Estimates
2014 EPA National MSW Data
MSW RECYCLED & COMPOSTED (TONS) (CT data is based on recycling facility and volume reduction
facility reports; annual municipal recycling reports (AMRRs); RRF pre-combustion metal reported recycled; and organics recycled but not reported on AMRRs)
925,241 1,300,344 89,400,000
POPULATION OF THE 169 CT TOWNS July 2013 (beginning of FY2014) 3,596,080 3,596,080 318,900,000
MSW RECYCLED TPY (tons/person/year) 0.2573 0.3616 0.2803
MSW RECYCLED PPY (Pounds/Person/Year) 514.6 723.2 560.5
MSW RECYCLED PPD (Pounds/Person/Day) 1.41 1.98 1.54
FY2014 MSW Disposal Estimates (landfilled and/or incinerated with or without energy
production)
MSW DISPOSED (TONS) 2,396,085
2,480,326
169,060,000
A 2015 national study claims that EPA underestimates the amount of MSW disposed
MSW DISPOSED TPY (tons/person/year) 0.6663 0.6897 0.5301
MSW DISPOSED PPY (Pounds/Person/Year) 1,332.6 1379.5 1,060.3
MSW DISPOSED PPD (Pounds/Person/Day) 3.65 3.78 2.90
FY2014 MSW Generated Estimates (recycling + disposal)
MSW GENERATED (TONS) 3,321,326 3,780,670
258,460,000 A 2015 national study claims that EPA underestimates the amount of MSW generated and estimates it at 382,500,000 tons in 2013.
MSW GENERATED TPY (tons/person/year) 0.9236 1.0513 0.810
MSW GENERATED PPY (pounds/person/year) 1,847 2,103 1,620
MSW GENERATED PPD (Pounds/Person/Day) 5.0608 5.7605 4.44 (6.8 - national study)
FY2014 % MSW ESTIMATED RECYCLED
% MSW RECYCLED (CT figures based on data reported to CTDEEP by CT recycling facilities and by CT
municipalities on their AMRRs) 27.86% 34.39% 34.6%
% MSW RECYCLED + % Estimated Home Composted/Grasscycled (CT figures based on data
reported to CTDEEP by CT recycling facilities and by CT municipalities on their AMRRs)
28.66%
35.09%
Page 11 of 14
Estimates of Connecticut Municipal Solid Waste Generated (MSW), Disposed, and Recycled FY2014 Rev 2/23/2017
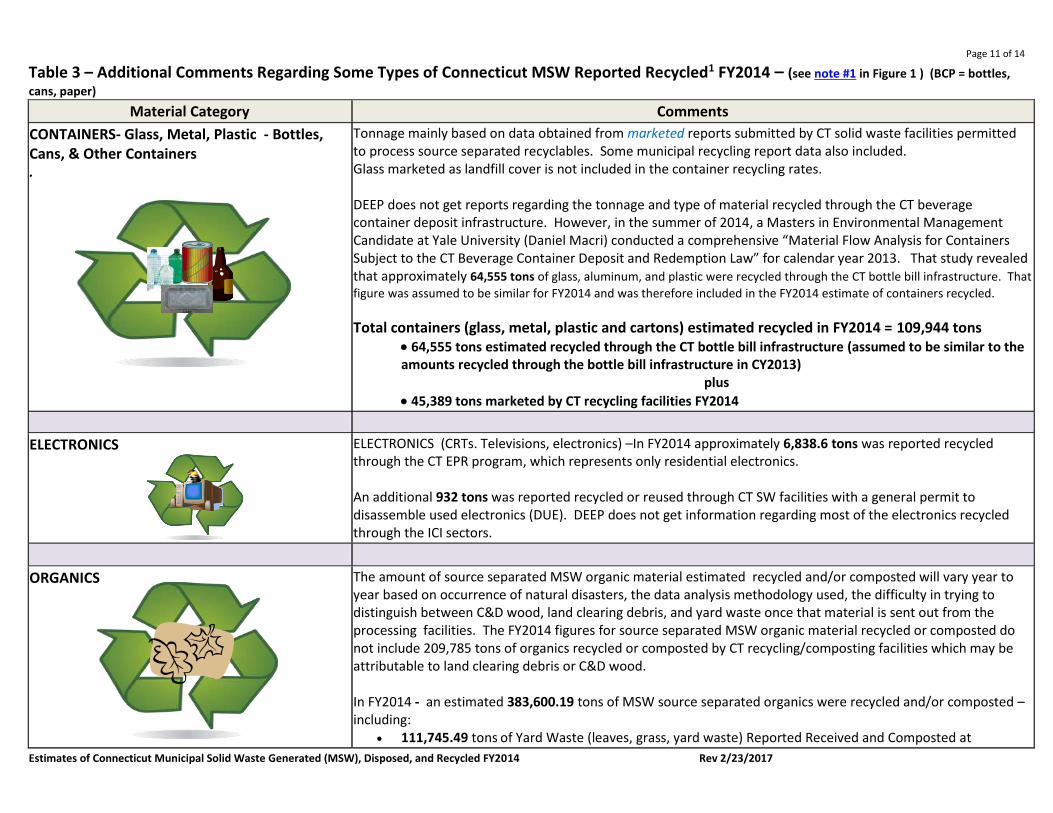
Table 3 – Additional Comments Regarding Some Types of Connecticut MSW Reported Recycled1 FY2014 – (see note #1 in Figure 1 ) (BCP = bottles,
cans, paper) Material Category Comments
CONTAINERS- Glass, Metal, Plastic - Bottles, Cans, & Other Containers .
Tonnage mainly based on data obtained from marketed reports submitted by CT solid waste facilities permitted to process source separated recyclables. Some municipal recycling report data also included. Glass marketed as landfill cover is not included in the container recycling rates. DEEP does not get reports regarding the tonnage and type of material recycled through the CT beverage container deposit infrastructure. However, in the summer of 2014, a Masters in Environmental Management Candidate at Yale University (Daniel Macri) conducted a comprehensive “Material Flow Analysis for Containers Subject to the CT Beverage Container Deposit and Redemption Law” for calendar year 2013. That study revealed that approximately 64,555 tons of glass, aluminum, and plastic were recycled through the CT bottle bill infrastructure. That
figure was assumed to be similar for FY2014 and was therefore included in the FY2014 estimate of containers recycled.
Total containers (glass, metal, plastic and cartons) estimated recycled in FY2014 = 109,944 tons 64,555 tons estimated recycled through the CT bottle bill infrastructure (assumed to be similar to the amounts recycled through the bottle bill infrastructure in CY2013)
plus
45,389 tons marketed by CT recycling facilities FY2014
ELECTRONICS ELECTRONICS (CRTs. Televisions, electronics) –In FY2014 approximately 6,838.6 tons was reported recycled through the CT EPR program, which represents only residential electronics. An additional 932 tons was reported recycled or reused through CT SW facilities with a general permit to disassemble used electronics (DUE). DEEP does not get information regarding most of the electronics recycled through the ICI sectors.
ORGANICS
The amount of source separated MSW organic material estimated recycled and/or composted will vary year to year based on occurrence of natural disasters, the data analysis methodology used, the difficulty in trying to distinguish between C&D wood, land clearing debris, and yard waste once that material is sent out from the processing facilities. The FY2014 figures for source separated MSW organic material recycled or composted do not include 209,785 tons of organics recycled or composted by CT recycling/composting facilities which may be attributable to land clearing debris or C&D wood. In FY2014 - an estimated 383,600.19 tons of MSW source separated organics were recycled and/or composted – including:
111,745.49 tons of Yard Waste (leaves, grass, yard waste) Reported Received and Composted at
Page 12 of 14
Estimates of Connecticut Municipal Solid Waste Generated (MSW), Disposed, and Recycled FY2014 Rev 2/23/2017
Material Category Comments
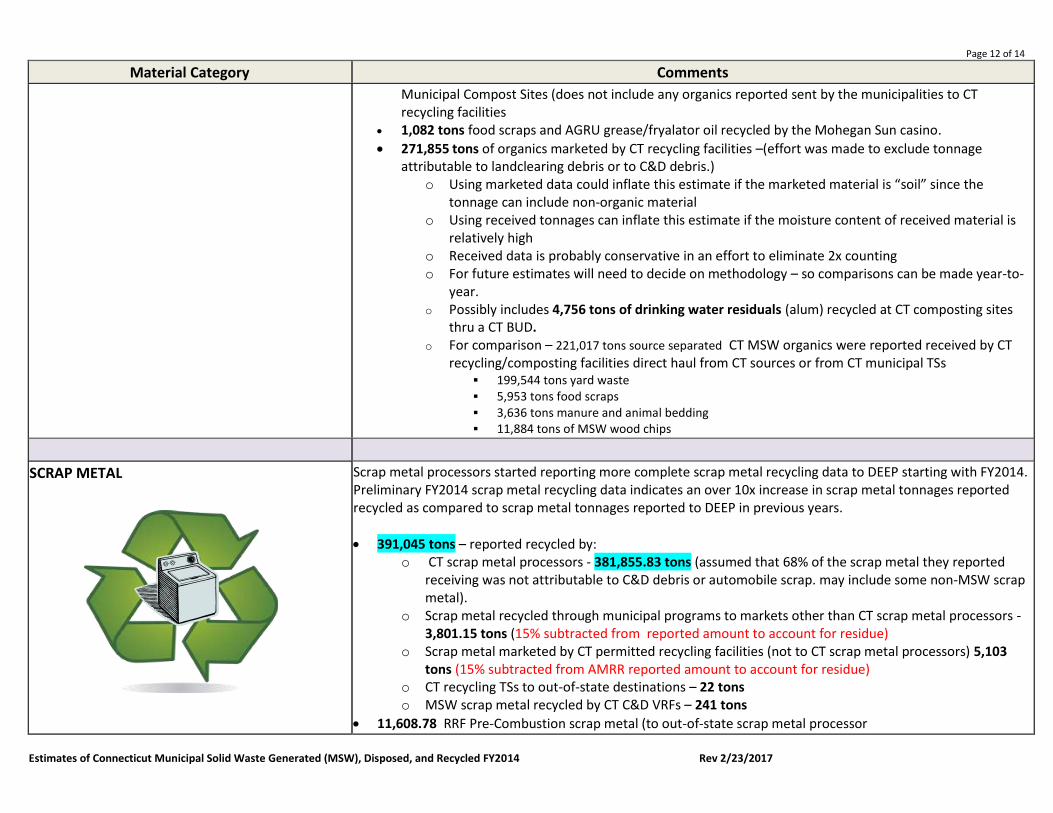
Municipal Compost Sites (does not include any organics reported sent by the municipalities to CT recycling facilities
1,082 tons food scraps and AGRU grease/fryalator oil recycled by the Mohegan Sun casino.
271,855 tons of organics marketed by CT recycling facilities –(effort was made to exclude tonnage attributable to landclearing debris or to C&D debris.)
o Using marketed data could inflate this estimate if the marketed material is “soil” since the tonnage can include non-organic material
o Using received tonnages can inflate this estimate if the moisture content of received material is relatively high
o Received data is probably conservative in an effort to eliminate 2x counting o For future estimates will need to decide on methodology – so comparisons can be made year-to-
year. o Possibly includes 4,756 tons of drinking water residuals (alum) recycled at CT composting sites
thru a CT BUD. o For comparison – 221,017 tons source separated CT MSW organics were reported received by CT
recycling/composting facilities direct haul from CT sources or from CT municipal TSs
199,544 tons yard waste 5,953 tons food scraps
3,636 tons manure and animal bedding
11,884 tons of MSW wood chips
SCRAP METAL
Scrap metal processors started reporting more complete scrap metal recycling data to DEEP starting with FY2014. Preliminary FY2014 scrap metal recycling data indicates an over 10x increase in scrap metal tonnages reported recycled as compared to scrap metal tonnages reported to DEEP in previous years.
391,045 tons – reported recycled by: o CT scrap metal processors - 381,855.83 tons (assumed that 68% of the scrap metal they reported
receiving was not attributable to C&D debris or automobile scrap. may include some non-MSW scrap metal).
o Scrap metal recycled through municipal programs to markets other than CT scrap metal processors - 3,801.15 tons (15% subtracted from reported amount to account for residue)
o Scrap metal marketed by CT permitted recycling facilities (not to CT scrap metal processors) 5,103 tons (15% subtracted from AMRR reported amount to account for residue)
o CT recycling TSs to out-of-state destinations – 22 tons o MSW scrap metal recycled by CT C&D VRFs – 241 tons
11,608.78 RRF Pre-Combustion scrap metal (to out-of-state scrap metal processor
Page 13 of 14
Estimates of Connecticut Municipal Solid Waste Generated (MSW), Disposed, and Recycled FY2014 Rev 2/23/2017
QUALIFIERS FOR DATA USED TO CALCULATE CONNECTICUT MSW RECYCLING, DISPOSAL, GENERATION RATES Recycling Data Qualifiers: Recycling data is based on information provided on: quarterly reports submitted to the CTDEEP by CT solid waste facilities permitted to process source separated recyclable items
and CT regional solid waste transfer stations permitted to transfer recyclables, and the annual municipal recycling reports (AMRRs) submitted to the CTDEEP.
The tonnage of leaves or other yard waste recorded as being recycled at municipal sites is usually estimated on the basis of cubic yards. The reliability of the conversion factor may be affected by the moisture content of the leaves and other material.
An estimate of the amount of yard waste and food waste backyard composted and the amount of grass “grasscycled” is based on descriptions in the AMRRs of municipal or regional programs to promote those activities.
Estimated tonnages of glass, metal, and plastic beverage containers recycled through the Connecticut bottle deposit law infrastructure was based on a CY2013 study conducted by
a Yale FES graduate student (i.e. a masters in environmental management candidate). CT scrap metal processors started reporting more complete scrap metal recycling data to the CT DEEP in FY2014. The tables above include preliminary FY2014 data which does not
knowingly include automobile scrap metal or C&D scrap metal. However, the data reported to DEEP needs to be vetted to assess its degree of accuracy.
The following recycling tonnages are not included in the data presented above with the exception of tonnages included in the annual municipal recycling reports (AMRRs): o Waste oil recycled by businesses or garages; o Most of the storage batteries which are recycled through the Connecticut storage battery deposit infrastructure; o Material backhauled by retail chains to out-of-state distribution centers for recycling or other recyclable material which does not pass through a permitted CT solid waste
facility o Textiles recycled through charitable organizations
The amount of yard waste, leaves, food waste recycled or composted was estimated using municipal and SW facility data.
The amount of mattress material, tires, bottles, cans, and paper recycled was estimated using tonnage reported marketed to brokers, beneficiators, secondary recycling processing facilities, or end users by Connecticut recycling processing facilities.
It is important to note that the recycling data reported to DEEP does not necessarily reflect the amount actually used to make products. For example, the amount of residue generated at and disposed by secondary processing facilities (e.g. glass beneficiators, secondary plastic recyclers -PRFs) and the amount of residue and unusable materials disposed by end users (e.g. paper mills or other manufactures) is not reflected in the recycling statistics.
Material used as alternative daily landfill cover material is not knowingly included in the recycling statistics.
Material (other than waste oil) burned for energy is not considered recycled. MSW Disposal Data Qualifiers
Disposal data is based on information provided on quarterly reports submitted to the CTDEEP by Connecticut permitted solid waste facilities including resource recovery facilities (waste-to-energy facilities), landfills, solid waste transfer stations, recycling facilities (residue), C&D VRPs (MSW separated out from C&D waste and disposed), and annual municipal recycling reports submitted to the CTDEEP.
As of July 31, 2011 data regarding MSW hauled directly out-of-state for disposal is now required to be reported to municipalities and to the CTDEEP by collectors hauling such MSW. However, compliance with that reporting requirement is poor. Therefore, there may be additional tonnages of MSW disposed that is not included in the CT MSW statistics.
Tonnages of MSW disposed do not always include the tonnage of disposed bulky MSW (furniture, carpets, etc.) which is often reported to the CTDEEP as "bulky waste" or as “construction and demolition (C&D)” waste. It is anticipated that in future reporting – the term “bulky waste” will be replaced by more specific waste categories such as: “Construction and Demolition Waste”; “Oversized MSW” (furniture, carpets, mattresses, etc.); “Landclearing” debris (logs and stumps); and “Yard Waste”.
MSW disposal figures represent residential and non-residential disposal.