estcp cost and performance report... · sop standard operating procedure ... when management is...
TRANSCRIPT
ESTCPCost and Performance Report
ENVIRONMENTAL SECURITYTECHNOLOGY CERTIFICATION PROGRAM
U.S. Department of Defense
(ER-0222)
BIOAVAILABILITY OF LEAD IN SMALL ARMS RANGE SOILS
August 2009
i
COST & PERFORMANCE REPORT ESTCP Project: ER-0222
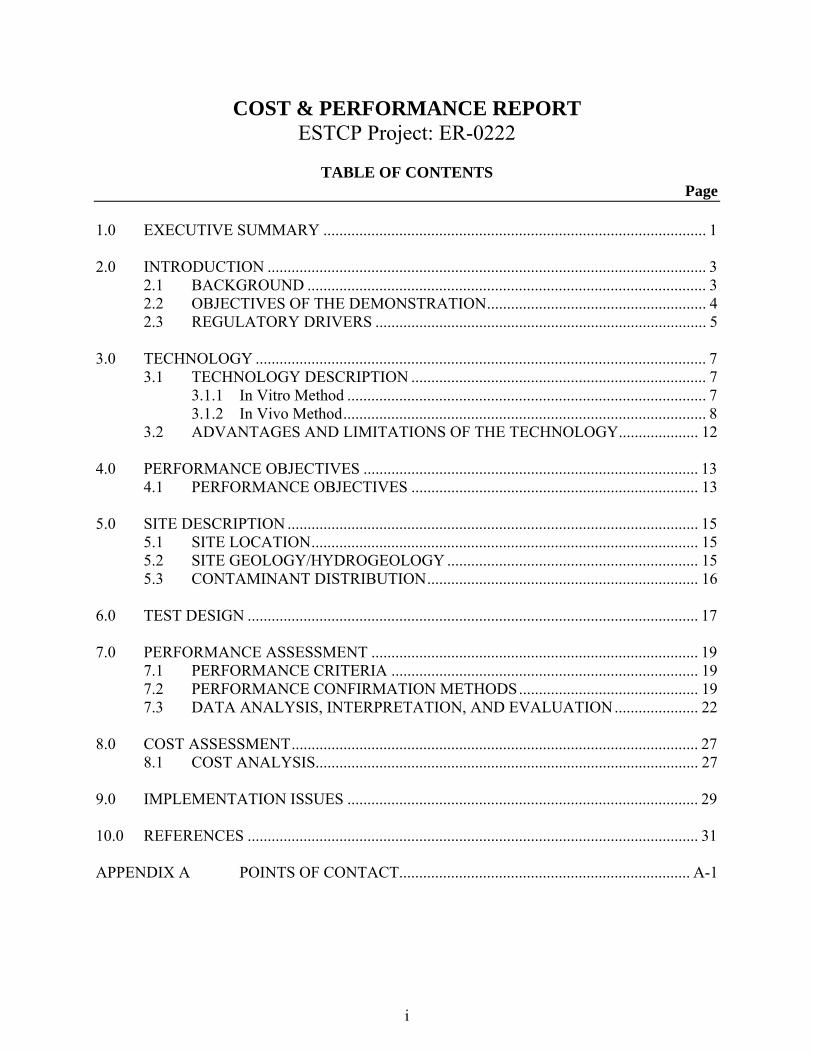
TABLE OF CONTENTS
Page 1.0 EXECUTIVE SUMMARY ................................................................................................ 1 2.0 INTRODUCTION .............................................................................................................. 3
2.1 BACKGROUND .................................................................................................... 3 2.2 OBJECTIVES OF THE DEMONSTRATION....................................................... 4 2.3 REGULATORY DRIVERS ................................................................................... 5
3.0 TECHNOLOGY ................................................................................................................. 7
3.1 TECHNOLOGY DESCRIPTION .......................................................................... 7 3.1.1 In Vitro Method .......................................................................................... 7 3.1.2 In Vivo Method........................................................................................... 8
3.2 ADVANTAGES AND LIMITATIONS OF THE TECHNOLOGY.................... 12 4.0 PERFORMANCE OBJECTIVES .................................................................................... 13
4.1 PERFORMANCE OBJECTIVES ........................................................................ 13 5.0 SITE DESCRIPTION ....................................................................................................... 15
5.1 SITE LOCATION................................................................................................. 15 5.2 SITE GEOLOGY/HYDROGEOLOGY ............................................................... 15 5.3 CONTAMINANT DISTRIBUTION.................................................................... 16
6.0 TEST DESIGN ................................................................................................................. 17 7.0 PERFORMANCE ASSESSMENT .................................................................................. 19
7.1 PERFORMANCE CRITERIA ............................................................................. 19 7.2 PERFORMANCE CONFIRMATION METHODS............................................. 19 7.3 DATA ANALYSIS, INTERPRETATION, AND EVALUATION..................... 22
8.0 COST ASSESSMENT...................................................................................................... 27
8.1 COST ANALYSIS................................................................................................ 27 9.0 IMPLEMENTATION ISSUES ........................................................................................ 29 10.0 REFERENCES ................................................................................................................. 31
APPENDIX A POINTS OF CONTACT......................................................................... A-1
ii
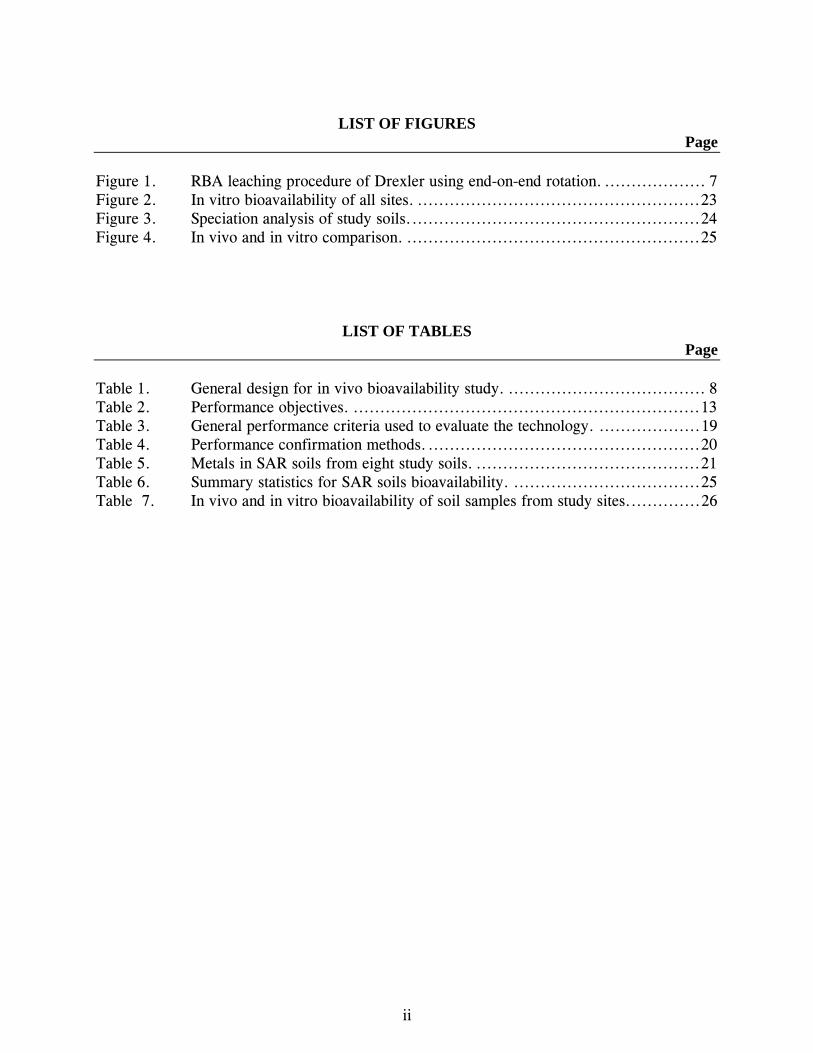
LIST OF FIGURES
Page Figure 1. RBA leaching procedure of Drexler using end-on-end rotation. ................... 7 Figure 2. In vitro bioavailability of all sites. .....................................................23 Figure 3. Speciation analysis of study soils.......................................................24 Figure 4. In vivo and in vitro comparison. .......................................................25
LIST OF TABLES Page Table 1. General design for in vivo bioavailability study. ..................................... 8 Table 2. Performance objectives. .................................................................13 Table 3. General performance criteria used to evaluate the technology. ...................19 Table 4. Performance confirmation methods. ...................................................20 Table 5. Metals in SAR soils from eight study soils. ..........................................21 Table 6. Summary statistics for SAR soils bioavailability. ...................................25 Table 7. In vivo and in vitro bioavailability of soil samples from study sites..............26
iii
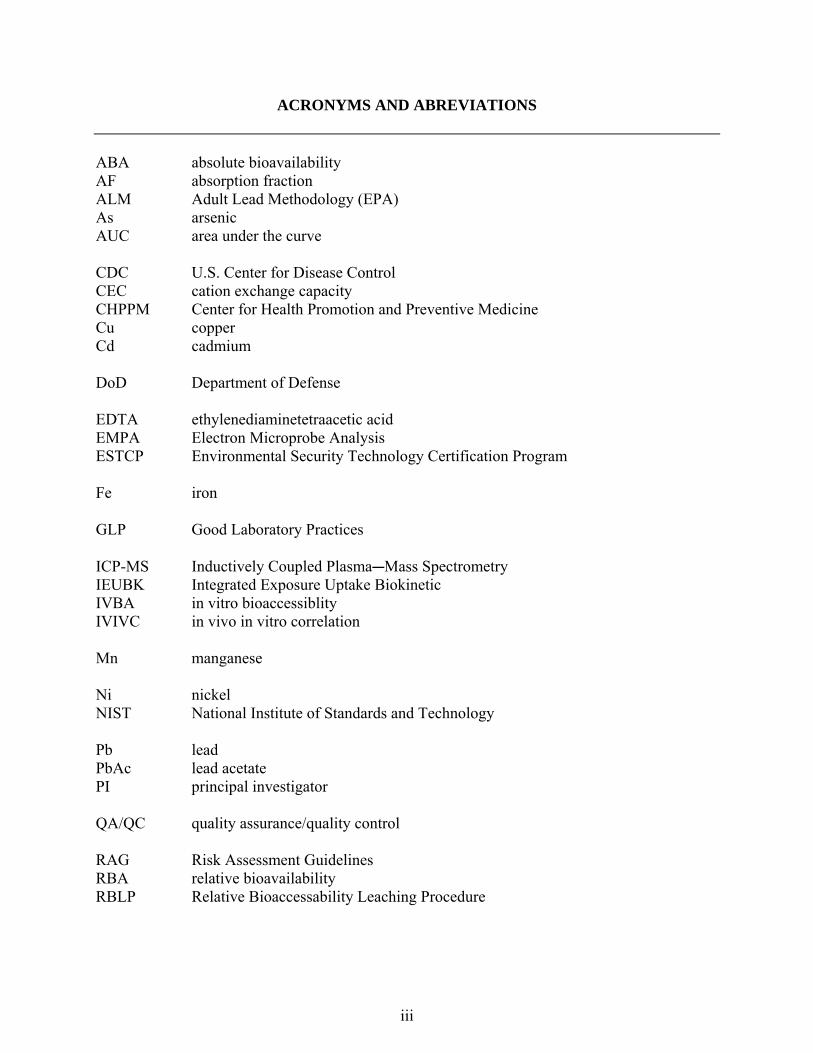
ACRONYMS AND ABREVIATIONS
ABA absolute bioavailability AF absorption fraction ALM Adult Lead Methodology (EPA) As arsenic AUC area under the curve CDC U.S. Center for Disease Control CEC cation exchange capacity CHPPM Center for Health Promotion and Preventive Medicine Cu copper Cd cadmium DoD Department of Defense EDTA ethylenediaminetetraacetic acid EMPA Electron Microprobe Analysis ESTCP Environmental Security Technology Certification Program Fe iron GLP Good Laboratory Practices ICP-MS Inductively Coupled PlasmaCMass Spectrometry IEUBK Integrated Exposure Uptake Biokinetic IVBA in vitro bioaccessiblity IVIVC in vivo in vitro correlation Mn manganese Ni nickel NIST National Institute of Standards and Technology Pb lead PbAc lead acetate PI principal investigator QA/QC quality assurance/quality control RAG Risk Assessment Guidelines RBA relative bioavailability RBLP Relative Bioaccessability Leaching Procedure
iv
ACRONYMS AND ABREVIATIONS (continued)
SAR small arms range Sb antimony Si silicon SOP standard operating procedure Ti titanium TOC total organic carbon USEPA U.S. Environmental Protection Agency XRF X-ray fluorescence Zn zinc Zr zirconium
1
1.0 EXECUTIVE SUMMARY
Ammunition manufacture is the second largest consumer of lead (Pb) in the United States after Pb acid batteries and represents approximately 80,000 metric tons per year. About 3000 small arms ranges (SAR) exist, the berms of which act as reservoirs for spent ammunition, and the Department of Defense (DoD) has a vested interest in monitoring the status of these sites so that military personnel may continue to be trained in a sustainable environment. Risk management of Pb at SARs depends on the site end use, whether the range is open or closed, and whether the risk drivers are human or ecologic. The U.S. Environmental Protection Agency’s (USEPA) risk assessment guidelines (RAG) allow for applications of site-specific bioavailability for Pb, where this bioavailability differs from the assumed default of 60%. Assessing the site-specific bioavailability of Pb has historically been carried out using the in vivo juvenile swine model, but significant reduction in cost and time could be achieved by using less expensive, less technical, and less time consuming in vitro models. This study compared bioavailability of Pb from SAR soils from eight different sites, using both an established in vivo and in vitro method. The in vivo method was based on the measured absorption of soil-Pb (compared to Pb acetate) by swine dosed daily for 14 days, using the ratio of the blood dose-response slopes for each compound. For the in vitro method, Pb was extracted from an aliquot of soil for 1 hour at 37ºC using glycine-HCl buffer at pH 1.5. The extractable Pb was expressed as a percentage of the total Pb in the sample. The initial aims of the study were to compare a projected range of bioavailability in a range of soils, creating a linear comparison between both methods. However, all eight soils carefully selected for testing were determined to have high bioavailability, regardless of source, pH, cation exchange capacity (CEC), or organic matter. The mean in vivo and in vitro bioavailability results were 107 ± 18% and 95 ± 6%, respectively, indicating a high degree of concordance in spite of the widely different methods. This indicates that the in vitro method is a good predictor of the in vivo results, further strengthening the existing data for correlation between these two methods. Furthermore, speciation analysis showed that Pb in these eight soils existed predominantly as Pb carbonate or oxide, compounds with known high bioavailability. An additional 20 SAR soils from across the United States, screened using only the in vitro method also had high bioavailability (91 ± 11%), leading to the overall conclusion that Pb at the majority of SARs has high bioavailability.

This page left blank intentionally.
3
2.0 INTRODUCTION
2.1 BACKGROUND
The annual consumption of lead (Pb) in the United States varies between 1.5 and 2 million metric tons, which represents approximately 10-15 pounds of Pb per person per year. Storage batteries consume 80% of this total, while ammunition accounts for about 4%, or 80,000 metric tons per year (Smith, 1998). Whereas Pb in storage batteries can be directed to recycling, Pb in spent bullets ultimately ends up in soil at the 3000 or so small arms ranges (SAR) used by the Department of Defense (DoD) or in the 9000 nonmilitary ranges thought to be in use (USEPA, 2005). For the DoD, federal agencies, and state bodies, these SAR soils represent significant efforts in stewardship, environmental risk assessment, and remediation, so that military personnel and civilian police can continue to be trained in a sustainable environment. Pb in ammunition can be in the form of Pb shot, copper jacketed bullets (80% Pb) or to a lesser extent in Pb compounds used as primers. Three general phases of Pb can be identified at firing rangesCfirst, when spent copper-jacketed bullets on the soil remain relatively intact and filled with metallic Pb; second, when bullets have broken up on impact into smaller Pb particles, and the third, where physical and chemical weathering over time has generated oxidized forms of Pb, such as Pb carbonate or Pb oxide, which are then bound to or sequestered by soil particles. All three phases of Pb exist at SAR soils, though with time there is a gradual oxidation from metallic Pb to chemical forms that are available to biota, a process that has been estimated to take hundreds of years (Jorgensen, 1987). At pH values of approximately 7.0, compounds of Pb in soils are adsorbed onto mineral phases or, in the case of high concentrations, precipitated out as carbonates or oxides (Cao, et al., 2003). Risk assessment at DoD sites that include SARs is carried out on a case-by-case basis, depending on the intended final use of the site (residential, brown field, continuing range) and whether human or ecological receptors are affected. Chemical forms of Pb have been shown to be relatively immobile in soils, assuming that pH values are not low. Unless specific sensitive species can be identified, human rather than ecological risk assessment drives the process, using tools such as the Integrated Exposure Uptake Biokinetic (IEUBK) model, which predicts population blood Pbs as a function of diet, soil, and water. When management is required, U.S. Environmental Protection Agency (USEPA) residential standards for Pb in soil are preferred by DoD risk assessors for cleanup, regardless of the end use. The IEUBK model contains a default relative bioavailability (RBA) term that estimates the fraction of Pb that will enter systematic circulation. However, it has been recognized by the EPA that site-specific bioavailability can be applied when there is evidence that bioavailability significantly differs from the default. Knowledge of Pb bioavailability is important because the amount of Pb that actually enters the body from an ingested medium depends on the physical-chemical properties of the Pb and of the medium. For example, Pb in soil may exist, at least in part, as poorly water-soluble minerals, and may also exist inside particles of inert matrix such as rock or slag of variable size, shape, and association; these chemical and physical properties may influence the absorption (bioavailability) of Pb when ingested. Thus, equal ingested doses of different forms of Pb in different media may not be of equal health concern. Bioavailability is normally described as the fraction or percentage of a chemical that is absorbed by the body following an exposure of a specified
4
amount, duration, and route (usually oral). Bioavailability of Pb in a particular medium may be expressed either in absolute terms (absolute bioavailability [ABA]) or in relative terms (RBA). ABA is the ratio of the amount of Pb absorbed compared to the amount ingested:
ABA = (absorbed dose) / (ingested dose) This ratio is also referred to as the oral absorption fraction (AF). RBA is the ratio of the ABA of Pb present in some test material compared the ABA of Pb in some appropriate reference material:
RBA = ABA(test) / ABA(reference) Usually the form of Pb used as reference material is a soluble compound such as lead acetate (PbAc) that is expected to completely dissolve when ingested. For example, if 100 micrograms (µg) of Pb dissolved in drinking water were ingested and a total of 50 µg entered the body, the ABA would be 50/100 or 0.50 (50%). Likewise, if 100 µg of Pb contained in soil were ingested and 30 µg entered the body, the ABA for soil would be 30/100 or 0.30 (30%). If the Pb dissolved in water were used as the frame of reference for describing the relative amount of Pb absorbed from soil, the RBA would be 0.30/0.50, or 0.60. This 60% is the default RBA used in models of Pb absorption. However, the Risk Assessment Guidelines (RAG) for Superfund sites states “if the medium of exposure [at] the site…differs from the medium of exposure assumed by the toxicity value…an absorption adjustment may…be appropriate.” Thus in several instances, juvenile bioavailability studies for specific sites have been used to adjust assumed RBA value of the model. However, these tests are expensive, time-consuming, and require specialized facilities and expertise.
Currently, there is no cost-effective method to assess the bioavailability of Pb at SARs; either the soils would have to be tested by costly studies in swine, as described above, or the universal default value of 60% RBA would be used. This demonstration conducted parallel studies on SAR soils to compare the results of in vivo swine RBA studies with those of a rapid and low-cost in vitro method to assess the RBA of Pb at ranges (USEPA, 2004). The comparison was intended to be a validation of the in vitro method for use as a stand-alone method.
2.2 OBJECTIVES OF THE DEMONSTRATION
The original objectives of this demonstration were twofold:
1. To demonstrate that the in vitro method can be used as a standalone method for risk assessment. This was carried out by correlation of the in vitro and in vivo two methods over a selected concentration range of Pb in SARs. A correlation coefficient (r) of 0.8 or greater would be considered a success.
2. To gain regulatory approval of the in vitro method by the USEPA. This would be
achieved by liaising with USEPA personnel as the study progresses. Since USEPA buy-in is critical to the ultimate success of this study, contact with critical USEPA personnel would be initiated at the start of the study and continued throughout the study.
5
However, as the study progressed, it became evident that the range of bioavailability in SAR soils would not extend from low to high but would remain consistently high. Therefore, the objectives of the demonstration were supplanted by the emerging picture of high bioavailability at all SARs tested (see results). Nonetheless, the ability of the in vitro method to consistently register the same high bioavailability as the in vivo method continued to be a consideration. In spite of the high bioavailability found in this study, this data can still be used to support the continued use of the in vitro method as a viable stand-alone method.
2.3 REGULATORY DRIVERS
SARS, which number in the thousands, are mostly confined to Pb as the major pollutant. Pb levels are generally localized to the firing end, the impact berms, and the target areas. In addition, SARS are generally small in size compared to Superfund sites. These combined factors make SARs unique from the perspective of risk assessment and remediation. An AF term is used in both the Adult Lead Methodology (ALM) and IEUBK models but calculated differently in each. The ALM assumes 20% absorption of soluble Pb and a 60% RBA of Pb in soil whereas the IEUBK assumes 50% absorption of soluble Pb and 60% RBA of Pb in soil. Using these default assumptions, the AF is calculated as follows:
ALM: 0.2 x 0.6 = 0.12
IEUBK: 0.5 x 0.6 = 0.30 Because the default assumption for relative bioavialability (0.6) is identical in both calculations, the driving factor in the calculation of the AF therefore becomes the assumed 2.5-fold increase (50% versus 20%) in absorption for children over adults, since children absorb more Pb than adults, and are also more vulnerable to it’s neurotoxic effects. Since we are refining a default value that is common to both ALM and IEUBK models, correlation with the juvenile pig model is an appropriate validation for the in vitro test. In addition, using the juvenile pig model provides continuity with previous work on bioavailability. According to the USEPA “…60% is a plausible default point estimate for the RBA of Pb when site specific data are not available. Such data are highly desirable as variation in RBA is expected for different species of Pb and different particle sizes...” Our study intended to provide validation of a rapid, cost-effective, and conservative RBA term for SAR soils that can be used to calculate the AF in the ALM and IEUBK models. The main stakeholders or end users of the results of this project are:
1. DoDCThe Army, Navy, and Air Force all have SARs that will require risk assessment and eventual remediation.
2. Other organizations such as the National Guard, local police forces both state and municipal, or any civil or military body that uses SAR and needs an estimate of the risk posed by Pb contamination.

This page left blank intentionally.
3.0 TECHNOLOGY
3.1 TECHNOLOGY DESCRIPTION
3.1.1 In Vitro Method
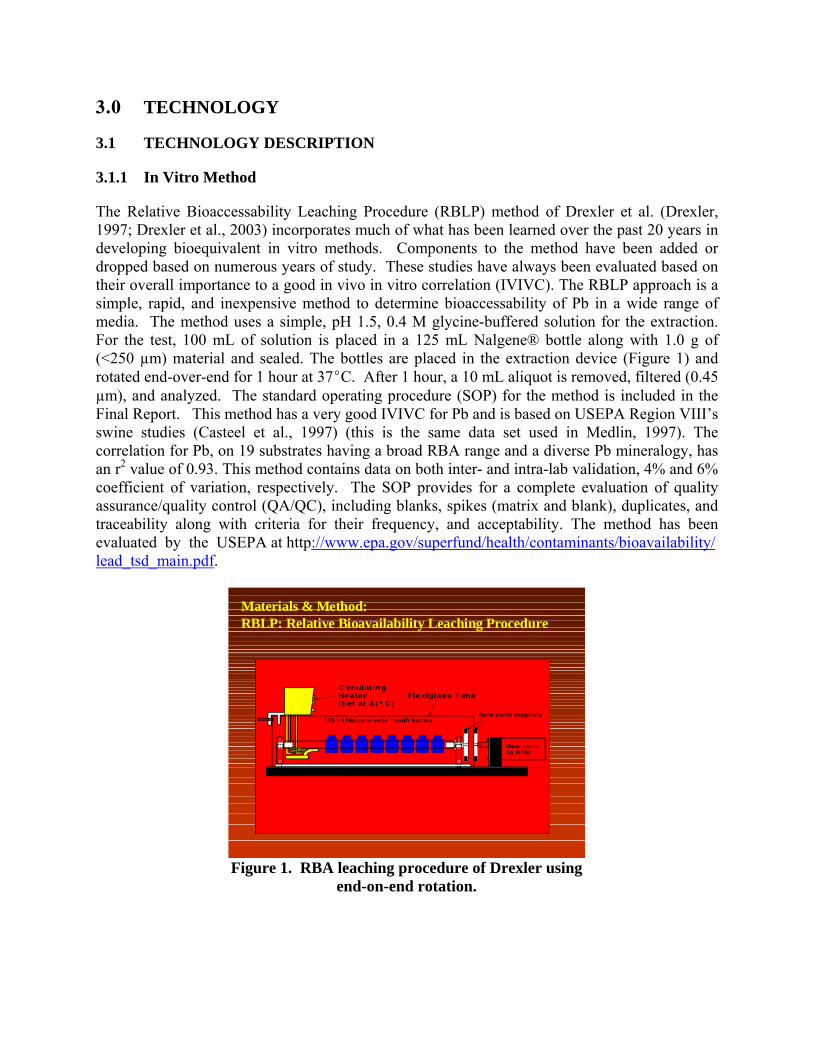
The Relative Bioaccessability Leaching Procedure (RBLP) method of Drexler et al. (Drexler, 1997; Drexler et al., 2003) incorporates much of what has been learned over the past 20 years in developing bioequivalent in vitro methods. Components to the method have been added or dropped based on numerous years of study. These studies have always been evaluated based on their overall importance to a good in vivo in vitro correlation (IVIVC). The RBLP approach is a simple, rapid, and inexpensive method to determine bioaccessability of Pb in a wide range of media. The method uses a simple, pH 1.5, 0.4 M glycine-buffered solution for the extraction. For the test, 100 mL of solution is placed in a 125 mL Nalgene® bottle along with 1.0 g of (<250 µm) material and sealed. The bottles are placed in the extraction device (Figure 1) and rotated end-over-end for 1 hour at 37EC. After 1 hour, a 10 mL aliquot is removed, filtered (0.45 µm), and analyzed. The standard operating procedure (SOP) for the method is included in the Final Report. This method has a very good IVIVC for Pb and is based on USEPA Region VIII’s swine studies (Casteel et al., 1997) (this is the same data set used in Medlin, 1997). The correlation for Pb, on 19 substrates having a broad RBA range and a diverse Pb mineralogy, has an r2 value of 0.93. This method contains data on both inter- and intra-lab validation, 4% and 6% coefficient of variation, respectively. The SOP provides for a complete evaluation of quality assurance/quality control (QA/QC), including blanks, spikes (matrix and blank), duplicates, and traceability along with criteria for their frequency, and acceptability. The method has been evaluated by the USEPA at http://www.epa.gov/superfund/health/contaminants/bioavailability/ lead_tsd_main.pdf.
Materials & Method:RBLP: Relative Bioavailability Leaching Procedure
Figure 1. RBA leaching procedure of Drexler using
end-on-end rotation.
8
3.1.2 In Vivo Method
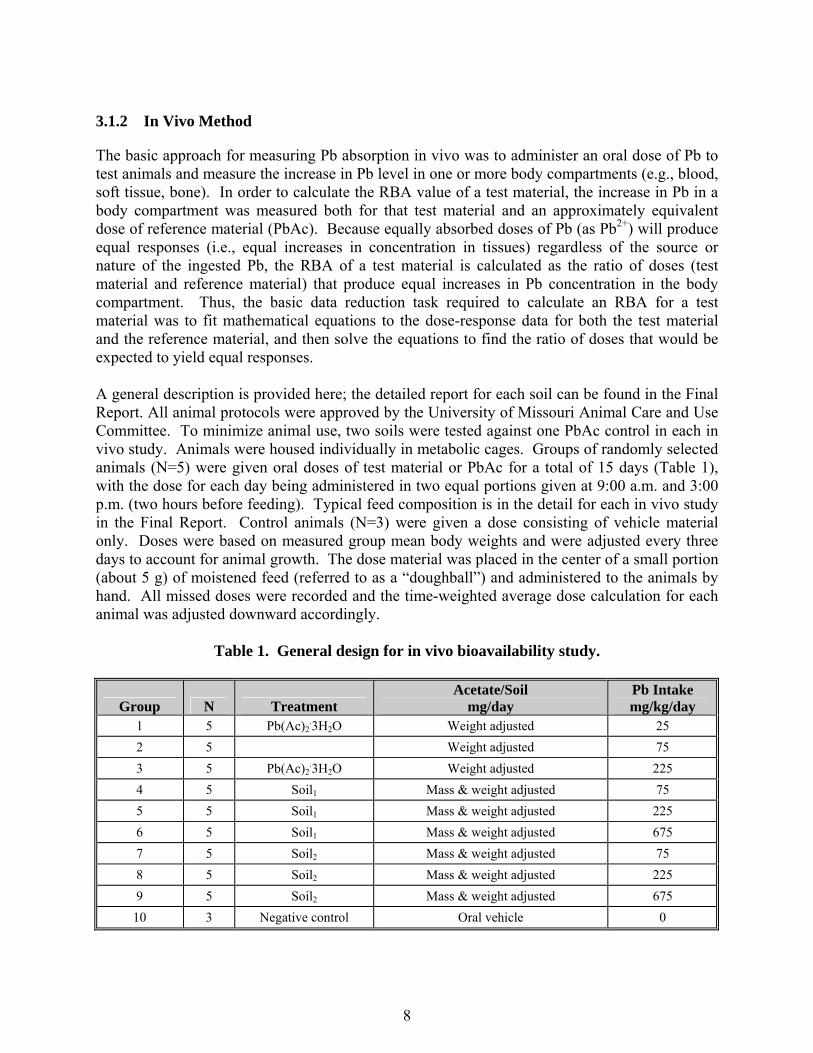
The basic approach for measuring Pb absorption in vivo was to administer an oral dose of Pb to test animals and measure the increase in Pb level in one or more body compartments (e.g., blood, soft tissue, bone). In order to calculate the RBA value of a test material, the increase in Pb in a body compartment was measured both for that test material and an approximately equivalent dose of reference material (PbAc). Because equally absorbed doses of Pb (as Pb2+) will produce equal responses (i.e., equal increases in concentration in tissues) regardless of the source or nature of the ingested Pb, the RBA of a test material is calculated as the ratio of doses (test material and reference material) that produce equal increases in Pb concentration in the body compartment. Thus, the basic data reduction task required to calculate an RBA for a test material was to fit mathematical equations to the dose-response data for both the test material and the reference material, and then solve the equations to find the ratio of doses that would be expected to yield equal responses. A general description is provided here; the detailed report for each soil can be found in the Final Report. All animal protocols were approved by the University of Missouri Animal Care and Use Committee. To minimize animal use, two soils were tested against one PbAc control in each in vivo study. Animals were housed individually in metabolic cages. Groups of randomly selected animals (N=5) were given oral doses of test material or PbAc for a total of 15 days (Table 1), with the dose for each day being administered in two equal portions given at 9:00 a.m. and 3:00 p.m. (two hours before feeding). Typical feed composition is in the detail for each in vivo study in the Final Report. Control animals (N=3) were given a dose consisting of vehicle material only. Doses were based on measured group mean body weights and were adjusted every three days to account for animal growth. The dose material was placed in the center of a small portion (about 5 g) of moistened feed (referred to as a “doughball”) and administered to the animals by hand. All missed doses were recorded and the time-weighted average dose calculation for each animal was adjusted downward accordingly.
Table 1. General design for in vivo bioavailability study.
Group N Treatment Acetate/Soil
mg/day Pb Intake mg/kg/day
1 5 Pb(Ac)2.3H2O Weight adjusted 25
2 5 Weight adjusted 75
3 5 Pb(Ac)2.3H2O Weight adjusted 225
4 5 Soil1 Mass & weight adjusted 75
5 5 Soil1 Mass & weight adjusted 225
6 5 Soil1 Mass & weight adjusted 675
7 5 Soil2 Mass & weight adjusted 75
8 5 Soil2 Mass & weight adjusted 225
9 5 Soil2 Mass & weight adjusted 675
10 3 Negative control Oral vehicle 0
9
In practice, the in vivo bioavailability consisted of twice daily dosing of juvenile swine for 14 days according to the dosing regime in Table 1. Four independent measurement endpoints were evaluated based on the concentration of Pb observed in blood, liver, kidney, and bone (femur). More detailed figures for each study are found in the Final Report. For liver, kidney, and bone, the measurement endpoint was simply the concentration in the tissue at the time of sacrifice (day 15). The measurement endpoint used to quantify the blood Pb response was the area under the curve (AUC) for blood Pb versus time (days 0-15). AUC was selected because it is the standard pharmacokinetic index of chemical uptake into the blood compartment and is relatively insensitive to small variations in blood Pb level by day. The AUC was calculated using the trapezoidal rule to estimate the AUC between each time point that a blood Pb value was measured (days 0, 1, 2, 3, 5, 7, 9, 12, and 15). At the end of the study, the Pb values in kidney, liver, and bone were measured to estimate the bioavailability in these tissues. One blood sample (6-8 mL) was drawn from each animal on days 0, 1, 2, 3, 5, 7, 9, 12, and 15, into a new plastic Pb-free syringe by venipuncture of the anterior vena cava. The blood was immediately transferred into Pb-free VacutainerR tubes containing ethylenediaminetetraacetic acid (EDTA). In each case, blood samples were drawn 17 hours after the second dosing of the previous day. Animal weights were recorded, and doses and feed were adjusted on days 1, 2, and every third day thereafter until study termination. Animals were fed according to the regular daily schedule outlined in a project notebook. On study day #15, pigs were humanely sacrificed and representative samples of liver, kidney, and bone were collected and prepared for analysis. Detailed logbook notes recorded information pertinent to each sample collection. These notes were indexed and made available for review following sample collection. The RBA of Pb in site materials was estimated using the following approach:
1. The biological responses of individual animals (Pb in blood, tissues) exposed to a series of oral doses of soluble Pb (e.g., PbAc) were plotted. For blood Pb, an AUC dose was calculated for each animal.
2. The data from bullet 1 (above) was used to fit dose response curves for each
tissue. An equation was fitted to the observed data points.
3. Using the best fit equations for reference material and test material, the RBA was calculated as the ratios of doses of test material and reference material that yield equal biological responses. Depending on the relative shape of the best-fit lines through the PbAc and test material dose response curves, RBA may either be constant (dose-independent) or variable (dose-dependent).
An RBA value of 1.0 means that Pb in the test soil is just as well absorbed as PbAc. An RBA value of 0.5 means that Pb in the test soil is absorbed 50% as well as PbAc.
10
Model: Basic Equations It has been shown previously (USEPA, 2004) that nearly all blood Pb AUC data sets can be well-fit using an exponential equation, and most tissue (liver, kidney, and bone) Pb data can be well-fit using a linear equation, as follows:
Linear (liver, kidney, bone): Response = a + b · Dose Exponential (blood Pb AUC): Response = a + b · [1 - exp(-c · Dose)]
Simultaneous Regression Because the data to be analyzed consist of three dose-response curves for each endpoint (the reference material and two test materials) and there is no difference between the curves when the dose is zero, all three curves for a given endpoint must have the same intercept. This requirement is achieved by combining the two dose response equations into one and solving for the parameters simultaneously, resulting in the following equations:
Linear: y = a + br·xr + bt·xt
Exponential: y = a + b · [ (1-exp(-cr·xr)) + (1-exp(-ct·xt)) ]
where:
y = response x = dose a, b, c = empirical coefficients for the reference material (r) and test material (t).
All linear model fitting was performed in Microsoft® Office Excel using matrix functions. Exponential model fitting was performed using JMP® version 3.2.2, a commercial software package developed by SAS®. Weighted Regression Regression analysis based on ordinary least squares assumes that the variance of the responses is independent of the dose and/or the response (Draper and Smith, 1998). It has previously been shown that this assumption is generally not satisfied in swine-based RBA studies, where there is a tendency toward increasing variance in response as a function of increasing dose (heteroscedasticity) (USEPA, 2004). To deal with heteroscedasticity, the data are analyzed using weighted least squares regression. In this approach, each observation in a group of animals is assigned a weight that is inversely proportional to the variance of the response in that group:
wi = (σ2i)
-1
where:
11
wi = weight assigned to all data points in dose group i σ2
i = variance of responses of animals in dose group i
(Draper and Smith, 1998). As discussed in USEPA (2004), there are several alternative strategies for assigning weights. The preferred method identified by USEPA (USEPA, 2004) and the method used in this study estimates the value of σ2
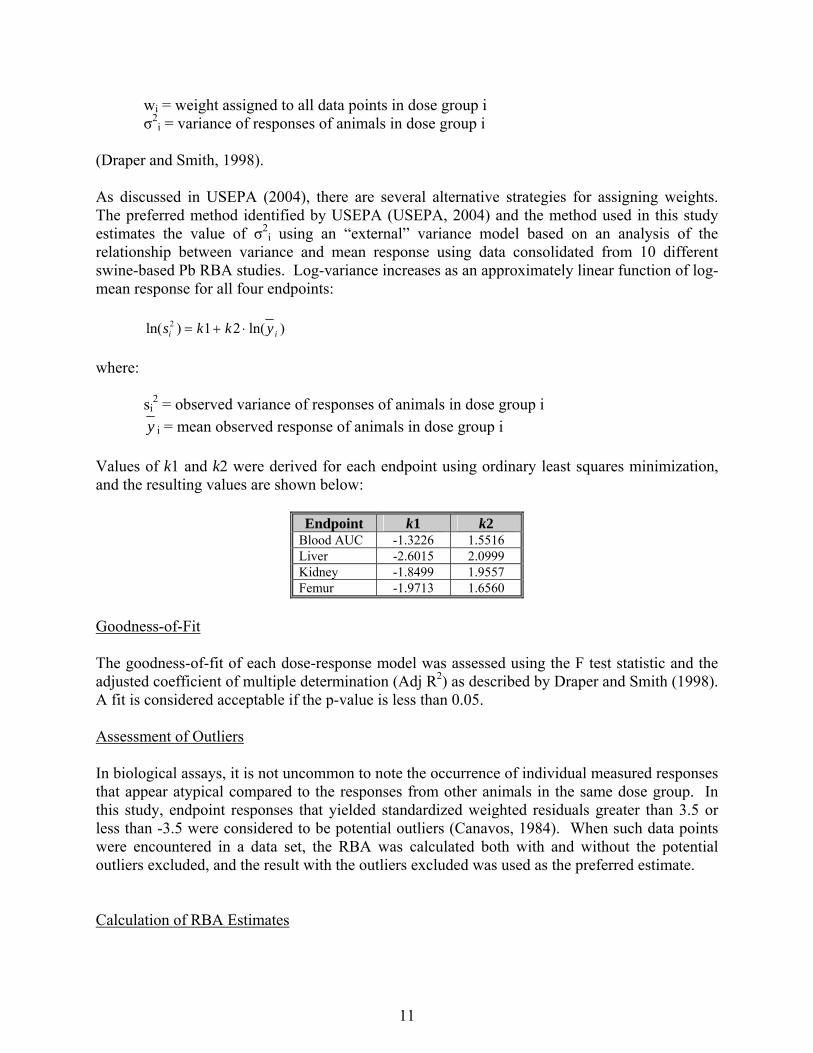
i using an “external” variance model based on an analysis of the relationship between variance and mean response using data consolidated from 10 different swine-based Pb RBA studies. Log-variance increases as an approximately linear function of log-mean response for all four endpoints:
ln( ) ln( )s k k yi i2 1 2
where:
si
2 = observed variance of responses of animals in dose group i
y i = mean observed response of animals in dose group i Values of k1 and k2 were derived for each endpoint using ordinary least squares minimization, and the resulting values are shown below:
Endpoint k1 k2 Blood AUC -1.3226 1.5516 Liver -2.6015 2.0999 Kidney -1.8499 1.9557 Femur -1.9713 1.6560
Goodness-of-Fit The goodness-of-fit of each dose-response model was assessed using the F test statistic and the adjusted coefficient of multiple determination (Adj R2) as described by Draper and Smith (1998). A fit is considered acceptable if the p-value is less than 0.05. Assessment of Outliers In biological assays, it is not uncommon to note the occurrence of individual measured responses that appear atypical compared to the responses from other animals in the same dose group. In this study, endpoint responses that yielded standardized weighted residuals greater than 3.5 or less than -3.5 were considered to be potential outliers (Canavos, 1984). When such data points were encountered in a data set, the RBA was calculated both with and without the potential outliers excluded, and the result with the outliers excluded was used as the preferred estimate. Calculation of RBA Estimates
12
Endpoint-specific RBA Estimates Pb RBA values were estimated using the basic statistical techniques recommended by Finney (1978). Each endpoint-specific RBA value was calculated as the ratio of a model coefficient for the reference material data set and for the test material data set:
Linear endpoints: RBAt = bt / br Exponential endpoint: RBAt = ct / cr
The uncertainly range about the RBA ratio was calculated using Fieller’s Theorem as described by Finney (1978). RBA Point Estimate Because there are four independent estimates of RBA (one from each measurement endpoint) for a given test material, the final RBA estimate for a test material involves combining the four endpoint-specific RBA values into a single value (point estimate) and estimating the uncertainty around that point estimate. As described in USEPA (2004), analysis of data from multiple studies suggests that the four endpoint-specific RBA values are all approximately equally reliable (as reflected in the average coefficient of variation in RBA values derived from each endpoint). Therefore, the RBA point estimate for the test material was calculated as the simple mean of all four endpoint-specific RBA values. The uncertainty bounds around this point estimate were estimated using Monte Carlo simulation. Values for RBA were drawn from the uncertainty distributions for each endpoint with equal frequency. Each endpoint-specific uncertainty distribution was assumed to be normal, with the mean equal to the best estimate of RBA and the standard deviation estimated from Fieller’s Theorem (Finney, 1978). The uncertainty in the point estimate was characterized as the range from the 5th to the 95th percentile of the mean across endpoints.
3.2 ADVANTAGES AND LIMITATIONS OF THE TECHNOLOGY
The primary advantages of the in vitro technology are low cost and ease of use. Low analytical cost for the in vitro test removes the cost-constriction associated with in vivo testing, which sometimes required that composite samples be taken (to reduce costs). With the proposed in vitro test, multiple sampling of SAR soils allows definition of the perimeter of contamination by Pb, which can be used in the design of cleanup strategies. When this technology is used with a portable X-ray fluorescence (XRF) deviceCthe Innov-X, which measures Pb in soilCit can be very effective. The XRF can identify Pb hotspots for sampling while the in vitro method can determine the RBA of these hotspots, providing a rapid and flexible estimate of the risk from SARs polluted with Pb. This technology was demonstrated only at SARS and is intended for use at those sites. In this sense, the technology is limited to ranges and is not intended for use at other sites, such as Superfund sites.
4.0 PERFORMANCE OBJECTIVES
4.1 PERFORMANCE OBJECTIVES
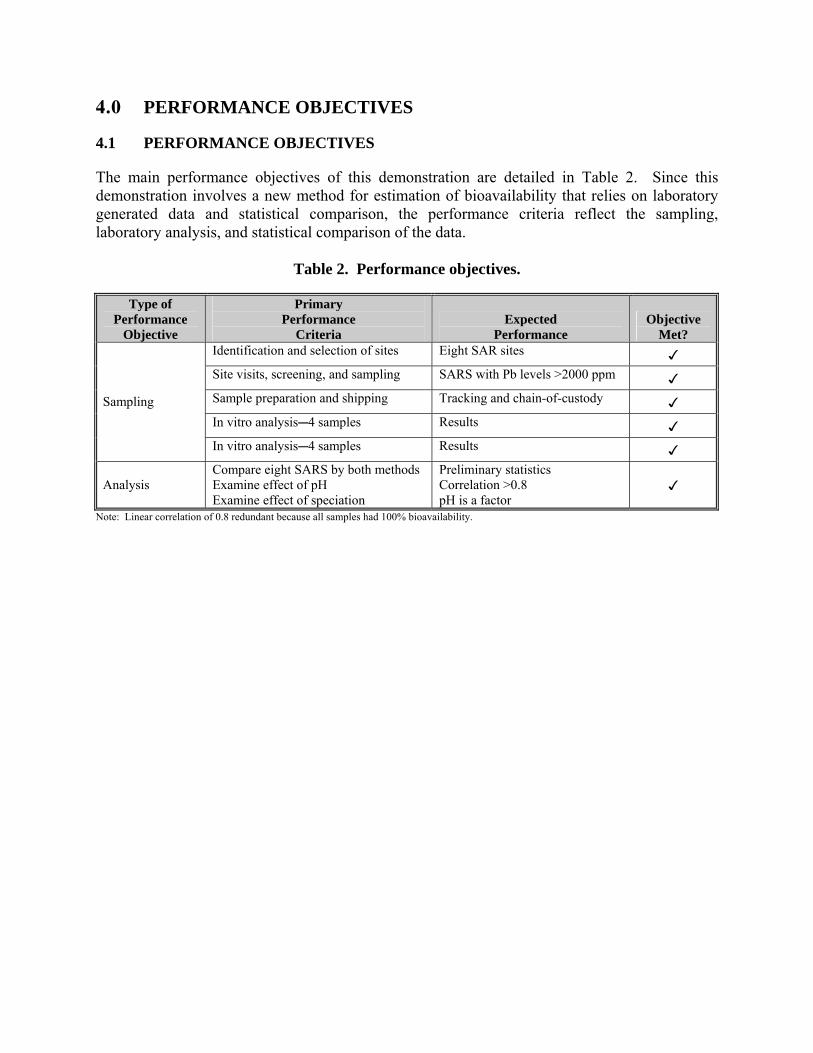
The main performance objectives of this demonstration are detailed in Table 2. Since this demonstration involves a new method for estimation of bioavailability that relies on laboratory generated data and statistical comparison, the performance criteria reflect the sampling, laboratory analysis, and statistical comparison of the data.
Table 2. Performance objectives.
Note: Linear correlation of 0.8 redundant because all samples had 100% bioavailability.
Type of Performance
Objective
Primary Performance
Criteria Expected
Performance Objective
Met? Identification and selection of sites Eight SAR sites ✓
Site visits, screening, and sampling SARS with Pb levels >2000 ppm ✓
Sample preparation and shipping Tracking and chain-of-custody ✓
In vitro analysisC4 samples Results ✓
Sampling
In vitro analysisC4 samples Results ✓
Analysis Compare eight SARS by both methods Examine effect of pH Examine effect of speciation
Preliminary statistics Correlation >0.8 pH is a factor
✓

This page left blank intentionally.
15
5.0 SITE DESCRIPTION
5.1 SITE LOCATION
The SARS sites were from a diverse group of ranges but, in the interest of convenience and ease of sampling, were initially confined to the eastern half of the United States. Later, sites were extended to include all areas in which appropriate samples could be obtained. Physico-chemical characteristics were also measured. Soils were either taken by the principal investigator (PI) or provided by the U.S. Army Corps of Engineers, Vicksburg, MS, courtesy of Dr. Steve Larson. Soils that were taken by the PI were homogenized and sieved at the U.S. Army Center for Health Promotion and Preventive Medicine (CHPPM) soils laboratory, Edgewood. Soils that were provided had already been sieved to <250 μm in size. The soil characteristics are outlined at the bottom of Table 5 in Section 6.2. The test site selection criteria were as follows;
SAR soil was from military installations. Sites should not have been disturbed or used as dump grounds. Sites should be accessible for sampling. Sites could be part of a risk assessment or remediation (optional).
The test sites for this demonstration were ranges that used conventional bullets. Skeet ranges and ranges where shotguns have been used were debarred from the study. This was in the interest of uniform soil samples. The sites were in accordance with the criteria outlined in the Site Sampling Protocol. Since this in vitro technology could be used to assess the risk from Pb in ranges, the test sites could have been part of areas that currently needed or were undergoing risk assessment. However, in practice it was difficult to get access to facilities to take samples from SARs. During the initial stages of the demonstration, soils collected at Aberdeen Proving Ground proved to have high bioavailability, and it was decided from thereon to first submit collected samples to in vitro measurement so that samples with lower bioavailability could be preselected for the in vivo assessment. It was also decided to search for samples from sites that would vary in their characteristics (high organic matter, high CEC) so that the methods could be challenged as much as possible and areas with potentially low bioavailability would be included. This resulted in a total of more than 30 samples being collected and tested using the in vitro method. Figure 4.7, of the final report, shows the extractable Pb as a function of total Pb in the sample and demonstrate that all samples screen using the in vitro method had high bioavailability with a mean of 91%. This figure represents soil samples from SARs in Maryland, Pennsylvania, New Jersey, New York, Tennessee, California, Oregon, Nebraska, Washington, Alaska, Louisiana, South Dakota, and Oregon.
5.2 SITE GEOLOGY/HYDROGEOLOGY
The selected sites for this study were from seven different states across the United States. All were from military installations.

16
5.3 CONTAMINANT DISTRIBUTION
The contaminant distribution was not measured in situ for this project. However, it is widely known that SARs are contaminated with Pb from bullets and that the Pb is relatively immobile, except were heavy rainfall causes movement of soil particles in surface water.
17
6.0 TEST DESIGN
Since this was not a technology demonstration but a comparison of methods of measuring bioavailability, there were no test design characteristics. Soil collection and preparation was the responsibility of the PI at CHPPM. Soils were either taken by the PI or sent by other researchers to CHPPM, after which, if necessary, they were dried, and sieved to a particle size of <250 μm and stored in metal-free Nalgene bottles. These were then shipped, in a round robin, to each investigator for in vitro and in vivo analysis. Subsampling by the PI prior to shipping was avoided to preclude bias due to settlement or sampling error. After arrival, each investigator was responsible for mixing the sample prior to subsampling so that any settlement of sample in shipping would be avoided. Co-investigators were responsible for their own QC, as outlined in the in vitro and in vivo method descriptions in the Final Report. The experimental design was a comparison of two methods using correlation. The sample size was small (n=8) because of the prohibitive costs of the in vivo analysis, but the design was intended to show that the in vitro method could predict the in vivo value of RBA. Two pH values were used, pH 1.5 and pH 2.5, with the intention of examining the effect of pH on the RBA values and resulting correlation with the in vivo method. It was calculated that with this sample size, a linear correlation of 0.8 or greater would be sufficient to demonstrate that these methods agreed. As the study proceeded, the experimental design was undermined by evidence that bioavailability values were registering at essentially 100%, regardless of source of the soils. At this stage it was decided, in conjunction with the Environmental Security Technology Certification Program (ESTCP), to continue with the project but to find soils that were spread across a wide spectrum of possible conditions and locations. This would ascertain if the initial results from East Coast soils would turn out to be the same for those from the heartland or West Coast. It was decided to use the in vitro method to “screen” soils that might have low bioavailability and then to submit the samples for in vivo testing. However, no such range in bioavailability was revealed, so samples from diverse sites across the United States were used to demonstrate the project. Sampling. Composite samples were taken by scooping the top few inches of soil across at least five sides on the impact sides of berms. At the CHPPM soils laboratory, samples were air-dried on trays at constant humidity to <2% residual moisture and then sieved to <250 μm size, using 2 mm then 250 m sieves. For the in vitro method, samples were further dried to 60ºC, then analyzed according to the protocol found in the Final Report. For the in vivo method, the soil sample was rolled 20 times to mix it evenly and then subsampled for swine dosing. The sieved samples were stored in Nalgene bottles. In some instances, soil samples that had been pre-sieved were forwarded to the PI. These samples were sieved anyway and stored as above. In vitro Method. Details of this method are found in the Appendix of the Final Report. Briefly, in vitro analysis was carried out at the laboratory of Dr. John Drexler at the University of Colorado using a widely accepted in vitro method. Triplicate subsamples were taken from each well-mixed sieved soil. Then, 1.0 g was extracted in 100 mL of a solution of 0.4 M glycine buffer, tissue culture grade (Fisher Scientific Limited, PA) that had been adjusted to pH 1.5 using
18
HCl, trace metal grade (Fisher Scientific Limited, PA). The closed 125 mL Nalgene bottles were placed in a heated extraction device and rotated end-over-end for 60 minutes at 37°C. After 1 hour, a 1 mL aliquot of the well-mixed solution was removed, filtered through a 0.45 μm cellulose acetate filter (BioExpress, UT) and analyzed for Pb using a Varian ULTRAMASS Inductively Coupled PlasmaCMass Spectrometry (ICP-MS) (Varian, Inc., CA). In vitro bioavailability was expressed as ratio of extracted Pb to the total Pb in the sample, measured by nitric acid digestion and ICP analysis. Pb speciation was carried out by Electron Microprobe Analysis (EMPA) using a Joel 8600 electron microprobe, with a finely focused (1F) beam, to produce characteristic x-rays for elemental analysis.
19
7.0 PERFORMANCE ASSESSMENT
This demonstration involves a new method for estimation of bioavailability that relies on laboratory-generated data and statistical comparison, so the performance criteria, in Table 3, reflect the sampling, laboratory analysis, and statistical comparison of the data.
7.1 PERFORMANCE CRITERIA
Table 3. General performance criteria used to evaluate the technology.
Performance Criteria Description Primary or Secondary Contaminant mobility No increase or decrease in Pb mobility resulted
from this technology. Primary
Hazardous materials
No hazardous materials were introduced, but the risk assessment of Pb was refined by this technology.
Primary
Process waste
Since this is a technology for assessment of toxicity, no process waste was generated.
Primary
Factors that affect technology performance
The following factors are important in the use of this technology: Particle size should be < 250 μm. Sample size is limited to 1.0 g. pH of the soil should not be a factor since
buffers are used in the extraction medium. pH of the extraction solution may be a
factor and was assessed by the study design.
Primary
Reliability The in vitro method has been published and used under widely varying conditions. It is considered a robust method.
Secondary
Ease of use The required equipment, a water bath with an orbital shaker, is relatively easy to use.
Primary
Versatility The technology is intended for use at all SARs. Primary
7.2 PERFORMANCE CONFIRMATION METHODS
The in vivo study contained a good deal of complexity and sample analysis, using 54 swine over a period of 5 days and requiring dosing schemes, blood sampling, and blood and tissue analysis for Pb. Therefore, a site audit was conducted by the CHPPM Good Laboratory Practices (GLP) representative during the course of the project. The audit examined the protocols, methods, and facilities at the University of Missouri Veterinary Diagnostic Facility (Dr. Casteel’s laboratory), which were deemed adequate though not compliant with GLP. It was not considered necessary to conduct a site visit to the in vitro laboratory of Dr. Drexler, as the process is simpler in application and could be judged by the quality of the submitted QC in reports. Triplicate analysis was carried out for the in vitro test, and five animals were used for each dose for the in vivo study. Measures of precision and accuracy were determined by using either standard reference materials from the National Institute of Standards and Technology (NIST) (environmental samples) or the U.S. Center for Disease Control (CDC) (blood Pb analysis). Since bioavailability is a relative measurement, there was no reference material that could be
20
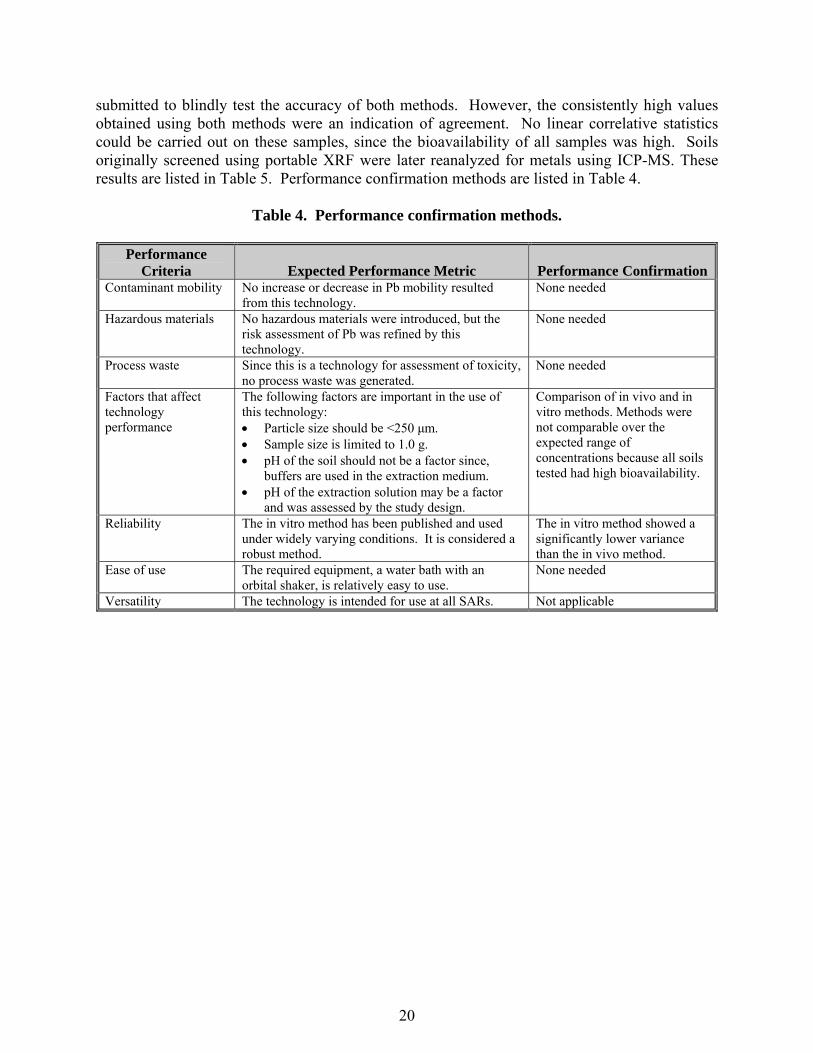
submitted to blindly test the accuracy of both methods. However, the consistently high values obtained using both methods were an indication of agreement. No linear correlative statistics could be carried out on these samples, since the bioavailability of all samples was high. Soils originally screened using portable XRF were later reanalyzed for metals using ICP-MS. These results are listed in Table 5. Performance confirmation methods are listed in Table 4.
Table 4. Performance confirmation methods.
Performance Criteria Expected Performance Metric Performance Confirmation
Contaminant mobility No increase or decrease in Pb mobility resulted from this technology.
None needed
Hazardous materials
No hazardous materials were introduced, but the risk assessment of Pb was refined by this technology.
None needed
Process waste
Since this is a technology for assessment of toxicity, no process waste was generated.
None needed
Factors that affect technology performance
The following factors are important in the use of this technology: Particle size should be <250 μm. Sample size is limited to 1.0 g. pH of the soil should not be a factor since,
buffers are used in the extraction medium. pH of the extraction solution may be a factor
and was assessed by the study design.
Comparison of in vivo and in vitro methods. Methods were not comparable over the expected range of concentrations because all soils tested had high bioavailability.
Reliability The in vitro method has been published and used under widely varying conditions. It is considered a robust method.
The in vitro method showed a significantly lower variance than the in vivo method.
Ease of use The required equipment, a water bath with an orbital shaker, is relatively easy to use.
None needed
Versatility The technology is intended for use at all SARs. Not applicable
21
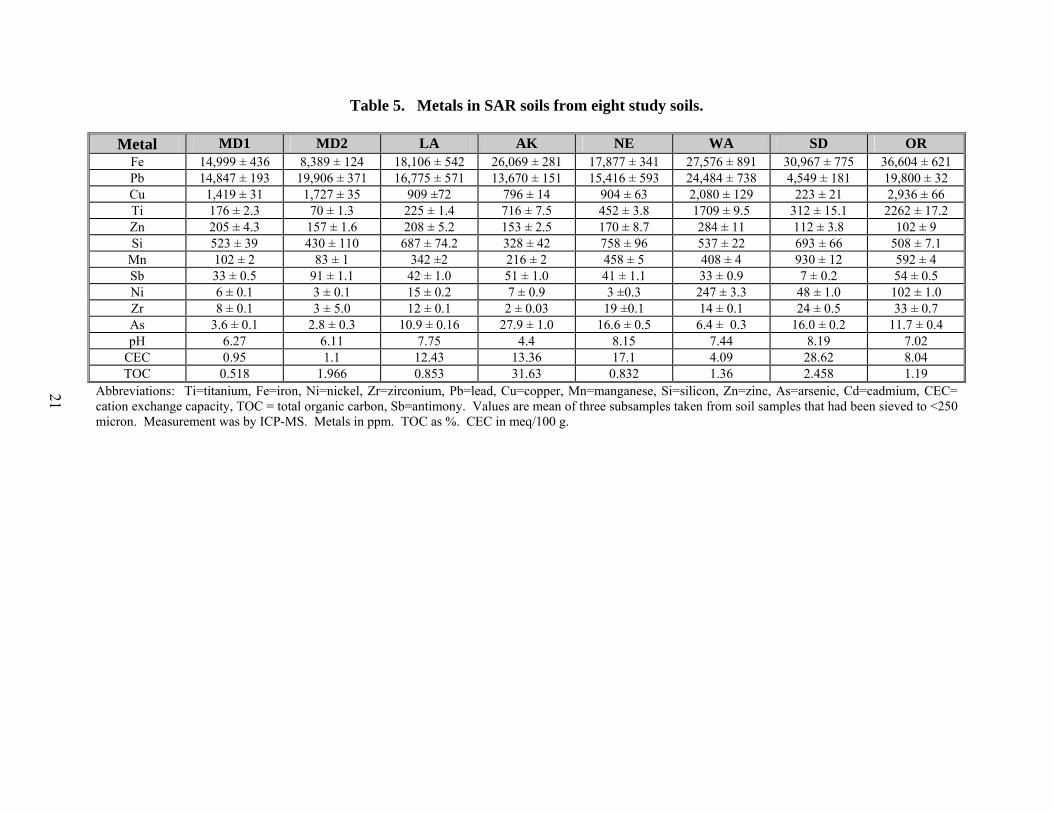
Table 5. Metals in SAR soils from eight study soils.
Metal MD1 MD2 LA AK NE WA SD OR Fe 14,999 ± 436 8,389 ± 124 18,106 ± 542 26,069 ± 281 17,877 ± 341 27,576 ± 891 30,967 ± 775 36,604 ± 621 Pb 14,847 ± 193 19,906 ± 371 16,775 ± 571 13,670 ± 151 15,416 ± 593 24,484 ± 738 4,549 ± 181 19,800 ± 32 Cu 1,419 ± 31 1,727 ± 35 909 ±72 796 ± 14 904 ± 63 2,080 ± 129 223 ± 21 2,936 ± 66 Ti 176 ± 2.3 70 ± 1.3 225 ± 1.4 716 ± 7.5 452 ± 3.8 1709 ± 9.5 312 ± 15.1 2262 ± 17.2 Zn 205 ± 4.3 157 ± 1.6 208 ± 5.2 153 ± 2.5 170 ± 8.7 284 ± 11 112 ± 3.8 102 ± 9 Si 523 ± 39 430 ± 110 687 ± 74.2 328 ± 42 758 ± 96 537 ± 22 693 ± 66 508 ± 7.1
Mn 102 ± 2 83 ± 1 342 ±2 216 ± 2 458 ± 5 408 ± 4 930 ± 12 592 ± 4 Sb 33 ± 0.5 91 ± 1.1 42 ± 1.0 51 ± 1.0 41 ± 1.1 33 ± 0.9 7 ± 0.2 54 ± 0.5 Ni 6 ± 0.1 3 ± 0.1 15 ± 0.2 7 ± 0.9 3 ±0.3 247 ± 3.3 48 ± 1.0 102 ± 1.0 Zr 8 ± 0.1 3 ± 5.0 12 ± 0.1 2 ± 0.03 19 ±0.1 14 ± 0.1 24 ± 0.5 33 ± 0.7 As 3.6 ± 0.1 2.8 ± 0.3 10.9 ± 0.16 27.9 ± 1.0 16.6 ± 0.5 6.4 ± 0.3 16.0 ± 0.2 11.7 ± 0.4 pH 6.27 6.11 7.75 4.4 8.15 7.44 8.19 7.02
CEC 0.95 1.1 12.43 13.36 17.1 4.09 28.62 8.04 TOC 0.518 1.966 0.853 31.63 0.832 1.36 2.458 1.19
Abbreviations: Ti=titanium, Fe=iron, Ni=nickel, Zr=zirconium, Pb=lead, Cu=copper, Mn=manganese, Si=silicon, Zn=zinc, As=arsenic, Cd=cadmium, CEC= cation exchange capacity, TOC = total organic carbon, Sb=antimony. Values are mean of three subsamples taken from soil samples that had been sieved to <250 micron. Measurement was by ICP-MS. Metals in ppm. TOC as %. CEC in meq/100 g.
22
7.3 DATA ANALYSIS, INTERPRETATION, AND EVALUATION
Eight selected SAR soil samples from across the United States were dried, sieved to <250 µm, and stored in Nalgene plastic bottles. Subsamples were first analyzed for Pb and other metals; additional analysis for Pb speciation was also carried out. Subsamples were then subject to in vitro bioaccessibility or in vivo bioavailability analysis using procedures described previously. This section is a summary of the analysis; detailed reports for the analyses can be found in the Final Report to ESTCP. Subsamples were initially screened for all metals using portable XRF but later analyzed using acid digestion ICP-MS, which is considered more accurate. The ICP-MS data is presented in this report. Samples MD1 and MD2 were reanalyzed using an improved statistical approach, and the bounded intervals have changed slightly from those in the Final Report, but the overall mean is similar. Analysis of metals and soil properties are listed in Table 5. Iron (Fe) concentrations in soil were highest but were occasionally exceeded by Pb. After Fe, Pb and copper (Cu) were found in the highest concentrations, followed by titanium (Ti), zinc (Zn), and silicon (Si). Note that when the Pb concentration doubled between samples, the Cu concentration also doubled showing that Pb and Cu are being mobilized at relatively constant rates from copper jacketed bullets. Other metals (potentially from small arms ammunition) such as arsenic (As), antimony (Sb), nickel (Ni), and zirconium (Zn) were found at significantly lower levels than Pb. Cadmium (Cd) concentrations were below background while tungsten was not detected (data not shown). Although no standard textural analyses was conducted on the soils, each was provided with a general descriptor, as follows; MD1 and MD2 (sandy), AK, OR, and WA (organic), LA, NE, and SD (clay). Most soils had a normal pH range of 6.1 to 8.2; with one soil slightly acidic (AK, pH 4.4). CECs ranged from 0.95 to 28.6 meq/100 g and correspond well with the general textural classifications, with the higher values associated with clay-rich soils (SD, NE) and the low values indicative of sandy soils (MD1, MD2). Organic carbon was highest in the peaty soil from Alaska and lowest in the sandy soil from Maryland. A summary table of the in vivo analysis for the eight sites (Table 5) shows the estimated RBA from each tissue, as well as the overall point estimate for all tissues. Blood Pb AUC estimates did not have estimates of the variance for samples MD1, MD2, SD, or OR. This was because Fieller’s theorem, which is used to calculate the upper and lower bound, failed for these estimations. For two samples in this study, MD1 and AK, the in vivo method reported a bioavailability value significantly higher than the reference sample, indicating that (gram for gram) the Pb in the soil sample was more completely absorbed than the reference material, Pb acetate. There could be two reasons for this: Pb from soils could be more completely absorbed compared to the PbAc reference or there was inadequate matching of the soil Pb concentration to the PbAc reference. For future in vivo studies, improved matching of reference Pb to sample (soil) Pb may need to be carried out, especially when the soils contain very high concentrations of Pb. In vitro and in vivo results for each study soil is presented in Table 7. The mean results for in vivo and in vitro analysis were 95% ± 6% and 107% ± 18%, respectively. These concordant mean values (both high bioavailability) differ somewhat in the degree of variation of the estimate: the in vivo method has a high degree of variability because of the biological variability
23
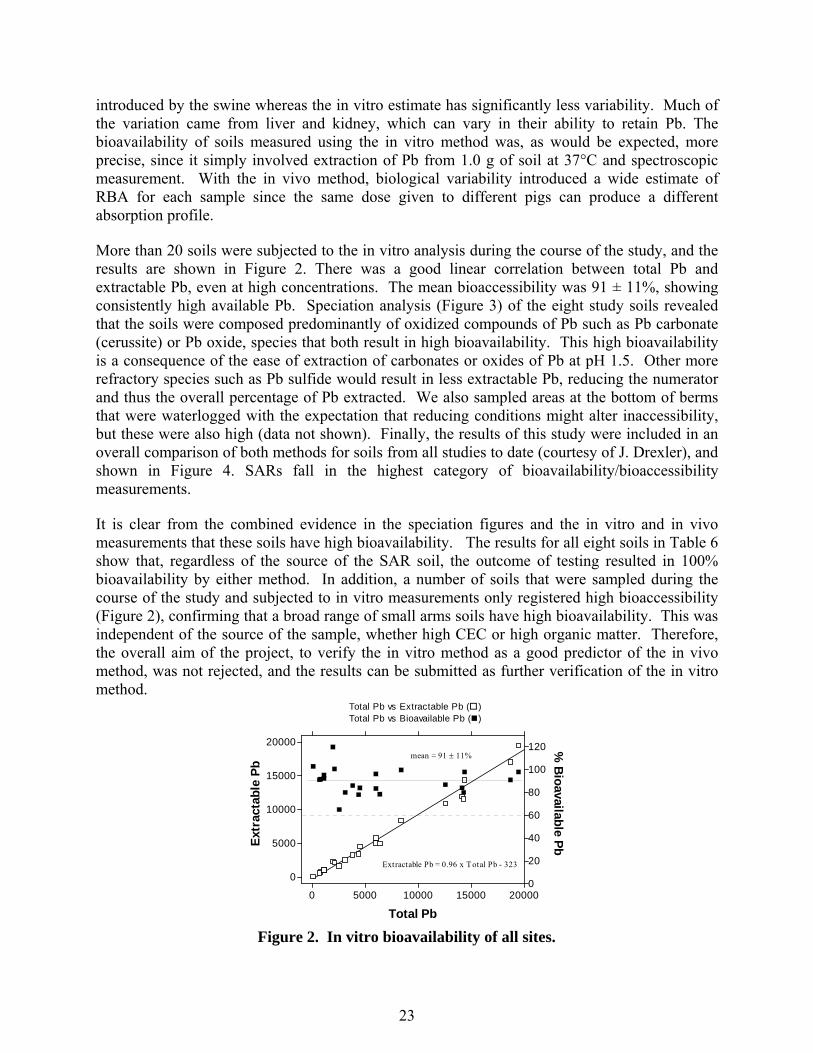
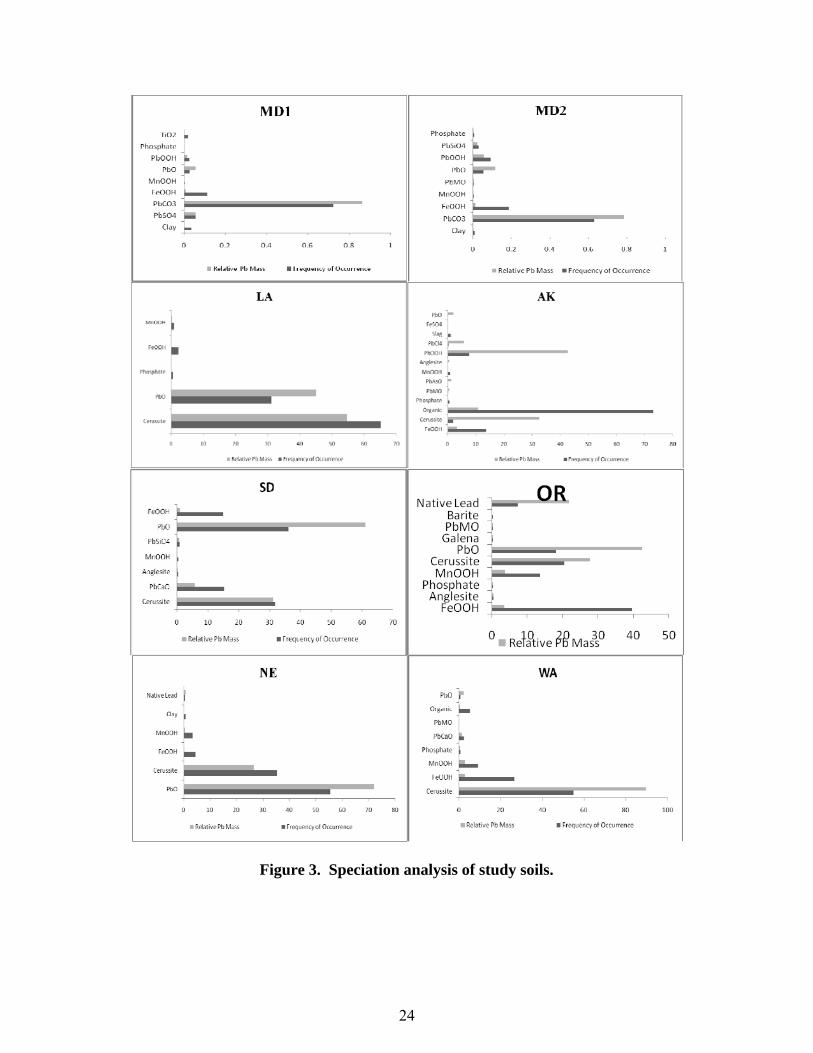
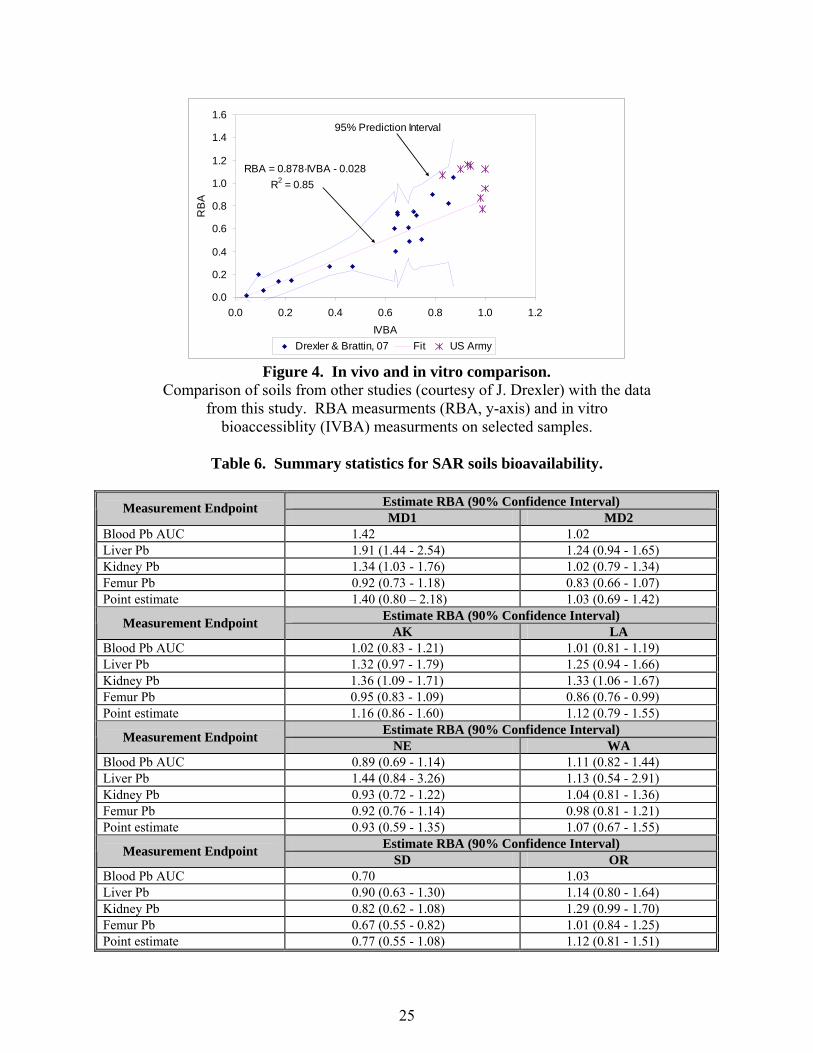
introduced by the swine whereas the in vitro estimate has significantly less variability. Much of the variation came from liver and kidney, which can vary in their ability to retain Pb. The bioavailability of soils measured using the in vitro method was, as would be expected, more precise, since it simply involved extraction of Pb from 1.0 g of soil at 37°C and spectroscopic measurement. With the in vivo method, biological variability introduced a wide estimate of RBA for each sample since the same dose given to different pigs can produce a different absorption profile. More than 20 soils were subjected to the in vitro analysis during the course of the study, and the results are shown in Figure 2. There was a good linear correlation between total Pb and extractable Pb, even at high concentrations. The mean bioaccessibility was 91 ± 11%, showing consistently high available Pb. Speciation analysis (Figure 3) of the eight study soils revealed that the soils were composed predominantly of oxidized compounds of Pb such as Pb carbonate (cerussite) or Pb oxide, species that both result in high bioavailability. This high bioavailability is a consequence of the ease of extraction of carbonates or oxides of Pb at pH 1.5. Other more refractory species such as Pb sulfide would result in less extractable Pb, reducing the numerator and thus the overall percentage of Pb extracted. We also sampled areas at the bottom of berms that were waterlogged with the expectation that reducing conditions might alter inaccessibility, but these were also high (data not shown). Finally, the results of this study were included in an overall comparison of both methods for soils from all studies to date (courtesy of J. Drexler), and shown in Figure 4. SARs fall in the highest category of bioavailability/bioaccessibility measurements. It is clear from the combined evidence in the speciation figures and the in vitro and in vivo measurements that these soils have high bioavailability. The results for all eight soils in Table 6 show that, regardless of the source of the SAR soil, the outcome of testing resulted in 100% bioavailability by either method. In addition, a number of soils that were sampled during the course of the study and subjected to in vitro measurements only registered high bioaccessibility (Figure 2), confirming that a broad range of small arms soils have high bioavailability. This was independent of the source of the sample, whether high CEC or high organic matter. Therefore, the overall aim of the project, to verify the in vitro method as a good predictor of the in vivo method, was not rejected, and the results can be submitted as further verification of the in vitro method.
0 5000 10000 15000 20000
0
5000
10000
15000
20000
0
20
40
60
80
100
120
Extractable Pb = 0.96 x Total Pb - 323
Total Pb vs Extractable Pb ()Total Pb vs Bioavailable Pb ()
mean = 91 11%
Total Pb
Ext
ract
able
Pb
% B
ioavailab
le Pb
Figure 2. In vitro bioavailability of all sites.
24
Figure 3. Speciation analysis of study soils.
25
0.0
0.2
0.4
0.6
0.8
1.0
1.2
1.4
1.6
0.0 0.2 0.4 0.6 0.8 1.0 1.2
IVBA
RB
A
Drexler & Brattin, 07 Fit US Army
RBA = 0.878·IVBA - 0.028
R2 = 0.85
95% Prediction Interval
Figure 4. In vivo and in vitro comparison.
Comparison of soils from other studies (courtesy of J. Drexler) with the data from this study. RBA measurments (RBA, y-axis) and in vitro
bioaccessiblity (IVBA) measurments on selected samples.
Table 6. Summary statistics for SAR soils bioavailability.
Estimate RBA (90% Confidence Interval) Measurement Endpoint MD1 MD2
Blood Pb AUC 1.42 1.02 Liver Pb 1.91 (1.44 - 2.54) 1.24 (0.94 - 1.65) Kidney Pb 1.34 (1.03 - 1.76) 1.02 (0.79 - 1.34) Femur Pb 0.92 (0.73 - 1.18) 0.83 (0.66 - 1.07) Point estimate 1.40 (0.80 – 2.18) 1.03 (0.69 - 1.42)
Estimate RBA (90% Confidence Interval) Measurement Endpoint
AK LA Blood Pb AUC 1.02 (0.83 - 1.21) 1.01 (0.81 - 1.19) Liver Pb 1.32 (0.97 - 1.79) 1.25 (0.94 - 1.66) Kidney Pb 1.36 (1.09 - 1.71) 1.33 (1.06 - 1.67) Femur Pb 0.95 (0.83 - 1.09) 0.86 (0.76 - 0.99) Point estimate 1.16 (0.86 - 1.60) 1.12 (0.79 - 1.55)
Estimate RBA (90% Confidence Interval) Measurement Endpoint
NE WA Blood Pb AUC 0.89 (0.69 - 1.14) 1.11 (0.82 - 1.44) Liver Pb 1.44 (0.84 - 3.26) 1.13 (0.54 - 2.91) Kidney Pb 0.93 (0.72 - 1.22) 1.04 (0.81 - 1.36) Femur Pb 0.92 (0.76 - 1.14) 0.98 (0.81 - 1.21) Point estimate 0.93 (0.59 - 1.35) 1.07 (0.67 - 1.55)
Estimate RBA (90% Confidence Interval) Measurement Endpoint
SD OR Blood Pb AUC 0.70 1.03 Liver Pb 0.90 (0.63 - 1.30) 1.14 (0.80 - 1.64) Kidney Pb 0.82 (0.62 - 1.08) 1.29 (0.99 - 1.70) Femur Pb 0.67 (0.55 - 0.82) 1.01 (0.84 - 1.25) Point estimate 0.77 (0.55 - 1.08) 1.12 (0.81 - 1.51)
26
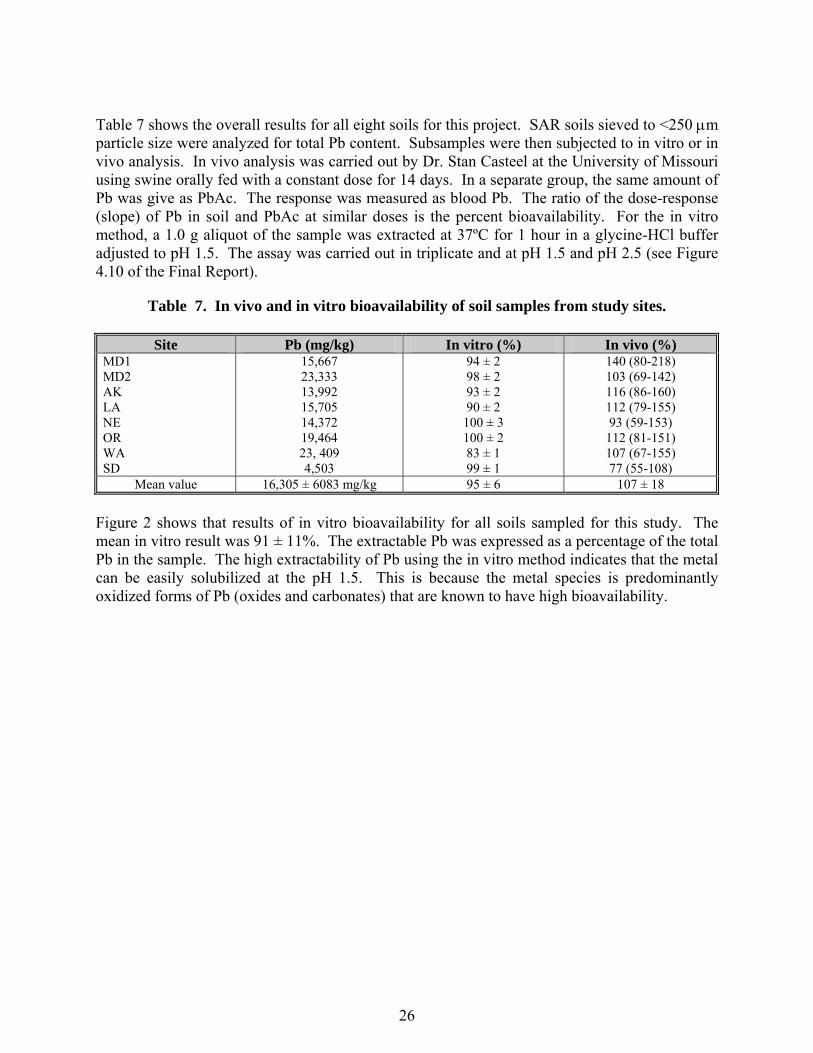
Table 7 shows the overall results for all eight soils for this project. SAR soils sieved to <250 m particle size were analyzed for total Pb content. Subsamples were then subjected to in vitro or in vivo analysis. In vivo analysis was carried out by Dr. Stan Casteel at the University of Missouri using swine orally fed with a constant dose for 14 days. In a separate group, the same amount of Pb was give as PbAc. The response was measured as blood Pb. The ratio of the dose-response (slope) of Pb in soil and PbAc at similar doses is the percent bioavailability. For the in vitro method, a 1.0 g aliquot of the sample was extracted at 37ºC for 1 hour in a glycine-HCl buffer adjusted to pH 1.5. The assay was carried out in triplicate and at pH 1.5 and pH 2.5 (see Figure 4.10 of the Final Report).
Table 7. In vivo and in vitro bioavailability of soil samples from study sites.
Site Pb (mg/kg) In vitro (%) In vivo (%) MD1 MD2 AK LA NE OR WA SD
15,667 23,333 13,992 15,705 14,372 19,464 23, 409 4,503
94 ± 2 98 ± 2 93 ± 2 90 ± 2 100 ± 3 100 ± 2 83 ± 1 99 ± 1
140 (80-218) 103 (69-142) 116 (86-160) 112 (79-155) 93 (59-153)
112 (81-151) 107 (67-155) 77 (55-108)
Mean value 16,305 ± 6083 mg/kg 95 ± 6 107 ± 18
Figure 2 shows that results of in vitro bioavailability for all soils sampled for this study. The mean in vitro result was 91 ± 11%. The extractable Pb was expressed as a percentage of the total Pb in the sample. The high extractability of Pb using the in vitro method indicates that the metal can be easily solubilized at the pH 1.5. This is because the metal species is predominantly oxidized forms of Pb (oxides and carbonates) that are known to have high bioavailability.
27
8.0 COST ASSESSMENT
8.1 COST ANALYSIS
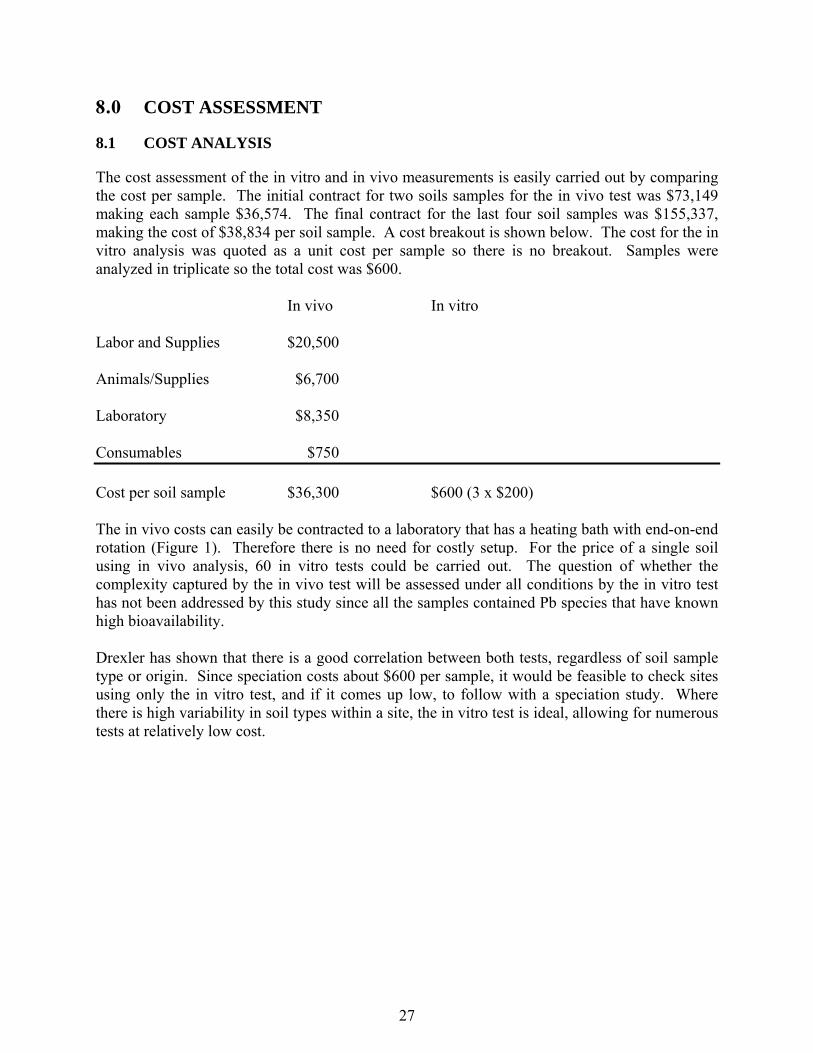
The cost assessment of the in vitro and in vivo measurements is easily carried out by comparing the cost per sample. The initial contract for two soils samples for the in vivo test was $73,149 making each sample $36,574. The final contract for the last four soil samples was $155,337, making the cost of $38,834 per soil sample. A cost breakout is shown below. The cost for the in vitro analysis was quoted as a unit cost per sample so there is no breakout. Samples were analyzed in triplicate so the total cost was $600. In vivo In vitro Labor and Supplies $20,500 Animals/Supplies $6,700 Laboratory $8,350 Consumables $750 Cost per soil sample $36,300 $600 (3 x $200) The in vivo costs can easily be contracted to a laboratory that has a heating bath with end-on-end rotation (Figure 1). Therefore there is no need for costly setup. For the price of a single soil using in vivo analysis, 60 in vitro tests could be carried out. The question of whether the complexity captured by the in vivo test will be assessed under all conditions by the in vitro test has not been addressed by this study since all the samples contained Pb species that have known high bioavailability. Drexler has shown that there is a good correlation between both tests, regardless of soil sample type or origin. Since speciation costs about $600 per sample, it would be feasible to check sites using only the in vitro test, and if it comes up low, to follow with a speciation study. Where there is high variability in soil types within a site, the in vitro test is ideal, allowing for numerous tests at relatively low cost.

This page left blank intentionally.
29
9.0 IMPLEMENTATION ISSUES
Since this was not a demonstration of a proposed technology in the field, there are no implementation issues. However, the study did assess the in vitro method, which has been widely used for assessment of solubility of Pb. The method could be run by any inorganic analytical laboratory since it requires minimal reagents, a water bath, and analytical spectroscopy for metals. The in vitro method is an ideal, low-cost screening tool for large numbers of samples from ranges and can detect low bioavailability if present. It has been recommended by the USEPA for use in soils. There are no significant issues in applying this technology; soil sampling can be carried out singly or in composite samples, after which drying and sieving to a particle size of <250 m is carried out. Analysis can be carried out by any metals laboratory that has a water bath and rotation device and spectroscopy.

This page left blank intentionally.
31
10.0 REFERENCES
Canavos, C. G. 1984. Applied Probability and Statistical Methods. Little, Brown, and Co., Boston.
Cao, X., L. Q. Ma, M. Chen, D. Hardison, Jr., and W. G. Harris. 2003. “Weathering of lead
bullets and their environmental effects at outdoor shooting ranges.” J Environ Qual 32(2): 526-34.
Casteel, S. W., R. P. Cowart, C. P. Weis, G. M. Henningsen, E. Hoffman, W. J. Brattin, R. E.
Guzman, M. F. Starost, J. T. Payne, S. L. Stockham, S. V. Becker, J. W. Drexler, and J. R. Turk. 1997. “Bioavailability of lead to juvenile swine dosed with soil from the Smuggler Mountain NPL Site of Aspen, Colorado.” Fundam Appl Toxicol 36(2): 177-87.
Casteel, S. W., C. P. Weis, G. M. Henningsen, and W. J. Brattin. 2006. “Estimation of relative
bioavailability of lead in soil and soil-like materials using young swine.” Environ Health Perspect 114(8): 1162-71.
Draper, N. R., and H. Smith. 1998. Applied Regression Analysis (3rd Edition). John Wiley &
Sons, New York. Drexler, J., and W. J. Brattin. 2007. “An in vitro procedure for estimation of lead relative
bioavailability with validation.” Hum Ecol Risk Assess. 13: 383-401. Drexler, J. W. 1997. Validation of an in vitro method: A tandem approach to estimating the
bioavailability of lead and arsenic in humans. IBC Conference on Bioavailability, Scottsdale, AZ.
Drexler, J. W., C. Weis, and W. Brattin. 2003. “Relative bioavailability of lead: A validated in
vitro procedure.” Journal of Applied Toxicology. Finney, D. J. 1978. Statistical Method in Biological Assay, Charles Griffin and Company. Jorgensen, S. S. 1987. “The fate of lead in soils: the transformation of lead pellets in shooting
range soils.” Ambio(16): 11-15. Medlin, E. A. 1997. An In Vitro method for estimating the relative bioavailability of lead in
humans. Masters thesis. Department of Geological Sciences, University of Colorado, Boulder.
Smith, G. R. 1998. “Lead: lead statistics and information, mineral commodity summary.” U.S.
Geological Survey Minerals Year Handbook 1998. USEPA. 1994. Guidance Manual for the Integrated Exposure Uptake Biokinetic Model for Lead
in Children. United States Environmental Protection Agency and OSWER Response.

32
USEPA. 2004. Estimation of relative bioavailability of lead in soil and soil like materials using in vivo and in vitro methods. OSWER 9285.7-77.
USEPA. 2005. Best Management Practises for Lead at Outdoor Shooting Ranges. R. 2, U.S.
Environmental Protection Agency. EPA-902-B-01-001.
A-1
APPENDIX A
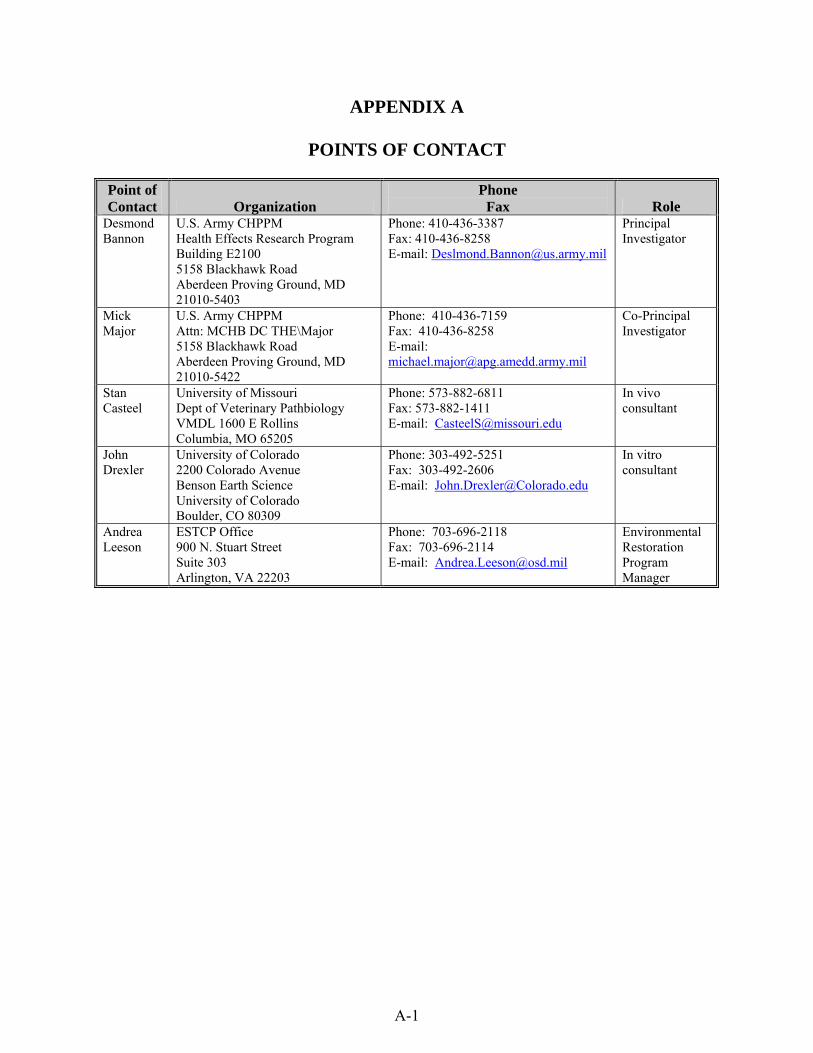
POINTS OF CONTACT
Point of Contact Organization
Phone Fax Role
Desmond Bannon
U.S. Army CHPPM Health Effects Research Program Building E2100 5158 Blackhawk Road Aberdeen Proving Ground, MD 21010-5403
Phone: 410-436-3387 Fax: 410-436-8258 E-mail: [email protected]
Principal Investigator
Mick Major
U.S. Army CHPPM Attn: MCHB DC THE\Major 5158 Blackhawk Road Aberdeen Proving Ground, MD 21010-5422
Phone: 410-436-7159 Fax: 410-436-8258 E-mail: [email protected]
Co-Principal Investigator
Stan Casteel
University of Missouri Dept of Veterinary Pathbiology VMDL 1600 E Rollins Columbia, MO 65205
Phone: 573-882-6811 Fax: 573-882-1411 E-mail: [email protected]
In vivo consultant
John Drexler
University of Colorado 2200 Colorado Avenue Benson Earth Science University of Colorado Boulder, CO 80309
Phone: 303-492-5251 Fax: 303-492-2606 E-mail: [email protected]
In vitro consultant
Andrea Leeson
ESTCP Office 900 N. Stuart Street Suite 303 Arlington, VA 22203
Phone: 703-696-2118 Fax: 703-696-2114 E-mail: [email protected]
Environmental Restoration Program Manager

ESTCP Program Office
901 North Stuart StreetSuite 303Arlington, Virginia 22203
(703) 696-2117 (Phone)(703) 696-2114 (Fax)
E-mail: [email protected]