esmo e-learning: imaging biomarkers in breast oncology ... · imaging biomarkers in breast oncology...
TRANSCRIPT

Imaging biomarkers in breast
oncology practice
Elizabeth O’FlynnClinical Lecturer and Consultant Radiologist
Institute of Cancer Research and Royal Marsden Hospital,
London, United Kingdom

Background
Neoadjuvant chemotherapy (NAC):
Clinical response rates 70–98%1,2
Pathological complete response (pCR) 3–16%3
1. Powles TJ, et al. J Clin Oncol 1995;13:547–552; 2. Fisher B, et al. J Clin Oncol 1998;16:2672–2685;
3. Swain SM, et al. Cancer Res 1987;47:3889–94.
Images courtesy of Dr Elizabeth O’Flynn.
Pre-treatment End of treatmentPre-treatment Post-treatment (pCR)
Signal void from markerTumour

Predicting response
1. After completion of NAC to guide surgery
2. At baseline (prior to commencing NAC)
3. At an early time point (1 or 2 cycles after commencing NAC)

Predicting response after completion
of NAC
MRI gives more accurate staging compared to clinical examination
mammography and US1–4
1. Chagpar AB, et al. Ann Surg 2006;243:257–264; 2. Akawawa K, et al. Breast J 2006;12:130–137; 3. Montemurro F, et al.
Eur Radiol 2005,15:1224–1233; 4. Marinovich ML, et al. Br J Cancer 2013;109:1528–1536.
Author n
Pooled mean difference
(95% confidence intervals) (cm)
MRI
Clinical
exam Mammo US
Marinovich et al.
201319
0.1
(-0.2, 0.3)
-0.3
(-0.7, 0.0)
0.4
(-0.5, 1.3)
0.1
(-0.1, 0.4)

Underestimation of residual disease
Post-treatment
Tumour reduced
enhancement
Tumour
Pre-treatment
Images courtesy of Dr Elizabeth O’Flynn.
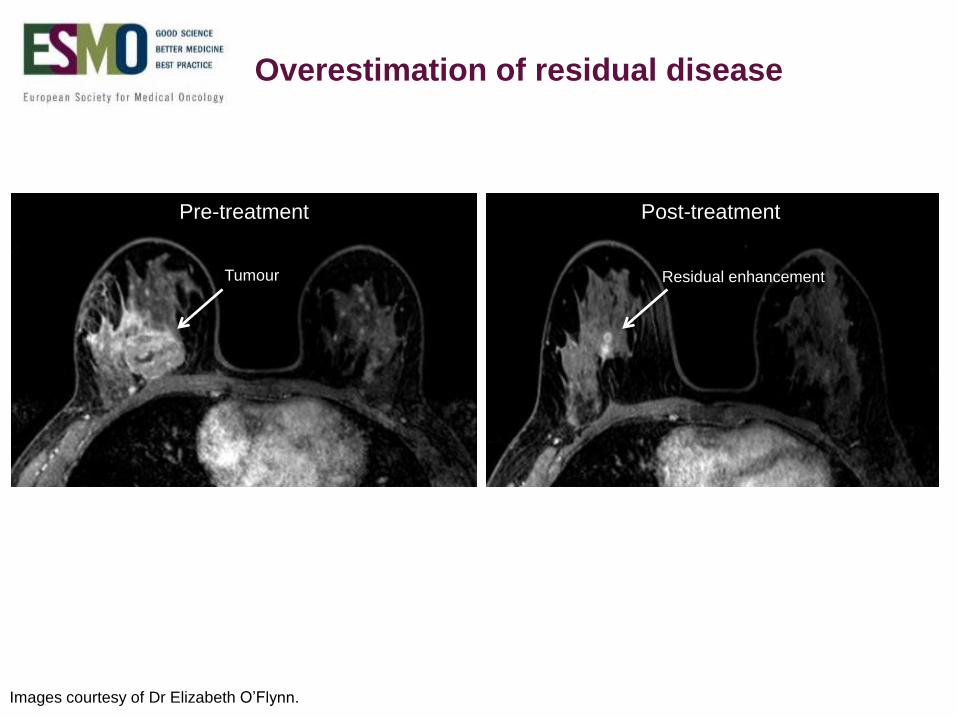
Overestimation of residual disease
Pre-treatment Post-treatment
Tumour Residual enhancement
Images courtesy of Dr Elizabeth O’Flynn.

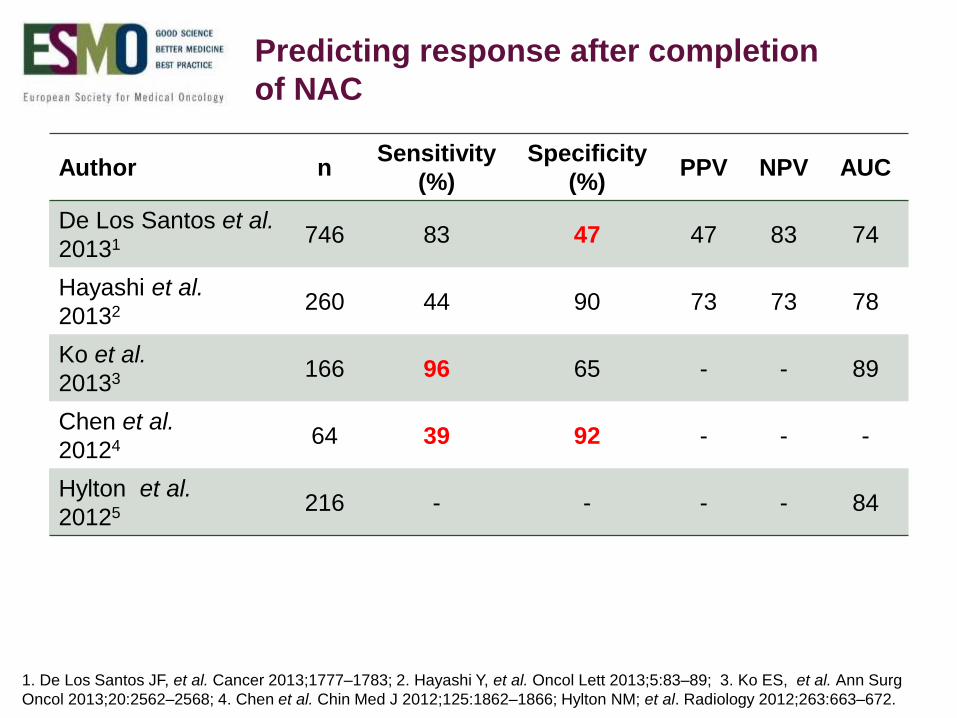
Predicting response after completion
of NAC
Author nSensitivity
(%)
Specificity
(%)PPV NPV AUC
De Los Santos et al.
20131 746 83 47 47 83 74
Hayashi et al.
20132 260 44 90 73 73 78
Ko et al.
20133 166 96 65 - - 89
Chen et al.
20124 64 39 92 - - -
Hylton et al.
20125 216 - - - - 84
1. De Los Santos JF, et al. Cancer 2013;1777–1783; 2. Hayashi Y, et al. Oncol Lett 2013;5:83–89; 3. Ko ES, et al. Ann Surg
Oncol 2013;20:2562–2568; 4. Chen et al. Chin Med J 2012;125:1862–1866; Hylton NM. et al. Radiology 2012;263:663–672.
Predicting response after completion
of NAC
Author nSensitivity
(%)
Specificity
(%)PPV NPV AUC
De Los Santos et al.
20131 746 83 47 47 83 74
Hayashi et al.
20132 260 44 90 73 73 78
Ko et al.
20133 166 96 65 - - 89
Chen et al.
20124 64 39 92 - - -
Hylton et al.
20125 216 - - - - 84
1. De Los Santos JF, et al. Cancer 2013;1777–1783; 2. Hayashi Y, et al. Oncol Lett 2013;5:83–89; 3. Ko ES, et al. Ann Surg
Oncol 2013;20:2562–2568; 4. Chen et al. Chin Med J 2012;125:1862–1866; Hylton NM; et al. Radiology 2012;263:663–672.

Molecular subtypes of breast cancer
Molecular subtype Biomarker profile Prevalence
Luminal AER+ and/or PR+,
HER2-, low Ki67<14%42-59%
Luminal B
ER+ and/or PR+ and HER2+
ER+ and/or PR+, HER2-,
high Ki67>14%
6-19%
Basal-like/ triple negativeER-, PR- , HER2-,
cytokeratin 5/6+ and/or EGFR+14-20%
HER2 ER-, PR-, HER2+ 7-12%
ER = oestrogen receptor
PR = progesterone receptor
HER2 = human epidermal growth factor receptor 2
EGFR = epidermal growth factor receptor
Carey LA, et al. JAMA 2006;295:2492–2502; Nielsen TO, et al. Clin Cancer Res 2004;10:5367–5374; Perou CM, et al. Nature
2000;406:747–752; Rakha EA, et al. Eur J Cancer 2006;42:3149–3156; Sorlie T, et al. Proc Natl Acad Sci USA 2001;
98:10869–10874
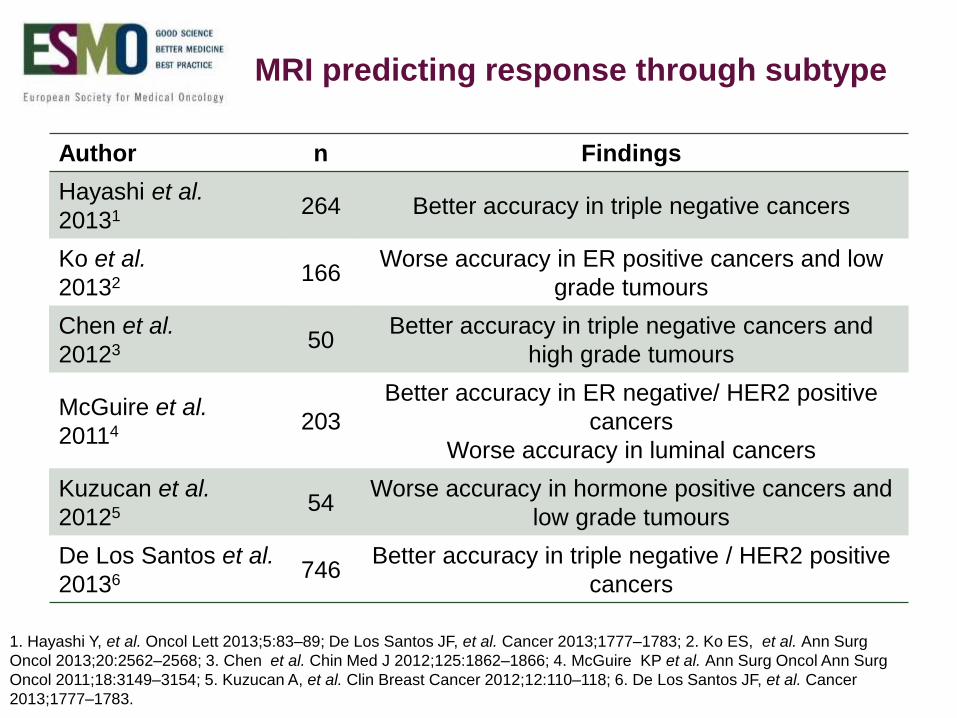
MRI predicting response through subtype
Author n Findings
Hayashi et al.
20131 264 Better accuracy in triple negative cancers
Ko et al.
20132 166Worse accuracy in ER positive cancers and low
grade tumours
Chen et al.
20123 50Better accuracy in triple negative cancers and
high grade tumours
McGuire et al.
20114 203
Better accuracy in ER negative/ HER2 positive
cancers
Worse accuracy in luminal cancers
Kuzucan et al.
20125 54Worse accuracy in hormone positive cancers and
low grade tumours
De Los Santos et al.
20136 746Better accuracy in triple negative / HER2 positive
cancers
1. Hayashi Y, et al. Oncol Lett 2013;5:83–89; De Los Santos JF, et al. Cancer 2013;1777–1783; 2. Ko ES, et al. Ann Surg
Oncol 2013;20:2562–2568; 3. Chen et al. Chin Med J 2012;125:1862–1866; 4. McGuire KP et al. Ann Surg Oncol Ann Surg
Oncol 2011;18:3149–3154; 5. Kuzucan A, et al. Clin Breast Cancer 2012;12:110–118; 6. De Los Santos JF, et al. Cancer
2013;1777–1783.

MRI predicting response through subtype
Author n Findings
Hayashi et al.
20131 264 Better accuracy in triple negative cancers
Ko et al.
20132 166Worse accuracy in ER positive cancers and low
grade tumours
Chen et al.
20123 50Better accuracy in triple negative cancers and
high grade tumours
McGuire et al.
20114 203
Better accuracy in ER negative/ HER2 positive
cancers
Worse accuracy in luminal cancers
Kuzucan et al.
20125 54Worse accuracy in hormone positive cancers and
low grade tumours
De Los Santos et al.
20136 746Better accuracy in triple negative / HER2
positive cancers
1. Hayashi Y, et al. Oncol Lett 2013;5:83–89; De Los Santos JF, et al. Cancer 2013;1777–1783; 2. Ko ES, et al. Ann Surg Oncol
2013;20:2562–2568; 3. Chen et al. Chin Med J 2012;125:1862–1866; 4. McGuire KP et al. Ann Surg Oncol 2011;18:3149–
3154; 5. Kuzucan A, et al. Clin Breast Cancer 2012;12:110–118; 6. De Los Santos JF, et al. Cancer 2013;1777–1783.

MRI predicting response through subtype
Author n Findings
Hayashi et al.
20131 264 Better accuracy in triple negative cancers
Ko et al.
20132 166Worse accuracy in ER positive cancers and
low grade tumours
Chen et al.
20123 50Better accuracy in triple negative cancers and
high grade tumours
McGuire et al.
20114 203
Better accuracy in ER negative/ HER2 positive
cancers
Worse accuracy in luminal cancers
Kuzucan et al.
20125 54Worse accuracy in hormone positive cancers
and low grade tumours
De Los Santos et al.
20136 746Better accuracy in triple negative / HER2 positive
cancers
1. Hayashi Y, et al. Oncol Lett 2013;5:83–89; De Los Santos JF, et al. Cancer 2013;1777–1783; 2. Ko ES, et al. Ann Surg Oncol
2013;20:2562–2568; 3. Chen et al. Chin Med J 2012;125:1862–1866; 4. McGuire KP et al. Ann Surg Oncol 2011;18:3149–
3154; 5. Kuzucan A, et al. Clin Breast Cancer 2012;12:110–118; 6. De Los Santos JF, et al. Cancer 2013;1777–1783.
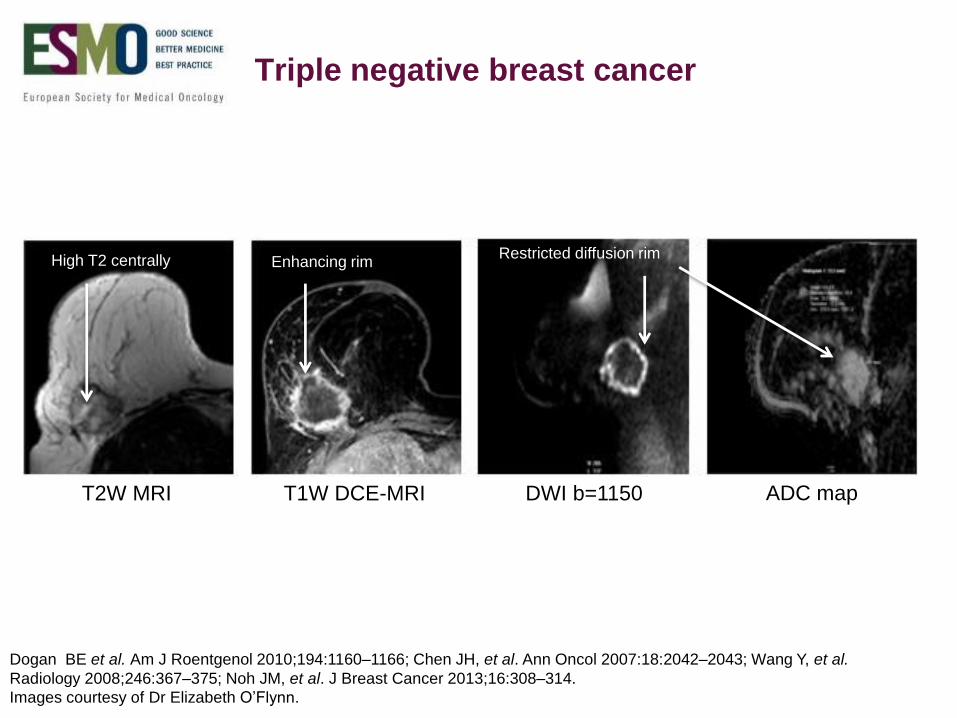
T2W MRI T1W DCE-MRI DWI b=1150 ADC map
Triple negative breast cancer
Dogan BE et al. Am J Roentgenol 2010;194:1160–1166; Chen JH, et al. Ann Oncol 2007:18:2042–2043; Wang Y, et al.
Radiology 2008;246:367–375; Noh JM, et al. J Breast Cancer 2013;16:308–314.
Enhancing rimHigh T2 centrally Restricted diffusion rim
Images courtesy of Dr Elizabeth O’Flynn.

Author n Study Sensitivity Specificity
Lobbes et al.
20131 35Systematic
review
Range
25 - 100%
Range
50 - 97%
Marinovich et al.
20132 44 Meta-analysis
Pooled
estimate
83 - 87%
Pooled
estimate
54 - 83%
MRI accuracy for residual disease
1. Lobbes MB, et al. Insights Imaging 2013;4:163–175; 2. Marinovich L, et al. J Natl Cancer Inst 2013;105:321–333.

Technique n Author Sensitivity Specificity PPV NPV
Clinical
exam
32 Arimappamagan
et al. 200486 64 40 94
US 32 Arimappamagan
et al. 2004
Heiken et al.
2013
86
58
100
70
100
57
96
71
MRI 88 Heiken et al.
201359 61 43 75
Nomogram 291 Schipper et al.
201443 88 65 75
Imaging techniques for predicting pCR in restaging the axilla post NAC
Schipper et al. Eur J Radiol 2015;84:41–47

Predicting response at baseline
Author n Factors predictive of response
Li et al.
20101 264 Traditional prognostic factors
Uematsu et al.
20102 166 Mass effect and wash-out pattern
Park et al.
20103 50 Lower pre-treatment ADC
Fangberget et al.
20114 264 HER2 overexpression
1. Li SP, et al. Radiology 2010;257:643–652; 2. Uematsu T, et al. Eur Rad 2010;20:2315-–2322; 3. Park SH, et al. Radiology
2010; 257:56–63; 4. Fangberget A, et al. Eur Radiol 2011;21:1188–1199.
MRI
Standard
Measurements
(RECIST)
MR Spectroscopy
Intrinsic
Susceptibility
Weighted
MRI (R2*)
Diffusion-
Weighted
Imaging (DWI)
Dynamic
Contrast
Enhanced MRI
(DCE-MRI)
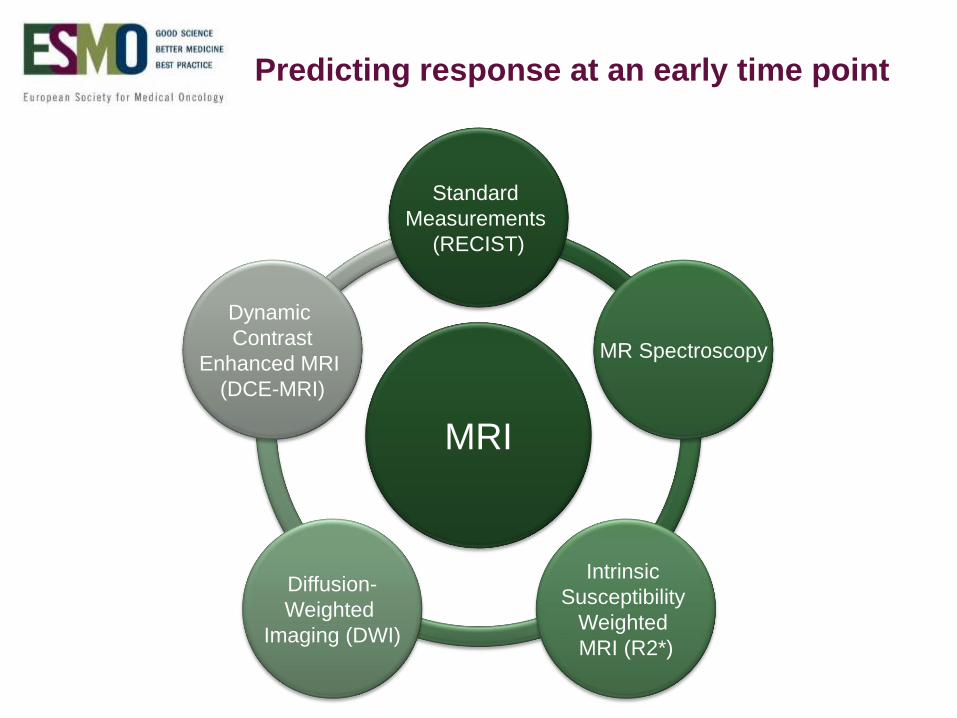
Predicting response at an early time point

MRI
Standard
Measurements
(RECIST)
MR Spectroscopy
Intrinsic
Susceptibility
Weighted
MRI (R2*)
Diffusion-
Weighted
Imaging (DWI)
Dynamic
Contrast
Enhanced MRI
(DCE-MRI)
b=1150
Time-signal
Intensity
curves
Ktrans, kep, ve
Apparent Diffusion
Coefficient (ADC)
Choline
peak at
3.2ppm
R2*=1/T2*
Tumour diameter
Tumour volume
Images courtesy of Dr Elizabeth O’Flynn.

MRI
Standard
Measurements
(RECIST)
MRI parameters
Tumour Diameter
Tumour Volume
Image courtesy of Dr Elizabeth O’Flynn.

Dynamic
Contrast
Enhanced MRI
(DCE-MRI)
MRI parameters
VASCULARITY
Semi-quantitative parameters:
Time-signal intensity curves
Maximum signal intensity
Absolute MRI signal intensity
Relative MRI signal intensity
Normalised MRI signal intensity
Initial Area Under the Gadolinium Curve (IAUGC)
Enhancement Fraction
Pharmacokinetically modelled parameters:
Ktrans
kep
Ve
Textural analysis
Images courtesy of Dr Elizabeth O’Flynn.

Dynamic contrast enhanced (DCE)-MRI
Ktrans
Transfer constantkep
rate constant
renal excretion
Gd-DTPA
iv injection
Blood plasma
Ve
extravascular extracellular
space
Normal Tumour
Endothelial cells3
Pericyte – red3
Pharmacokinetic modelling1,2
1. Courtesy of O’Flynn EAM, et al. Breast Cancer Research 2011;13:204; 2. Tofts PS, et al. J Magn Reson Imaging
1999;10:223–232; 3. McDonald DM, et al. Nat Med 2003;9:713–725. Reprinted by permission from Macmillan Publishers Ltd:
Nature Medicine, © 2003

DCE-MRI Assessing treatment response
Author n RespondersNon-
responders
Time point
imaged after
NAC
Ah-See et al.
20081 19Ktrans ↓ 40%
kep ↓ 33%
Ktrans ↑ 18%
kep ↑ 7%2 cycles
Pickles et al.
20052 68
Ktrans ↓ 20%
kep ↓ 20%
ve ↑ 4%
Ktrans ↓ 20%
kep ↓ 36%
ve ↑ 28%
“early time
point”
Padhani et al.
20063 15Ktrans ↓ 22%
kep ↓ 62%
Ktrans ↓ 7%
kep ↓ 25%
1 cycle
2 cycles
Yu et al.
20074 29Ktrans ↓ 5%
kep ↓ 14%
Ktrans ↑ 8%
kep ↑ 7%1 cycle
Yu et al.
20105 32Ktrans ↓ 49%
ve ↓ 27%
Ktrans ↓ 18%
ve ↓ 13%2 cycles
1. Ah-See ML, et al. Clin Can Res 2008;14:6580–6589; 2. Pickles MD, et al. Breast Cancer Res Treat 2005;91:1–10; 3.Padhani
et al. Radiology 2006;239:361–374; 4. Yu JH, et al. J Magn Reson Imaging 2007;26:615–623; 5.Yu Y, et al. Radiology
2010;257:47–55.

Diffusion-
Weighted
Imaging (DWI)
MRI parameters
DWI b=1150 ADC map
CELLULARITY
ADC = Apparent Diffusion Coefficient
Images courtesy of Dr Elizabeth O’Flynn.
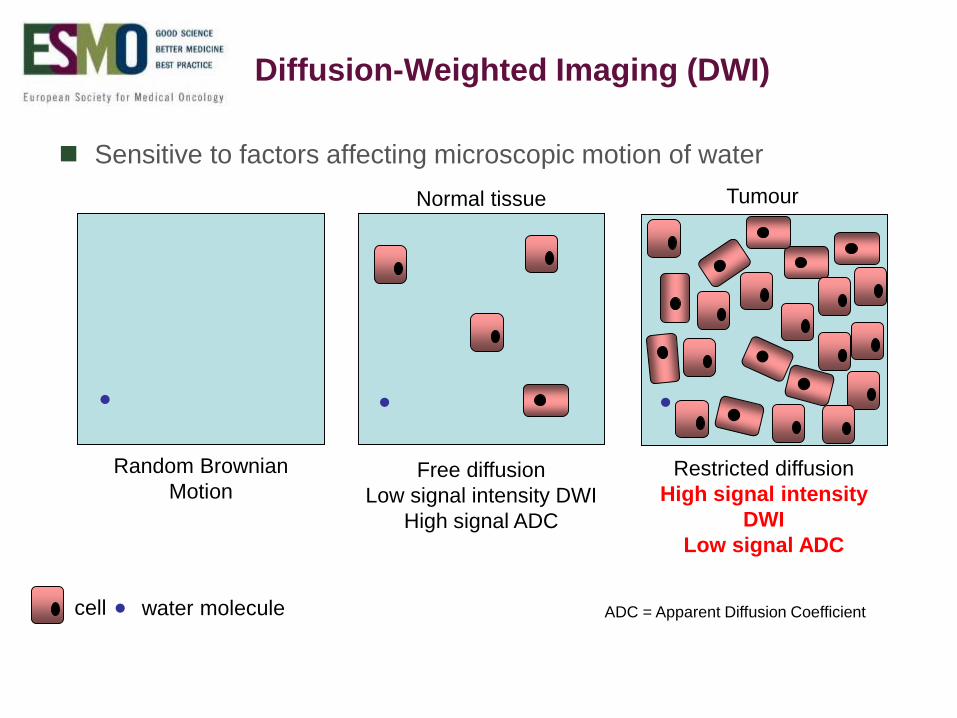
ADC = Apparent Diffusion Coefficient
● ● ●
●
Random Brownian
MotionFree diffusion
Low signal intensity DWI
High signal ADC
Restricted diffusion
High signal intensity
DWI
Low signal ADC
cell water molecule
Normal tissue Tumour
Diffusion-Weighted Imaging (DWI)
Sensitive to factors affecting microscopic motion of water

b (s/mm2)
In (
S/S
0
ADC = Apparent Diffusion Coefficient
b = 0
b = 350
b = 700
b = 1150
ADC map
S = S0e-b.ADC
DWI
Images courtesy of Dr Elizabeth O’Flynn.

Rise in ADC
Tumour size static
1. O’Flynn EA, et al. Eur Radiol 2012;22:1512–1518; 2. Pickles MD, et al. Magn Reson Imaging 2006;24:843–847
DWI
ADC values reproducible1
DWI has shown an increase in ADC prior to any change in breast
tumour size2
0 1 2
Treatment cycles
0.60.5
0.70.80.91.01.11.21.31.41.5
No
rmalised
ADC (normalised) Diameter (normalised)

DWI – Assessing treatment response
Author n RespondersTime point imaged after
NAC
Pickles et al.
20061 10ADC ↑ 16%
ADC↑ 27%
1 cycle
2 cycles
Sharma et al.
20092
14
24
29
ADC ↑ 15%
ADC ↑ 27%
ADC ↑35%
1 cycle
2 cycles
3 cycles
Nilsen et al.
20103 25 ADC ↑ 25% 4 cycles
Fangberget et al.
20114 29 ADC ↑ 40% 4 cycles
1. Pickles MD, et al. Magn Reson Imaging 2006;24:843–847; 2. Sharma U, et al. NMR Biomed 2009;22:104–113;
3. Nilsen l, et al. Acta Oncol 2010;49:354–360; 4. Fangberget A, et al. Eur Radiol 2011;21:1188–1199.
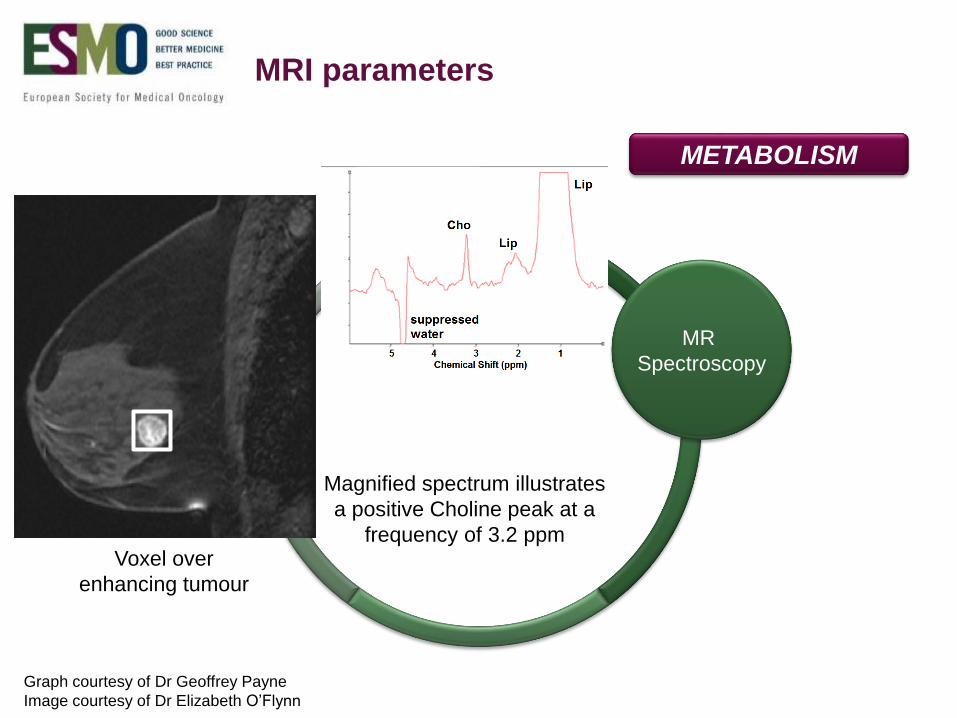
MR
Spectroscopy
MRI parameters
Voxel over
enhancing tumour
METABOLISM
Magnified spectrum illustrates
a positive Choline peak at a
frequency of 3.2 ppm
Graph courtesy of Dr Geoffrey Payne
Image courtesy of Dr Elizabeth O’Flynn
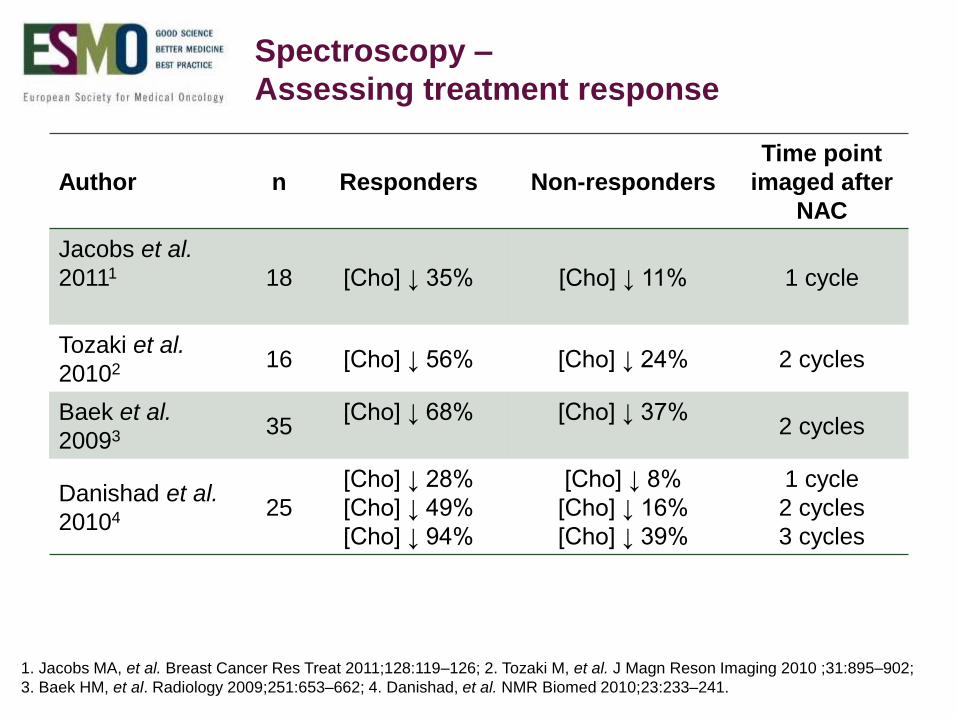
Spectroscopy –
Assessing treatment response
Author n Responders Non-responders
Time point
imaged after
NAC
Jacobs et al.
20111 18 [Cho] ↓ 35% [Cho] ↓ 11% 1 cycle
Tozaki et al.
20102 16 [Cho] ↓ 56% [Cho] ↓ 24% 2 cycles
Baek et al.
20093 35[Cho] ↓ 68% [Cho] ↓ 37%
2 cycles
Danishad et al.
20104 25
[Cho] ↓ 28%
[Cho] ↓ 49%
[Cho] ↓ 94%
[Cho] ↓ 8%
[Cho] ↓ 16%
[Cho] ↓ 39%
1 cycle
2 cycles
3 cycles
1. Jacobs MA, et al. Breast Cancer Res Treat 2011;128:119–126; 2. Tozaki M, et al. J Magn Reson Imaging 2010 ;31:895–902;
3. Baek HM, et al. Radiology 2009;251:653–662; 4. Danishad, et al. NMR Biomed 2010;23:233–241.
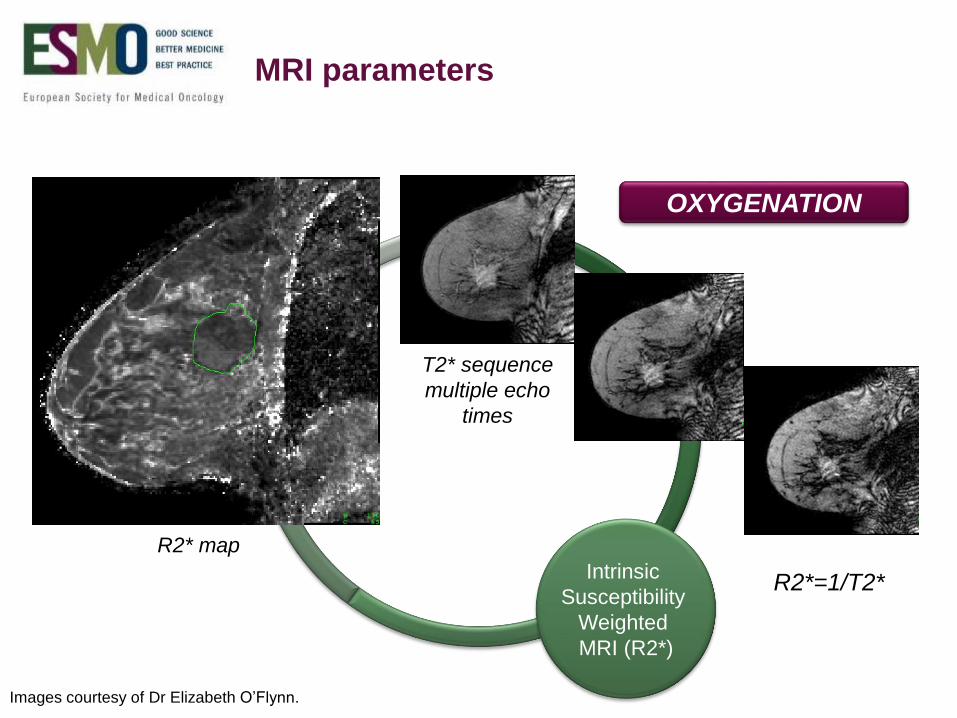
Intrinsic
Susceptibility
Weighted
MRI (R2*)
MRI parameters
T2* sequence
multiple echo
times
R2* map
OXYGENATION
R2*=1/T2*
Images courtesy of Dr Elizabeth O’Flynn.
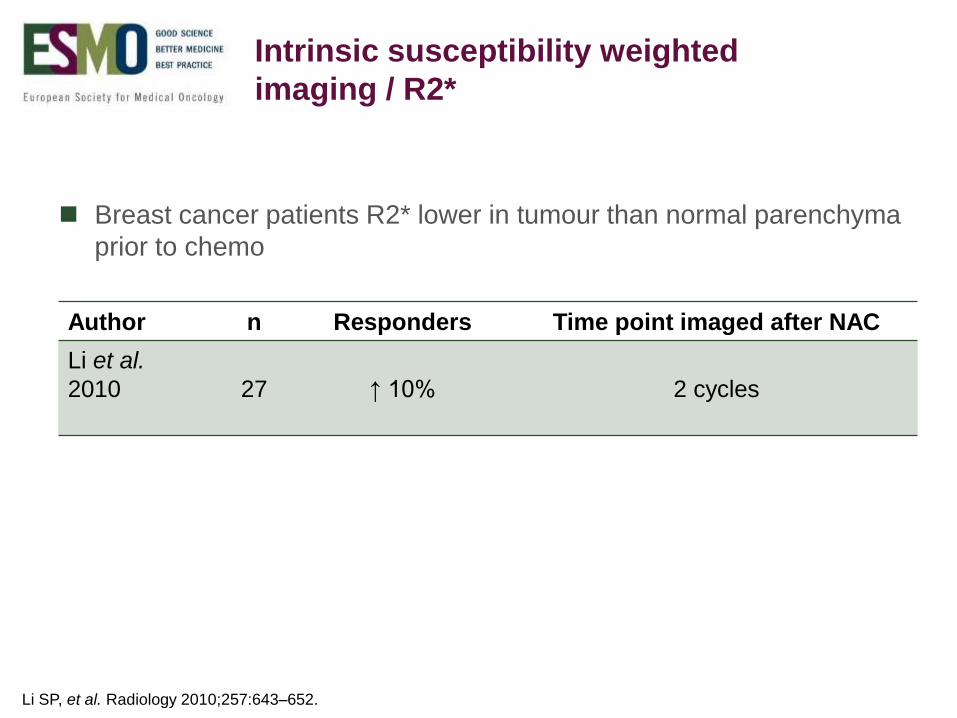
Author n Responders Time point imaged after NAC
Li et al.
2010 27 ↑ 10% 2 cycles
Li SP, et al. Radiology 2010;257:643–652.
Intrinsic susceptibility weighted
imaging / R2*
Breast cancer patients R2* lower in tumour than normal parenchyma
prior to chemo
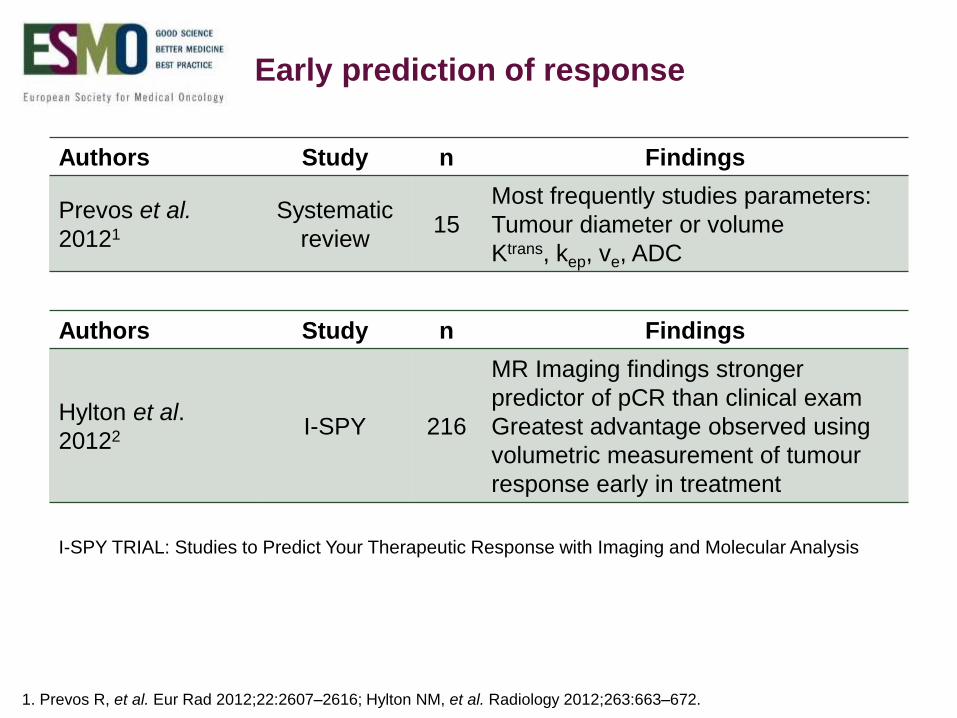
Early prediction of response
Authors Study n Findings
Prevos et al.
20121
Systematic
review15
Most frequently studies parameters:
Tumour diameter or volume
Ktrans, kep, ve, ADC
1. Prevos R, et al. Eur Rad 2012;22:2607–2616; Hylton NM, et al. Radiology 2012;263:663–672.
I-SPY TRIAL: Studies to Predict Your Therapeutic Response with Imaging and Molecular Analysis
Authors Study n Findings
Hylton et al.
20122 I-SPY 216
MR Imaging findings stronger
predictor of pCR than clinical exam
Greatest advantage observed using
volumetric measurement of tumour
response early in treatment

Multiparametric MRI
Improved diagnostic
accuracy combining
DCE-MRI, DWI
and MR Spectroscopy
Change in enhancement
fraction after 2 cycles
was the best
discriminator of response
1. Pinker K, et al. Invest Radiol 2014;49:421–430;
2. O’Flynn EA, et al. ISMRM Proceedings. 2014.
Images courtesy of Dr Elizabeth O’Flynn

Summary
Many MRI parameters and time points at which to predict response
No definite advantage of MRI assessment over US but more larger
scale studies needed
Tumour subtype plays a crucial role accuracy of MRI
Assessment of tumour volume and the ADC hold most potential for
incorporation into routine clinical practice
Standardisation required
Acknowledgments
ICR The Institute of Cancer research
Cancer Research UK
The Royal Marsden – NHS Foundation Trust

THANK YOU!