esci 1101 spring_2011_chapter_02_guided_notes
TRANSCRIPT

© 2007, John Wiley and Sons, Inc.
Physical GeographyPhysical Geographyby Alan Arbogastby Alan Arbogast
Chapter 2Chapter 2
The Geographer’s Tools
Lawrence McGlinnDepartment of GeographyState University of New York - New Paltz
© 2007, John Wiley and Sons, Inc.
ToolsTools
• Geographic grid
• Maps
• Digital Technology

© 2007, John Wiley and Sons, Inc.
Geographic GridGeographic Grid
• Great Circles
• Small Circles

© 2007, John Wiley and Sons, Inc.
Geographic GridGeographic Grid
• Latitude
• _____________
• _____________
• N & S Hemispheres
• Low, Middle and
High LatitudesGeographic Grid

© 2007, John Wiley and Sons, Inc.
Geographic GridGeographic Grid
• Longitude
• _____________
• _____________

© 2007, John Wiley and Sons, Inc.
MapsMaps
• What Is a Map?• 1. A map is a two-dimensional (flat)
representation of the whole Earth or a specific region of the Earth.
• 2. A map is a generalized view of an area, as seen from above, that is reduced in size.
• 3. A map is a tool that is used to depict ___________________________________
© 2007, John Wiley and Sons, Inc.
MapsMaps
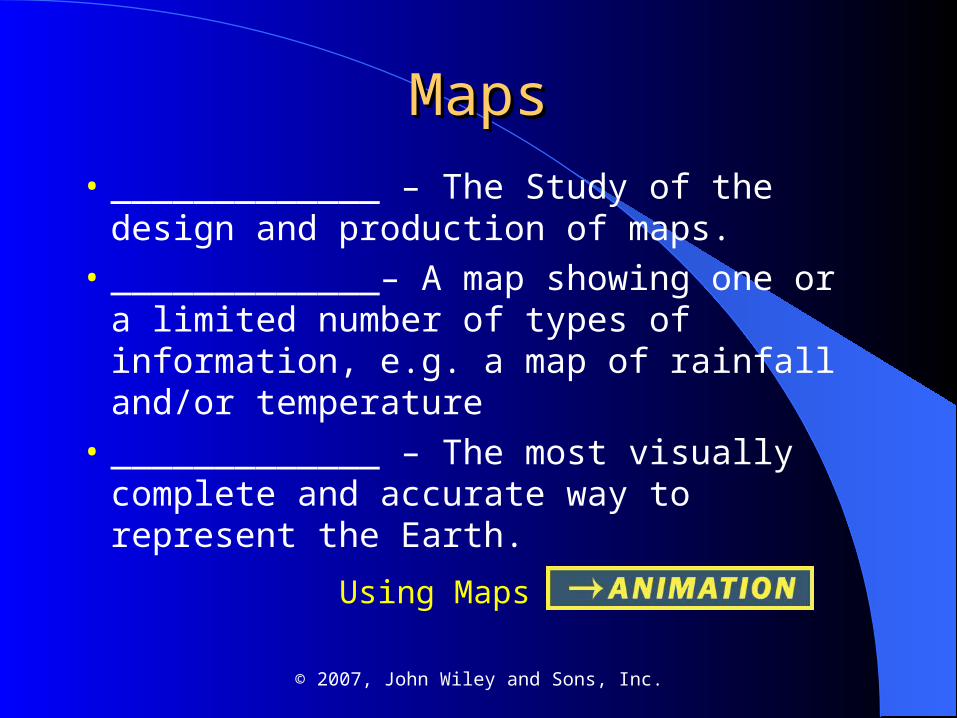
• _____________ – The Study of the design and production of maps.
• _____________– A map showing one or a limited number of types of information, e.g. a map of rainfall and/or temperature
• _____________ – The most visually complete and accurate way to represent the Earth.
Using Maps

© 2007, John Wiley and Sons, Inc.
MapsMaps
• _____________– Representation of the 3-dimensional Earth on a 2-dimensional surface
• _____________
• 2 types of projection:
• _____________ – Shape OK
• _____________ – Size OK
© 2007, John Wiley and Sons, Inc.
MapsMaps
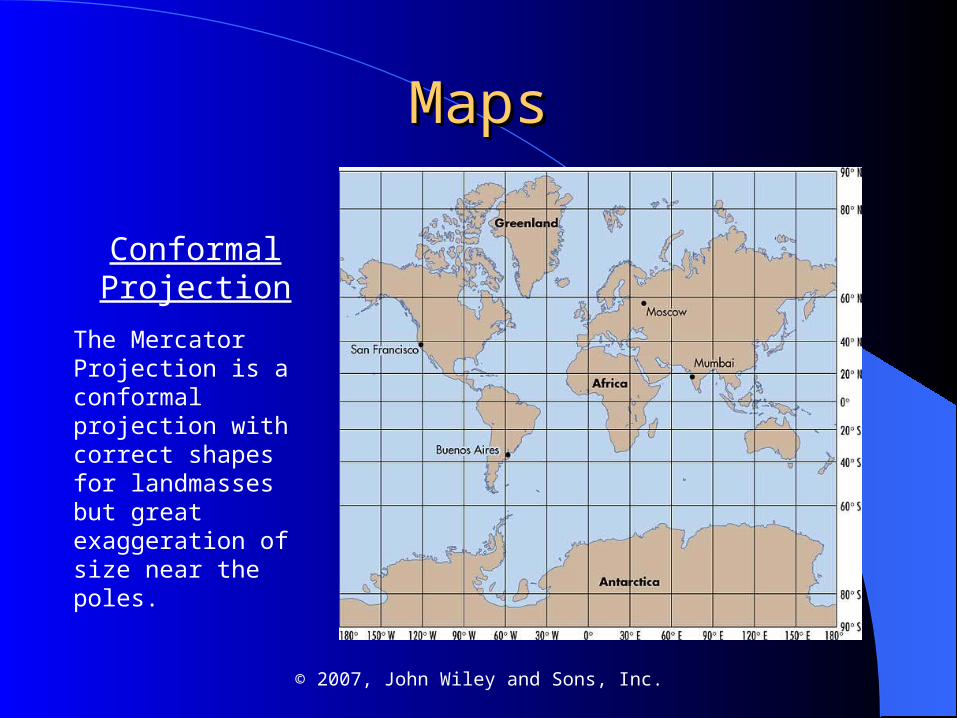
The Mercator Projection is a conformal projection with correct shapes for landmasses but great exaggeration of size near the poles.
ConformalProjection

© 2007, John Wiley and Sons, Inc.
MapsMaps• Equivalent Projection – This Albers Equal-Area Projection (the
standard projection for the continental US) is an example of an equivalent projection. Size is consistent throughout this map, but shape is distorted, especially toward the poles and toward the equator.

© 2007, John Wiley and Sons, Inc.
MapsMaps
• _____________– The distance ratio between features on a map and features in the real world (linear)
• _____________– small area, fine detail
• _____________– large area, little detail

© 2007, John Wiley and Sons, Inc.
Large ScaleVerbal Scale 1 inch = 0.25 miles
Representative Fraction 1:16,000
Bar Scale 0 0.4 Miles
Courtesy : USGS
0 5000 Miles
Small ScaleVerbal Scale 1 inch = 3000 miles
Representative Fraction 1:190,000,000
Bar Scale
© 2007, John Wiley and Sons, Inc.
MapsMaps
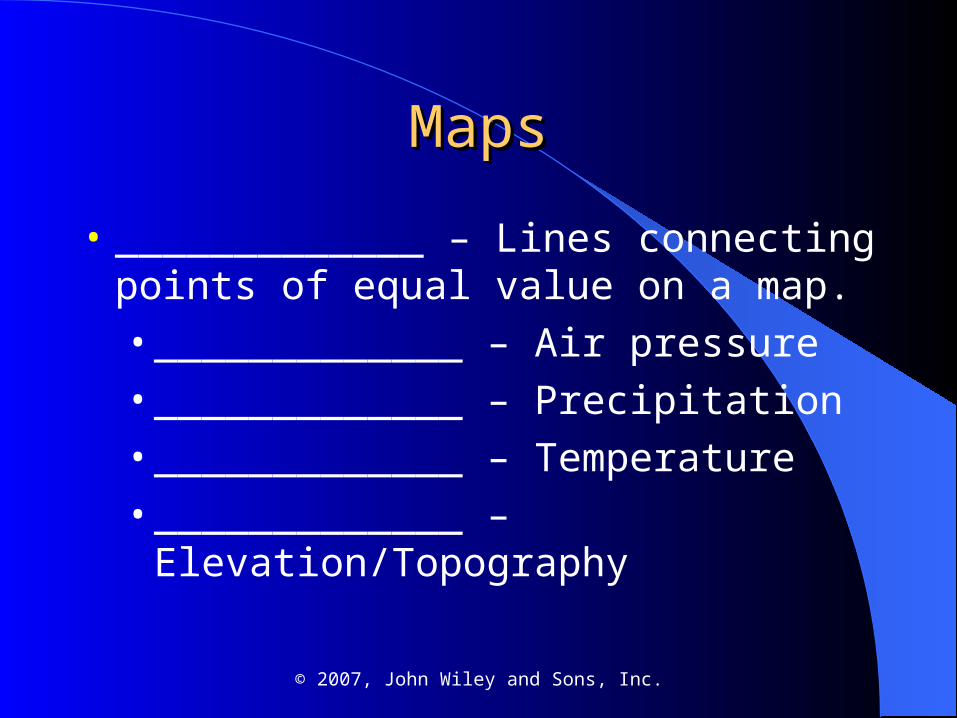
• _____________ – Lines connecting points of equal value on a map.
• _____________ – Air pressure
• _____________ – Precipitation
• _____________ – Temperature
• _____________ – Elevation/Topography

© 2007, John Wiley and Sons, Inc.
Constructing an Isoline Map
Starting with a map of tempera-tures at weather stations (a),Isotherms for 2 degree intervalsare drawn (b) & (c). Then, shading is added, showing thegeographic patterns oftemperature over the upperMidwest (d).
© 2007, John Wiley and Sons, Inc.
Digital TechnologyDigital Technology
• _____________– Data collected from aerial photography and satellite imagery.
• __________________________– System of satellites & receivers to plot location.
• __________________________- System to manipulate & display spatial data.

© 2007, John Wiley and Sons, Inc.
Remote SensingRemote Sensing
• Aerial Photography
• Discern Spatial
Patterns
• Resource Inventory
• Emergency
Management
© 2007, John Wiley and Sons, Inc.
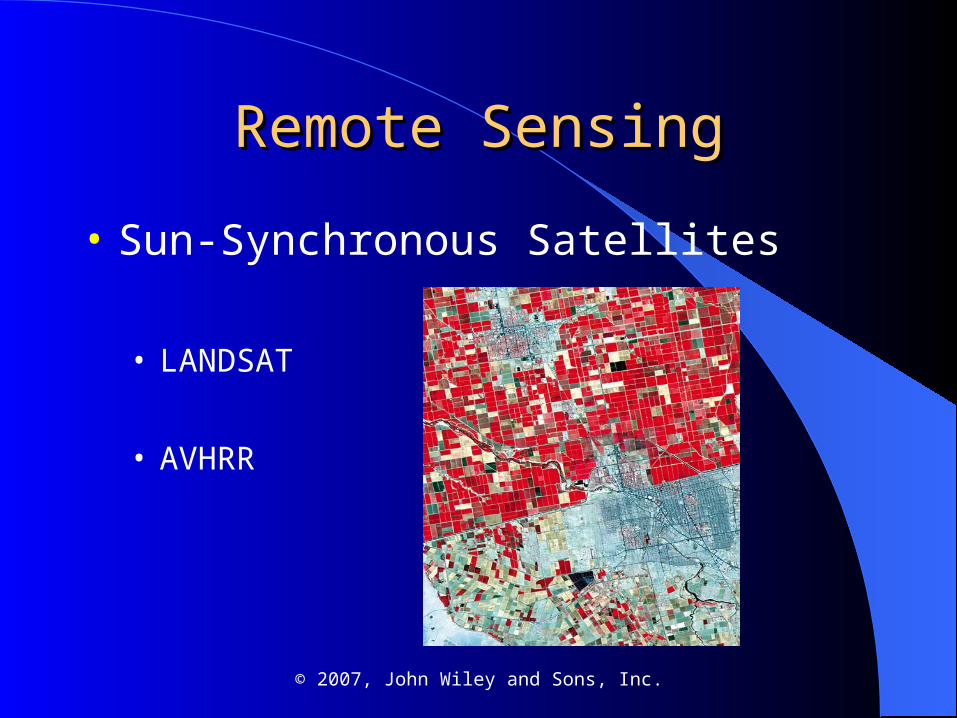
Remote SensingRemote Sensing
• Sun-Synchronous Satellites
• LANDSAT
• AVHRR

© 2007, John Wiley and Sons, Inc.
Remote SensingRemote Sensing
• Geostationary Satellites
• GOES (Weather)

© 2007, John Wiley and Sons, Inc.
GPSGPS
• Global Positioning System
• ___ satellites orbit earth every 12 hours
• Satellites transmit pseudo random code
• __________________________
• _____________ gives location
© 2007, John Wiley and Sons, Inc.
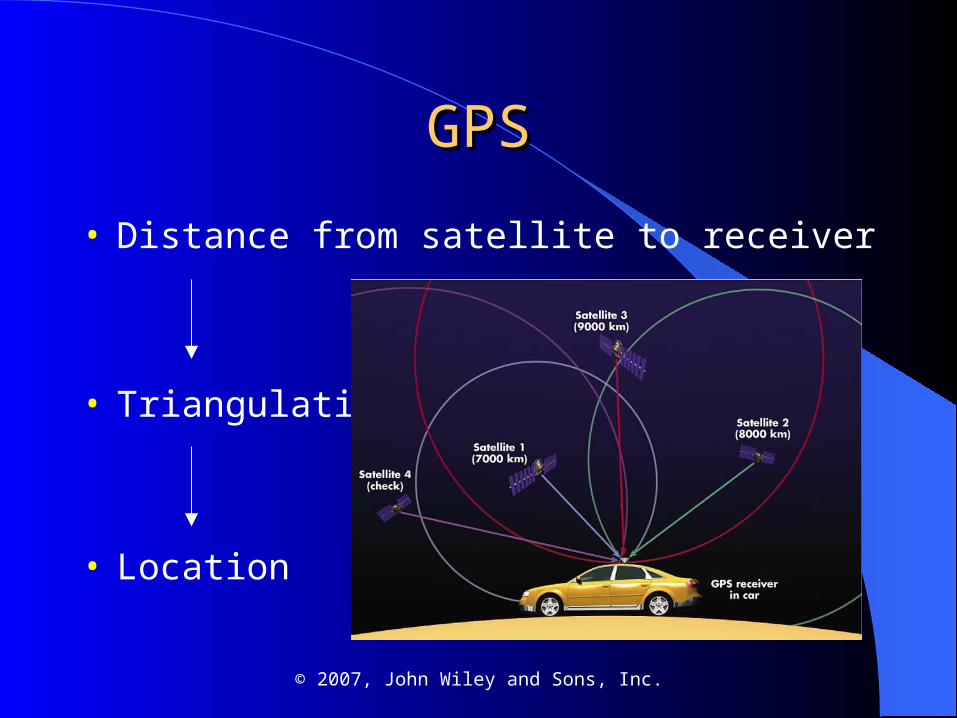
GPSGPS
• Distance from satellite to receiver
• Triangulation
• Location
© 2007, John Wiley and Sons, Inc.
GISGIS• Geographic Information Systems
• ____________________________________________________
• Data consists of layers of one variable such as: vegetation, landforms, or soils
• Layers can be overlaid/combined for analysis or display
• Applications include: resource management, planning, hazard assessment, etc.
Using a Geographic Information System