esc residential connections · esc service improvement commitment kpi performance presentation in...
TRANSCRIPT
ESC Residential ConnectionsService Improvement Commitment1H 2019 Performance report
08.07.19
Executive summary
08.07.19 ESC Service Improvement Commitment KPI performance presentation2
Over the course of the past 6 months we’ve committed significant resources (people, time and investment) to deliver on the ESC Service Improvement commitments.
Whilst our work is not completed we have been able to improve our systems, process and methods of engagement and communication which have benefitted our stakeholders and customers.
This report outlines summarises our performance against targets at 5 key stages of the development and connection process
1. Master plan review2. Design review3. Construction audit4. Practical completion5. Construction tie in
We’ve also included additional performance information relating to design and audit quality

Key performance metrics
08.07.19 ESC Service Improvement Commitment KPI performance presentation3
1H 2019

Powercor has committed to improving in 5 key stages of the connection process
ESC Service Improvement Commitment KPI performance presentation
1
2
3
4
5
Master plan review
Design review
Practical completion
Construction ‘tie-in’
Construction audit
Replace staged scopes with a revised and contestable Master Planning
process – this will remove network scoping from the critical path
Target completion of design plan audits and re-audits within 20 business
days
Complete construction audit (from request to final report) within 5 to 8
business days
Grant practical completion in less than 10 business days from request
Meet customer dates and implement new process to offer the option of
a 20-business day construction tie in
New process 16.0 days2
Old process 34.0 days
6.1 days
2.3 days
18.4 days
New process being implemented
90% customer target date met in June
Stage Target 1H19 Performance1
1. All performance measures are in business days
2. New process is in trial and we only have a small sample size. We expect to roll the new process out in 2H2019
4 08.07.19

Project time with Powercor represented ~17% of the total job time in 1H 2019
ESC Service Improvement Commitment KPI performance presentation
1. SOC = Statement of compliance
Application
response
Customer
acceptance
Scope
Development
Design plan
development
Design Plan
Audit
Construction Construction
Audit
Practical
Completion
Construction
Tie-in
Powercor Developer Powercor Developer Powercor Developer Powercor Powercor Powercor
10.3 22.1 34.0 137.8 18.4 190.5 6.1 2.3 42.8
Projects that were completed in 1H2019 took an average of ~421 business
days from Application to SOC1
Developer
application
Consent for
SOC
Powercor was responsible for an average ~71 business days (~17%) of project development time from application to SOC
Developers were responsible for the remaining ~350 days (~83%)Developer
application (Day 0)Consent for SOC
at ~421 days
1 2 3 4 5
10.3
22.1 34.0 137.8 18.4 190.5
6.1
2.3
42.8
0.0 50.0 100.0 150.0 200.0 250.0 300.0 350.0 400.0 450.0 500.0
Ave time
5 08.07.19

10.3
22.1 34.0 137.8 18.4 190.5
6.1
2.3
42.8
0.0 50.0 100.0 150.0 200.0 250.0 300.0 350.0 400.0 450.0 500.0
Ave time
Staged scopes are being replaced with a contestable Master Planning process
ESC Service Improvement Commitment KPI performance presentation
In the very early stages this change has resulted in a reduction in time frames from 34
to 16 days1. The change also removes network scoping from project critical path.
1Master Plan review
• We recognised that the staged
scope process was creating
unnecessary delays
• We are trialling the new Master
Plan review process on a small
number of projects with positive
results
• We are seeking to implement this
process by the end of 2019
• Our target will be to turn these
around in 10 business days
significantly reducing timeframes
Performance Target
16.0 10V
34
16
0
5
10
15
20
25
30
35
40
Old Staged Scope Process New Master Planning Process
Avera
ge D
ays
Master Planning Performance 1H2019
1. Small sample size due to early stages of roll out
New process roll out
will gain momentum in
2H2019
6 08.07.19
10.3
22.1 34.0 137.8 18.4 190.5
6.1
2.3
42.8
0.0 50.0 100.0 150.0 200.0 250.0 300.0 350.0 400.0 450.0 500.0
Ave time
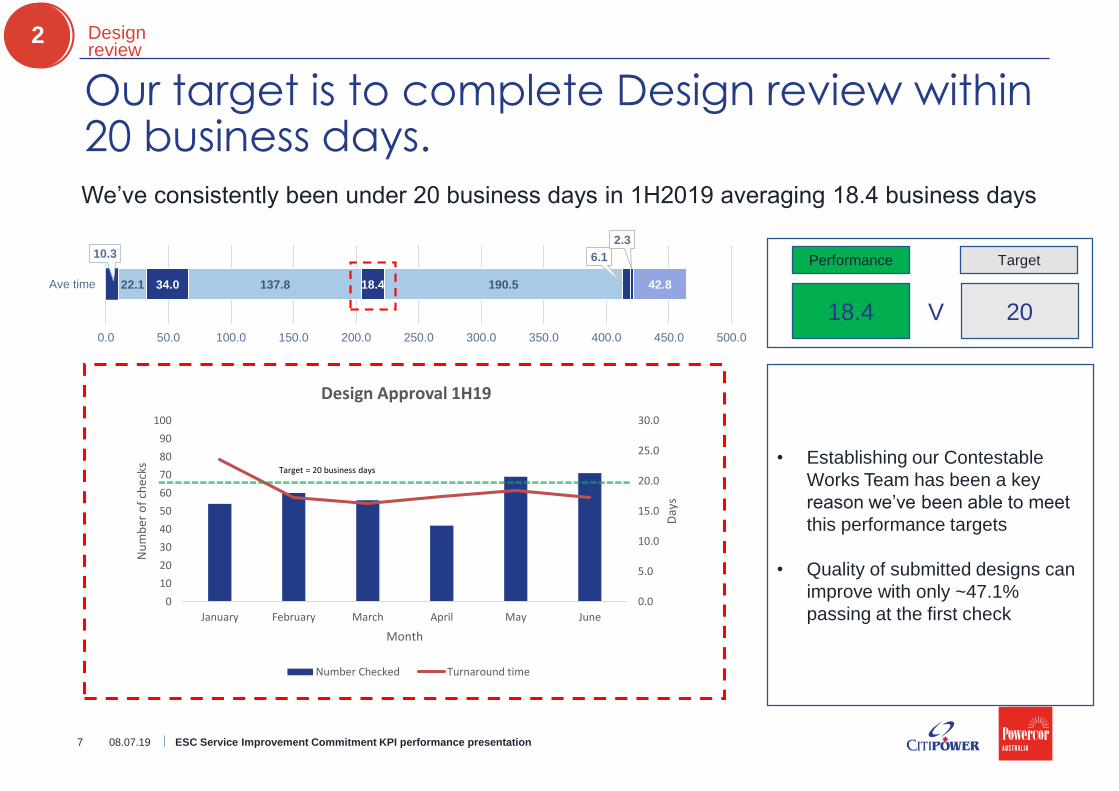
Our target is to complete Design review within 20 business days.
ESC Service Improvement Commitment KPI performance presentation7
2 Design review
We’ve consistently been under 20 business days in 1H2019 averaging 18.4 business days
• Establishing our Contestable
Works Team has been a key
reason we’ve been able to meet
this performance targets
• Quality of submitted designs can
improve with only ~47.1%
passing at the first check
Performance Target
18.4 20V
0.0
5.0
10.0
15.0
20.0
25.0
30.0
0
10
20
30
40
50
60
70
80
90
100
January February March April May June
Day
s
Nu
mb
er o
f ch
ecks
Month
Design Approval 1H19
Number Checked Turnaround time
Target = 20 business days
08.07.19
10.3
22.1 34.0 137.8 18.4 190.5
6.1
2.3
42.8
0.0 50.0 100.0 150.0 200.0 250.0 300.0 350.0 400.0 450.0 500.0
Ave time
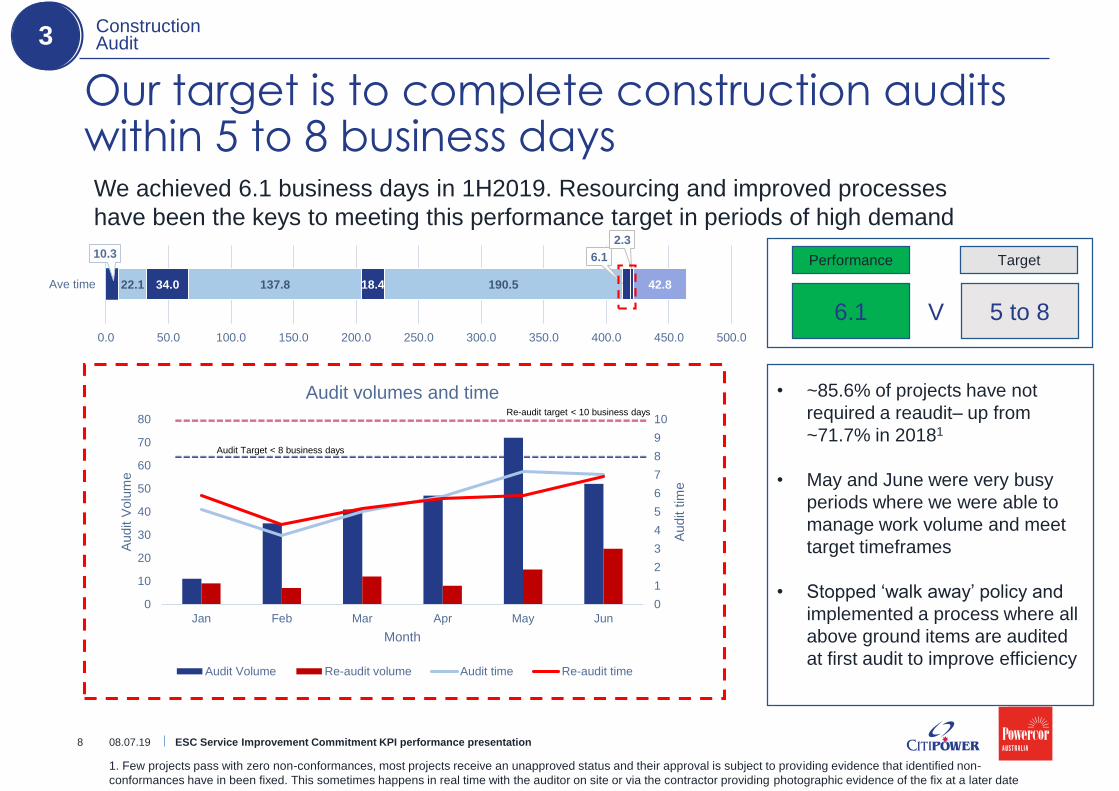
Our target is to complete construction audits within 5 to 8 business days
ESC Service Improvement Commitment KPI performance presentation8
3 Construction Audit
We achieved 6.1 business days in 1H2019. Resourcing and improved processes
have been the keys to meeting this performance target in periods of high demand
• ~85.6% of projects have not
required a reaudit– up from
~71.7% in 20181
• May and June were very busy
periods where we were able to
manage work volume and meet
target timeframes
• Stopped ‘walk away’ policy and
implemented a process where all
above ground items are audited
at first audit to improve efficiency
0
1
2
3
4
5
6
7
8
9
10
0
10
20
30
40
50
60
70
80
Jan Feb Mar Apr May Jun
Audit t
ime
Audit V
olu
me
Month
Audit volumes and time
Audit Volume Re-audit volume Audit time Re-audit time
Audit Target < 8 business days
Re-audit target < 10 business days
Performance Target
6.1 5 to 8V
08.07.19
1. Few projects pass with zero non-conformances, most projects receive an unapproved status and their approval is subject to providing evidence that identified non-
conformances have in been fixed. This sometimes happens in real time with the auditor on site or via the contractor providing photographic evidence of the fix at a later date
10.3
22.1 34.0 137.8 18.4 190.5
6.1
2.3
42.8
0.0 50.0 100.0 150.0 200.0 250.0 300.0 350.0 400.0 450.0 500.0
Ave time
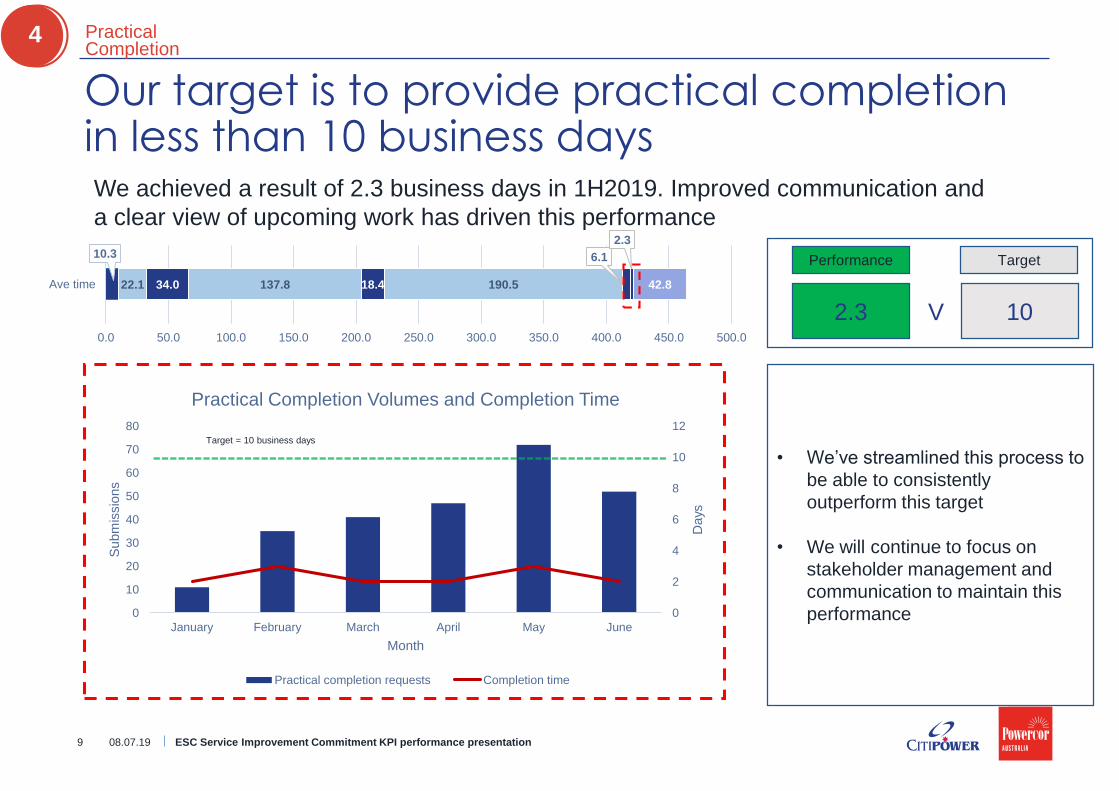
Our target is to provide practical completion in less than 10 business days
ESC Service Improvement Commitment KPI performance presentation9
4 Practical Completion
We achieved a result of 2.3 business days in 1H2019. Improved communication and
a clear view of upcoming work has driven this performance
• We’ve streamlined this process to
be able to consistently
outperform this target
• We will continue to focus on
stakeholder management and
communication to maintain this
performance
Performance Target
2.3 10V
0
2
4
6
8
10
12
0
10
20
30
40
50
60
70
80
January February March April May June
Days
Subm
issio
ns
Month
Practical Completion Volumes and Completion Time
Practical completion requests Completion time
Target = 10 business days
08.07.19
10.3
22.1 34.0 137.8 18.4 190.5
6.1
2.3
42.8
0.0 50.0 100.0 150.0 200.0 250.0 300.0 350.0 400.0 450.0 500.0
Ave time
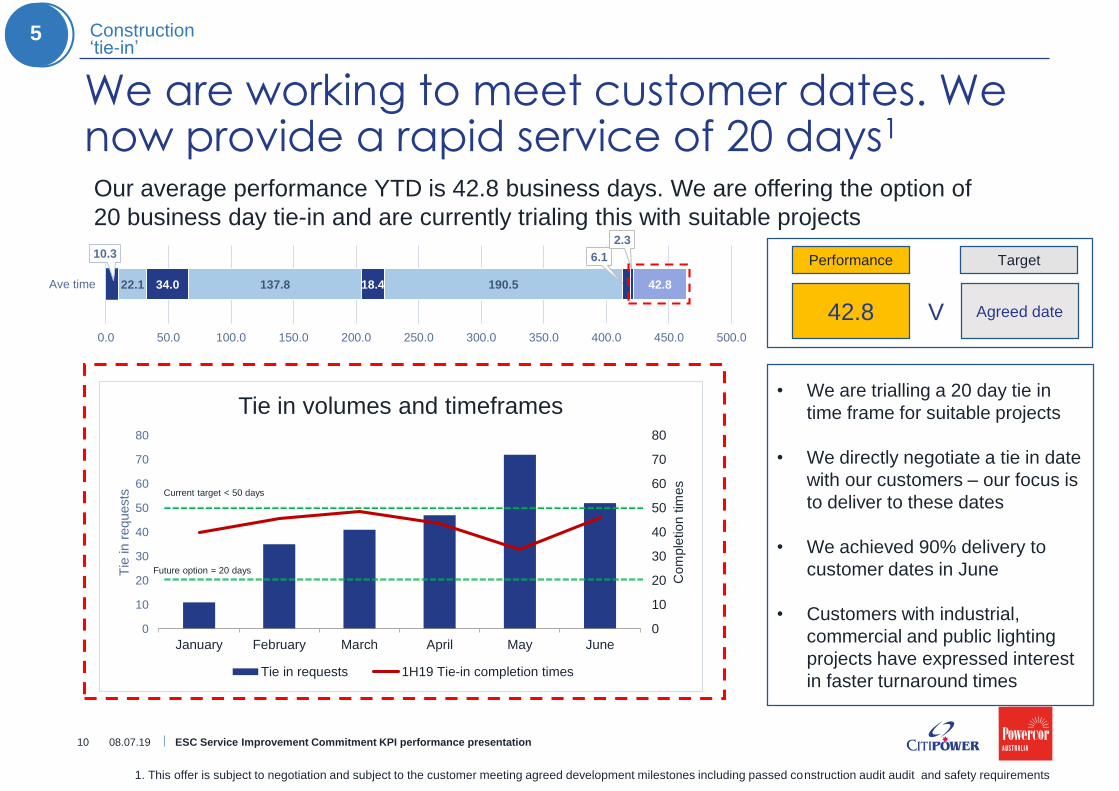
We are working to meet customer dates. We now provide a rapid service of 20 days1
ESC Service Improvement Commitment KPI performance presentation10
5 Construction ‘tie-in’
1. This offer is subject to negotiation and subject to the customer meeting agreed development milestones including passed construction audit audit and safety requirements
Our average performance YTD is 42.8 business days. We are offering the option of
20 business day tie-in and are currently trialing this with suitable projects
• We are trialling a 20 day tie in
time frame for suitable projects
• We directly negotiate a tie in date
with our customers – our focus is
to deliver to these dates
• We achieved 90% delivery to
customer dates in June
• Customers with industrial,
commercial and public lighting
projects have expressed interest
in faster turnaround times
Performance Target
42.8 Agreed dateV
0
10
20
30
40
50
60
70
80
0
10
20
30
40
50
60
70
80
January February March April May June
Com
ple
tion t
imes
Tie
in r
equests
Tie in volumes and timeframes
Tie in requests 1H19 Tie-in completion times
Future option = 20 days
Current target < 50 days
08.07.19
Additional performance information
ESC Service Improvement Commitment KPI performance presentation11
1H 2019
08.07.19
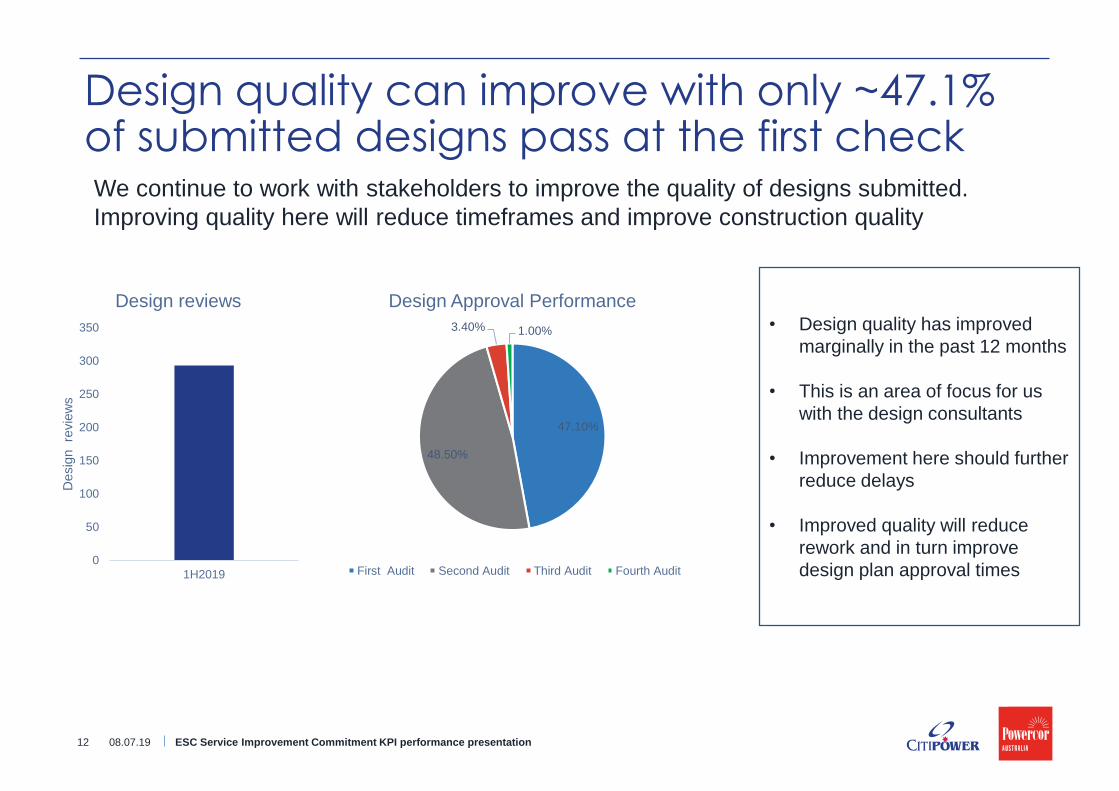
Design quality can improve with only ~47.1% of submitted designs pass at the first check
ESC Service Improvement Commitment KPI performance presentation12
47.10%
48.50%
3.40% 1.00%
Design Approval Performance
First Audit Second Audit Third Audit Fourth Audit
• Design quality has improved
marginally in the past 12 months
• This is an area of focus for us
with the design consultants
• Improvement here should further
reduce delays
• Improved quality will reduce
rework and in turn improve
design plan approval times0
50
100
150
200
250
300
350
1H2019
Desig
n
revie
ws
Design reviews
We continue to work with stakeholders to improve the quality of designs submitted.
Improving quality here will reduce timeframes and improve construction quality
08.07.19
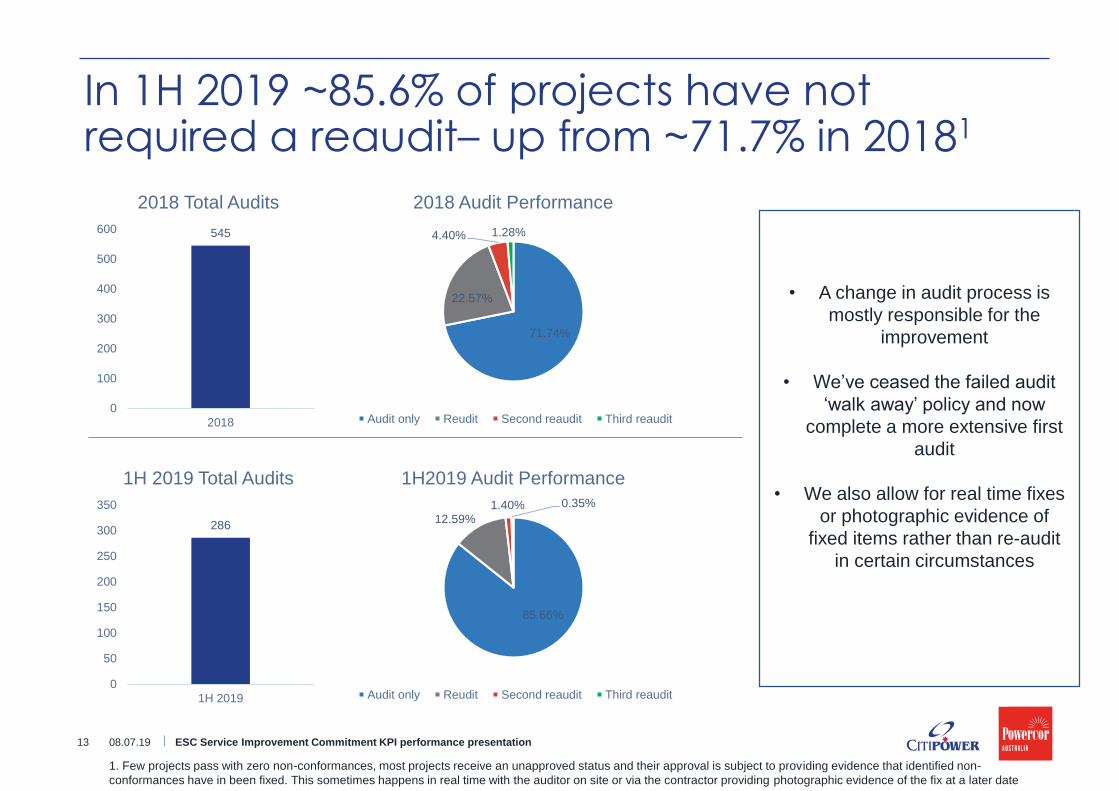
In 1H 2019 ~85.6% of projects have not required a reaudit– up from ~71.7% in 20181
ESC Service Improvement Commitment KPI performance presentation13
71.74%
22.57%
4.40% 1.28%
2018 Audit Performance
Audit only Reudit Second reaudit Third reaudit
85.66%
12.59%1.40% 0.35%
1H2019 Audit Performance
Audit only Reudit Second reaudit Third reaudit
545
0
100
200
300
400
500
600
2018
2018 Total Audits
286
0
50
100
150
200
250
300
350
1H 2019
1H 2019 Total Audits
• A change in audit process is
mostly responsible for the
improvement
• We’ve ceased the failed audit
‘walk away’ policy and now
complete a more extensive first
audit
• We also allow for real time fixes
or photographic evidence of
fixed items rather than re-audit
in certain circumstances
1. Few projects pass with zero non-conformances, most projects receive an unapproved status and their approval is subject to providing evidence that identified non-
conformances have in been fixed. This sometimes happens in real time with the auditor on site or via the contractor providing photographic evidence of the fix at a later date
08.07.19
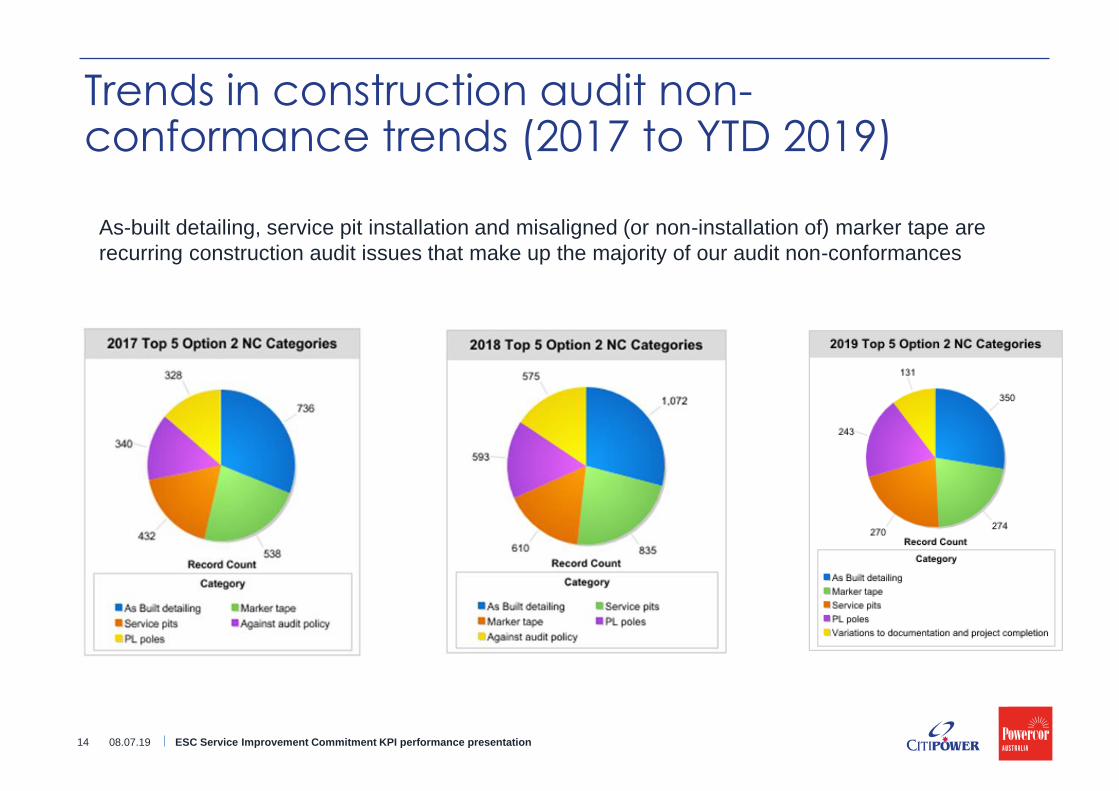
Trends in construction audit non-conformance trends (2017 to YTD 2019)
ESC Service Improvement Commitment KPI performance presentation
As-built detailing, service pit installation and misaligned (or non-installation of) marker tape are
recurring construction audit issues that make up the majority of our audit non-conformances
14 08.07.19
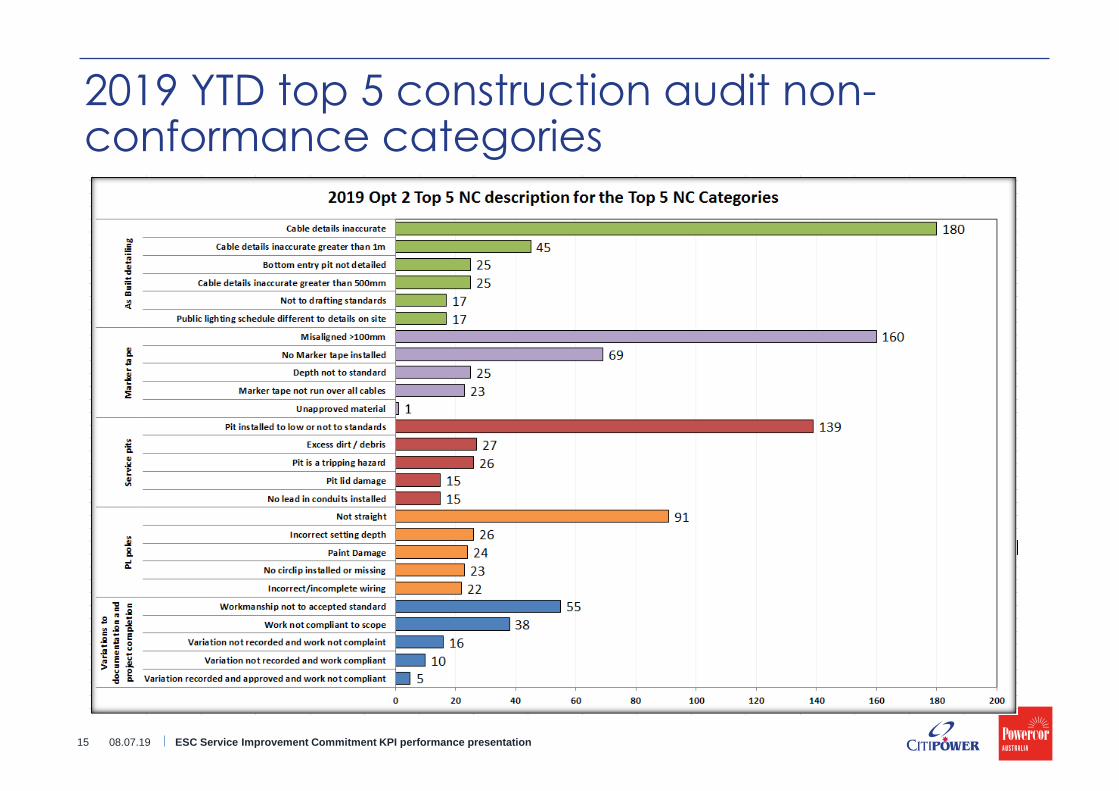
2019 YTD top 5 construction audit non-conformance categories
ESC Service Improvement Commitment KPI performance presentation15 08.07.19
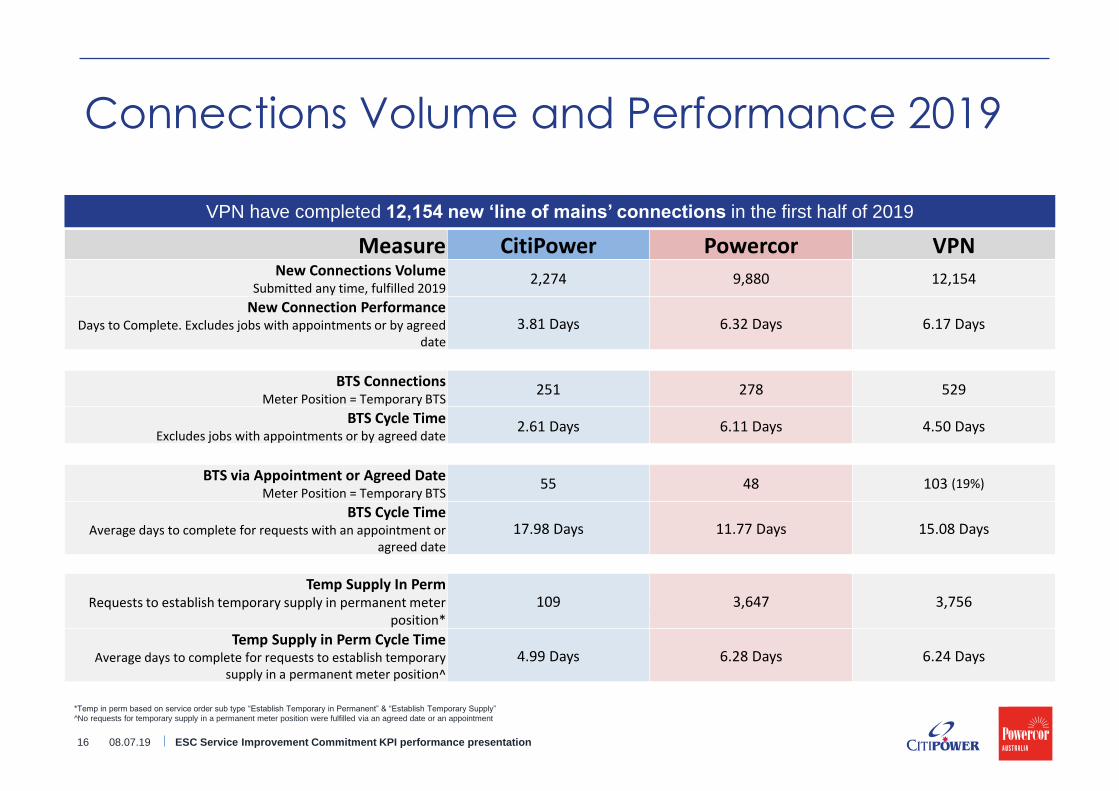
Connections Volume and Performance 2019
ESC Service Improvement Commitment KPI performance presentation
VPN have completed 12,154 new ‘line of mains’ connections in the first half of 2019
CR’s Completed & Fulfilled 1st of January – 30th of June 2019
Measure CitiPower Powercor VPNNew Connections Volume
Submitted any time, fulfilled 20192,274 9,880 12,154
New Connection PerformanceDays to Complete. Excludes jobs with appointments or by agreed
date3.81 Days 6.32 Days 6.17 Days
BTS ConnectionsMeter Position = Temporary BTS
251 278 529
BTS Cycle TimeExcludes jobs with appointments or by agreed date
2.61 Days 6.11 Days 4.50 Days
BTS via Appointment or Agreed DateMeter Position = Temporary BTS
55 48 103 (19%)
BTS Cycle TimeAverage days to complete for requests with an appointment or
agreed date17.98 Days 11.77 Days 15.08 Days
Temp Supply In PermRequests to establish temporary supply in permanent meter
position*109 3,647 3,756
Temp Supply in Perm Cycle TimeAverage days to complete for requests to establish temporary
supply in a permanent meter position^4.99 Days 6.28 Days 6.24 Days
*Temp in perm based on service order sub type “Establish Temporary in Permanent” & “Establish Temporary Supply”
^No requests for temporary supply in a permanent meter position were fulfilled via an agreed date or an appointment
16 08.07.19