ericsson mobility report 2016 - #mobile #iot #ecommerce #streaming #telecoms
TRANSCRIPT

ON THE PULSE OF THE NETWORKED SOCIETY
Ericsson Mobility Report
2016JUNE
2 ERICSSON MOBILITY REPORT JUNE 2016
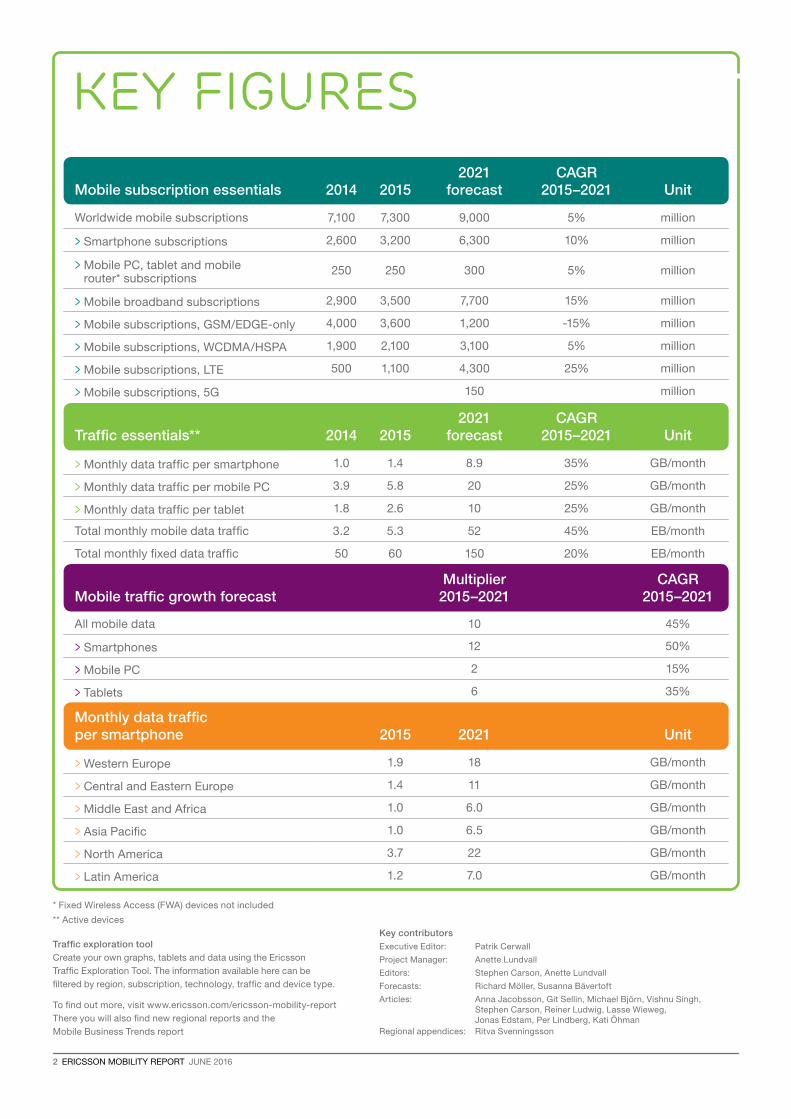
Mobile subscription essentials 2014 20152021
forecastCAGR
2015–2021 Unit
Worldwide mobile subscriptions 7,100 7,300 9,000 5% million
> Smartphone subscriptions 2,600 3,200 6,300 10% million
> Mobile PC, tablet and mobile router* subscriptions
250 250 300 5% million
> Mobile broadband subscriptions 2,900 3,500 7,700 15% million
> Mobile subscriptions, GSM/EDGE-only 4,000 3,600 1,200 -15% million
> Mobile subscriptions, WCDMA/HSPA 1,900 2,100 3,100 5% million
> Mobile subscriptions, LTE 500 1,100 4,300 25% million
> Mobile subscriptions, 5G 150 million
Traffic essentials** 2014 20152021
forecastCAGR
2015–2021 Unit
> Monthly data traffic per smartphone 1.0 1.4 8.9 35% GB/month
> Monthly data traffic per mobile PC 3.9 5.8 20 25% GB/month
> Monthly data traffic per tablet 1.8 2.6 10 25% GB/month
Total monthly mobile data traffic 3.2 5.3 52 45% EB/month
Total monthly fixed data traffic 50 60 150 20% EB/month
Mobile traffic growth forecastMultiplier
2015–2021CAGR
2015–2021
All mobile data 10 45%
> Smartphones 12 50%
> Mobile PC 2 15%
> Tablets 6 35%
Monthly data traffic per smartphone 2015 2021 Unit
> Western Europe 1.9 18 GB/month
> Central and Eastern Europe 1.4 11 GB/month
> Middle East and Africa 1.0 6.0 GB/month
> Asia Pacific 1.0 6.5 GB/month
> North America 3.7 22 GB/month
> Latin America 1.2 7.0 GB/month
Key figures
* Fixed Wireless Access (FWA) devices not included
** Active devices
Key contributors
Executive Editor: Patrik Cerwall
Project Manager: Anette Lundvall
Editors: Stephen Carson, Anette Lundvall
Forecasts: Richard Möller, Susanna Bävertoft
Articles: Anna Jacobsson, Git Sellin, Michael Björn, Vishnu Singh, Stephen Carson, Reiner Ludwig, Lasse Wieweg, Jonas Edstam, Per Lindberg, Kati Öhman
Regional appendices: Ritva Svenningsson
Traffic exploration tool
Create your own graphs, tablets and data using the Ericsson
Traffic Exploration Tool. The information available here can be
filtered by region, subscription, technology, traffic and device type.
To find out more, visit www.ericsson.com/ericsson-mobility-report
There you will also find new regional reports and the
Mobile Business Trends report
JUNE 2016 ERICSSON MOBILITY REPORT 3
Ericsson Mobility Report
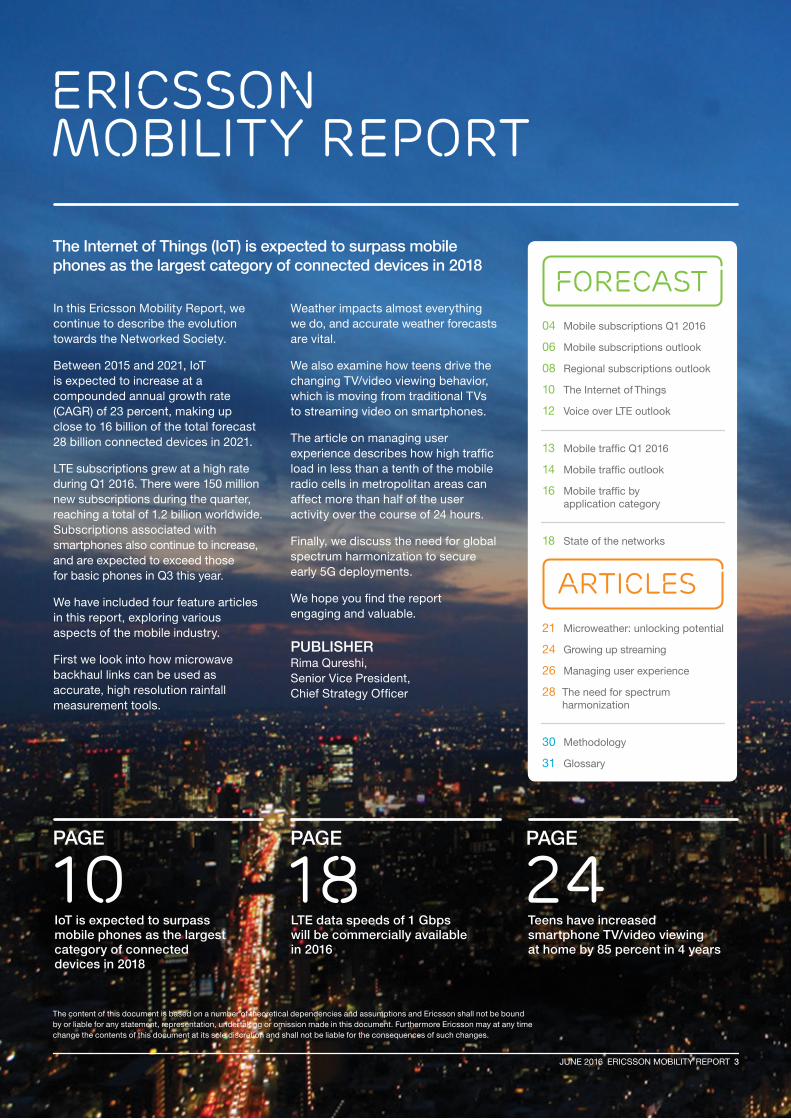
The Internet of Things (IoT) is expected to surpass mobile phones as the largest category of connected devices in 2018
In this Ericsson Mobility Report, we continue to describe the evolution towards the Networked Society.
Between 2015 and 2021, IoT is expected to increase at a compounded annual growth rate (CAGR) of 23 percent, making up close to 16 billion of the total forecast 28 billion connected devices in 2021.
LTE subscriptions grew at a high rate during Q1 2016. There were 150 million new subscriptions during the quarter, reaching a total of 1.2 billion worldwide. Subscriptions associated with smartphones also continue to increase, and are expected to exceed those for basic phones in Q3 this year.
We have included four feature articles in this report, exploring various aspects of the mobile industry.
First we look into how microwave backhaul links can be used as accurate, high resolution rainfall measurement tools.
Weather impacts almost everything we do, and accurate weather forecasts are vital.
We also examine how teens drive the changing TV/video viewing behavior, which is moving from traditional TVs to streaming video on smartphones.
The article on managing user experience describes how high traffic load in less than a tenth of the mobile radio cells in metropolitan areas can affect more than half of the user activity over the course of 24 hours.
Finally, we discuss the need for global spectrum harmonization to secure early 5G deployments.
We hope you find the report engaging and valuable.
PUBLISHERRima Qureshi, Senior Vice President,Chief Strategy Officer
FORECAST
articles
JUNE 2016 ERICSSON MOBILITY REPORT 3
04 Mobile subscriptions Q1 2016
06 Mobile subscriptions outlook
08 Regional subscriptions outlook
10 The Internet of Things
12 Voice over LTE outlook
13 Mobile traffic Q1 2016
14 Mobile traffic outlook
16 Mobile traffic by application category
18 State of the networks
21 Microweather: unlocking potential
24 Growing up streaming
26 Managing user experience
28 The need for spectrum harmonization
30 Methodology
31 Glossary
IoT is expected to surpass mobile phones as the largest category of connected devices in 2018
LTE data speeds of 1 Gbps will be commercially available in 2016
Teens have increased smartphone TV/video viewing at home by 85 percent in 4 years
10 18 24PAGE PAGE PAGE
The content of this document is based on a number of theoretical dependencies and assumptions and Ericsson shall not be bound by or liable for any statement, representation, undertaking or omission made in this document. Furthermore Ericsson may at any time change the contents of this document at its sole discretion and shall not be liable for the consequences of such changes.

4 ERICSSON MOBILITY REPORT JUNE 2016
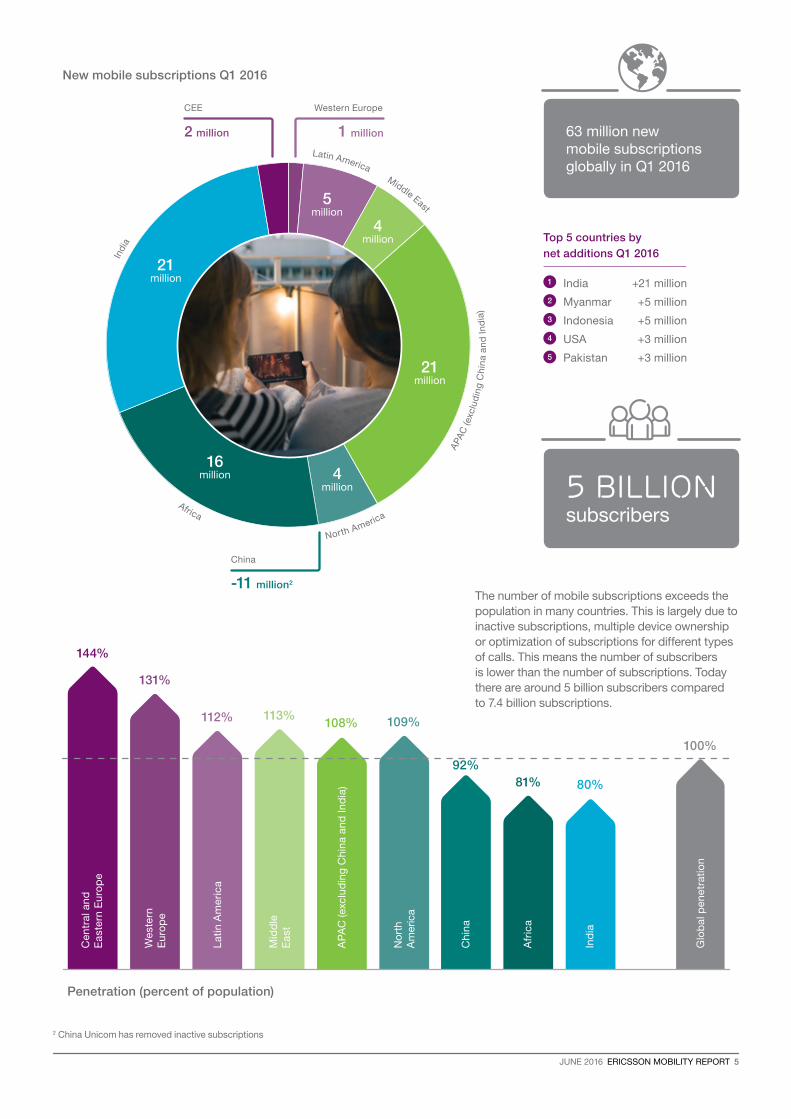
Mobile subscriptions are growing around 3 percent year-on-year globally and reached 7.4 billion in Q1 2016. India grew the most in terms of net additions during the quarter (+21 million), followed by Myanmar (+5 million), Indonesia (+5 million), the US (+3 million) and Pakistan (+3 million).
Mobile broadband subscriptions1 are growing by around 20 percent year-on-year, increasing by approximately 140 million in Q1 2016 alone.
LTE subscriptions continue to grow strongly, with 150 million new subscriptions. The total number of LTE subscriptions is now around 1.2 billion. WCDMA/HSPA added around 30 million during the quarter. The majority of 3G/4G subscriptions have access to GSM/EDGE as a fallback. GSM/EDGE-only subscriptions declined by 70 million during Q1 2016.
Subscriptions associated with smartphones continue to increase. During Q3 2016 the number of smartphone subscriptions will surpass those for basic phones. In Q1 2016 smartphones accounted for close to 80 percent of all mobile phones sold.
395
No
rth
Am
eric
a
395
Mid
dle
E
ast
In Q1 2016: 7.4 billion mobile subscriptions, 3.7 billion mobile broadband subscriptions and 3.4 billion smartphone subscriptions
Mobile subscriptions (millions)
550
Wes
tern
E
uro
pe
590
Cen
tral
an
d
Eas
tern
Eu
rop
e
965
Afr
ica
1,425
AP
AC
(exc
lud
ing
Ch
ina
and
Ind
ia)
1,035
Ind
ia
710
Lat
in A
mer
ica
1,295
Ch
ina
The total number of mobile subscriptions in Q1 2016 was around 7.4 billion, including 63 million new subscriptions
Mobile subscriptionsq1 2016
1 Mobile broadband is defined as HSPA, LTE, CDMA2000 EV-DO, TD-SCDMA and Mobile WiMAX
JUNE 2016 ERICSSON MOBILITY REPORT 5
Middle East
Africa
Indi
a
Latin America
A
PAC
(exc
lud
ing
Ch
ina
an
d I
nd
ia)
63 million new mobile subscriptions globally in Q1 2016
North America
144%
131%
112% 113%108% 109%
81% 80%
100%
Wes
tern
E
uro
pe
Cen
tral
an
d
Eas
tern
Eu
rop
e
Mid
dle
E
ast
Afr
ica
AP
AC
(exc
lud
ing
Ch
ina
and
Ind
ia)
Ind
ia
Glo
bal
pen
etra
tion
Lat
in A
mer
ica
Ch
ina
No
rth
A
mer
ica
92%
Penetration (percent of population)
New mobile subscriptions Q1 2016
The number of mobile subscriptions exceeds the population in many countries. This is largely due to inactive subscriptions, multiple device ownership or optimization of subscriptions for different types of calls. This means the number of subscribers is lower than the number of subscriptions. Today there are around 5 billion subscribers compared to 7.4 billion subscriptions.
Top 5 countries by
net additions Q1 2016
India +21 million
Myanmar +5 million
Indonesia +5 million
USA +3 million
Pakistan +3 million
1
2
3
4
5
5 billion subscribers
2 China Unicom has removed inactive subscriptions
1 million
-11 million2
2 million
CEE Western Europe
China
5 million
4 million
21 million
4 million
16 million
21 million
6 ERICSSON MOBILITY REPORT JUNE 2016
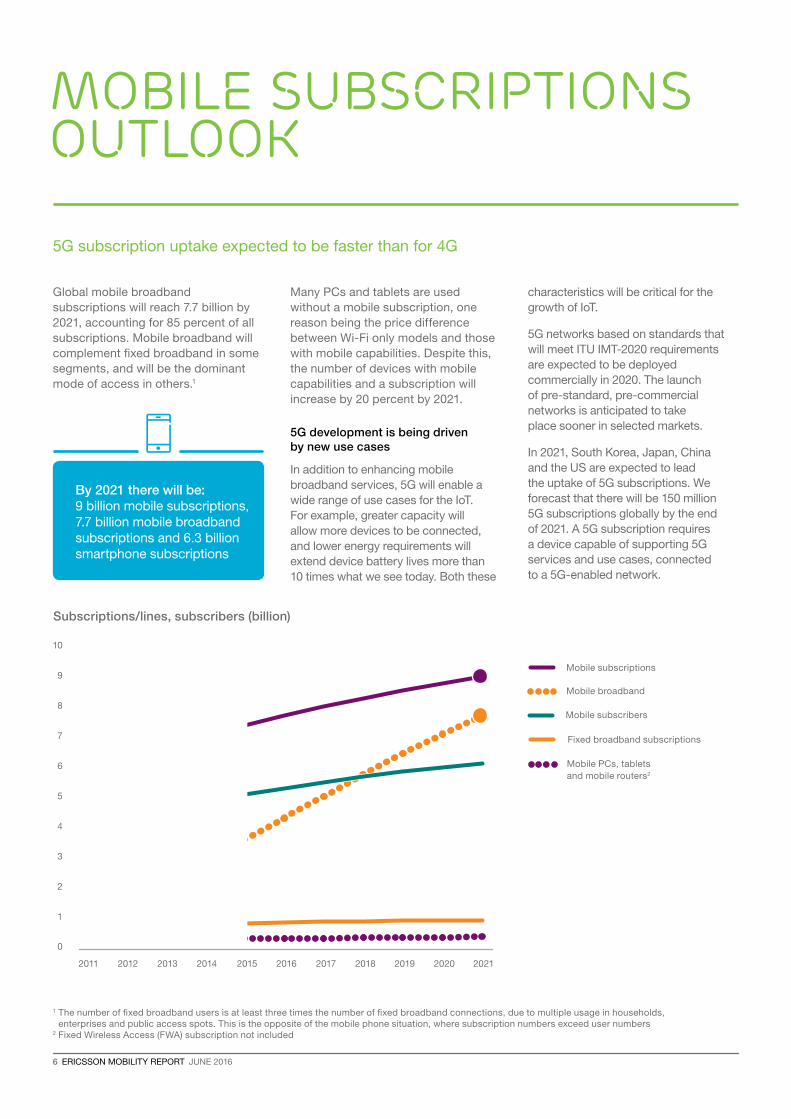
Global mobile broadband subscriptions will reach 7.7 billion by 2021, accounting for 85 percent of all subscriptions. Mobile broadband will complement fixed broadband in some segments, and will be the dominant mode of access in others.1
Many PCs and tablets are used without a mobile subscription, one reason being the price difference between Wi-Fi only models and those with mobile capabilities. Despite this, the number of devices with mobile capabilities and a subscription will increase by 20 percent by 2021.
5G development is being driven by new use cases
In addition to enhancing mobile broadband services, 5G will enable a wide range of use cases for the IoT. For example, greater capacity will allow more devices to be connected, and lower energy requirements will extend device battery lives more than 10 times what we see today. Both these
characteristics will be critical for the growth of IoT.
5G networks based on standards that will meet ITU IMT-2020 requirements are expected to be deployed commercially in 2020. The launch of pre-standard, pre-commercial networks is anticipated to take place sooner in selected markets.
In 2021, South Korea, Japan, China and the US are expected to lead the uptake of 5G subscriptions. We forecast that there will be 150 million 5G subscriptions globally by the end of 2021. A 5G subscription requires a device capable of supporting 5G services and use cases, connected to a 5G-enabled network.
2015 20202017 201920162014 202120182011 20132012
Subscriptions/lines, subscribers (billion)
Mobile PCs, tablets and mobile routers2
Fixed broadband subscriptions
Mobile subscriptions
Mobile broadband
1 The number of fixed broadband users is at least three times the number of fixed broadband connections, due to multiple usage in households, enterprises and public access spots. This is the opposite of the mobile phone situation, where subscription numbers exceed user numbers
2 Fixed Wireless Access (FWA) subscription not included
MOBILE SUBSCRIPTIONS OUTLOOK
5G subscription uptake expected to be faster than for 4G
1
2
3
4
5
6
7
8
9
10
0
Mobile subscribers
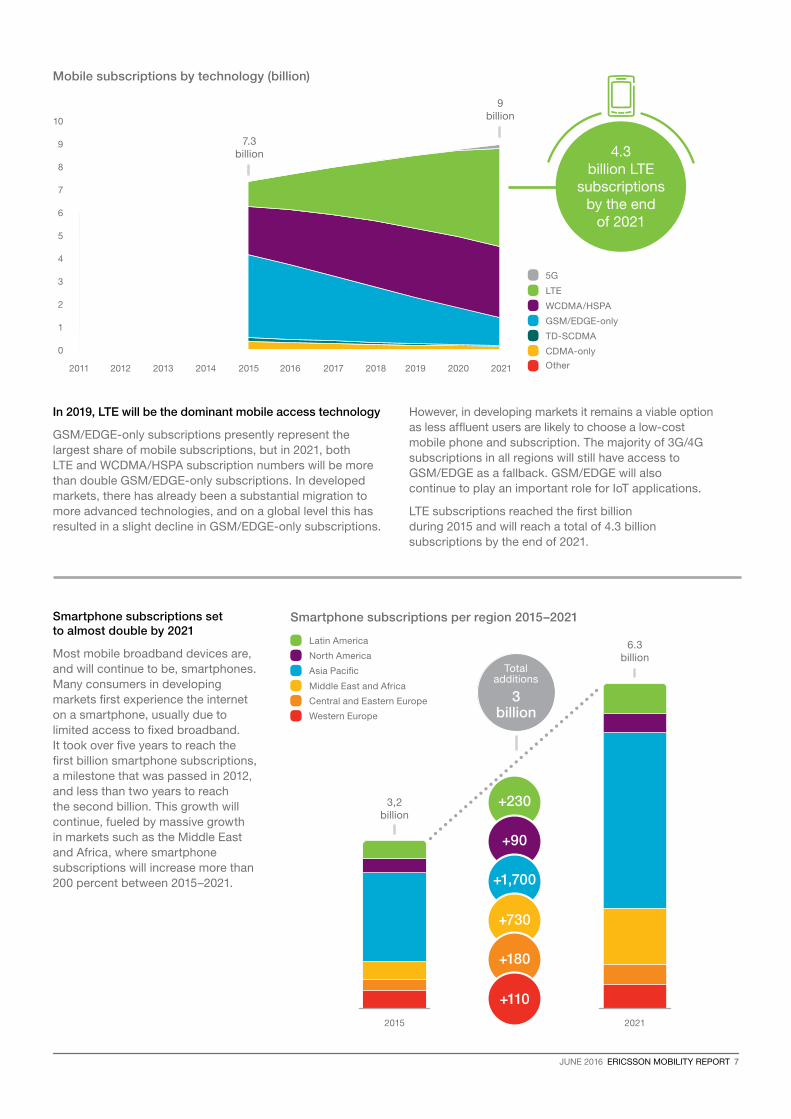
By 2021 there will be: 9 billion mobile subscriptions,7.7 billion mobile broadband subscriptions and 6.3 billion smartphone subscriptions
JUNE 2016 ERICSSON MOBILITY REPORT 7
3 billion
Total additions
3,2 billion
Smartphone subscriptions per region 2015–2021
+230
+90
+1,700
+730
+180
+110
North America
Asia Pacific
Middle East and Africa
Central and Eastern Europe
Western Europe
Latin America
2015
6.3 billion
2021
Smartphone subscriptions set to almost double by 2021
Most mobile broadband devices are, and will continue to be, smartphones. Many consumers in developing markets first experience the internet on a smartphone, usually due to limited access to fixed broadband. It took over five years to reach the first billion smartphone subscriptions, a milestone that was passed in 2012, and less than two years to reach the second billion. This growth will continue, fueled by massive growth in markets such as the Middle East and Africa, where smartphone subscriptions will increase more than 200 percent between 2015–2021.
10
1
2
3
4
5
6
7
8
9
0
Mobile subscriptions by technology (billion)
2011 2014 2020 20212012 2013 2015 2016 2017 2018 2019
9 billion
LTE
5G
WCDMA/HSPA
GSM/EDGE-only
TD-SCDMA
CDMA-only
Other
4.3 billion LTE
subscriptions by the end
of 2021
In 2019, LTE will be the dominant mobile access technology
GSM/EDGE-only subscriptions presently represent the largest share of mobile subscriptions, but in 2021, both LTE and WCDMA/HSPA subscription numbers will be more than double GSM/EDGE-only subscriptions. In developed markets, there has already been a substantial migration to more advanced technologies, and on a global level this has resulted in a slight decline in GSM/EDGE-only subscriptions.
However, in developing markets it remains a viable option as less affluent users are likely to choose a low-cost mobile phone and subscription. The majority of 3G/4G subscriptions in all regions will still have access to GSM/EDGE as a fallback. GSM/EDGE will also continue to play an important role for IoT applications.
LTE subscriptions reached the first billion during 2015 and will reach a total of 4.3 billion subscriptions by the end of 2021.
7.3 billion

8 ERICSSON MOBILITY REPORT JUNE 2016
1
2
3
4
5
6
7
8
9
0
Mobile broadband subscriptions by region (billion)
Latin America
North America
Asia Pacific
Middle East and Africa
Central and Eastern Europe
Western Europe
The number of mobile subscriptions is continuing to grow across regions. Greater device affordability is encouraging new subscribers in developing regions, whereas growth in mature markets is largely due to individuals adding more devices. Local economic conditions also have a significant impact on the uptake of subscriptions in different regions. The growth is fueled by the strong uptake of mobile broadband subscriptions across most regions.
Mobile broadband subscription growth is expected to be particularly strong in the Middle East and Africa due to a young and growing population, rising GDP and smartphone uptake. Several countries in the Asia Pacific region will also experience a strong mobile broadband subscription uptake over the next five years, while more mature regions like North America and Europe will have more moderate growth.
regional SUBSCRIPTIONS OUTLOOK
There is an increase in mobile subscriptions across all regions, but the underlying factor driving change is mobile broadband
4X growth in mobile broadband subscriptions in Middle East and Africa between 2015 and 2021
2011 20152013 2017 20202012 2016 20192014 2018 2021

JUNE 2016 ERICSSON MOBILITY REPORT 9
LTE/5G
WCDMA/HSPA
GSM/EDGE-only
TD-SCDMA
CDMA-only
Other
20
40
0
60
80
100
Mobile subscriptions by region and technology (percent)
North America
2015 2021
55%LTE/5G
95%LTE/5G
Latin America
2015 2021
45%WCDMA/HSPA
45%LTE/5G
Asia Pacific
2015
50%GSM/EDGE-only
2021
50%LTE/5G
Middle East and Africa
2015 2021
75%GSM/EDGE-only
55%WCDMA/HSPA
Central and Eastern Europe
2015 2021
50%WCDMA/HSPA
60%LTE/5G
Western Europe
2015 2021
55%WCDMA/HSPA
90%LTE/5G
90 percent of subscriptions in Western Europe and 95 percent in North America will be for LTE/5G by 2021
Middle East and Africa will see a dramatic shift from 2G to a market where almost 80 percent of subscriptions will be for 3G/4G
Mobile subscriptions in Middle East and Africa and Asia Pacific are mainly GSM/EDGE-only, while in Western Europe and North America the majority are WCDMA/HSPA and LTE
Middle East and Africa is a region experiencing economic growth and improved living standards in several countries. Combined with increasing availability of low cost smartphones and demand for mobile broadband services, there will be a shift from a voice centric GSM/EDGE-only majority of subscriptions in 2015 to a majority of WCDMA/HSPA and LTE-subscriptions by 2021. However, GSM/EDGE-only subscriptions will still have a significant share in the region by 2021. In Sub-Saharan Africa, WCDMA/HSPA will become predominant towards 2021, due to the high number of lower income consumers using 3G-enabled handsets.
Asia Pacific is a diverse region and the regional share of LTE subscriptions will be around 50 percent in 2021.
This is despite an already ongoing massive deployment of LTE in China, which will result in 1.2 billion LTE subscriptions in the country by the end of 2021 – around one quarter of the global total. Also, countries like South Korea and Japan were among the first countries to adopt LTE. These two countries accounted for 14 percent of global LTE subscriptions at the end of 2015.
In Central and Eastern Europe, the share of WCDMA/HSPA subscriptions is increasing and LTE networks are present in almost all countries.
5G initial deployments
5G subscriptions will provide enhancements in mobile broadband services, as well as enabling a widening range of use cases for the IoT. The US, Japan, China and South Korea are expected to be the first countries where 5G subscriptions will be available.

10 ERICSSON MOBILITY REPORT JUNE 2016
Connected devices (billions)
1 In our forecast a connected device is a physical object that has an IP stack, enabling two-way communication over a network interface. Traditional landline phones are included for legacy reasons
Mobile phones continue to be the largest category of connected devices1, but in 2018 they are expected to be surpassed by IoT, which includes connected cars, machines, utility
meters, remote metering and consumer electronics. IoT devices are expected to increase at a compounded annual growth rate (CAGR) of 23 percent from 2015 to 2021, driven by new use cases.
In total, around 28 billion connected devices are forecast by 2021, of which close to 16 billion will be related to IoT.
0
5
10
15
20
25
30
2020 2021201920182017201620152014
Cellular IoT
Non-cellular IoT
PC/laptop/tablet
Mobile phones
Fixed phones
the internet of things
Growth in the number of connected devices is driven by emerging applications and business models, and supported by falling device costs
2015 2021
15 billion
CAGR 2015–2021
28 billion
0.4 1.5 27%
4.2 14.2 22%
1.7 1.8 1%
7.1 8.6 3%
1.3 1.4 0%
IoT connected devices are expected to surpass mobile phones in 2018

JUNE 2016 ERICSSON MOBILITY REPORT 11
IoT connected devices: cellular and non cellular (billions)
2 Connected devices connecting to a wide area network through a common gateway
1.5 billion IoT devices with cellular subscriptions by 2021
There were around 400 million IoT devices with cellular subscriptions at the end of 2015. Cellular IoT is expected to have the highest growth among the different categories of connected devices, reaching 1.5 billion in 2021. The growth is due to increased industry focus and 3GPP standardization of cellular IoT technologies. Cellular connections benefit from enhancements in provisioning, device management, service enablement and security.
Within IoT, two major market segments with different requirements are emerging: massive and critical applications.
Massive IoT connections are characterized by high connection volumes, low cost, requirements on low energy consumption and small data traffic volumes. Examples
include smart buildings, transport logistics, fleet management, smart meters and agriculture. Many things will be connected through capillary networks.2 This will leverage the ubiquity, security and management of cellular networks. Today, around 70 percent of cellular IoT modules are GSM-only. Network mechanisms are being implemented, resulting in extended network coverage for low-rate applications. Additional functionality will allow existing networks to support different device categories, and enable prioritization of devices accessing the network. Network system improvements, such as sleep mode, will support battery lifetimes beyond 10 years for remote cellular devices.
Critical IoT connections are characterized by requirements for ultra-reliability and availability, with very low latency. Examples include traffic safety, autonomous
cars, industrial applications, remote manufacturing and healthcare, including remote surgery. Today, LTE’s share of cellular IoT device penetration is around five percent. Cost reductions will make LTE-connected devices increasingly viable, enabling new, very low latency applications. This will be achieved by reducing complexity and limiting modems to IoT application capabilities. Evolved functionality in existing LTE networks, as well as 5G capabilities, is expected to extend the range of addressable applications for critical IoT deployments.
Between 2015 and 2021, IoT connections are expected to grow with a CAGR of 23 percent. Over that time, Western Europe will add the most connections, led by growth within the connected car segment. A connected car is counted as one device, though it may have hundreds of sensors.
0
1
2
3
4
5
6
2009 2013 20172011 2015 2019 2021
Latin America
North America
Asia Pacific
Middle East and Africa
Central and Eastern Europe
Western Europe
The number of IoT devices is projected to quadruple in Western Europe between 2015 and 2021
12 ERICSSON MOBILITY REPORT JUNE 2016
VoLTE subscriptions by region (billion)
1 Making at least one VoLTE call per month2 GSA (April 2016)
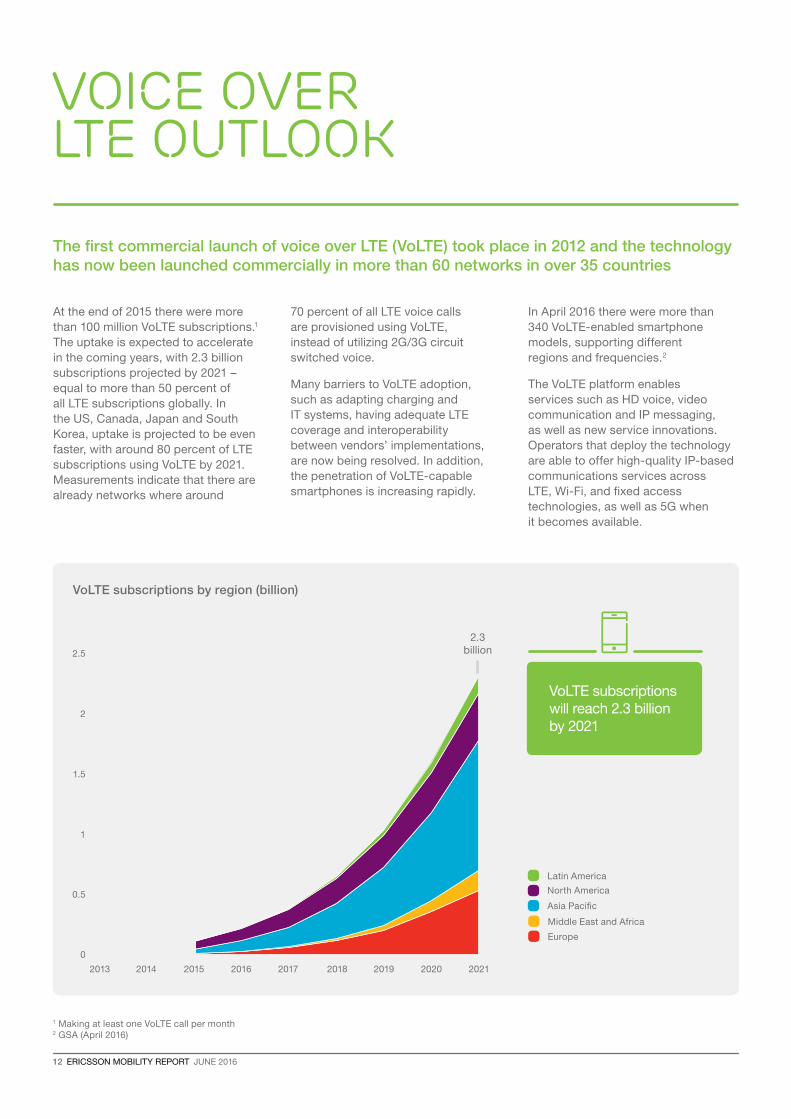
At the end of 2015 there were more than 100 million VoLTE subscriptions.1 The uptake is expected to accelerate in the coming years, with 2.3 billion subscriptions projected by 2021 – equal to more than 50 percent of all LTE subscriptions globally. In the US, Canada, Japan and South Korea, uptake is projected to be even faster, with around 80 percent of LTE subscriptions using VoLTE by 2021. Measurements indicate that there are already networks where around
70 percent of all LTE voice calls are provisioned using VoLTE, instead of utilizing 2G/3G circuit switched voice.
Many barriers to VoLTE adoption, such as adapting charging and IT systems, having adequate LTE coverage and interoperability between vendors’ implementations, are now being resolved. In addition, the penetration of VoLTE-capable smartphones is increasing rapidly.
In April 2016 there were more than 340 VoLTE-enabled smartphone models, supporting different regions and frequencies.2
The VoLTE platform enables services such as HD voice, video communication and IP messaging, as well as new service innovations. Operators that deploy the technology are able to offer high-quality IP-based communications services across LTE, Wi-Fi, and fixed access technologies, as well as 5G when it becomes available.
Voice over LTE outlook
The first commercial launch of voice over LTE (VoLTE) took place in 2012 and the technology has now been launched commercially in more than 60 networks in over 35 countries
2.5
0.5
1
1.5
2
0
Latin America
North America
Asia Pacific
Middle East and Africa
Europe
VoLTE subscriptions will reach 2.3 billion by 2021
2014 2020 20212013 2015 2016 2017 2018 2019
2.3 billion
JUNE 2016 ERICSSON MOBILITY REPORT 13
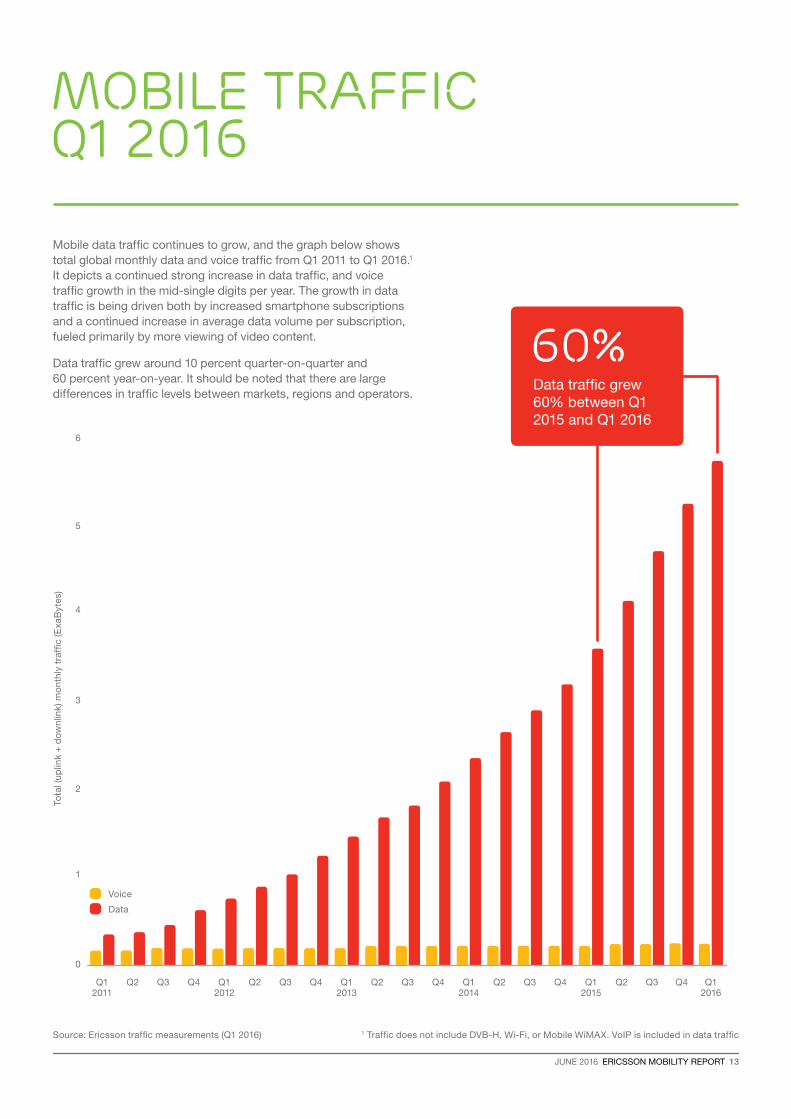
60%Data traffic grew 60% between Q1 2015 and Q1 2016
Mobile data traffic continues to grow, and the graph below shows total global monthly data and voice traffic from Q1 2011 to Q1 2016.1
It depicts a continued strong increase in data traffic, and voice traffic growth in the mid-single digits per year. The growth in data traffic is being driven both by increased smartphone subscriptions and a continued increase in average data volume per subscription, fueled primarily by more viewing of video content.
Data traffic grew around 10 percent quarter-on-quarter and 60 percent year-on-year. It should be noted that there are large differences in traffic levels between markets, regions and operators.
Voice
Data
1
2
3
4
6
5
0
Tota
l (u
plin
k +
do
wn
link)
mo
nth
ly t
raffi
c (E
xaB
yte
s)
Q12011
Q2 Q3 Q4 Q1 2012
Q2 Q3 Q4 Q1 2013
Q2 Q3 Q4 Q1 2014
Q2 Q3 Q4 Q4 Q1 2016
Q1 2015
Q2 Q3
1 Traffic does not include DVB-H, Wi-Fi, or Mobile WiMAX. VoIP is included in data traffic
mobile traffic q1 2016
Source: Ericsson traffic measurements (Q1 2016)
14 ERICSSON MOBILITY REPORT JUNE 2016
20212021 2021 2021 2021 202120152015 2015 2015 2015 2015
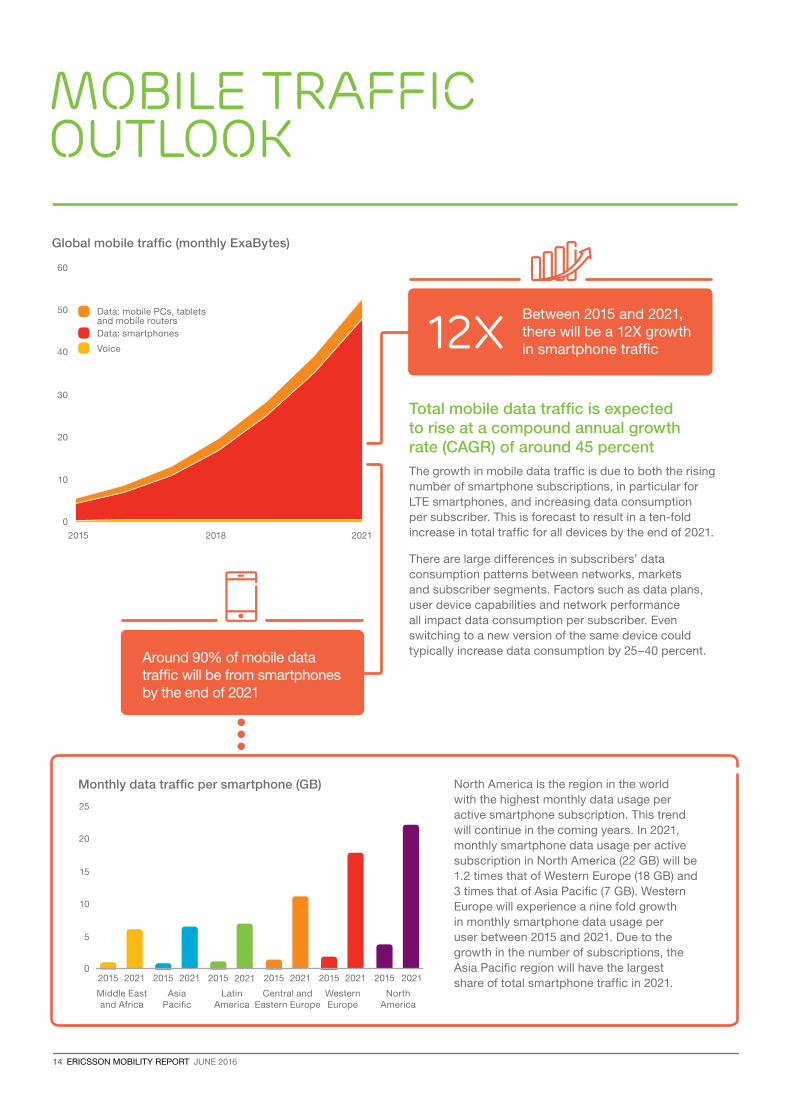
12XBetween 2015 and 2021, there will be a 12X growth in smartphone traffic
Global mobile traffic (monthly ExaBytes)
50
60
0
10
20
30
40
20212015 2018
Data: mobile PCs, tablets and mobile routersData: smartphones
Voice
Monthly data traffic per smartphone (GB)
Total mobile data traffic is expected to rise at a compound annual growth rate (CAGR) of around 45 percent
The growth in mobile data traffic is due to both the rising number of smartphone subscriptions, in particular for LTE smartphones, and increasing data consumption per subscriber. This is forecast to result in a ten-fold increase in total traffic for all devices by the end of 2021.
There are large differences in subscribers’ data consumption patterns between networks, markets and subscriber segments. Factors such as data plans, user device capabilities and network performance all impact data consumption per subscriber. Even switching to a new version of the same device could typically increase data consumption by 25–40 percent.
North America is the region in the world with the highest monthly data usage per active smartphone subscription. This trend will continue in the coming years. In 2021, monthly smartphone data usage per active subscription in North America (22 GB) will be 1.2 times that of Western Europe (18 GB) and 3 times that of Asia Pacific (7 GB). Western Europe will experience a nine fold growth in monthly smartphone data usage per user between 2015 and 2021. Due to the growth in the number of subscriptions, the Asia Pacific region will have the largest share of total smartphone traffic in 2021.
mobile traffic outlook
Around 90% of mobile data traffic will be from smartphones by the end of 2021
0
5
10
20
15
25
Latin America
Middle East and Africa
Asia Pacific
Central and Eastern Europe
Western Europe
North America

JUNE 2016 ERICSSON MOBILITY REPORT 15
13XThere will be 13X mobile data traffic in Central Europe and Middle East and Africa up to 2021
Asia Pacific will have the largest share of mobile data traffic in 2021, due to it being the most populous region and a rapid growth in subscriptions. China alone will add 210 million mobile subscriptions between the end of 2015 and 2021
With varying levels of maturity, diversity is a key feature of the mobile broadband market in Asia Pacific. For example, South Korea and Japan deployed LTE early, and with fast penetration take-up, markets such as Singapore and Hong Kong are highly advanced. GSM is still the dominant technology in the less developed countries, and insufficient network quality and the cost of data subscriptions remain barriers to higher mobile data consumption.
Central Europe and Middle East and Africa will experience a 13-fold increase up to 2021, driven by a strong growth in smartphone subscriptions and demand for data-intensive applications like video.
North America and Western Europe currently have a larger share of total traffic volume than their subscription numbers imply. This is due to high penetration of high-end user devices and well built-out WCDMA and LTE networks with affordable packages of large data volumes. This leads to higher data usage per subscription.
Mobile data traffic by region
2015 (EB/month)
Multiplier 2015–2021
Asia Pacific 2.1 11
Central Europe and Middle East and Africa
0.8 13
Western Europe 0.8 10
North America 1.3 7
Latin America 0.4 9
0
5
10
20
15
25
20212015
Asia Pacific
20212015
North America
20212015
Latin America
20212015
Western Europe
20212015
Central Europe and MEA
Mobile PCs, tablets and mobile routers
Smartphones
Global mobile data traffic (monthly ExaBytes)
16 ERICSSON MOBILITY REPORT JUNE 2016
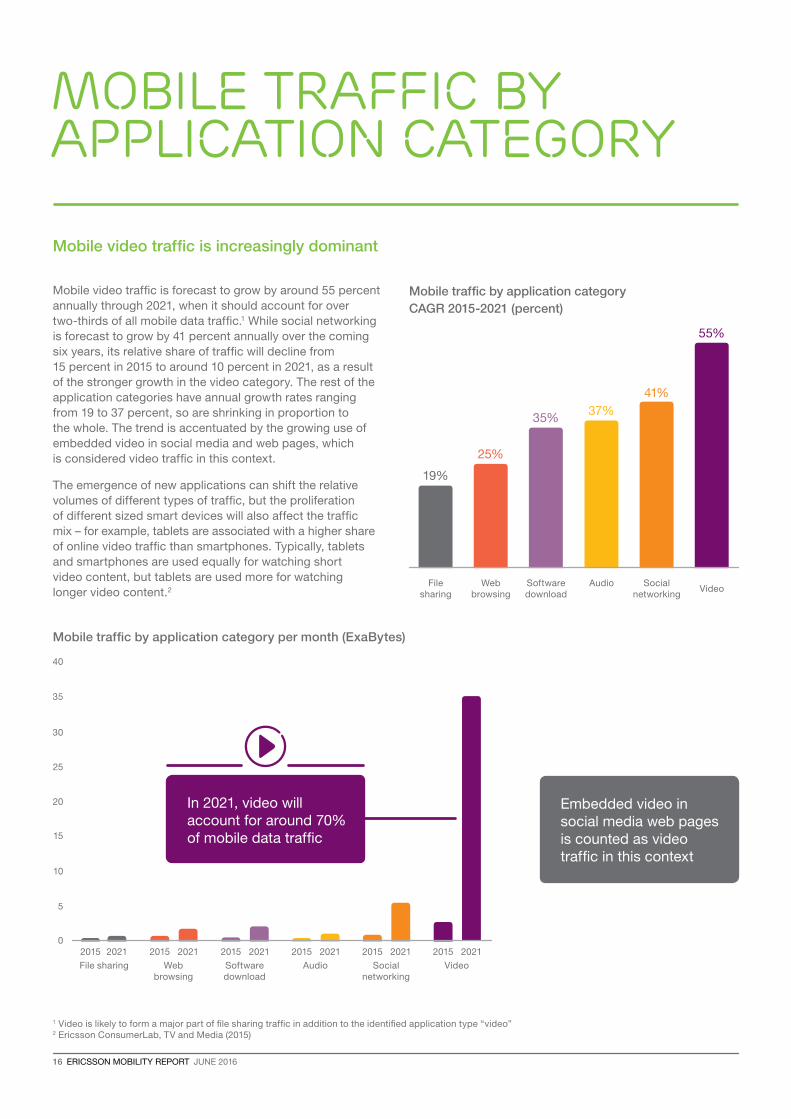
In 2021, video will account for around 70% of mobile data traffic
Mobile video traffic is forecast to grow by around 55 percent annually through 2021, when it should account for over two-thirds of all mobile data traffic.1 While social networking is forecast to grow by 41 percent annually over the coming six years, its relative share of traffic will decline from 15 percent in 2015 to around 10 percent in 2021, as a result of the stronger growth in the video category. The rest of the application categories have annual growth rates ranging from 19 to 37 percent, so are shrinking in proportion to the whole. The trend is accentuated by the growing use of embedded video in social media and web pages, which is considered video traffic in this context.
The emergence of new applications can shift the relative volumes of different types of traffic, but the proliferation of different sized smart devices will also affect the traffic mix – for example, tablets are associated with a higher share of online video traffic than smartphones. Typically, tablets and smartphones are used equally for watching short video content, but tablets are used more for watching longer video content.2
Mobile traffic by application category CAGR 2015-2021 (percent)
Mobile traffic by application category per month (ExaBytes)
Mobile traffic by application category
Mobile video traffic is increasingly dominant
Embedded video in social media web pages is counted as video traffic in this context
1 Video is likely to form a major part of file sharing traffic in addition to the identified application type “video”2 Ericsson ConsumerLab, TV and Media (2015)
File sharing
Web browsing
Audio Software download
Social networking
Video
19%
25%
37%35%
41%
55%
2021 2021 2021 2021 2021 20212015 2015 2015 2015 2015 20150
5
10
15
20
25
30
35
40
File sharing Web browsing
Software download
Audio Social networking
Video
JUNE 2016 ERICSSON MOBILITY REPORT 17
3 Measurements do not include Wi-Fi traffic. “Other” includes application categories not possible to identify or that aren’t one of the listed application types4 Compared to similar traffic measurements in 2012
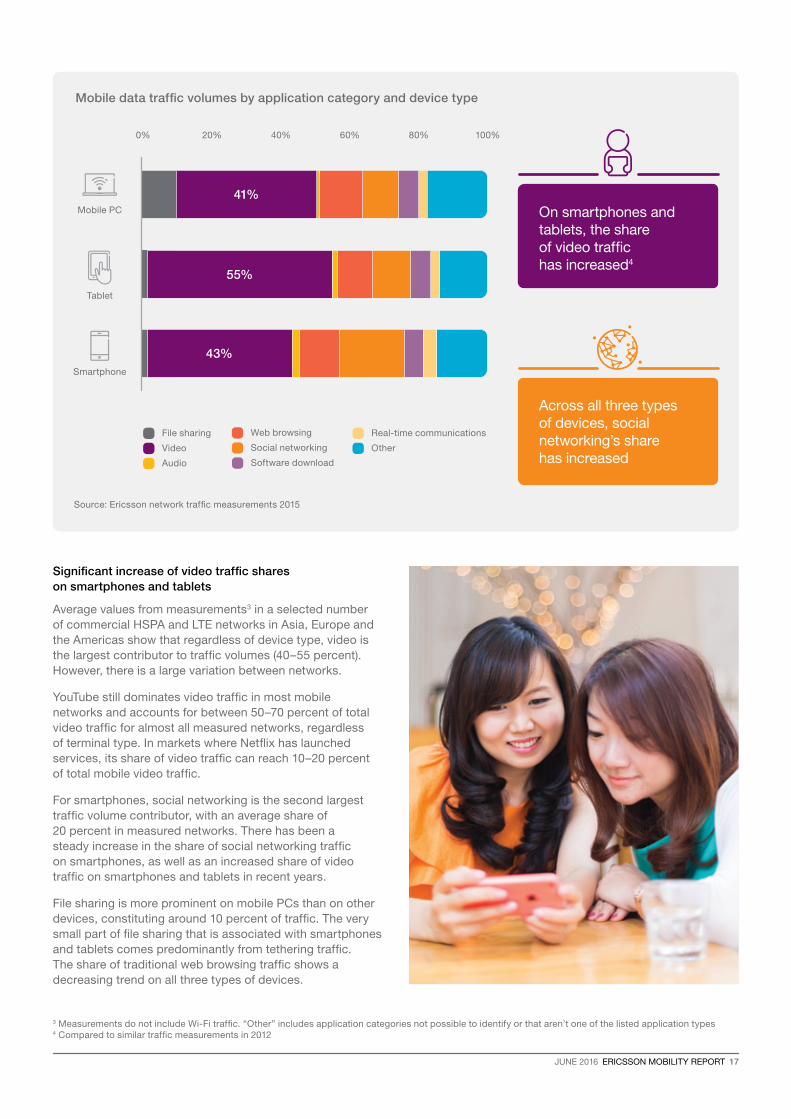
Significant increase of video traffic shares on smartphones and tablets
Average values from measurements3 in a selected number of commercial HSPA and LTE networks in Asia, Europe and the Americas show that regardless of device type, video is the largest contributor to traffic volumes (40–55 percent). However, there is a large variation between networks.
YouTube still dominates video traffic in most mobile networks and accounts for between 50–70 percent of total video traffic for almost all measured networks, regardless of terminal type. In markets where Netflix has launched services, its share of video traffic can reach 10–20 percent of total mobile video traffic.
For smartphones, social networking is the second largest traffic volume contributor, with an average share of 20 percent in measured networks. There has been a steady increase in the share of social networking traffic on smartphones, as well as an increased share of video traffic on smartphones and tablets in recent years.
File sharing is more prominent on mobile PCs than on other devices, constituting around 10 percent of traffic. The very small part of file sharing that is associated with smartphones and tablets comes predominantly from tethering traffic. The share of traditional web browsing traffic shows a decreasing trend on all three types of devices.
Mobile data traffic volumes by application category and device type
Tablet
Smartphone
Mobile PC
0% 20% 40% 60% 100%80%
File sharing
Video
Audio
Web browsing
Social networking
Real-time communications
Software download
Other
55%
43%
41%
On smartphones and tablets, the share of video traffic has increased4
Across all three types of devices, social networking’s share has increased
Source: Ericsson network traffic measurements 2015

18 ERICSSON MOBILITY REPORT JUNE 2016
WCDMA/HSPA enables mass market mobile broadband
WCDMA/HSPA continues to experience significant growth worldwide, both in terms of subscribers and population coverage. This is expected to remain true throughout our forecast period. The global statistics, however, mask diverging trends on a regional level.
In some regions there is high growth of WCDMA subscriptions, as declining smartphone prices offer an economic entry into mobile broadband. In others regions there is a growing focus on re-farming WCDMA frequency bands to LTE, enabled by the ability to fit higher HSPA traffic volumes into smaller frequency allocations. This is made possible by new radio access network software functionality
that enhances smartphone handling and network capacity. Operators are also seeking additional ways to make the network simple to handle and thus increase network operational efficiency.
Achieving LTE downlink peak data speeds of 1 Gbps
The demand for enhanced app coverage continues to push LTE data rates to new heights. In 2016 a long anticipated milestone is being passed, with commercial LTE networks supporting downlink peak data speeds of 1 Gbps.
1 Gbps LTE peak data speeds will provide users with significantly faster time-to-content than today.
World population coverage by technology1
By 2021, over 90% of the world´s population will be covered by mobile broadband networks2015 ~90%
2021 ~95%
GSM/EDGE
GSM/EDGE will retain the widest
global reach
LTE uptake is driven by demand
for an improved user experience and faster networks
2015 ~50%
2021 ~75%
LTE
2015 ~75%
2021 >90%
WCDMA/HSPA WCDMA/HSPA is driven by increased demand for internet
access and the growing affordability
of smartphones
STATE OF THE NETWORKS
Evolving mobile network capabilities is key to ensuring a high quality user experience and continual service improvements
1 The figures refer to population coverage of each technology. The ability to utilize the technology is subject to factors such as access to devices and subscriptions
JUNE 2016 ERICSSON MOBILITY REPORT 19
2 256 QAM is susceptible to interference. However, system interference can be reduced, hence increasing the utilization of 256 QAM in the network.
Gigabit speeds will also enhance the usefulness of personal hotspots, as well as making LTE a more attractive alternative to deliver fixed wireless services.
One of the barriers to delivering higher LTE data speeds is spectrum. New commercially available LTE capabilities provide greater spectral efficiency and make the delivery of commercial LTE peak data rates of 1 Gbps feasible using 60 MHz of spectrum. These capabilities include:
> 3 Component Carrier Aggregation – which enables the aggregation of 60 MHz of LTE spectrum
> 256 Quadrature Amplitude Modulation (QAM) – which can increase downlink data speeds by 33 percent
> 4x4 Multiple Input Multiple Output (MIMO) – which doubles the number of unique data streams being transmitted to the user’s smartphone, thereby enabling up to twice the capacity and data throughput
When used in combination, 2 aggregated 20 MHz LTE carriers using 4x4 MIMO and 256 QAM2 aggregated with a single 20 MHz LTE carrier using 2x2 MIMO and 256 QAM can support a LTE peak data rate of 1 Gbps over the downlink.
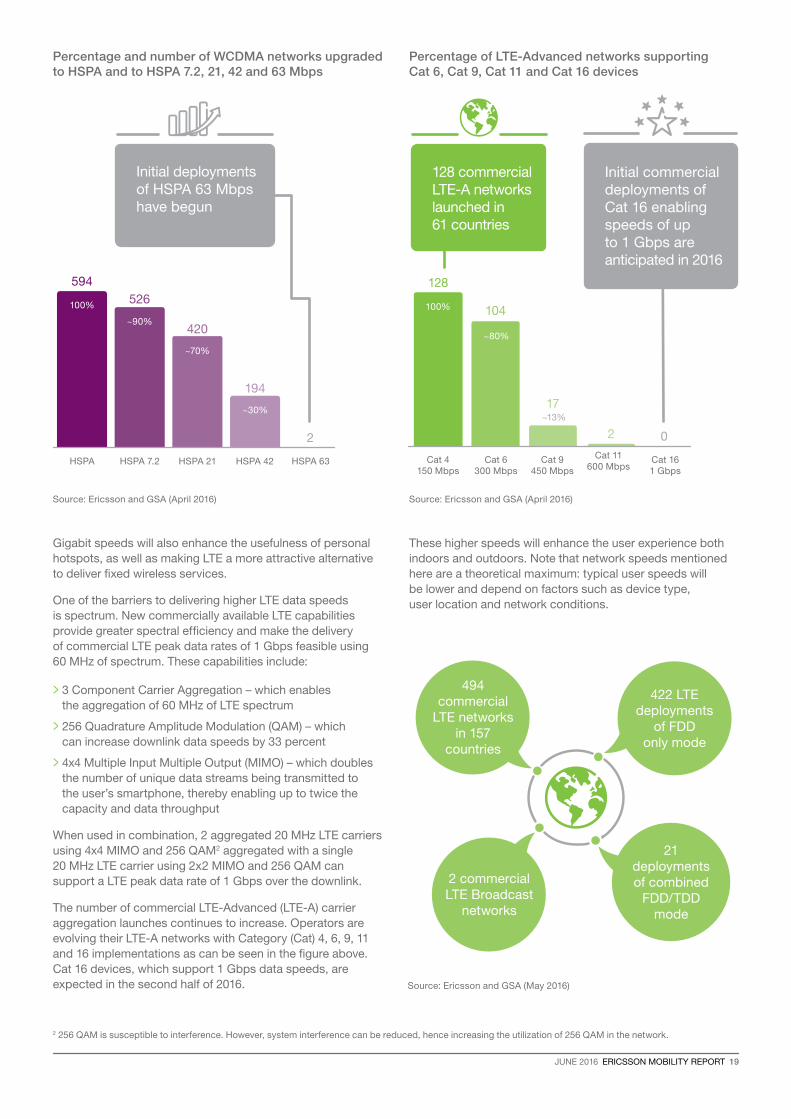
The number of commercial LTE-Advanced (LTE-A) carrier aggregation launches continues to increase. Operators are evolving their LTE-A networks with Category (Cat) 4, 6, 9, 11 and 16 implementations as can be seen in the figure above. Cat 16 devices, which support 1 Gbps data speeds, are expected in the second half of 2016.
These higher speeds will enhance the user experience both indoors and outdoors. Note that network speeds mentioned here are a theoretical maximum: typical user speeds will be lower and depend on factors such as device type, user location and network conditions.
Percentage of LTE-Advanced networks supporting Cat 6, Cat 9, Cat 11 and Cat 16 devices
2 commercial LTE Broadcast
networks
494 commercial
LTE networks in 157
countries
21 deployments of combined
FDD/TDD mode
422 LTE deployments
of FDD only mode
Cat 4 150 Mbps
128
Cat 6 300 Mbps
Cat 9 450 Mbps
2 0
Cat 11 600 Mbps
Cat 16 1 Gbps
128 commercial LTE-A networks launched in 61 countries
Initial commercial deployments of Cat 16 enabling speeds of up to 1 Gbps are anticipated in 2016
Percentage and number of WCDMA networks upgraded to HSPA and to HSPA 7.2, 21, 42 and 63 Mbps
Source: Ericsson and GSA (April 2016) Source: Ericsson and GSA (April 2016)
Source: Ericsson and GSA (May 2016)
HSPA
594
100% 100%
HSPA 7.2
526
~90%
HSPA 21
420
~70%
HSPA 42
194
~30%
HSPA 63
2
Initial deployments of HSPA 63 Mbps have begun
104
~80%
~13%17

20 ERICSSON MOBILITY REPORT JUNE 2016
Operators can stay competitive by launching attractive data and IP-based communication services bundles
Demand for communication services is still strong, despite declining voice and messaging revenue. A study3 in the US showed that SMS texting and voice are still the main methods of communication for the majority of families.
Communication services based on VoLTE enable operators to offer bundled data and high-quality communication services packages, with telecom-grade HD voice, video communication, multi-device capabilities and more, while enabling simultaneous LTE data services on smartphones. GSMA standards based Rich Communication Services (RCS) enable globally interoperable IP messaging and content sharing during calls. This can also be combined with VoLTE natively on smartphones.
Taking HD voice to the next quality level in LTE and Wi-Fi networks
HD voice improves mobile voice quality. It requires device support, and new functionality on 2G, 3G and LTE networks. An evolved HD voice service – 3GPP standardized Enhanced Voice Services (EVS) – for VoLTE-enabled networks further improves the user experience by delivering even higher quality voice and music within calls (e.g. call announcements or sharing music from a concert during a voice/video call). EVS also provides a better quality service than HD voice in challenging LTE radio conditions, as well as better service robustness when using Wi-Fi calling.
Wi-Fi calling is taking off with more commercial launches and new devices
With Wi-Fi calling, operators can extend their voice service indoors so consumers can make calls in their homes over their own Wi-Fi access points, using any Internet Service Provider (ISP). This benefits users with limited circuit-switched voice or VoLTE indoor coverage, as well as roaming users.
All major chipset and device vendors now support natively integrated Wi-Fi calling on many smartphone models. Some device and network vendors also support Wi-Fi calling on
devices without a SIM card, such as tablets, smartwatches and personal computers. This means the users’ personal devices can be located at different Wi-Fi access points across the world, and the smartphone can be on cellular or Wi-Fi access. The users can select to answer and make calls on any of the devices and transfer calls between their personal devices.
Network evolution – 5G-ready core
The IP Multimedia Subsystem (IMS) and Evolved Packet Core (EPC) enable these packet-switched communication services, which can be run over LTE, Wi-Fi and fixed broadband on any device, as the device ecosystem evolves. VoLTE and Wi-Fi calling are the first consumer services that have been deployed using Network Function Virtualization (NFV) in core networks. A 5G-ready core takes NFV one step further, by adding the concepts distributed cloud and network slicing.
2015 Live VoLTE and Wi-Fi calling using NFV
Circuit switched voice (GSM, WCDMA)
2012 Live IP messaging/RCS
plus CS voice
2015 Live combined
native VoLTE+RCS
2014 Live native
Wi-Fi calling
2016 Live Evolved HD voice
for VoLTE
2015 Live native Wi-Fi calling
for multi-device
2012 Live
VoLTE
Packet-switched voice and new communication services (LTE, Wi-Fi, fixed broadband, 5G)
3 Ericsson ConsumerLab, Bringing families closer (August 2015) 4 GSA (May 2016) 5 GSMA (March 2016)
COMMUNICATION SERVICES EVOLUTION
20 commercial native Wi-Fi
calling networks in 10+
countries
130+ commercial HD voice networks
(2G/3G)4
60+ commercial
VoLTE networks in 35+
countries
48 live RCS networks in
35 countries5
JUNE 2016 ERICSSON MOBILITY REPORT 21
1 Wireless microwave connection between a transmitter and receiver. A microwave hop can have a length from a few hundred meters up to tens of kilometers and a capacity up to several Gbps
Microweather: unlocking potential
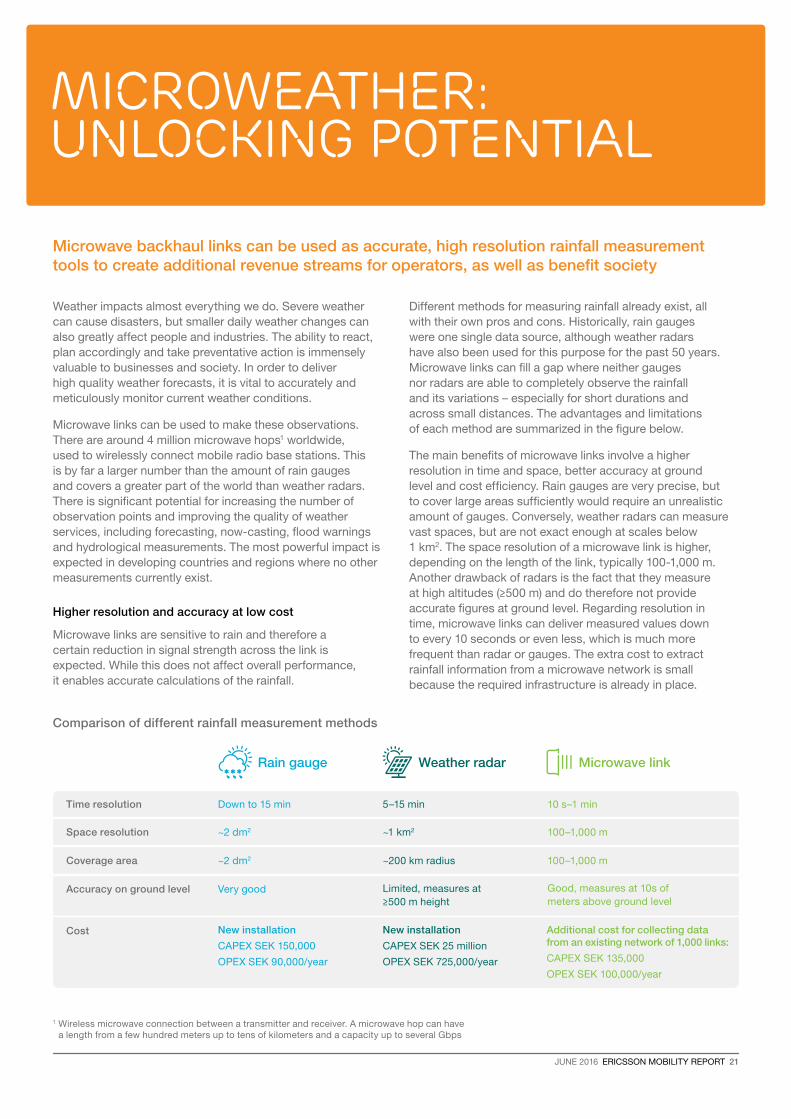
Microwave backhaul links can be used as accurate, high resolution rainfall measurement tools to create additional revenue streams for operators, as well as benefit society
Weather impacts almost everything we do. Severe weather can cause disasters, but smaller daily weather changes can also greatly affect people and industries. The ability to react, plan accordingly and take preventative action is immensely valuable to businesses and society. In order to deliver high quality weather forecasts, it is vital to accurately and meticulously monitor current weather conditions.
Microwave links can be used to make these observations. There are around 4 million microwave hops1 worldwide, used to wirelessly connect mobile radio base stations. This is by far a larger number than the amount of rain gauges and covers a greater part of the world than weather radars. There is significant potential for increasing the number of observation points and improving the quality of weather services, including forecasting, now-casting, flood warnings and hydrological measurements. The most powerful impact is expected in developing countries and regions where no other measurements currently exist.
Higher resolution and accuracy at low cost
Microwave links are sensitive to rain and therefore a certain reduction in signal strength across the link is expected. While this does not affect overall performance, it enables accurate calculations of the rainfall.
Different methods for measuring rainfall already exist, all with their own pros and cons. Historically, rain gauges were one single data source, although weather radars have also been used for this purpose for the past 50 years. Microwave links can fill a gap where neither gauges nor radars are able to completely observe the rainfall and its variations – especially for short durations and across small distances. The advantages and limitations of each method are summarized in the figure below.
The main benefits of microwave links involve a higher resolution in time and space, better accuracy at ground level and cost efficiency. Rain gauges are very precise, but to cover large areas sufficiently would require an unrealistic amount of gauges. Conversely, weather radars can measure vast spaces, but are not exact enough at scales below 1 km2. The space resolution of a microwave link is higher, depending on the length of the link, typically 100-1,000 m. Another drawback of radars is the fact that they measure at high altitudes (≥500 m) and do therefore not provide accurate figures at ground level. Regarding resolution in time, microwave links can deliver measured values down to every 10 seconds or even less, which is much more frequent than radar or gauges. The extra cost to extract rainfall information from a microwave network is small because the required infrastructure is already in place.
Comparison of different rainfall measurement methods
Time resolution
Space resolution
Coverage area
Accuracy on ground level
Cost
Down to 15 min
~2 dm2
~2 dm2
Very good
New installation
CAPEX SEK 150,000
OPEX SEK 90,000/year
New installation
CAPEX SEK 25 million
OPEX SEK 725,000/year
Additional cost for collecting data from an existing network of 1,000 links:
CAPEX SEK 135,000
OPEX SEK 100,000/year
5–15 min
~1 km2
~200 km radius
Limited, measures at ≥500 m height
10 s–1 min
100–1,000 m
100–1,000 m
Good, measures at 10s of meters above ground level
Rain gauge Weather radar Microwave link
22 ERICSSON MOBILITY REPORT JUNE 2016
Live measurements during eight months
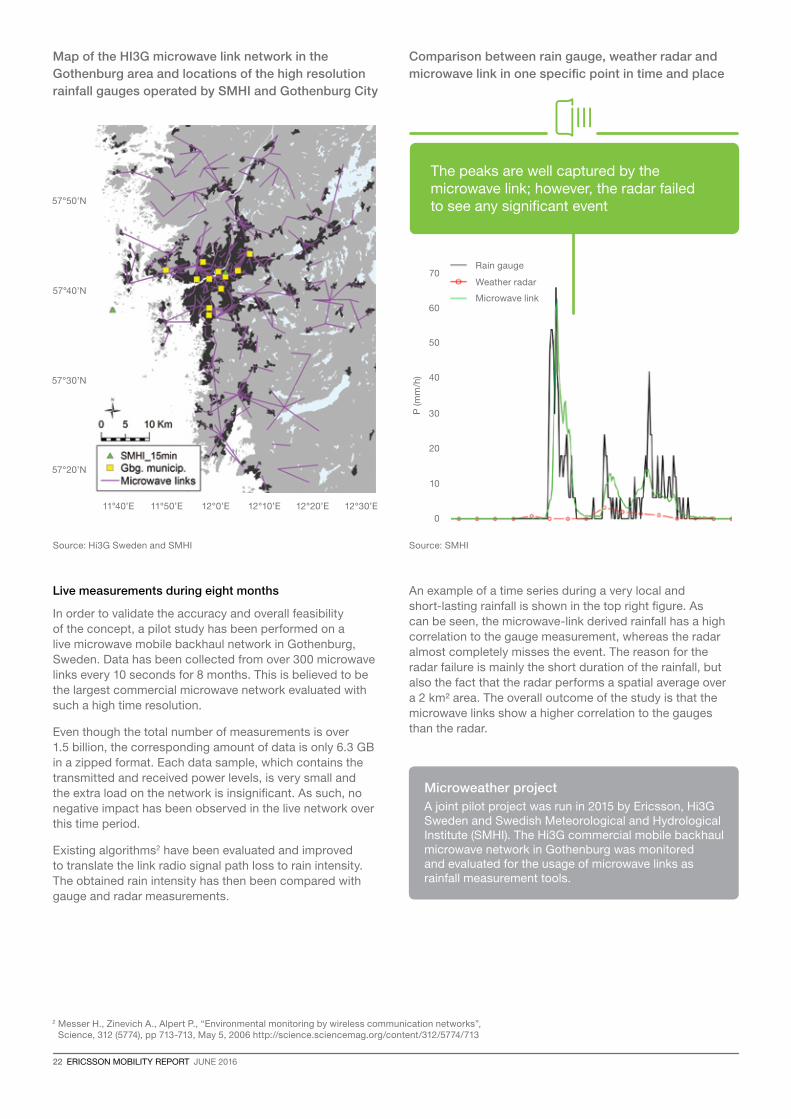
In order to validate the accuracy and overall feasibility of the concept, a pilot study has been performed on a live microwave mobile backhaul network in Gothenburg, Sweden. Data has been collected from over 300 microwave links every 10 seconds for 8 months. This is believed to be the largest commercial microwave network evaluated with such a high time resolution.
Even though the total number of measurements is over 1.5 billion, the corresponding amount of data is only 6.3 GB in a zipped format. Each data sample, which contains the transmitted and received power levels, is very small and the extra load on the network is insignificant. As such, no negative impact has been observed in the live network over this time period.
Existing algorithms2 have been evaluated and improved to translate the link radio signal path loss to rain intensity. The obtained rain intensity has then been compared with gauge and radar measurements.
An example of a time series during a very local and short-lasting rainfall is shown in the top right figure. As can be seen, the microwave-link derived rainfall has a high correlation to the gauge measurement, whereas the radar almost completely misses the event. The reason for the radar failure is mainly the short duration of the rainfall, but also the fact that the radar performs a spatial average over a 2 km² area. The overall outcome of the study is that the microwave links show a higher correlation to the gauges than the radar.
0
20
40
60
10
30P (m
m/h
)
50
70Rain gauge
Microwave link
Weather radar
Map of the HI3G microwave link network in the Gothenburg area and locations of the high resolution rainfall gauges operated by SMHI and Gothenburg City
Comparison between rain gauge, weather radar and microwave link in one specific point in time and place
2 Messer H., Zinevich A., Alpert P., “Environmental monitoring by wireless communication networks”, Science, 312 (5774), pp 713-713, May 5, 2006 http://science.sciencemag.org/content/312/5774/713
Microweather project A joint pilot project was run in 2015 by Ericsson, Hi3G Sweden and Swedish Meteorological and Hydrological Institute (SMHI). The Hi3G commercial mobile backhaul microwave network in Gothenburg was monitored and evaluated for the usage of microwave links as rainfall measurement tools.
11°40’E
57°20’N
57°30’N
57°40’N
57°50’N
11°50’E 12°0’E 12°10’E 12°20’E 12°30’E
The peaks are well captured by the microwave link; however, the radar failed to see any significant event
Source: Hi3G Sweden and SMHI Source: SMHI
JUNE 2016 ERICSSON MOBILITY REPORT 23
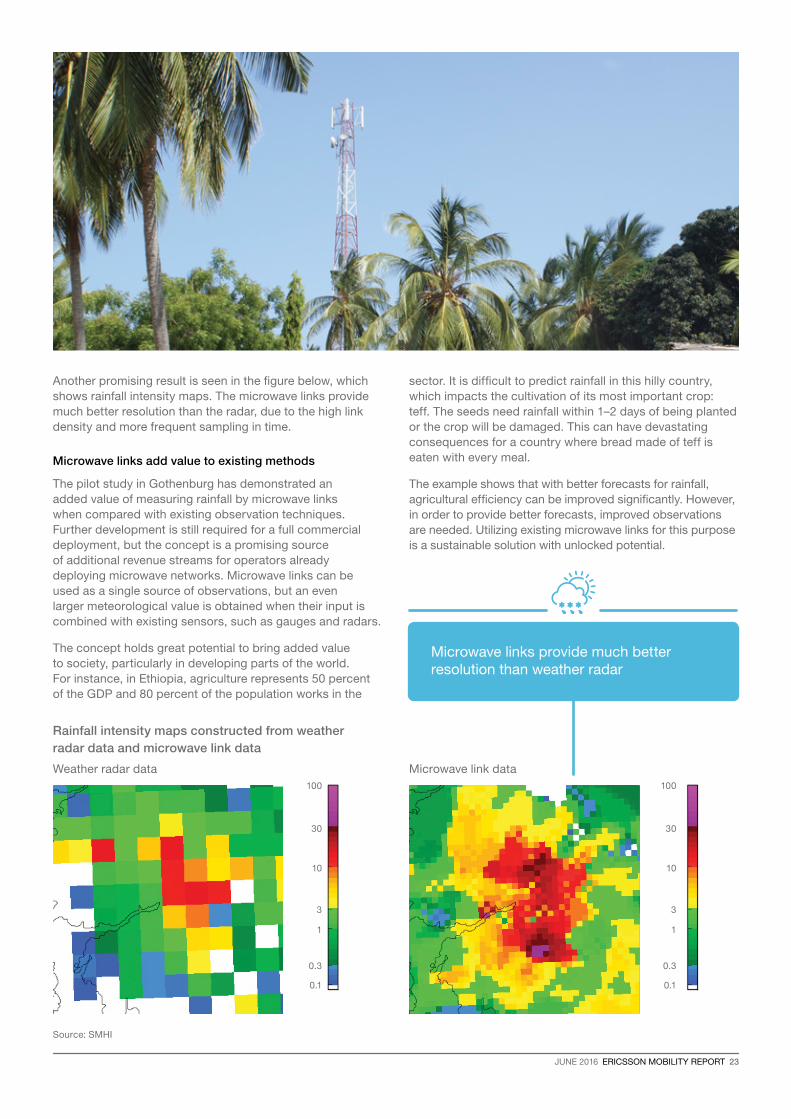
Another promising result is seen in the figure below, which shows rainfall intensity maps. The microwave links provide much better resolution than the radar, due to the high link density and more frequent sampling in time.
Microwave links add value to existing methods
The pilot study in Gothenburg has demonstrated an added value of measuring rainfall by microwave links when compared with existing observation techniques. Further development is still required for a full commercial deployment, but the concept is a promising source of additional revenue streams for operators already deploying microwave networks. Microwave links can be used as a single source of observations, but an even larger meteorological value is obtained when their input is combined with existing sensors, such as gauges and radars.
The concept holds great potential to bring added value to society, particularly in developing parts of the world. For instance, in Ethiopia, agriculture represents 50 percent of the GDP and 80 percent of the population works in the
sector. It is difficult to predict rainfall in this hilly country, which impacts the cultivation of its most important crop: teff. The seeds need rainfall within 1–2 days of being planted or the crop will be damaged. This can have devastating consequences for a country where bread made of teff is eaten with every meal.
The example shows that with better forecasts for rainfall, agricultural efficiency can be improved significantly. However, in order to provide better forecasts, improved observations are needed. Utilizing existing microwave links for this purpose is a sustainable solution with unlocked potential.
Rainfall intensity maps constructed from weather radar data and microwave link data
Microwave links provide much better resolution than weather radar
0.1 0.1
0.3 0.3
1 1
3 3
10 10
30 30
100 100
Weather radar data Microwave link data
Source: SMHI

24 ERICSSON MOBILITY REPORT JUNE 2016
Growing up streaming
Given the massive explosion of video content available on the internet, there is a corresponding sharp increase in streamed video viewing, particularly among younger generations. Today’s teens are streaming natives, as they have no experience of a world without online video streaming
TV/video viewership is changing for everyone
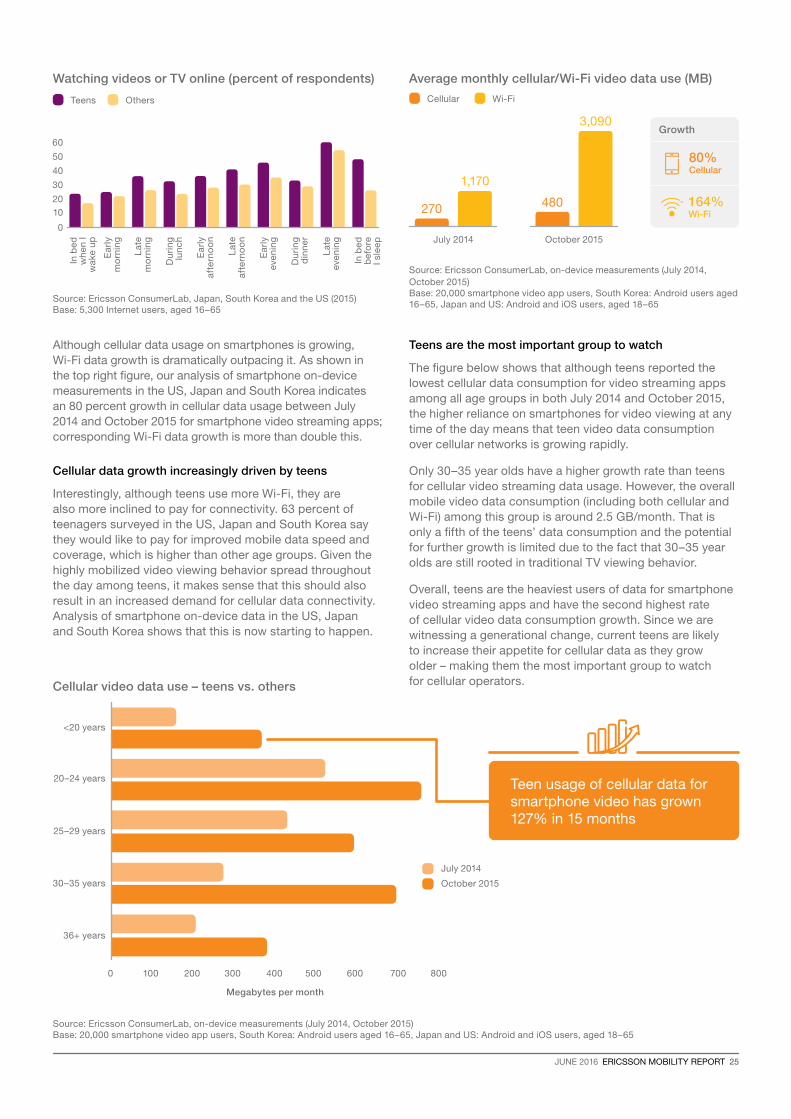
Viewing is gradually switching from traditional TV to streaming video on smartphones. Although most streaming is over Wi-Fi, high growth rates can be seen for teen data usage over cellular networks, as they stream video throughout the day – indicating a major shift in behavior.
When looking at total time spent watching TV and video content at home, teens spend roughly as much time watching as others. In fact, when compared with internet users between 20-59 years old with smartphones, teens aged 16-19 reported similar overall viewing times at home to others both in 2011 and 2015.
However, screen preference is gradually changing from the traditional TV set to smartphones. This is a change that can be observed across age groups, although it is most clearly seen in teen behavior. Between 2011 and 2015, teens increased their TV/video viewing at home on smartphones by 85 percent and nearly halved their time spent watching on a traditional TV screen. Older generations are slower to
change. For example, 30–35 year-olds spent 4 hours more than teens in front of the traditional TV in 2011 and still did so in 2015.
Video streaming situations spread out across time and place
When TV/video viewing migrates from fixed to mobile screens, viewing situations spread out across the day. Teenagers have higher viewership and more video sessions for all parts of the day. This behavior has also been verified by analysis of smartphone on-device measurements.
Wi-Fi data use still grows faster than cellular data
With a lot of mobile device viewing time spent indoors, it should come as no surprise that over 85 percent1 of data traffic generated by the use of smartphone video apps goes over Wi-Fi. However, given that video viewing is taking place across the whole day, there are situations where Wi-Fi is unavailable or insufficient, leading to an increase in video viewing over cellular networks.
Teens have increased smartphone TV/video viewing 85% in 4 years
Total weekly hours of TV/video viewing at home
Source: Ericsson ConsumerLab, TV and Media (2011, 2015)Base: 9,000 respondents aged 16-59 in Brazil, China, Germany, South Korea, Spain, Sweden, Taiwan, UK and US
Teens Others
0
10
5
15
2011 2011 2011 2011 2011
TV Smartphone Tablet
2015 2015 2015 2015 2015
Desktop Laptop
1 Ericsson ConsumerLab, on-device measurements, October 2015
JUNE 2016 ERICSSON MOBILITY REPORT 25
July 2014 October 2015
Although cellular data usage on smartphones is growing, Wi-Fi data growth is dramatically outpacing it. As shown in the top right figure, our analysis of smartphone on-device measurements in the US, Japan and South Korea indicates an 80 percent growth in cellular data usage between July 2014 and October 2015 for smartphone video streaming apps; corresponding Wi-Fi data growth is more than double this.
Cellular data growth increasingly driven by teens
Interestingly, although teens use more Wi-Fi, they are also more inclined to pay for connectivity. 63 percent of teenagers surveyed in the US, Japan and South Korea say they would like to pay for improved mobile data speed and coverage, which is higher than other age groups. Given the highly mobilized video viewing behavior spread throughout the day among teens, it makes sense that this should also result in an increased demand for cellular data connectivity. Analysis of smartphone on-device data in the US, Japan and South Korea shows that this is now starting to happen.
Teens are the most important group to watch
The figure below shows that although teens reported the lowest cellular data consumption for video streaming apps among all age groups in both July 2014 and October 2015, the higher reliance on smartphones for video viewing at any time of the day means that teen video data consumption over cellular networks is growing rapidly.
Only 30–35 year olds have a higher growth rate than teens for cellular video streaming data usage. However, the overall mobile video data consumption (including both cellular and Wi-Fi) among this group is around 2.5 GB/month. That is only a fifth of the teens’ data consumption and the potential for further growth is limited due to the fact that 30–35 year olds are still rooted in traditional TV viewing behavior.
Overall, teens are the heaviest users of data for smartphone video streaming apps and have the second highest rate of cellular video data consumption growth. Since we are witnessing a generational change, current teens are likely to increase their appetite for cellular data as they grow older – making them the most important group to watch for cellular operators.
Teen usage of cellular data for smartphone video has grown 127% in 15 months
Cellular video data use – teens vs. others
Watching videos or TV online (percent of respondents)
Teens Others
0 100 200 300 400 500 600 700 800
Source: Ericsson ConsumerLab, on-device measurements (July 2014, October 2015) Base: 20,000 smartphone video app users, South Korea: Android users aged 16–65, Japan and US: Android and iOS users, aged 18–65
Source: Ericsson ConsumerLab, Japan, South Korea and the US (2015) Base: 5,300 Internet users, aged 16–65
3,090
Average monthly cellular/Wi-Fi video data use (MB)
Cellular Wi-Fi
Source: Ericsson ConsumerLab, on-device measurements (July 2014, October 2015) Base: 20,000 smartphone video app users, South Korea: Android users aged 16–65, Japan and US: Android and iOS users, aged 18–65
80% Cellular
164% Wi-Fi270 480
1,170
Growth
In b
ed
w
he
n I
wak
e u
p
Du
rin
g
lun
ch
Ea
rly
mo
rnin
g
Ea
rly
afte
rno
on
Ea
rly
eve
nin
g
Lat
e m
orn
ing
Lat
e af
tern
oo
n
Du
rin
g
din
ne
r
Lat
e ev
en
ing
In b
ed
b
efo
re
I sle
ep
0
60
50
40
30
20
10
<20 years
20–24 years
25–29 years
Megabytes per month
30–35 years
36+ years
July 2014
October 2015
26 ERICSSON MOBILITY REPORT JUNE 2016
5th percentile
Using a time-to-content target to determine an optimal cell load ceiling
Managing user experience
High load in less than a tenth of the cells in a metropolitan area can affect more than half of the user activity over the course of 24 hours. This is not necessarily bad news – with an efficient way to identify highly loaded cells, focused improvements can be made to enhance overall user experience
Before the smartphone revolution, most of the attention in mobile network operations was focused on managing voice coverage. Voice now constitutes less than five percent of mobile traffic. Users still expect good voice coverage, but they also expect good user experience when they access the internet through apps running on their smart devices. Providing good app coverage has become an important differentiator for mobile operators, and it has a significant impact on subscriber loyalty and an operator’s Net Promoter Score (NPS). The ability to directly connect user experience to network performance statistics is a major step on the way to monitoring and managing app coverage.
Good app coverage depends on sufficient uplink and downlink throughput and low latency, which in turn depend on many factors, including cell load and radio channel quality. With so many variables involved, it is challenging to manage networks effectively to deliver the desired level of user experience.
Data analytics are increasingly being applied to find relationships between user experience and network
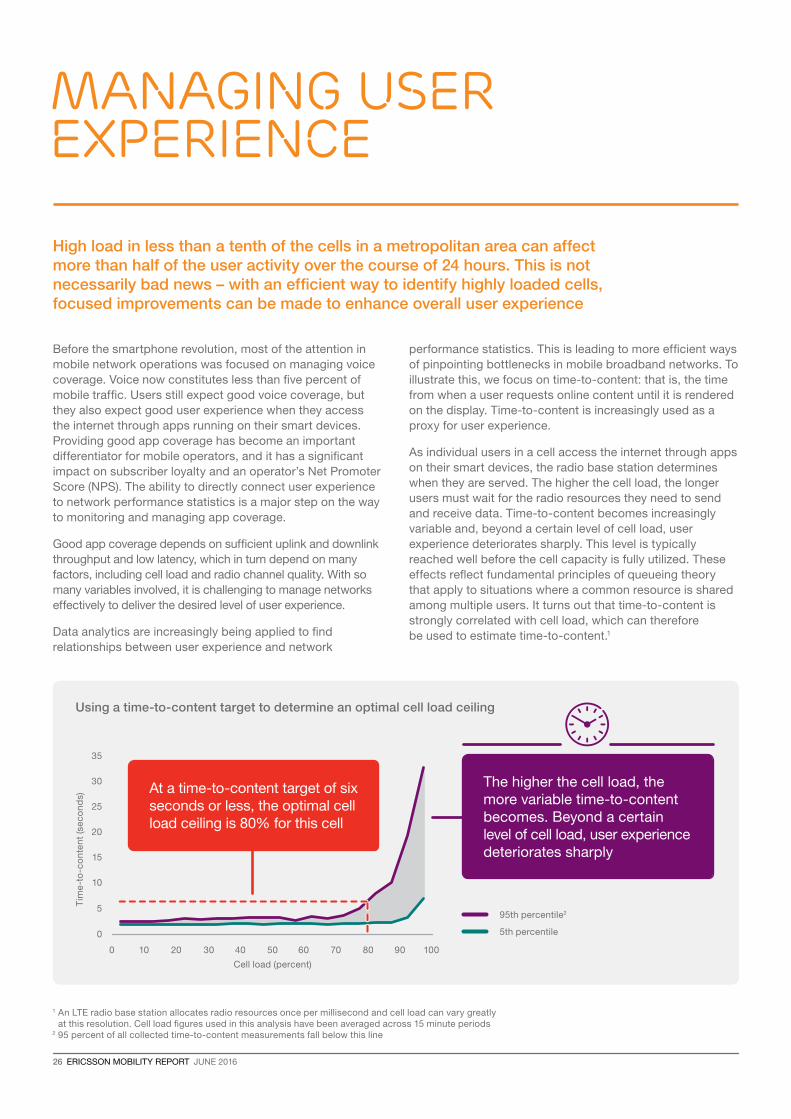
performance statistics. This is leading to more efficient ways of pinpointing bottlenecks in mobile broadband networks. To illustrate this, we focus on time-to-content: that is, the time from when a user requests online content until it is rendered on the display. Time-to-content is increasingly used as a proxy for user experience.
As individual users in a cell access the internet through apps on their smart devices, the radio base station determines when they are served. The higher the cell load, the longer users must wait for the radio resources they need to send and receive data. Time-to-content becomes increasingly variable and, beyond a certain level of cell load, user experience deteriorates sharply. This level is typically reached well before the cell capacity is fully utilized. These effects reflect fundamental principles of queueing theory that apply to situations where a common resource is shared among multiple users. It turns out that time-to-content is strongly correlated with cell load, which can therefore be used to estimate time-to-content.1
1 An LTE radio base station allocates radio resources once per millisecond and cell load can vary greatly at this resolution. Cell load figures used in this analysis have been averaged across 15 minute periods
2 95 percent of all collected time-to-content measurements fall below this line
0
5
10
15
20
25
30
35
Tim
e-t
o-c
on
ten
t (s
ec
on
ds)
Cell load (percent)
100 20 30 40 50 60 70 80 90 100
95th percentile2
The higher the cell load, the more variable time-to-content becomes. Beyond a certain level of cell load, user experience deteriorates sharply
At a time-to-content target of six seconds or less, the optimal cell load ceiling is 80% for this cell
JUNE 2016 ERICSSON MOBILITY REPORT 27
The figure on the previous page plots time-to-content for a reference web page versus cell load. The time-to-content statistics were collected on smartphones set up to take measurements continually, while the cell load statistics came from network counters. The optimal ceiling for cell load is a trade-off between the operator’s target for time-to-content and getting the most out of network investments. In this example, the target is defined as a popular web page loading in 6 seconds or less, 95 percent of the time. Given this target, the plot indicates that the optimal ceiling for cell load should be around 80 percent for this particular cell. In the same way, an optimal ceiling can be established and monitored for every cell. If any cell operates above its ceiling, network operations personnel can be alerted to explore what is limiting the cell’s capacity and focus on improvements.
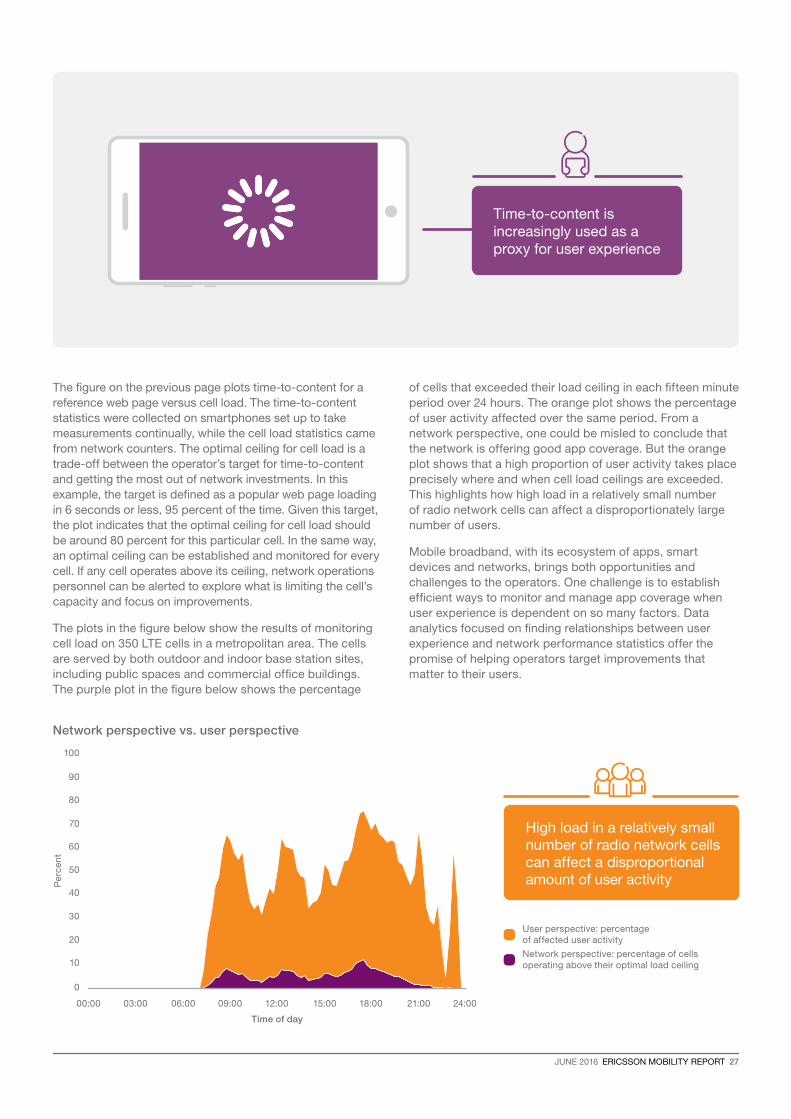
The plots in the figure below show the results of monitoring cell load on 350 LTE cells in a metropolitan area. The cells are served by both outdoor and indoor base station sites, including public spaces and commercial office buildings. The purple plot in the figure below shows the percentage
of cells that exceeded their load ceiling in each fifteen minute period over 24 hours. The orange plot shows the percentage of user activity affected over the same period. From a network perspective, one could be misled to conclude that the network is offering good app coverage. But the orange plot shows that a high proportion of user activity takes place precisely where and when cell load ceilings are exceeded. This highlights how high load in a relatively small number of radio network cells can affect a disproportionately large number of users.
Mobile broadband, with its ecosystem of apps, smart devices and networks, brings both opportunities and challenges to the operators. One challenge is to establish efficient ways to monitor and manage app coverage when user experience is dependent on so many factors. Data analytics focused on finding relationships between user experience and network performance statistics offer the promise of helping operators target improvements that matter to their users.
Network perspective vs. user perspective
0
10
20
30
40
50
60
70
80
90
100
Pe
rce
nt
Time of day
00:00 03:00 06:00 09:00 12:00 15:00 18:00 21:00 24:00
High load in a relatively small number of radio network cells can affect a disproportional amount of user activity
Network perspective: percentage of cells operating above their optimal load ceiling
User perspective: percentage of affected user activity
Time-to-content is increasingly used as a proxy for user experience
28 ERICSSON MOBILITY REPORT JUNE 2016
Following regulatory decisions made at WRC-15 in Geneva, the International Telecommunication Union (ITU) is commissioning international spectrum studies within its Radiocommunication Sector (ITU-R). The studies concern 5G mobile broadband systems of specific frequency bands in the 24.25-86 GHz range, as shown in the table on the right. This will pave the way for decisions in the fall of 2019. Such new spectrum decisions at the ITU WRC-19 will allow for standardized and commercial 5G deployments beyond 2020. This is good news for the future development of more advanced mobile broadband services.
Intensive work by ITU-R and 3GPP is also ongoing to finalize specifications and standards for deployment of 5G networks before 2020. These efforts need to take into account the challenges presented by the many different requirements of future 5G users. In addition, the different properties in the various frequency bands for 5G networks – primarily differing propagation characteristics and available bandwidths – must also be considered. Beyond 2020, the bands included in the ITU-R studies towards WRC-19 will play very important roles in the 5G deployments in many countries.
Mobile industry suppliers are already cooperating with some national regulators and operators in pursuing deployment of innovative 5G services. However, decisions taken at WRC-15 do not include studies of frequency bands below 24.25 GHz, a fact which has generated incentives for the mobile industry to find new ways to enable solutions for early deployments of 5G networks. Therefore, parts of the range 3,100-4,200 MHz is regarded as essential for early deployments of 5G.
In addition, the 27.5–29.5 GHz frequency range is not on the ITU-R list for WRC-19, although several countries
There is a need for spectrum harmonization between countries planning early 5G deployment. This needs to be done in addition to the current process for WRC-19, which focuses on spectrum for commercial 5G deployment beyond 2020
The need for spectrum harmonization
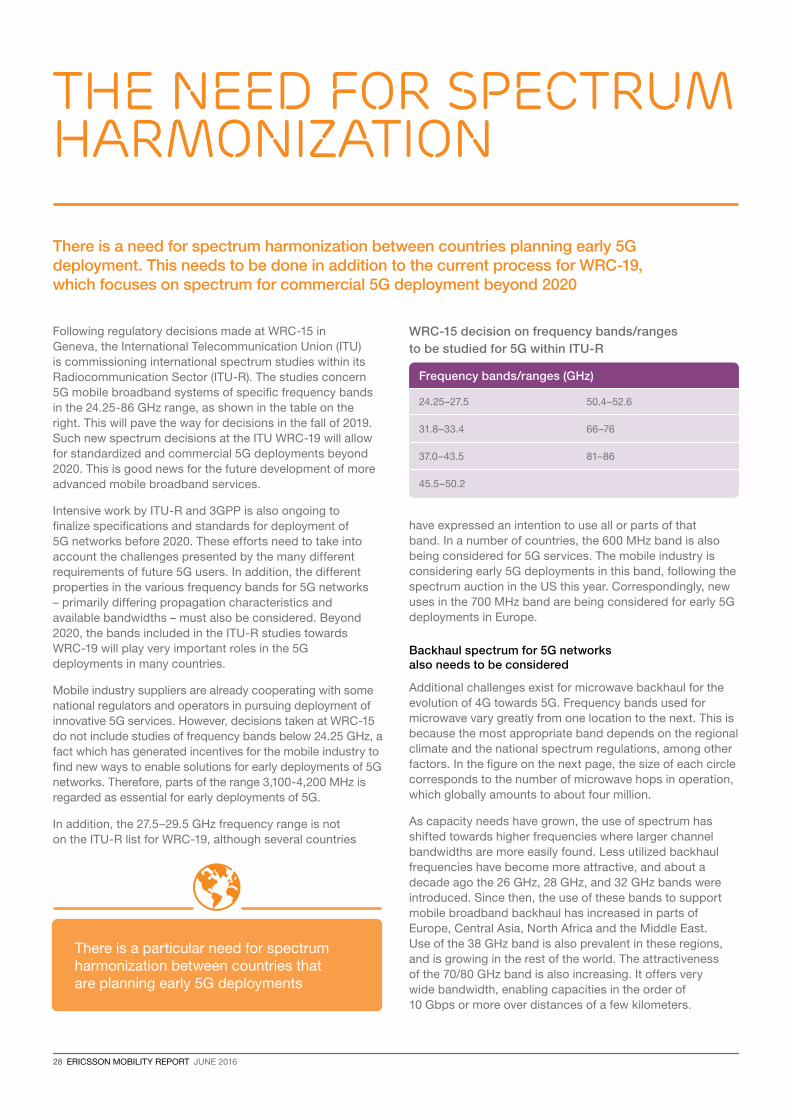
WRC-15 decision on frequency bands/ranges to be studied for 5G within ITU-R
have expressed an intention to use all or parts of that band. In a number of countries, the 600 MHz band is also being considered for 5G services. The mobile industry is considering early 5G deployments in this band, following the spectrum auction in the US this year. Correspondingly, new uses in the 700 MHz band are being considered for early 5G deployments in Europe.
Backhaul spectrum for 5G networks also needs to be considered
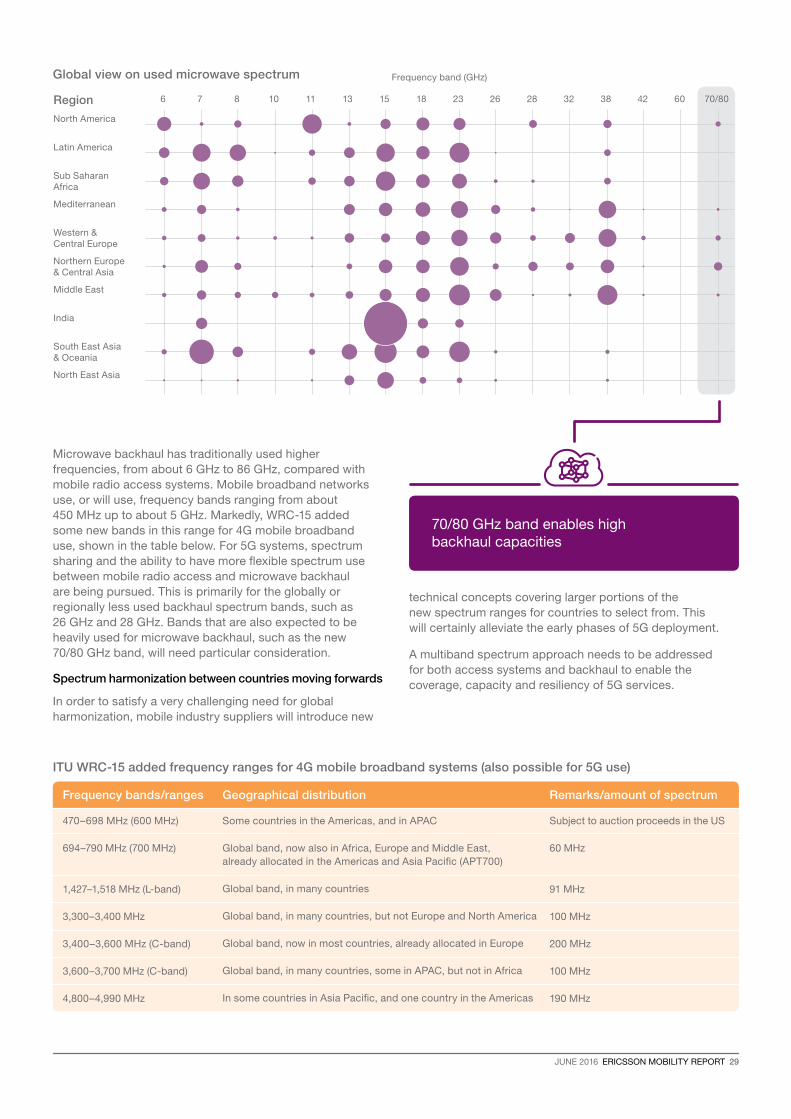
Additional challenges exist for microwave backhaul for the evolution of 4G towards 5G. Frequency bands used for microwave vary greatly from one location to the next. This is because the most appropriate band depends on the regional climate and the national spectrum regulations, among other factors. In the figure on the next page, the size of each circle corresponds to the number of microwave hops in operation, which globally amounts to about four million.
As capacity needs have grown, the use of spectrum has shifted towards higher frequencies where larger channel bandwidths are more easily found. Less utilized backhaul frequencies have become more attractive, and about a decade ago the 26 GHz, 28 GHz, and 32 GHz bands were introduced. Since then, the use of these bands to support mobile broadband backhaul has increased in parts of Europe, Central Asia, North Africa and the Middle East. Use of the 38 GHz band is also prevalent in these regions, and is growing in the rest of the world. The attractiveness of the 70/80 GHz band is also increasing. It offers very wide bandwidth, enabling capacities in the order of 10 Gbps or more over distances of a few kilometers.
24.25–27.5
31.8–33.4
37.0–43.5
45.5–50.2
50.4–52.6
66–76
81–86
Frequency bands/ranges (GHz)
There is a particular need for spectrum harmonization between countries that are planning early 5G deployments
JUNE 2016 ERICSSON MOBILITY REPORT 29
Frequency band (GHz)Global view on used microwave spectrum
ITU WRC-15 added frequency ranges for 4G mobile broadband systems (also possible for 5G use)
70/80 GHz band enables high backhaul capacities
Region 6 7 8 10 11 13 15 18 23 26 28 32 38 42 60 70/80
North America
Latin America
Sub Saharan Africa
Mediterranean
Western & Central Europe
Northern Europe & Central Asia
Middle East
India
South East Asia & Oceania
North East Asia
Microwave backhaul has traditionally used higher frequencies, from about 6 GHz to 86 GHz, compared with mobile radio access systems. Mobile broadband networks use, or will use, frequency bands ranging from about 450 MHz up to about 5 GHz. Markedly, WRC-15 added some new bands in this range for 4G mobile broadband use, shown in the table below. For 5G systems, spectrum sharing and the ability to have more flexible spectrum use between mobile radio access and microwave backhaul are being pursued. This is primarily for the globally or regionally less used backhaul spectrum bands, such as 26 GHz and 28 GHz. Bands that are also expected to be heavily used for microwave backhaul, such as the new 70/80 GHz band, will need particular consideration.
Spectrum harmonization between countries moving forwards
In order to satisfy a very challenging need for global harmonization, mobile industry suppliers will introduce new
technical concepts covering larger portions of the new spectrum ranges for countries to select from. This will certainly alleviate the early phases of 5G deployment.
A multiband spectrum approach needs to be addressed for both access systems and backhaul to enable the coverage, capacity and resiliency of 5G services.
470–698 MHz (600 MHz)
694–790 MHz (700 MHz)
1,427–1,518 MHz (L-band)
3,300–3,400 MHz
3,400–3,600 MHz (C-band)
3,600–3,700 MHz (C-band)
4,800–4,990 MHz
Subject to auction proceeds in the US
60 MHz
91 MHz
100 MHz
200 MHz
100 MHz
190 MHz
Some countries in the Americas, and in APAC
Global band, now also in Africa, Europe and Middle East,already allocated in the Americas and Asia Pacific (APT700)
Global band, in many countries
Global band, in many countries, but not Europe and North America
Global band, now in most countries, already allocated in Europe
Global band, in many countries, some in APAC, but not in Africa
In some countries in Asia Pacific, and one country in the Americas
Frequency bands/ranges Remarks/amount of spectrumGeographical distribution
30 ERICSSON MOBILITY REPORT JUNE 2016
Forecast methodologyEricsson performs forecasts on a regular basis to support internal decisions and planning, as well as market communication. The subscription and traffic forecast baseline in this report uses historical data from various sources, validated with Ericsson internal data, including extensive measurements in customer networks. Future development is estimated based on macroeconomic trends, user trends (researched by Ericsson ConsumerLab), market maturity, technology development expectations and documents such as industry analyst reports, on a national or regional level, together with internal assumptions and analysis. Historical data may be revised if the underlying data changes – for example, if operators report updated subscription figures.
Mobile subscriptions include all mobile technologies. Subscriptions are defined by the most advanced technology that the mobile phone and network are capable of. Figures are rounded and hence summing up rounded data may result in slight differences from the actual total.
Traffic refers to aggregated traffic in mobile access networks and does not include DVB-H, Wi-Fi or Mobile WiMAX traffic.
VoIP is included in data traffic.
Traffic measurements
New devices and applications affect mobile networks. Having a deep and up-to-date knowledge of the traffic characteristics of different devices and applications is important when designing, testing and managing mobile networks. Ericsson regularly performs traffic measurements in over 100 live networks in all major regions of the world. Detailed measurements are made in a selected number of commercial WCDMA/HSPA and LTE networks with the purpose of discovering different traffic patterns. All subscriber data is made anonymous before it reaches Ericsson’s analysts.
methodology
To find out more, scan the QR code, or visit
www.ericsson.com/ericsson-mobility-report
You may use charts generated from
the Ericsson Traffic Exploration Tool
in your own publication as long as
Ericsson is stated as the source
There you will also be able to access
regional appendices and the
Mobile Business Trends appendix

JUNE 2016 ERICSSON MOBILITY REPORT 31
2G: 2nd generation mobile networks (GSM, CDMA 1x)
3G: 3rd generation mobile networks (WCDMA/HSPA, TD-SCDMA, CDMA EV-DO, Mobile WiMax)
3GPP: 3rd Generation Partnership Project
4G: 4th generation mobile networks (LTE, LTE-A)
5G: 5th generation mobile networks (not yet standardized)
ARPU: Average Revenue Per User, a measure of the revenue generated per user or unit
Basic phone: Non-smartphone
CAGR: Compound Annual Growth Rate
CAPEX: Capital Expenditure
CDMA: Code Division Multiple Access
DL: Downlink
EB: ExaByte, 1018 bytes
EDGE: Enhanced Data Rates for Global Evolution
EVS: Enhanced Voice Services
FDD: Frequency Division Duplex
GB: GigaByte, 109 bytes
GHz: Gigahertz
Gpbs: Gigabits per second
GSA: Global Supplier Association
GSM: Global System for Mobile Communications
GSMA: GSM Association
HSPA: High Speed Packet Access
ICT: Information and Communications Technology
IMS: IP Multimedia Subsystem
ITU: International Telecommunication Union
IoT: Internet of Things
ISP: Internet Service Provider
LTE: Long-Term Evolution
MB: MegaByte, 106 bytes
MBB: Mobile Broadband (defined as CDMA2000
EV-DO, HSPA, LTE, Mobile WiMax and TD-SCDMA) Mbps: Megabits per second
MHz: Megahertz
MIMO: Multiple Input Multiple Output
Mobile PC: Defined as laptop or desktop PC devices with built-in cellular modem or external USB dongle
Mobile router: A device with a cellular network connection to the internet and Wi-Fi or ethernet connection to one or several clients (such as PCs or tablets)
MTC: Machine-Type Communication
NFV: Network Function Virtualization
OPEX: Operational Expenditure
OS: Operating System
PB: PetaByte 1015 bytes
QAM: Quadrature Amplitude Modulation
RCS: Rich Communication Services
RTT: Round Trip Time
SEK: Swedish Krona
Smartphone: Mobile phones with open OS, e.g. iPhones, Android OS phones, Windows phones but also Symbian and Blackberry OS
TD-SCDMA: Time Division-Synchronous Code Division Multiple Access
TDD: Time Division Duplex
TB: TeraByte, 1012 bytes
VoIP: Voice over IP (Internet Protocol)
VoLTE: Voice over LTE
UL: Uplink
WCDMA: Wideband Code Division Multiple Access
WRC: World Radiocommunication Conference
glossary

EAB-16:006659 Uen, Revision A
© Ericsson AB 2016
Ericsson
SE-164 80 Stockholm, Sweden
Telephone +46 10 719 0000
www.ericsson.com
Ericsson is the driving force behind the Networked Society – a world leader in
communications technology and services. Our long-term relationships with every
major telecom operator in the world allow people, business and society to fulfill
their potential and create a more sustainable future.
Our services, software and infrastructure – especially in mobility, broadband and
the cloud – are enabling the telecom industry and other sectors to do better business,
increase efficiency, improve the user experience and capture new opportunities.
With approximately 115,000 professionals and customers in 180 countries, we combine
global scale with technology and services leadership. We support networks that
connect more than 2.5 billion subscribers. Forty percent of the world’s mobile traffic
is carried over Ericsson networks. And our investments in research and development
ensure that our solutions – and our customers – stay in front.