eric ngandu (10275959) final thesis 2015
TRANSCRIPT
THE COPPERBELT UNIVERSITY
SCHOOL OF MINES AND MINERAL SCIENCES
DEPARTMENT OF ENVIRONMENTAL ENGINEERING
The Generation and Retention of Aerosol Nanoparticles by comparing two PVC
filter membranes of different pore size at Kansanshi Mining PLC.
DECEMBER, 2014.
PROJECT REPORT
SUBMITTED IN PARTIAL FULFILLMENT OF THE
REQUIREMENT FOR THE DEGREE
IN
ENVIRONMENTAL ENGINEERING
BY
NGANDU ERIC
(10275959)
UNDER THE SUPERVISION OF
DR. P. MWAANGA
i | P a g e
LETTER OF TRANSIMITTAL
The Project Supervisor,
The Copperbelt University
Department of Environmental Engineering
P.O Box 21692.
KITWE.
Dear Sir,
REF: SUBMISSION OF THE FINAL YEAR PROJECT REPORT
In partial fulfilment of a Bachelor’s Degree in Environmental Engineering, I submit this
report to the Copperbelt University in the faculty of the Environmental Engineering under
the school of Mines and Mineral Sciences.
My sincere hope is that this report will help meet the main objective and that the results
and recommendations can be applied to protect and understand the generation and
distribution of aerosol nanoparticles in mining environment.
Yours faithfully,
NGANDU ERIC

ii | P a g e
DECLARATION
I, Ngandu Eric, declare that the work and information contained in this document is the
absolute truth and is my own. All the work by other persons and the sources has been
rightfully and duly acknowledged. To the best of my knowledge, I further affirm that this
work has never been presented at this or any other university.
Author’s Signature
……………………………….. Date ………………………………….
Supervisors Signature
……………………………… Date …………………………………..

iii | P a g e
DEDICATION
I would like to dedicate this report to my family; Dad Geoffrey Ngandu , Mum Violet
Ngambo Makeche, my brother Elvis Ngandu, and my sisters; Angela Ngandu, Andrea
Ngandu and Catherine Ngandu for the support they rendered to me both financially and
morally. Above all I would like to thank my God for giving me strength and good health
throughout my project.

iv | P a g e
ACKNOWLEGDEMENTS
I would like to thank my supervisor Dr. Phenny Mwaanga for his guidance and support.
His patience, trust and professional spirit he devoted to this work helped me in pursuing
my academic goals. He constantly pushed me to become a better environmental engineer
and search for the truth.
I am also grateful to my friends, Danny Simwanza, Walubita Mufalo, Jethro Katantha Jr,
Chitoshi Mukuka, Musonda Chizinga, Mafunda Mukuma and Trevor Lee Barry for
providing counsel, insight, and encouragement throughout the past years.
Thank you to Mr Martin Gilchrist, Mr Fred Mangala and Stanley Mayonde of Kansanshi
Mine Safety Department, Mr M. Munyenyembe for providing guidance, as well as thought-
provoking discussions about experimental results.
Finally, I have to express the deepest gratitude to my family. Their love, pride and
encouragement have made all the difference. The work ethic that my mother and father
have instilled in me was my single most valuable tool throughout this process. I appreciate
the tremendous efforts and sacrifices that they have consistently made throughout their
own lives to ensure that I was never limited for opportunity.
v | P a g e
Table of Contents LETTER OF TRANSIMITTAL ................................................................................................................. i
DECLARATION ................................................................................................................................. ii
DEDICATION ................................................................................................................................ iii
ACKNOWLEGDEMENTS ..................................................................................................................... iv
List of Figures .................................................................................................................................. vi
ABSTRACT ................................................................................................................................. vii
1.0. INTRODUCTION……………………………………………………………………………………….1
1.1. Problem Statement ……………………………………………………………………………..….3
1.2. Research Hypothesis………………………………………………………................................3
1.3. Justification………………………………………………………………………………………....3
1.4. Main Objective………………………………………………………………………………………4
2.0. MINE BACKGROUND …….………………………………………………………………………….5
2.1. Nanotechnology…………………………………………………………………………………..6
2.2. Nanoparticles ………………………………………………………………………………..……7
3.0. METHODOLOGY……………………………………………………………………………………11
3.1. Sample Collection……………………………………………………………………………..…11
3.2. Lab Analysis……………………………………………………………………………………..21
4.0. RESULTS……………………………………………………………………………………………22
4.1. Discussion……………………………………………………………………………………..…26
5.0. CONCLUSION……………………………………………………………………………………….27
5.1. Recommendations………………………………………………………………………….......28
6.0. APPENDICES………………………………………………………………………………………29
7.0. REFERENCES ….…………………………………………………………………………………33
vi | P a g e
List of Figures
Figure 1 Spectrum of PVC-acrylic filter taken at beam focus, 400 to 3400 cm-3 .................................. 10
Figure 2 Characteristic FTIR spectrum of sample on polymer membrane filter ................................... 10
Figure 3 Gyratory Crusher with dump truck feeding rocks and Aerosol nanoparticles being
generated ............................................................................................................................................ 14
Figure 4 Google earth map showing Gyro Crushers ............................................................................. 15
Figure 5 Main 8 showing moving Dump Trucks and Drillers generating aerosol nanoparticles .......... 17
Figure 6 Projection of mass differences of 0.5µm and 0.8µm filter membranes at Gyratory crushers
.............................................................................................................................................................. 22
Figure 7 Projection of mass differences of 0.5µm and 0.8µm filter membranes from the main pit ... 22
Figure 8 Projection of mass differences of 0.5µm and 0.8µm filter membranes from the underground
portal ..................................................................................................................................................... 23
Figure 9 Graph showing the concentration of silica retained on both filter membranes at the Gyratory
Crushers ................................................................................................................................................ 24
Figure 10 Graph showing the concentration of silica retained on both filter membranes at the Main Pit
.............................................................................................................................................................. 25
vii | P a g e
ABSTRACT
Aerosol Nanoparticles are very tiny nanometre (one billionth of a metre) sized particles
which are ubiquitous on earth. One of the common places to get exposed to these
nanoparticles is the mining industry.
This study investigates the generation of these aerosol nanoparticles, shows how they can
be distributed, compares and contrasts the retention of these aerosol nanoparticles on a
0.5µm filter membrane and the 0.8µm filter membrane which is currently in use at
Kansanshi Mining PLC. The Fourier Transform Infrared Spectroscopy (FTIR) was used to
identify the presence of Crystalline Silica in the samples retained on both the 0.5µm and
0.8µm and the GIL 5 Air check was used to capture the aerosol nanoparticles on the filter
membranes that are equipped in the cassettes of the GIL 5 Air Check.
In Zambian mining regulations, aerosol nanoparticles monitoring in the mines has always
been a challenge and some critical component such as crystalline silica have no standard
exposure limits (Hambuyu et al, 2008). Samples were carefully collected from various
mining activities such as blasting, gyratory stone crushing and general surroundings by
placing them on the operators working in the areas being sampled. The GIL 5 air check
pump was used to collect the samples for a shift duration of not less than 6hours which
were later analysed using the FTIR which is used to identify the presence Crystalline Silica.
The results therefore showed how the concentration of crystalline silica that is exposed to
the workers through the mining activities, can be reduced by using the 0.5µm filter
membrane as a pore size of the personal protective equipment that is available for use.
Keywords: Aerosol Nanoparticles, Crystalline silica nanoparticles, Fourier
Transform Infrared Spectroscopy (FTIR), Mining
1 | P a g e
CHAPTER ONE
1.0. INTRODUCTION
Zambia is one of the many fast developing nations in Africa and for this reason, it is
taking part in the most of the new sciences and technological frontiers (Ampian, et al,
2005). One such latest technological frontier is the venturing into Nanotechnology. The
term ‘’nanotechnology’’ refers to the technologies of the very small substances, with
dimensions in the nanometer range (Cui et al, 2002). Nanotechnologies exploit the
specific properties that arise from re-structuring matter at meso-scale characterized by
the interplay of classical physics and quantum mechanics (Cui et al, 2003).
The word nanoparticle is used to describe particles with diameters ranging from 1 to
more than 1000 nm. In addition to their size, these nanoparticles vary in their
morphology (Davda et al, 2002). A specific group of nanoparticles is categorized as
aerosol nanoparticles, and the nanoparticles that are discussed in this paper belong to
this group. The precise definition of an Aerosol Nanoparticle is a solid or liquid
suspended in a gas, thus the term aerosol refers to both the particle and the gas (Maria
et al, 2011). According to this definition, almost all nanoparticles could be considered
to be aerosol, but in this study only particles suspended in an air parcel will be termed
as aerosol nanoparticles.
Aerosol nanoparticles in mining environments may be generated from a wide variety of
sources, depending on the type of activity and processes taking place. Nanoparticle
aerosols arising from mechanical processes (e.g. underground mining, blasting, milling,
crushing and concentrator works) are likely to be formed. Nanoparticles exhibit
increased diffusivity with decreasing size and therefore show delayed sedimentation in
the earth’s gravitational field, which translates into potentially increased lifetimes for
nanoparticulate impurities at low concentration (Chen et al, 2012).
2 | P a g e
The most myriad aerosol nanoparticles that are generated in mining environment are
crystalline silica nanoparticles. Crystalline silica is a hard, chemically inert and has a
high melting point; it is a substance which is a by-product of many mining activities and
processes (Jones et al, 1967). The most common form of this crystalline silica is quartz
(IMA Europe, 2014). Therefore the fact that this ubiquitous compound is found in all
mining processes, makes the possibility of exposure very high by mine workers. Thus
workers in a large variety of industries and specifically the mining industry may be
exposed to crystalline silica because of its widespread natural occurrence and the wide
use of the materials and products containing it (silica) (OSHA gazette, 2014).
This study was mainly aimed at comparing the particle retention of samples on two
PVC filter membranes fitted in an air sampling device and identifying the presence of
crystalline silica. A 0.8µm PVC filter membrane and a 0.5µm PVC filter membrane were
used to measure and investigate the particle retention. Devices that were used in this
study included a GIL 5 air sampling pump and a Fourier Transform Infrared
spectroscopy (FTIR).
The Gil 5 personal air sampling pump is a suction air pump that is fitted with a
membrane casket in which a filter membrane is fitted and left open on one end to suck
in the ambient air together with its particles. The person equips the pump by harnessing
it on the belt or putting it in the pocket while the tube runs up the person’s garments
and up to the individuals breathing area (Ampian, et al, 1992).
The Fourier transform Infrared Spectroscopy is a technique used to measure how well
a sample absorbs light. Because of this, the particles which could either be liquid or
solid and in this case the solid crystalline silica particles will be identified.
3 | P a g e
1.1. Problem Statement
The generation of aerosol nanoparticles has always been an issue of major concern
in the mining sector in Zambia. Mining activities are a major contributor to the
generation of aerosol nanoparticles in which most particles generated do not get
trapped or retained by the conventional pore size of the filter membranes currently
used as protective dust masks. This exposure to these nanoparticles (mostly
crystalline silica) results in acquiring pulmonary diseases such as silicosis. Therefore
it is imperative that this problem is addressed in the effort to greatly reduce the
exposure.
1.2. Research Hypothesis
Some mining activities can generate crystalline silica nanoparticles that are found in
the respirable dust and are capable of passing through the 0.8µm filter membrane
currently in use in dust masks.
1.3. Justification
It is essential to investigate the aerosol nanoparticles generated as a result of mining
activities and identify them due to the fact that Zambia has for a long time published
a lot of information about Particulate Matter found in the dust emitted from the mining
activities but has neglected the possibility of this dust possessing very tiny particles
in the nanometre range that are capable of passing through the dust preventive filter
membranes being used. This study will integrate the new technology of nanoparticles
and promote the use of better and safer filter membrane pore size to help prevent the
acquiring of certain pulmonary diseases such as silicosis.
4 | P a g e
1.4. Main Objective
Assessing the generation and distribution of aerosol nanoparticles as a result of
mining activities by contrasting and comparing the retention of nanoparticles on two
PVC filter membranes of 0.5µm and 0.8µm pore size.
1.4.1. Specific Objectives
To assess the respirable dust and investigate the presence of
aerosol nanoparticles as a result of mining activities like blasting,
drilling and crushing.
To measure the sizes and mineralogy of the aerosol nanoparticles.
Compare the mass concentrations of the nanoparticles on the
0.8µm PVC filter membrane and the 0.5µm PVC filter membrane.
Identify the presence of crystalline silica in the nanoparticles.
5 | P a g e
CHAPTER TWO
2.0. LITERATURE REVIEW
2.1. Mine Background
Kansanshi Mining Plc., a double owned firm by First Quantum Mining Ltd and the
Zambian government in a percentage ratio of 80 to 20 respectively, is located at about
10km north of Solwezi, the administrative centre and headquarters of North Western
province. Kansanshi area used to be an environmentally degraded site; however, its
recommissioning provided an ideal opportunity to rectify residual adverse
environmental impacts. This is done by ensuring that lands that were deforested are
now vegetated, acid spills are minimized and controlled, to mention but a few. The
recent introduction of a game reserve area has been welcomed, as this will enable
the preservation and conservation of biodiversity in the woodlands surrounding the
mine.
Occupational Health and Safety (OHS), a section of the Safety department at
Kansanshi Mining Plc. is particularly interested in the health and safety of its
employees and surrounding communities such as Kabwela and Mushtala
communities. Kansanshi employees are exposed to hazardous conditions such as
intense heat, light, noise, dust emissions and gases to mention but a few, therefore,
the Occupational Health and Safety officers have to ensure that the employees and
communities are protected in accordance with the statutory regulations given by
ZEMA so as to adhere to the Kansanshi Mining Plc.
6 | P a g e
2.2. Nanotechnology
Nanotechnology is the art and science of manipulating matter at the atomic or
molecular scale and holds the promise of providing significant improvements in
technologies for protecting the environment (Hoet, et al, 2004).
While many definitions for nanotechnology exist, the U.S. Environmental Protection
Agency (EPA) uses the definition developed by the National Nanotechnology Initiative
(NNI), a U.S. Government research and development (R&D) program established to
coordinate multi-agency efforts in nanoscale science, engineering, and technology
(Oberd orster et al, 2007). The NNI (NNI 2007) requires nanotechnology to involve all
of the following:
Research and technology development at the atomic, molecular, or
macromolecular levels, in the length scale of approximately 1-100 nanometer
(nm) range in any direction;
Creating and using structures, devices, and systems that have novel
properties and functions as a result of their small and/or intermediate size; and
Ability to control or manipulate on the atomic scale.
Nanotechnology is thus the technology of the extremely small; one nm is defined as
one billionth of a meter. In comparison, 1 nm is one fifty-thousandth of the diameter
of a human hair, or, if a nanometer was scaled to the diameter of a child’s marble,
then a meter would have to be scaled to the diameter of the Earth (Sattler, 2010).
Nanotechnology is often regarded as being a product of the latter part of the twentieth
century, a product of the drive towards miniaturization led by the semiconductor
industry. However, in a broader sense, nanotechnology has been around, albeit
unrealized as such, for a long time. Two thousand years ago the ancient Greeks used
a permanent hair-dying recipe that worked by depositing 5 nm lead sulfide crystals
inside hair. High-quality steel made in India before the turn of the first millennium has
7 | P a g e
been shown to contain—and owe its outstanding properties to—carbide structures
similar to modern carbon nanotubes. Medieval artists colored stained glass using
metal nanoparticles (Ampian, et al, 2005). The difference between these ancient
examples of “nanotechnology” and the current situation is the ability to understand—
or at least embark on a path towards understanding—the fundamental principles
underlying Nano technological behavior, the ability to assess the current state of
knowledge, and the ability to systematically plan for the future based on that
knowledge.
2.3. Nanoparticles
All human beings are exposed to nanoparticles in their everyday life. Nanoparticles
are generated by several mechanisms including nature itself (in forests, oceans, and
deserts), and arise from anthropogenic sources such as combustion engines, car
tires, coal fires, cooking, mining and construction. It is well known that nanoparticles
can have a major impact on climate (Ramanathan et al, 2001) and public health (Hoet,
et al, 2004). Nanoparticles in the atmosphere affect the climate both by direct
scattering of short-wave incoming solar radiation and by influencing cloud formation
(Andreae et al, 2005). Although nanoparticles may have a positive effect on climate,
due to their effects on cloud formation, which is believed to reduce global warming
nanoparticles in the air have severe negative effects on human health. It has been
demonstrated that long-term exposure to airborne nanoparticles is an important risk
factor in mortality due to cardiopulmonary disease and lung cancer (Pope, 2002) the
word nanoparticle is used to describe particles with diameters ranging from 1 to more
than 1000 nm. Throughout this thesis the term nanoparticles is used to describe
particles with diameters roughly between 1 and 200 nm. In addition to their size, the
shape of nanoparticles can also vary significantly. Some nanoparticles are spherical
or almost spherical, some have a hexagonal shape, and others exhibit a less compact,
8 | P a g e
chain-like structure. Furthermore, the internal structure of nanoparticles, often
meaning the way in which their atoms are distributed, may also vary. Some are
amorphous (randomly distributed atoms) while others are crystalline (regularly
distributed atoms) (Simonis et al 2006). Crystalline materials may be polycrystalline,
which means that the structure (particle) contains different areas with different single
crystalline orientations.
A specific group of nanoparticles is categorized as aerosol particles, and the majority
of the particles discussed in this thesis belong to this group. The precise definition of
an aerosol is a solid or liquid particle suspended in a gas (Hinds, 1982) thus the term
aerosol refers to both the particle and the gas. It should be noted, however, that this
expression is often used for the particle only. According to this definition, almost all
nanoparticles could be considered to be aerosol particles, but in this thesis only solid
particles suspended in dust generated from mining activities, will be termed aerosol
nanoparticles (Simonis et al 2006).
Sources of Nanoparticles
Natural sources of nanoparticles
Nanoparticles are abundant in nature, as they are produced in many natural
processes, including photochemical reactions, volcanic eruptions, forest fires, and
simple erosion, and by plants and animals, e.g. shed skin and hair (Pope, 2002).
Though we usually associate air pollution with human activities – cars industry, and
charcoal burning, natural events such as dust storms, volcanic eruptions and forest
fires can produce such vast quantities of nanoparticulate matter that they profoundly
affect air quality worldwide.
The aerosols generated by human activities are estimated to be only about 10% of
the total, the remaining 90% having a natural origin (Taylor et al, 2002). These large-
9 | P a g e
scale phenomena are visible from satellites and produce particulate matter and
airborne particles of dust and soot ranging from the micro- to nanoscales.
Small particles suspended in the atmosphere, often known as aerosols, affect the
entire planet’s energy balance because they both absorb radiation from the sun and
scatter it back to space (Houghton, 2005).
It has been estimated that the most significant components of total global atmospheric
aerosols are, in decreasing mass abundance: mineral aerosols primarily from soil
deflation (wind erosion) with a minor component (<1%) from volcanoes
(16.8Terragram), sea salt (3.6 Terragram), natural and anthropogenic sulfates (3.3
Terragram), products of biomass burning excluding soot (1.8 Terragram), and of
industrial sources including soot (1.4 Terragram), natural and anthropogenic
nonmethane hydrocarbons (1.3 Terragram), natural and anthropogenic nitrates (0.6
Terragram), and biological debris (0.5 Terragram) (Buseck et al , 1999) (NOTE:
terragram, equal to 1012 grams).
Anthropogenic sources of nanoparticles
Many of the human activities generate different forms of nanoparticles. This can either
be a direct human impact or an indirect human impact (Pope, 2002). Mining is one
industry that as a result of its activities generates a lot of nanoparticles in particular
crystalline silica nanoparticles as a by-product of the target mineral extraction.
Crystalline Silica nanoparticles
Crystalline silica is a basic component of soil, sand, granite, and many other minerals.
Quartz is the most common form of crystalline silica. Cristobalite and tridymite are two
other forms of crystalline silica. All three forms may become respirable size particles
when workers chip, cut, drill, or grind objects that contain crystalline silica (Oberd
orster et al, 2007).
10 | P a g e
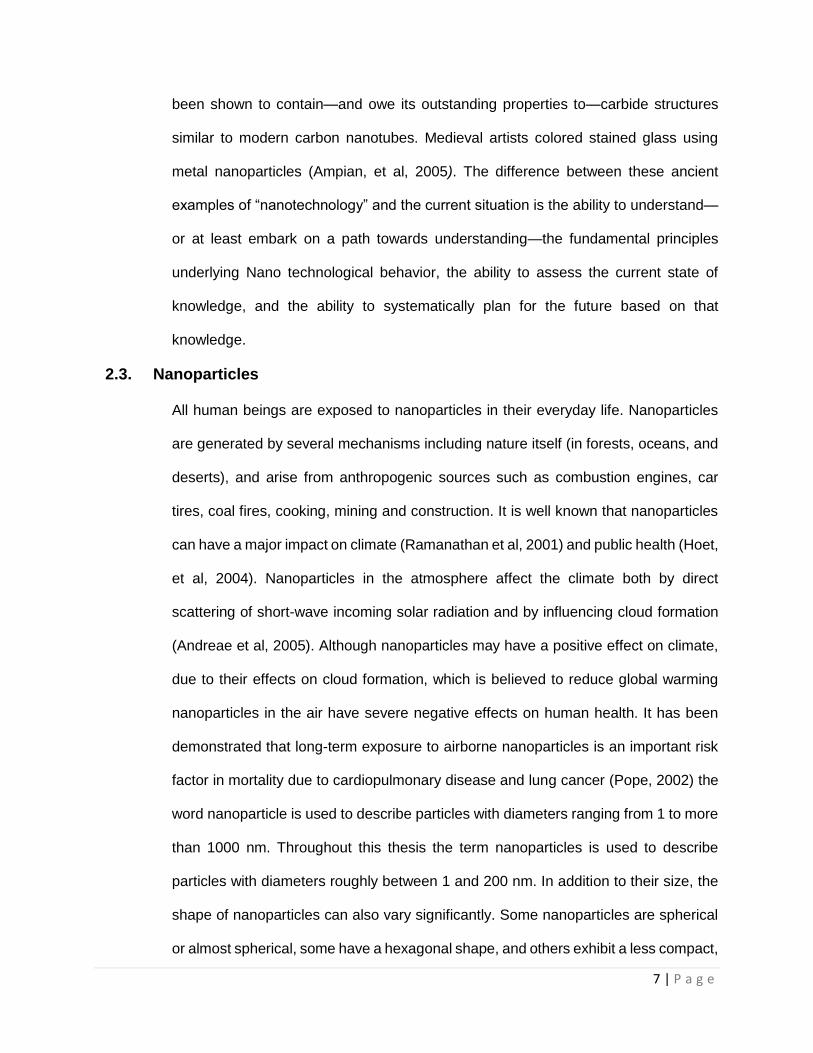
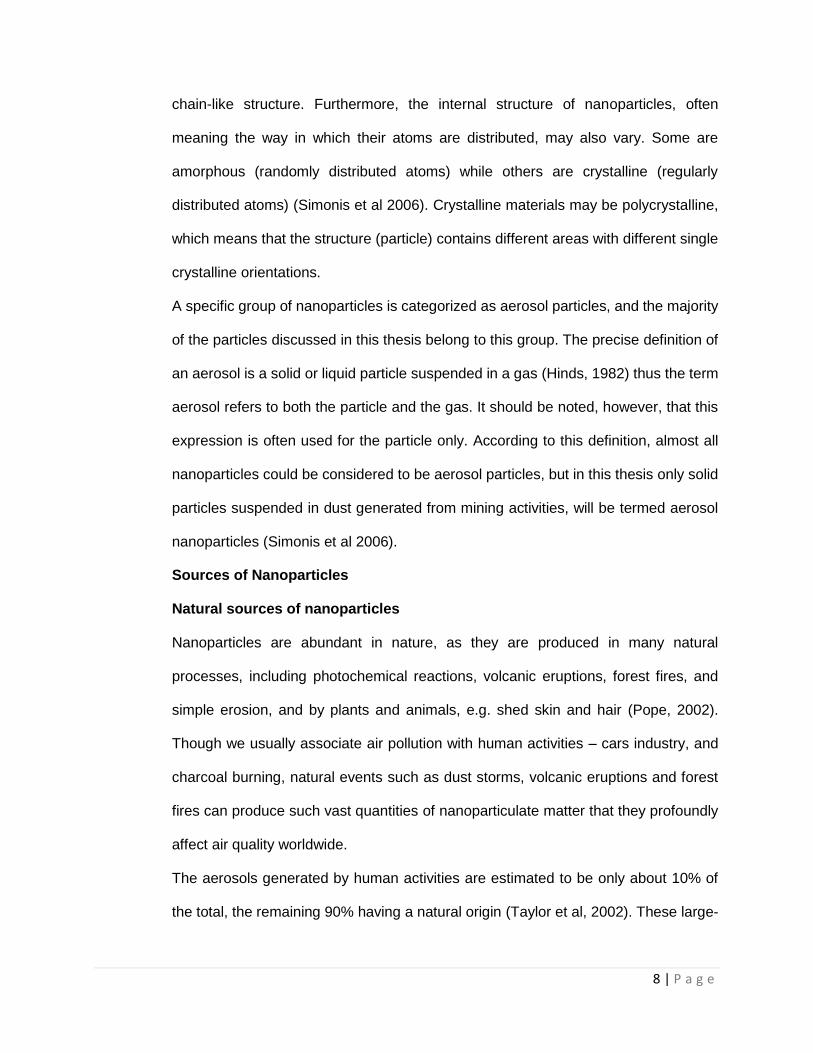
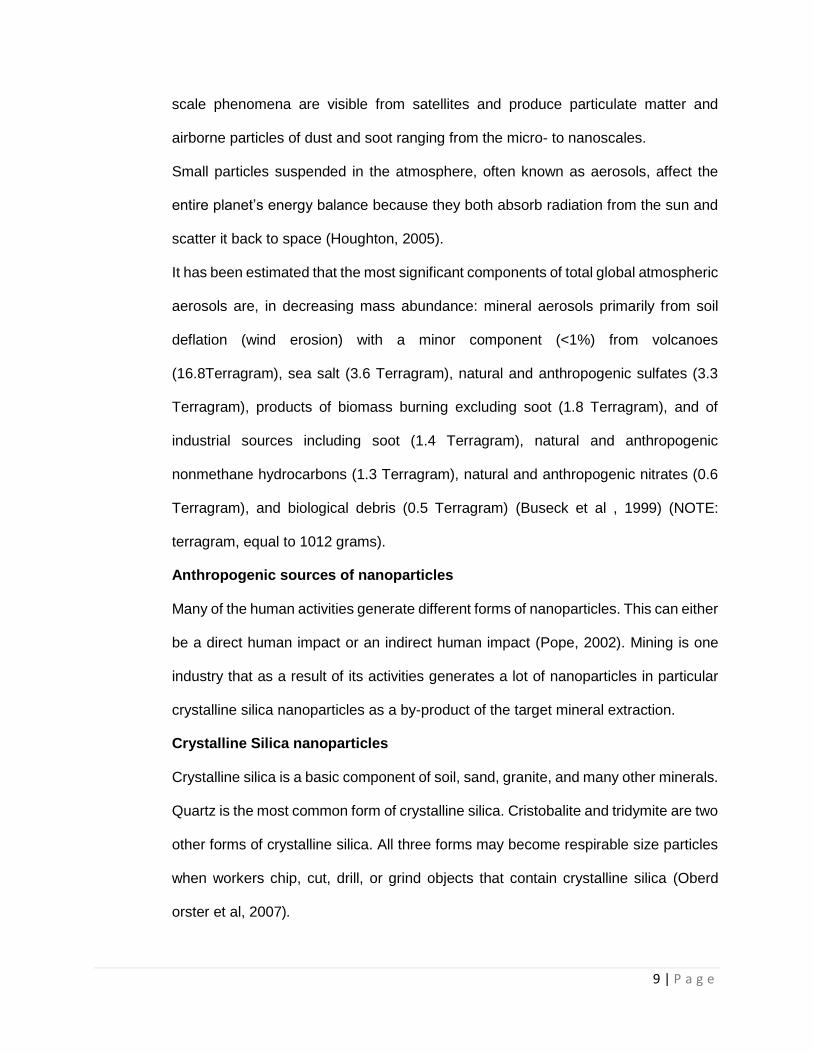
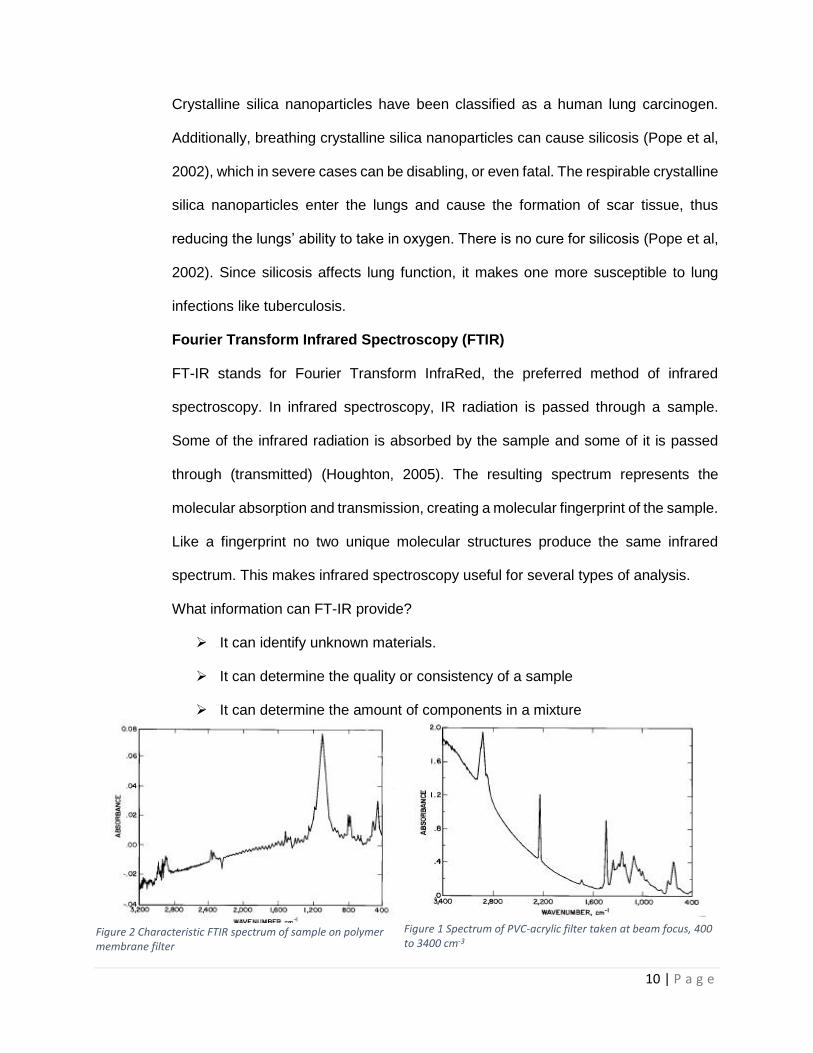
Figure 2 Characteristic FTIR spectrum of sample on polymer membrane filter
Figure 1 Spectrum of PVC-acrylic filter taken at beam focus, 400 to 3400 cm-3
Crystalline silica nanoparticles have been classified as a human lung carcinogen.
Additionally, breathing crystalline silica nanoparticles can cause silicosis (Pope et al,
2002), which in severe cases can be disabling, or even fatal. The respirable crystalline
silica nanoparticles enter the lungs and cause the formation of scar tissue, thus
reducing the lungs’ ability to take in oxygen. There is no cure for silicosis (Pope et al,
2002). Since silicosis affects lung function, it makes one more susceptible to lung
infections like tuberculosis.
Fourier Transform Infrared Spectroscopy (FTIR)
FT-IR stands for Fourier Transform InfraRed, the preferred method of infrared
spectroscopy. In infrared spectroscopy, IR radiation is passed through a sample.
Some of the infrared radiation is absorbed by the sample and some of it is passed
through (transmitted) (Houghton, 2005). The resulting spectrum represents the
molecular absorption and transmission, creating a molecular fingerprint of the sample.
Like a fingerprint no two unique molecular structures produce the same infrared
spectrum. This makes infrared spectroscopy useful for several types of analysis.
What information can FT-IR provide?
It can identify unknown materials.
It can determine the quality or consistency of a sample
It can determine the amount of components in a mixture
11 | P a g e
CHAPTER THREE
3.0. Methodology
The following methodology was used in order to achieve the objectives of the project.
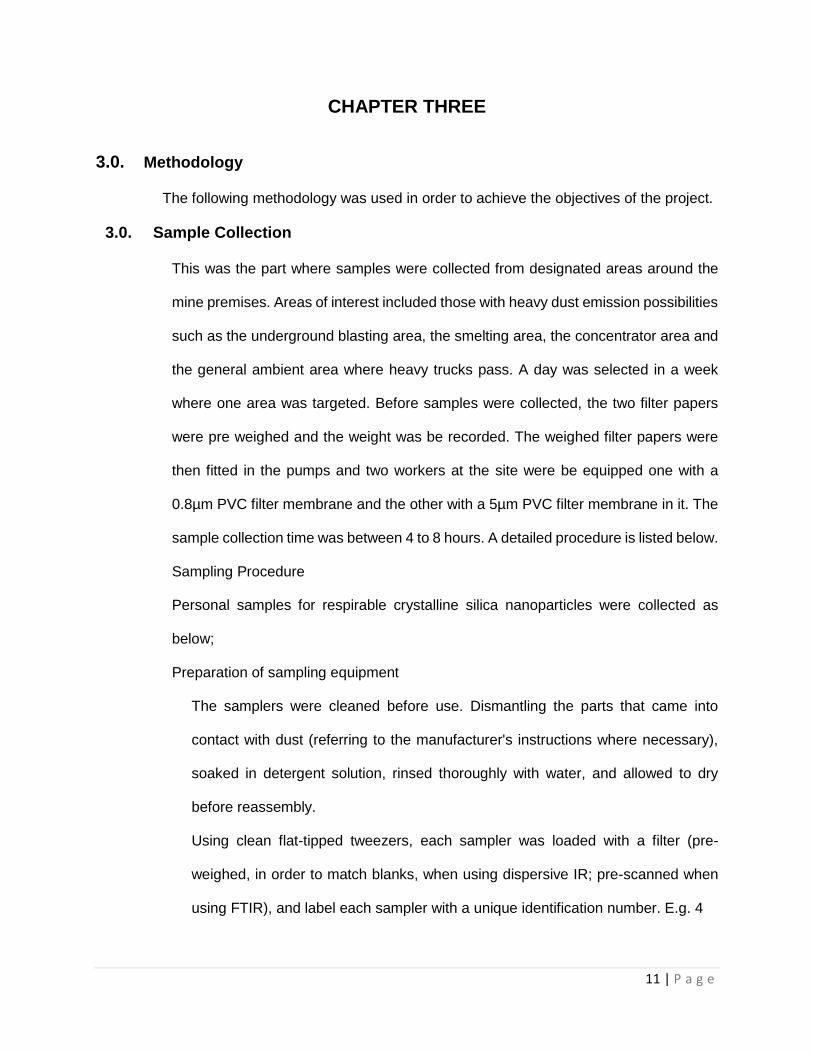
3.0. Sample Collection
This was the part where samples were collected from designated areas around the
mine premises. Areas of interest included those with heavy dust emission possibilities
such as the underground blasting area, the smelting area, the concentrator area and
the general ambient area where heavy trucks pass. A day was selected in a week
where one area was targeted. Before samples were collected, the two filter papers
were pre weighed and the weight was be recorded. The weighed filter papers were
then fitted in the pumps and two workers at the site were be equipped one with a
0.8µm PVC filter membrane and the other with a 5µm PVC filter membrane in it. The
sample collection time was between 4 to 8 hours. A detailed procedure is listed below.
Sampling Procedure
Personal samples for respirable crystalline silica nanoparticles were collected as
below;
Preparation of sampling equipment
The samplers were cleaned before use. Dismantling the parts that came into
contact with dust (referring to the manufacturer's instructions where necessary),
soaked in detergent solution, rinsed thoroughly with water, and allowed to dry
before reassembly.
Using clean flat-tipped tweezers, each sampler was loaded with a filter (pre-
weighed, in order to match blanks, when using dispersive IR; pre-scanned when
using FTIR), and label each sampler with a unique identification number. E.g. 4
12 | P a g e
The volumetric flow rate was set on each sampler to the 2.2 l/m, to an accuracy of
±5 %.
Collection of samples
The sampler was attached to the wearer, as close to the mouth and nose as
possible. The Cyclone samplers were not generally sensitive to orientation, but
were attached to the wearer with the grit-pot at the base. The pump was attached
to a suitable belt or harness so that it caused minimum inconvenience to the
wearer, and safely secured any tubing connecting the pump and sampler.
For each sampler, the sample identity and all relevant sampling data was carefully
recorded.
To begin sampling, the protective cover was removed from the sampler and
switched on the pump. The time and volumetric flow rate was recorded at the
beginning of the sampling period.
At the end of the sampling period, the volumetric flow rate and the time were
recorded again, and the duration of the sampling period was calculated.
Background (fixed position) sampling
In use, the personal samplers were mounted at approximately head height, away
from obstructions, fresh air inlets or strong winds. The sampling procedures were
otherwise the same as for personal sampling. It was not appropriate to compare
fixed point (background) samples with the exposure limit. Fixed-position samples
could have been useful in identifying the main source(s) of crystalline silica
nanoparticles exposure. Comparison of airborne concentration measurements
from personal and fixed point samples were given some indication of the extent to
which exposure arises from local or general conditions.
13 | P a g e
Sampling time
A long sampling time ensures a heavier deposit of dust on the filter, thus reducing
measurement inaccuracies. Sampling times were therefore made as long as is
reasonably practicable (preferably not less than four hours), and were a
representative of the working periods of the individuals being monitored. If the
aerosol nanoparticles concentration was so high that a single filter would be
overloaded, several filters were used consecutively.
Transport
The filter was removed from the sampler using flat-tipped tweezers, places it in an
airtight tin and closed with a lid. Particular care was taken to prevent material being
dislodged from the filter. Transportation the samples to the laboratory was carried
out in a container capable of preventing damage in transit, and labelled to ensure
proper handling.
14 | P a g e
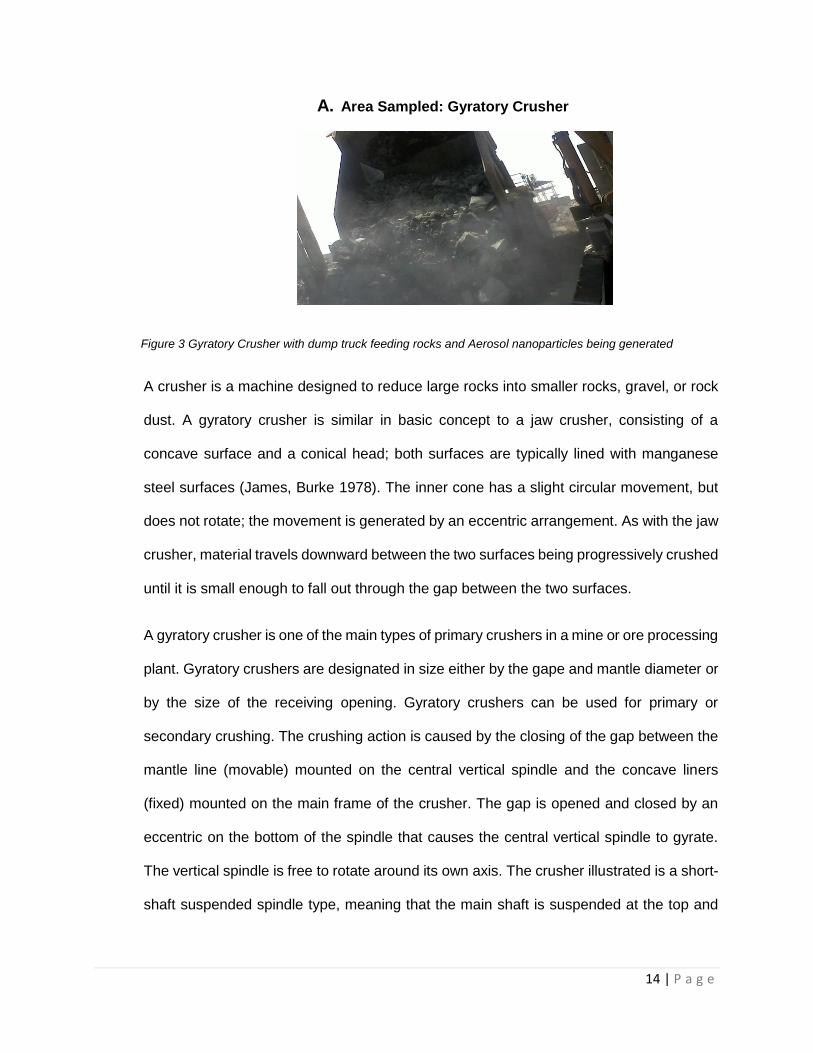
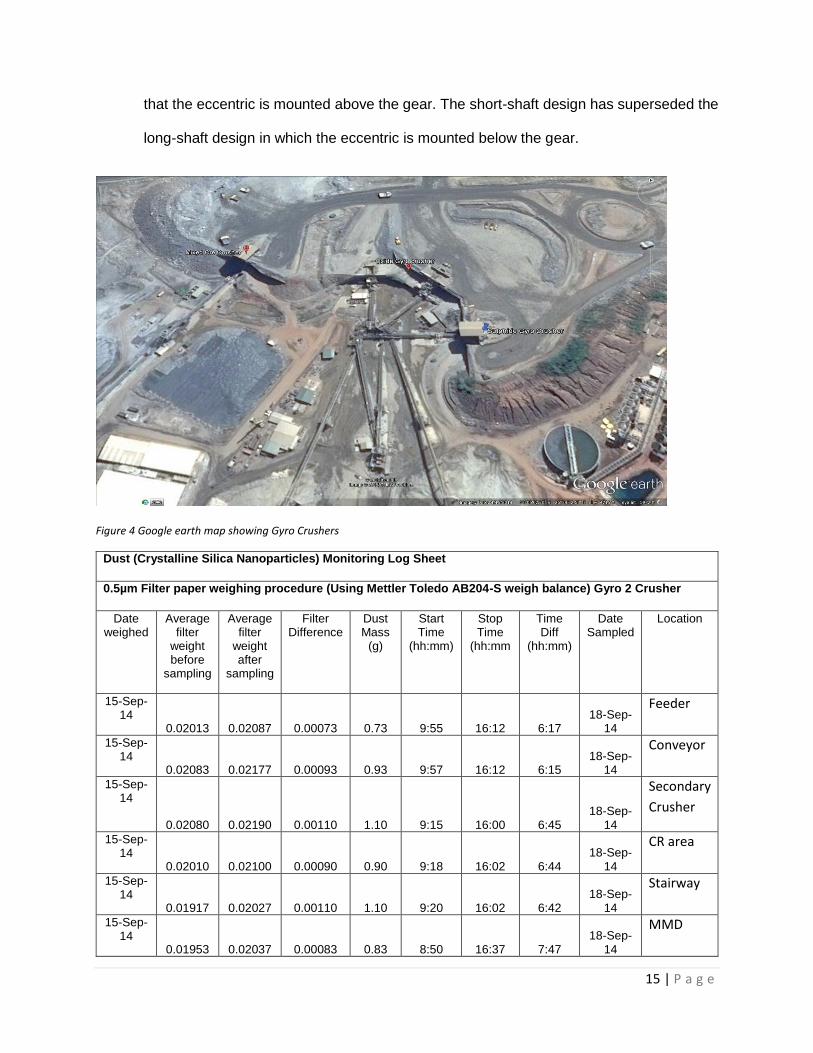
A. Area Sampled: Gyratory Crusher
Figure 3 Gyratory Crusher with dump truck feeding rocks and Aerosol nanoparticles being generated
A crusher is a machine designed to reduce large rocks into smaller rocks, gravel, or rock
dust. A gyratory crusher is similar in basic concept to a jaw crusher, consisting of a
concave surface and a conical head; both surfaces are typically lined with manganese
steel surfaces (James, Burke 1978). The inner cone has a slight circular movement, but
does not rotate; the movement is generated by an eccentric arrangement. As with the jaw
crusher, material travels downward between the two surfaces being progressively crushed
until it is small enough to fall out through the gap between the two surfaces.
A gyratory crusher is one of the main types of primary crushers in a mine or ore processing
plant. Gyratory crushers are designated in size either by the gape and mantle diameter or
by the size of the receiving opening. Gyratory crushers can be used for primary or
secondary crushing. The crushing action is caused by the closing of the gap between the
mantle line (movable) mounted on the central vertical spindle and the concave liners
(fixed) mounted on the main frame of the crusher. The gap is opened and closed by an
eccentric on the bottom of the spindle that causes the central vertical spindle to gyrate.
The vertical spindle is free to rotate around its own axis. The crusher illustrated is a short-
shaft suspended spindle type, meaning that the main shaft is suspended at the top and
15 | P a g e
that the eccentric is mounted above the gear. The short-shaft design has superseded the
long-shaft design in which the eccentric is mounted below the gear.
Figure 4 Google earth map showing Gyro Crushers
Dust (Crystalline Silica Nanoparticles) Monitoring Log Sheet
0.5µm Filter paper weighing procedure (Using Mettler Toledo AB204-S weigh balance) Gyro 2 Crusher
Date weighed
Average filter
weight before
sampling
Average filter
weight after
sampling
Filter Difference
Dust Mass
(g)
Start Time
(hh:mm)
Stop Time
(hh:mm
Time Diff
(hh:mm)
Date Sampled
Location
15-Sep-14
0.02013 0.02087 0.00073 0.73 9:55 16:12 6:17 18-Sep-
14
Feeder
15-Sep-14
0.02083 0.02177 0.00093 0.93 9:57 16:12 6:15 18-Sep-
14
Conveyor
15-Sep-14
0.02080 0.02190 0.00110 1.10 9:15 16:00 6:45 18-Sep-
14
Secondary
Crusher
15-Sep-14
0.02010 0.02100 0.00090 0.90 9:18 16:02 6:44 18-Sep-
14
CR area
15-Sep-14
0.01917 0.02027 0.00110 1.10 9:20 16:02 6:42 18-Sep-
14
Stairway
15-Sep-14
0.01953 0.02037 0.00083 0.83 8:50 16:37 7:47 18-Sep-
14
MMD
16 | P a g e
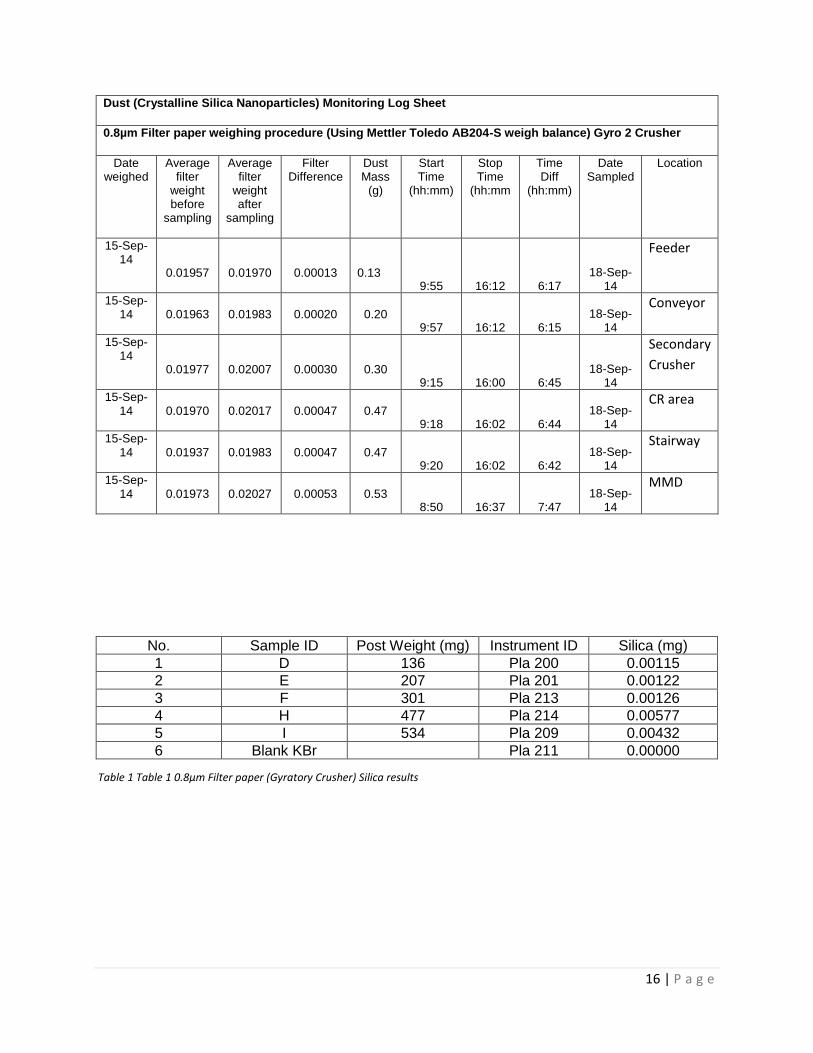
Dust (Crystalline Silica Nanoparticles) Monitoring Log Sheet
0.8µm Filter paper weighing procedure (Using Mettler Toledo AB204-S weigh balance) Gyro 2 Crusher
Date weighed
Average filter
weight before
sampling
Average filter
weight after
sampling
Filter Difference
Dust Mass
(g)
Start Time
(hh:mm)
Stop Time
(hh:mm
Time Diff
(hh:mm)
Date Sampled
Location
15-Sep-14
0.01957 0.01970 0.00013
0.13 9:55 16:12 6:17
18-Sep-14
Feeder
15-Sep-14 0.01963 0.01983 0.00020 0.20
9:57 16:12 6:15 18-Sep-
14
Conveyor
15-Sep-14
0.01977 0.02007 0.00030 0.30 9:15 16:00 6:45
18-Sep-14
Secondary
Crusher
15-Sep-14 0.01970 0.02017 0.00047 0.47
9:18 16:02 6:44 18-Sep-
14
CR area
15-Sep-14 0.01937 0.01983 0.00047 0.47
9:20 16:02 6:42 18-Sep-
14
Stairway
15-Sep-14 0.01973 0.02027 0.00053 0.53
8:50 16:37 7:47 18-Sep-
14
MMD
No. Sample ID Post Weight (mg) Instrument ID Silica (mg)
1 D 136 Pla 200 0.00115
2 E 207 Pla 201 0.00122
3 F 301 Pla 213 0.00126
4 H 477 Pla 214 0.00577
5 I 534 Pla 209 0.00432
6 Blank KBr Pla 211 0.00000
Table 1 Table 1 0.8µm Filter paper (Gyratory Crusher) Silica results
17 | P a g e
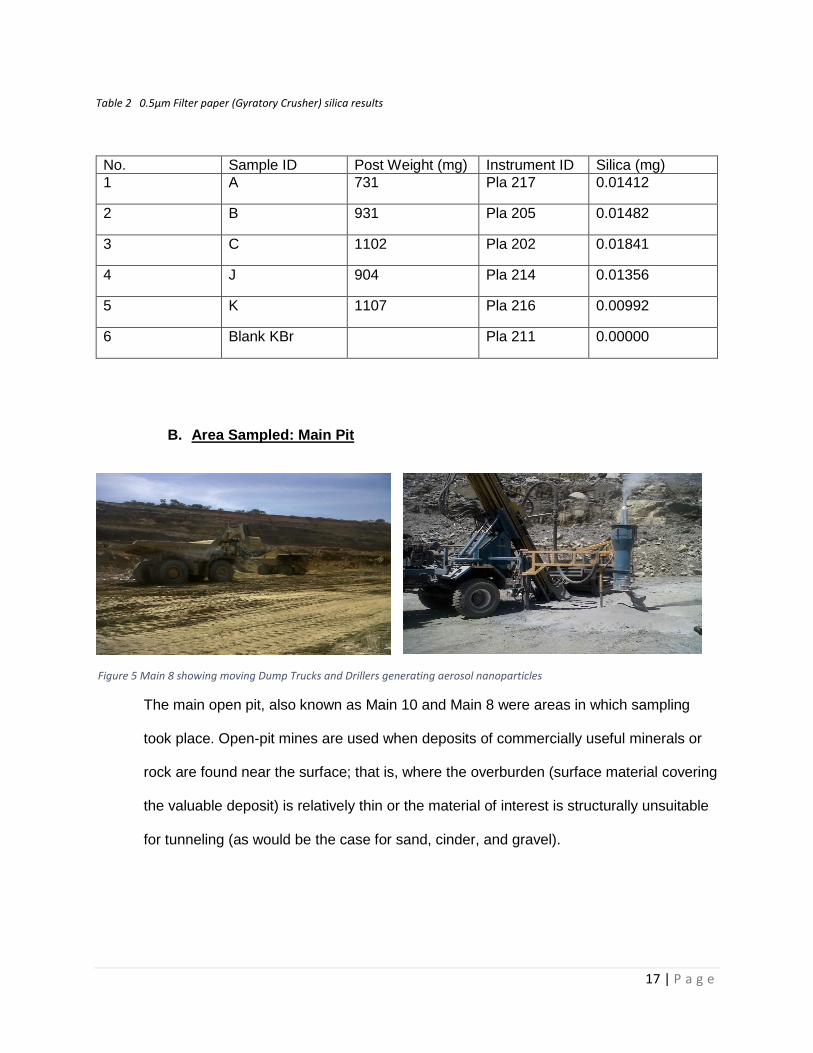
Table 2 0.5µm Filter paper (Gyratory Crusher) silica results
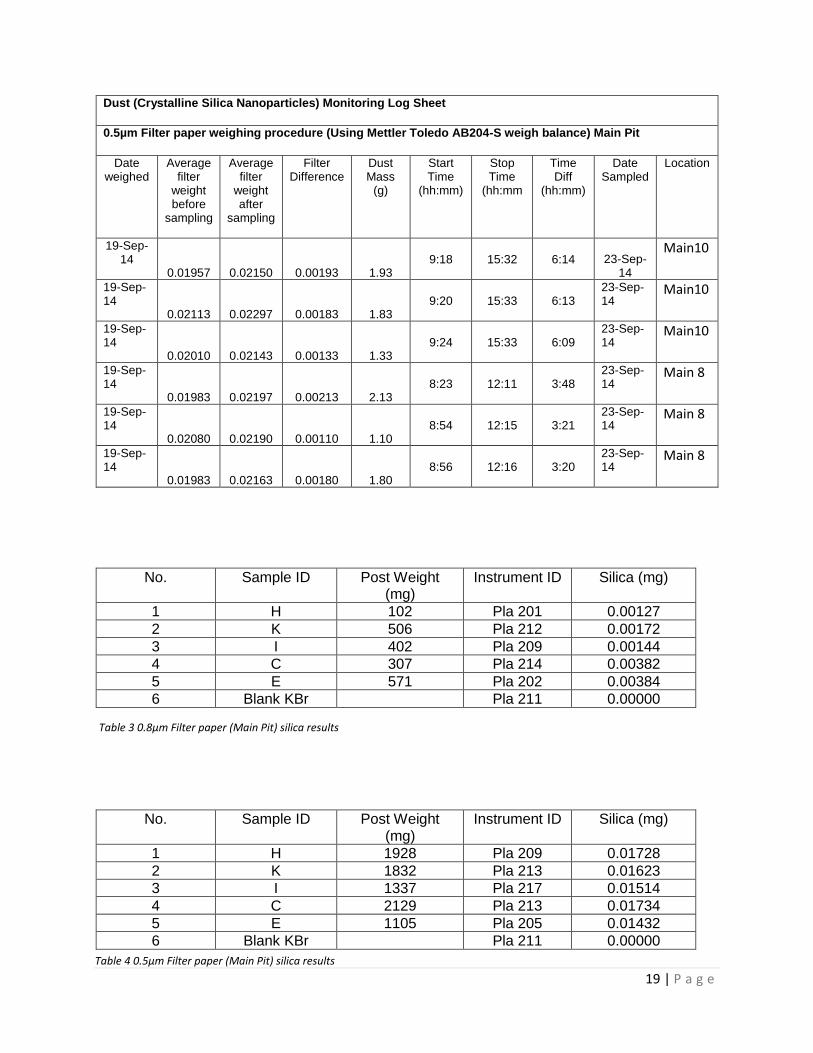
B. Area Sampled: Main Pit
The main open pit, also known as Main 10 and Main 8 were areas in which sampling
took place. Open-pit mines are used when deposits of commercially useful minerals or
rock are found near the surface; that is, where the overburden (surface material covering
the valuable deposit) is relatively thin or the material of interest is structurally unsuitable
for tunneling (as would be the case for sand, cinder, and gravel).
No. Sample ID Post Weight (mg) Instrument ID Silica (mg)
1 A 731 Pla 217 0.01412
2 B 931 Pla 205 0.01482
3 C 1102 Pla 202 0.01841
4 J 904 Pla 214 0.01356
5 K 1107 Pla 216 0.00992
6 Blank KBr Pla 211 0.00000
Figure 5 Main 8 showing moving Dump Trucks and Drillers generating aerosol nanoparticles
18 | P a g e
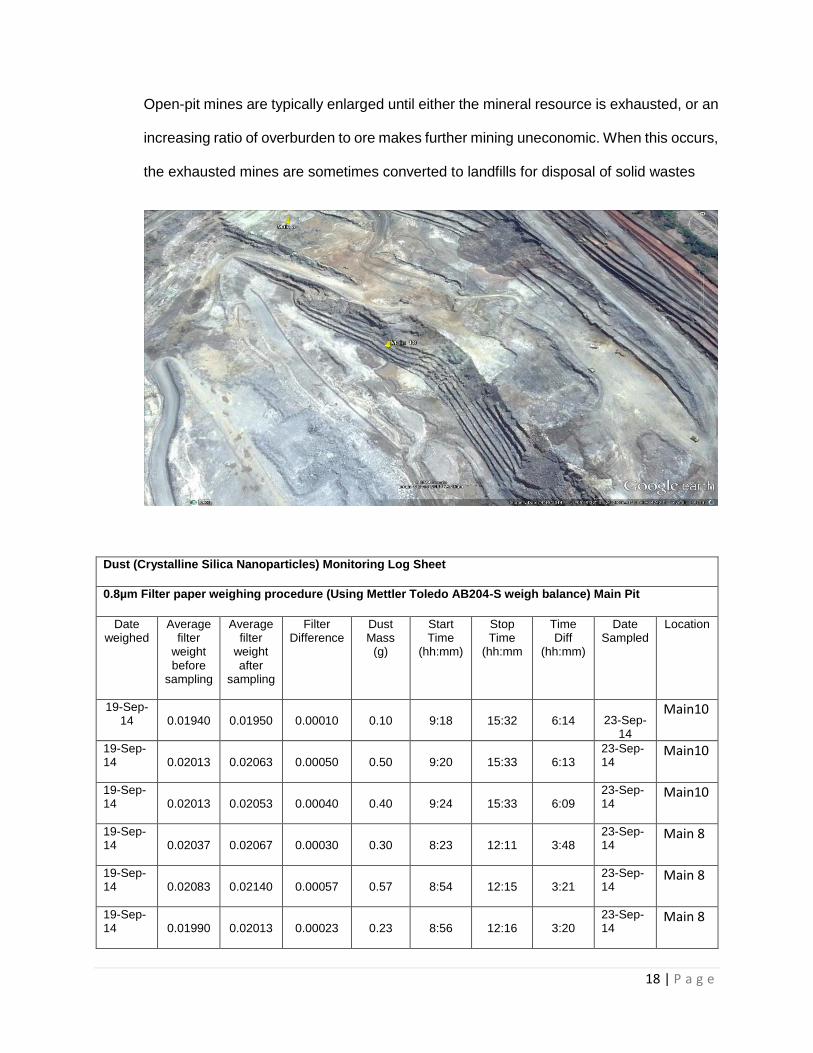
Open-pit mines are typically enlarged until either the mineral resource is exhausted, or an
increasing ratio of overburden to ore makes further mining uneconomic. When this occurs,
the exhausted mines are sometimes converted to landfills for disposal of solid wastes
Dust (Crystalline Silica Nanoparticles) Monitoring Log Sheet
0.8µm Filter paper weighing procedure (Using Mettler Toledo AB204-S weigh balance) Main Pit
Date weighed
Average filter
weight before
sampling
Average filter
weight after
sampling
Filter Difference
Dust Mass
(g)
Start Time
(hh:mm)
Stop Time
(hh:mm
Time Diff
(hh:mm)
Date Sampled
Location
19-Sep-14 0.01940 0.01950 0.00010 0.10 9:18 15:32 6:14 23-Sep-
14
Main10
19-Sep-14 0.02013 0.02063 0.00050 0.50 9:20 15:33 6:13
23-Sep-14
Main10
19-Sep-14 0.02013 0.02053 0.00040 0.40 9:24 15:33 6:09
23-Sep-14
Main10
19-Sep-14 0.02037 0.02067 0.00030 0.30 8:23 12:11 3:48
23-Sep-14
Main 8
19-Sep-14 0.02083 0.02140 0.00057 0.57 8:54 12:15 3:21
23-Sep-14
Main 8
19-Sep-14 0.01990 0.02013 0.00023 0.23 8:56 12:16 3:20
23-Sep-14
Main 8
19 | P a g e
Dust (Crystalline Silica Nanoparticles) Monitoring Log Sheet
0.5µm Filter paper weighing procedure (Using Mettler Toledo AB204-S weigh balance) Main Pit
Date weighed
Average filter
weight before
sampling
Average filter
weight after
sampling
Filter Difference
Dust Mass
(g)
Start Time
(hh:mm)
Stop Time
(hh:mm
Time Diff
(hh:mm)
Date Sampled
Location
19-Sep-14
0.01957 0.02150 0.00193 1.93 9:18 15:32 6:14 23-Sep-
14
Main10
19-Sep-14
0.02113 0.02297 0.00183 1.83 9:20 15:33 6:13
23-Sep-14
Main10
19-Sep-14
0.02010 0.02143 0.00133 1.33 9:24 15:33 6:09
23-Sep-14
Main10
19-Sep-14
0.01983 0.02197 0.00213 2.13 8:23 12:11 3:48
23-Sep-14
Main 8
19-Sep-14
0.02080 0.02190 0.00110 1.10 8:54 12:15 3:21
23-Sep-14
Main 8
19-Sep-14
0.01983 0.02163 0.00180 1.80 8:56 12:16 3:20
23-Sep-14
Main 8
No. Sample ID Post Weight (mg)
Instrument ID Silica (mg)
1 H 102 Pla 201 0.00127
2 K 506 Pla 212 0.00172
3 I 402 Pla 209 0.00144
4 C 307 Pla 214 0.00382
5 E 571 Pla 202 0.00384
6 Blank KBr Pla 211 0.00000
Table 3 0.8µm Filter paper (Main Pit) silica results
Table 4 0.5µm Filter paper (Main Pit) silica results
No. Sample ID Post Weight (mg)
Instrument ID Silica (mg)
1 H 1928 Pla 209 0.01728
2 K 1832 Pla 213 0.01623
3 I 1337 Pla 217 0.01514
4 C 2129 Pla 213 0.01734
5 E 1105 Pla 205 0.01432
6 Blank KBr Pla 211 0.00000
20 | P a g e
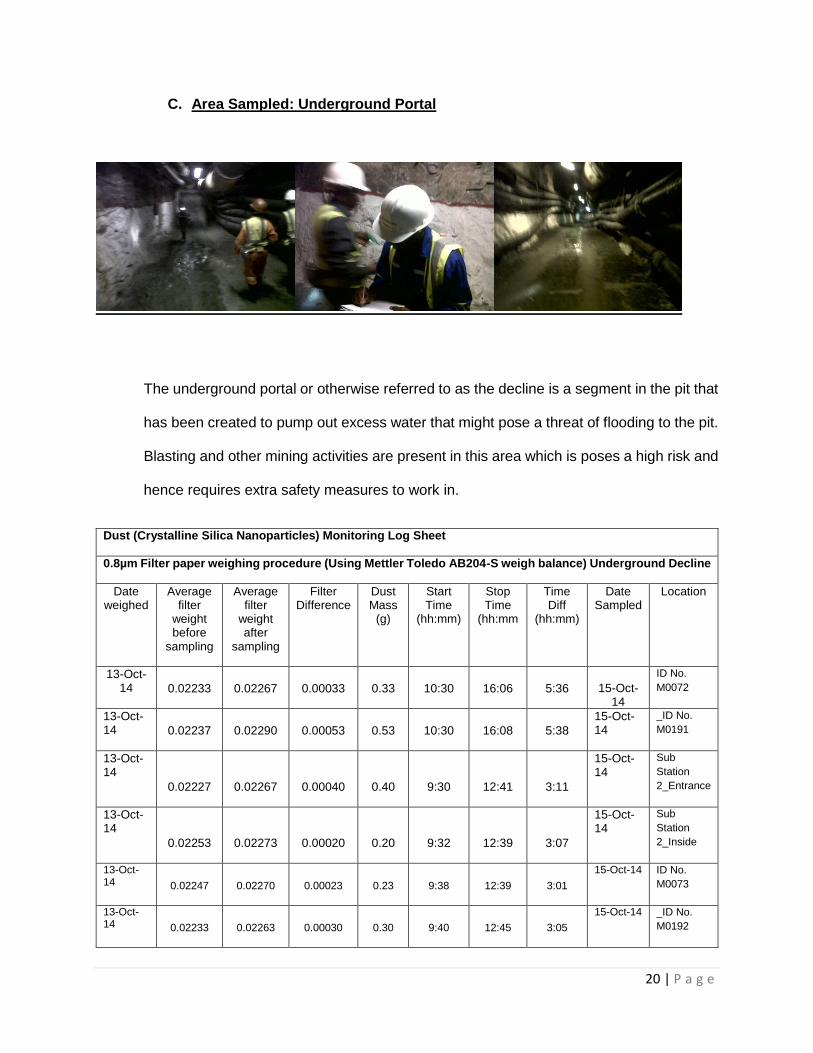
C. Area Sampled: Underground Portal
The underground portal or otherwise referred to as the decline is a segment in the pit that
has been created to pump out excess water that might pose a threat of flooding to the pit.
Blasting and other mining activities are present in this area which is poses a high risk and
hence requires extra safety measures to work in.
Dust (Crystalline Silica Nanoparticles) Monitoring Log Sheet
0.8µm Filter paper weighing procedure (Using Mettler Toledo AB204-S weigh balance) Underground Decline
Date weighed
Average filter
weight before
sampling
Average filter
weight after
sampling
Filter Difference
Dust Mass
(g)
Start Time
(hh:mm)
Stop Time
(hh:mm
Time Diff
(hh:mm)
Date Sampled
Location
13-Oct-14 0.02233 0.02267 0.00033 0.33 10:30 16:06 5:36 15-Oct-
14
ID No.
M0072
13-Oct-14 0.02237 0.02290 0.00053 0.53 10:30 16:08 5:38
15-Oct-14
_ID No.
M0191
13-Oct-14
0.02227 0.02267 0.00040 0.40 9:30 12:41 3:11
15-Oct-14
Sub
Station
2_Entrance
13-Oct-14
0.02253 0.02273 0.00020 0.20 9:32 12:39 3:07
15-Oct-14
Sub
Station
2_Inside
13-Oct-14 0.02247 0.02270 0.00023 0.23 9:38 12:39 3:01
15-Oct-14 ID No.
M0073
13-Oct-14 0.02233 0.02263 0.00030 0.30 9:40 12:45 3:05
15-Oct-14 _ID No.
M0192

21 | P a g e
Dust (Crystalline Silica Nanoparticles) Monitoring Log Sheet
0.8µm Filter paper weighing procedure (Using Mettler Toledo AB204-S weigh balance) Underground Decline
Date weighed
Average filter
weight before
sampling
Average filter
weight after
sampling
Filter Difference
Dust Mass
(g)
Start Time
(hh:mm)
Stop Time
(hh:mm
Time Diff
(hh:mm)
Date Sampled
Location
13-Oct-14 0.02203 0.02400 0.00197 1.97 10:30 16:06 5:36 15-Oct-
14
ID No.
M0072
13-Oct-14 0.02227 0.02400 0.00173 1.73 10:30 16:08 5:38
15-Oct-14
_ID No.
M0191
13-Oct-14
0.02220 0.02397 0.00177 1.77 9:30 12:41 3:11
15-Oct-14
Sub
Station
2_Entrance
13-Oct-14
0.02227 0.02407 0.00180 1.80 9:32 12:39 3:07
15-Oct-14
Sub
Station
2_Inside
13-Oct-14 0.02183 0.02387 0.00203 2.03 9:38 12:39 3:01
15-Oct-14 ID No.
M0073
13-Oct-14 0.02197 0.02393 0.00197 1.97 9:40 12:45 3:05
15-Oct-14 _ID No.
M0192
3.1. Laboratory analysis
After sample collection was achieved and recorded from all the selected areas of the
mine, the filter membranes were then removed from the pumps and weighed again to
record the mass difference.
From the balance room, the filter papers were then taken to Mopani Copper Mines to
be analysed under the Fourier Transform Infrared Spectroscopy which was able to
single out and identify the presence of Crystalline Silica by mass.
The following is the laboratory method used to obtain the silica from dust samples and
it was what was used to obtain silica from the nanoparticles that were retained on the
0.8µm and 0.5µm filter membranes.
22 | P a g e
CHAPTER FOUR
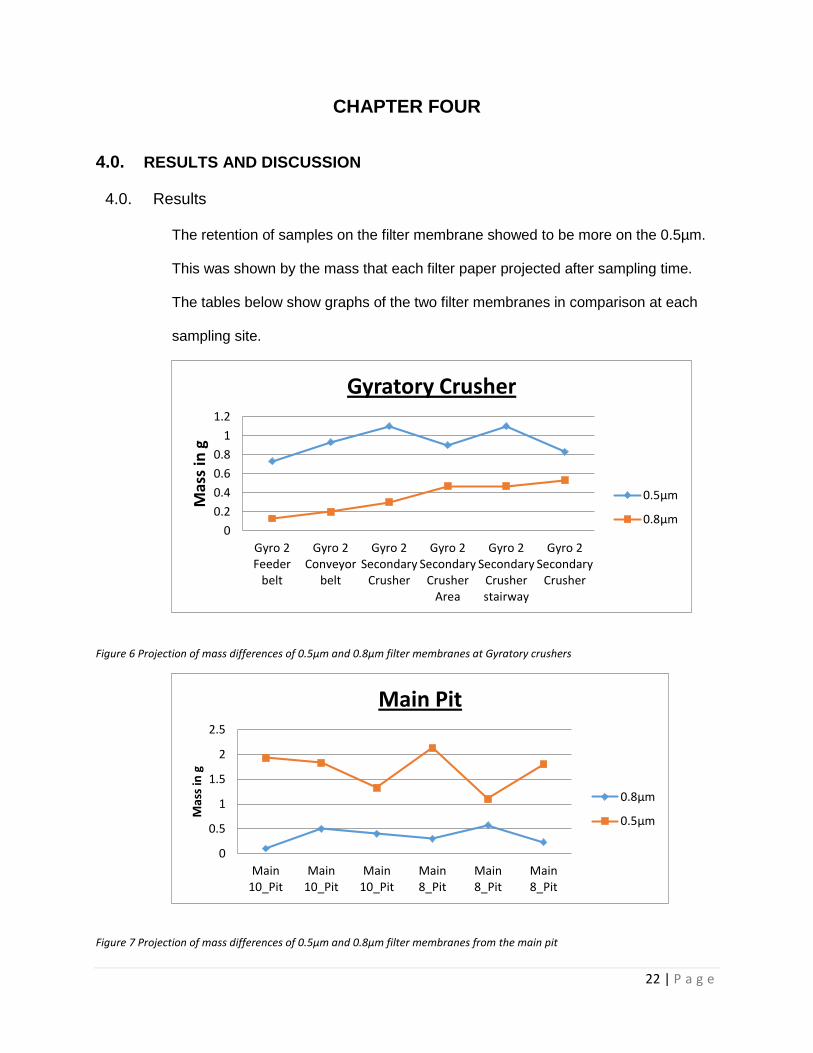
4.0. RESULTS AND DISCUSSION
4.0. Results
The retention of samples on the filter membrane showed to be more on the 0.5µm.
This was shown by the mass that each filter paper projected after sampling time.
The tables below show graphs of the two filter membranes in comparison at each
sampling site.
Figure 6 Projection of mass differences of 0.5µm and 0.8µm filter membranes at Gyratory crushers
Figure 7 Projection of mass differences of 0.5µm and 0.8µm filter membranes from the main pit
0
0.2
0.4
0.6
0.8
1
1.2
Gyro 2Feeder
belt
Gyro 2Conveyor
belt
Gyro 2Secondary
Crusher
Gyro 2Secondary
CrusherArea
Gyro 2Secondary
Crusherstairway
Gyro 2Secondary
Crusher
Mas
s in
g
Gyratory Crusher
0.5µm
0.8µm
0
0.5
1
1.5
2
2.5
Main10_Pit
Main10_Pit
Main10_Pit
Main8_Pit
Main8_Pit
Main8_Pit
Mas
s in
g
Main Pit
0.8µm
0.5µm
23 | P a g e
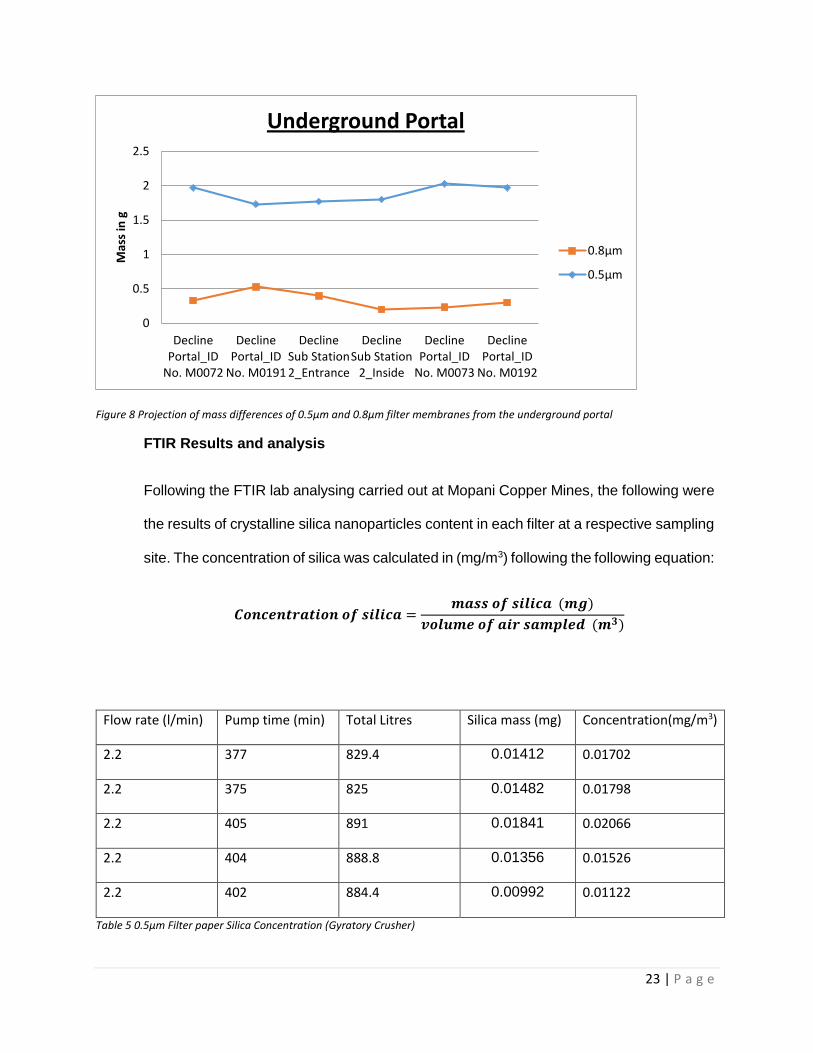
Figure 8 Projection of mass differences of 0.5µm and 0.8µm filter membranes from the underground portal
FTIR Results and analysis
Following the FTIR lab analysing carried out at Mopani Copper Mines, the following were
the results of crystalline silica nanoparticles content in each filter at a respective sampling
site. The concentration of silica was calculated in (mg/m3) following the following equation:
𝑪𝒐𝒏𝒄𝒆𝒏𝒕𝒓𝒂𝒕𝒊𝒐𝒏 𝒐𝒇 𝒔𝒊𝒍𝒊𝒄𝒂 =𝒎𝒂𝒔𝒔 𝒐𝒇 𝒔𝒊𝒍𝒊𝒄𝒂 (𝒎𝒈)
𝒗𝒐𝒍𝒖𝒎𝒆 𝒐𝒇 𝒂𝒊𝒓 𝒔𝒂𝒎𝒑𝒍𝒆𝒅 (𝒎𝟑)
Flow rate (l/min) Pump time (min) Total Litres Silica mass (mg) Concentration(mg/m3)
2.2 377 829.4 0.01412 0.01702
2.2 375 825 0.01482 0.01798
2.2 405 891 0.01841 0.02066
2.2 404 888.8 0.01356 0.01526
2.2 402 884.4 0.00992 0.01122
Table 5 0.5µm Filter paper Silica Concentration (Gyratory Crusher)
0
0.5
1
1.5
2
2.5
DeclinePortal_ID
No. M0072
DeclinePortal_ID
No. M0191
DeclineSub Station2_Entrance
DeclineSub Station
2_Inside
DeclinePortal_ID
No. M0073
DeclinePortal_ID
No. M0192
Mas
s in
gUnderground Portal
0.8µm
0.5µm
24 | P a g e
Flow rate (l/min) Pump time (min) Total Litres Silica mass (mg) Concentration(mg/m3)
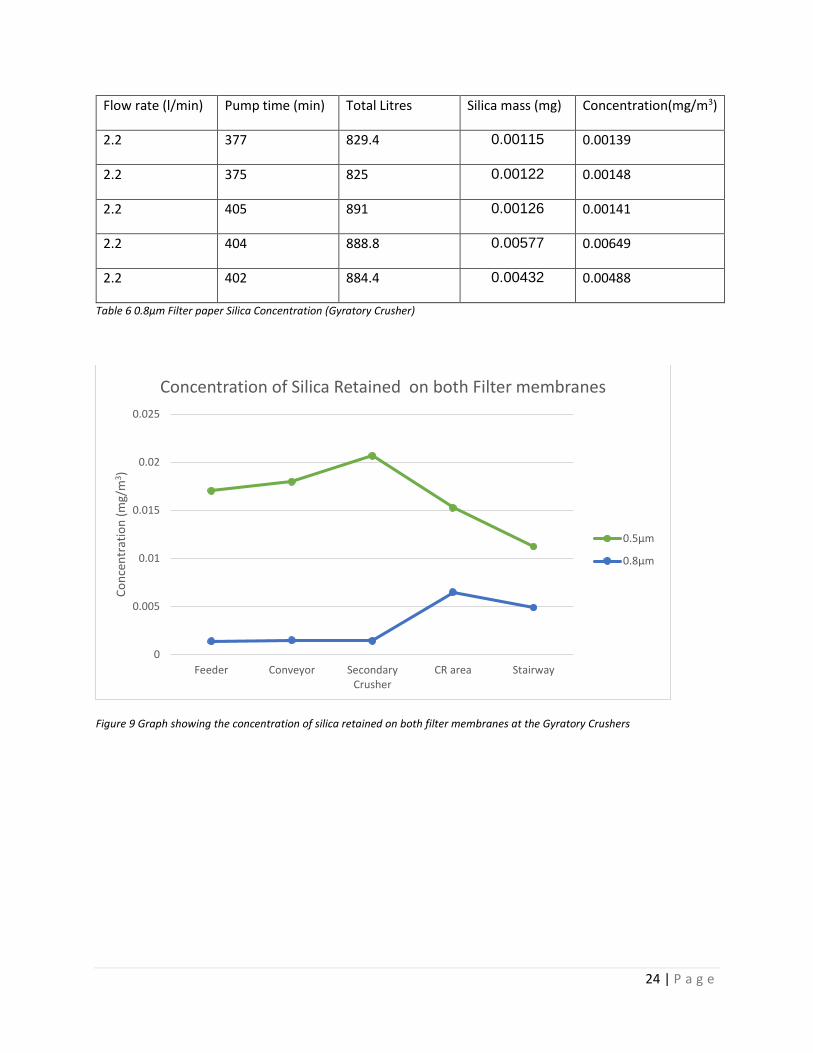
2.2 377 829.4 0.00115 0.00139
2.2 375 825 0.00122 0.00148
2.2 405 891 0.00126 0.00141
2.2 404 888.8 0.00577 0.00649
2.2 402 884.4 0.00432 0.00488
Table 6 0.8µm Filter paper Silica Concentration (Gyratory Crusher)
Figure 9 Graph showing the concentration of silica retained on both filter membranes at the Gyratory Crushers
0
0.005
0.01
0.015
0.02
0.025
Feeder Conveyor SecondaryCrusher
CR area Stairway
Co
nce
ntr
atio
n (
mg/
m3)
Concentration of Silica Retained on both Filter membranes
0.5µm
0.8µm
25 | P a g e
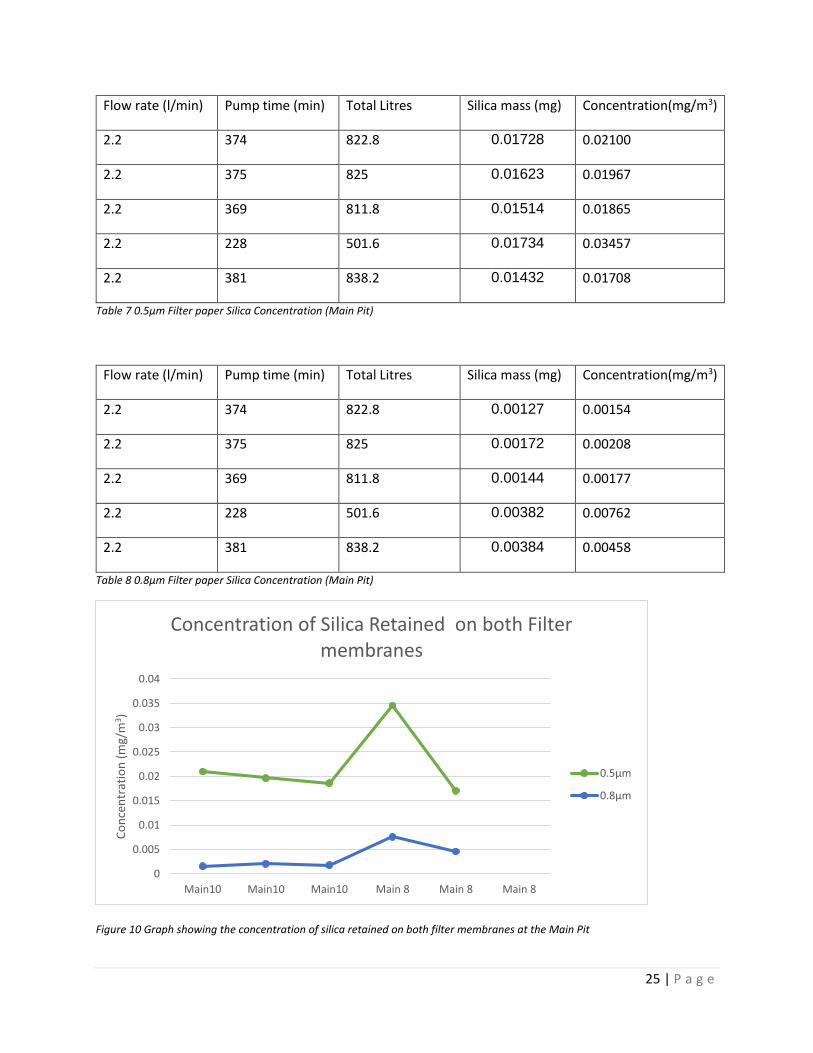
Flow rate (l/min) Pump time (min) Total Litres Silica mass (mg) Concentration(mg/m3)
2.2 374 822.8 0.01728 0.02100
2.2 375 825 0.01623 0.01967
2.2 369 811.8 0.01514 0.01865
2.2 228 501.6 0.01734 0.03457
2.2 381 838.2 0.01432 0.01708
Table 7 0.5µm Filter paper Silica Concentration (Main Pit)
Flow rate (l/min) Pump time (min) Total Litres Silica mass (mg) Concentration(mg/m3)
2.2 374 822.8 0.00127 0.00154
2.2 375 825 0.00172 0.00208
2.2 369 811.8 0.00144 0.00177
2.2 228 501.6 0.00382 0.00762
2.2 381 838.2 0.00384 0.00458
Table 8 0.8µm Filter paper Silica Concentration (Main Pit)
Figure 10 Graph showing the concentration of silica retained on both filter membranes at the Main Pit
0
0.005
0.01
0.015
0.02
0.025
0.03
0.035
0.04
Main10 Main10 Main10 Main 8 Main 8 Main 8
Co
nce
ntr
atio
n (
mg/
m3 )
Concentration of Silica Retained on both Filter membranes
0.5µm
0.8µm
26 | P a g e
4.1. Discussion
Gyratory Crusher: 0.5µm vs. 0.8µm
The crushers is one of the busiest areas on the mining lease. The average mass of
the 0.5µm filter membrane showed a retention of more nanoparticles. This was
attributed to the mass (in grams) being higher than that of the 0.8µm filter membrane
average mass. The crushers receive the raw material that is just from being blasted
and crush it yet into smaller stones. It is for this reason that the crystalline silica
concentration showed to be higher in the 0.5µm filter at this area also after the FTIR
analysis was carried out.
Main Pit: 0.5µm vs. 0.8µm
The main pit, which is always dusty, is an area expected to have a lot of aerosol
nanoparticles because of the activities that are found in this area such as blasting,
rock punching, and constant dump truck movement raising the aerosol nanoparticles.
The spotters and operators of the drilling machines are required to wear a dust mask
at all times in this area together with other necessary Personal Protective Equipment
(PPE) and as the results show, the individuals that were samples in this area, all the
workers wearing the 0.5µm filter membrane had shown a higher mass concentration
retention on the filter membrane.
27 | P a g e
CHAPTER FIVE
5.0. CONCLUSION AND RECOMMENDATIONS
5.1. Conclusion
This study basically assessed the generation of aerosol nanoparticles which are as
the result of mining activities. The distribution of these aerosol nanoparticles was done
by the contrasting of the sample retention of two filter membranes. As expected the
0.5µm filter membrane retained more samples than the 0.8µm filter and this was
shown by the mass differences that was projected by the average two filter
membranes.
Mining activities such as drilling, blasting and crushing reduce the particle size of the
rock that contains many elements. One of the elements contained in the rock is
crystalline silica which was an element of interest in this study. The presence of
crystalline silica nanoparticles which was done by the use of the Fourier Transform
Infrared Spectroscopy (FTIR) showed that there was more crystalline silica
nanoparticles retained on the 0.5µm filter membrane. This showed a significant sign
of how a reduction in pulmonary diseases is achievable by the use of dust masks that
have a pore size of preferably less than 0.5µm.
28 | P a g e
5.2. Recommendations
Following the main objective of this study and the findings thereof, the following
recommendations have been made;
The current pore size filter membrane for most dust masks is 0.8µm, this
should be changed to dust masks used in specific areas in the mine that
generate a lot of aerosol nanoparticles to a 0.5µm pore sized filter membrane.
Improved dust suppression systems must be employed in places such as pits
and crushing areas.
29 | P a g e
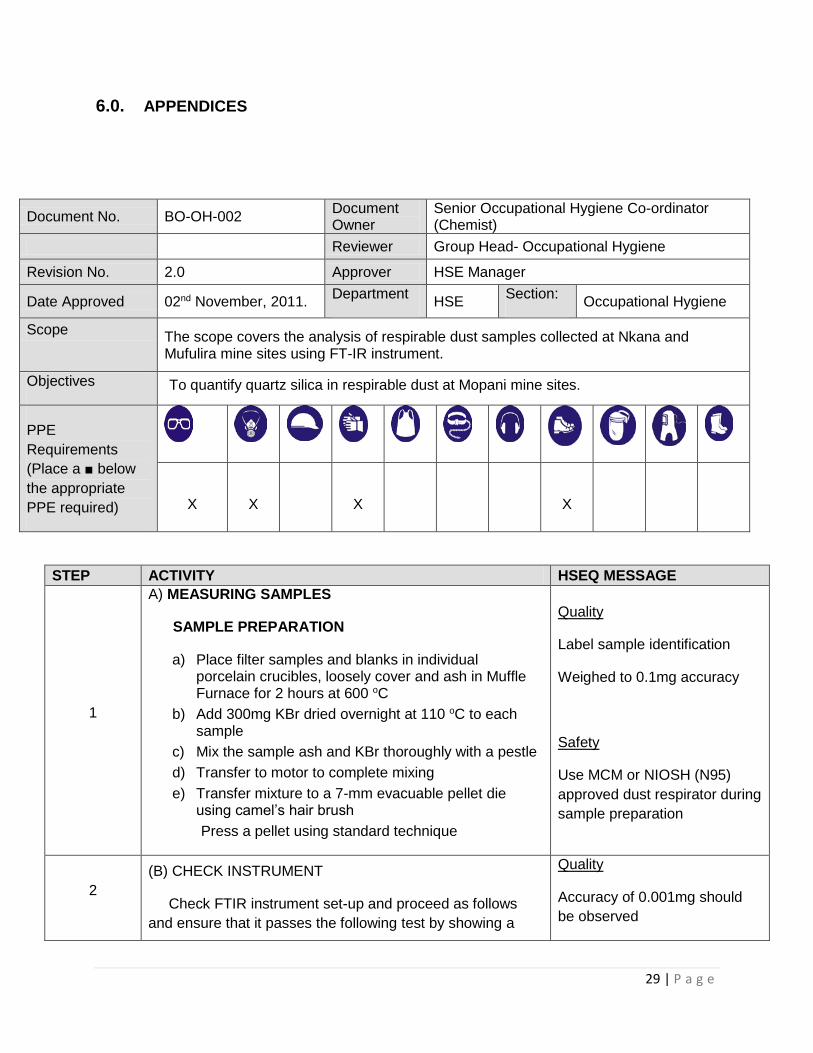
6.0. APPENDICES
Document No. BO-OH-002 Document Owner
Senior Occupational Hygiene Co-ordinator (Chemist)
Reviewer Group Head- Occupational Hygiene
Revision No. 2.0 Approver HSE Manager
Date Approved 02nd November, 2011. Department
HSE Section:
Occupational Hygiene
Scope The scope covers the analysis of respirable dust samples collected at Nkana and Mufulira mine sites using FT-IR instrument.
Objectives To quantify quartz silica in respirable dust at Mopani mine sites.
PPE
Requirements
(Place a ■ below
the appropriate
PPE required)
X X X X
STEP ACTIVITY HSEQ MESSAGE
1
A) MEASURING SAMPLES
SAMPLE PREPARATION
a) Place filter samples and blanks in individual porcelain crucibles, loosely cover and ash in Muffle Furnace for 2 hours at 600 oC
b) Add 300mg KBr dried overnight at 110 oC to each sample
c) Mix the sample ash and KBr thoroughly with a pestle
d) Transfer to motor to complete mixing
e) Transfer mixture to a 7-mm evacuable pellet die using camel’s hair brush
Press a pellet using standard technique
Quality
Label sample identification
Weighed to 0.1mg accuracy
Safety
Use MCM or NIOSH (N95)
approved dust respirator during
sample preparation
2
(B) CHECK INSTRUMENT
Check FTIR instrument set-up and proceed as follows
and ensure that it passes the following test by showing a
Quality
Accuracy of 0.001mg should
be observed

30 | P a g e
STEP ACTIVITY HSEQ MESSAGE
green circular icon located at the bottom far right end of
screen.
a) Laser
b) Source
c) Electronic
d) Automation
e) Detector
f) Interferometer
g) Transmission
Encase of red circular icon at the bottom far right end of
screen, select diagnosis and run appropriate test
3
(C) SAMPLE MEASUREMENT
a) Select MEASURE and click on measurement
b) Enter sample Name
c) Start background measurement
d) Click ON EVALUATION Tab and then Quantitative Analysis button on Opus wizard
e) Activate SHOW RESULTS IMMEDIATELY button
f) Load required Quant Method
g) Click on ANALYSE
h) Repeat above steps for the remaining samples
4
(D) CALCULATIONS
Concentration quartz = weight of quartz/ volume of air
sampled (mg/m3)
5
31 | P a g e
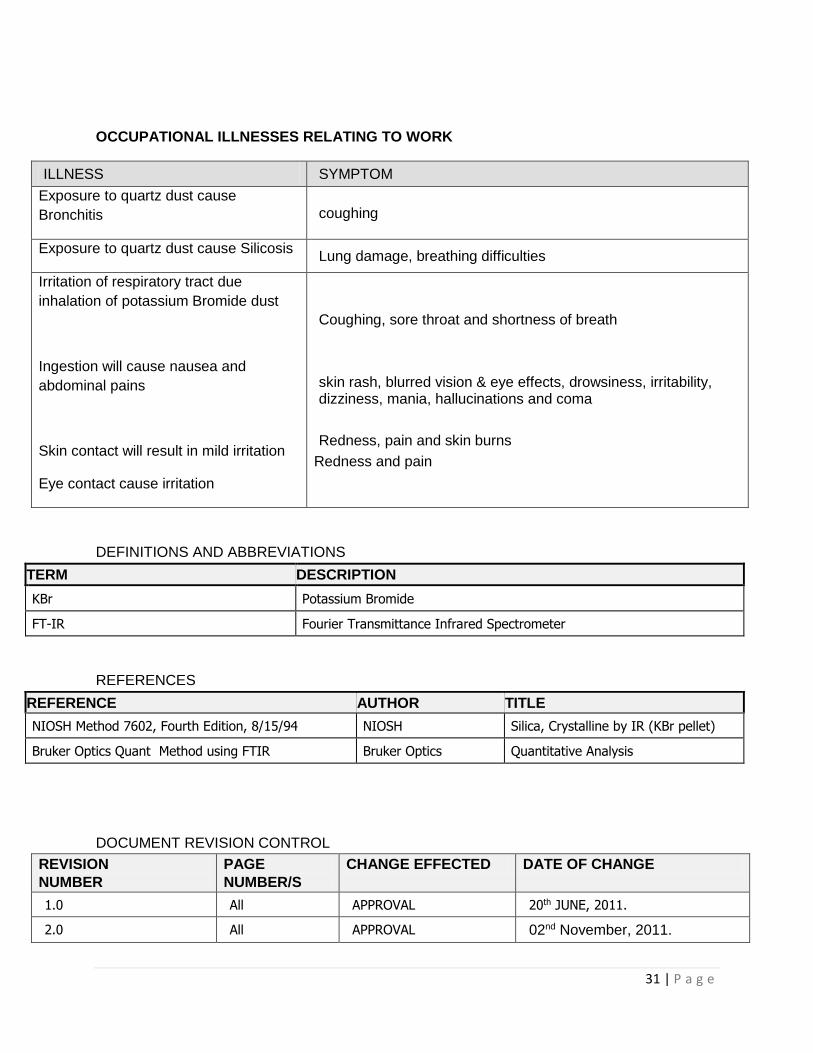
OCCUPATIONAL ILLNESSES RELATING TO WORK
ILLNESS SYMPTOM
Exposure to quartz dust cause
Bronchitis coughing
Exposure to quartz dust cause Silicosis Lung damage, breathing difficulties
Irritation of respiratory tract due
inhalation of potassium Bromide dust
Ingestion will cause nausea and
abdominal pains
Skin contact will result in mild irritation
Eye contact cause irritation
Coughing, sore throat and shortness of breath
skin rash, blurred vision & eye effects, drowsiness, irritability, dizziness, mania, hallucinations and coma
Redness, pain and skin burns
Redness and pain
DEFINITIONS AND ABBREVIATIONS
TERM DESCRIPTION
KBr Potassium Bromide
FT-IR Fourier Transmittance Infrared Spectrometer
REFERENCES
REFERENCE AUTHOR TITLE
NIOSH Method 7602, Fourth Edition, 8/15/94 NIOSH Silica, Crystalline by IR (KBr pellet)
Bruker Optics Quant Method using FTIR Bruker Optics Quantitative Analysis
DOCUMENT REVISION CONTROL
REVISION
NUMBER
PAGE
NUMBER/S
CHANGE EFFECTED DATE OF CHANGE
1.0 All APPROVAL 20th JUNE, 2011.
2.0 All APPROVAL 02nd November, 2011.

32 | P a g e
REVIEW AND APPROVAL SIGNATURES RECORD
REVIEWER ROLE TITLE SIGNATURE DATE
Originator (Document Owner) Senior Occupational
Hygiene Co-ordinator
Original Signed 02nd November, 2011.
Reviewer 1 Group Head – Occupational
Hygiene
Original Signed 02nd November, 2011.
APPROVED BY: Manager Group Manager - HSE Original Signed 02nd November, 2011.

33 | P a g e
7.0. REFERENCES
Ampian, S. G., Virta, R.L. (2005): Crystalline silica overview: Occurrence and analysis.
Washington, DC: U.S.Department of the Interior, Bureau of Mines, Information Circular
IC 9317.
Chen,W., Liu,Y., Wang, H., Hnizdo,E.,Sun,Y., Su,L., Zhang,X., Weng,S., Bochmann,
F., Hearl, F.J., Chen,J., and Wu, T (2012): Long-Term Exposure to Silica Dust and
Risk of Total and Cause-Specific Mortality in Chinese Workers: A Cohort Study ,PLoS
Medicine, Volume 9, Issue 4, e1001206
Chamberain, J.; Gibbs,J.E.; Gebbie, H.E. (1969). "The determination of refractive index
spectra by Fourier spectrometry". Infrared Physics 9 (4).
Cruz T, Gaspar R, Donato A and Lopes C. Interaction between polyalkylcyanoacrylate
nanoparticles and peritoneal macrophages: MTT metabolism, NBT reduction and NO
production. Pharm Res 1997, 14, 73-79.
K.D. Sattler, Handbook of Nanophysics, Principles and Methods (CRC, New York,
2010)
B. Bhushan, Handbook of Nanotechnology (Springer, Berlin, 2004) C. Huang, A.
Notten, N. Rasters, J. Technol. Transf. 36, 145–172 (2011)
F. Simonis S. Schilthuizen, Nanotechnology Innovation Opportunities for Tomorrow’s
Defence (TNO Science & Industry, 2006)
34 | P a g e
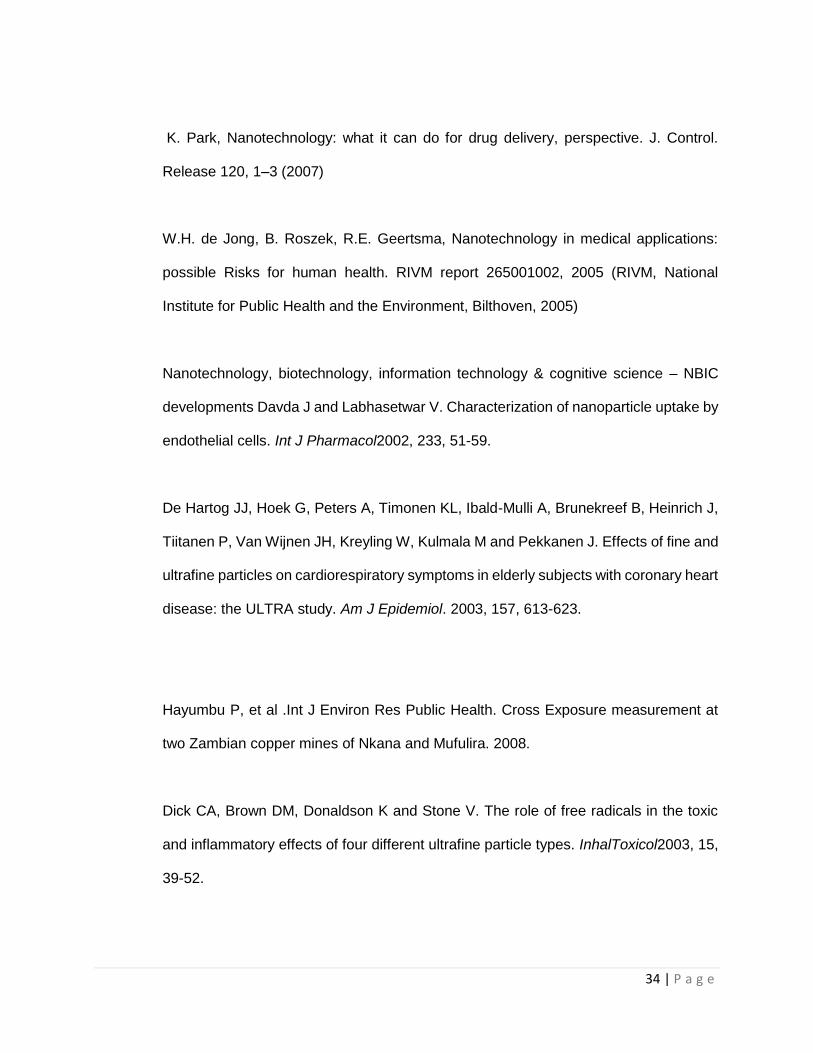
K. Park, Nanotechnology: what it can do for drug delivery, perspective. J. Control.
Release 120, 1–3 (2007)
W.H. de Jong, B. Roszek, R.E. Geertsma, Nanotechnology in medical applications:
possible Risks for human health. RIVM report 265001002, 2005 (RIVM, National
Institute for Public Health and the Environment, Bilthoven, 2005)
Nanotechnology, biotechnology, information technology & cognitive science – NBIC
developments Davda J and Labhasetwar V. Characterization of nanoparticle uptake by
endothelial cells. Int J Pharmacol2002, 233, 51-59.
De Hartog JJ, Hoek G, Peters A, Timonen KL, Ibald-Mulli A, Brunekreef B, Heinrich J,
Tiitanen P, Van Wijnen JH, Kreyling W, Kulmala M and Pekkanen J. Effects of fine and
ultrafine particles on cardiorespiratory symptoms in elderly subjects with coronary heart
disease: the ULTRA study. Am J Epidemiol. 2003, 157, 613-623.
Hayumbu P, et al .Int J Environ Res Public Health. Cross Exposure measurement at
two Zambian copper mines of Nkana and Mufulira. 2008.
Dick CA, Brown DM, Donaldson K and Stone V. The role of free radicals in the toxic
and inflammatory effects of four different ultrafine particle types. InhalToxicol2003, 15,
39-52.
35 | P a g e
Donaldson K and Stone V. Current hypotheses on the mechanism of toxicity of ultrafine
particles. Ann Ist Super Sanità2003, 39, 405-410.
Donaldson K, Stone V. Gilmour PS, Brown DM and MacNee W. Ultrafine particles:
mechanisms of lung injury. Phil Trans R SocLondA2000, 358, 2741-2749.
Donaldson K, Stone V, Clouter A, Renwick L and MacNee W. Ultrafine particles. Occup
Environ Med 2001a, 58, 211-216.
Jonathan Atteberry, How Scanning Microscope Works. 2000
OSHA, the Occupational Safety and Health Administration journal, 2014
IMA Europe, Crystalline silica and health. 2014.
Maria Messing. Engineered Nanoparticles generation, characterization, and
application. 2011 V. Ramanathan, P. J. Crutzen, J. T. Kiehl and D. Rosenfeldt:
Aerosols, Climate, and the Hydrological Cycle. Science, 2001, 294, 2119–2124
P. H. M. Hoet, I. Brüske-Hohlfeld and O. V. Salata: Nanoparticles known and unknown
health risks. J. Nanobiotechn., 2004, 2, 12
M. O. Andreae, C. D. Jones and P. M. Cox: Strong present-day aerosol cooling implies
a hot future. Nature, 2005, 435, 1187–1190
36 | P a g e
C. A. Pope, R. T. Burnett, M. J. Thun, E. E. Calle, D. Krewski, K. Itoand G. D. Thurston:
Lung cancer, cardiopulmonary mortality and longterm exposure to fine particulate air
pollution. J. Am. Med. Assoc., 2002, 287, 1132–1141
James, Burke (1978). "Chapter 6.Fuel to the Flame". Connections, (pbk: ISBN 0-316-
11685-8)
Taylor D A 2002 Dust in the wind Environ. Health Perspect. 110 A80-A87
Houghton J 2005 Global warming Rep. Prog. Phys. 68 1343–1403
Buseck P R, Pósfai M 1999 Airborne minerals and related aerosol particles: Effects on
climate and the environment Proc. Nat. Acad. Sci. 96 3372-3379 and references therein
W.H. de Jong, B. Roszek, and R.E. Geertsma: Nanotechnology in medical applications:
Possible risks for human health, RIVM report 265001002/2005
XiandengHou and Bradley T. Jones. Inductively Coupled Plasma/Optical Emission
Spectrometry. John Wiley & Sons Ltd, Chichester, 2000, pp. 9468–9485
NanoReg News. 2008. NanoReg Report: Policy News for the Nanotechnology Value
Chain. February 15, 2008. Volume 5, Issue 3. Accessed March, 2008.
http://www.nanoregnews.com/. National Nanotechnology Initiative (NNI). 2007.
Website. Accessed December 2007. http://www.nano.gov/.
37 | P a g e
Nel, A., T. Xia, L. M¨adler, N. Li. 2006. Toxic potential of materials at the nanolevel.
Science. 311: 622-627.
Oberd ¨orster, G., V. Stone, K... Donaldson. 2007. Toxicology of nanoparticles: A
historical perspective. Nanotoxicology. 1(1): 2-25.
Québec Comisión de l’éthique de la science Et de la technologie (QC), 2006. Position
Statement: Ethics and Nanotechnology: A Basis for Action. Québec G1V 4Z2.
http://www.ethique.gouv.qc.ca/IMG/pdf/Avis-anglaisfinal-2.pdf.
Responsible NanoCode (RNC). 2006. Workshop report: How can business respond to
the Technical, social and commercial uncertainties of nanotechnology?
http://www.responsiblenanocode.org/documents/Workshop-Report_07112006.pdf
L.H.P. Jones, K.A. Handreck, Silica in soils, plants and animals. Adv. Agron. 19, 107–
149 (1967)