equity research biofuel sector - frankhaugwitz.info · asia pacific/china multi utilities biofuel...
TRANSCRIPT

Equity Research
30 August 2006Asia Pacific/China
Multi Utilities
Biofuel Sector Global comparisons of a fast-growing sector
• The growth of the global biodiesel market has been driven by government incentives and a recent surge in fossil fuel prices. Governments around the world have promoted the use of biodiesel in order to reduce air pollution and the reliance on imported fossil fuels, as well as to promote their agricultural industry.
• The EU is expected to drive global demand for biodiesel. Feedstock availability implies that Asia will become the major biodiesel producer in the future. The geographical demand-supply imbalance indicates that Europe will import biodiesel from Asia in future.
• The availability of low-cost feedstock allows Chinese manufacturers to produce biodiesel at an impressively competitive price compared with both global biodiesel prices and China’s fossil diesel prices. Chinese biodiesel manufacturers currently enjoy high profit margins.
Figure 1: EBITDA margin comparison (2005)
7.75%
42.90%
30.00%
3.08%
12.22%
44.30%
23.35%
15.56% 14.44%
40.82%
29.32%
3.23%8.25%
-0.24% -5 0 5
10 15 20 25 30 35 40 45 50
BioP
etrol
Indus
tries A
G
Miss
ion B
iofue
ls
D1 O
ils P
lc
Austr
alian
Biod
iesel
Grou
p
Biofu
els C
orp.
Plc
Vera
sun E
nerg
y Cor
p.
China
Biod
iesel
Inter
natio
nal
Holdi
ngs
IOI C
orpe
ratio
n
Kuala
Lump
ur K
epon
g
Golde
n Hop
e Plan
tation
PT A
stra A
gro L
estar
i Tbk
PT Lo
ndon
Sum
atra I
ndon
esia
Wilm
ar In
t'l Ltd
.
Sina
r Mas
Agr
o Res
&Tec
h
(%)
Note: The EBITDA margins of Mission Biofuels, D1 Oils plc, Australian Biodiesel Group and Biofuels Corp. plc are based on IBES numbers for 2008, 2007, 2006 and 2008, respectively; others are all 2005 data Source: Bloomberg, company data, Credit Suisse estimates
ANALYST CERTIFICATIONS ARE IN THE DISCLOSURE APPENDIX. FOR OTHER IMPORTANT DISCLOSURES, visit www.credit-suisse.com/ researchdisclosures or call +1 (877) 291-2683. U.S. Disclosure: Credit Suisse does and seeks to do business with companies covered in its research reports. As a result, investors should be aware that the Firm may have a conflict of interest that could affect the objectivity of this report. Investors should consider this report as only a single factor in making their investment decision. Customers of Credit Suisse in the United States can receive independent, third party research on the company or companies covered in this report, at no cost to them, where such research is available. Customers can access this independent research at www.credit-suisse.com/ir or call 1 877 291 2683 or email [email protected] to request a copy of this research.
Research team
Angello Chan Research Analyst 852 2101 6314 [email protected]
Edwin Chen Research Analyst 852 2101 6550 [email protected]
Tan Ting Min Research Analyst 603 2723 2080 [email protected]
Haider Ali Research Analyst 62 21 2553 7974 [email protected]

Biofuel Sector 30 August 2006
2
Focus charts
Figure 2: Global biodiesel market Figure 3: Cost of biodiesel varies on the feedstock used
Global biodiesel market
2.6 3.44.4
5.7
7.3
9.5
2005 2006 2007 2008 2009 2010
(mn tons)
CAGR of 30%
0 1 2 3 4 5 6 7 8 9
10
2.6 3.44.4
5.7
7.3
9.5
2005 2006 2007 2008 2009 2010
(mn tons)
CAGR of 30%
0 1 2 3 4 5 6 7 8 9
10 (US$/barrel)
$38.00
$131.00
$66.57
Waste vegetableand cooking oil
biodiesel
Rapeseedbiodiesel
Palm oil biodiesel
70%
43%
0
20
40
60
80
100
120
140
$38.00
$131.00
$66.57
Waste vegetableand cooking oil
biodiesel
Rapeseedbiodiesel
Palm oil biodiesel
70%
43%
0
20
40
60
80
100
120
140
Source: Bio-era, Credit Suisse research Source: Company data, Bio-era, POC, Credit Suisse estimates
Figure 4: China’s 5% biodiesel blend scenario Figure 5: China’s feedstock availability Axis of fossil diesel consumption (in million tons)
Axis of biodiesel market assuming 5% blend (in million tons)
Fossil diesel consumption Biodiesel assumed at 5% blend
050
100150200250300350400
2000 2004 2008 2012 2016 2020 2024 20280
5
10
15
20
25
30
050
100150200250300350400
2000 2004 2008 2012 2016 2020 2024 20280
5
10
15
20
25
30
('000 tonnes)
Total edible oil consumption Waste oil Collectable waste oil Vegetable oil offal
0
5,000
10,000
15,000
20,000
25,000
2000 2001 2002 2003 2004 2005 2006 2007 2008 2009 2010
CAGR of 6.16%
0
5,000
10,000
15,000
20,000
25,000
2000 2001 2002 2003 2004 2005 2006 2007 2008 2009 2010
CAGR of 6.16%
Source: Company data, Credit Suisse estimates Source: National Bureau of Statistics of China, Euromonitor, Credit Suisse estimates
Figure 6: Crude oil and diesel prices
0
50
100
150
200
250
Jan 02 Jan 03 Jan 04 Jan 05 Jan 06 Jan 07 Jan 08 Jan 09 Jan 10
(US$/bbl)
Crude oil price Germany retail diesel price US retail diesel price
China diesel retail guidance price China diesel w holesale price
Source: Bloomberg, Credit Suisse estimates

Biofuel Sector 30 August 2006
3
Global comparisons of a fast-growing sector
Alternative to fossil energy-biodiesel Biodiesel is a viable alternative fuel to conventional petroleum-based diesel; it can meet the requirements of Europe’s fuel standards II and III. Relative to fossil fuel, biodiesel exhibits much lower emissions and can be operated in any diesel engine with little or no modification to the engine or the fuel system. Growth of the biodiesel market has been supported by government incentives and surging fossil fuel prices. Two primary standards governs the quality and specifications of biodiesel globally: ASTM D 6751 for the US market and EN 14214 for the EU market.
Surging global market Government incentives derived from environmental concerns and surging fossil fuel prices were the major catalysts behind the 45.66% CAGR in production of the global biodiesel market from 1991 to 2005. Bio-era (a provider of independent research and advisory services on the economic and societal impact of human-induced change to biological systems) estimates that the global biodiesel market will maintain a 30% CAGR in production between 2005 and 2010. Eurostat and European Union Directorate General Energy estimate that, according to the EU directive, the EU’s biodiesel consumption will increase dramatically from 3.8 mn tons in 2006 to 11.5 mn tons in 2011, reflecting a CAGR of 24.75%. Bio-era projects that the North American biodiesel market will reach 1 mn tons by 2010. Meanwhile, US Energy Information Administration (EIA) estimates the lower and upper bounds for the US biodiesel market at 6.5 mn gallons and 470 mn gallons by 2010, respectively.
As for feedstock, our Malaysian plantations analyst, Tan Tingmin, recently hiked up her crude palm oil (CPO) price assumption to RM1,800/tonne for FY08E from RM1,650, with the view that there will be short-term shortages in CPO supply, once new biodiesel capacity comes on stream. We prefer KL Kepong and Golden Hope in Malaysia, and Astra Agro in Indonesia.
China’s biodiesel market growth is even faster China’s biodiesel production capacity will reach 600,000 t.p.a. (tons per annum) in 2006, and is expected to reach 1.8 mn t.p.a. by 2010. And with its access to low-cost feedstock, Chinese biodiesel producers are enjoying a 30-40% profit margin, even without considering government subsidies yet.
Cost of biodiesel Governments are promoting renewable energyThe cost of feedstock could reach more than 80% of total production costs for biodiesel. Given that, biodiesel costs vary significantly, depending on the different costs of raw materials. Currently, vegetable oil offal and waste oil use as feedstock achieves the lowest production costs.
Primary government policies and incentives Governments around the world are currently striving to promote the use of renewable and alternative energy, motivated by the recent surge in global fossil fuel prices, worsening air pollution and increasing oil consumption.
Biodiesel use can meet therequirements of Europe’s
fuel standards II and III with no or little modification
to the engine or the fuel system
Bio-era estimates that the global biodiesel market will
maintain a 30% CAGR in production over 2005-10
Assuming a RM1,800/tonne FY08E
CPO price, we prefer KL Kepong, Golden Hope
and Astra Agro
With access to low-cost feedstock, Chinese
biodiesel producers enjoy a 30-40% profit margin
Feedstock accounts for more than 80% of total
production costs for biodiesel

Biofuel Sector 30 A
ugust 2006
4
Figure 7: Valuation matrix 2006E P/E to 2006E EV/EBITDA EPS Market cap (mn) P/E (x) EV/EBITDA (x) 2006-08E to 2006-08E growth (%) Company name Ticker Price Currency (local) (US$) 2005A 2006E 2007E 2008E 2005A 2006E 2007E 2008E EPS CAGR (%) EBITDA CAGR (%) 2007 2008Tier one Biofuel producers BioPetrol Industries AG B2I GR 8.40 € 311 395 84.0 88.4 20.5 8.2 40.9 36.8 9.7 4.6 0.39 0.20 332 151Mission Biofuels MBT AU 1.36 A$ 124 93 n.m. -151.1 -503.7 4.3 n.m. -70.4 -73.4 2.3 n.m. n.m. n.m. n.m.D1 Oils plc DOO LN 2.21 £ 70 128 -789.3 -7.1 -34.5 n.m. -5.7 0.0 -2.3 n.m. n.m. n.m. n.m. n.m.Australian Biodiesel Group ABJ AU 0.70 A$ 81 61 -6.4 10.9 2.4 1.9 -98.0 5.8 1.4 1.1 0.08 0.04 352 26Australian Renewable Fuels ARW AU 1.07 A$ 133 100 -107.0 56.3 3.9 2.6 -60.7 47.5 2.8 1.9 0.15 0.12 1337 50Biofuels Corp. plc BFC LN 0.975 £ 48 89 -2.8 -0.6 -12.2 8.1 -19.5 -0.9 -26.1 13.1 n.m. n.m. n.m. n.m.Verasun Energy Corp. VSE US 21.61 US$ 1,631 1,631 -122.9 16.2 19.7 12.5 53.2 9.7 10.4 6.8 1.17 0.50 -18 58China Biodiesel Int’l Holdings CBI LN 1.04 £ 47 87 n.m. n.m. n.m. n.m. n.m. n.m. n.m. n.m. n.m. n.m. n.m. n.m.Feedstock producers IOI Corperation IOI MK 16.60 RM 19,880 5,408 19.7 23.2 19.2 16.8 14.9 15.9 13.0 11.1 1.33 0.83 20 15Kuala Lumpur Kepong KLK MK 11.30 RM 8,194 2,229 19.6 17.5 13.7 11.2 13.2 11.8 8.6 6.8 0.70 0.47 28 22Golden Hope Plantation GHP MK 4.80 RM 6,861 1,866 11.4 24.5 15.0 11.5 11.4 17.0 10.3 7.7 0.53 0.37 63 31PT Astra Agro Lestari Tbk AALI IJ 8,450.00 Rp 13,227,858 1,458 16.8 13.4 11.2 10.4 9.6 7.7 6.3 5.7 0.99 0.63 20 8PT London Sumatra Indonesia LSIP IJ 4700 Rp 5,147,576 568 14.5 16.3 13.9 11.4 10.7 8.2 7.2 6.1 0.83 0.53 18 22Wilmar Int'l Ltd. WIL SP 1.23 S$ 3,046 1,937 30.8 n.m. n.m. n.m. 17.9 n.m. n.m. n.m. n.m. n.m. n.m. n.m.Sinar Mas Agro Res. & Tech. SMAR IJ 4000 Rp 11,488,772 1,267 28.8 n.m. n.m. n.m. 31.4 n.m. n.m. n.m. n.m. n.m. n.m. n.m. Tier two Degussa AG DGX GR 46.34 € 9,529 12,117 -19.4 20.9 20.1 17.8 1.5 1.3 1.3 1.3 2.45 1.07 4 13Energy Conversion Devices ENER US 31.44 US$ 1,228 1,228 17.2 -43.4 -408.3 24.0 -1.7 4.1 -5.0 -0.8 n.m. n.m. n.m. n.m.Novozymes A/S NZYMB DC 409.5 DKK 22,216 3,787 31.2 28.8 25.3 22.8 0.6 0.5 0.5 0.5 2.33 0.07 14 11MGP Ingredients MG4 GR 14.55 € 235 299 58.2 22.5 12.0 12.7 10.9 n.m. n.m. n.m. 0.68 n.m. 87 -5Covanta Holding CVA US 20.67 US$ 3,038 3,038 42.2 40.7 33.1 30.0 14.6 8.3 7.9 7.6 2.46 1.70 23 11Xiwang Sugar Holdings 2088 HK 4.97 HK$ 3,407 438 20.6 14.0 12.1 14.0 13.2 9.0 7.6 7.6 n.m. 1.39 16 -13Chaoda Modern Agriculture 682 HK 4.02 HK$ 9,656 1,242 8.5 7.0 5.7 4.5 8.0 7.0 6.2 4.9 0.28 0.32 23 27Sinochem (HK) Holding Ltd 297 HK 2.95 HK$ 16,669 2,144 20.4 22.2 20.5 17.0 15.4 14.7 13.9 11.4 1.56 1.09 9 20Q-Cells QCE GR 34.51 € 2,687 3,440 55.1 33.6 27.5 21.0 33.7 19.1 15.1 11.5 1.27 0.65 22 31Renewable Energy Corp. R3Q GR 10.87 € 5,221 6,685 73.6 50.8 38.1 29.1 54.7 24.0 17.8 13.8 1.58 0.73 33 31MEMC Electronic Materials Inc. WFR US 34.39 US$ 7,985 7,985 23.9 18.3 14.2 n.m. 23.3 14.8 11.8 8.3 n.m. 0.44 29 n.m.Tokuyama 4043 JP 1714 ¥ 470,713 4,043 34.9 26.5 21.4 18.5 12.9 10.3 8.7 7.9 1.34 0.73 24 16Sunpower Corp. SPWR US 31.88 US$ 520 520 -91.1 R R R 1,879. R R R R n.m. R RSuntech Power Holdings STP US 29.9 US$ 4,326 4,326 150.2 R R R 87.7 R R R R R R RDistritutors PetroChina 857 HK 9.06 HK$ 1,614,758 207,649 12.0 10.5 10.9 10.1 6.9 5.9 5.9 5.4 5.03 1.55 -3 8SINOPEC 386 HK 4.64 HK$ 401,430 51,622 9.8 8.1 8.2 7.5 5.8 5.1 4.9 4.6 2.12 0.72 -2 10CNOOC 883 HK 7.15 HK$ 296,359 38,110 11.6 10.0 10.8 10.4 6.7 5.8 6.2 5.6 -4.95 -7.69 -7 3
Note: R = Restricted. Companies are priced as at 23 August 2006 Source: Company data, Credit Suisse estimates

Biofuel Sector 30 August 2006
5
Table of contents
Alternative to the fossil energy – biodiesel .......................................................................6
Surging global market .....................................................................................................24 Global market ..............................................................................................................24 Europe .........................................................................................................................27 North and Latin America..............................................................................................29 Asia..............................................................................................................................30 Rising crude oil prices spurred use of CPO as a biofuel.............................................34 Valuation comparison..................................................................................................38 Plantations – primary beneficiary of rising demand/prices..........................................41 Refineries and oleochemicals – positive surprise? .....................................................43 Distributors – opaque industry presents opportunities ................................................45 Biodiesel – the new ‘new thing’ ...................................................................................45
China’s biodiesel market – even faster ...........................................................................48 Huge energy demand embraces the use of biodiesel.................................................49 A need to promote the use of renewable energy in China..........................................55 Rising fuel prices inspires the demand for biodiesel ...................................................58 Production and capacity ..............................................................................................62 Distribution...................................................................................................................65 Feedstock availability ..................................................................................................66 By-products .................................................................................................................68 Biodiesel in China........................................................................................................68
Cost of biodiesel..............................................................................................................72 German case ...............................................................................................................73 Malaysia case..............................................................................................................75 US case .......................................................................................................................76 China case...................................................................................................................77
Primary government policies and incentives ..................................................................79 Increasing environmental awareness and regulations limiting fossil fuel emissions ..79 Australia.......................................................................................................................84 European Union...........................................................................................................84 United States ...............................................................................................................87 Brazil............................................................................................................................88 ASEAN (Association of South-East Asian Nations) ....................................................88 Korea ...........................................................................................................................91 Japan...........................................................................................................................91 India.............................................................................................................................92 China ...........................................................................................................................92
Investment risks ..............................................................................................................97
Appendix I: Primary biodiesel standards.........................................................................98
Appendix II: Types of feedstock....................................................................................101
Appendix III: Ethanol market.........................................................................................109

Biofuel Sector 30 August 2006
6
Alternative to fossil energy – biodiesel Biodiesel is a viable alternative fuel to conventional petroleum-based diesel; it can meet the requisites of European fuel standards II and III. Relative to fossil fuel, biodiesel exhibits much lower emissions and can be operated in any diesel engine with little or no modification needed to the engine or fuel system. Growth of biodiesel has been supported by government incentives and surging fossil fuel prices. Two primary standards govern the quality and specifications of biodiesel globally: the ASTM D 6751 for the US market and the EN 14214 for the EU market.
Figure 8: Biodiesel can be used for diesel-powered sedans Figure 9: Biodiesel can be used for diesel-powered trucks/buses
Source: Credit Suisse research Source: Credit Suisse research
Figure 10: Biodiesel can be used for diesel-powered plants Figure 11: Biodiesel can be used for diesel-powered ships
Source: Credit Suisse research Source: Credit Suisse research
Biodiesel meets Europeanfuel standards II and III, and can be used in any
diesel engine with little or no modification to the engine or fuel system

Biofuel Sector 30 August 2006
7
Background Invented in Germany in 1988, biodiesel is a viable alternative fuel to conventional petroleum-based diesel. Several European countries and the US started researching biodiesel in the 1990s and have since successfully developed biodiesel manufacturing technologies. In recent years, more than 20 countries have initiated the production of biodiesel, where national policy has been drawn into most of them. This national policy includes providing tax support for biodiesel promotion. For instance, in Italy, no tax is being levied on the biodiesel production industry. Over 100 biodiesel plants have been established around the world and producing approximately 2 mn tons of biodiesel in 2005, according to the Worldwatch Institute.
Biodiesel is defined as the mono-alkyl esters of fatty acids derived from vegetable oils or animal fats or simply, the product obtained when a vegetable or animal fat is chemically reacted with alcohol to produce a new compound, known as a fatty acid alkyl ester.
Figure 12: Biodiesel formula
Source: D1 Oil plc
By itself, vegetable oil or animal fat cannot be categorised as biodiesel – a catalyst, such as sodium or potassium hydroxide, is required. The biodiesel production process results in glycerol as a by-product. The National Biodiesel Board states that biodiesel today is produced with the following three processes, and the majority use base catalysed reaction.
• Base catalysed transesterification of the oil with alcohol.
• Direct acid catalysed esterification of the oil with methanol.
• Conversion of the oil to fatty acids, and then to alkyl esters with acid catalysis.
The general process of biodiesel production is depicted in Figure 13. Animal fats or vegetable oils are reacted with an alcohol, such as methanol, in the presence of a catalyst in order to produce biodiesel. The catalyst is typically sodium or potassium hydroxide, which has already been mixed with the methanol. The process produces a pure biodiesel (B100).
Invented in Germany in 1988, biodiesel is a viable
alternative fuel to conventional petroleum-
based diesel

Biofuel Sector 30 August 2006
8
Figure 13: Biodiesel production plant configuration
CRUDE OIL PRETREATMENT
ESTERIFICATIONTRANSESTERIFIC.
SEPARATIONCITRIC ACIDSOLUTION
PREPARATIONGLYCERINETREATMENT
FINAL FLASHMETHANOL
DISTILLATION
CRUDE OIL REFINED OIL ANIMAL FATS/WASTE FATS/HIGH ACIDITY
OILS
EsterifiedProduct
FreshMethanol
Catalyst
FattyAcid
CrudeGlycerine
Reaction Mixture
Acidified WetMethanol
BIOSIESEL GLYCERINE
WetMethanol
Water
Dry Methanol
DryMethanol
Citric Acid
Methylester
Methanol
Water
Source: D1 Oil plc
On average, 100 lbs of oil added with 10 lbs of methanol will produce 100 lbs of biodiesel and 10 lbs of glycerol, meaning a 91% or above conversion efficiency (using vegetable oil feedstock). Using used cooking oil and vegetable oil offal feedstock, the conversion efficiency is also above 90%.
Usually the conversion ratio of biodiesel
production could be more than 90%

Biofuel Sector 30 August 2006
9
Figure 14: Production yield of D1 Oil plc could reach 95%
Source: D1 Oil plc
It is imperative to distinguish between biodiesel and ethanol. While ethanol represents the renewable energy of petrol, biodiesel represents the renewable energy of diesel-petrol. Relative to fossil-diesel, biodiesel exhibits significantly lower emissions. Biodiesel can be used as an additive in formulations of diesel to increase the lubricity of pure ultra-low sulphur petrodiesel (ULSD) fuel. Typically, a system known as the ‘B’ factor is globally employed to state the amount of biodiesel in any fuel mix. For example, 20% bidiesel is labelled B20, whereas pure biodiesel, 100%, is referred to as B100.

Biofuel Sector 30 August 2006
10
Valuation chain Figure 15: Value chain of biodiesel
Source: Credit Suisse research
Most biodiesel-related companies are engaged in either biodiesel production or feedstock plantation, although some companies have both feedstock and biodiesel production capacity.
Figure 16: Selected business model comparison Company Plantation/feedstock Biodiesel product Distribution BioPetrol Industries AG ● Mission Biofuels ● D1 Oils plc ● ● Australian Biodiesel Group ● ● Australian Renewable Fuels ● Biofuels Corporation plc ● China Biodiesel Int’l Holding ● IOI Corp. ● ● Kuala Lumpur Kepong ● Golden Hope Plantation ● ● PT Astra Agro Lestari Tbk ● PetroChina ● SINOPEC ● ● Source: Company data, Credit Suisse research
Stock screen BioPetrol Industries (B2I GR, €8.40, not rated) manufactures and distributes biodiesel and pharmaceutical-grade glycerol in Europe. It uses a multi-feedstock strategy to ensure a secure availability of resources. Rapeseed oil, palm oil and soya oil are the feedstock that it processes, and it turning out products at Schwarzheide/Brandenburg. The foundations for its new plant in Rostock were laid on 1 February 2006 and as of autumn 2006, it will also be supplying products from Rostock and ramping up annual capacity to a total of around 300,000 tons of biodiesel. It plans to build an additional plant in Rotterdam and therefore plans to reach, with three facilities, an annual output total of 750,000 tons of biodiesel and 90,000 tons of pharmaceutical glycerine by year-end 2007.
Processes rapeseed oil, palm oil and
soya oil feedstock

Biofuel Sector 30 August 2006
11
Mission Biofuels (MBT AU, A$1.36, not rated) seeks to construct a biodiesel refinery and glycerine purification plant in Malaysia. Mission Biofuels is proposing to establish a 100,000 t.p.a. biodiesel refinery and a 12,000 t.p.a. glycerine purification plant at Kuantan Port, Malaysia. Project construction commenced in May 2006, with commercial production of the project expected to begin by October 2007. Mission Biofuels has a five-year supply contract for 100% of the CPO required with Cargill (not listed). While CPO will be the primary feedstock, the company has contracted Crown (not listed) to supply a multi-feedstock process plant, which will be capable of using various oils for the production of biodiesel.
D1 Oils plc (DOO LN, £2.21, not rated) is a UK-based global producer of biodiesel. The company has plantation rights to cultivate the crop jatropha curcas. The D1 20 is a standalone skid-mounted unit, capable of producing 8,000 tonnes of biodiesel per year from a range of vegetable oil feedstock. The deployment of the first cluster of four units will give the Middlesbrough site a total annual production capacity of 32,000 tons. As of 31 March 2006, the company has planted or obtained the rights to offtake from a total of 42,000 hectares of jatropha planting worldwide. The D1 20 refinery successfully completed its initial trials to produce biodiesel from rapeseed oil in April 2005, and by December had successfully completed refining tests for soy and palm.
Australian Biodiesel Group (ABJ AU, A$0.70, not rated) is a biodiesel producer. ABG was established in 2001. Its production facility in Berkeley Vale has a designed production capacity of 40 mn litres per year. Construction at Narangba is now well advanced, and the facility is expected to commence in mid-2006. The Narangloa facility and associated infrastructure has a design production capacity of 160 mn litres of biodiesel per annum. The plant is situated on land that the company purchased in August 2005. ABG has recently acquired a major aggregator of used cooking oils in N5W and is evaluating a number of energy cropping options to enhance its feedstock security.
Australian Renewable Fuels Ltd (ARW AU, A$1.07, not rated) is a biodiesel producer, based in Australia. The company is undertaking the construction of two plants. The first of these is located at Largs Bay in South Australia, and the second in Picton in Western Australia. The Adelaide plant will be the company’s first production plant and has a design capacity of almost 45 mn litres of biodiesel per annum. Largs Bay is due for commissioning in 2Q06, and Picton is due for commissioning in 3Q06.
Biofuels Corp. plc (BFC LN, £0.975, not rated) is a biodiesel producer based in Europe. aims to become Europe’s leading biodiesel producer. The main activities of the company are the large-scale production and exploitation of biodiesel and glycerine, following the construction and commissioning of the initial plant. Its first plant on Teesside was operating fully by the end of September 2005 and is expected to produce some 21,000 tonnes per month. It has completed contracts for its initial feedstock requirements and is established with blue-chip, market-leading counterparties to supply it with rape, palm and soya oils. The company aims to become Europe’s leading biodiesel producer.
Proposing to establish a 100,000 t.p.a. biodiesel
refinery and a 12,000 t.p.a.glycerine purification plant at Kuantan Port, Malaysia
Has plantation rights to cultivate the crop jatropha
curcas
Aiming to become Europe’s leading biodiesel
producer

Biofuel Sector 30 August 2006
12
VeraSun Energy (VSE US, US$21.62, NEUTRAL, TP US$23.00, MW) is a renewable energy source company, which began its business in 2001. VeraSun is currently the second largest ethanol producer in the US, with two plants and capacity of 230 mn gallons per year (MMGY). VSE has plans to reach 560 MMGY by the end of 2008. The third plant is already in construction and due to start up in 3Q07, while plants 4 and 5 are due for completion in 2Q08 (but have not yet started construction).
According to our US oil and gas research analyst, Mark Flannery, VeraSun is highly levered to the continued high margins available in US ethanol, and therefore contains more risk than the average refiner. However, opportunities for redeployment of free cash back into the business are significant.
China Biodiesel (CBI LN, £1.04, not rated) is the holding company for a renewable energy business focused on biodiesel manufacture, marketing, sales and technology research and development. The group commenced operations in 2001 through Longyan New Energy Development Co. (now China Biodiesel) (ZYNE). ZYNE has agreed to acquire a neighbouring plot of land to the group’s main premises in Longyan in order to construct an additional production plant with a capacity of 30,000 t.p.a. Final approval is expected to be received in August 2006. The feedstock used by the group for the production are waste palm oil, used cooking oil or other waste oil source.
Figure 17 shows that there are only a couple of companies with biofuel production capacity of over 200,000 tonnes, and Figure 18 shows most are only producing a modest level of net income but are expected to see rapid profit growth from a low base, in the next couple of years, based on consensus forecasts.
Figure 17: Aggregate biofuel capacity comparison
0
200,000
400,000
600,000
800,000
1,000,000
1,200,000
BioPetrolIndustries AG
MissionBiofuels
D1 Oils Plc AustralianBiodiesel
group
AustralianRenewableFuels Ltd.
BiofuelsCorp. Plc
VerasunEnergy Corp.
ChinaBiodiesel
InternationalHoldings
(tonnes)
2005 2006 2007
Note: The capacity of Verasun is ethanol Source: Company data, Credit Suisse estimates
Second largest ethanol producer in the US
A renewable energy business focused on
biodiesel manufacture, marketing, sales and
technology research and development

Biofuel Sector 30 August 2006
13
Figure 18: Net income comparison
-150
-100
-50
0
50
100
BioPetrol IndustriesAG
Mission Biofuels Australian BiodieselGroup
Australian Renew ableFuels Ltd.
Biofuels Corp. Plc
(US$ mn)
2005 2006 2007 2008
Source: Company data, Bloomberg, Credit Suisse research
IOI Corporation (IOI MK, RM16.30, NEUTRAL, TP RM17.00) cultivates and processes oil palm and rubber. The company, through its subsidiaries, operates in property development and investment, provides landscape services, and sells ornamental plants and turfing grass. IOI Oleo is the largest vegetable-based oleochemical manufacturer in Asia, with an annual production capacity of 350,000 tons. IOI Oleo’s principal products include fatty acids, glycerine, soap noodles and metallic stearates. IOI Oleo has a network of distributors and agents in various countries in Europe, Asia and Australia as well as storage facilities in Europe and the US. IOI Corp. confirmed the purchase of a 28 ha plot of land in July 2006 to set up biodiesel factories in the biofuel park in Tanjung Langsat, Johor.
According to our Malaysian plantations analyst, Tan Tingmin, IOI Corp. is the best-managed plantation company in Malaysia, with above-average ROEs and profitability. However, we believe its valuations are fair.
Kuala Lumpur Kepong (KLK MK, RM11.50, OUTPERFORM, TP RM 15.50) was incorporated in 1906. It produces and processes palm products, natural rubber, and cocoa on its plantations. Fresh fruit bunch (FFB) production rose impressively by 11.5% to 2,250,808 tons, boosted by the additional 4,114 hectares of oil palms being brought to harvest and more satisfyingly, by the rise in FFB yield per hectare by 6.1% to 22.89 tons per hectare. Further expansion of output in the near future can be expected from both the immature palms coming into productive age and the young palms increasing their yield. The modern Kekayaan Palm Oil Mill in Johor, currently amongst the largest in peninsular Malaysia with a capacity of 120 tons FFB per hour, is commissioned in early 2006.
According to Tan Tingmin, KL Kepong is our top pick in Malaysian palm oil sector, for the following reasons: 1) its earnings are very leveraged to commodity prices. We estimate that for every RM100/tonne increase in CPO prices, KL Kepong’s earnings will increase by 6-8%; KL Kepong is also one of the most profitable plantation companies in Malaysia, suggesting that it is efficiently managed, 2) KL Kepong is trading at prospective FY07E and FY08E P/Es of 13.8x and 11.3x, respectively, which are
Cultivates and processes oil palm and rubber
Produces and processes palm products, natural
rubber and cocoa on its plantations
KL Kepong is our top pick in Malaysian palm oil
sector with an OUTPERFORM rating

Biofuel Sector 30 August 2006
14
significantly cheaper than other large-cap plantation stocks; 3) KL Kepong has a young plantation, with some 20% of its plantations immature, 19% categorised as young, and about 50% at prime age, so future CPO output is likely to be relatively strong, and 4) KL Kepong has the largest exposure to rubber among the listed plantation companies, and rubber prices are at 17-year highs.
Golden Hope Plantation (GHP MK, RM4.84, OUTPERFORM, TP RM5.40) was established in 1844. It is the first Malaysian public-listed plantation group with downstream refineries and activities in the oils and fats industry in Europe and South Africa. The group’s plantation operation is palm-based at almost 94%, covering a total planted area of 166,337 hectares planted with oil palm. In 2005, the group processed 3.205 mn tonnes of FFB. Crude palm oil production increased to 689,890 tonnes, while the palm kernel yield was 157,870 tonnes. Golden Hope appears to be the most aggressive in biodiesel with a proposed cumulative capacity of 400,000 tonnes. The new 30,000 tonne plant was commissioned in June 2006 and is already exporting to Japan. Another 150,000-tonne plant could be located in Rotterdam and yet another 150,000-tonne plant in East Malaysia. We have not incorporated any profit contribution from the biodiesel plants, but these plants could make an annual net profit of RM95 mn or enhance its FY08E.
PT Astra Agro Lestari Tbk (AALI IJ, IDR8,650, NEUTRAL, TP IDR9,500) operates rubber plantations and manufactures cooking oil in Indonesia. Through its subsidiaries, the company also operates a variety of other plantations, such as palm oil, tea and cocoa. For its CPO product, it increased production by 12% to 857,141 tons in 2005 from 765,172 tons in 2004. Its ‘super CPO’ production increased by 18.3% to 516,000 tons in 2005. Better quality in planting and more efficient processing of FFB has further improved its total CPO extraction rate to 23.14% from 22.81%.
Our Indonesian plantations analyst, Haider Ali, remains convinced that AALI’s near-100% exposure to CPO, its improving productivity and its creditable cost management ranks it as one of the biggest potential beneficiaries of an upturn in the CPO price cycle. We have raised our 2007E EPS and 2008E EPS for AALI, due to the positive outlook for CPO prices, and we have revised our 12-month target price to Rp9,500 (from Rp8,500) – implying 12% potential upside – and maintain our NEUTRAL rating. We believe that there is a strong argument that AALI will continue to perform well relative to its peers on the back of its higher CPO leverage and stronger earnings momentum as CPO prices continue to rally.
First Malaysian public-listed plantation group withdownstream refineries and
activities in the oils and fats industry in Europe and
South Africa
Operates rubber plantations and
manufactures cooking oil in Indonesia

Biofuel Sector 30 August 2006
15
Figure 19: Unit total cost comparison (2005)
925
1,962
314
795
0
500
1,000
1,500
2,000
2,500
BioPetrol Industries Biofuels Corp. Plc Verasun Energy Corp. China Bisdiesel Int'l.
(US$/ton)
Av erage: 999
Note: The unit total cost for Verasun was for ethanol production, Unit total cost=(COGS+operating expense)/production volume Source: Company data, Credit Suisse research
As shown above, the unit total costs of Chinese biodiesel producers are significantly lower than international competitors’. And the main factor is the different feedstock used in China. Feedstock accounts for more than 80% of the biodiesel production costs (Figure 106), and the costs of vegetable oil offal and used cooking oil, which are the main feedstock used in China for biodiesel production (Figure 108), are much lower than other feedstock (Figure 107).
And the cost difference explains the difference in margins.
Figure 20: EBITDA margins comparison (2005)
7.75%
42.90%
30.00%
3.08% 12.22%
44.30%
23.35%
15.56% 14.44%
40.82%
29.32%
3.23%8.25%
-0.24% -5 0 5
10 15 20 25 30 35 40 45 50
BioP
etrol
Indus
tries A
G
Miss
ion B
iofue
ls
D1 O
ils P
lc
Austr
alian
Biod
iesel
Grou
p
Biofu
els C
orp.
Plc
Vera
sun E
nerg
y Cor
p.
China
Biod
iesel
Inter
natio
nal H
olding
s
IOI C
orpe
ratio
n
Kuala
Lump
ur K
epon
g
Golde
n Hop
e Plan
tation
PT A
stra A
gro L
estar
i Tbk
PT Lo
ndon
Sum
atra I
ndon
esia
Wilm
ar In
t'l Ltd
.
Sina
r Mas
Agr
o Res
&Tec
h
(%)
Note: The EBITDA margins of Mission Biofuels, D1 Oils plc, Australian Biodiesel Group and Biofuels Corp. plc are based on the IBES in 2008, 2007, 2006 and 2008, respectively, others are all 2005 data Source: Bloomberg, company data, Credit Suisse research
Difference in feedstock costs explains the
difference in margins

Biofuel Sector 30 August 2006
16
Figure 21: Operating margin comparison (2005)
6.60%
27.50%
9.66%
42.60%
20.34%
12.47% 11.78%
25.68%23.22%
0 5
10 15
20 25
30 35
40 45%
BioPetrol Industries AG
Australian Biodiesel Group
Verasun Energy Corp.
China BiodieselInternational
Holdings
IOI Corperation Kuala LumpurKepong
Golden Hope Plantation
PT Astra AgroLestari Tbk
PT LondonSumatra
Indonesia
(%
Note: Since Australian Biodiesel Group had not produced biodiesel in 2005 yet, the operating margin of it is based on the IBES in 2006, others are all 2005 data Source: Bloomberg, Company data, Credit Suisse research
Figure 22: Net income margin comparison (2005)
3.65%
41.42%
20.00%
3.08% 0.11%
39.80%
14.86%10.84%
16.46%
23.45% 20.17%
1.25%6.53%
0 5
10 15 20 25 30 35 40 45
BioP
etrol
Indus
tries A
G
Miss
ion B
iofue
ls
Austr
alian
Biod
iesel
Grou
p
Biofu
els C
orp.
Plc
Vera
sun E
nerg
y Cor
p.
China
Biod
iesel
Inter
natio
nal H
olding
s
IOI C
orpe
ratio
n
Kuala
Lump
ur K
epon
g
Golde
n Hop
e Plan
tation
PT A
stra A
gro L
estar
i Tb k
PT Lo
ndon
Sum
atra I
ndon
esia
Wilm
ar In
t'l Ltd
.
Sina
r Mas
Agr
o Res
&Tec
h
(%)
Note: Since Mission Biofuels, Australian Biodiesel Group and Biofuels Corp. plc had not produced biodiesel in 2005 yet, the net income margins of them are based on the IBES in 2008, 2006 and 2008, respectively, others are all 2005 data Source: Bloomberg, Company data, Credit Suisse research

Biofuel Sector 30 August 2006
17
Figure 23: Debt-to-capital ratio (2005)
6.4% 4.9%
73.9% 62.4%
41.4%
13.2% 13.5% 12.1%
66.5%
14.5%
45.8%
32.4%
85.5%
37.6%46.4%
25.5%
78.8%
27.5%
41.3%
14.8%
58.2%
28.9%
47.8%
34.2%
0 10 20 30 40 50 60 70 80 90
D1 O
ils
Austr
alian
Biod
iesel
Grou
p
Biofu
els C
orp.P
lc
Vera
sun IOI
Kuala
Lump
ur K
epon
g
Golde
n Hop
e
PT A
stra A
gro L
estar
i
Degu
ssa
Ener
gy C
onve
rsion
Dev
ices
Novo
zyme
s
MGP
Ingre
diants
Cova
nta
Xiwa
ng S
uga r
Sino
chem
Q-Ce
lls
REC
MEMC
Toku
yama
Sunp
owe r
Sunte
ch
Petro
China
Sino
pec
CNOO
C
(%)
Source: Bloomberg, Company data, Credit Suisse research
Figure 24: 2006-08 EPS CAGR
229.2
7%
138.4
8%
13.82
%
17.46
%
25.18
%
45.89
%
13.60
%
19.60
%
0.00%
32.87
%
16.54
%
0.00%
14.28
%
26.55
%
32.06
%
0.00%
0.00%
3.80%
363.9
6%
-2.03
%
0.00%
-50 0
50 100 150 200 250 300 350 400
BioP
etrol
Austr
alian
Biod
iesel
Grou
p
Austr
alian
Ren
ewab
le Fu
els
Vera
sun
IOI C
orp
Kuala
Lump
ur K
epon
g
Golde
n Hop
e
PT A
stra A
gro L
estar
i
PT Lo
ndon
Sum
atra I
ndon
esia
Degu
ssa
Novo
zyme
s
MGP
Ingre
dients
Cova
nta
Chao
da M
oder
n
Sino
chem
Q-Ce
lls
REC
Toku
yama
Petro
China
Sino
pec
CNOO
C
(%)
Source: Company data, Bloomberg, Credit Suisse estimates
Given Chinese biodiesel producers’ superior profit margins and earnings growth prospects driven from producing biodiesel by using lower-cost feedstock materials that are abundant in China compared to those sold by the feedstock suppliers, such as Malaysian and Indonesian CPO plantation companies, we believe Chinese biodiesel producers are well positioned in China to capture strong energy demand growth as well as the government’s goal to raise renewable energy consumption under the Renewable Energy Law. In addition, we believe they are well positioned from further rapid biodiesel demand growth from the likely biodiesel standard implementation in China (in 2007),

Biofuel Sector 30 August 2006
18
which will also significantly raise the number of biodiesel distribution points, stipulation of blending ratios and the use of biodiesel. And the use of waste cooking oil and vegetable oil offal will probably win government support in and outside of China. In particular, those global low-cost producers of biodiesel that already meet with the European specification could export their products to vast overseas European markets, such as Germany, although we expect they will not have spare capacity aside from filling domestic PRC demand in the near future.
Compared to the solar companies, we believe the high valuation levels of these stocks already reflect the market discounting the ability of these companies to deliver significant cost savings via their R&D strengths. As current government solar subsidies are scheduled to be removed in time, government subsidy removal risk is much higher for solar stocks.
Benefits analysis Biodiesel is a renewable fuel with environmental benefits derived from oil-bearing crops. It is a natural hydrocarbon with negligible sulphur content. It can reduce carbon monoxide and 30% of particulate emission. And biodiesel is becoming an increasingly important element in global energy policies, given the rise in crude oil prices.
Softening the reliance on fossil fuels
Figure 25: Global net oil importers, 2004
12.1
5.3
2.92.4 2.2
0
2
4
6
8
10
12
14
US Japan China Germany South Korea
(mn barrels/day )
Source: BP Statistical Review of World Energy, Credit Suisse research
Both developed and developing countries are importing more crude oil to support their domestic economies. For example, China imported more than 127 mn tons of crude oil in 2005, making it the second largest crude oil importer in the world. But given the continued increase in oil prices, it has to pay a significant amount of money to oil exporters. Biodiesel provides an alternative solution to fuel the development of these countries.
Biodiesel has been well embraced as it provides an
alternative to fossil fuels, producing low emissions
China imported more than 127 mn tons of crude oil in 2005, making it the secondlargest crude oil importer in
the world

Biofuel Sector 30 August 2006
19
Figure 26: Rising crude and diesel price
0
50
100
150
200
250
Jan 02 Jan 03 Jan 04 Jan 05 Jan 06 Jan 07 Jan 08 Jan 09 Jan 10
(US$/bbl)
Crude oil price Germany retail diesel price
US retail diesel price China diesel retail guidance price
China diesel w holesale price
Source: Bloomberg, Credit Suisse estimates
Low emissions Biodiesel is the first and only alternative fuel to have a complete evaluation of emission results and potential health effects submitted to the US Environmental Protection Agency (EPA) under the Clean Air Act Section 211(b). These programmes include the most stringent emission testing protocols ever required by the EPA for certification of fuels and fuel additives.
Biodiesel is biodegradable, making it especially suitable for marine or farm applications. And according to the National Renewable Energy Laboratory (NREL), biodiesel reduces the emission of carbon monoxide (CO) by approximately 50% and carbon dioxide (CO2) by 78.45% on a net lifecycle basis, as emissions are recycled from carbon dioxide that was already in the atmosphere, rather than being new carbon dioxide from petroleum that was sequestered in the earth’s crust.
Figure 27: Advantages of biodiesel Property Benefit No sulphur No SOx Emission High cetane Smooth Running & less Noise Presence of oxygen Low CO, HC, & PM Closed carbon cycled Reduce CO2 Better lubricity Improved engine performance Source: D1 Oils India Private Limited, Credit Suisse research
Biodiesel is biodegradable,so its emissions are
significantly lower than those of fossil diesel, and the higher percentage of
biodiesel blends, the lowerthe emissions it produces

Biofuel Sector 30 August 2006
20
Figure 28: Comparison of biodiesel and diesel Property Biodiesel (B100) Petroleum diesel Cetane number 51 to 62 44-49 Biodegradability Degrades readily Poor bio-degradability Toxicity Essentially non-toxic High toxic Oxygen Up to 11% free oxygen Very low Aromatics No aromatic compounds 18 to 22% Sulphur None 0.05% Flash point 300 to 400 °F 125 °F Spill hazard None Highly toxic Material compatibility Degrades natural, butyl rubber No affect on natural/butyl; rubber Shipping Non-hazard and non-flammable materials Hazardous Fuel type Clean renewable and alternative Polluting and non renewable Supply security Domestic raw materials Predominantly imports Production process Chemical reaction Reaction + fractionation Cost of production Lower Higher Source: D1 Oils India Private Limited, Credit Suisse research
Figure 29: Comparison of different blend scenarios (relative to petroleum diesel) Biodiesel grade B100 (%) B20 (%)Regulated emissions Total unburnt hydrocarbons -93 -30Carbon Monoxide -50 -20Particulate matter -30 -22NOx 13 2 Unregulated emissions Sulphates -100 -20Polyciclic aromatic hydrocarbon -80 -13Nitrated PAHs -90 -50Ozone potential of speciated HC -50 -10 Life cycle emissions Carbon dioxide (LCA) -80 Sulphur dioxide (LCA) -100 Source: Company data, Credit Suisse estimates
Biodiesel vegetable oil methyl esters contain no volatile organic compounds that would give rise to any poisonous or noxious fumes. The biodiesel does not contain any aromatic hydrocarbons (benzene, toluene, xylene) or chlorinated hydrocarbons. There is no lead or sulphur to react and release harmful or corrosive gases. However, in blends with fossil diesel there will continue to be significant fumes released by the benzene and other aromatics present in the petroleum fraction (80%) of the blend.
Figure 30: Biodiesel total emissions (truck) compared to fossil diesel Emission Low sulphur diesel (G/km) Biodiesel (G/km) %Greenhouse 925 70 8Total hydrocarbon 1.51 0.60 40NOx 11.25 11.76 105CO 2.72 1.40 52PM 10 438.40 274.30 63Source: CSIRO, Credit Suisse research
Higher investment efficiency and energy conversion ratio Besides providing an alternative choice to fossil fuels, biodiesel also offers a higher investment efficiency and energy conversion ratio.

Biofuel Sector 30 August 2006
21
The construction investment requested by the biodiesel processing industry with a production capacity of 10.65 mn t.p.a. is to be calculated with €6 bn, meaning approximately US$715 per ton of annual capacity. And the ratio of annual production value to the total investment is about 1:1, higher than in traditional energy industry, which is about 0.4:1 in thermal power generation. (Citied from Liquid Biofuels for Transportation, GTZ, 2006.)
New capacities being set up in Asia have even lower investment cost, in the range of US$250-400/ton of annual capacity.
And according to US Department of Energy, biodiesel has the most favourable energy balance of any transportation fuel. For every unit of energy needed to produce one litre of biodiesel, 3.2 units of energy are gained. In comparison, for every unit of energy needed to produce one litre of conventional petroleum diesel, 0.8 units of energy are provided.
Income for the agricultural sector and regeneration of wasteland Because it is made from locally grown or grease trap waste, renewable resources, using biodiesel in vehicles can help to boost the farm economy, especially to China, which has an agricultural population of more than 300 mn (2004). Mandating the use of biodiesel in China in the coming years is critical to the support of domestic agriculture, even though most Chinese biodiesel producers are using vegetable oil offal and used cooking oil as feedstock, the rising demand for them still can inspire the demand for crops, since both vegetable oil offal and used cooking oils are produced from crops originally. A study completed in 2001 by the US Department of Agriculture found that an average annual increase of the equivalent of 200 mn gallons of soy-based biodiesel demand would boost total crop cash receipts by US$5.2 bn cumulatively by 2010, resulting in an average net farm income increase of US$300 mn p.a. It is also calculated that the biodiesel processing industry, with a yield of 10.65 mn t.p.a. output can create about €5 bn per year, and can offer employment to more than 200,000 workers (Citied from Liquid Biofuels for Transportation, GTZ, 2006), which can provide more jobs for China’s abundant workforce.
The promotion of biodiesel also leads to wasteland regeneration, offering scope for improving rural economies. For instance, there is huge potential in India, which has 63.85 mn ha of wasteland. Its regeneration could generate massive employment in rural areas by providing job opportunities. Also, it could promote agriculture productivity and preserve ecology.
Better than ethanol Even comparing with bioethanol, biodiesel shows some advantages listed below:
The ratio of annual production value to total investment is about 1:1,
higher than in the traditional energy industry
For every unit of energy needed to produce one
litre of biodiesel, 3.2 units of energy is gained
An average annual increase of the equivalent of 200 mn gallons of soy-based biodiesel demand
would result in an average net farm income increase
of US$300 mn p.a.

Biofuel Sector 30 August 2006
22
Figure 31: Comparison between biodiesel and bioethanol Biodiesel Ethanol
Production process is relatively simple and energy conserving with an FF EER of 3.25
Production process is energy intensive with an FF EER of 1.34 Energy deficiency
Diesel engines are 35-40% more efficient than ICEs Energy density = 90% of petro-diesel (117 kbtu/gal versus 131 kbtu/gal for petro-diesel)
Energy density 30% lower than petrol and 35% lower than diesel (84 kbtu/gal vs 125 kbtu per gallon for petrol)
Increased lubricity allows full sulphur removal from petro-diesel when 2% biodiesel added
Octane enhancer main selling point
Has good solvent capability resulting in cleaner combustion process and better engine performance
Has affinity for water, which requires special transport and blending arrangements to avoid petrol-EtOH/H2O separation
Fuel properties
Can either be blended with or used as 100% petro-diesel replacement
Low tech process lends itself to community-scale plants Large scale plants needed to achieve economies of scale Process technology & feedstock Can be produced from used cooking oils and exotic feedstocks such as algae and Jatropha
Unless EH becomes cost-effective, ethanol plants will remain dependent on feed grains and sugar crops grown on plantations
Source: LP Power Consultants, Credit Suisse research
Biodiesel is easy to use and is practically a drop-in technology, where neither additional equipment nor any modifications are necessary. Plus, biodiesel has better lubricity than petroleum diesel, making it suitable for blending into low and ultra-low sulphur diesel, which lacks lubricity.
Candidate for carbon credits Use of biodiesel is a prime candidate for generation of carbon credits, because it uses renewable and sustainable products and technologies to generate power. China has signed that it will comply with the Kyoto protocol, and wide use of biodiesel would provide more room to grow its expanding, but polluting, economy.
Sales of avoided carbon emissions are in the form of carbon credits. One credit is equivalent to 1 mn tons of avoided carbon dioxide. Carbon credits sell for more than €15 currently. If the credits are accumulated over a five-year time cycle and then sold, the company can receive a lump sum. Global financial markets are embracing credits as viable investment vehicles, and major EU financial institutions have designed and operated a €142 mn financial fund – the European Carbon Fund – dedicated to purchasing carbon credits.
Figure 32: Spot prices of carbon credits (€)
0
5
10
15
20
25
30
35
Jul 05 Sep 05 Oct 05 Nov 05 Dec 05 Feb 06 Mar 06 Apr 0+ Jun 06 Jul 060
5
10
15
20
25
30
35
Jul 05 Sep 05 Oct 05 Nov 05 Dec 05 Feb 06 Mar 06 Apr 0+ Jun 06 Jul 060
5
10
15
20
25
30
35
Jul 05 Sep 05 Oct 05 Nov 05 Dec 05 Feb 06 Mar 06 Apr 0+ Jun 06 Jul 060
5
10
15
20
25
30
35
Jul 05 Sep 05 Oct 05 Nov 05 Dec 05 Feb 06 Mar 06 Apr 0+ Jun 06 Jul 06Source: Bloomberg, Credit Suisse research
Carbon credits sell for more than €15 currently

Biofuel Sector 30 August 2006
23
Disposal of waste oil The recovery of waste cooking oil for biodiesel can reduce the dependency upon landfill sites as a means of waste disposal and reduce the use of fossil fuels for energy generation.
Disadvantages Conversely, the Energy Information Administration (EIA) has noted a number of disadvantages to using biodiesel relative to fossil-diesel.
• Produces more nitrogen dioxide (NO2). One argument in the past used by many environmental agencies to hinder the market penetration of biodiesel was that NOx emissions could be increased by up to 15% using B100. But adding coconut oil to biodiesel mixtures can decrease NOx emissions. Also animal fats used to make biodiesel additives can cut NOx in the exhaust gas to about 5-10% less than emissions from fossil diesel.
• Markedly worse performance in cold conditions.
• Reduces fuel economy. While the use of biodiesel does not reduce engine efficiency (the percentage of the fuel’s thermal energy that is delivered as engine output), it exhibits lower volumetric efficiency (the energy content per gallon) than fossil-diesel. Biodiesel contains 8% less energy per gallon than typical No.2 diesel in the US and 12% less energy per pound.
• Most biodiesel emission studies have been carried out on existing heavy-duty highway engines. The US Environmental Protection Agency has concluded that the results of biodiesel tests in heavy-duty vehicles cannot be generalised to light-duty diesel vehicle or off-highway diesel engines.
• There is still an absence of unified agreement between auto companies on the appropriate maximum percentages for blending biodiesel with diesel fuel.

Biofuel Sector 30 August 2006
24
Surging global market Government incentives derived from environmental concerns, and surging fossil fuel price have been the major catalysts for the 46% CAGR of global biodiesel market in 1991-2005. Bio-era estimated that global biodiesel market will continue its strong growth with 30% CAGR estimated fro 2005-2010 period. Ascribed to the EU Directive, the European region is expected to lead the global demand growth. With substantial feedstock availability, Asian region is set to become the leading biodiesel producer. Europe is expected to import approximately 1 million tons of biodiesel from Asia by 2010 (as estimated by Bio-era).
Global market Interest in biofuels began during the 1970s due to oil supply concerns. However, commercial production of biodiesel did not begin until the late 1990s. The biodiesel market has grown rapidly since its induction. The National Biodiesel Board reported production of 500,000 gallons (32.6 barrels per day) in 1999 and 6.7 mn gallons (437 barrels per day) in 2000. Correspondingly, Worldwatch Institute reported that global production of biodiesel has increased from 11.4 mn litres in 1991 to 2,200 mn litres in 2005, representing a CAGR of 45.66%.
Figure 33: Global biodiesel production (mn litres)
Global biodiesel production
0
500
1,000
1,500
2,000
2,500
1991 1992 1993 1994 1995 1996 1997 1998 1999 2000 2001 2002 2003 2004 2005
CAGR 45.66%
0
500
1,000
1,500
2,000
2,500
1991 1992 1993 1994 1995 1996 1997 1998 1999 2000 2001 2002 2003 2004 2005
CAGR 45.66%
Source: Worldwatch Institute, Credit Suisse research
Government policies and incentives play a major role in the rapidly increasing biodiesel industry. These policies are implemented on the back of increasing concerns over global warming and air pollution. In addition, nations across the globe are mandating the introduction of biodiesel to meet Kyoto Protocol requirements. The continuing unrest in the Middle East and volatile fuel prices provide further upward pressure on the growth of the biodiesel industry. The EU has directed that 5.75% of the energy content of all petrol and diesel for transport in 2010 is to originate from renewable sources. All diesel sold in France currently is already blended with 2% biodiesel. Thailand is currently aiming for a 10% blend by 2012. Evidently, meeting these targets will depend on feedstock availability and production capacity, but the prospects for growth look strong.
Government incentives derived from
environmental concerns, and surging fossil fuel
prices have been and will remain the major catalysts for global biodiesel market
The global biodiesel market increased at a
45.66% CAGR in 1991-2005
Biofuel Sector 30 August 2006
25
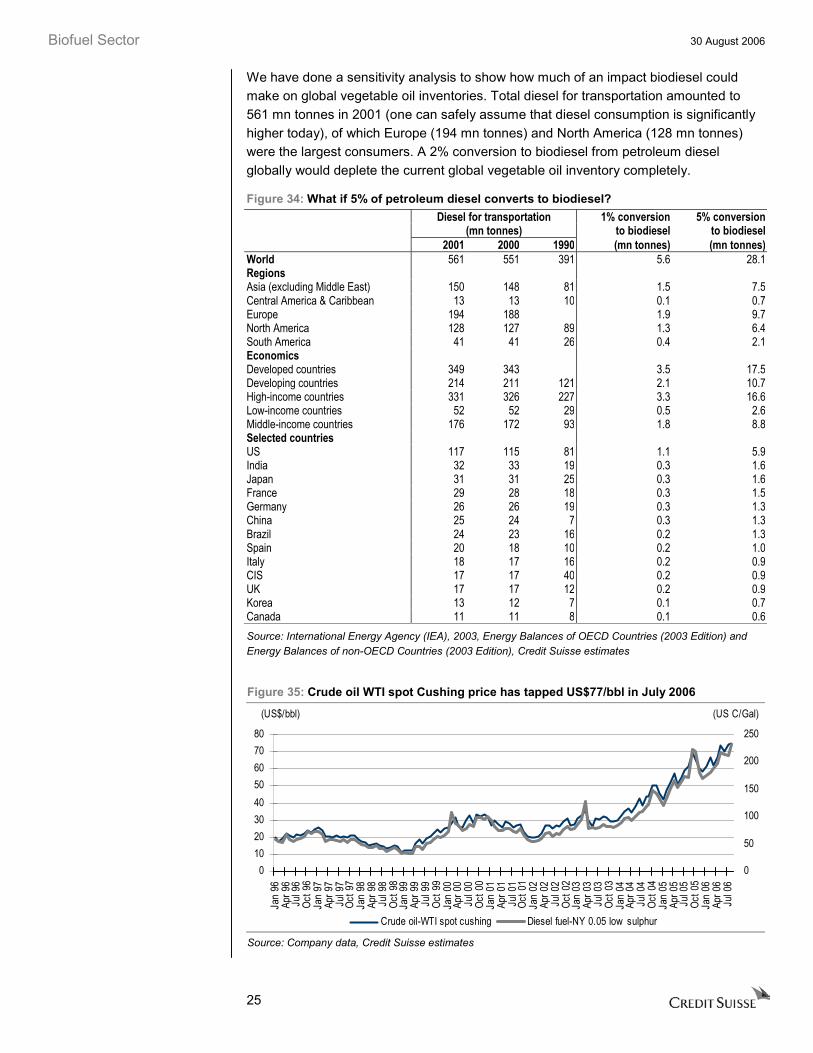
We have done a sensitivity analysis to show how much of an impact biodiesel could make on global vegetable oil inventories. Total diesel for transportation amounted to 561 mn tonnes in 2001 (one can safely assume that diesel consumption is significantly higher today), of which Europe (194 mn tonnes) and North America (128 mn tonnes) were the largest consumers. A 2% conversion to biodiesel from petroleum diesel globally would deplete the current global vegetable oil inventory completely.
Figure 34: What if 5% of petroleum diesel converts to biodiesel? Diesel for transportation 1% conversion 5% conversion (mn tonnes) to biodiesel to biodiesel 2001 2000 1990 (mn tonnes) (mn tonnes)World 561 551 391 5.6 28.1Regions Asia (excluding Middle East) 150 148 81 1.5 7.5Central America & Caribbean 13 13 10 0.1 0.7Europe 194 188 1.9 9.7North America 128 127 89 1.3 6.4South America 41 41 26 0.4 2.1Economics Developed countries 349 343 3.5 17.5Developing countries 214 211 121 2.1 10.7High-income countries 331 326 227 3.3 16.6Low-income countries 52 52 29 0.5 2.6Middle-income countries 176 172 93 1.8 8.8Selected countries US 117 115 81 1.1 5.9India 32 33 19 0.3 1.6Japan 31 31 25 0.3 1.6France 29 28 18 0.3 1.5Germany 26 26 19 0.3 1.3China 25 24 7 0.3 1.3Brazil 24 23 16 0.2 1.3Spain 20 18 10 0.2 1.0Italy 18 17 16 0.2 0.9CIS 17 17 40 0.2 0.9UK 17 17 12 0.2 0.9Korea 13 12 7 0.1 0.7Canada 11 11 8 0.1 0.6Source: International Energy Agency (IEA), 2003, Energy Balances of OECD Countries (2003 Edition) and Energy Balances of non-OECD Countries (2003 Edition), Credit Suisse estimates
Figure 35: Crude oil WTI spot Cushing price has tapped US$77/bbl in July 2006
01020304050607080
Jan
96Ap
r 96
Jul 9
6Oc
t 96
Jan
97Ap
r 97
Jul 9
7Oc
t 97
Jan
98Ap
r 98
Jul 9
8Oc
t 98
Jan
99Ap
r 99
Jul 9
9Oc
t 99
Jan
00Ap
r 00
Jul 0
0Oc
t 00
Jan
01Ap
r 01
Jul 0
1Oc
t 01
Jan
02Ap
r 02
Jul 0
2Oc
t 02
Jan
03Ap
r 03
Jul 0
3Oc
t 03
Jan
04Ap
r 04
Jul 0
4Oc
t 04
Jan
05Ap
r 05
Jul 0
5Oc
t 05
Jan
06Ap
r 06
Jul 0
6(US$/bbl)
0
50
100
150
200
250
(US C/Gal)
Crude oil-WTI spot cushing Diesel fuel-NY 0.05 low sulphur
Source: Company data, Credit Suisse estimates
Biofuel Sector 30 August 2006
26
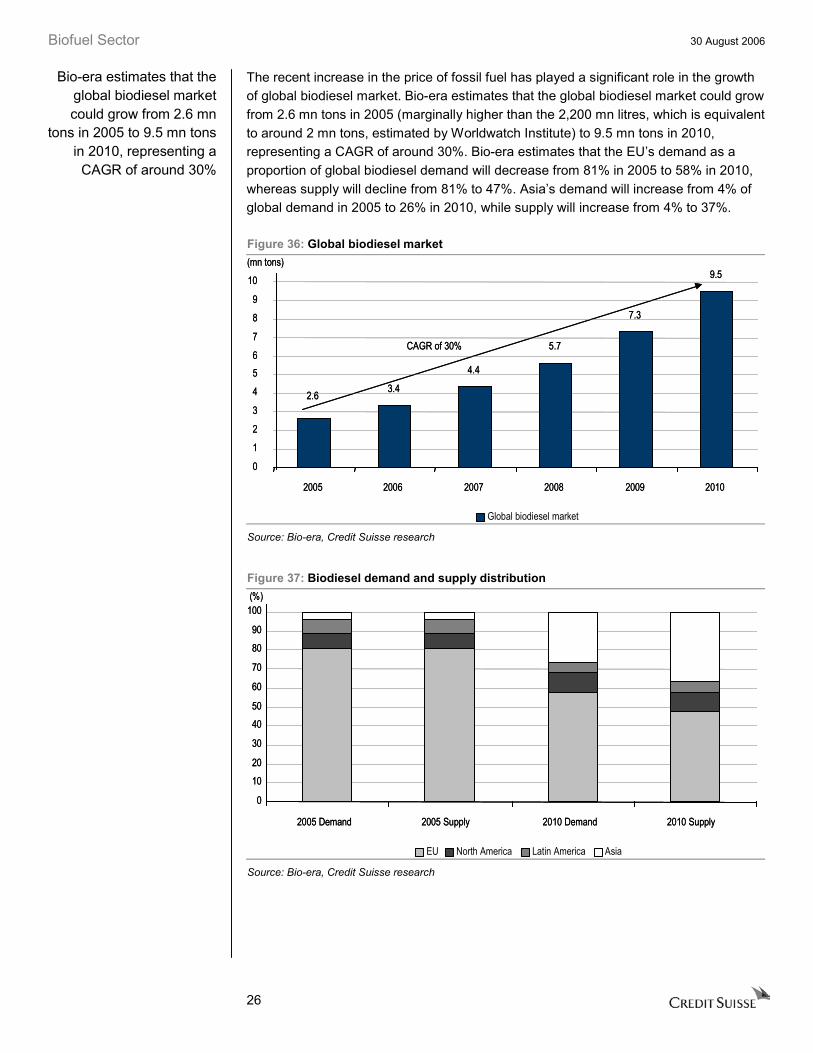
The recent increase in the price of fossil fuel has played a significant role in the growth of global biodiesel market. Bio-era estimates that the global biodiesel market could grow from 2.6 mn tons in 2005 (marginally higher than the 2,200 mn litres, which is equivalent to around 2 mn tons, estimated by Worldwatch Institute) to 9.5 mn tons in 2010, representing a CAGR of around 30%. Bio-era estimates that the EU’s demand as a proportion of global biodiesel demand will decrease from 81% in 2005 to 58% in 2010, whereas supply will decline from 81% to 47%. Asia’s demand will increase from 4% of global demand in 2005 to 26% in 2010, while supply will increase from 4% to 37%.
Figure 36: Global biodiesel market
Global biodiesel market
2.6 3.4
4.4
5.7
7.3
9.5
2005 2006 2007 2008 2009 2010
(mn tons)
CAGR of 30%
0
1
2
3
4
5 6
7
8
9
10
2.6 3.4
4.4
5.7
7.3
9.5
2005 2006 2007 2008 2009 2010
(mn tons)
CAGR of 30%
0
1
2
3
4
5 6
7
8
9
10
Source: Bio-era, Credit Suisse research
Figure 37: Biodiesel demand and supply distribution
EU North America Latin America Asia
0
1020
30
4050
60
70
8090
100
2005 Demand 2005 Supply 2010 Demand 2010 Supply
(%)
0
1020
30
4050
60
70
8090
100
2005 Demand 2005 Supply 2010 Demand 2010 Supply
(%)
Source: Bio-era, Credit Suisse research
Bio-era estimates that the global biodiesel market could grow from 2.6 mn
tons in 2005 to 9.5 mn tons in 2010, representing a
CAGR of around 30%

Biofuel Sector 30 August 2006
27
Europe Europe is the largest biodiesel market in the world. The main feedstocks used in Europe are rapeseed oil and canola oil. In the bid to reduce greenhouse gas emissions, the EU is promoting the use of biofuels. Under the 2003 EU Biofuels Directive, by the end of 2010, 5.75% of energy content of all petrol and diesel used for transport purposes must originate from renewable sources. The maximum potential is around 10% of petro-diesel usage. This implies that the EU’s biodiesel consumption will reach 9.2 mn t.p.a. in 2010. Eurostat and European Union Directorate General Energy estimate that, according to the EU directive, EU’s biodiesel consumption will increase dramatically from 3.8 mn tons in 2006 to 11.5 mn tons in 2011, reflecting a CAGR of 24.75%. Despite the fact that the EU’s biodiesel production accounts for around 90% of global production, the current production capacity of 2.1 mn t.p.a. is still well short of the 9.2 mn ton consumption per year in 2010, as outlined by the EU directive.
Figure 38: EU biodiesel consumption based on EU directive
EU biodiesel consumption
0
2,000
4,000
6,000
8,000
10,000
12,000
14,000
2006 2007 2008 2009 2010 2011
('000 tons)
CAGR of 24.75%
Source: Eurostat and European Union Directorate General Energy, Credit Suisse research
Eurostat and European Union Directorate General Energy provided the breakdown of biodiesel consumption in the EU, in accordance to the EU’s directive. Biodiesel consumption by France, Germany, Spain, Italy and the UK represent around 70% of Europe’s total biodiesel consumption in both 2006 and 2010. And Germany is the largest producer of biodiesel, no only in Europe, but also in the world.
However, market participants and researchers are sceptical about the EU’s capacity to meet its target, since, due to higher production costs, European biodiesel producers are heavy reliant on tax incentives. Bio-era estimates that the EU’s total biodiesel consumption would reach only 5.5 mn tons by 2010, while supply is projected to reach 4.5 mn tons. Henceforth, even Bio-era’s conservative estimate still indicates that there will be a biodiesel supply shortage for the EU by 2010. Bio-era predicts that by 2010, the EU will need to import 1 mn tons of biodiesel from Asia.
Eurostat and European Union Directorate General
Energy estimate that the EU’s biodiesel
consumption will increase dramatically from 3.8 mn tons in 2006 to 11.5 mn
tons in 2011, a CAGR of 24.75%
Bio-era estimates that the EU’s total biodiesel
consumption will reach only 5.5 mn tons by 2010,
while supply is projected toreach 4.5 mn tons

Biofuel Sector 30 August 2006
28
Figure 39: Europe’s biodiesel production capacity
Source: Frost & Sullivan, Credit Suisse research
Figure 40: Europe’s biodiesel consumption
0
500
1,000
1,500
2,000
2,500
Fran
ce
Germ
any
Spain Ita
ly UK
Nethe
rland
s
Belgi
um
Portu
gal
Austr
ia
Polan
d
Swee
dend
Czec
h Rep
ublic
Gree
ce
Finlan
d
Irelan
d
Denm
ark
Hung
ary
Luxe
mbou
rg
Slov
ak R
epub
lic
Lithu
ania
Slov
enia
Latvi
a
Cypr
us
Eston
ia
Malta
('000 tons)
2006 2010
Source: Eurostat, European Union Directorate General Energy and Transport, Credit Suisse research

Biofuel Sector 30 August 2006
29
Figure 41: European biodiesel market Demand-supply (million tons) Imports (million tons)
Demand Supply Imports
0.0
1.0
2.0
3.0
4.0
5.0
6.0
2005 2006 2007 2008 2009 2010
0.0
0.2
0.4
0.6
0.8
1.0
1.2
Source: Bio-era, Credit Suisse research
North and Latin America Bio-era estimates that in 2005, the size of biodiesel market in North and Latin America combined was approximately 400,000 tons, with each region consuming and producing around 200,000 tons. Bio-era projects that the biodiesel market of North and Latin America will reach 1 mn tons and 500,000 tons by 2010, respectively.
Figure 42: North American biodiesel market Figure 43: Latin American biodiesel market
North America biodiesel market
0.0
0.2
0.4
0.6
0.8
1.0
1.2
2005 2006 2007 2008 2009 2010
(million tons)
CAGR of 37.97%
0.0
0.2
0.4
0.6
0.8
1.0
1.2
2005 2006 2007 2008 2009 2010
(million tons)
CAGR of 37.97%
Latin America biodiesel market
(million tons)
0.0
0.1
0.2
0.3
0.4
0.5
0.6
2005 2006 2007 2008 2009 2010
CAGR 20.11%
0.0
0.1
0.2
0.3
0.4
0.5
0.6
2005 2006 2007 2008 2009 2010
CAGR 20.11%
Source: Bio-era, Credit Suisse research Source: Bio-era, Credit Suisse research
Although output and capacity have grown exponentially over the past two years, comparing with 60,000 mn gallons of petro-diesel consumption in 2005, 75 mn gallons of biodiesel output was only a drop in the bucket. In order to promote the use of biodiesel, the USDA has offered grants for biodiesel production through the Commodity Credit Corporation (CCC), which provides a US$1.45-1.47/gallon and US$0.89-
Bio-era projects that North America’s biodiesel market
will reach 1 mn tons by 2010

Biofuel Sector 30 August 2006
30
0.96/gallon for soybean oil and tallow grease biodiesel production expansions in 2004-06, respectively. The transportation bill passed by the US Senate on 12 February 2004 includes exercising tax credit of US$1/gallon and US$0.50/gallon for biodiesel blending produced from virgin oil and non-virgin oil, respectively.
The EIA provides the lower and upper bound estimates for US biodiesel market. The lower bound estimate assumes the use of biodiesel only for government fleet whereas the upper bound assumes that biodiesel will be blended into ultra-low sulphur diesel at 1% by volume. EIA estimated that the lower and upper bounds for US biodiesel market are 6.5 mn gallons and 470 mn gallons by 2010, respectively.
In Canada, Halifax Regional Municipality has converted its bus fleet to allow for the use of biodiesel, with potential future demand of 7,500 m3 of B20. Ocean Nutrition of Mulgrave, Nova Scotia produces 6 mn gallons (23,000 m3) of fatty acid ethyl esters annually as a by-product of its Omega-3 fatty acid processing. Halifax-based Wilson Fuels converts the surplus into biodiesel. Quebec also produces around 35,000 m3 of biodiesel annually.
The biodiesel market in Latin America is currently still in its infancy and its growth is likely to lag behind global growth. D1 Oils reports that Brazil, after its success in building a leading position in ethanol production, is now aiming to become a biodiesel powerhouse. The Brazilian government’s National Biodiesel Programme has mandated a 2% biodiesel blend by 2008 and 5% by 2013.
Asia Asia is currently consuming more than 2 bn tons of fossil oil per year, and demand is expected to double by 2025. Consequently, Asian countries are currently confronted with worsening air pollution and greater reliance on imported oil. The recent increase in the price of fossil oil has been driving a boom in Asian biofuels production. Bio-era estimates that Asia’s biodiesel demand will increase from 100,000 tons in 2005 to 2.5 mn tons by 2010, representing a CAGR of more than 90%.
Figure 44: Asia's demand for biodiesel
Demand
(million tons)
0.1 0.20.4
0.7
1.3
2.5
0.0
0.5
1.0
1.5
2.0
2.5
3.0
2005 2006 2007 2008 2009 2010
CAGR of 90%
0.1 0.20.4
0.7
1.3
2.5
0.0
0.5
1.0
1.5
2.0
2.5
3.0
2005 2006 2007 2008 2009 2010
CAGR of 90%
Source: Bio-era, Credit Suisse research
The EIA estimates that thelower and upper bounds
for the US biodiesel market are 6.5 mn gallons and
470 mn gallons by 2010, respectively
Bio-era estimates that Asia’s biodiesel demand
will increase to 2.5 mn tonsby 2010, a CAGR of more
than 90%

Biofuel Sector 30 August 2006
31
The home for numerous indigenous oil-bearing crops, including palm, coconut and jotropha, which can be used as feedstock for biodiesel, Asia’s biodiesel production capacity is expected to grow rapidly. Bio-era estimates that Asia’s supply of biodiesel will increase from 100,000 tons in 2005 to 3.5 mn tons by 2010, representing a CAGR of more than 100%. By 2010, Asia is expected to export around 1 mn t.p.a. of biodiesel.
Figure 45: Asia’s supply of biodiesel Figure 46: Asia’s export of biodiesel
Supply
0.0
0.5
1.0
1.5
2.0
2.5
3.0
3.5
4.0
2005 2006 2007 2008 2009 2010
CAGR of 104%
0.0
0.5
1.0
1.5
2.0
2.5
3.0
3.5
4.0
2005 2006 2007 2008 2009 2010
CAGR of 104%
(million tons)
Export
(million tons)
0.0
0.2
0.4
0.6
0.8
1.0
1.2
2006 2007 2008 2009 2010
CAGR of 194%
0.0
0.2
0.4
0.6
0.8
1.0
1.2
2006 2007 2008 2009 2010
CAGR of 194%
Source: Bio-era, Credit Suisse research Source: Bio-era, Credit Suisse research
India While Asia has enjoyed strong economic growth in the past 50 years, the region is still confronted with significant poverty. Plantations of biodiesel feedstock provide the opportunity for these nations to enjoy economic improvements via the enhancement of their agricultural industries. One of the most attractive possibilities that has attracted the attention of D1 Oils plc is the plantation of Jatropha, especially in India. D1 Oils has formed a joint venture with Mohan Breweries (not listed) and distilleries, and has begun large-scale Jatropha cultivation in Tamil Nadu, Andhra Pradesh and Chattisgarh. In February 2006, Southern Online Biotechnologies (SOBT IN, Rs12.73, not rated), a Hyderabad-based company, started setting up a 10,000 t.p.a. biodiesel project in Chautupal, Nalgonda district, Andhra, Pradesh, with technology provided by Lurgi (not listed) of Germany. India exhibits significant potential for the plantation of Jatropha. The crop was introduced to India the 16th century by Portuguese traders. Indian agriculturalists are experienced in the science of Jatropha cultivation. Given that Jatropha requires minimal attention and can easily be intercropped, it provides India with a measure to confront its poverty issues.
Despite having some of the world’s leading technological services, more than 70% of India’s 1 bn people are dependent on agriculture, with farming contributing 25% of the country’s GDP. As rural poverty and unemployment are widespread, the need for sustainable agricultural development remains great. D1 Oil plc estimates that around 20 mn hectares of India’s 60 mn ha (representing 20% of the total national area) of waste and marginalised land that lay barren or underutilised can be used for Jatropha cultivation.
Bio-era estimates that Asia’s supply of biodiesel
will increase to 3.5 mn tonsby 2010, a CAGR of more
than 100%
D1 Oil plc estimates that around 20 mn hectares of
waste and marginalised land can be used for
jatropha cultivation

Biofuel Sector 30 August 2006
32
Production of biodiesel also allows India to reduce its high dependence on imported oil. The Indian government is introducing a US$300 mn programme to promote biofuel development and production, and is also mandating the blending of biodiesel with fossil diesel. The short-term target is to introduce a 5% blending into fossil diesel, which will be increased to 20% by 2020. A 5% blending will represent 2.5 mn tons of demand, whereas a 20% blend will introduce 16 mn tons of demand.
Figure 47: Estimated demand for biodiesel in India Diesel demand Biodiesel demand (mn tonnes) Year (mn tonnes) At 5% blending At 10% blending At 20% blending2003-04 44.51 2.23 4.45 8.902004-05 46.97 2.35 4.70 9.392005-06 49.56 2.48 4.96 9.912006-07 52.33 2.62 5.23 10.472011-12 66.90 3.35 6.69 13.382012-15 80.00 4.00 8.00 16.00Source: D1 Oil, Credit Suisse research
Philippines Another country that exhibits high suitability for the plantation of Jatropha is the Philippines. The Philippine government introduced the Philippines Clean Air Act in 1999 in order to reduce the nation’s dependence on imported oil as well as to improve its air quality. It also introduced the National Coconut Biodiesel Program, which aims to mandate all government vehicles to use a 1-2% coconut methylester blended biodiesel.
South-East Asia South-East Asian countries, while having enjoyed significant economic growth, are still heavily confronted by poverty issues. The available resources imply that these nations are capable of being a major feedstock producers and thus, biodiesel producers. Countries in this region has also started to recognise the importance of renewable energy and the role it plays in reducing dependence on imported oils as well as promoting higher air quality. The Thai government has legislated a 10% biodiesel blend to be introduced nationally from 2012 and is likely to increase the target to 20%. The Thai Ministry of Energy is now actively investigating the creation of a national biodiesel industry.
Malaysia and Indonesia, which house numerous palm oil crops, are expected to play a major role in the production of biodiesel. The increase in demand for palm oil from the biodiesel industry has been attributed as the driving factor behind the recent increase in the price of palm oil. However, the strategy to promote palm oil biodiesel has been criticised by environmental groups, who are concerned that the clearance of forest for oil-palm plantations could jeopardise the habitat of orang-utan and contribute to worsening air pollution.
The government’s short-term target is to introduce a 5% blending into fossil
diesel, which will be increased to 20% by 2020

Biofuel Sector 30 August 2006
33
Malaysia Caught in the euphoria, Malaysian companies have embarked on constructing biodiesel capacity to ride the biodiesel theme. The government has approved 52 biodiesel licences, with a cumulative capacity of 5 mn tons, but Malaysia’s current CPO inventory is only 1.65 mn tonnes. The food and biodiesel industries will compete directly for vegetable oil supply, leading to a rise in vegetable oil prices. These biodiesel plants are targeted for export, rather than for domestic use. We do not expect all 5 mn tonnes to come on stream. The capacity of 1 mn tonnes appears to be more concrete. For example, Carotech (CARO MK, RM0.985, not rated) and Golden Hope in Malaysia are already manufacturing biodiesel for export to Japan.
Figure 48: Selected biodiesel capacity in Malaysia Company Plant location Size (ton) Completion dateLipid Tech Sdn. Bhd Port Klang, Selangor 12,000 Jun-08Golden Hope Banting, Selangor 35,000 CompletedCarotech Chemor, Perak 48,000 n.a.Caratino (JV with MPOB) Pasir Gudang, Johor 60,000 CompletedGolden Hope (JV with MPOB) Carey Island, Selangor 60,000 1H07Golden Hope Pasir Gudang, Johor 60,000 2007IJM Plantations Sandakan, Sabah 90,000 4Q07PPB Group Pasir Gudang, Johor 100,000 early 2007SPC Biodiesel Lahad Datu, Sabah 100,000 end-2007Mission Biotechnologies Kuantan, Pahang 100,000 July 2007Global Bonanza Sdn Bhd Kuching, Sarawak 100,000 June 2007GS Palm Sdn Bhd Masai, Johor 100,000 3Q07Achi Jaya Plantations Segamat, Johor 100,000 end-2007Pacific Bio-Energy Sdn Bhd Lahad Datu, Sabah 100,000 n.a.Kulim (JV with Cremer) Pasir Gudang, Johor 100,000 2007Kulim (JV with Cremer) Singapore 100,000 2007Empee Industries Bhd Kuantan, Pahang 100,000 n.a.TSH Resources Sabah 100,000 n.a.Zurex Lahad Datu, Sabah 200,000 1Q08Himpunan Sari Sdn Bhd Kemamam, Terengganu 200,000 June 2007Source: Company data, MIDA, Credit Suisse estimates
Most Malaysian plantation companies embarking on new biodiesel plants have indicated that their biodiesel is earmarked for export, especially to the EU. However, this is the biggest risk to the biodiesel theme in Malaysia, as the latest European Parliament plenary session in Brussels emphasised that local cultivation of raw materials is needed to produce biofuels for heat and power, and has asked the ‘Commission to consider putting in place specific market access arrangements for biofuel imports from non-EU countries, such as Brazil, in the context of high environmental standards’. This suggests that the EU may restrict the import of palm-based biodiesel should it decide to protect its rapeseed farmers. (Bio-ethanol from Brazil has been slapped with a high import tax, making it unviable to be imported commercially.)
In addition, the campaign by non-governmental organisations (NGOs) against the activities of some palm oil plantations is obviously not helping. Although most of the Malaysian plantation companies are part of the Roundtable for Sustainable Palm Oil (RSPO), and palm oil plantations are old estates or logged-over land (and not virgin jungle), the NGOs are undertaking a very high-profile campaign to protest against the use of CPO. The Malaysian Palm Oil Promotion Council (MPOPC) issued a rebuttal, stating that Malaysia has put in place laws to encourage sustainability. In addition, the MPOPC has indicated that ‘in Malaysia, the areas converted to palm cultivation over the past two
The Malaysian governmenthas approved 52 biodiesel licences, with a cumulativecapacity of 5 mn tonnes, in
which 1 mn tonnes appears to be more
concrete, in our view
NGOs are campaigning against CPO

Biofuel Sector 30 August 2006
34
decades came from pre-existing rubber, cocoa and coconut farms, or from logged-over forests of areas zoned for agriculture’ and ‘the clearing of 500 hectares or more of land requires permission from the Malaysia Department of Environment and an environmental impact assessment study. In large areas of the country, jungle is not allowed to be cleared for palm cultivation. In cases where logged-over forests are converted to palm cultivation, strict regulations prohibit open burning and require careful treatment of logging debris. The industry uses environmentally sound practices in connection with fertilisation, pest control, land and crop management, and waste management’.
Although Malaysia has put in place sustainability codes, blanket statements, such as those highlighted in Figure 49, put pressure on the EU to curb the import of palm-based biofuel.
Figure 49: Pressure from NGOs
‘Travelling in a car fuelled by biodiesel seems like a great, environmentally friendly thing to do. However, if the biodiesel has come for soya planted in the Brazilian Amazon or palm oil from Indonesia, the green consumer is likely to be unwittingly driving another nail into the coffin of the world’s great ecosystems.’ – Ariel Brumer, BirdLife
‘Large-scale biomass plantation projects like the massive planned palm plantation in Kalimantan, Indonesia, entail the destruction of vast swathes of rainforest. This not only affects valuable ecosystems, but contributes to climate change, as the rainforests are an important carbon sink.’ – Jean-Philippe Denruyter, Climate Change and Energy Policy Officer, WWF
Source: BirdLife, WWF
Having highlighted the risk to palm-based biodiesel, we remain bullish on CPO prices for four main reasons: 1) rising crude oil prices have spurred the use of CPO as a biofuel, 2) the substitution effect, 3) Malaysia’s biofuel policy and 4) biodiesel exports to the rest of Asia Pacific.
Rising crude oil prices spurred use of CPO as a biofuel Figure 50: Crude oil is more expensive than CPO
0102030405060708090
100
Jan 91 Jan 94 Jan 97 Jan 00 Jan 03 Jan 06
Crude palm oil Crude soy oil Crude oil (Tapis)
(US$/barrel)
Source: Bloomberg, Credit Suisse research
We are bullish on CPO prices, as CPO is now
used as a biofuel due to rising crude oil prices

Biofuel Sector 30 August 2006
35
Crude oil prices have hit historical highs of over US$77 per barrel. Based on our estimates, crude oil prices are now far more expensive than palm or soy oil. It is obvious that economically, it now makes a lot of sense to use palm oil rather than crude oil whenever possible, for example in stationary engines such as power generators and power plants. In short, we believe that if crude oil prices remain high, governments around the world will expedite their renewable energy plans to diversify their fuel sources.
In addition to the potential of biodiesel in the EU, there is growing demand for bio-energy (biofuel for power plants), which is relatively unknown within the investment community.
As underlined in the Commission’s Green Paper on Security of Energy Supply, the EU’s objective is to reach a share of 12% (including wind, solar, hydro, biomass and biodiesel) for the contribution of renewable energy sources to the EU’s gross inland consumption by 2010. In order to reach this target, major legislative proposals have been adopted. The ‘Directive on Renewable Energies’ adopted in 2001 provides for an overall EU indicative target of 22% by 2010, from the current level of about 14%, for the share of renewable energy sources of the EU’s electricity consumption. The directives allow each member country to decide how to achieve the indicative national targets.
The main drivers include the move to reduce carbon dioxide emissions, enhance sustainability, reduce the EU’s dependence on imported energy sources and increase diversification of fuel supplies.
This suggests that the potential market for biomass (including vegetable oils) is 130 mn t.p.a. However, the palm-based fuel for bioenergy is not commercially viable without subsidies. The subsidies differ for every EU country, and can be as high as 200% of electricity prices and fixed for as long as 10-20 years. As palm-based biodiesel is not significant at the moment, we believe that the sharp 19% jump in CPO exports to the EU in 2005 was actually channelled into the bio-energy sector. It is estimated that some 600,000-750,000 tonnes of CPO were used in the renewable energy sector in 2005. Industry experts believe that this figure will grow to 1 mn tonnes in 2007.
Figure 51: Exports of Malaysian CPO to the EU (6 mma)
100,000
120,000
140,000
160,000
180,000
200,000
220,000
240,000
260,000
280,000
Jul 9
8
Jan
99
Jul 9
9
Jan
00
Jul 0
0
Jan
01
Jul 0
1
Jan
02
Jul 0
2
Jan
03
Jul 0
3
Jan
04
Jul 0
4
Jan
05
Jul 0
5
Jan
06
(tonnes)
Source: SGS, Credit Suisse research
CPO is now cheaper than crude oil
The EU is driving the renewable energy policy
The aim is to reduce EU’s dependence on imported
energy sources
The 19% jump in CPO exports to the EU in 2005
was probably for biofuel

Biofuel Sector 30 August 2006
36
Figure 52: Subsidy regimes for the renewable energy sector in key EU countries Netherlands Italy Belgium Germany UK Spain EUSubsidy regime (€/MWh) 60-97 110 80-120 80-120 60-80 60-70 60-120Electricity prices (€/MWh) (2006 base load) 58 60 53 54 70 55 53-70Target renewable electricity as % of total in 2010 9 25 6 12 10 30 21Total current installed capacity (MW) 20,000 65,000 9,000 120,000 78,500 58,000 655,000Source: BIOX, Credit Suisse research
Figure 53: Renewable energy in the EU in 1999 (achieved) and targets for 2010
15
10 13 145
19 16
4
31
3
146
28
1320
2821
136 9
39
60
10
2212
70
46
20
25
78
32
0
10
20
30
40
50
60
70
80
90
Belgi
um
Denm
ark
Germ
any
Gree
ce
Spain
Fran
ce
Irelan
d
Italy
Luxe
mbo
urg
Neth
erlan
ds
Aust
ria
Portu
gal
Finla
nd
Swed
en UK
EU-1
5
(%)
Source: BIOX, Credit Suisse research
Substitution effect Even if CPO is not used directly to manufacture biodiesel, CPO prices should benefit indirectly, due to the substitution effect. All vegetable oil prices move in tandem with one another, although there are varying premiums and discounts between the different vegetable oils. The economics are simple: if the price of one vegetable oil rises too much relative to other vegetable oils, importers will switch to a cheaper alternative. We show that (Figure 136), historically, this relationship has held true, although occasionally there is a short-term divergence. Therefore, should soy and rape oil prices rise significantly (due to high demand for their biodiesel), then CPO prices should follow suit.
Biodiesel exports to the rest of Asia Pacific Due to logistical reasons, the biodiesel market is expected be quite fragmented – in short, soy-based biodiesel or corn-based bioethanol is likely to be utilised in the Americas, while rape seed-based biodiesel will be dominant in the EU and palm-based biodiesel will be dominant in Asia. In addition, palm-based biodiesel is the most logical choice for Asia as: 1) it is the cheapest vegetable oil and, therefore, the lowest priced feedstock and 2) the oil yield for palm oil is about 5-6 tonnes per hectare (the highest among the oil crops) and therefore, it is found in plentiful amounts.
Substitution effect – CPO prices move in tandem
with other vegetable oils
Many Asian countries are signatories of the
Kyoto Protocol

Biofuel Sector 30 August 2006
37
It is interesting to see that many Asian countries are signatories to the Kyoto Protocol (including Japan, Singapore, Korea, China and India). Some governments have already announced their biofuel policies, which should be positive for CPO in the medium and long term, as this will soak up more vegetable oil inventories.
Although some countries have mentioned the commercialisation of Jatropha as a feedstock for biodiesel, we believe that it is not a threat in the short term, as: 1) it is not yet a commercial crop, hence, it will take time to bulk up production, 2) its yields in the first three years are very low and 3) its oil yields are supposedly less than 2 tonnes per hectare versus palm oil’s yield of 5-6 tonnes per hectare.
CPO prices of RM1,800/tonne in FY08 Based on our Malaysian analyst, Tan Tingmin’s research, our CPO price assumption is raised to RM1,800 in FY08E, up from the previous forecast of RM1,650/tonne, with the view that there will be short-term shortages of CPO supply during late 2007 and going into 2008, once the new biodiesel capacity comes on stream. The demand-supply dynamics clearly suggest that there is upside to CPO prices. Our CPO forecasts for FY06 and FY07 remain unchanged at RM1,400-1,450/tonne and RM1,650/tonne, respectively.
Figure 54: Profit sensitivity for every RM100/t increase in CPO (%) FY07 FY08IOI Corp 6.1 5.7KLKepong 8.8 7.9Golden Hope 12.3 9.8Astra Agro 9.1 10.5London Sumatra 5.3 5.2Source: Company data, Credit Suisse estimates
Figure 55: New target prices and ratings Rating Sh. price Target price (RM) New forecasts (RM mn) P/E (x) New Previous (RM) New Previous FY06E FY07E FY08E FY06E FY07E FY08EIOI Corp. NEUTRAL Underperform 16.3 17.00 14.70 847.6 1,079.8 1,211.5 22.4 17.8 16.0 KLKepong OUTPERFORM Outperform 11.4 15.50 11.70 459.5 588.4 720.1 17.7 13.8 11.3 Golden Hope OUTPERFORM Neutral 4.42 5.40 4.70 279.4 455.3 594.6 22.5 13.8 10.6 Source: Company data, Credit Suisse estimates
We are now at the top of the market consensus figures and 5-27% above market consensus figures for FY07 and FY08.
Figure 56: Credit Suisse is at the top of the market consensus figures Credit Suisse forecasts (RM mn) Market consensus (RM mn) Credit Suisse vs market consensus (%) FY06E FY07E FY08E FY06E FY07E FY08E FY06E FY07E FY08EIOI Corp. 847.6 1,079.8 1,211.5 867.04 1,082.43 1,156.2 -2 0 5KLKepong 459.5 588.4 720.1 462.14 544.01 601.3 -1 8 20Golden Hope 279.4 455.3 594.6 299.73 415.36 467.42 -7 10 27Source: Company data, Credit Suisse estimates
Japan and Korea are likely to be big markets for
Malaysian biodiesel
Jatropha is not a threat in the short term, in our view
Revised up FY08 CPO price assumption to
RM1,800 …
… leading to earnings, target price and rating
upgrades
Top end of consensus

Biofuel Sector 30 August 2006
38
Valuation comparison Figure 57: Valuation comparison of plantation stocks under Credit Suisse coverage (calendarised) Price P/E (x) EV/EBITDA (x) P/B (x) Two-year Company (RM) 2004 2005 2006E 2007E 2004 2005 2006E 2007E 2004 2005 2006E 2007E CAGR (%)IOI Corp 16.20 22.2 22.7 22.7 18.0 15.7 15.4 14.4 12.1 3.8 3.4 3.2 2.9 12KLK 11.50 19.5 20.6 18.0 13.3 12.6 12.9 11.0 8.2 2.0 1.9 1.7 1.5 24Ghope 4.82 16.3 21.1 19.8 13.3 12.6 14.2 13.7 9.0 1.1 1.2 1.3 1.2 26Astra Agro 8400 16.5 16.7 13.3 11.1 9.0 9.6 7.8 6.3 6.4 5.0 4.3 3.5 23London Sumatra 4700 -25.9 14.5 16.3 13.9 11.2 10.7 8.2 7.2 6.7 4.6 3.5 2.9 2Source: Company data, Credit Suisse estimates
Figure 58: Valuation comparison of large-cap plantation stocks (based on market consensus) Share price Market cap 6 mth avg. vol. P/E (x) BVPSCompany Year-end (RM) (RM mn) (mn shares) 2005 2006E 2007E 2008E (RM) P/B (x)IOI Corp Jun-06 16.20 19880 2.02 20.1 22.5 17.6 16.5 4.99 3.2Kuala Lumpur Kepong Sep-06 11.50 8265 1.10 19.9 19.9 17.7 14.9 6.12 1.9Golden Hope Plantations Jun-06 4.82 6890 1.13 11.4 23.0 16.6 14.6 3.50 1.4Kumpulan Guthrie Dec-06 3.74 3818 0.40 74.8 74.8 26.7 22.0 2.99 1.2Highlands & Lowlands Dec-06 4.60 2780 0.15 20.9 n.a. n.a. n.a. 4.31 1.1Batu Kawan Sep-06 9.30 2695 0.17 11.9 n.a. n.a. n.a. 7.75 1.2PPB Oil Palms Dec-06 8.00 3541 0.50 25.8 21.6 17.0 14.8 3.07 2.6Asiatic Development Dec-06 3.76 2809 0.82 16.3 15.0 13.4 13.0 2.24 1.7United Plantations Dec-06 8.30 1728 0.07 13.0 n.a. n.a. n.a. 4.82 1.7Boustead Holdings Dec-06 1.91 1149 0.31 7.6 n.a. n.a. n.a. 1.48 1.3Kulim Malaysia Dec-06 4.24 1116 0.34 30.0 n.a. n.a. n.a. 9.97 0.4IJM Plantations Mar-06 1.67 849 1.04 21.0 20.9 13.9 13.9 1.07 1.6Source: Thompson estimates, Credit Suisse estimates
Figure 59: Absolute and relative performances of the Malaysian plantation stocks Absolute performance Relative performance 1M 3M 6M YTD 1M 3M 6M YTDIOI Corp 3.2 11.7 17.4 30.6 1.0 9.5 15.2 24.4Kuala Lumpur Kepong 7.4 17.2 24.7 38.1 5.1 14.9 22.4 31.5Golden Hope Plantations 11.0 12.6 15.2 21.6 8.6 10.3 13.1 15.8Kumpulan Guthrie 36.0 42.1 60.2 55.6 33.0 39.3 57.2 48.1Highlands & Lowlands 9.5 11.1 8.5 10.0 7.2 8.9 6.5 4.8Batu Kawan 13.5 17.8 16.4 22.5 11.0 15.5 14.2 16.6PPB Oil Palms 8.2 22.3 54.4 69.9 5.8 19.9 51.5 61.7Asiatic Development 10.6 21.3 37.7 74.9 8.2 18.9 35.2 66.5United Plantations 7.8 9.2 17.7 17.7 5.5 7.1 15.5 12.1Boustead Holdings 4.3 -2.0 1.6 8.5 2.1 -4.0 -0.3 3.3Kulim Malaysia 10.5 35.3 61.6 81.4 8.1 32.6 58.6 72.6IJM Plantations 5.8 17.1 45.1 49.1 3.5 14.8 42.4 41.9Source: Bloomberg, Credit Suisse research
Close correlation The KL Plantation Index’s relative performance historically shows a very tight correlation with CPO prices. The correlation factor was 83% between 1993 and 2005. As we believe that CPO prices are likely to rise in 2007 and beyond and that the sector will be rerated upwards, plantation stocks should continue to outperform.
The KL Plantation Index has outperformed the KLCI tremendously beyond 2005. This outperformance was not driven by CPO prices, but diverged to correlate with rising crude oil prices. This is justifiable, in our view, as the marginal buyers of CPO will be the biodiesel plants, which are dependent on crude oil prices. Since 1 January 2005, the
Close correlation between CPO prices and stock
performance
Since mid-2004, oil prices have had a major influence

Biofuel Sector 30 August 2006
39
MSCI oil/gas and consumables index has risen by 48%, while the KL Plantation Index has risen by a similar magnitude of 46% in the same period.
Figure 60: CPO prices and relative performance of the KL Plantation Index
-20
0
20
40
60
80
100
120
140
Dec 92 Mar 94 May 95 Aug 96 Oct 97 Jan 99 Apr 00 Jun 01 Sep 02 Dec 03 Feb 05 May 06
-
500
1,000
1,500
2,000
2,500
3,000
CPO prices in Ringgit
Plantation index relativ e performance against KLCI (RM/t)
Source: Bloomberg, Credit Suisse research
Indonesia Similar to Malaysia, currently most of Indonesian biodiesel-related companies are palm oil producers and/or refinery companies. And given the increasing domestic demand, combining with the international market, even under conservative CPO demand growth assumptions of 5% p.a. (an historical demand CAGR of 7.9% from 1993 to date), total CPO demand would double by 2020 (Figure 61).
Figure 61: Palm oil demand growth scenarios
Consumption (mn tonnes) Conservative (@ 5%) Sustained growth (@ 7%) Optimistic (@10%)
Consumption (mn tonnes)
-
50
100
150
200
250
93A 95A 97A 99A 01A 03A 05E 07E 09E 11E 13E 15E 17E 19E 21E 23E 25E
Optimistic demand growth (10% CAGR)
Sustained demand growth (7% CAGR)
Conservative demand growth (5% CAGR)
Historical consumption growth rate1993 - 2005: 7.9% CAGR
-
50
100
150
200
250
93A 95A 97A 99A 01A 03A 05E 07E 09E 11E 13E 15E 17E 19E 21E 23E 25E
Optimistic demand growth (10% CAGR)
Sustained demand growth (7% CAGR)
Conservative demand growth (5% CAGR)
Historical consumption growth rate1993 - 2005: 7.9% CAGR
Source: Oil World, Credit Suisse estimates
Total CPO demand could double by 2020

Biofuel Sector 30 August 2006
40
With net export earnings of over US$4 bn, domestic consumption of over 3.0 mn tonnes and rising potential as source of energy, palm oil should continue to play a critical role in Indonesia’s economy. Dominated by private companies, however, the sector is very opaque, especially when compared with Malaysia’s.
Figure 62: Indonesia palm oil value chain and major players
PlantationsCPO produced: 12.5 mn tonnes
Major players (‘000 ha)RGM Group 318Sinar Mas Group 287Astra Agro 209Guthrie (Indonesia) 163Government 677Total – Indonesia 5,597
Refineries/oleochem.CPO processed: 9.3 mn tonnes
Major refineries (‘000 tpa)Wilmar 3,454Musim Mas 1,760Total – Indonesia 11,434Major oleochemical cos.Musim Mas/Cisadane Raya/ Sumi Asih/Sinar Mas/Darmex
End customerConsumed (globally): 33 mn tonnes
Major destinations (‘000 t)Domestic 3,149India 2,762China 1,084Netherlands 800Malaysia 573Indonesia supply 11,811
Biodiesel Producers
Major players (‘000 tpa)Wilmar 250Eterindo Group 240RGM / Sinar Mas/Bakrie Sumatera/ Musim Mas/Darmex Oil (100 ea.)
Traders/distributors
Major playersPrivate companies – Wilmar / Cargill / Gardener Smith / GuthrieGovt. – KPB / Bulog / Pertamina
Trading companies are major customers of plantations for domestic and exports sales
3.2 mn tonnes of CPO sold (2005) primarily through
traders
RBD oleins supply for methyl ester (biodiesel)
Direct supply likely given small scale
Smaller potential sale of CPO / oleins directly by
plantations
Govt. blue print estimates 0.72 mn litres of biodiesel annual local
sales (2005-10) primarily through Pertamina
Some direct CPO purchases by refineries /
oleochem
Some direct sales including branded
cooking oils
Traders also supply CPO to refiners/oleochem.
Finished goods
Plus biodiesel and refined products
Pertamina for dom
estic
Traders for exports
Direct exports to EU / Asia
Note: Unless stated otherwise, estimated figures are for 2005; plantation area represents planted palm plantations including plasma and is in thousand hectares (ha); refining and biodiesel capacities are expressed in tonnes per annum (tpa); domestic consumption and Indonesian exports data is for 2004 Source: Company data, BPS, DG Estate Crops, CIFOR, GAPKI, Binis Indonesia, Credit Suisse research
Based on our Indonesian analyst, Haider Ali’s research, we estimate that the plantation and biodiesel sectors present the highest margin and value added within the palm oil sector (Figure 63). However, biodiesel volumes are likely to remain small for now in comparison to existing business. Oleochemical and refining companies could emerge as the surprise winners on potentially higher margins.
Figure 63: Credit Suisse estimates for potential value added by the palm oil sub-sectors (US$/tonne) Est. input costs Est. output prices Est. value added Remarks Plantations 250 - 350 450 100-200 Major beneficiaries of CPO price outlook; we favour efficient producers Refineries/oleochemical 450 490 30-100 Best positioned for expansion into biodiesel; margin expansion likely Distributors/traders Not known Not known Not known Opaque and fragmented sector; proprietary trading could be lucrative Biodiesel producers 490 840 350 Secure feedstock supply to differentiate operations and profitability Source: Credit Suisse estimates

Biofuel Sector 30 August 2006
41
Plantations – primary beneficiary of rising demand/prices Indonesian palm plantations have come a long way since the Dutch first introduced the crop in 1870. Today, Indonesia has the largest planted landbank of oil palms in the world, and is on the verge of overtaking Malaysia as the largest global supplier of palm oil.
Figure 64: Indonesian production catching up with Malaysia Figure 65: Rapidly improving average oil yields in Indonesia
0
2
4
6
8
10
12
14
16
90 91 92 93 94 95 96 97 98 99 00 01 02 03 04 05
Indonesia Malay sia
CPO production (mn tonnes)
0.0
0.5
1.0
1.5
2.0
2.5
3.0
3.5
4.0
98 99 00 01 02 03 04
Indonesia Malay sia
CPO y ield (tonne/ha)
Source: BPS, GAPKI, MPOB, Credit Suisse estimates Source: BPS, MPOB, Credit Suisse estimates
Average CPO production yields have been rapidly improving in Indonesia, partly with maturing plantations entering peak production cycles and partly because of improved agricultural practices by the plantation companies. Together with this yield improvement, rapid growth in terms of the planted area is fuelling Indonesian CPO production growth.
Figure 66: Indonesian palm oil plantation area by producer categories (’000 ha) Plantation category 1998 1999 2000 2001 2002 2003 2004 2005 CAGR (%)Smallholders 891 1,041 1,167 1,561 1,808 1,854 1,905 1,917 11.6Government 557 577 588 610 632 663 675 677 2.8Private 2,113 2,284 2,403 2,542 2,627 2,766 2,821 3,003 5.1Total 3,560 3,902 4,158 4,713 5,067 5,284 5,401 5,597 6.7Mature plantations 2,068 2,397 2,518 2,956 3,307 3,429 3,732 3,784 9.0Immature/others 1,492 1,505 1,640 1,757 1,760 1,855 1,668 1,814 2.8Source: BPS, Directorate General Estate Crops, Credit Suisse estimates
Formal private sector plantations continue to dominate, with a 54% share of total planted area in 2005. Planted area classified as under smallholders showed strongest growth, at an 11.6% CAGR since the 1997 financial crisis. This category also includes those smallholders associated with large plantation companies, which are known as ‘plasma’, under a scheme first introduced in 1979. Under this scheme, private developers prepare land for nearby smallholders, who retain the land rights. In return, the smallholders are obliged to sell their fresh fruit bunches (FFB) to the developer through a transparent, pre-determined pricing formula, which is linked to the CPO market price. In the past, the government channelled soft term loans through commercial banks to facilitate the plasma scheme, although this practice has since been discontinued. Some developers still prefer to engage local communities through a plasma programme in order to maintain good community relations. Typically, plasma accounts for 20-30% of a developer’s total planted area. Major plantation companies are listed in Figure 67.
Indonesia may overtake Malaysia as the largest
global palm oil producer
Growing planted landbank and improving CPO yields underlying volume growth
Plasma scheme may havefuelled growth in
smallholders’ landbank

Biofuel Sector 30 August 2006
42
Figure 67: Landbank and planted area of major plantation companies in Indonesia Landbank and Percent of co. Percent of plantation area (’000 ha) landbank (%) total Status/ Palm Other Other Total Plasma IndonesiaCompany/group ticker planted planted land landbank (incl.) Plasma Plantation (%)Raja Garuda Mas Privately held 317.9 n.a. n.a. n.a. n.a. n.a. n.a. 5.7Sinar Mas Group SMAR IJ/ GGR SP 287.0 n.a. n.a. n.a. n.a. n.a. n.a. 5.1Astra Agro AALI IJ 208.6 2.8 30.0 241.4 53.7 22 88 4.3Guthrie - Indonesia KGB MK 163.0 1.2 52.7 216.9 n.a. n.a. 76 3.9London Sumatra LSIP IJ 91.2 27.3 29.8 148.2 35.9 24 80 2.6Wilmar International WIL SP 81.9 1.9 25.4 109.3 38.1 35 77 2.0Indofood INDF IJ 60.0 n.a. 35.0 95.0 n.a. n.a. 63 1.7Dutapalma Nusantara Privately held 40.0 - 20.0 60.0 n.a. n.a. 67 1.1Tunas Baru Lampung TBLA IJ 39.5 1.9 22.2 63.7 24.5 38 65 1.1Socfindo (Bollore Group) Privately held 37.7 10.3 - 48.0 n.a. n.a. 100 0.9Bakrie Sumatera UNSP IJ 31.7 19.2 75.5 126.3 12.5 10 40 2.3Government plantations Privately held 677.0 n.a. n.a. n.a. n.a. n.a. n.a. 12.1Other plantations Privately held 3,206.3 57.3Total plantation area 5,597.0 100.0Source: Company annual reports and websites, Directorate General Estate Crops, BPS, Binis Indonesia, Investor Daily, Credit Suisse estimates
Malaysian plantation companies have also been increasingly active in Indonesia, given the limited availability of new development land in Malaysia itself. Amongst these, Kumpulan Guthrie Bhd (KGB MK, RM3.38, not rated) has been notable for its aggressive expansion in Indonesia through the acquisition of Minamas (not listed), a plantation holding formerly controlled by the Salim group (not listed), in 2000.
Figure 68: Malaysian plantation companies with major presence in Indonesia (’000 ha) Indonesia Malaysia Other countries Total landbank Indonesia as % of totalCompany Ticker Palm planted Total Palm planted Total Palm planted Total Palm planted Total Palm planted TotalGuthrie – Indonesia KGB MK 163.0 216.9 100.9 105.4 - - 263.9 322.4 62 67Golden Hope GHP MK 12.8 18.2 156.5 179.8 - - 169.3 198.0 8 9KLK KLK MK n.a. 45.7 n.a. 102.2 n.a. 8.4 121.0 150.5 n.a. 30PPB Oil PBOB MK 23.7 283.2 62.6 80.0 - - 86.4 363.2 28 78Kulim Malaysia KUL MK 29.8 97.3 30.2 31.5 38.6 51.0 60.0 179.8 50 54Source: Company annual reports, Credit Suisse estimates
It is worth noting that well over 50% of the total landbank of the three listed Malaysian plantation companies is located in Indonesia. Even 30% of Kuala Lumpur Kepong’s landbank is in Indonesia. We believe that the trend of increasing participation by the Malaysian companies in Indonesia is likely to continue, which could lead to further narrowing of the valuation gap between Indonesian and Malaysian listed plantation companies.
Some estimates by the government and non-governmental organisations place the average production cost for Indonesian palm oil plantations at about US$250/tonne. We estimate the total cost of goods sold at US$245/tonne for Astra Agro, assuming a US$:Rp exchange rate of Rp9,100. This is a simplified estimate, as Astra Agro also produces refined palm oil and palm kernel oil products in addition to CPO. Our estimated value added range for the sector is based on the above estimates and a subjective allowance for less efficient plantations.
Malaysian companies’ growth in Indonesia will
continue and may further narrow the valuation gap
We favour low-cost producers within the wide range of US$100-200/t of
potential value added

Biofuel Sector 30 August 2006
43
Refineries and oleochemicals – positive surprise? We estimate Indonesia’s total palm oil refining capacity at 11.4 mn t.p.a., based on a bottom-up estimation detailed in Figure 70. Many of the major refining companies, such as Wilmar International (WIL SP, S$1.22, not rated), Musim Mas (not listed) and Sinar Mas group (not listed), are also active in oleochemicals.
Two notable exceptions to this norm are the major consumer products companies, Indofood Sukses Makmur (INDF IJ, Rp11,00.0, OUTPERFORM, TP Rp1,250.0) and the Wings Group (not listed). Indofood focuses primarily on plantation and refining (cooking oil), while Wings is a major oleochemical producer (soaps/detergents).
We expect integrated players to be active in biodiesel, given their access to feedstock (RBD olein) and familiarity with processing technologies. Most of the major companies, including Wilmar, Musim Mas, Sinar Mas, Darmex Oil (not listed), have already announced their plans to build biodiesel plants. One company, Eterindo Wahanatama (ETWA.JK, Rp235.00, not rated) is already producing biodiesel in Indonesia by modifying some of its existing plants.
We use the price differential between RBD oleins and CPO prices as a proxy by which to estimate the average value added for this segment. Since 2000 to date, the average spread was US$30/tonne, with a peak of US$62/tonne. The wide product range for this segment renders it difficult to accurately estimate the value added; our estimate of US$30-100/tonne is based on the RBD olein price spread plus an allowance for higher value added for complex chemicals and branded products (e.g., cooking oils/soaps).
Figure 69: RBD olein vs CPO price differential – potential for margin expansion?
0
10
20
30
40
50
60
70
2000 2001 2002 2003 2004 2005 2006
0
100
200
300
400
500
600
Est. value add (US$/tonne) - left axis
RBD Olein price - right
CPO price - right
Est. v alue add (US$/tonne) CPO / RBD olein price (US$/tonne)
Note: CPO price denotes MPOB CPO FOB spot price converted to US dollars; RBD olein price denotes MPOB FOB spot price in US dollars for exports Source: Bloomberg, MPOB, Credit Suisse estimates
The advent of biodiesel could lead to a significant expansion in this segment’s value added (and margins) through either expansion into biodiesel or because of appreciating feedstock (RBD olein) prices and margins, and represents a key risk for standalone biodiesel companies.
Production cost and pricing – estimated US$30-
100/tonne value added

Biofuel Sector 30 A
ugust 2006
44
Figure 70: Estimated palm oil refining capacity in Indonesia Annual capacity (’000 tonnes) Company/group Status 1995 1997 2000 2005 Remarks Musim Mas Group/ Karim family Privately held 877 1,759 1,759 1,760 Said to operate largest CPO refinery in the world; Musim Mas is amongst the most integrated
palm oil companies in Indonesia. It is expanding oleochemicals facilities would potentially become the second largest globally after Sime Darby (SIME.KL, RM5.75, NEUTRAL, TP RM7) in 2006. Various press reports suggest total revenues estimated to be approaching US$1 bn
Wilmar Int’l/ Kuok Family and ADM (USA)
Singapore listed (WIL SP) 25 1,324 1,562 3,454 Also known as Bukit Kapur in Indonesia, Wilmar is expected to expand total refining capacity to 5 mn tonnes p.a. in 2006 with construction already underway. Amongst the largest CPO refining group, may also venture in biodiesel. Plantation landbank estimated at under 100,000 ha
Hasil Karsa/ Panin Group Private; Panin Group assets included listed bank and insurance companies in Indonesia
962 962 962 962 The company may be operating old equipment with minimal reinvestment. Actual realizable capacity maybe 1000 tpd. Non-core business for Panin Group, primarily in financial services
Sinar Mas Group/ Widjaja Family Listed cos. include SMART (SMAR IJ), Golden Agri (GGR SP) and Asia Food and Prop. (AFP SP). Also own Asia Pulp & Paper
632 822 840 840 Annual capacity est. @ 2,800 tpd at 300 days/year; Realisable capacity maybe higher. Multiple listed companies holding plantation assets incl.: Asian Food & Properties (Singapore), Golden Agri (Singapore) and PT SMART (Indonesia). One of the largest business groups in Indonesia
Indofood/ Salim Group Jakarta listing (INDF IJ); Salim group also owns other plantation and oleochemical assets privately.
465 570 570 630 Flagship company of the Salim group. Major plantations of Salim group (200,000 hectares) were sold to Guthrie in 2001, excluding plantation and refining assets of Indofood. Salim also privately owns additional oleochemical, plantation and possibly refining units outside Indofood. Indofood's stated capacity is 2,100 tpd; annual estimate at 300 days
Berlian Eka Sakti Tangguh Private company 431 431 No information available on this group. We have assumed that refining capacity to remain flat at the last reported estimate as of 2000
Tunas Baru/ Sungai Budi Group Jakarta listing (TBLA IJ); Sungai Budi also owns other food and chemicals businesses
100 270 480 Integrated producer with approximately 40,000 hectares of plantation plus refinery plant held under Tunas Baru. The group also active in chemical trading and manufacturing under Budi Acid Jaya (listed)
Perkebunan Nusantara/ Government of Indonesia
Unlisted state-owned enterprises 385 385 Fourteen state-owned plantation companies were restructured into three main holding companies, known as PTPNs. The refining capacity estimate could not be verified (we tracked 650 tpd; rest may be held through other entities); maintaining at 2000 reported estimate
Raja Garuda Mas (RGM) Group/ Sukanto Tanato
Privately held; RGM group also owns APRIL, a major paper and pulp business
346 346 780 Amongst the largest business groups and plantation companies with reported landbank of 317,000 ha. Company’s website reports refining capacity of about 1 mn tpa; last published estimate was 780,000 tpa
Bakrie Sumatera/ Bakrie Group Jakarta listing (UNSP IJ) 12 12 One of the largest Indonesian business families with ambitious expansion plans. Management guidance is total palm planted area to expand to 50,000 ha in three years
SCOFINDO/ Bollore Group Privately held; Bollore listed on EURONEXT 112 112 Almost a showcase 48,000 ha palm and rubber plantation in Indonesia. One of three certified palm seed producers. Amongst the top 250 European businesses, the group is majority controlled by Bollore family
Cahaya Kalbar Group/ Wilmar International
Jakarta listing (CEKA IJ) –limited free float Wilmar acquired maker of confectionary specialty oils, Cahaya Kalbar in 2005. Growth through acquisition of downstream assets has been a key part of Wilmar growth strategy. Now planning for a biodiesel plant
Cisadane Raya Group Privately held 180 180 Privately held with an integrated strategy. Also operates 120,000 tpa oleochemical plant. Established in 1975 but exact date of refining and downstream operations not verified (assumed operational in 2000)
Darmex Oil & Fats/ Dutapalma Group
Privately held 390 390 Privately held plantation and refining company with 60,000 ha palm plantation and 1,300 tpd CPO refinery; established in 1987 but the date of refining operations not verified (assumed operational in 2000)
Unifractum/ Bambu Mas Privately held 143 143 143 Privately held not much information available Others n.a. 225 876 876 876 We have maintained ‘others’ estimate flat at 876,000 tonnes. It is quite possible that this
segment would have grown although earlier difficult operating environment and acquisitions by larger groups (e.g. Wilmar) may have checked rate of growth. Best estimate at present
Total refining capacity 3,185 6,902 8,838 11,434 Best estimate for refining industry capacity; may be understated Total CPO processed 3,180 3,932 5,385 9,260 For both domestic consumption and exports Implied capacity utilisation (%) 99.8 57.0 60.9 81.0 Implied capacity utilisation rate for the industry
Source: Company data, GAPKI, CIFOR, Binis Indonesia, Investor Daily, Credit Suisse estimates

Biofuel Sector 30 August 2006
45
Distributors – opaque industry presents opportunities The distribution of palm oil products in Indonesia is dominated by privately held in-house and government-owned operations. The resulting wide range of opaque business models renders analysis of the value added difficult, if not impossible. While the traditional business model of high-volume, low-margin could be the dominant form of operations, there are a few interesting exceptions.
The government operations of Bulog (a state-owned logistics company) and Joint Marketing Office are effective means of controlling the supply of essential commodities, such as cooking oil, rice and sugar. In times of scarcity, these agencies were directed to supply subsidised goods to nationwide retail outlets. These operations may effectively deter entry of a private sector distribution company in this space. Some consumer companies (e.g., Indofood) maintain their in-house distribution channels, whereas private companies are generally more active in bulk trade, including exports.
Wilmar is one of the largest traders of palm and vegetable oil in the region. Its trading and integrated production facilities arguably could place Wilmar in a unique position to profit from the very opaque nature of Indonesia’s contribution to global supply.
Biodiesel – the new ‘new thing’ On 20 May 2006, Pertamina started to distribute ‘Bio Solar’, a 5% biodiesel mix (B5), at selected pumps in Jakarta. Public reaction has been enthusiastic, and Pertamina is now expanding Bio Solar distribution to more locations in Jakarta and Surabaya. The company is targeting monthly distribution of 2,000-3,000 tonnes of Bio Solar in Jakarta and 1,000-1,500 tonnes in Surabaya by the end of 2006. Annualised demand for Bio Solar of about 36,000 tonnes in 2006 is expected to grow to 620,000 tonnes in 2010 and 1.3 mn tonnes by 2015. The pump price of Bio Solar is the same as that for automotive diesel oil (ADO).
Figure 71: Estimated domestic biodiesel demand and implied incremental palm oil demand For the year ending Biodiesel demand estimates Implied annual palm31 December Monthly (tonnes) Annual (’000 tonnes) Annual (mn litres) oil demand (’000 tonnes)2006E 3,000 36 42 372010E 52 619 720 6382015E 108 1,290 1,500 1,3302025E 337 4,042 4,700 4,167Note: Based on 1 kilolitre = 0.86 tonnes of biodiesel and 97% conversion factor for palm oil into biodiesel Source: Pertamina, PT Eterindo Wahanatama Tbk, MESDM energy blueprint, Credit Suisse estimates
Indonesian policy calls for the distribution of fatty acid methyl ester (FAME)-based biodiesel, which complies with both US (ASTM D6751) and European (EN 14214) standards. In its pure form (B100), biodiesel produced in Indonesia can be exported to the US and the EU. Eterindo, the only commercial-scale producer currently operational, exports 70% of its present production of 6,000 tonnes/month. Eterindo operates three converted chemical plants, with a rated capacity of 120,000 t.p.a., which is expected to be expanded to 240,000 tpa. All three facilities are held through private companies in which Eterindo holds a minority stake.
To date, at least 17 biodiesel projects have been announced, with a combined capacity of over 1.6 mn t.p.a. In addition, three companies are also expected to launch facilities for the production of ethanol based on cassava root or sugar cane, with a combined capacity of 360,000 tpa. Some of the proposed projects are listed in Figure 72.
Opaque market with limited number of
established standalone private companies
Wilmar is amongst the veryfew listed companies
active in this segment
Initial public reaction to biodiesel has been
enthusiastic
Indonesian biodiesel complies with international
standard and is readily exportable

Biofuel Sector 30 August 2006
46
Figure 72: Select announced biodiesel and ethanol projects to be located in Indonesia Company/sponsor Capacity (t.p.a.) Exp. completion Remarks Energi Alternative 300 2006 Operational plant Rekayasa/ Pertamina 5,000 2006 Operational. Rekayasa is a state-owned engineering, procurement and construction
company Eterindo Wahanatama 240,000 2007 22,000 t.p.a. operational; converted existing chemical plant Mopoli Raya 150,000 2007 Specialty chemicals company; JV operations with Korean and German partners Sinar Mas/ CITIC 100,000 2007 Major business and plantation group Musimas 100,000 2007 Vertically integrated company with refining and oleochemical facilities Sumi Asih 60,000 2007 Target capacity of 200,000 t.p.a.; Chinese investors with oleochemical plant in Indonesia Wilmar Group 250,000 2007 Major CPO plantation, refining and vegetable oil trading company Bakrie Sumatera/ Rekayasa 100,000 2008 70% owned by Bakrie Sumatera; 30% by Rekayasa. Project cost US$25 mn Darmex Oil & Fats 100,000 n.a. Target capacity of 200,000 tpa; integrated plantation, refining and oleochemical company Sari Dumai Sejati 100,000 n.a. Local group involved in palm oil trading amongst other business; limited public information Indo Bio Fuels 150,000 n.a. Asianagro Agungjaya 100,000 n.a. RGM Group company Wahana Abadi Tirta 30,000 n.a. Provider of water/utilities services in Samarinda, East Kalimantan Artha Trans Jaya 1,200 n.a. Makindo Group 100,000 n.a. Financial services company with some direct equity investments Government projects 36,000 n.a. 4 x 6,000 t.p.a. plus 4 x 3,000 t.p.a. Est. biodiesel capacity 1,622,500 n.a. Current estimate, as news flow continues. Not all projects may come on line. Ethanol projects Molindo Raya/ PTPN X 40,000 2007 30,000 t.p.a. ethanol plant using cassava roots operational for non-fuel uses Sampoerna family/ PTPN XI 160,000 2008 Sugar cane ethanol; PTPN XI is a state-owned plantation company Medco 160,000 n.a. Meco Energi is constructing the plant to produce ethanol from cassava roots Estimated ethanol capacity 360,000 n.a. Current estimate may have excluded existing ethanol capacity for non-fuel use Note: Capacity in tonnes per annum (tpa) production of biodiesel. Source: Company data, Bisnis Indonesia, Investor Daily, Credit Suisse estimates
According to Eterindo, most biodiesel contracts are based on a ‘feedstock cost + x’ formula under which it can pass through any increase in feedstock prices, palm-oil-based refined bleached deodorised (RBD) olein. The company procures its feedstock from palm oil refineries and larger (integrated) plantations.
Figure 73: Estimated biodiesel unit production cost (per unit of biodiesel produced) Estimated biodiesel production cost As percentage of US$/tonne US¢/litre US¢/gallon (US) total cost (%)Feedstock cost 503 43 164 77Processing cost 150 13 49 23Total unit cost 653 56 213 100Estimated ASP 814 70 265 125Est. value added 351 (per tonne of feedstock used) Note: Estimated value added is on per tonne of feedstock used. Conversion factors used: 1 tonne of feedstock = 0.97 tonne of biodiesel; 1 kilolitre = 0.86 tonnes; 1 US gallon = 3.7854 litres; assumed RBD olein purchase price of US$488/tonne (closing price as of 11 August 2006); methanol usage 15% by weight Source: Company data, Credit Suisse estimates
Operating costs primarily comprise of feedstock, additives (methanol) and catalysts (sodium hydroxide, NaOH, or potassium hydroxide, KOH). Eterindo estimates processing costs at approximately US$150/tonne, including depreciation charges. The company is currently recovering 97% of feedstock in biodiesel production. Some improvement in the recovery rate is expected (up to 98%) once the expanded plant is commissioned, management believes that 1:1 recovery rates suggested by some prospective biodiesel producers are laboratory test results and may not be replicated in commercial scale projects.
Production costs and pricing – estimated
US$350/tonne of value added
‘Feedstock + x’ pricing model implies potentially
attractive returns
Feedstock comprises over 75% of operating costs

Biofuel Sector 30 August 2006
47
The company suggests Pertamina’s current purchase price of biodiesel (B100) is approximately US$0.70/litre. At the present subsidised ADO and Bio Solar pump price of Rp4,300/litre (US$0.47/litre), Pertamina is losing money on both ADO and Bio Solar. Eterindo believes that pump prices could be raised in the near future and/or the government may introduce a favourable price differential for Bio Solar to encourage further take-up. Eterindo believes that the government will support the local biodiesel industry in order to reduce its oil import bill, preserve foreign exchange and improve the energy supply mix and security.
Figure 74: Retail diesel pump prices (including tax) vs estimated CPO based B100 cost
-
100
200
300
400
500
600
700
Jan 00 Jan 01 Jan 02 Jan 03 Jan 04 Jan 05 Jan 06
-20
406080
100120140
160180
US retail Av e. select EU retail Indonesia retail Est. B100 cost
(US cent/gallon) (US cent/litre)
Source: Energy Information Administration (EIA), Pertamina, MPOB, Bloomberg, Credit Suisse estimates
Eterindo estimates total capital cost for a greenfield project to be in the US$200-250 per tonne of installed capacity. A converted facility, such as Eterindo’s, could reduce capital cost by 50-75% depending on the modifications and additions required. Feedstock supply rather than capital cost may be the real barrier to entry in this sector.
A number of companies, including Astra Agro, are also investigating developing jatropha-based biodiesel. Small-scale production of biodiesel and soap from jatropha oil is fairly widespread in Africa and India in poverty-alleviation programmes known as the ‘Jatropha System’. However, commercial crop and oil production has not yet been proven. The ability of Jatropha to grow in relatively inhospitable land with potential oil yields of 2.0 tonnes/hectare makes it potentially attractive alternative to palm oil for energy and oleochemical use (jatropha is not fit for human consumption).
Pertamina’s biodiesel (B100) purchase price is estimated at US¢70/litre
Capital costs not prohibitive
Jatropha oil’s potential as alternative feedstock yet to
be determined

Biofuel Sector 30 August 2006
48
China’s biodiesel market – even faster China benefits from the availability of low-cost feedstock allowing Chinese biodiesel manufacturer to produce biodiesel at prices that are highly competitive with both global biodiesel and domestic fossil diesel prices. Chinese biodiesel manufacturers are currently enjoying a gross and net margin of more than 40% and 30%, respectively.
Figure 75: China’s diesel consumption continues to rise
0
20
40
60
80
100
120
1985 1986 1987 1988 1989 1990 1991 1992 1993 1994 1995 1996 1997 1998 1999 2000 2001 2002 2003 2004
(tons mn)
Source: CEIC, Credit Suisse estimates
In conjunction with annual fossil diesel consumption of almost 100 mn tonnes in 2004, the ability to produce biodiesel at prices below that of fossil diesel implies that China’s domestic market for biodiesel is immense. The rapid growth of the EU and US biodiesel market and the higher end-customer price of fossil diesel in the EU and the US denote a significant export potential for the Chinese biodiesel manufacturers. However, viability of export demand relies heavily on China’s ability to comply with the EN 14214 and ASTM D 6751. Besides, Chinese government’s restrictions on fuels exports are also a concern. For example, by Circular 1606, issued jointly on 24 August 2005 by the NDRC, Ministry of Finance, Ministry of Commerce, China Customs and State Administration of Taxation of China, China suspended all diesel and gasoline exports between 1 September and 31 December 2005, due to a supply shortage in the domestic market. Thus, we can assume that the Chinese government will not give many incentives to encourage diesel/biodiesel exports in the foreseeable future.
The absence of a national standard and any substantial technology barrier is the primary concern. Implementation of stringent national standard, expected in the future (probably in 1H07), may drive up production costs. High profit margins and low technological barriers should attract newcomers in the long term. Competition for feedstock supply in the future is inevitable. However, the competition from newcomers and the competition for feedstock represent long-term, rather than short- and medium-term, concerns.
In addition to the awareness of worsening air pollution, China’s strong energy consumption growth also increases the nation’s reliance on renewable energy.
China benefits from the availability of low-cost
feedstock allowing Chinese biodiesel
manufacturers to produce biodiesel at highly competitive prices
Implementation of stringent national standard may
drive up production costs; high profit margins and low
technological barriers should attract newcomers
in the long term

Biofuel Sector 30 August 2006
49
Huge energy demand embraces the use of biodiesel Figure 76: China nominal GDP (RMB bn) Figure 77: Annual per capita earnings (RMB)
9921.510965.5
12033.313582.3
15987.8
18232.120146.4705
22060.3852
0
5,000
10,000
15,000
20,000
25,000
2000 2001 2002 2003 2004 2005 2006E 2007E
CAGR =12. 94%
9921.510965.5
12033.313582.3
15987.8
18232.120146.4705
22060.3852
0
5,000
10,000
15,000
20,000
25,000
2000 2001 2002 2003 2004 2005 2006E 2007E
CAGR =12. 94%
9,33310,834
12,373
13,969
16,024
18,364
0
2,000
4,000
6,000
8,000
10,000
12,000
14,000
16,000
18,000
20,000
2000 2001 2002 2003 2004 2005
CAGR = 14. 50%
9,33310,834
12,373
13,969
16,024
18,364
0
2,000
4,000
6,000
8,000
10,000
12,000
14,000
16,000
18,000
20,000
2000 2001 2002 2003 2004 2005
CAGR = 14. 50%
Source: CEIC, Credit Suisse estimates Source: CEIC, Credit Suisse research
Given the continuously growing Chinese economy, we forecast that China’s energy consumption will reach 3.5 bn tce by 2020, compared with the NDRC’s target of 2.65 bn tce. We expect energy consumption per unit of GDP to fall by 13.7% in 2004-10, lower than the NDRC’s 20% reduction target. The NDRC’s 20% target requires the nation either to achieve a coal consumption CAGR of -2% or an oil consumption CAGR of -11% in 2005-10. Given China’s historical 17% CAGR for oil consumption and 26% for coal consumption in 2001-04, as reported by the Energy Information Administration (EIA), we are sceptical as to whether China can achieve such a reduction in coal and oil consumption in 2006-10. Coal will remain China’s primary energy source. We estimate that in 2020, coal will represent 58.2% of China’s total energy consumption, down from 68.7% in 2004. Based on forecasts from the SCDRC, the NDRC and the CNPC, we estimate that China’s reliance on imported oil will increase from 44% of total national oil consumption in 2006 to 56% in 2020. The ERI’s forecast implies that demand for natural gas will increase, outstripping domestic output growth, resulting in higher imports of natural gas. In a bid to reduce air pollution and reliance on coal and oil, China has decided to boost its renewable energy development.
Owing to the nation’s rapid economic growth, China’s demand for energy has experienced a dramatic surge. The NDRC reported that in 2004, total energy consumption was 1,386 mtoe (mn tonnes of oil equivalent), 13.5% of the 10,200 mtoe of global world energy consumption in that year. The NDRC predicted that in the absence of any government effort to curb energy consumption, China’s total energy consumption is likely to reach 4,000 mtce by 2020. The NDRC is striving to enhance China’s energy efficiency in order to keep the country’s total energy consumption below 3,000 mtce by 2020.
China’s energy consumption should
continue to rise for the foreseeable future

Biofuel Sector 30 August 2006
50
Figure 78: Total energy demand in China
Base-case estimates CAGR 5.54%
0.0
0.5
1.01.5
2.0
2.5
3.03.5
4.0
4.5
2004 2005 2006 2007 2008 2009 2010 2011 2012 2013 2014 2015 2016 2017 2018 2019 2020
Base case estimates CAGR 2.79%
NDRC forecast NDRC target Base-case estimates
(bn tons of standard coal)
Source: NDRC, SCDRC, CNPC, ERI, Credit Suisse estimates
We estimate China’s total energy consumption by aggregating the estimated consumption for all energy types (coal, oil, natural gas, hydro, nuclear and non-hydro renewable energy). Forecasts for energy consumption of each energy source type are provided separately by the NDRC, obtained from various sources. According to Mr Li Shan Shi, the deputy head of the renewable energy bureau of the NDRC, total energy consumption in China reached 2.22 bn tce in 2005. China’s total energy consumption increased at a CAGR of 5.4% between 1995 and 2005, according to Mr Zhou Da Di, head of the energy research institute of the NDRC. The NDRC estimates that China’s total energy consumption will increase at a CAGR of 5.5% in 2004-10 to reach 2.70 bn tce by 2010. The NDRC projects energy consumption of 3 bn tce by 2020, which implies a CAGR of 1% in 2010-20, due to the significant energy consumption efficiency gains. Instead, we estimate that China’s total energy consumption will reach 3.59 bn tce by 2020, which implies a CAGR of 2.8% in 2010-20 to reflect slightly less energy efficiency gains over the period, compared to the NDRC’s estimates. Our estimates are slightly higher than the forecasts published by the World Bank, derived from several studies, which project that China’s demand for energy consumption will reach 3.3 bn tce by 2020. Figure 79 shows our forecasts of the composition of China’s energy consumption between 2004 and 2020.
China’s total energy consumption is estimated
to reach 3,590 mtce by 2020

Biofuel Sector 30 August 2006
51
Figure 79: Composition of China’s energy consumption
0 10 20 30 40 50 60 70 80 90
100
2004 2005 2006 2007 2008 2009 2010 2011 2012 2013 2014 2015 2016 2017 2018 2019 2020Coal Crude oil Natural Gas Hydro Nuclear Non-hydro renewable energy
(%)
Source: NDRC, SCDRC, CNPC, ERI, Credit Suisse estimates
In response to the country’s rapidly worsening air pollution, China is looking to boost renewable energy consumption from 7% of total energy consumption currently to 10% in 2010, according to Mr Li Shan Shi. We estimate that renewable energy will represent 14.8% of total energy consumption in 2020, marginally lower than the NDRC’s target of 20%, as our targeted total energy consumption for China by 2020 is higher than that of the NDRC. We believe that despite China’s attempt to enhance utilisation of renewable energy and to reduce air pollution, coal will remain the primary source of China’s energy and that the country’s reliance on imported oil will rise. We estimate that China’s reliance on coal will decrease from 68.70% of total energy consumption in 2004 to 58.52% in 2020. Our estimate is marginally more aggressive than the forecast provided by the World Bank, which projects that China’s reliance on coal will decrease only to 60% by 2020. We also expect China’s reliance on fossil fuel oil to decrease from 21.80% of total energy consumption in 2004 to 18.6% in 2020. However, our forecast implies that China’s dependence on imported oil will increase from 44% to 56% of the country’s oil consumption between 2006 and 2020, resulting in 250 mn tonnes of oil to be imported by 2020.
Coal consumption Coal is China’s primary source of energy, and we expect it to remain so for the foreseeable future. According to Mr Li Shan Shi, in November of 2005, China’s annual coal consumption had reached 1,870 mn tonnes, a 14.4% increase from the previous year. This accounted for 68.7% of the country’s total energy consumption in 2004. Ms Ou Xinqian, vice director of the NDRC, forecasts that China’s coal demand will increase to 2.25 bn tonnes in 2006, implying a 9.7% CAGR in 2005 and 2006.
Mr Pu Hongjiu, vice-president of the China Coal Industry Association, predicts that China’s total demand for coal in 2020 will exceed 2.5 bn tonnes, and that approximately 1.0-1.6 bn tonnes will be used to generate electricity. In response to the increasing demand, Mr Xu Dingming, director of the energy bureau of the NDRC, stated that the government is targeting an additional 1.1 bn tonnes of coal production capacity by 2020. This implies that China’s coal production capacity will increase by around 50% in 2005-20, resulting in a net exportable surplus of 460 mn tonnes by 2020.
Responding to the rapidly worsening air pollution,
China is looking to boost renewable energy
consumption
Coal is China’s primary source of energy and will
remain so in the foreseeable future
Coal production capacity will be increased in order
to meet increasing demand

Biofuel Sector 30 August 2006
52
Figure 80: China’s coal consumption and production
0
500
1,000
1,500
2,000
2,500
3,000
3,500
4,000
2005 2006 2007 2008 2009 2010 2011 2012 2013 2014 2015 2016 2017 2018 2019 2020
(mn tons)
Consumption Production
Source: NDRC, Credit Suisse estimates
We estimate that China’s coal consumption will reach 2.9 bn tonnes by 2020, implying a CAGR of 1.8% in 2006-20E. Our estimates fall at the high end of the 2,100-2,900 mn tonne range estimated by Professor Ni Weidou of Tsinghua University. There are two justifications for our aggressive forecasts. First, our estimate of a 1.8% CAGR remains significantly below the 9.7% CAGR in 2005-06 provided by the NDRC and China’s historical double-digit coal consumption growth. Second, the 1.1 bn tonnes of additional production capacity reduces the risk of a future supply shortage.
We estimate the CAGR for China’s coal consumption per unit of GDP to be -2.7% in 2005-20E. We expect coal consumption, as a proportion of total energy consumption, to decrease from 68% in 2005 to 58% in 2020, or an annual reduction of approximately 1%. Our 1% forecast is more conservative than the NDRC’s 3% estimate, as stated by Mr Wang Jiacheng, deputy director of the Industrial Economics and Technical Economics Institute under the NDRC; our forecast of total coal consumption in 2020 is also higher than the official government guidance.
The rise in energy demand has forced China to focus on expanding coal production capacity and exploring new technologies, including renewable energy solutions and coal liquefaction technologies. Consequently, the State Administration of Work and Safety has stated that around 50% of China’s coal production originates from mines that do not meet safety standards. Any move by the government to close mines that do not adhere to the existing work and safety standards will reduce production capacity. However, mining companies are taking safety risks in order to take advantage of the current high coal prices by operating in unsafe mines. The China Daily reported that 2,157 mines were shut down in 2005. According to Credit Suisse’s metals and mining analyst, Trina Chen, the estimated 5,000 mines targeted for closure represent only around 50-100 mn tonnes of annual coal production capacity. Hence, while our estimate of China’s coal production capacity may be exposed to some downside risks, we do not believe that the magnitude is significant.
The outlook for China’scoal consumption
remains strong
Coal mines targeted for shutdown represent only
around 50-100 mn tonnes of coal production capacity

Biofuel Sector 30 August 2006
53
Oil consumption We believe that China’s reliance on imported oil will rise, despite the reduction in oil consumption as a proportion of total energy consumption. The NDRC reported that China’s oil demand increased from 290 mn tonnes in 2004 to 318 mn tonnes in 2005, representing a CAGR of 9.6%. The SCDRC estimates that China’s 2006 oil consumption will reach 328.6 mn tonnes, with 184 mn tonnes produced locally and 144.6 mn tonnes imported. The NDRC estimates that China’s oil demand will reach 500 mn tonnes in 2020, while CNPC predicts that the country’s oil consumption in 2020 will reach 450 mn tonnes, with 200 mn tonnes produced locally.
Figure 81: China’s oil consumption
0
50
100
150
200
250
300
2004 2006 2008 2010 2012 2014 2016 2018 2020
050100150200250300350400450500
Imports Local production Total
Ax is of oil imports and local production (mn of tons) Ax is of total oil consumption (mn of tons)
Source: NDRC, SCDRC, CNPC, Credit Suisse estimates
Based on the SCDRC’s forecast, China’s oil consumption will be 328.6 mn tonnes in 2006, with 184 mn tonnes produced domestically and 144.6 mn tonnes imported. In line with the CNPC’s forecast, we expect China’s oil consumption to reach 450 mn in 2020. Our estimates fall within the 400-500 mn tonne range estimated by Professor Ni Weidou of Tsinghua University and are slightly below the NDRC’s forecast of 500 mn tonnes. We estimate that China’s oil consumption will grow at a CAGR of 2.3% in 2007-20. This represents almost a 1% reduction from the 3.3% growth estimated for 2006. Our estimates assume that China’s power shortage will ease in the near future and, thus, that the country’s high historical oil consumption growth will moderate.
Based on our estimates, China’s dependence on imported oil will increase from 44% in 2006E to 56% in 2020E, reflecting a CAGR of 4.05%. With local oil production expected to grow from 184 mn tonnes in 2006 to 198 mn tonnes in 2020, we expect China to be importing around 250 mn tonnes of oil by 2020. Our estimates for the size of China’s imported oil in 2020 are consistent with those of the NDRC.
China’s reliance on imported oil will increase
We expect China’s oil consumption to reach
450 mn in 2020
China’s dependence on imported oil should
increase from 44% in 2006to 56% in 2020

Biofuel Sector 30 August 2006
54
Figure 82: China’s oil imports
0 10 20 30 40 50 60 70 80 90
100
2004 2005 2006 2007 2008 2009 2010 2011 2012 2013 2014 2015 2016 2017 2018 2019 2020
Imports Local
(%)
Source: NDRC, SCDRC, CNPC, Credit Suisse estimates
Natural gas consumption The Chinese government is striving to reduce the nation’s reliance on coal and oil, which is likely to lead to higher demand for natural gas. The NDRC reported that natural gas accounted for only 2.8% of China’s total energy consumption in 2004, significantly lower than the world average of 24.2%. The ERI predicts that China’s natural gas demand will increase at a CAGR of 10.3%, resulting in total consumption of 200 bn cu m by 2020. Given the drastic increase in demand, we believe that local production is likely to fall behind, implying that China’s imports of natural gas will increase. However, competitive bidding for LNG is already pushing up international LNG export prices. The PRC government’s plan to build a second west-east gas pipeline and Russia’s announcement of the construction of two gas pipelines transmitting gas to China reflect the PRC government’s ongoing efforts to secure additional fuel supplies to meet rising energy demand growth. In the bid to reduce air pollution and the reliance on coal and oil, China is likely to boost renewable energy development. China’s plan to build 12 LNG terminals on the east coast and in the south may therefore be amended.
Ms Liu Xiaoli of the NDRC estimates that China’s demand for natural gas will reach 120 bn cu m in 2010 and 200 bn cu m in 2020. This corresponds with the ERI’s estimates. The aggressive growth is ascribed to China’s aim to reduce its heavy reliance on coal and oil. The Shanghai Municipal Energy Research Society indicates that China aims to increase the share of natural gas in electricity generation significantly from 2.8 bn KWh in 2000 to 285 bn KWh in 2020. However, a lack of gas supply may reduce this target or delay its attainment.
The NDRC reported that natural gas accounted for only 2.8% of China’s total
energy consumption in 2004
The demand for natural gas is set to grow
dramatically

Biofuel Sector 30 August 2006
55
Figure 83: China’s natural gas consumption and output
0
50
100
150
200
250
2005 2006 2007 2008 2009 2010 2011 2012 2013 2014 2015 2016 2017 2018 2019 2020
Demand Output
Source: ERI, Credit Suisse estimates
The ERI projects that China will require RMB220 bn (US$27 bn) of investment by 2020 in order to expand its natural gas production and distribution capacity. The ERI estimates that production capacity will only grow from 48 bn cu m in 2005 to 80 bn cu m in 2010 and to 120 bn cu m in 2020. The shortage of natural gas supply is expected to increase from around 6 bn cu m in 2006 to 40 bn cu m in 2010 and to 80 bn cu m in 2020. Consequently, China’s import of natural gas is likely to increase from 3% of the country’s natural gas consumption in 2005 to 33% in 2010 and to 40% in 2020.
Figure 84: Imports of natural gas are set to grow Figure 85: Proportion of natural gas imported
30% YoY increase to 2020
0102030405060708090
2005 2007 2009 2011 2013 2015 2017 2019
Imports
Imports
Local output
0
20
40
60
80
100
2005 2007 2009 2011 2013 2015 2017 2019
(%)
Source: Credit Suisse estimates Source: Credit Suisse estimates
A need to promote the use of renewable energy in China In recent years, China’s energy consumption growth has been driven by its rapid economic growth. The deputy head of the NDRC, Zhang Guobao, has said that China’s per capita annual energy consumption, at 1.08 tonnes of oil equivalent is only 66% of the world average of 1.63 tonnes and is significantly lower than the 8.02 tonnes, 4.03 tonnes and 3.82 tonnes per capita annual consumption of the US, Japan and the UK, respectively. According to the NDRC, China’s total energy consumption in 2004
China’s imports of natural gas expected to increase from 6 bn cu m in 2006 to 40 bn cu m in 2010 and to
40 bn cu m in 2020
China’s rapid increase in energy consumption

Biofuel Sector 30 August 2006
56
was 1,970 mtce, or around 13% of global energy consumption. According to the NDRC, China’s coal consumption in 2004 (68% of China’s total energy consumption) represents 34% of global coal production, making it the largest coal consumer in the world.
China’s large energy consumption can be attributed to the country’s rapid economic growth as well as its low energy efficiency. As China’s economy has grown at a rapid rate in the recent past, its demand for energy increased at even a faster rate. In 2003, China’s GDP grew by 9.4%, while its energy consumption increased by 12.5%. The rapidly increasing energy demand exposes China to the volatility of global energy prices as well as heavy reliance on imported energy.
China’s heavy reliance on coal creates a number of concerns. First, due to the rapid increase in demand, safety concerns on coal mining have been relegated to second place. The State Administration of Work and Safety stated that in 2004, 40% of China’s coal output came from mines that did not fully meet safety standards. Second, the high demand for coal has created a transportation bottleneck in coal distribution.
More importantly, with coal producing the highest level of emissions (higher than gas and oil), China’s heavy reliance on coal contributes aggressively to the country’s worsening air pollution problems. China’s carbon-dioxide emissions are currently the second-highest in the world. Professor Ni Weidou of Tsinghua University predicts that China’s emissions are likely to peak in 2015. In addition, China has low emission standards, even relative to other Asian countries. In 2002, the IEA reported that China’s carbon-dioxide emissions accounted for 14% of global CO2 emissions, which was slightly higher than the total carbon-dioxide emissions by the EU-15 countries combined.
Figure 86: Coal produces the most carbon-dioxide emissions among major fossil fuels
Figure 87: Carbon-dioxide emissions in 2002
90.6
71.5
49.5
0102030405060708090
100
Coal Oil Gas
Coal Oil Gas
5,652
3,271 3,207
1,5031,207 1,017 837
529 377
0
1,000
2,000
3,000
4,000
5,000
6,000
US China EU-15 Russia Japan India Germany UK France
US China EU-15 Russia Japan
India Germany UK France
Source: METI, Credit Suisse estimates Source: IEA, Credit Suisse estimates
In 2003, China’s GDP grew by 9.4%, while its
energy consumption increased by 12.5%
China’s reliance on imported oil will reach 56%
of the nation’s oil consumption by 2020
China’s carbon-dioxide emissions are currently the
second-highest in the world

Biofuel Sector 30 August 2006
57
Figure 88: Emission standards for coal-fired power plants in 2000 Particulate matter SO2 Nox as NO2 (mg/m3) (mg/m3) (mg/m3)China 200-600 1,200-2,100 650-1,000Hong Kong 50 200 670Indonesia 125 750 850Japan 100 k-value method 410Korea 50 770 720Malaysia 400 Ambient only Ambient onlyThailand 400 Ambient only 940United States 40 1,480 560-620Source: Study on Atmospheric Emissions Regulations in Asia-Pacific Economic Cooperation (APEC) economies and their compliance at coal-fired plants, Credit Suisse estimates
The 11th FYP proposes two measures to address China’s increasing energy consumption: 1) enhancing energy efficiency and 2) promoting the use of renewable energy. The first measure is likely to prove the more difficult to achieve, as it requires the country to undergo significant structural changes. The latter measure involves an estimated RMB800 bn investment by 2020. On the Industrialisation Forum of China Renewable and Alternative Energy, held on June 17 2006 in Beijing, Xu Dingming, head of the Energy Bureau of the NDRC, has said that according to the upcoming Renewable Energy Long/Mid-term Plan, China is aiming to reach a 12 mn tonnes production capacity of biofuel by 2020, of which 2 mn tonnes will be biodiesel. He also mentioned that to achieve the target that renewable energy could comprise 16% of Chinese total energy consumption in 2020, China would need to invest around RMB800 bn
As stated by Zhang Guobao, vice-minister of the NDRC, renewable energy should not only help to ease the energy shortage, but it should also help to cut China’s contribution to climate change and reduce China’s poverty by increasing demand for agricultural products (biomass energy). The renewable energy sector provides local governments with a fresh investment area that could stimulate economic growth and employment.
Figure 89: China’s renewable energy growth (mtce)
Renewable energy
0
100
200
300
400
500
600
2004 2005 2006 2007 2008 2009 2010 2011 2012 2013 2014 2015 2016 2017 2018 2019 2020
CAGR of 9.40%
0
100
200
300
400
500
600
2004 2005 2006 2007 2008 2009 2010 2011 2012 2013 2014 2015 2016 2017 2018 2019 2020
CAGR of 9.40%
Source: NDRC, Credit Suisse estimates
Up to RMB800 bn will need to be invested in
China’s renewable energy sector by 2020
Renewable energy provideslocal governments with a fresh
area for investment

Biofuel Sector 30 August 2006
58
Mr Zhang recognised that the private sector and international corporations will play important roles in determining China’s success to promote renewable energy sector development. He encouraged both domestic and overseas investors to share the large-scale investment required. The government has passed a law that allows for the implementation of a bidding system in order to attract both domestic and foreign investors, and is currently considering providing additional incentives, such as further tax breaks, to encourage the business sector to invest in renewable energy.
Rising fuel prices inspires the demand for biodiesel Figure 90: China’s diesel retail guidance price is expected to maintain at RMB5,478/tonne until 2009
0
50
100
150
200
250
Jan 02 Jan 03 Jan 04 Jan 05 Jan 06 Jan 07 Jan 08 Jan 09 Jan 10
(US$/bbl)
Crude oil price Germany retail diesel priceUS retail diesel price China diesel retail guidance priceChina diesel wholesale price
Source: Bloomberg, Credit Suisse estimates
Although China has a control on the domestic diesel price, with the hiking of international oil prices, the retail and wholesale prices of diesel have been upgraded several times, which increase the gap between diesel prices and the production costs of biodiesel, creating a more friendly environment to Chinese biodiesel manufacturers. The last diesel price adjustment was in May 2006, the retail guidance price of diesel was lifted to RMB5,478/tonne, and a float of around 8% was allowed. By our oil and gas team’s assumption, the price of crude oil will stay above US$65/bbl until 2009, and Chinese government will not lower the diesel guidance price until then. Meanwhile, the production costs of biodiesel in China, estimated by GTZ are now in the range of RMB1,981/tonne to RMB4,080/tonne, even without considering government subsidies. Backed by the low cost, Chinese biodiesel producers could earn a 30-40% margin.
Our oil and gas team forecasts that crude oil will stay above US$65/bbl until2009, and that the Chinese
government will not lower the diesel guidance price below RMB 5,478/tonne
until then

Biofuel Sector 30 August 2006
59
Figure 91: Cost of biodiesel varies depending on the feedstock used (US$/barrel)
$38.00
$131.00
$66.57
Waste vegetableand cooking oil
biodiesel
Rapeseedbiodiesel
Palm oil biodiesel
70%
43%
0
20
40
60
80
100
120
140
(US$/barrel)
$38.00
$131.00
$66.57
Waste vegetableand cooking oil
biodiesel
Rapeseedbiodiesel
Palm oil biodiesel
70%
43%
0
20
40
60
80
100
120
140
Source: Company data, Bio-era, POC, Credit Suisse estimates
Moreover, hiking oil prices have caused diesel prices to surge in Europe and the US, which are the two potentially significant markets for Chinese biodiesel manufacturers. If China’s upcoming standard can meet the requirements in Europe and US, Chinese biodiesel could easily be exported to Europe and US, with huge price competitiveness, especially in the European market, although the Chinese government may put barriers on exports, like the current status of gasoline and diesel exports.
Substitution effect between gasoline and diesel
Figure 92: Gasoline price is higher than diesel price
-
1,000
2,000
3,000
4,000
5,000
6,000
7,000
Jan 00 Jan 01 Jan 02 Jan 03 Jan 04 Jan 05 Jan 06
(RMB/tonne)
China diesel retail price China gasoline retail price
Source: Bloomberg, Credit Suisse estimates
The production costs ofbiodiesel in China,
estimated by GTZ are nowin the range of
RMB1,981/tonne toRMB4,080/tonne

Biofuel Sector 30 August 2006
60
Diesel price has been lower than gasoline in China since 2001, which makes the CAGR of diesel consumption could reach 5.5% between 2006 and 2020. If we simply assume that all Chinese diesel is blended with 5% biodiesel, we calculate that China’s biodiesel demand will reach 6 mn tonnes by 2010, 10 mn tonnes by 2020 and 18 mn tonnes by 2030. This means that at a 5% biodiesel blend, China’s market would represent more than total Asia’s biodiesel demand estimated by Bio-era for 2010, although it is not possible for all the diesel to be blended with biodiesel in China. While the absolute demand level appears aggressive, we believe the growth of biodiesel in China is promising, provided that Chinese biodiesel manufacturers maintain their ability to produce biodiesel at lower costs than the price of fossil diesel and sufficient supply of feedstock.
Figure 93: Diesel fuel consumption 2000-30 Axis of fossil diesel consumption (in million tons)
Axis of biodiesel market assuming 5% blend (in million tons)
Fossil diesel consumption Biodiesel assumed at 5% blend
0
50
100
150
200
250
300
350
400
2000 2004 2008 2012 2016 2020 2024 20280
5
10
15
20
25
30
0
50
100
150
200
250
300
350
400
2000 2004 2008 2012 2016 2020 2024 20280
5
10
15
20
25
30
Source: IEEJ, Credit Suisse estimates
Although the emission problem is still a concern, engine technology developments have significantly improved the perspective on using diesel. Comparing with 1990, in 2005 the particle and Nox emissions of diesel engines had been lowered by 91% and 95%, respectively, according to Feng Fei, the head of the Industrial Economy Research Division of the Development Research Centre of the State Council.
Given China’s peaking oil consumption, government is considering encouraging the sale of diesel-powered sedans. According to Professor Hao Jiming, a member of Chinese Academy of Engineering, currently diesel-powered sedans only account for 0.2% market share of total sedans sold in China; by comparison, the same ratio in Europe in 2004 was 47%.
The price of diesel hasbeen lower than that of gasoline in China since 2001, which means the
CAGR of diesel consumption could reach
5.5% between 2006 and 2020
Simply assuming a 5% blend, we calculate that
China’s biodiesel demand will reach 6 mn tonnes
by 2010
Emission problems remaina concern, but engine
technology development has improved the
prospects for diesel use
Given China’s peaking oil consumption, government
is considering encouraging the sale of diesel-powered
sedans

Biofuel Sector 30 August 2006
61
Figure 94: Motor trucks in China (’000) Figure 95: Motor vehicles in China (’000)
7163.27652.4
8122.28535.066
8930.0489555.5
0
2,000
4,000
6,000
8,000
10,000
12,000
2000 2001 2002 2003 2004 2005
CAGR = 5.93%
7163.27652.4
8122.28535.066
8930.0489555.5
0
2,000
4,000
6,000
8,000
10,000
12,000
2000 2001 2002 2003 2004 2005
CAGR = 5.93%
16089.10118020.4
20531.7
23829.254
26937.1
31596.6
0
5,000
10,000
15,000
20,000
25,000
30,000
35,000
2000 2001 2002 2003 2004 2005
CAGR = 14.45%
16089.10118020.4
20531.7
23829.254
26937.1
31596.6
0
5,000
10,000
15,000
20,000
25,000
30,000
35,000
2000 2001 2002 2003 2004 2005
CAGR = 14.45%
Source: CEIC, Credit Suisse research Source: CEIC, Credit Suisse research
Figure 96: Composition of China vehicles (2005) – almost 7.5 mn motor vehicles were using diesel in China
Figure 97: Heavy/medium truck capacity and demand forecast
Others76%
Diesel engine24%
(mn units)
0.0
0.2
0.4
0.6
0.8
1.0
1.2
2005 2006 2007 2008 2009 2010
50
55
60
65
70
0.0
0.2
0.4
0.6
0.8
1.0
1.2
2005 2006 2007 2008 2009 2010
50
55
60
65
70(%)
Demand Capacity Utilisation
Source: Development Research Centre of the State Council, Credit Suisse estimates
Source: Credit Suisse estimates
Moreover, the growing truck demand (most of trucks are diesel-powered) backs the diesel and biodiesel consumption. China’s adoption of Euro III emission standards in 2007/08, should boost demand for Euro II-standard trucks. More trucks will be required as construction picks up from projects related to the 11th Five-Year Plan, Beijing Olympics and real estate development. Furthermore, an expected reacceleration of the Chinese economy should also boost truck demand, in our view. And according to our talk with Shanghai Diesel Engine (600841 CH, RMB7.03, not rated) and Weichai Power (2338 HK, HK$19.08 not rated), their Euro III diesel engines are already on the market and can use biodiesel with no further modification to meet the Euro III emission standards.

Biofuel Sector 30 August 2006
62
1) Transition to Euro III. Although it has not yet been announced officially, the truck manufacturing and related component industry widely expects the government to implement Euro III (E3) emission standards in Beijing and selected cities in January 2007, and to roll out the standard nationwide in January 2008, in time for the Beijing Olympics. Given that trucks with E3-standard engines are much more expensive than those with E2 engines, prices for trucks that comply with the E3 standard will be significantly higher than those of trucks with E2 standard engines. As a result, we expect buyers to purchase cheaper E2 trucks ahead of 2007, which would boost demand in 2006.
2) Pick-up in construction. The 11th Five-Year Plan outlines government-sponsored infrastructure investment targeted at second- and third-tier cities. Much of this investment will be spent on railways, energy and power grids, and work will begin in 2006. More projects relating to the Beijing Olympic Games will also begin this year. The real estate market outside Shanghai and Beijing still looks healthy, as transaction volumes and construction activities are improving. As domestic liquidity was never cleared from the system by the austerity programme, there is a possibility that the real estate markets in smaller cities may rally as credit conditions loosen. Any increase in construction activity should trigger demand for trucks.
3) Reaccelerating economy. Our non-Japan Asia chief economist, Dong Tao, believes China has entered a new upward business cycle. He notes that although signs of a pick-up in economic activities are scarce in major cities, such as Shanghai and Beijing, anecdotal evidence points to an economic revival in tier-two and -three cities. Leading indicators, such as the PMI, M2 and loan growth, also suggest that a reacceleration is underway. This general improvement in the economy bodes well for truck demand, in our view.
In the longer term, China’s ongoing expansion of its highway system from the current 1.9 mn km to 2.1-2.3 mn km by 2010, and the improvement in road conditions should foster increased usage of trucks.
Production and capacity China’s biodiesel industry is still very much in its beginning. Total production nationwide was only 110,000 tons in 2005, but it is growing very fast. In 2005, the production capacity almost doubled, and in 2006, it is expected to double again. Wendy Wen, vice-president of SinoBright Clean Oil Technologies (not listed), estimates that Chinese biodiesel may be available on a larger scale for the transportation sector in three years. According to Wendy Wen and CEH’s forecasts, production capacity should reach 600,000 tonne/year in 2006 and 1.8 mn tonne/year by 2010.
Transition to Euro III should boost sales
ahead of 2007
Pick-up in construction to drive truck demand
The production capacity will reach 600,000
tonne/year in 2006, and is expected to 1.8 mn tonne/year by 2010

Biofuel Sector 30 August 2006
63
Figure 98: China’s biodiesel production and capacity (tonnes) (Capacity) (Production)
Capacity Production
200022000 32000 158700
300000
600000
1800000
1000015000
50000
110000
1000
0
200,000
400,000
600,000
800,000
1,000,000
1,200,000
1,400,000
1,600,000
1,800,000
2,000,000
2001 2002 2003 2004 2005 2006 2010
0
20,000
40,000
60,000
80,000
100,000
120,000
Source: CEH, SinoBright Clean Oil Technologies, Credit Suisse estimates
Currently, most of the biodiesel producers in China are privately owned. Until 2006, among the big three, PetroChina (857 HK, HKD9.02, UNDERPERFORM, TP HKD7.15), SINOPEC (386 HK, HKD4.61, NEUTRAL, TP HKD4.77) and CNOOC (883 HK, HKD6.83, NEUTRAL, TP HKD6.20), only SINOPEC has a pilot factory, with a capacity of 2,000 tonne/year. But CNOOC’s parent company has signed a memorandum of understanding with a Malaysian research company, Bio Sweet (not listed), to jointly develop palm-biodiesel on Hainan Island in 12 months’ time, with an annual capacity of 120,000 tonnes per year. CNOOC has also indicated that there are further plans to build biodiesel plants in other parts of China. Meanwhile, SINOPEC is planning to build a plant in 2008 with 100,000 tonne/year capacity, using virgin oil and waste cooking oil as feedstock.

Biofuel Sector 30 A
ugust 2006
64
Figure 99: Companies engaged in biodiesel production (not exhaustive) Designed Output Start Name Location Feedstock Process technology capacity (ton/yr) (ton/yr) date Market China Biodiesel International Holdings (CBI LN) Fujian GTW 1-step sub-acid catalyst process: own technology 20,000 15,000 2003 Private fleet owners, biodiesel distributors & fuel
stations Wuxi Huahong Biofuel Co. Ltd. Jiangsu GTW 100,000 n.a. Zhenghe Bio-energy Ltd. Hebei Acidified oil,fatty acid distillates 1-step sub-acid catalyst process: own development 20,000 15,000 2002 Private fleet owners, biodiesel distributors & fuel
stations Zhejiang Haiyan Fine Chemical Ltd. Zhejiang n.a. n.a. n.a. 3,500 Mainly sold as fine chemicals Wu'an Hengtai Chemical Ltd. Hebei n.a. n.a. n.a. 3,000 Mainly sold as fine chemicals Shanghai Qianwei Olechemical Ltd. Shanghai n.a. n.a. n.a. 4,000 Mainly sold as chemical intermediates Shandong Zichuanhuitong Olechemical Ltd. Shandong n.a. n.a. n.a. 4,000 Mainly sold as chemical intermediates Shaanxi Lantian Science-tech Chemical Ltd. Shaanxi n.a. n.a. n.a. 3,500 Biodiesel Wuhai Yuancheng Science-tech Ltd. Mongolia n.a. n.a. n.a. 2,500 Biodiesel Xinyang Hongchang Group Henan GTW & Local wood plant oil Enzymatic approach (developed by Tsinghua Univ.) 2006: 30,000, 2010: 100,000,
2015: 300,000n.a. 2006 Fuel stations, or directly sold
Hainabaichuan Biological Engineering Co. Hunan GTW, rapeseed The same as above 10,000 n.a. 2006 Fuel stations, buses Dinuo Chemical Ltd. Guizhou GTW Own development 2006: 3,000, 2010: 30,000 n.a. 2006 n.a. Yuanhua Energy Science Co., Ltd. Fujian GTW & oils n.a. 30,000 n.a. 2005 n.a. Grease Chemical Co. Henan Waste oil n.a. 110,000 Yuanhua Energy Technology Zhejiang Waste grease & oils n.a. 50,000 n.a. 2006 n.a. Shanghai Biodiesel Plant Shanghai GTW, rapeseed Japanese technology 50,000 n.a. 2005 Fuel stations & direct sale Hubei Oil Crops Research Institute Pilot Plant Hubei Rapeseed oil, waste grease n.a. 2,000 n.a. 2006 n.a. SINOPEC Institute of Petroleum Refining Pilot Virgin, waste oil n.a. 2,000 n.a. 2006 R&D Changchun Oil & Grease Plant Jilin n.a. n.a. 7,200 n.a. 2006 Planned for alphatic alcohol Sichuan University Chemistry Institute Sichuan n.a. n.a. 1,000 n.a. 2006 R&D Beijing Foodstuff Research & Univ. of Chemistry Beijing n.a. n.a. 320 n.a. 2006 R&D Fushun Development Planning Committee Liaoning n.a. n.a. 25,000 n.a. 2006 Planned for MES production Baotashan Painting Ltd. Shaanxi n.a. n.a. 20,000 n.a. 2006 Planned for paint production CNOOC (M) Biofuel Sdn Bhd Hainan Palm-oil n.a. 120,000 n.a. 2007 n.a. SINOPEC Commercial Biodiesel Plant Virgin, waste oil n.a. 100,000 n.a. 2008 Planned to be used for blending with fossil diesel
to B20 in SINOPEC petrol stations Henan Tianguan Group Henan Diesel oil as byproduct from bioethanol n.a. 100,000 n.a. n.a n.a.
Note: GTW = grease trap waste Source: GTZ, company data, Credit Suisse estimates

Biofuel Sector 30 August 2006
65
Also, the big domestic market has attracted some foreign biodiesel players to invest in China, with apparently larger capacity.
Figure 100: Joint ventures in the field of biodiesel (not exhaustive) Designed Invest capacityName Location Feedstock Investment (ton/year) dateD1 Energy plc, UK Sichuan Jatropha curcas L. Seeds from India, growing medium, technical expertise,
purchase of output from plantations 500,000 2005
Leo Ltd., England & Hunan Tianyuan Clean BioEnergy Ltd. Hunan n.a. Eu 30 mn 200,000 2005Biolux, Austria Shandong n.a. Eu 100 mn 275,000-300,000 2005Lurgi, Germany Shandong Rapeseed Technology & turnkey engineering 100,000 2005Daimler Chrysler, Germany Guizhou Jatropha seeds Development of large-scale liquid biofuel production n.a. 2003
Source: GTZ, company data, Credit Suisse estimates
Distribution Although the current distribution monopolization of the fossil oil industry limits biodiesel companies to local customers, there are still more than 25,000 privately owned gas stations can provide biodiesel. And according to our conversations with PetroChina and SINOPEC, the two Chinese majors currently have no facilities in their gas stations to provide biodiesel, but in the future, after the establishment of Chinese national standards, they may consider providing biodiesel in their gas stations, which in our view would broaden the distribution channel of biodiesel in China significantly.
Figure 101: Currently, there are total 75,000 to 80,000 gas stations in China
17,952
30,352
-
5,000
10,000
15,000
20,000
25,000
30,000
35,000
1Q01 3Q01 1Q02 3Q02 1Q03 3Q03 1Q04 3Q04 1Q05 3Q05 1Q06
Petro China Sinopec
Source: Company data, Credit Suisse estimates
There are total 75,000-80,000 gas stations in
China, in which more than 25,000 are privately owned

Biofuel Sector 30 August 2006
66
Feedstock availability At present, agricultural crops in China that can be used to produce biodiesel include rapeseed, sunflower and soybean, but these plants and their products are used preferably for producing edible oil. China imports and produces edible oils, such as soybean oil, palm oil and rapeseed in large quantities to meet the demand for food oil production (Figure 102). Some concern have been raised about the competing demands and uses of agricultural products between production for biodiesel and for food. However, in China, due to market mechanisms and higher costs, most market participants in biodiesel production are currently using vegetable oil offal and used cooking oil as their feedstock, instead of virgin oils, such as soybean and rapeseed oil. Thus, a high level of demand and consumption of edible oils could mean more collectable resources of used cooking oil in China.
Figure 102: China imports large quantities of edible oils (’000 tonnes)
Soya Bean Oil Palm Kernal Oil Rape & Mustard Oil
0
500
1,000
1,500
2,000
2,500
3,000
01 02 03 04 05 1H060
500
1,000
1,500
2,000
2,500
3,000
01 02 03 04 05 1H06
Source: CEIC, Credit Suisse estimates
Figure 103: A population of more than 1.3 bn implies a large quantity of used cooking oil for biodiesel production
1,050
1,100
1,150
1,200
1,250
1,300
1,350
1990 1991 1992 1993 1994 1995 1996 1997 1998 1999 2000 2001 2002 2003 2004 2005
(Persons mn)
Source: CEIC, Credit Suisse estimates
Large quantities of edible oils are consumed in China
– this provides large quantities of waste oil and
vegetable oil offal, which can be used feedstock for
Chinese biodiesel production

Biofuel Sector 30 August 2006
67
Waste oil and vegetable oil offal
Figure 104: China’s availability of waste oil and vegetable oil offal
-
5,000
10,000
15,000
20,000
25,000
2000 2001 2002 2003 2004 2005 2006 2007 2008 2009 2010
('000 tonnes)
Total edible oil consumption Waste oil Collectable waste oil Vegetable oil offal
CAGR of 6.16%
Source: National Bureau of Statistics of China, Euromonitor, Credit Suisse estimates
According to Ji Xing, associate professor at the China University of Petroleum (Beijing) and head of the university’s biodiesel laboratory, in 2004, 4-5 mn tonnes of consumed edible oil became waste oil, of which 2 mn tonnes were collectable. By simply adopting the same collectable percentage to our forecast of edible oil consumption in China and ignoring any further improvement of the collecting channels, the collectable waste oil could easily reach 2.27 mn tonnes in 2006. And by the industry’s average, for every 100 tonnes of edible vegetable oil produced, 8 tonnes of vegetable oil offal is generated. This means that in 2006, the amount of vegetable oil offal could reach 1.43 mn tonnes.
Assuming 80% industry conversion efficiency, which is conservative compared with the actual conversion efficiency level of more than 90% by the current technology used in China, we estimate that in 2010 collectable feedstock could support 3.576 mn tonnes of biodiesel production capacity, which is easily enough to meet the requirements of 1.8 mn tonnes projected production capacity. Moreover, this is without considering any improvement in waste oil collection channels and the impact of the upcoming Food Security Act.
China’s Food Security Act is expected to be enacted this year, and it impacts biodiesel feedstock in at least two ways:
• more stringent standards/regulations to limit the use of waste oil by restaurants, which implies more feedstock supply for biodiesel production; and
• more stringent standards/regulations aiming to upgrade the quality of edible oil will produce more vegetable oil offal for biodiesel production.
Collectable waste oil couldeasily reach 2.27 mn
tonnes in 2006 in China
We estimate that in 2010, collectable feedstock could
support 3.576 mn tonnes of biodiesel production
capacity

Biofuel Sector 30 August 2006
68
By-products Seed cake When seeds are crushed to extract oil, the husks and other residues are left over as seedcake. This seedcake is often high in protein and other nutrients, and it has a wide variety of applications as organic fertiliser, fodder and nutraceutical. Further processing can convert seedcake into high-protein animal feed.
In the case of Jatropha curcas, the cake is toxic, but it can be used as a soil conditioner and fertiliser because of its high phosphorous content. Jatropha curcas seedcake also has a high-energy content and can be pressed into briquettes and burned as fuel.
Seedcake is sold to local farmers to minimise transportation costs. There are no standardised prices available for seedcake and fertilisers as by-products from biodiesel production, because they are usually negotiated between local providers and purchasers, as they are only seasonally available and are competitive products.
Glycerine Refining plant oil into biodiesel produces about 10% glycerine, depending on raw oil quality and processing techniques. Glycerine is in demand as a raw material for a very wide range of cosmetic, medical and food products. China’s national demand for glycerine is about 100,000 tonnes. As the production of biodiesel is still very limited, in 2004 the amount of glycerine produced in China covered only 5% of the national market. If the production of biodiesel could be increased considerably up to the level of 1 mn tonnes/year, marketing strategies for glycerine would be feasible and might offer a valuable additional income to refiners.
In the glycerine market, the main actors are identified especially in the cosmetic industry, which buys glycerine on a large scale, and trade companies with export relations and chemical factories that produce a range of oil- and acid-based products. The Chinese glycerine industry is increasing its output with consequently decreasing prices. While the national price of high-purity glycerine was about €800 per tonne in 2005, some chemical products, such as high-value 1,3-propanodiol, priced at more than €5,000 per tonne, may expand the market for glycerine. Thus, biodiesel production could become more feasible. Chinese companies recently started to import glycerine as a supplement to the regional market. Largely traders and distributors drive the buying interest. According to industry sources, deals have been closed at €890-900/tonne.
Asia as a region is the major exporter of glycerine to the global market, and therefore of strong interest for international business and trading companies. However, the availability of lower-priced biodiesel glycerine in Europe and the US has added more pressure to the lower prices being offered for refined glycerine. In light of the ample supply of lower-priced biodiesel glycerine, demand from the US and Europe for high-quality, vegetable-derived glycerine from China has weakened.
Biodiesel in China China’s biodiesel industry is still very much in its infancy. Total annual production nationwide is only 110,000 tonnes. Wendy Wen, vice-president of SinoBright Clean Oil Technologies, estimates that Chinese biodiesel may be available on a larger scale for the transportation sector in three years.
The national demand for glycerine is about
100,000 tonnes

Biofuel Sector 30 August 2006
69
Chinese biodiesel research took off under the leadership of the central government. Many government leaders, such as the former premier, Zhu Rongji, the current premier, Wen Jiabao, and the chairman of the National People’s Congress, Wu Bangguo, have shown their dedication to the concept and development of a biodiesel industry in China, and emitted policy directions to the National Economy and Trade Committee (NETC), the NDRC and the Chinese Academy of Engineering (CAE).
In the 1980s, basic technology research was supported by the Ministry of Mechanics Industry, China Petroleum & Chemical Co-operation and the Chinese Academy of Agriculture Engineering. Liaoning Institute of Energy Resources worked on biodiesel in a China-EU research project. The University of Science and Technology of China, Beijing, also carried out relevant initial research.
However, systematic efforts started in the early 1990s with the programme ‘Fuel Plants’ Survey and Planting Technology Research’ carried out by the CAS, as one of the national research programmes during the period of the 8th FYP. In this programme, the fuel plants in the drainage area of the Jinsha river, in Sichuan province, were investigated, the planting technologies of some fuel plants were studied, and 20 ha of jatropha curcas were planted for demonstration.
From 1991 to 1995, the Changsha Institute of New Technology and Hunan Academy of Forestry carried out the program of methyl ester fuel production from Cornus wilsoniana oil and a combustion feature study; from 1996 to 2000, they worked in the program of ‘Energy-oriented End-use Technologies with Plant Oil’, as one of the national research program during the period of the 9th FYP.
In June 2005, the Chinese Ministry of Science and Technology (MOST) started a program for bio-energy, which aims the development and utilization of standardized industrial biodiesel production units with a designed capacity of 50,000 tonnes per year per unit, to be installed before 2010.
In addition, recently research programs about biodiesel started at the University of Science and Technology of China, Anhui, Jiangsu Polytechnic University, Sichuan University, Beijing University of Chemical Technology, and Shanghai Tongji University.
Enterprises also show interest in the investment in biodiesel production, which led to many new international joint ventures (see Figure 100).
Although the R&D on biodiesel in China started lately, it advanced rapidly. Research sectors include selection, genetic modification, distribution and cultivation of oily plants, processing technologies and equipments. Research work in each topic has been accelerated. Chinese researchers from various universities have mad progress in the field of raw material filtering, production techniques and biodiesel additives.
Chinese biodiesel research took off under the leadership of the
central government

Biofuel Sector 30 August 2006
70
Figure 105: Biomass energy R&D institutions in China Name Location Subject Website University of Science and Technology of Beijing Beijing Biodiesel www.ustb.edu.cn Beijing University of Chemical Technology Beijing Biodiesel www.buct.edu.cn Tsinghua University Beijing Biodiesel and bioethanol www.tsinghua.edu.cn Jiangsu Polytechnic University Jiangsu Biodiesel www.jpu.edu.cn Sichuan University Sichuan Biodiesel www.scu.edu.cn China Agriculture University Beijing Biomass energy www.cau.edu.cn Guangzhou Institute of Energy Conversion Guangdong Biodiesel www.giec.ac.cn China National Center of Biotechnology Development of MOST Beijing Biodiesel www.cncbd.org.cn Southwest Forest Institute Sichuan Biodiesel --- Tianjin University Tianjin Biodiesel www.tju.edu.cn Northeast Forestry University Harbin Heilongjiang Plant oil www.nefu.edu.cn Note: MOST=Ministry of Science and Technology Source: GTZ, Credit Suisse research
Biodiesel production process in China In China, the following methodologies for biodiesel production are developed and applied, but the industrialized biodiesel production applies the traditional chemical catalysis approach.
Chemical catalysis approach
Chemical catalysis approach is widely used in the international and Chinese biodiesel producing industry. It uses a low cost catalyst and achieves a high efficiency in oil conversion. Ordinary acid catalyst requires H2SO4, H3PO4, HCl and H3SO3, in which H2SO4 is the most popular because of its low price and abundant occurrence.
Conventional enzymatic approaches
Although the industrialisation of conventional enzymatic approaches is not very popularized, due to high costs of lipase and its short service time, they are more and more accepted, given their excellent production conditions, low restrictions to equipment and no water polluting waste features.
New enzymatic approach
Developed by Tsinghua University, new enzymatic approach uses an inactive organic solvent as reaction medium, and can effectively convert bean oil, rapeseed oil, cottonseed oil, waste oil, waste acid oil and microbe alga oil to biodiesel. Since the lipase’s service time is up to 10 times longer than with conventional enzymatic approaches, the cost for lipase with new approach can be reduced to near the cost of industrialised chemical approaches.
In Hunan province, a pilot-scale unit with a capacity of 200 kg/d of rapeseed oil has successfully completed the production tests.
Supercritical fluid system (SCF)
SCF performs a quick chemical reaction rate and a high efficiency of conversion, but it needs high temperature and pressure, so the technical requirements to the equipment are much stricter.

Biofuel Sector 30 August 2006
71
Currently, at Northeast Forestry University, SCF is applied on laboratory scale. It is also applied by different pharmaceutical companies for the production of traditional Chinese medicine for the extraction of plant oil.
Co-boiling distillation
Laboratory research has made some important progress at Wuhan Oil Plant Research Institute.
Whole cell catalyst approach
Whole cell catalyst instead of extra cellular lipase is used to decrease the cost of catalyst. And the laboratory research has made some important progress at Tsinghua University and Tianjin University.

Biofuel Sector 30 August 2006
72
Cost of biodiesel The primary component of the production costs of biodiesel is feedstock costs. A study commissioned by Piedmont Biofuels estimate that the cost of feedstock could reach up to 90% of total production costs, whereas in the report prepared for the Energy Efficiency and Conservation Authority, it is estimated that feedstock account for approximately 80% of total production costs. The discrepancy is largely due to the large number of potential feedstock sources, which vary in price. The biodiesel production costs breakdown provided by Bio-era indicate that feedstock costs, on average, account for 82% of biodiesel production costs, whereas distribution and processing costs account for 6% and 12%, respectively.
Figure 106: Biodiesel production costs
Distribution costs6%
Processing costs12%Feedstock costs
82%
Source: Bio-era, Credit Suisse research
Given that more than 80% of costs coming from feedstock, biodiesel costs vary significantly depending on the different costs of raw materials.
Figure 107: Raw material cost comparison (RMB/tonne)
0
1,000
2,000
3,000
4,000
5,000
6,000
7,000
2003 2004 2005 1H2006
Rapeseed oil Soybean oil Palm oil Used cooking oil Vegetable oil offal
Rapeseed oil
Soybean oil
Palm oil
Used cooking oil
Vegetable oil offal
0
1,000
2,000
3,000
4,000
5,000
6,000
7,000
2003 2004 2005 1H2006
Rapeseed oil Soybean oil Palm oil Used cooking oil Vegetable oil offal
Rapeseed oil
Soybean oil
Palm oil
Used cooking oil
Vegetable oil offal
Source: Company data, Credit Suisse estimates
The cost of feedstock could reach up to more
than 80% of total production costs for
biodiesel

Biofuel Sector 30 August 2006
73
Figure 108: Different countries use different feedstock Biodiesel raw materials Prevailed countriesRapeseed UK, GermanySunflower Italy and Southern FranceSoybean USA & BrazilPalm Malaysia, IndonesiaLinseed, olive SpainCottonseed GreeceVegetable oil offal, used cooking oil ChinaJatropha curcas IndiaSource: Credit Suisse research
Biodiesel commonly uses rapeseed, palm oil, soy, Jatropha, sunflower, and recycled cooking oil. Rapeseed oil is the most popular feedstock in EU. The requirement for 5.75% of biodiesel mix for energy content on all diesel used for transport purpose by 2010 set by the EU directive would consume half of EU’s rapeseed oil production. And in ASEAN, like Malaysia and Indonesia, palm oil is the dominant feedstock for biodiesel. However, China biodiesel manufacturers use waste grease more as feedstock currently. And by using different feedstock, cost of biodiesel is different among countries.
German case Based on Germany’s biodiesel market, Bio-era estimated that biodiesel, produced using virgin oils, costs around US$131.00/barrel, wherein feedstock, production and distribution costs are US$110/barrel, US$14.50/barrel and US$6.50/barrel, respectively. Bio-era assumed fossil diesel cost of US$75/barrel, which implies that the cost of biodiesel is 75% higher than that of fossil diesel. Henceforth, the price of fossil diesel will have to reach more than US$130/barrel before biodiesel can be competitive without any government subsidy.
Germany’s strong biodiesel market has primarily been attributed to government’s incentive and policy that allows for a full exercise tax exemption on biodiesel. Currently, fossil diesel is taxed at 47cents/litre, or around US$86/barrel. This implies that, based on the US$75/barrel diesel cost assumed by bio-era, end-customer diesel price in Germany is around US$161/barrel, 18.6% higher than biodiesel price. Adjusting for the 8% higher energy output by fossil diesel than biodiesel, it implies that, in Germany, the price of diesel is approximately 12% higher than biodiesel.
Given that more than 80% of costs coming from
feedstock, biodiesel costs vary significantly
depending on the different costs of raw materials
Based on the US$75/barreldiesel cost assumed by
bio-era, end-customer diesel price in Germany is
around US$161/barrel, 18.6% higher than
biodiesel price

Biofuel Sector 30 August 2006
74
Figure 109: Cost of biodiesel vs fossil diesel in Germany
Feedstock cost Production costs distribution costs Petrol diesel cost tax Adjusted price
0
20
40
60
80
100
120
140
160
180
Biodiesel Fossil diesel (adjusted for 8% higher output)
Fossil diesel
(US$/bbl)
Feedstock cost
Production costDistribution cost
Petrol dieselcost
Tax
12%18.6%
75%
Source: Bio-era, Credit Suisse estimates
The sizeable tax exemption enjoyed by biodiesel sector in Germany has been the key driver behind the rapid growth of the nation’s biodiesel market. According to the Berliner Zeitung newspaper, the German government has proposed a €0.15/litre tax to be imposed on biodiesel starting 1 August 2006. The introduction of biodiesel tax will bring biodiesel cost up from US$131.00/barrel to US$159.30/barrel. This implies that when the price of fossil diesel is at US$73/barrel, the end-customer price of biodiesel (US$160/barrel) will be at par to that of fossil diesel. Adjusting for the 8% lower energy output, biodiesel will lose its competitiveness if the price of petro diesel falls below US$62/barrel. That is, biodiesel in Germany will lose its competitiveness with and without the additional Eur0.15/litre tax if crude oil falls below US$30/barrel – US$35/ barrel and US$25/barrel – US$30/barrel, respectively.
Figure 110: Retail fossil diesel price vs biodiesel price in Germany
0
50
100
150
200
250
Jan 03 Jul 03 Jan 04 Jul 04 Jan 05 Jul 05 Jan 06
(US$/bbl)
Retail fossil diesel priceRetail fossil price adjusted for 8% higher energy outputBiodiesel with Eur0.15/liter taxBiodiesel without taxPalm oil biodiesel
Source: Bloomberg, Bio-era, Credit Suisse estimates
The introduction of a biodiesel tax will bring biodiesel cost up from
US$131.00/barrel to US$159.30/barrel

Biofuel Sector 30 August 2006
75
Malaysia case Our Malaysian palm oil analyst, Tan Ting Min, asserted that participants of the Palm Oil Conference (POC), held in Kuala Lumpur on 23-25 February 2006, estimated 2006 palm oil price of around RM1,450/ton to RM1,540/ton, with expected greater volatility, incorporating the potential supply shocks due to weather risks. And for 2007 and 2008, on the expectation of strong demand growth from biodiesel producers, Ting Min is projecting that crude palm oil (CPO) prices are RM1,725/ton and RM1,800/ton, respectively.
Figure 111: Revised CPO price estimates For the year ending 31 Dec 2007E 2008EPrevious estimates (RM/tonne) 1,650 1,650Revised estimates (RM/tonne) 1,725 1,800Change in estimates (%) 4.5 9.1Note: Our long-term price assumption is RM1,650/ton (kept flat from 2010 onward) Source: Credit Suisse estimates
Figure 112: Malaysia’s CPO inventory and prices
300
500
700
900
1,100
1,300
1,500
1,700
1,900
98 99 00 01 02 03 04 05 06
0
100
200
300
400
500
600
700
800
CPO prices in USDollar Malaysian CPO (US$/t)("000 T)
Source: MPOB, Oil World, Credit Suisse estimates
Assuming to the cost distribution as illustrated in Figure 106, it implies that price of palm oil biodiesel will range between US$64.50/barrel to US$68.50/barrel (assuming currency conversion of US$1 = RM3.74), which is significantly cheaper than the biodiesel cost estimated by Bio-era. Primarily, the estimate of Bio-era assumes the higher reliance towards rapeseed oil, the most widely used feedstock in Europe, which are generally more expensive than palm oil. However, the environmentalists are currently lobbying the EU government to discourage the use of palm oil biodiesel due to concern over the threat that it may impose on the orang-utan habitat and rain forests. This may lead to EU imposing higher tax on palm oil biodiesel imports.
For 2007 and 2008, on theexpectation of strong demand growth from
biodiesel producers, we are projecting that CPO
prices are RM1,725/tonne and RM1,800/tonne,
respectively
The cost of palm oil biodiesel is significantly
lower than that of rapeseed oil biodiesel

Biofuel Sector 30 August 2006
76
Figure 113: Palm oil biodiesel vs Bio-era estimate
66.57
131.00
0
20
40
60
80
100
120
140
Estimated cost of palm oil biodiesel Biodiesel cost estimated by Bio-era
(US$/barrel)
Source: Bio-era, POC 2006, Credit Suisse research
The future direction of biodiesel market looks to be heading towards feedstock sources that are able to enhance the cost competitiveness of biodiesel vis-à-vis fossil diesel. Henceforth, palm oil biodiesel is likely to represent an important segment of future global biodiesel market.
US case Taking account of subsidies, the US production costs of soybean biodiesel is US$1.12/gallon in 2006 (Figure 114), lower than production cost of bioethanol, which is US$1.17/gallon (Figure 166). Although the lower cost is derived from the subsidies, it will significantly enhance the biodiesel’s competitiveness in the market.
Figure 114: Soybean biodiesel production costs and subsidies (2002 US$ per gallon) Fiscal year
Cost and subsidies 2004 2005 2006Variable cost 2.55 2.54 2.49CCC base production payment -0.43 -0.22 0.00Variable cost of base production, net 2.12 2.32 2.49Variable cost 2.55 2.54 2.49CCC additional production payment -1.45 -1.46 -1.47Variable cost of additional production, net 1.10 1.08 1.12Note: CCC=Commodity Credit Corporation Source: EIA, Credit Suisse research
Aside from the subsidies, another factor for the production costs difference is the different percentage of feedstock accounting for the total production costs. Feedstock costs account for approximately 80% of total biodiesel production costs and 46% of total bioethanol production costs (Figure 163).
Figure 115 provides a comparison of litres per hectare extractable from different feedstock of bioethanol and biodiesel and their related feedstock yields. Two facts are shown by the Figure 115: firstly, average yields from ethanol feedstock is higher than
Taking account of subsidies, the US
production cost of soybean biodiesel is lower than that
of bioethanol

Biofuel Sector 30 August 2006
77
average yields from biodiesel feedstock; secondly, palm oil yields the most litres of biodiesel in terms of per hectare, comparing with others, and soybean yields the least.
Figure 115: Comparison of yields among different feedstock
1,150 2,500
3,100
5,0006,000
630 750 1,000 1,2001,900
4,500
- 1,000 2,000 3,000 4,000 5,000 6,000 7,000
Barle
y
Whe
at
Corn
Suga
r bee
t
Suga
r can
e
Soyb
ean
Casto
r bea
ns
Sunfl
ower
seed
Rape
seed
Jatro
pha
Palm
oil
(Litres per hectare)
Ethanol feedstock Biodiesel feedstock
Source: International Federation of Agriculture Producers, Credit Suisse estimates
China case Being one of the highest cooking and vegetable oil consumers, China is able to produce biodiesel using recycled cooking and vegetable oil. China’s lack of agricultural land (and thus potentially insufficient agricultural products) will make the use of recycled cooking and vegetable oil very important of the large-scale production of biodiesel oil. The use of recycled cooking oil allows a highly cost-competitive biodiesel to be produced.
Figure 116: Cost of biodiesel feedstock
1,2501,650
6,480
3,244
0
1,000
2,000
3,000
4,000
5,000
6,000
7,000
Vegetable oil offal Recy cled cooking oil Rapeseed oil Palm oil
(RMB/ton)
Source: Bio-era, Credit Suisse estimates

Biofuel Sector 30 August 2006
78
Bio-era estimated that China’s current recyclable used cooking and vegetable oil is around 5 mn tonnes per year. We estimate the current cost of vegetable oil in China to be around RMB1,200-1,300/tonne, whereas recycled cooking oil costs around RMB1,600-1,700/tonne. This implies that the cost of biodiesel feedstock in China is over 70% cheaper than rapeseed oil and over 50% than palm oil. Bio-era estimates that the cost of rapeseed oil in Germany is approximately €675/tonne or RMB6,480/tonne (at exchange rate of €1 = RMB9.60). And the cost of palm oil in 2006 would range from around RM1,450/tonne to RM1,540/tonne or RMB3,141/tonne to RMB3,336/tonne (at exchange rate of RM1 = RMB2.1665) feedstock cost.
Bio-era estimates that feedstock accounts for around 80% of total biodiesel production costs in most parts of the world. Given the significantly lower cost of feedstock in China, we estimate conservatively that feedstock cost accounts for 60% of total biodiesel production costs in China. This estimate implies that the total cost of producing biodiesel in China is about RMB2,200/tonne, significantly cheaper than in other countries. Bio-era estimates that the cost of biodiesel in Germany, where rapeseed oil is the dominant feedstock source, is around €805/tonne or RMB7,700/tonne. Based on the palm oil price provided at the POC and the biodiesel production costs provided by Bio-era, we estimate that the cost of biodiesel produced using palm oil is approximately RMB3,961/tonne. And GTZ estimates the biodiesel production costs in China are now in the RMB1,981/tonne to RMB4,080/tonne range, depending on different feedstock.
China has access to cheapbiodiesel feedstock

Biofuel Sector 30 August 2006
79
Primary government policies and incentives Governments around the world are currently striving to promote the use of renewable and alternative energy, motivated by the following factors: 1) the recent surge in global fossil-fuel price, 2) the worsening air pollution and concerns over global warming, 3) the increasing oil consumption, which results in heightening reliance on imported oil and 4) the potential for renewable energy to enhance agricultural industry, which may assist developing countries to combat their poverty issues.
Increasing environmental awareness and regulations limit emissions from fossil fuels Global warming alarms – the background The topic of global warming has inspired heated debate among world leaders, industry representatives and environmentalists. Human activities enhance the greenhouse effect primarily by burning fossil fuels, such as coal, oil and natural gas. These fuels are stored carbon, formed millions of years ago from organic matter. Burning them returns the carbon to the atmosphere in the form of carbon dioxide (CO2), the gas that contributes most to the enhanced greenhouse effect. Other greenhouse gases are less common than CO2 in the atmosphere, but have more potent effects. Nitrous oxide (NOX), for example, is only one-thousandth as common as carbon dioxide, but is 200-300x as effective at trapping heat, and remains in the atmosphere far longer than carbon dioxide.
Global temperatures have already risen by 0.7°C over the past century, and the ten hottest years on record have all occurred since 1991. This is the fastest rise in temperatures in the northern hemisphere for a thousand years.
The Intergovernmental Panel on Climate Change (IPCC) has exposed the potential dangers of long-term climate change and global warming: ‘Projected climate changes during the 21st century have the potential to lead to future large-scale and possibly irreversible changes in the Earth’s systems, resulting in impacts on continental and global scales’, said the IPCC on 16 February 2000.
A terrifying effect arising from the warming climate is that it has caused glaciers to melt. Glaciers have been melting ever since the end of the 19th century, and the rate of melting has accelerated since the mid-1970s, with glaciers now disappearing alarmingly fast. Scientists have proved that glacier melting is the result of climate changes due to an increase in anthropogenic greenhouse gas (GHG) emissions, and the greenhouse effect starting in the industrial era. The most significant changes in glacier volume have occurred since the end of the 1980s. This period includes the warmest decade and several of the warmest years on record. The change in global average temperatures over the past few decades is more pronounced at higher altitudes. The sensitivity of glacier volume changes to temperature is a function of precipitation; regions with higher precipitation are more sensitive to temperature and thus to temperature changes.
The changes are not immediate, but latent, as the melting has been increasing in intensity since the mid-1970s. It is difficult to make projections for future changes because of the seasonal nature of the glacier mass balance and the temperature and humidity sensitivity differences that vary between different glaciers and regions.
The topic of global warming has inspired
heated debate
A terrifying effect of the warming climate is that it
has caused glaciers to melt

Biofuel Sector 30 August 2006
80
Montana’s Glacier National Park is in danger of losing all remnants of its namesake. Having boasted 150 glaciers at the turn of 2000, now only 26 remain, all covering less than 1.5 sq km. Two of these glaciers are so small that they have even stopped flowing. Ice and snow cover on Kilimanjaro decreased from 12 sq km in 1912 to 2.6 km2 in 2000. The area covered by glaciers in the Ak-shirak range in Alaska diminished by 3.4% from 1943-77, and by over 20% from 1977-2001. There are numerous other examples around the world – it is a global phenomenon.
Figure 117: Cumulative volume change in glaciers globally (metre per sq m)
Source: Credit Suisse research
Glacier melting will have disastrous effects on humans. Nearly 75% of the Earth’s freshwater supply is in the form of glacier ice. One of the most crucial impacts to consider is the effect that rapidly melting glaciers have and will have on the hydrological system. Glaciers store precipitation from the winter to discharge it gradually during the summer (usually lacking in rainfall). There is usually an annual surge in river flow from the spring snowmelt; until the following winter, the flow is dependent on glacier melt and ground water.
Glacier melting would also be disastrous for the populations inhabiting river basins. Dams are affected by the rapid increase in flow and the associated flooding because of an amplified siltation process which, in turn, reduces dam life and increases flood risk. Access to hydropower and drinking water would be limited by the subsequent drying up of the river basins; the Himalayan glaciers feed the seven major rivers of Asia – the Ganges, Indus, Brahmaputra, Salween, Mekong, Yangtze and Huang He (Yellow) – and thus contribute to the year-round water supply of a vast population. In India alone, some 500 mn people, including those in New Delhi and Calcutta, depend on glacier-melt water that feeds into the Ganges River system. Glaciers in Central Asia’s Tien Shan Mountains have shrunk by nearly 30% between 1955 and 1990. In arid western China, shrinking glaciers account for at least 10% of freshwater supplies. Glacier melt buffers stream flow for irrigation, hydro and drinking water. Without seasonal glacier melt water input, the rivers have to draw on groundwater, a finite and non-renewable resource. The drainage of the watersheds is important to consider, along with the impact this will have on sustainable water management and access to fresh water for future generations.
The cumulative global glacier loss has started to
accelerate rapidly since 1998; the slope of the line
shows the rate of glacier loss

Biofuel Sector 30 August 2006
81
The Kyoto Protocol The Kyoto Protocol, an agreement among industrialised nations to reduce emissions of six greenhouse gases, was signed by more than 170 nations, including the US, the European Union, Canada and Japan. This was the most recent international effort to address the greenhouse effect. However, US President George W. Bush, announced in late March 2001 that the US would withdraw from the Kyoto Protocol. Instead of committing to the Kyoto Protocol standards, President Bush suggested that the US should adopt other measures, such as developing energy-efficient technology, encouraging industries to reduce greenhouse gas emissions through market-based incentives and sequestering carbon in the soil through conservation programmes.
The Kyoto Protocol could only be enforced internationally if it is endorsed by at least 55 nations that totally accounted for not less than 55% of the total carbon dioxide emissions in 1990. Given that the US alone was responsible for about 25% of total emissions, experts predicted that the Kyoto Protocol would never be implemented without the involvement of the US.
The European Union aims to increase the percentage of renewable sources of energy in the electricity supply to 21% by 2010 from 14% in 2001. In addition, the share of renewable energies in total primary energy consumption in the European Union is targeted to increase from 6% in 2001 to 12% in 2010. However these targets can only be reached if all of the Member States implement the European Union requirements on a timely basis. According to the PV Status Report (2004) published by the European Commission, based on current developments, the European Union estimates that the share of renewable energies in the electricity supply will increase to 18-19% until 2010 and their share of total primary energy consumption will amount to between 9% and 10% by that time.
The German government aims to reduce the level of CO2 emissions by 21%, compared to the 1990 level, between 2008 and 2012 and, at the same time, to increase the share of renewable energy in the electricity supply to at least 12.5% by 2010, double the 2000 level, and to at least to 20% by 2020 German’s targets are lower than the European Union’s targets because Germany started on a lower level regarding the relative share of renewable energy compared with the rest of the European Union. A number of industrialised countries initiated programmes aimed at promoting these goals in order to achieve them; Germany is one of the leading countries in this regard.
Global experiences to decrease emissions of GHG Recognising the emission of GHG (green house gas) is the main reason for the warming weather and many countries have established emission standards in the implementation of their air quality management strategies.
We discuss the experience of the US as a good example of how countries can decrease the emission of pollutants by taking effective measures.
In the US, emissions are regulated by the Clean Air Act Amendments of 1990. Phase 2 of the Clean Air Act Amendments came into effect on 1 January 2000. Phase 2 mandates that all major coal-fired power plants reduce their SO2 emissions to 1.2 pounds of SO2 per mmbtu. Phase 2 of the Clean Air Act Amendments places a system-wide cap on total SO2 emissions in the US. The 1.2 pound SO2 per mmbtu ratio was based upon the energy
Emission standards have been established in many
countries to implement their air quality
management strategies
The US’s experience in decreasing emissions of
pollutants

Biofuel Sector 30 August 2006
82
output of the system in 1987-88, when the law was written. In other words, each power plant is allowed to emit 1.2 pounds of SO2 per mmbut, based upon the power output of that plant in the late 1980s. For example, if a given power plant is producing double the amount of power today that it was in 1988, its effective average SO2 compliance limit is 0.6 pounds, not 1.2 pounds. Obviously, any new plants constructed since 1989 are allowed zero emissions of SO2. For the entire system, it is estimated that the effective average Phase 2 compliance level is 0.9 pounds of SO2 per mmbtu and this is likely to keep falling as energy output rises and new coal-fired plants are built. In addition, President Bush’s Clear Skies proposal calls for further cuts in SO2 by 2008.
The US also introduced an emission-trading programme in 1990 to encourage coal-fired power plants to decrease pollutant emissions. Under such a programme, the government will set emission targets each year and issue tradable licences that give their owners – mainly factories and power producers – the right to produce a permitted level of the pollutant. Companies producing a permitted level are allowed to store the excess capacity for future use or trade it with other corporations that cannot meet the pollution targets by authorities. Power plants that exceed the cap will have no choice but to purchase excess emission credits at market prices.
The introduction of an emissions trading system can also encourage companies to use low sulphur content coal. Below we show the conversion of the percentage of sulphur into pounds of SO2 taking the sulphur content of coal produced as our base of calculation. The sulphur content of coal produced in the US varies from 0.4 pounds per mmbtu to 6 pounds per mmbtu.
Figure 118: The conversion of percent sulphur into pounds of SO2 Many times, coal quality is listed as % sulphur per ton.
Utility compliance with the Clean Air Act is measured in pounds of SO2 emissions per mmbtu (energy content). Investors can convert % sulphur content into pounds to SO2 per mmbtu using the following formula.
The Molecular Weight of SO2= S(32.1)+O2(32.0) = 64.1 SO2/S=?
64.1/32.1=1.9969 Therefore, if coal is listed as having
Heat content Sulphur content (%) 13,000 btu/lb 2.00%
The SO2 content per mmbtu calculation is as follows: Pounds needed for 1,000,000 btu:
1,000,000/13,000=79.1 lbs of coal @2% sulphur content = 1.539 lbs of sulphur 1.9969x1.539=3.07 lbs of SO2 per mmbtu
Source: Credit Suisse research
In the US, the value of an emission allowance is embedded in the coal price. Therefore, low-sulphur coal prices have risen faster than high sulphur coal prices. The price competitiveness of natural gas will depend on how high the Emission Allowance (EA) price is under the Emission Trading System.
Carbon dioxide emissions in China As shown below, relative to other Asian nations, the level of China’s carbon emissions per dollar of GDP (carbon intensity) is comparatively high, due to China’s almost complete dependence on coal. In 2001, China’s carbon intensity was only lower than that of South Korea. This indicates that there is still ample room for China to catch up with its peers in term of carbon dioxide emission controls.
The price competitiveness of natural gas will depend on how high the Emission
Allowance (EA) price is under the Emission
Trading System

Biofuel Sector 30 August 2006
83
Figure 119: Carbon emissions in Asia (2001) (metric ton per US$)
India Japan Thailand Indonesia China Korea
0.000.020.04
0.060.080.100.120.14
0.160.180.20
India Japan Thailand Indonesia China Korea
0.000.020.04
0.060.080.100.120.14
0.160.180.20
India Japan Thailand Indonesia China Korea
(metric ton per US$)
India Japan Thailand Indonesia China Korea
0.000.020.04
0.060.080.100.120.14
0.160.180.20
India Japan Thailand Indonesia China Korea
0.000.020.04
0.060.080.100.120.14
0.160.180.20
India Japan Thailand Indonesia China Korea
0.000.020.04
0.060.080.100.120.14
0.160.180.20
India Japan Thailand Indonesia China Korea
0.000.020.04
0.060.080.100.120.14
0.160.180.20
India Japan Thailand Indonesia China Korea
0.000.020.04
0.060.080.100.120.14
0.160.180.20
India Japan Thailand Indonesia China Korea
0.000.020.04
0.060.080.100.120.14
0.160.180.20
India Japan Thailand Indonesia China Korea
0.000.020.04
0.060.080.100.120.14
0.160.180.20
India Japan Thailand Indonesia China Korea
0.000.020.04
0.060.080.100.120.14
0.160.180.20
India Japan Thailand Indonesia China Korea
Source: Credit Suisse research
The table below shows a comparison of emission standards for new coal-fired power plants in China and several other countries in 2000. We note that emission standards in other Asian countries were significantly tighter than those in China.
Figure 120: Emissions standards for coal-fired power plants 2000 Particulate matter SO2 Nox as NO2 (mg/m3) (mg/m3) (mg/m3)China 200-600 1,200-2,100 650-1,000Hong Kong 50 200 670Indonesia 125 750 850Japan 100 k-value method 410Korea 50 770 720Malaysia 400 Ambient only Ambient only'Thailand 400 Ambient only 940United States 40 1,480 560-620Source: Study on Atmospheric Emissions Regulations in APEC economies and their compliance at coal-fired plants, Credit Suisse research
China is still entitled to the so-called clean development mechanism (CDM) of the Kyoto Protocol, which exempts developing countries that have signed the treaty from reducing greenhouse gas emissions. In addition, China can also seek technical assistance from developed countries, which are able to earn emissions-trading credits for helping the developing world to cut emissions.
Although the international rules for the CDM are still being developed, China’s government is already trying to set up its own internal CDM rules. Given China’s current developing country status, we do not see any immediate negative impact from the Kyoto Protocol for the PRC IPPs. However, we believe it is inevitable that China’s government will tighten carbon dioxide emission controls in the long run.
In order to promote the use of biodiesel, many countries around the globe have already implemented tax breaks and other incentives on biodiesel.

Biofuel Sector 30 August 2006
84
Figure 121: Overview of worldwide biofuel policies Country Policy EU Goal of attaining 5.75% of transportation fuel needs from biofuels by 2010 in all member states Brazil Mandated 20-26% ethanol in all gasoline Canada Intention for all gasoline to contain minimum 5% ethanol by 2010 Colombia Mandated use of 10% ethanol in all gasoline sold in cities with populations exceeding 500,000 US Renewable Fuels Standard (RFS) mandates annual use of 7.5 BGPY of renewable fuels by 2012 China Mandated 10% ethanol in gasoline in some provinces India Mandated 5% ethanol in gasoline in a number of regions Japan Intention for all gasoline to contain 10% ethanol by 2030 Source: Credit Suisse research
Australia Although biodiesel is well known, produced, used and specifically legislated for in Europe and the US, it remains in the shadows in Australia. In May 2003, the Australian Federal Government implemented an initiative to promote the use of biodiesel. This measure was formed as part of broader reforms to the fuel tax arrangements, which brought all untaxed fuels used in internal combustion engines into the exercise system.
As of 18 September 2003, locally manufactured biodiesel for use in internal combustion engines is subject to the same rate of 38.143 cents per litre of exercise tax as low sulphur diesel. Simultaneously, the Australian Federal Government introduced the ‘Cleaner Fuels Grants Scheme’ for biodiesel manufactures and importers of eligible cleaner fuels. From 18 September 2003 to 30 June 2011, the scheme provides a grant of 38.143 cents per litre and thus, resulting in a zero net exercise effect on biodiesel. Thereafter, the grant will be reduced in five equal annual instalments to decrease the effective exercise rate to half that of fossil-diesel. Export sales of biodiesel are not subject to exercise tax in Australia.
European Union The primary initiatives to promote biodiesel include the implementation of tax breaks and exercise tax exemption. However, VAT is still payable on biodiesel. The implementation of tax breaks and exercise tax exemption significantly increase the competitiveness of biodiesel vis-à-vis fossil diesel. As of June 2005, exercise tax represents around 30-55%, whereas VAT represents around 13-20% of the end-customer diesel price. In conjunction with the recent surge in the price of fossil diesel, the substantial tax imposed on fossil diesel increases the competitiveness of biodiesel in EU markets.
The primary initiatives to promote biodiesel include the implementation of tax
breaks and exercise tax exemptions in Europe

Biofuel Sector 30 August 2006
85
Figure 122: Fossil-diesel price over time (cents/litre)
Diesel price Without VAT All taxes included
0102030405060708090
100
1987 1988 1989 1990 1991 1992 1993 1994 1995 1996 1997 1998 1999 2000 2001 2002 2003 2004 20050
102030405060708090
100
1987 1988 1989 1990 1991 1992 1993 1994 1995 1996 1997 1998 1999 2000 2001 2002 2003 2004 2005
Source: Eurostat, Credit Suisse research
On 8 May 2003, in order to promote renewable energy further, the European Parliament and the Council of the European Union adopted EU Directive 2003/30/EC, ‘The promotion of the use of biofuels or other renewable fuels for transport’. The directive established a national indicative target for the proportion of biofuels placed in the markets of the Member States. These reference values are 2% in 2005, calculated on the basis of energy content of all petrol and diesel used for transport during that year, and 5.75% in 2010.
On 27 October 2003, the European Parliament and the Council of European Union adopted EU Directive 2003/96/CE, ‘Restructuring the community framework for the taxation of energy products and electricity’. The directive allows Member States to potentially reduce or even exempt exercising taxes on biodiesel. The level of reduction can be adjusted to account for changes in the cost of raw materials in order to avoid over-compensating biofuel manufacturers.
Figure 123: EU end-customer diesel price composition, June 2005
0 20 40 60 80 100 120Estonia
LatviaLithuania
CyprusLuxemberg
GreeceSpain
Czech RepublicSlovenia
PolandMalta
PortugalAustria
BelgiumSlovakiaFinland
DenmarkNetherlands
FranceHungary
IrelandGermanySweden
ItalyUnited Kingdom
0 20 40 60 80 100 120Estonia
LatviaLithuania
CyprusLuxemberg
GreeceSpain
Czech RepublicSlovenia
PolandMalta
PortugalAustria
BelgiumSlovakiaFinland
DenmarkNetherlands
FranceHungary
IrelandGermanySweden
ItalyUnited Kingdom
cents/litreDiesel Price Tax VAT
Source: Eurostat
The directive established a national indicative target
for the proportion of biofuels placed in the
markets of the Member States is 5.75% in 2010,
calculated on the basis of energy content of all petrol
and diesel used for transport purpose during
that year

Biofuel Sector 30 August 2006
86
Figure 124: EU diesel price, tax and VAT, June 2005
0 10 20 30 40 50 60 70 80 90 100Estonia
LatviaLithuania
CyprusLuxemberg
GreeceSpain
Czech RepublicSlovenia
PolandMalta
PortugalAustria
BelgiumSlovakiaFinland
DenmarkNetherlands
FranceHungary
IrelandGermanySweden
ItalyUnited Kingdom
(%)0 10 20 30 40 50 60 70 80 90 100Estonia
LatviaLithuania
CyprusLuxemberg
GreeceSpain
Czech RepublicSlovenia
PolandMalta
PortugalAustria
BelgiumSlovakiaFinland
DenmarkNetherlands
FranceHungary
IrelandGermanySweden
ItalyUnited Kingdom
(%)cents/litre
Diesel Price Tax VAT Source: Eurostat
Figure 125: EU diesel tax, June 2005
0 10 20 30 40 50 60 70LatviaMalta
EstoniaCyprus
LithuaniaGreece
LuxembergPolandSpain
PortugalAustria
BelgiumCzech Republic
SloveniaFinland
HungaryDenmark
IrelandSlovakia
NetherlandsSweden
ItalyFrance
GermanyUnited Kingdom
0 10 20 30 40 50 60 70LatviaMalta
EstoniaCyprus
LithuaniaGreece
LuxembergPolandSpain
PortugalAustria
BelgiumCzech Republic
SloveniaFinland
HungaryDenmark
IrelandSlovakia
NetherlandsSweden
ItalyFrance
GermanyUnited Kingdom
cents/litreTax
Source: Eurostat

Biofuel Sector 30 August 2006
87
Figure 126: Biodiesel tax breaks compared to fossil diesel Austria Full exemption for pure biodiesel and blends up to 2%. Belgium Discussions to introduce full exemption underway. Denmark No measures currently in place. Finland No measures currently in place. France Partial exemption of €330 m³, with a quota of 317,000 t. Only for blends of up to 0.5%, and pure biodiesel is not covered by measure. Germany Total tax exemption, but the mandatory blending subsidies will be slowly reduced. Greece No measures currently in place. Ireland No measures currently in place. Italy Full exemption up to a quota of 300,000 t. Pure biodiesel used for heating (rather than transport) can avail of measure. Netherlands Discussions to introduce full exemption underway. Portugal Discussions underway on incentives to introduce. Poland Full exemption and defined mandatory targets for biofuel market penetration. Spain Full exemption for biofuels. Sweden Full exemption until at least 2008. UK Exemption of £0.20 per litre on bio-ethanol and biodiesel. Source: Agra Focus and FAS Dublin, Credit Suisse research
In addition, EU Directive 2003/96/CE set a minimum tax level of 30.2 cents/litre and 33 cents/litre for fossil-diesel use as a motor fuel by 2004 and 2010, respectively. Spain, Austria and Belgium successfully negotiated a delay and will implement the minimum tax level of 30.2 cents/litre and 33 cents/litre by 2007 and 2012, respectively. Member States that are admitted into the EU after the adoption of the directive are also expected to negotiate for a delay.
United States The Energy Policy Act of 2005 (EPAct) (Public Law 109-58) is a statute that was passed by the US Congress on July 29, 2005 and signed into law on August 8, 2005 at Sandia National Laboratories in Albuquerque, New Mexico. The Act, described by proponents as an attempt to combat growing energy problems, provides tax incentives and loan guarantees for energy production of various types.
To a large extent, the EPAct was responsible for the increase in the popularity of biodiesel in the US, especially for the use of biodiesel in government fleet. The revised EPAct states that one biodiesel fuel use credit, which is counted as one AFV (alternative fuel vehicle) acquisition, is allocated to fleets for each purchase of 450 gallons of net biodiesel fuel, for use in diesel vehicles of more than 8,500 lbs. The biodiesel must be neat (B100) or in blends that contain at least 20% biodiesel (B20). Fleets are allowed to use these credits to fulfil up to 50% of their EPAct requirements. These credits can be claimed only in the year in which the fuel is purchased for use, and they cannot be traded along fleets.
The importance of biodiesel is also expected to increase, as EPA regulations will require the use of ultra-low sulphur diesel fuels in all US highway diesel engines by 2006. Unfortunately, ultra-low sulphur diesel fuels can have poor lubricating properties. The low lubricating properties of ultra-low sulphur diesel fuels can be mitigated via the addition of biodiesel into the mix.
However, while the US is currently one of the largest producers of biodiesel, its biofuel consumption is still dominated by ethanol, rather than biodiesel. Subsidies are playing a big role in popularising biodiesel as well as celebrity sponsorship of biodiesel products. In the bid for promoting the use of biodiesel, the 2005 EPAct permits a US$0.50-

Biofuel Sector 30 August 2006
88
1.00/gallon exercise of tax exemptions, depending on the feedstock used, until 2008. Currently, Bio-era estimates that US biodiesel production is around 200,000 tons and expects this to reach around 1 mn tons by 2010.
A joint programme with the US Department of Agriculture (USDA) and the Department of Energy (DOE) will see an investment of over US$2 bn in bio-refineries and bio-energy research and development of biomass processing technologies over the next ten years. A further US$750 mn in FY06-09 will be given to the Environmental Protection Agency (EPA) to fund at least four conversion technologies for producing cellulosic biomass ethanol.
As part of the ‘Advanced Energy Initiative’ announced by President Bush in his 2006 State of the Union address, the US Energy Policy initiative will involve cost-shared three-year funding to construct three commercial bio-refineries, which will cost up to US$160 mn.
Brazil In 2000, Brazil launched its second biodiesel programme called ‘Probiodiesel Programme’, after the ‘Prodiesel Programme’ failed in 1985. The launch of this programme was due to economic, environmental and strategic motivations. In 2002, MST (Brazil’s Landless Workers Movement) established a national network to study biodiesel from soybean and ethanol. In 2003, the new government installed an Interministerial Committee (IC) for biodiesel, which concluded that the introduction of biodiesel could bring social, economic, environmental and strategic benefits, which of course satisfied the original targets.
In December 2004 and May 2005, Law 11116 and Decree 5297 were introduced, respectively. These laws and decrees gave the exemption to pay IPI tax; tax reduction for biodiesel producers.
Law 11097 was set on January 2005. This introduced Brazil’s energy matrix and a fixed mandatory 5% mixture of biodiesel (B5) from 2013, a fixed 2% (B2) from 2008 (800 mn litres/year), and authorizes B2 from 2005.
On 23 September 2005, the National Council for Energetic Policy launched Resolution #3, aimed at encouraging oil producers and importers to purchase all biodiesel produced from companies or associations awarded with SFS, from 1 January 2006.
ASEAN (Association of South-East Asian Nations) Although some of ASEAN’s member countries are rich in natural resources such as oil and gas (e.g., Brunei Darussalam and Indonesia, which are ranked among the world’s top five liquid natural gas (LNG) producers), encouraging the development of the biodiesel industry could still ease ASEAN’s exploding energy demand and boost their agricultural industries, such as palm oil.
Indonesia According to our Indonesian analyst, Haider Ali, a number of statements by cabinet ministers and government officials indicate positive policy momentum. However, formal policies have yet to be announced. These statements include reserving 6 mn tonnes of

Biofuel Sector 30 August 2006
89
CPO by both the Indonesian and Malaysian government for biodiesel production, the allotment of 6 mn hectares of new land in Indonesia for palm plantations, and a potential incentive package for the biodiesel sector in Indonesia. Actual government policies and plans introduced in 2006 are as follows:
• A presidential decree – Peraturan Presiden (PP), no. 5/2006 – specifies the national policy on energy conservation and usage. Specifically, it directs national energy elasticity to be lowered to 1.0 (a 1991-2003 average of 1.48) and achieve a more balanced energy mix by 2025 (see Figure 128). The president also directed the Ministry of Energy and Mineral Resources (MESDM) to develop a national energy blueprint based on these guidelines. The president also instructed the relevant miniseries on 25 January 2006 to formulate detailed policy packages towards achieving this national energy goal.
Figure 127: Indonesia – primary energy mix (2004) Figure 128: Indonesia – target primary energy mix (2025)
Oil and fuels56%
Gas / LPG20%
Geo-thermal3%
Hydro power4%
Coal17%
Oil and fuels
20%
Biofuel5%
Coal33%
Liquified coal2%
Gas / LPG30%
Geothermal5%
Renew able5%
Source: MESDM, Credit Suisse estimates Source: PP 5/2006, Credit Suisse estimates
• MESDM’s national energy blueprint calls for a 2% biofuel mix in 2005-10, or an estimated annual domestic usage of 720,000 kl, which is raised to 3% in 2011-15 (1.5 mn kl/) and 5% in 2016-25 (4.7 mn kl).
Besides the tax breaks, the Indonesian government has required Rp100 tn to be invested in various feedstock in order to develop biofuel energy It should be noted that while the policy and the energy blueprint specifically discuss biodiesel, in practice the government is likely to encourage all biofuel projects, including palm oil or Jatropha-based biodiesel and cassava- or sugarcane-based ethanol.
Besides the tax breaks, the Indonesian government has required Rp100 tn to be invested in various feedstock in order to develop biofuel energy, of which, around Rp30 mn/ha is estimated to be invested in palm oil plantations and Rp3 mn/ha in Jatropha. In the meantime, the minister for state-owned enterprises, Sugiharto, said that state-owned banks are able to extend Rp24 tn of credit from the Rp100 tn expected to be extended by commercial banks for the development of biofuel, especially for investment in palm oil plantations. Moreover, the government is looking to revoke
A presidential decree provides the foundation for
future policy direction

Biofuel Sector 30 August 2006
90
213 plantation licences where logging has taken place but no effort to do any replanting has been initiated.
A regulatory package will soon be released allowing foreign oil firms to distribute biodiesel in order to enhance competition. To encourage demand, the government is imposing a requirement on Pertamina (not listed) and PLN (not listed) to be the standby offtaker of 21.5 mn kl biofuel of the expected 23.432 mn kl produced by 2010. The move is intended to curb the nation’s reliance on imported oil. For production of 21.5 mn kl, it requires 6.5 mn ha of plantation area, with an investment value that could reach Rp250 tn. PLN has reported that it is ready, and has in fact started, to use biofuel products.
As for ethanol, the National Energy Planning is targeting for consumption to reach 550 mn litres, 850 mn litres and 1,500 mn litres in 2010, 2015 and 2020, respectively.
As reported by the Jakarta Post, a regulatory package will soon be released allowing foreign oil firms to distribute biodiesel in order to enhance competition. The plan should reduce biodiesel producers’ concern about Pertamina’s ability to control prices. Genting (GENT MK, RM24.30, OUTPERFORM, TP RM28.50) from Malaysia has expressed interest in investing in 1 mn ha of oil palm and Jatropha plantations, while some Chinese investors are looking to invest 0.5-1 mn ha of sugar cane and cassava plantations. Head of Asian Agri (not listed), , has said that CPO exports to the EU and US are usually subject to an ‘orang-utan’ discount of US$5/tonne imposed by purchasers. Of the 17 licences approved for biodiesel plant development, 12 are held by foreign investors.
Malaysia The Envo B5 will probably not be commercially launched until late 2007, delayed from the original plan of early 2007. Malaysia is in the midst of formulating its biofuel policy. The government announced the introduction of a National Biofuel Policy on 10 August 2005. The three-pronged strategy includes:
• the production and use of biofuel for the transportation and industrial sectors;
• biofuel production for export; and
• the commercialisation of biofuel technology.
The four initial measures stated by the government are:
• the establishment of a 5% palm-oil-based biodiesel blend;
• encouraging the trial use of biofuel;
• the establishment of a commercial plant in Negeri Sembilan; and
• the development of a standard by Sirim for the new biodiesel.
Four government ministries are currently using the Envo B5 blend, which is a blend of 5% refined olein and 95% mineral diesel, in a test run. In Miri, Sarawak, three bus companies have volunteered for the trial, allowing their buses to use this B5 bio-fuel. If the Malaysian government were to commercialise B5 fully for domestic use, we estimate that some 0.5 mn tonnes of palm oil would be used as biofuel in Malaysia. The Envo B5

Biofuel Sector 30 August 2006
91
will probably not be commercially launched until late 2007, delayed from the original plan of early 2007.
The Philippines The DOE has mandated the use of 1% coconut-based biodiesel in all government diesel vehicles. The DOE also plans to implement the use of a 5% biodiesel blend nationwide.
Tax exemptions will also be received for the pioneering of biodiesel production and for the purchase of foreign equipment to do so. In addition, fiscal and non-fiscal incentives are provided and a high priority in seeking financial assistance.
For ethanol, a Biothanol Bill is being debated currently in the Senate. It mandates the minimum blending with gasoline of E5 within two years (2008), which requires 220 mn litres per year, and E10 within four years (2010), which requires 480 mn litres.
Thailand Thailand aims to make a 10% biodiesel blend available by 2012. Thailand aims to make a 10% biodiesel blend available by 2012. E10 is currently available at more than 4,000 retail stations in Thailand. The government has also launched a programme, and a 10% blend for gasoline has been mandated from 2007, with a ban on MTBE (methyl tert-butyl ether) imports. Higher blends are expected (E20 and E85) once domestic production increases sufficiently.
Vietnam Legislation is currently being drafted for the development of a national biofuel programme.
Korea B0.5 biodiesel for private vehicles has been on sale in Korea since 1 July 2006. South Korea has no domestic oil reserves and is the world’s seventh-largest oil consumer and fifth-largest importer of crude oil. B0.5 biodiesel for private vehicles has been on sale in Korea since 1 July 2006. The low percentage of blending (Europe has 5% biofuel-blended diesel) appears to be a compromise between refiners and the government amid a lack of an adequate local supply of vegetable oil, the raw material used in biodiesel production, and lack of preparedness by the South Korean automotive industry. Nevertheless, it is a step forward. The government still wants refiners to switch to B20 after two years. In a bid to encourage the use of biodiesel, the government has offered some fiscal benefits, but due to the meagre percentage of blending, the price of biodiesel is only W2/litre lower than that of conventional diesel.
Japan The RPS Law requires all electric power utilities to supply 1.35% of total electricity from renewable sources by 2010. Japan is the fourth-largest energy consumer in the world and remains highly dependent on oil imports. Enacted in 2002, the Law Concerning Special Measures for Promotion of the Use of New Energy (the RPS Law) requires all electric power utilities to supply 1.35% of total electricity from renewable sources by 2010. The Japanese government has also set a target of 3% of total energy consumption from new sources by the same year. Unfortunately, the availability and

Biofuel Sector 30 August 2006
92
stability of supply is currently a major problem facing the development of a biofuel market in Japan. In May 2005, Japan signed a US$578 mn loan agreement with Brazil to finance infrastructure, which should result in increased exports of biofuel to Japan. The Japanese government had aimed to introduce automobile fuel containing 3% bio-ethanol in the market in 2005, but the plan failed because of inadequate supply.
In order to encourage the uptake of ethanol, the Japanese government proposed an E3 standard in 2004 as a prelude to a national E10 blend standard by 2010. The E3 initiative began in April 2005. However, due to insufficient of ethanol supply, the scheme failed. The Ministry of Economy, Trade and Industry plans to sell the biofuel at special gas stations in 2008, and it estimates that by 2010 around 10% of gasoline in Japan will be mixed with bio-ethanol.
India The Bio-diesel purchase policy provides for the purchase of bio-diesel by oil marketing companies at a reasonable price from some 20 purchase centres in 12 states. India has begun many biodiesel initiatives, one of which being field trials of biodiesel by many vehicle companies. Studies of biodiesel blends of up to 20% are being conducted to analyse the feasibility of biodiesel as an automotive fuel. Indian Oil Corporation (IOC) (IOCL IN, INR470.9, not rated) are conducting field trials of biodiesel, using it on bus fleets in Haryana and Mumbai. IOC is also conducting trials on railways with biodiesel. Furthermore, specifications for biodiesel (B20) have been drafted by the Bureau of Indian Standards (BIS) and circulated to all stakeholders for comments, and are likely to be finalised soon.
The Bio-diesel Purchase policy, announced by the Ministry of Petroleum and Natural Gas on 9 October 2005, provides for the purchase of bio-diesel by oil marketing companies at a reasonable price from some 20 purchase centres in 12 states. The blending of biodiesel at a maximum of 5% will be undertaken initially at these 20 centres depending on availability. The initiatives by industry include R&D (e.g., engine trials and process technology), Jatropha plantations and biodiesel production facilities.
China On 24 July 2006, Mr Zhu Zhigang, vice-minister of China Ministry of Finance, said that China was formulating a mid-/long-term development plan for biomass energy. He mentioned that the government was aiming for the consumption of biomass energy to account for 20% of oil consumption by 2020. Specifically, the government hopes the liquid biofuels capacity can reach 20 mn tonnes/year by 2020, of which bio-ethanol should reach 15 mn tonnes/year and biodiesel should reach 5 mn tons/year. (according to Xu Dingming, head of the Energy Bureau of the NDRC, the upcoming Renewable Energy Long-/Mid-term Plan, the target by 2020 is 12 mn tonnes of biofuel production capacity, of which 2 mn will be biodiesel.)
Besides the above initiatives, China is making policies and incentives for renewable energy as a whole, rather than for biomass alone.
The 11th FYP saw the increase in the Chinese government’s commitment to promoting renewable energy. Xu Dingming stated that up to RMB800 bn (US$100 bn) would need to be invested by 2020, with some of the investment expected to come from
The current government subsidy is at
RMB0.25 per kWh

Biofuel Sector 30 August 2006
93
international and private investors. In addition, a 50% tax break is currently available for investors in solar, wind and renewable energy. Currently, the government is considering more favourable incentives to encourage business to invest in renewable energy projects. The proposed RMB0.25/kWh (which should decline by 2% p.a. after 2010) subsidy for electricity generated using non-hydro renewable energy represents approximately 0.90%, 1.25% and 1% of China’s GDP in 2004, 2010 and 2020, respectively, assuming a GDP CAGR of 7.5% in 2005-10 and 4% in 2010-20. According to the China Daily, the Ministry of Finance will launch a fund to help research into and development of renewable energy. Although the size of the fund has not yet been established, the money will be allocated in the form of subsidies and interest repayments.
The energy authorities of local governments above the county level are responsible for the management of the development and utilisation of renewable energy within their own jurisdictions. Medium- and long-term targets on the total volume of renewable energy to be developed at the national level will be determined by the State Council.
The 11th FYP sets out a tender process for licences for the construction of renewable power generation projects. Grid enterprises are required to purchase renewable energy generated by licensed generators in their region.
Based on the 11th FYP, local governments above the county level are required to prepare a renewable energy development plan. They are also required to provide financial support for the renewable energy utilisation projects in rural areas.
The law that came into effect at the beginning of 2006 stipulates two forms of renewable energy pricing: the government-set price and the government-‘guided’ price. For biopower, the government will set the price based on the provincial or local on-grid price of desulphurised coal-fired power, plus a government subsidy of RMB0.25 (US$0.03) per kWh. Biomass plants with an output of more than a 20% blend of fossil fuel will not be eligible for the RMB0.25 per kWh subsidy. The subsidy will cease when the project has been operating for 15 years. Subsidies are also set to decrease by 2% YoY for projects approved after 2010. For biomass projects, licensees that are determined through competitive bidding process will have the project power tariffs set based on the bid-winning price, as long as it does not exceed the local price of on-grid power.
The NDRC stated that the additional tariff for renewable energy is computed as the proportion of total additional tariff of renewable energy to national electricity sales (with additional tariff included). The total additional tariff of renewable energy accounts for the higher running and maintenance costs of renewable energy plants, connection fees of renewable energy power projects and other fees.
The on-grid price of wind power will be established by the State Council based on the bid-winning price. The price of solar, marine and geothermal power projects will be determined on an ‘economic and reasonable’ basis. The pricing of hydropower is not affected by this new law. The cost differential between on-grid renewable power and power from an on-grid desulphurised coal-fired plant will be shared in the selling price at the provincial and national level.
Assuming an average of RMB0.25 per kWh subsidy for all electricity generated using non-hydro renewable energy, it implies a total additional tariff of RMB182 bn in 2006, which represents around 0.9% of China’s estimated GDP for 2006 and will amount to
The cost difference between on-grid renewable
power and power from an on-grid desulphurised
coal-fired plant will be shared in the selling price
at the provincial and national level

Biofuel Sector 30 August 2006
94
1.25% and 1% of China’s GDP in 2010 and 2020, respectively. Our estimates take into consideration the 2% p.a. decrease in subsidy after 2010, our 7.5% GDP CAGR assumption from 2005-10 and 4% CAGR assumption from 2010-20. According to a presentation by Li Shan Shi of the NDRC, between 2006 and 2020, around 23% of non-renewable energy capacity will be used for means other than electricity generation.
Figure 129: China – government subsidy for non-hydro renewable energy
Figure 130: China – subsidy percentage of GDP
(RMB/kwh)
Subsidy
0.00
0.05
0.10
0.15
0.20
0.25
2006 2008 2010 2012 2014 2016 2018 2020
Subsidy for non-hydro renewable/GDP
(%)
0.0
0.2
0.4
0.6
0.8
1.0
1.2
1.4
2006 2008 2010 2012 2014 2016 2018 2020
Source: NDRC, Credit Suisse estimates Source: NDRC, Credit Suisse estimates
The 11th FYP states that power grid enterprises that fail to purchase renewable power in full, resulting in economic loss to renewable power generation enterprises, will be penalised. The magnitude of the penalty, however, will be less than the size of the economic loss.

Biofuel Sector 30 August 2006
95
Policies on the development of renewable energies The current structure of the legislation implies that the State Council is responsible only to provide a broad picture guideline, whereas detailed implementation will be carried out by local governments. The current structure of legislation may negatively affect power grid enterprises that are required to purchase power generated from renewable power generators.
Figure 131: Classification of policies on the development of renewable energy First level Task Activities/results Central Government (National People’s Congress (NPC), State Council (SC))
Providing general direction and guidance Provides general direction and guidance; speeches of state leaders about development of renewable energy and the Chinese government’s standpoint on the global environment; Provides the enabling environment to facilitate the implementation of the other two levels by issuing regulations
Second level Task Activities/results Relevant departments of the Central Government (National Development and Reform Committee- NDRC), National Economic and Trade Committee (NETC), Ministry of Science and Technology (MOST), Ministry of Water Resources (MWR), Ministry of Agriculture (MOA) and Ministry of Commerce (MOC))
Specifying goals/objectives and development plans
Specifies goals/objectives and development plans focusing on rural electrification, renewable energy-based technologies and fuel wood. Aims to standardize trends, focal points, and objectives of renewable energy development from different points of view. Some departments propose specific policies regulations. Second-level policies have played a key-role in promoting technologies for renewable energies.
Third level Task Activities/results Local governments: provincial and municipal governments, county governments
Practice oriented, specific incentives and managerial guidelines
Outlines specific supporting measures for developing and using renewable energy, applying practical and specific incentives and managerial guidelines; Provides crucial support to develop renewable energy in its early introductory stage; Executes what the previous two levels require. Since the mid-1990s, many provinces and autonomous regions have adopted policies including subsidies and tax reduction to develop and implement renewable energy.
Source: GTZ, Credit Suisse research
As biodiesel technology is in the initial stages of dissemination, it is characterised by high capital costs, low productivity and low profit margins. From the viewpoint of China’s still ‘socialist’ market, it would be impossible for the biodiesel industry to grow without government support. Thus, the newly established Renewable Energy Promotion Law and, since February 2005, the CO2-emissions trading system, are thought to stimulate the introduction of liquid biofuel in the transport sector. And since the third level category specifies and executes supporting measures for the development and utilisation of biofuel, the policies at the third level are crucial to achieving the objective of biofuel production and market development. Since January 2005, in order to share less fossil fuel among more vehicles, the Chinese automobile efficiency standard defines that all new cars must adhere to limitations on their fuel consumption ranging from a maximum of 6.2 l100 km for small vehicles to 15.5 l/100 km for small trucks.
Some provincial governments have set up so called ‘gasohol offices’ to promote gasohol. Local governments, state-owned enterprises and other governmental organisations use gasohol as a transport fuel, further steps of the strategy to phase out pure gasoline until mandatory E10 can be supplied for the whole country.
Policies on the development of renewable
energies are categorised inthree levels in terms of
scope and characteristics

Biofuel Sector 30 August 2006
96
Figure 132: Major policies on the development of renewable energies Year Policy instrument Level 1983 Suggestions to Reinforce the Development of Rural Energy First 1992 China Agenda 21 First 1992 Ten Strategies on China's Environment and Development First 1994 Brightness Program and Ride the Wind Program, formulated by SPC Second 1995 SSTC Blue Paper No. 4: China Energy Technology Policy First 1995 Outline on New and Renewable Energy Development in China: SPC, SSTC, SETC First 1995 Electric Power Law First 1995 New and Renewable Energy Development Projects in Priority (1996-2010) China, by SSTC, SPC, SETC Second 1996 Guidelines for the Ninth FYP and 2010: Long-term Objectives on Economic and Social Development of China First 1996 State Energy Technology Policy First 1996 Ninth FYP and 2010 Plan of Energy Conservation and New Energy Development by the State Power Corporation Second 1996 Ninth FYP of Industrialization of New and Renewable Energy by SETC Second 1997 Electric Power Law First 1997 Energy Saving Law First 1997 Circular of the Communication and Energy Development of SPC on Issuing the Provisional Regulations on the Management of New
Energy Capital Construction Project Third
1998 Incentive Policies for Renewable Energy Technology Localization by SDPC and MOST First 1999 Circular of MOST and SDPC (now NDRC) on Further Supporting the Development of Renewable Energy Third 2001 Standards for bio-ethanol-fuel First 2001 Tenth FYP for New and Renewable Energy Commercialization Development by SETC Second 2001 Adjustment of Value-added Tax for Some Resource Comprehensive Utilization Products by MOF and State Tax Administration Third 2001 Electricity Facility Construction in Non-Electrification Townships in Western Provinces of China or Township Electrification Program by
SDPC (now NDRC) and MOF Third
2003 Renewable Energy Promotion Law (draft) First 2003 Rural Energy Development Plan to 2020 for Western Areas Second 2005 Renewable Energy Promotion Law First Note: NDRC = National Development and Reform Commission, SSTC = State Science and Technology Commission, SPC = State Planning Commission (now NDRC), SETC = State Economics and Trade Commission (now National-ETC), SDPC = State Development and Planning Commission (now NDRC), MOST = Ministry of Science and Technology, MOF = Ministry of Finance, FYP = Five-Year Plan Source: GTZ, Credit Suisse research

Biofuel Sector 30 August 2006
97
Investment risks The rapid growth of the biodiesel market has been supported by the dramatic surge in the price of fossil fuels. Conversely, a slump in the price of fossil fuels would have a detrimental effect on global biodiesel demand.
A substantial increase in the production capacity and number of biodiesel manufacturers would create greater competition for the supply of feedstock. Given the limited availability of supply, an increase in the demand for feedstock would put an upward pressure on prices.
As for Asian plantation companies, the EU’s concerns about farm protection may cast a shadow. If the EU restricts the use of palm oil as feedstock in order to protect its agriculture, such as rapeseed farms, demand for Malaysian and Indonesian palm oil may drop.
While adequate technology is a prerequisite, no substantial technology barrier exists in the biodiesel market. Invented in 1988, the manufacturing process for biodiesel is currently well known and understood. The remaining challenge is to achieve a production process that is cost-competitive with that of fossil diesel. Even if the lengthy government approval process might serve as a potential entry barrier to the biodiesel market, such a barrier would not be sufficient to prevent newcomers from entering and eroding the market share of the current manufacturers over the long term.
Government policy uncertainty is also a concern, e.g., change in the preferential tax treatment will put significant pressure on European biodiesel producers, since the biodiesel price competitiveness in Europe is highly dependent on tax breaks. And since most biodiesel producers are relatively small in terms of scale, the loss of key management officers and/or technical personnel and the shortage of headcount resources are also potential risks for their future capacity expansion.
In addition, the introduction of more stringent nationwide biodiesel standards, while possibly hindering newcomers, might induce higher production costs for the current biodiesel manufacturers.
Potential drop in fossil fuel prices, competition for the
supply of feedstock and competition from the
newcomers are the main risks of investing in
biodiesel sector

Biofuel Sector 30 August 2006
98
Appendix I: Primary biodiesel standards For the biodiesel industry, standards are of vital importance for producers, suppliers and users, and are necessary for the evaluation of safety risks, environmental protection and warranty commitment for vehicles. There are two primary government registrations that govern the specifications and standards of biodiesel: ASTM D 6751 by the US government and EN 14214 by the EU. However, there is still a lack of standardised specifications and regulations for biodiesel outside these two regions.
ASTM D 6751 Biodiesel is a legally registered fuel and fuel additive with the Environmental Protection agency (EPA). The EPA registration includes all biodiesel meeting the ASTM International biodiesel specification, ASTM D 6751, and is not dependent upon the oil or fat used to produce the biodiesel or the specific process employed.
The ASTM D 6751 describes biodiesel as long chain fatty acid esters from vegetable or animal fats that contain only one alcohol molecule on one ester linkage. Thus, raw or refined vegetable oil cannot be legally categorised as biodiesel as it contains three ester linkages. Biodiesel can be produced from methyl, ethyl, isopropyl and other alcohols, but most biodiesel research focuses on methyl esters, and virtually all commercial-production in the US today uses methyl esters.
Requirements for B100 as listed in ASTM D 6751-03 Property ASTM Method Limits UnitsFlash Point D93 130.0 min oCWater and Sediment D2709 0.050 max % volKinematic Viscosity, 40oC D445 1.9-6.0 Mm2/sSulfated Ash D874 0.020 max % mass
0.0015 max (S15) Sulphur D5453 0.05 max (s500) % massCopper strip corrosion D130 No. 3 max Cetane number D613 47 min Cloud point D2500 Report to customer oCCarbon residue D4530 0.050 max % massAcid number D664 0.80 max Mg KOH/gFree glycerin D6584 0.020 max % massTotal glycerin D6584 0.240 max % massPhosphorus content D4951 0.001 max % maxDistillation temperature, 90% D1160 360 max oCSource: US DOE, Credit Suisse research
Initially, the EPA requires that over 75% of new vehicle purchases by certain federal, state and alternative fuel provider fleets be alternative-fuelled vehicles. Based on the initial EPAct, only vehicles that run on B100 will qualify under the alternative fuel vehicle purchase provisions of EPAct. However, it appears that no vehicles meeting this requirement are available today, and thus that this vehicle credit has not created a market for biodiesel. EPAct was amended in 1998 by the Energy Conservation and Reauthorisation Act (ECRA). The amendment allows qualified fleets to use B20 in existing vehicles to generate alternative fuel vehicle purchase credits
EN 14214 Prior to the implementation of a unified standard by the EU, various biodiesel standards and legislations existed in Europe. The first biodiesel standard in Europe was published
There are two primary government registrations
that govern the specifications and
standards of biodiesel: ASTM D 6751 by the US
government and EN 14214 by the EU government

Biofuel Sector 30 August 2006
99
in Austria (ON C 1190) in 1994. The ONC 1190 covers only rapeseed-oil-methyl-ester (RME). ONC 1190 was soon followed by ON C 1191 which covered fatty-acid-methyl-ester (FAME), published on July 1997. Other standards soon followed, such as CSN 65 6507 in Czechia, CUNA NC 635-01 in Italy, SS 15 54 36 in Sweden and DIN E 51606 in Germany.
The unified biodiesel standard was the result of the work by European Commission-appointed CEN (Comité Européen de Normalisation). The result was the EN 14214 fuel standard for biodiesel, which was officially published in the third quarter of 2003. EN 14214 set forth the minimum requirements for biodiesel. According to the EN 590 specification for petroleum-based diesel, biodiesel meeting EN 14214 may be blended into European diesel fuel in quantities up to 5%
EN 14214 specifications Unit StandardDensity kg/m3 860-900Viscosity mm2/s 3.50-5.00Flashpoint OC ≥ 120Total sulphur % mass ≤ 0.001Sulfated ash % mass ≤ 0.02Water content mg/kg < 500Total contamination mg/kg < 24Cetane Number ≥ 51Acid value mgKOH/g ≤ 0.50Stability h ≥ 6Methanol content % mass ≤ 0.2Ester content % mass ≥ 96.5Monoglycides % mass ≤ 0.80Diglyceride % mass ≤ 0.20Triglyceride % mass ≤ 0.20Free glycerol % mass ≤ 0.02Total glycerol % mass ≤ 0.25Iodine Number ≤ 120Linolenic methyl ester % m/m ≤ 12Polyunsaturated % m/m 1Phosphorus content mg/kg ≤ 10Alcaline metals mg/kg ≤ 5Source: US DOE, Credit Suisse research
Although the country’s first national standard is likely to be implemented in 2007, at present China’s biodiesel market is primarily confronted by the absence of a national standard. Currently, biodiesel specifications and standards in China are set at the provincial level, so the quality of biodiesel in China may vary between provinces. In addition, the absence of a stringent biodiesel standard may result in biodiesel manufacturers forgoing quality control in order to minimise production costs, although the Chinese biodiesel manufacturers claim that their product complies with the old German standard DIN E 51606. If the Chinese quality level genuinely does meet the old German standard, the quality is not far behind the global standard. However, China may still be prevented from exporting to the US and the EU until further enhancements are made. Compared to the old German standard DIN E 51606, new EU standard EN 14214 is more stringent and stipulates additional requirements that were not initially included in DIN E 51606. Standard EN 14214 prohibits the use of recycled oils with a high polymer content. In addition, animal fats derived from animal slaughter operations (which process the whole animal, including hairy skins), contain higher levels of sulphur

Biofuel Sector 30 August 2006
100
than permitted by standard EN 14214. Therefore, reduction of sulphur content via specific distillation process is required in order to comply with EN 14214. Hence, compliance with DIN E 51606 does not guarantee that China’s biodiesel will comply with the US standard set for biodiesel products, ASTM D 6751.
Comparison among different standards and codes Czech India Austria Rep. France Germany Italy Sweden USA (proposal) EUStandard specification ONC
1191 CSN
65.6507 Journal Official
DIN E51606
NC635-01
SS 155436
ASTM D 6751
BIS EN 14214
Date Jul-97 Sep-98 Sep-97 Apr-97 Nov-96 Nov-96 Feb-02 TBD 2003Density @ 15°C (g/cm³) 0.85-0.89 0.87-0.89 0.87-0.89 0.875-0.90 0.86-0.90 0.87-0.90 - 0.87-0.90 0.86-0.90Viscosity @ 40°C (mm²/s) 3.5-5.0 3.5-5.0 3.5-5.0 3.5-5.0 3.5-5.0 3.5-5.0 1.9-6.0 3.5-5.0 3.5-5.0Flashpoint (°C) 100 110 100 110 100 100 130 100 ≥120Sulphur max % mass 0.02 0.02 0.02 0.01 0.01 0.01 0.05 0.05 0.001Sulphated ash, max, % mass 0 0.02 - 0.03 - - 0.02 0.02 0.02Water, max, mg/kg - 500 200 300 700 300 500 500 500Cetane no. ≥49 ≥48 ≥49 ≥49 - ≥48 ≥47 ≥51 ≥51Free glycerol % mass ≤0.02 ≤0.02 ≤0.02 ≤0.02 ≤0.05 ≤0.02 ≤0.02 ≤0.02 ≤0.02Source: D1 Oils India Private Ltd., Credit Suisse research
The Chinese government is currently developing a national standard for biodiesel, using German DIN E 51606 as its basis. There are two possible implications that the introduction of a national standard could have on China’s biodiesel market. First, implementation of a national standard that is less stringent than EN 14214 and ASTM D 6751 would allow local biodiesel manufacturers to maintain their cost-competitiveness. However, this would mean that China could not export its biodiesel to the EU and US, which the two largest biodiesel markets in the world. Second, the introduction of a stringent standard, such as one that complies with EN 14214 and ASTM D 6751, might result in higher production costs for PRC biodiesel manufacturers.

Biofuel Sector 30 August 2006
101
Appendix II: Types of feedstock Oilseeds, meal and edible oils are commodities that are traded globally. In 2002, 119.4 mn tonnes of edible oils were produced worldwide. Of this, 13.1 mn tonnes was rapeseed oil. In 2002, worldwide biodiesel production was approximately 1.8 mn tonnes. Since oil is converted into biodiesel on a one-to-one basis, if the plants had used only fresh oils (and not other feedstock, as described above), they would have consumed 1.5% of the global edible oil production. Had they been run only on rapeseed oil, they would have consumed 13.7% of the feedstock available that year. Undoubtedly, with global biodiesel market expected to continue its rapid growth, biodiesel plants are, and will remain, an important buyer of rapeseed and other oils.
Figure 133: Global edible oil production (mn tons)
1980 1990 2000
0
5
10
15
20
25
Soy Palm Rape Sunflower Groundnut Cottonseed Coconut Olive
Source: Austrian Biofuels Institute, Credit Suisse research
By the end of 2004, rapeseed oil continued to represent, by far, the leading feedstock in Europe. In 2004, Germany took the leading position within the EU region for biodiesel production overtook the previous leader, France. The third position was held by the Czech Republic, followed by Denmark, Austria, Slovakia and Sweden. The UK was a late starter and has only recently initiated the construction of a large biodiesel production plant with 250,000 tons of capacity in the north-east of England, near to one of the most suitable areas for rapeseed cultivation.
In addition to rapeseed oil, there is a growing interest in producing biodiesel from other feedstock sources. According to a survey by the Austrian Biofuels Institute, the list of feedstock sources in the order of cost are sunflower oil, rapeseed oil, soybean oil, tallow, palm oil, lard and used frying oils. As shown below, biodiesel uses the most diversified feedstock in terms of types of stock.

Biofuel Sector 30 August 2006
102
Figure 134: Sources of bio-energy from agriculture Biodiesel Cellulosic ethanol Bio-ethanol #2 Heating/furnace oil Renewable energy Palm oil Crop residue (rice, wheat, corn, sorghum) Sugarcane Palm oil Crop residue Canola/rape Perennial grasses Sugar beet Temperate tree plantations Soy Temperate tree plantations Corn Tropical tree plantations Jatropha Tropical tree plantations Wheat Castor oil Grapes Sunflower Safflower Sugar cane Source: Credit Suisse research
Figure 135: Promising sources for biodiesel Oilseed Seed harvesting Gestation period (Yr) Productive life (Yr) Employment days/haJatropha curcas Sept – Dec, Mar -Apr <1 50 250Pongamia pinnata Throughout the year 3-10 100 125Jojoba June - Aug 5-7 >100 n.a.Madhuca indica Aug - Sept n.a. n.a. 120Azadaricta indica June - Aug 5-6 >50 60Simarouba April - May 4-6 n.a. n.a.Sorea robuta May - July 25-30 100 80Kusim June - July n.a. n.a. 80Source: D1 Oils plc, Credit Suisse research
Different countries use different feedstock based on their cultivations and economic availabilities.
Figure 136: Prices of vegetable oils generally move in tandem, due to the substitution effect
200
300
400
500
600
700
800
900
1987 1988 1989 1990 1991 1992 1993 1994 1995 1996 1997 1998 1999 2000 2001 2002 2003 2004 2005 2006
CPO Soy abean Oil Sunflow er Oil Rapeseed Oil
(US$/tonne)
Source: Oil World, Credit Suisse estimates
Rapeseed oil Rapeseed oil exhibits relatively high oxidation stability, an iodine value (IV) of lower than 120, acceptable winter operability and yield up to 2 tonnes oil/ha. These properties have made rapeseed oil the favoured and dominating feedstock for biodiesel. The

Biofuel Sector 30 August 2006
103
disadvantages of rapeseed oil include the high level (11%) of linolenic fatty acid (18:3), which has three unsaturated double bonds and thus, causes greater instability than desired. Technological advancements have allowed the current supply of rapeseed oil for biodiesel feedstock to reach a higher level of oleic fatty acid (18:1), resulting in greater oxidation stability than previously.
Figure 137: EU-25 rapeseed oil consumptions and imports '000 metric tons (consumptions) '000 metric tons (imports)
Consumption Imports
0
1,000
2,000
3,000
4,000
5,000
6,000
7,000
1999 2000 2001 2002 2003 2004 20050
50
100
150
200
250
0
1,000
2,000
3,000
4,000
5,000
6,000
7,000
1999 2000 2001 2002 2003 2004 20050
50
100
150
200
250
0
1,000
2,000
3,000
4,000
5,000
6,000
7,000
1999 2000 2001 2002 2003 2004 20050
50
100
150
200
250
Source: Bloomberg, Credit Suisse research
Rapeseed represents the dominant feedstock for the European biodiesel market, supplying around 80% of the total biodiesel requirements. Rapeseed is a relatively expensive crop to grow and requires frequent rotation and extensive use of expensive fertiliser. As such, this type of feedstock may simply be too expensive without government subsidy.
Figure 138: Rapeseed Figure 139: Sunflower
Source: Credit Suisse research Source: Credit Suisse research
Sunflower oil Sunflower oil exhibits a lower yield/ha and a higher IV than rapeseed oil. Sunflower oil has an IV higher than 120, whereas the European standard EN 14214 requires biodiesel to have an IV lower than 120. In order to be used as biodiesel feedstock for EU production, sunflower oil needs to be blended with low IV oils. Currently, sunflower

Biofuel Sector 30 August 2006
104
oil, with up to 90% high oleic fatty acid, is ready to enter the biodiesel market of southern European countries.
Palm oil Palm oil methyl ester has been used since 1987 in Kuala Lumpur’s Mercedes buses. Biodiesel derived from palm oil exhibits high stability, but has a cold filter plugging point (CFPP) of only +11o C. As such, this type of biodiesel is unsuitable for the colder climatic conditions in Europe. Malaysia and Indonesia are starting pilot-scale production from palm oil. However, the environmental group Friends of the Earth has expressed concern over the potential threat that clearance of forests for oil-palm plantations could have on the last remaining habitat of the orang-utan. In addition, the smaller palms absorb lower amounts of carbon dioxide than the larger forest trees and thus, biodiesel produced from plantation-grown oil may be a net source of carbon dioxide.
Figure 140: Global palm oil demand/supply dynamics and stock/usage ratio
0
10,000
20,000
30,000
40,000
50,000
1980
1981
1982
1983
1984
1985
1986
1987
1988
1989
1990
1991
1992
1993
1994
1995
1996
1997
1998
1999
2000
2001
2002
2003
2004
2005
2006
2007
10
15
20
25
30
35
Production (mn T) Consumption (mn T) Stock/usage (%)
('000 T) (%)
Source: Oil World, Credit Suisse research
Figure 141: SWOT analysis for CPO as a renewable energy Strengths Weaknesses Easily available Food grade product Existing infrastructure Pressure on tropical rainforest Easy logistics and handling CO2 neutrality Clean biomass Sustainability Large suppliers Price per GJ Cheap Needs to be imported Not a local crop Difficult to get license for plant Opportunities Threats Renewable energy Overcompensation Expensive fossil fuels Pressure of NGOs Shortage of rapeseed in the EU Lobby of local farmers Carbon credits Can become too expensive Source: BIOX, Credit Suisse research

Biofuel Sector 30 August 2006
105
Figure 142: Palm fruit Figure 143: Soybeans
Source: Credit Suisse research Source: Credit Suisse research
Soybean oil Soybean oil is the feedstock of choice in the US, Argentina and other soybean growing countries. Soy oil has an IV higher than 120 and thus does not meet the EN 14214 standard. However, the US biodiesel standard, ASTM D6751 02, does not require an IV lower than 120, and thus, soy oil is a feasible biodiesel feedstock in this region. In order to fulfil the requirements of EN 14214, soy oil may be used as multi-feedstock blending component.
Non-food oil crops The full scope of potentially available and suitable non-food oil seeds has yet to be explored. A number of oilseed plants that have recently been listed as potential feedstock include physic nut (Jatropha curcas), which has been successfully used as feedstock in a new biodiesel programme in India.
Figure 144: Comparison of the characteristics of fossil diesel oil and Jatropha curcas oil Parameter Diesel oil Oil of Jatropha curcas seedsDensity (15/40°C) 0.84 - 0.85 0.91 - 0.92Cold solidifying point (°C) 14.0 2.0Flash point (°C) 80 110 - 240Cetane number 47.8 51.0S (%) 1.0 - 1.2 0.13Source: GTZ, Credit Suisse research
The Indian government has initiated large cultivations of Jatropha of more than 1 mn ha on wasteland ‘rain-shadow areas’ of Andhra Pradesh and Jaipur. The success of such initiatives will enhance India’s agricultural industry and may serve as an attractive method for India to combat its poverty issue. Jatropha trees are planted in India and South-east Asia for watershed protection and are able to grow productively with minimal water and nutrients. Hence, Jatropha trees can be easily intercropped with high-value food and fuel crops, although there are wide variations in Jatropha yield, varying from 1-12 tonnes of seed/ha, due to inputs and agroecological conditions. It is difficult to cross-check claims, as there are very few existing mature plantations.
Other areas that exhibit high potential for Jatropha cultivation include China, Egypt, Ghana, Mali, Mozambique, South Africa and Tanzania. Other oils from oil-bearing trees

Biofuel Sector 30 August 2006
106
such as sal (Shorea robusta), mahua (Madhuca indica) and neem (Azadirachta indica) are currently being investigated for their suitability as biodiesel feedstock.
Figure 145: Jatropha curcas
Source: Credit Suisse research
Recycling oils and animal fats. With the implication of appropriate technology, relatively cheap recycled oils from restaurants and households, as well as animal fats, could serve as feedstock for biodiesel. This production method would offer high profitability, given the lower feedstock costs. However, the European biodiesel fuel standard EN 14241 prohibits the use of recycled oils with high polymer content. EN 14241 also set clear parameters on the allowable recycled oils to be used as biodiesel feedstock. Given these parameters, careful and clean recycling practices are required upon employing recycled oils as biodiesel feedstock. Animal fats derived from slaughter operations, which process the whole animal including hairy skins, contain higher levels of sulphur than required. Therefore, reduction on sulphur content via specific distillation process is required.
Feedstock of ethanol Figure 146: Advantages of various ethanol feedstock Ethanol Feedstock Advantages Sugar cane (sucrose) No enzymes required, and bagasse product can be used for steam and electricity generation Maize (corn) Easily transported and stored, well-developed agricultural machinery, valuable co-product (distillers grains for cattle) Wheat and barley The same as maize, but better suited to shorter and colder climates Cassava High starch content, and can be produced in tropical climates where grains cannot grow Lignocellulosic biomass A universally available source of carbohydrate, but commercially viable collection and pretreatment is yet to be developed Molasses Utilizes a low value product, and can reduce the cost of recovering sucrose. It also contains nutrients which aid fermentation Cassava Dried cassava is a very stable form of starch easy to transport and store. It provides increased agricultural utilization, especially in developing regions
Source: Credit Suisse research

Biofuel Sector 30 August 2006
107
Figure 147: Sugar cane Figure 148: Maize
Source: Credit Suisse research Source: Credit Suisse research
Figure 149: Barley Figure 150: Cassava
Source: Credit Suisse research Source: Credit Suisse research
Sugar cane Sugar cane is a tropical crop, which is processed into raw sugar and molasses. As alcohol is created by fermenting sugar, sugar crops such as sugar cane and sugar beet are the easiest to convert into alcohol. Sugar cane holds out great promise as an ethanol feedstock, exemplified by Brazil's fuel self-sufficiency through its use of sugarcane to produce ethanol as the major fuel source. Currently there are no US plants producing ethanol from sugar feedstocks, but the Energy Policy Act of 2005 created a US$36 mn sugar cane ethanol programme to study the production of ethanol from sugar cane in Texas.
Maize Maize is the primary feedstock for ethanol in the US. Maize, at US$2.50/bu, represents a feedstock cost of US$0.264/l of expected ethanol yield. Wet milling of maize spins off an array of by-products, including ethanol, high-fructose corn syrup, gluten feed, oil and carbon dioxide. Just as high-value chemicals help pay the distillation cost of gasoline, these co-products help pay the cost of producing the ethanol. It is probable that a fibre-conversion plant will have to produce a range of higher-value co-products along with ethanol if it is going to compete with the wet milling of maize.

Biofuel Sector 30 August 2006
108
Barley Use of barley as a feedstock is problematic, and current processes for conversion to fuel ethanol are not cost competitive today in the US compared with the use of maize. The abrasive nature of hulled barley, the high viscosity of barley fermentations and the low starch and high fibre content lead to high production costs and low ethanol yields. A multidisciplinary research effort at the Eastern Regional Research Center, ARS, USDA in Wyndmoor, Pennsylvania, in co-operation with research partners, has been initiated to solve these technical problems. The research approaches include: 1) development of high-starch, hulless barley varieties specifically bred for ethanol production, 2) development of pre-fermentation barley fractionation processes to remove non-fermentables from hulled and hulless barley to produce a starch-rich feedstock for ethanol production, and 3) use of new beta-glucanases to decrease viscosity of mashes, increase yields of ethanol and decrease levels of residual beta-glucans in DDGS.
Cassava Cassava is a good feedstock to produce this ethanol because it has a high starch content and it is abundant in the southern provinces. The productivity of cassava per ha varies widely from one region to another, depending on climatic and agro-technological conditions. From about 16 tonnes (harvested weight) per ha in north-eastern Brazil, the yield can be easily increased by the use of fertilisers and improved cultivation practices to 40 and even 60 tonnes per ha. Other advantages of cassava are low production costs, easy storage in the ground for several months and high calorie content for animal feed.

Biofuel Sector 30 August 2006
109
Appendix III: Ethanol market Ethanol was the first fuel used by the pioneers of the automobile industry. It is more than a source of power: it has the characteristics of high octane, which replaces carcinogenic aromatics and tetraethyl lead, and high oxygen content, without the problems of ethers, such as MTBE; it also reduces carbon dioxide emissions, as the carbon dioxide produced is reabsorbed by the starch crops, and it reduces dependence on Middle Eastern crude oil and helps support the local agricultural economy. It is proven in billions of kilometres of use in all climates in high-performance, economy and truck engines. Ethanol is also used in millions of cars. Most cars in Brazil are flexible-fuel vehicles, allowing 95% ethanol or lower blends. ‘Regular’ gasoline sold contains 10% ethanol. There are over 5 mn flexible-fuel vehicles on the road in the US. These vehicles can use E-85 (85% ethanol), E-10 (10% ethanol), or straight gasoline equally well. Unfortunately, there are only 650 E-85 gas stations in the US today, but the number increases every week.
Backed by the growing energy demand, bio-ethanol experienced a sustainable growth in the past twenty years. And driven by the surging energy demand from emerging countries, such as China and India, and hiking fossil fuel prices, bio-ethanol should enjoy fast growth until 2020. (see Figure 151)
Figure 151: World ethanol production
Source: Novozymes
As shown in the chart above, Brazil and the US have been the top two producers for the past twenty years, and will still be the top two in the following 15 years, as estimated by the Novozymes A/S (NZYMMB DC, DKK409.5, not rated), a Danish biotech-based enzyme and micro-organism manufacturer. And as shown in Figure 153, the US passed Brazil to become the largest provider of ethanol in the world in 2005.

Biofuel Sector 30 August 2006
110
As production volume is growing, the price of ethanol could drop accordingly, indicating an economy of scale or a learning curve that might also be applicable to biodiesel production around the world.
Figure 152: Economy of scale – Brazil’s ethanol production
100
- 50,000 100,000 150,000 200,000 250,000
Accumulated production of Ethanol ('000 m3)
10
Ethanol prices in Brazil Rotterdam regular gasoline price
trend (Rotterdam gasoline prices) trend (Ethanol prices)
1980
19951990
1988
20021999
2004
2005
Source: USP, Credit Suisse estimates
Figure 153: Top 11 fuel ethanol providers (’000 tonnes)
11,897
2,8751,378
653 590 328 316 236 236 221
12,718
10,543
12,608
236277952743075907161,340
2,994
0
2,000
4,000
6,000
8,000
10,000
12,000
14,000
Brazil US China India France Russia SouthAfrica
UK SaudiArabia
Spain Thailand
2004 2005
Source: Novozymes, Credit Suisse estimates
The top 11 countries accounted for 89% of all fuel ethanol produced in the world in 2005, of which Brazil and the US accounted for more than 70% of production, making them the most important producers in the fuel ethanol market.

Biofuel Sector 30 August 2006
111
Figure 154: US and Brazil ethanol industry comparison US ethanol industry Brazil ethanol industry In 2005, largest producer of fuel ethanol (EtOH) (16,195 mn litres vs. 4100 mn litres in 1996).
Brazil was second largest producer of EtOH in 2005 (16,000 mn litres)
2005 EtOH output ~ 3% of US motor gasoline usage by volume; 2% by energy content.
Producers EtOH from sugar cane using straight sugar cane juice plus some from molasses
By 2008, USDA forecasts that US EtOH output will increase to 30,000 mn litres Considered lowest cost producer of EtOH in the world. 90% of US EtOH produced from corn using 13% of total 2005 US corn output. Dry milling used, which produces DDGS as a by-product.
Able to expand output substantially but expert markets needed.
US Issues Brazil Issues Cost producing EtOH from corn in the US is substantially high and industry can only survive with substantially help from government:
Very small domestic market; growth of Brazil's EtOH industry is highly dependant on exports.
Renewable fuels standard requires US refineries and filling stations to use 28,500 mn litres/yr of biofuel by 2015 with 1,000 mn litres coming from cellulose.
High import duties in the US and elsewhere are limiting EtOH export from Brazil.
EtOH Excise Tax Exemption - $0.13/litre. Fuel vs. Food issue resurfaces whenever sugar prices jump or if a drought or natural disaster affects sugar crops.
Duty on imported EtOH: $0.14/litre. Domestic regulations related to blending ratios continue to create government-caused supply fluctuation
EtOH exempted from Gasoline Tax in many States. Water and land required to expand sugar cane output may lead to significant local environment impacts.
Other state and federal subsidies. Corn-to-ethanol is an inefficient way to produce transport fuels: Ethanol opponents argue that it takes more energy to produce a litre of ethanol from corn that the energy content of that litre of EtOH.
USDA disagrees strongly with that view, but the fossil fuel energy efficiency ratio is still very low ~ 1.32 EtOH vs. 0.83 for gasoline
Source: LP Power Consultants, Credit Suisse research
USA Most US plants use maize in their production of ethanol because the climate favours this crop, allowing greater yields annually. Moreover, it used to take 18 months to build a plant, but now it only takes half that time. Most plants operate with a total staff of only 30-40 people, including management. Production capacity of the typical new plant has grown from 40 mn litres of ethanol in 1990, to 150 mn litres in 2000, to 4000 mn litres in 2006. Plant investment costs are about US$1.50 per gallon of annual capacity. Lower than the construction investment for biodiesel production in Europe, (as mentioned above), this value can be higher for small plants or unusual feedstock, and lower for large corn plants. The yellow dots in Figure 155 show that the current biomass resources and ethanol capacity are concentrated in the corn belt and the upper Midwest.
The EPAct aims to double the volume of ethanol produced by 2012 (7.5 bn gallons) – grants, incentives and loan guarantees for the construction of bio-refineries producing cellulosic ethanol will be provided. A joint programme with the USDA and the DOE will see an investment of over US$2 bn in bio-refineries and bio-energy research and development of biomass processing technologies over the next ten years. This will facilitate integration of emerging technologies, such as PureVision technology, into existing starch ethanol plants, paper mills and power plants. A further US$750 mn in FY06-09 will be given to the EPA to fund at least four conversion technologies for producing cellulosic biomass ethanol.
As part of the ‘Advanced Energy Initiative’ announced by President Bush in his 2006 State of the Union address, the US energy policy initiative will involve a cost-shared three-year funding to construct three commercial bio-refineries, costing up to

Biofuel Sector 30 August 2006
112
US$160 mn. Figure 156 maps the potential location of ethanol plants in 2025 with application of enzymatic hydrolysis technologies.

Biofuel Sector 30 A
ugust 2006
113
Figure 155: US crop residue resource and ethanol capacity
Source: LP Power Consultants

Biofuel Sector 30 A
ugust 2006
114
Figure 156: Potential location of ethanol plants in 2025
Source: LP Power Consultants

Biofuel Sector 30 August 2006
115
Brazil The introduction of flexible-fuel vehicles has helped the Brazilian ethanol industry greatly. It is a good environment for the ethanol industry to slowly gather pace, with plenty of demand readily available. This provides the government and consumers alike with diversity of choice for which gas to use at the petrol station. More importantly, many automobile firms are interested in ethanol production, including Ford, Volkswagen, Toyota, Renault, FIAT, Chevrolet, Mercedes Benz, Honda and Ferrari, providing another segment of consumers. Brazil produces more than 18 bn litres of ethanol annually for automotive use, which accounts for a 16.9% global market share of the Brazilian fuel market (see Figure 154).
Figure 157: Breakdown of Brazil’s fuel market
Hy drous Ethanol8.4% NGV
2.9%
Gasoline (E25)34.1%
Diesel54.6%
Anhy drous Ethanol 8.5%
Source: ANP, Gás Brasil, Credit Suisse research
However, the vast growing domestic demand in Brazil means that relying on Brazilian exports to satisfy increasing world demand is not likely to be sustainable in the long run.
Figure 158: Flexible-fuel cars’ market share has grown very fast
0
20
40
60
80
100
Jan 03 Apr 03 Jul 03 Oct 03 Jan 04 Apr 04 Jul 04 Oct 04 Jan 05 Apr 05 Jul 05 Oct 05 Jan 06
(%)
Gasohol Flex fuel Ethanol
76.6%
19.3%
FFV Introducing
Source: Petroquisa, Credit Suisse research

Biofuel Sector 30 August 2006
116
Figure 158 shows the growth in sales of flexible-fuel cars in comparison to sales of pure gasoline cars and pure ethanol cars in Brazil. Since May 2003, sales of flexible-fuel cars have been growing rapidly.
India India is the world’s sixth-largest and second-fastest growing producer of greenhouse gases. It is also the world’s second-largest producer of sugar cane. Ethanol’s lower greenhouse gas potential is a driver for its deployment in India. In January 2003, 5% ethanol blending in petrol was made mandatory in nine states, and four Union Territories Some 2 mn kl of ethanol was procured during 2003-04. Owing to drought conditions in several parts of the country, sugar cane production suffered between 2004 and 2005. Mandatory blending was later made subject to availability. During 2005-06, ethanol supply is expected to improve.
Figure 159: Bio-ethanol use in India Parameters India (now) India (2006/07)Fuel ethanol output (mn litres) 1560 Total ethanol (mn Iitres) 2,000 Total sugar area (ha) 4,361,000 5,000,000 Mandatory blending (%) 5% in 9 states Production costs for ethanol (€/I) 0.36 Source: GTZ, Credit Suisse research
ASEAN Figure 160: Theoretical yield of bio-ethanol from selected feedstocks in ASEAN (mn litres)
0
1,000
2,000
3,000
4,000
5,000
6,000
Indonesia Malaysia Philippines Thailand Vietnam0
1,000
2,000
3,000
4,000
5,000
6,000
Indonesia Malaysia Philippines Thailand Vietnam
Cassava Corn Sugarcane Bioethanol requirement at 10% blend
Source: The Bronzeoak Group, Credit Suisse research

Biofuel Sector 30 August 2006
117
Figure 161: Potential ethanol demand (E5 and E10) for Indonesia, Malaysia, Philippines, Thailand and Vietnam (million litres per year)
Ethanol Demand (E5 Blend) Ethanol Demand (E10 blend)Thailand Intended production Existing capacity (Thailand)
0
500
1,000
1,500
2,000
2,500
3,000
3,500
4,000
4,500
2006 2008 2010
76 Distilliers
67 Distilliers
0
500
1,000
1,500
2,000
2,500
3,000
3,500
4,000
4,500
2006 2008 2010
76 Distilliers
67 Distilliers
Source: The Bronzeoak Group, Credit Suisse research
In 2005, the Philippines’ domestic production was insufficient to meet mandated E5 blend of 220,000,000 litres per year; 16 distilleries will be required to meet the forecast demand in 2010.
China The Chinese ethanol industry comprises over 200 production facilities in 11 provinces, capable of producing more than 3 mn tonnes p.a. of ethanol. The production of bio-ethanol is regarded as one of the pathways to large scale and feasible use of agricultural products. As a high-quality petrol substitute, bio-ethanol meets the national standards GB18350 and GB18351 according to the US bio-ethanol fuel standard. A 10% proportion of ethanol as transport fuel mixed with gasoline can save on petroleum and reduce harmful gas discharges, but as it is still not economical, so Chinese fuel ethanol enterprises request national financial subsidy to be sustainable.
The energy crops that can be used to produce bio-ethanol in China include sorghum, cassava, sugar cane and maize. The income from planting maize is about €50/ha. Compared to maize, the possible income from sorghum is 25-30 €/ha higher. However, there are barriers to sorghum production, the most important one being the volatile sugar content of the plant. Researchers have not yet discovered the most adequate method to preserve it. Moreover, the harvest can be endangered by strong winds, which can easily break the long stalks, thus reducing the sugar content significantly within a short time. Given the characteristics of sorghum, more than 670,000 ha could be cultivated in Jilin, Liaoning, Heilongjiang, Inner Mongolia and Xinjiang provinces in the near future, providing feedstock for the annual production of 2,512,000 tonnes of bio-ethanol.

Biofuel Sector 30 August 2006
118
The total production cost of bio-ethanol ranges from €287.5/tonne to €481/tonne, including 70% for raw material purchases (cited by GTZ). Existing raw materials, especially maize and wheat, cost over €400 per tonne of bio-ethanol, but by-products, such as distillers dried grains (DDGS) can be sold to compensate for the high feedstock costs.
Demand for bio-ethanol in 2020 In 2020, the number of motor vehicles in China is expected to reach 130-150 mn. It is predictable that E10 gasohol will be already widely used in 2010. E85 and E10 will be the most offered forms of bio-ethanol in future. A higher blending rate will depend on experimental results of the pilot usage of E20, E35, E95 or pure bio-ethanol E100.
At present, the production capacity of the four existing fuel ethanol factories is 820,000 tonnes p.a. The yield of fuel ethanol from food crops is unlikely to exceed 2 mn tonnes p.a. by 2020, and food crop use for bio-ethanol production should not exceed 6 mn tonnes p.a.; therefore, it should not have a negative impact on the internal food market.
Bio-ethanol has a high octane number and is also used as a replacement in gasoline for lead. Blending gasoline with bio-ethanol reduces emissions of CO2 and hydrocarbons from old engines running ‘rich’ with a low air-to-fuel ratio. The environmental significance of using bio-ethanol focuses on protection and improvement of China’s atmosphere and the reduction of carbon dioxide emissions.
It is calculated that the bio-ethanol processing industry, with a yield of 8.02 tonnes p.a. can create about €3.6/year, and will absorb a labour force of more than 160,000. Relevant-energy-oriented agriculture could offer employment to about 2.9 mn workers, thus increasing employment in rural areas and developing the rural economy.
Figure 162: Bio-ethanol use in China Parameters China (now) China (2020)Fuel ethanol output (Mn litres) 1,270 8 to 28Total ethanol (Mn I) 3,797,000 Fuel ethanol area (Mn ha) 2.7 4.3 (2010) at least 7.6 (2020)Subsidies for ethanol (€/t) 137 0Mandatory blending (%) 10% in 5 provinces 10%Production costs for ethanol (€/I) 0.23-0.38 of which feedstock price 0.16-0.32 Ethanol net energy balance (I/O) 1:1.1 (corn)
1:2.1 (cane) 1:0.7 (cassava)
Source: GTZ, Credit Suisse research
Cost of bio-ethanol Bio-ethanol is typically derived from reacting sugars with alcohol. Common crops and produce used in ethanol production are sugar cane, sugar beet, corn, wheat and grapes. The cost of ethanol production depends on several factors, the cost of feedstock, the cost of generation and energy, and other costs, such as transportation and export, but feedstock accounts for the biggest percentage, the same as biodiesel.

Biofuel Sector 30 August 2006
119
Figure 163: Bio-ethanol production cost distribution
Feedstock46.05%
Electricity4.10%
Depreciation11.99%
Water0.10% Fuels
16.78%
Waste management
0.40%
Enzy mes2.40%
Yeast0.40%
Chemicals1.90%
Donaturant4.60%
Maintenance4.00%
Labor4.10%
Adminstrativ e cost2.80%
Other costs0.40%
Source: Novozymes, Credit Suisse research
The chart below shows the ethanol yields from the four selected feedstock and shows that maize provides the largest level of ethanol yield in terms of tonnage feedstock used.
Figure 164: Feedstock yields comparison for bio-ethanol Sugar cane Sweet sorghum Cassava MaizeEthanol yield (litres/tonne feedstock) 86 40 164 318Source: Bronzeoak Limited, Credit Suisse research
However, given the yield of feedstock per ha (see Figure 115), sugar cane provides the largest level of ethanol yield in terms of hectare land used. And currently, Brazil has the lowest cost in sugar production, which partly explains why Brazil is competitive in the biofuel market, making it one of the top two producers of bio-ethanol in the world currently.
Figure 165: Sugar production cost (US$/tonne)
174 204 241 248 283 284378 440 424 483
687
1,400
-
200
400
600
800
1,000
1,200
1,400
1,600
Brazil(CS)
Australia SouthAmerica
India Cuba Thailand France USA China England Italy Japan
Sugar cane
Source: LP Power Consultants, Credit Suisse research

Biofuel Sector 30 August 2006
120
According to Larry Peckous, manager of Novozymes, after taking account of labour and administrative costs, total production cost for bio-ethanol is US$1.17/gallon, slightly higher than that for soybean biodiesel at US$1.12/gallon, as a rough comparison.
Figure 166: Bio-ethanol production cost US$/gal. ThB litre BasisFeedstock 80.95 885.5 US$2.23/BuDDGS value 26.10 275.8 US$90/tonneCO2 value 0.80 8.5 Net feedstock 54.05 571.2 Electricity 4.76 50.3 US$0.04/KWhFuels 19.63 207.5 US$6/MMBTUWaste management 0.41 4.3 Water 0.15 1.6 Enzymes 2.80 29.6 Yeast 0.46 4.9 Chemicals 2.28 24.1 Denaturant 5.40 57.1 US$1.80/gal. 3%Maintenance 4.74 50.1 Labour 4.78 50.5 Administrative costs 3.25 34.3 Other costs 0.43 4.5 Total cash costs 103.14 1090 Depreciation 14.00 148 10 yrs SLD US$1.40/gal.Total (incl. dep’n) 1.17 12.4 Source: Novozymes, Credit Suisse research

Biofuel Sector 30 August 2006
121
Companies Mentioned (Price as of 23 Aug 06) Australian Biodiesel Group (ABJ.AU, A$0.70, NOT RATED) Australian Renewable Fuels Ltd. (ARW.AU, A$1.07, NOT RATED) Biofuels Corp. plc (BFC.LN, 97.50p, NOT RATED) BioPetrol Industries AG (B2I.GR, Eu 8.40, NOT RATED) Chaoda Modern Agriculture (0682.HK, HK$4.14, NEUTRAL, TP HK$5.00) China Biodiesel Int'l Holdings (CBI.LN, 104.00p, NOT RATED) China Petroleum & Chemical Corporation - H (0386.HK, HK$4.61, NEUTRAL, TP HK$4.77) CNOOC Ltd (0883.HK, HK$6.83, NEUTRAL, TP HK$6.20) Covanta Holding (CVA.US, $20.67, NOT RATED) D1 Oils plc (DOO.LN, 221.00p, NOT RATED) Degussa AG (DGX.GR, Eu 46.34, NOT RATED) Energy Conversion Devices (ENER.US, $31.44, NOT RATED) Genting (GENT.KL, RM 24.5, OUTPERFORM, TP RM 28.5) Golden Hope Plantation (GHOP.KL, RM 4.84, OUTPERFORM, TP RM 5.40) Indian Oil Corp. (IOCL.IN, Rs470.9, NOT RATED) Indofood Sukses Makmur (INDF.JK, Rp1100.00, OUTPERFORM, TP Rp1250.00) IOI Corporation (IOIB.KL, RM 16.30, NEUTRAL, TP RM 17.00) Kuala Lumpur Kepong (KLKK.KL, RM 11.50, OUTPERFORM, TP RM 15.50) MEMC Electronics Materials (WFR, $35.06, OUTPERFORM [V], TP $45.00, MARKET WEIGHT) MGP Ingredients (MG4.GR, Eu 14.55, NOT RATED) Mission Biofuels (MBT.AU, A$1.36, NOT RATED) Novozymes A/S (NZYMB.DC, DKr409.5, NOT RATED) PetroChina - H (0857.HK, HK$9.02, UNDERPERFORM, TP HK$7.15) PT Astra Agro Lestari Tbk (AALI.JK, Rp8650.00, NEUTRAL, TP Rp9500.00) PT London Sumatra Indonesia (LSIP.JK, Rp4825.00, NEUTRAL [V], TP Rp4260.00) Q-Cells (QCEG.DE, Eu 35.64, OUTPERFORM [V], TP Eu 47.35, OVERWEIGHT) Renewable Energy (REC.OL, NKr86.25, NEUTRAL [V], TP NKr79.00, OVERWEIGHT) Sinar Mas Agro Res & Tech (SMAR.IJ, Rs4000, NOT RATED) Sinochem Hong Kong Holdings (0297.HK, HK$2.85, UNDERPERFORM [V], TP HK$2.20) Sunpower Corp. (SPWR, $31.62, RESTRICTED, OVERWEIGHT) Suntech Power Holdings (STP.N, $29.90, RESTRICTED [V]) Tokuyama (4043, ¥1,714, NEUTRAL, TP ¥1,600, MARKET WEIGHT) Verasun Energy Corporation (VSE, $21.62, NEUTRAL [V], TP $23.00, MARKET WEIGHT) Wilmar Int'l Ltd. (WIL.SP, S$1.23, NOT RATED) Xiwang Sugar (2088.HK, HK$4.15, UNDERPERFORM [V], TP HK$3.69)

Biofuel Sector 30 August 2006
122
Disclosure Appendix Important Global Disclosures I, Angello Chan, certify that (1) the views expressed in this report accurately reflect my personal views about all of the subject companies and securities and (2) no part of my compensation was, is or will be directly or indirectly related to the specific recommendations or views expressed in this report. The analyst(s) responsible for preparing this research report received compensation that is based upon various factors including Credit Suisse's total revenues, a portion of which are generated by Credit Suisse's investment banking activities. Analysts’ stock ratings are defined as follows***: Outperform: The stock’s total return is expected to exceed the industry average* by at least 10-15% (or more, depending on perceived risk) over the next 12 months. Neutral: The stock’s total return is expected to be in line with the industry average* (range of ±10%) over the next 12 months. Underperform**: The stock’s total return is expected to underperform the industry average* by 10-15% or more over the next 12 months.
*The industry average refers to the average total return of the analyst's industry coverage universe (except with respect to Asia/Pacific, Latin America and Emerging Markets, where stock ratings are relative to the relevant country index, and Credit Suisse Small and Mid-Cap Advisor stocks, where stock ratings are relative to the regional Credit Suisse Small and Mid-Cap Advisor investment universe. **In an effort to achieve a more balanced distribution of stock ratings, the Firm has requested that analysts maintain at least 15% of their rated coverage universe as Underperform. This guideline is subject to change depending on several factors, including general market conditions. ***For Australian and New Zealand stocks a 7.5% threshold replaces the 10% level in all three rating definitions.
Restricted: In certain circumstances, Credit Suisse policy and/or applicable law and regulations preclude certain types of communications, including an investment recommendation, during the course of Credit Suisse's engagement in an investment banking transaction and in certain other circumstances. Volatility Indicator [V]: A stock is defined as volatile if the stock price has moved up or down by 20% or more in a month in at least 8 of the past 24 months or the analyst expects significant volatility going forward. All Credit Suisse Small and Mid-Cap Advisor stocks are automatically rated volatile. All IPO stocks are automatically rated volatile within the first 12 months of trading.
Analysts’ coverage universe weightings* are distinct from analysts’ stock ratings and are based on the expected performance of an analyst’s coverage universe** versus the relevant broad market benchmark***: Overweight: Industry expected to outperform the relevant broad market benchmark over the next 12 months. Market Weight: Industry expected to perform in-line with the relevant broad market benchmark over the next 12 months. Underweight: Industry expected to underperform the relevant broad market benchmark over the next 12 months. *Credit Suisse Small and Mid-Cap Advisor stocks do not have coverage universe weightings. **An analyst’s coverage universe consists of all companies covered by the analyst within the relevant sector. ***The broad market benchmark is based on the expected return of the local market index (e.g., the S&P 500 in the U.S.) over the next 12 months. Credit Suisse’s distribution of stock ratings (and banking clients) is:
Global Ratings Distribution Outperform/Buy* 40% (61% banking clients) Neutral/Hold* 43% (57% banking clients) Underperform/Sell* 14% (49% banking clients) Restricted 3%
*For purposes of the NYSE and NASD ratings distribution disclosure requirements, our stock ratings of Outperform, Neutral, and Underperform most closely correspond to Buy, Hold, and Sell, respectively; however, the meanings are not the same, as our stock ratings are determined on a relative basis. (Please refer to definitions above.) An investor's decision to buy or sell a security should be based on investment objectives, current holdings, and other individual factors.

Biofuel Sector 30 August 2006
123
Credit Suisse’s policy is to update research reports as it deems appropriate, based on developments with the subject company, the sector or the market that may have a material impact on the research views or opinions stated herein. Credit Suisse's policy is only to publish investment research that is impartial, independent, clear, fair and not misleading. For more detail please refer to Credit Suisse's Policies for Managing Conflicts of Interest in connection with Investment Research: http://www.csfb.com/research-and-analytics/disclaimer/managing_conflicts_disclaimer.html Credit Suisse does not provide any tax advice. Any statement herein regarding any US federal tax is not intended or written to be used, and cannot be used, by any taxpayer for the purposes of avoiding any penalties. Important Regional Disclosures
Restrictions on certain Canadian securities are indicated by the following abbreviations: NVS--Non-Voting shares; RVS--Restricted Voting Shares; SVS--Subordinate Voting Shares. Individuals receiving this report from a Canadian investment dealer that is not affiliated with Credit Suisse should be advised that this report may not contain regulatory disclosures the non-affiliated Canadian investment dealer would be required to make if this were its own report. For Credit Suisse Securities (Canada), Inc.'s policies and procedures regarding the dissemination of equity research, please visit http://www.csfb.com/legal_terms/canada_research_policy.shtml. As of the date of this report, Credit Suisse acts as a market maker or liquidity provider in the equities securities that are the subject of this report. For disclosure information on other companies mentioned in this report, please visit the website at www.credit-suisse.com/researchdisclosures or call +1 (877) 291-2683. Disclaimers continue on next page.

UT0197.doc
Disclaimers References in this report to Credit Suisse or CS include all of the subsidiaries and affiliates of Credit Suisse, a Swiss bank, operating under its investment banking division. For more information on our structure, please follow the below link: http://www.credit-suisse.com/who_we_are/en/structure.html. This report is not directed to, or intended for distribution to or use by, any person or entity who is a citizen or resident of or located in any locality, state, country or other jurisdiction where such distribution, publication, availability or use would be contrary to law or regulation or which would subject Credit Suisse, the Swiss bank, or its subsidiaries or its affiliates (“CS”) to any registration or licensing requirement within such jurisdiction. All material presented in this report, unless specifically indicated otherwise, is under copyright to CS. None of the material, nor its content, nor any copy of it, may be altered in any way, transmitted to, copied or distributed to any other party, without the prior express written permission of CS. All trademarks, service marks and logos used in this report are trademarks or service marks or registered trademarks or service marks of CS or its affiliates. The information, tools and material presented in this report are provided to you for information purposes only and are not to be used or considered as an offer or the solicitation of an offer to sell or to buy or subscribe for securities or other financial instruments. CS may not have taken any steps to ensure that the securities referred to in this report are suitable for any particular investor. CS will not treat recipients as its customers by virtue of their receiving the report. The investments or services contained or referred to in this report may not be suitable for you and it is recommended that you consult an independent investment advisor if you are in doubt about such investments or investment services. Nothing in this report constitutes investment, legal, accounting or tax advice or a representation that any investment or strategy is suitable or appropriate to your individual circumstances or otherwise constitutes a personal recommendation to you. CS does not offer advice on the tax consequences of investment and you are advised to contact an independent tax adviser. Please note in particular that the bases and levels of taxation may change. CS believes the information and opinions in the Disclosure Appendix of this report are accurate and complete. Information and opinions presented in the other sections of the report were obtained or derived from sources CS believes are reliable, but CS makes no representations as to their accuracy or completeness. Additional information is available upon request. CS accepts no liability for loss arising from the use of the material presented in this report, except that this exclusion of liability does not apply to the extent that liability arises under specific statutes or regulations applicable to CS. This report is not to be relied upon in substitution for the exercise of independent judgment. CS may have issued, and may in the future issue, a trading call regarding this security. Trading calls are short term trading opportunities based on market events and catalysts, while stock ratings reflect investment recommendations based on expected total return over a 12-month period relative to the relevant coverage universe. Because trading calls and stock ratings reflect different assumptions and analytical methods, trading calls may differ directionally from the stock rating. In addition, CS may have issued, and may in the future issue, other reports that are inconsistent with, and reach different conclusions from, the information presented in this report. Those reports reflect the different assumptions, views and analytical methods of the analysts who prepared them and CS is under no obligation to ensure that such other reports are brought to the attention of any recipient of this report. CS is involved in many businesses that relate to companies mentioned in this report. These businesses include specialized trading, risk arbitrage, market making, and other proprietary trading. Past performance should not be taken as an indication or guarantee of future performance, and no representation or warranty, express or implied, is made regarding future performance. Information, opinions and estimates contained in this report reflect a judgement at its original date of publication by CS and are subject to change without notice. The price, value of and income from any of the securities or financial instruments mentioned in this report can fall as well as rise. The value of securities and financial instruments is subject to exchange rate fluctuation that may have a positive or adverse effect on the price or income of such securities or financial instruments. Investors in securities such as ADR’s, the values of which are influenced by currency volatility, effectively assume this risk. Structured securities are complex instruments, typically involve a high degree of risk and are intended for sale only to sophisticated investors who are capable of understanding and assuming the risks involved. The market value of any structured security may be affected by changes in economic, financial and political factors (including, but not limited to, spot and forward interest and exchange rates), time to maturity, market conditions and volatility, and the credit quality of any issuer or reference issuer. Any investor interested in purchasing a structured product should conduct their own investigation and analysis of the product and consult with their own professional advisers as to the risks involved in making such a purchase. Some investments discussed in this report have a high level of volatility. High volatility investments may experience sudden and large falls in their value causing losses when that investment is realised. Those losses may equal your original investment. Indeed, in the case of some investments the potential losses may exceed the amount of initial investment, in such circumstances you may be required to pay more money to support those losses. Income yields from investments may fluctuate and, in consequence, initial capital paid to make the investment may be used as part of that income yield. Some investments may not be readily realisable and it may be difficult to sell or realise those investments, similarly it may prove difficult for you to obtain reliable information about the value, or risks, to which such an investment is exposed. This report may provide the addresses of, or contain hyperlinks to, websites. Except to the extent to which the report refers to website material of CS, CS has not reviewed the linked site and takes no responsibility for the content contained therein. Such address or hyperlink (including addresses or hyperlinks to CS’s own website material) is provided solely for your convenience and information and the content of the linked site does not in any way form part of this document. Accessing such website or following such link through this report or CS’s website shall be at your own risk. This report is issued and distributed in Europe (except Switzerland) by Credit Suisse Securities (Europe) Limited, One Cabot Square, London E14 4QJ, England, which is regulated in the United Kingdom by The Financial Services Authority (“FSA”). This report is being distributed in Germany by Credit Suisse Securities (Europe) Limited Niederlassung Frankfurt am Main regulated by the Bundesanstalt fuer Finanzdienstleistungsaufsicht ("BaFin"). This report is being distributed in the United States by Credit Suisse Securities (USA) LLC ; in Switzerland by Credit Suisse; in Canada by Credit Suisse Securities (Canada), Inc..; in Brazil by Banco de Investimentos Credit Suisse (Brasil) S.A.; in Japan by Credit Suisse Securities (Japan) Limited; elsewhere in Asia/Pacific by whichever of the following is the appropriately authorised entity in the relevant jurisdiction: Credit Suisse (Hong Kong) Limited, Credit Suisse Equities (Australia) Limited , Credit Suisse Securities (Thailand) Limited, Credit Suisse Securities (Malaysia) Sdn Bhd, Credit Suisse Singapore Branch and elsewhere in the world by the relevant authorised affiliate of the above. Research on Taiwanese securities produced by Credit Suisse Taipei Branch has been prepared by a registered Senior Business Person. Research provided to residents of Malaysia is authorised by the Head of Research for Credit Suisse Securities (Malaysia) Sdn. Bhd., to whom they should direct any queries on +603 2723 2020. In jurisdictions where CS is not already registered or licensed to trade in securities, transactions will only be effected in accordance with applicable securities legislation, which will vary from jurisdiction to jurisdiction and may require that the trade be made in accordance with applicable exemptions from registration or licensing requirements. Non-U.S. customers wishing to effect a transaction should contact a CS entity in their local jurisdiction unless governing law permits otherwise. U.S. customers wishing to effect a transaction should do so only by contacting a representative at Credit Suisse Securities (USA) LLC in the U.S. Please note that this report was originally prepared and issued by CS for distribution to their market professional and institutional investor customers. Recipients who are not market professional or institutional investor customers of CS should seek the advice of their independent financial advisor prior to taking any investment decision based on this report or for any necessary explanation of its contents. This research may relate to investments or services of a person outside of the UK or to other matters which are not regulated by the FSA or in respect of which the protections of the FSA for private customers and/or the UK compensation scheme may not be available, and further details as to where this may be the case are available upon request in respect of this report. Any Nielsen Media Research material contained in this report represents Nielsen Media Research's estimates and does not represent facts. NMR has neither reviewed nor approved this report and/or any of the statements made herein. Copyright 2006 CREDIT SUISSE and/or its affiliates. All rights reserved. ASIA/PACIFIC: +852 2101-6000 EUROPE: +44 (20) 7888-8888 UNITED STATES OF AMERICA: +1 (212) 325-2000