epi info 7 user guide-v1.0 cleared
TRANSCRIPT

7/14/2019 Epi Info 7 User Guide-V1.0 Cleared
http://slidepdf.com/reader/full/epi-info-7-user-guide-v10-cleared-563109dd5013b 1/368
Epi Info 7 User Guide
7/14/2019 Epi Info 7 User Guide-V1.0 Cleared
http://slidepdf.com/reader/full/epi-info-7-user-guide-v10-cleared-563109dd5013b 2/368
ii
Table of Contents
Contents
1. Getting Started ______________________________________________________________________________ 2
Introduction to Epi Info 7 2
Epi Info 7 Tools Overview 3
Analysis 3
Map 3
Options 4
General 4
Conventions Used in this Manual 5
Navigate Epi Info 7 8
Tech Support and Contact Information 10
Acknowledgements 11
2. Form Designer______________________________________________________________________________ 16
Introduction 16
Navigate the Form Designer Workspace 17
Available Field or Variable Types 18
Field Properties 24
Check Code Program Editor 25
How To: 26
Create a New Project and Form 26
Edit a Field in a Form 30
Set a Field or Prompt Font 31
Change Workspace Settings 32
Set the Tab Order 33
Set a Default Font 34
Align Fields 36
Insert a Background Image or Color 37
Work with Pages in a Form 38
Save Page as Template 41
Create a Mirror Field 47
Create an Option Box 48
Create Legal Values 49
Create a Comment Legal 50
Codes 51
Create Codes with Existing Table 53
Match Fields 54
Insert a Line as an Image 57
Insert an Image in a Record 58
Editing Related Forms 61
Delete an Existing Data Table Without Deleting the Form 62
Check Code 64
Overview 64
Create a Skip Pattern with GOTO 68
Create a Dialog 71
Use Autosearch 72
Set a European Date Format 73
Concatenate Fields 76
7/14/2019 Epi Info 7 User Guide-V1.0 Cleared
http://slidepdf.com/reader/full/epi-info-7-user-guide-v10-cleared-563109dd5013b 3/368
Table of Contents
iii
Create Check Code for Option Box Fields 79
How to use EpiWeek Function 81
3. Enter Data_________________________________________________________________________________ 82
Introduction 82
How To 84
Enter Data in a Form 84 Save a Page or Record 85
Find Records 86
4. Classic Analysis_____________________________________________________________________________ 90
Introduction 90
Navigate the Classic Analysis Workspace 91
How to Manage Data 93
Use the READ Command 93
Use Related Forms 97
Use the WRITE Command 99
Use the MERGE Command 101
Delete File/Table 106
Delete Records 109
Use the ROUTEOUT Command 111
Use the CANCEL SORT Command 113
Undelete Records 114
How to Manage Variables 115
Use the DEFINE Command 115
How to Use Undefine 120
Use the ASSIGN Command 121
How to Use Recode 123
Use the DISPLAY Command 125
How to Select Records 126
Use the SELECT Command 126
Use the IF Command 129
Use the Sort Command 131
CANCEL SORT 132
How to Display Statistics and Records 133
Use the LIST Command 133
Use the FREQ Command 135
Use the TABLES Command 138
Use the SUMMARIZE Command 146
Use the GRAPH Command 149
How to Manage Output 153
Header 153
TypeOut 155
Closeout 158
Printout 159
Storing Output 160 How to Use User-Defined Commands 162
Define Command (CMD) 162
Run Saved Program 163
Execute File 167
How to Create User Interaction 169
DIALOG 169
BEEP 173
QUIT 174
7/14/2019 Epi Info 7 User Guide-V1.0 Cleared
http://slidepdf.com/reader/full/epi-info-7-user-guide-v10-cleared-563109dd5013b 4/368
Epi Info 7 User Guide
iv
SET 176
How to Use Advanced Statistics 178
Use the REGRESS Command 178
Use the LOGISTIC Command 182
Use the KMSURVIVAL Command 185
Use the COXPH Command 188
Complex Sample Frequencies 194
Complex Sample Means 195
Complex Sample Tables 196
5. Translation ________________________________________________________________________________ 198
Features 198
How To Translate Epi Info 7 199
Create a New LANGUAGE .MDB Database 199
Use an Existing LANGUAGE .MDB Database 201
Choose a Language 204
6. Nutritional Anthropometry
_________________________________________________________________________________________ 206
Introduction 206
Using the Nutrition Project 206
Opening the Nutrition Form 206
Using the Nutrition Form 208
Customizing the Nutrition Forms 210
Creating Growth Charts 210
Using the Nutrition Functions 213
The ZSCORE Function 213
The PFROMZ Function 215
7. StatCalc __________________________________________________________________________________ 216
Introduction 216
How to Use StatCalc 217 Opening StatCalc 217
Analysis of Single and Stratified Tables 218
Population Survey or Descriptive Study 223
8. Command Reference ________________________________________________________________________ 226
Introduction 226
Check Code Commands 227
ASSIGN 227
AUTOSEARCH 229
BEEP 231
CLEAR 232
COMMENTS (*) 234
DEFINE 235
DEFINE DLLOBJECT 238
AFTER and END-AFTER 239
BEFORE and END-BEFORE 240
EXECUTE 241
GOTO 243
UNHIDE 245
IF THEN ELSE 247
NEWRECORD 250
7/14/2019 Epi Info 7 User Guide-V1.0 Cleared
http://slidepdf.com/reader/full/epi-info-7-user-guide-v10-cleared-563109dd5013b 5/368
Table of Contents
v
Analysis Commands 252
ASSIGN 252
BEEP 254
CANCEL SELECT or SORT 255
CLOSEOUT 256
COXPH 257
DEFINE 259
DEFINE DLLOBJECT 261
Define Group Command (Analysis Reference) 262
DELETE FILE/TABLES 263
DELETE RECORDS 264
DIALOG 265
DISPLAY 271
EXECUTE 273
FREQ 275
GRAPH 277
IF THEN ELSE 280
KMSURVIVAL 283
LIST 284
LOGISTIC 285
MEANS 286
MERGE 288
PRINTOUT 290
QUIT 291
READ 292
RECODE 294
REGRESS 297
RELATE 298
ROUTEOUT 300
RUNPGM 301
SELECT 302
SET 304
SORT 306
SUMMARIZE 307
TABLES 308
TYPEOUT 310
UNDEFINE 311
UNDELETE 312
WRITE 313
9. Functions and Operators ____________________________________________________________________ 316
Introduction 316
Syntax Notations 316
Operators 317
Operator Precedence 318
& Ampersand 319
= Equal Sign 319
Addition (+) 320
AND 321
ARITHMETIC 321
COMPARISONS 323
LIKE Operator 325
NOT 325
OR 326
XOR (eXclusive OR) 327
7/14/2019 Epi Info 7 User Guide-V1.0 Cleared
http://slidepdf.com/reader/full/epi-info-7-user-guide-v10-cleared-563109dd5013b 6/368
Epi Info 7 User Guide
vi
Functions 329
ABS Function 329
DAY 330
DAYS 330
EXISTS 331
EXP 331
FILEDATE 332
FINDTEXT 332
FORMAT 333
HOUR 337
HOURS 337
LN 338
LOG 338
MINUTES 339
MONTH 339
MONTHS 340
NUMTODATE 340
NUMTOTIME 342
RECORDCOUNT 344
RND 345
ROUND 346
SECONDS 347
SIN, COS, TAN 347
SUBSTRING 348
SYSTEMDATE 348
SYSTEMTIME 350
TRUNC 351
LIST Trc1 ADDSC 351
TXTTODATE 351
TXTTONUM 352
UPPERCASE 352
YEAR 353
YEARS 354
10. Glossary __________________________________________________________________________________ 356
11. Appendix _________________________________________________________________________________ 360
Data Quality Check 360
Date Validation 360
Numeric Data Validation – Lower and Upper Bound 360
Legal Values 361
Comment Legal Values 361
Auto Search 361
Skip Logic/Patterns 362
Update Data 362
Must Enter 362 Calculated Age 362
Analysis 363
Check for Duplicate Records 363
Delete Duplicate Records 363
Missing Data 363

7/14/2019 Epi Info 7 User Guide-V1.0 Cleared
http://slidepdf.com/reader/full/epi-info-7-user-guide-v10-cleared-563109dd5013b 7/368
Table of Contents
vii
7/14/2019 Epi Info 7 User Guide-V1.0 Cleared
http://slidepdf.com/reader/full/epi-info-7-user-guide-v10-cleared-563109dd5013b 8/368
2
Getting Started
Introduction to Epi Info 7
Epi Info 7 is a series of freely-distributable tools and utilities for Microsoft Windowsfor use by public health professionals to conduct outbreak investigations, managedatabases for public health surveillance and other tasks, and general database andstatistics applications. It enables physicians, epidemiologists, and other publichealth and medical officials to rapidly develop a questionnaire or form, customizethe data entry process, and enter and analyze data.
Epi Info 7 is free of charge and can be downloaded from the Centers for DiseaseControl and Prevention (CDC) website at http://www.cdc.gov/epiinfo.
Epi Info Tools
Form Designer - Create the questionnaire, form, or form to collect andview data.
Enter - Enter data and show existing records in the form.
Classic Analysis - Run statistical analyses, lists, tables, graphs, charts,etc.
Map - Create maps from Map Server or ShapeFiles.
Options - User custom configuration of Epi Info.
o General - Set default values for data format, Map server, etc.
o Language - Use Epi Info 7 tools in languages other than English.
o Analysis - Set default Boolean values, HTML output format, etc.
o Plug-ins - Import new Dashboard Gadgets and Data Sources.
Additional Utilities
StatCalc - Epidemiologic calculators for statistics of summary data.
7/14/2019 Epi Info 7 User Guide-V1.0 Cleared
http://slidepdf.com/reader/full/epi-info-7-user-guide-v10-cleared-563109dd5013b 9/368
Getting Started
3
Epi Info 7 Tools Overview
Form Designer
The Form Designer module can be accessed by clicking on the Create Forms buttonon the main menu or through the Tools/Create Forms option available from the topmenu. The Form Designer module allows you to place prompts and data entry fieldson one or more pages of a form. Since this process also defines the database(s) thatare created, Form Designer can be regarded as the database design environment.
The Check Code editor within Form Designer customizes data entry providing manycommands and functions. It enables operators to validate data as they are entered,auto-calculate fields, provide skip patterns, and deliver messages to the data entryuser. For more information, see Introduction to Form Designer.
Enter
The Enter module can be accessed by clicking on the Enter Data button on the mainmenu or through the Tools/Enter Data option available from the top menu. Enterdisplays the form that was constructed in Form Designer. It can construct a datatable, control the data entry process using the settings and check code specified inForm Designer, and provide a search function to locate records that match valuesspecified for any combination of variables or fields on the form. In Enter, the cursormoves from field-to-field and page-to-page automatically saving data. Navigationbuttons provide access to new, previous, next, first, and last records, and to theirrelated tables. For more information, see Introduction to Enter.
Analysis
Analysis is the Epi Info 7 tool that allows you to manipulate, manage and analyzedata. The Analysis module offers two interfaces; Classic and Visual Dashboard.Both of these interfaces can be accessed by clicking on the Classic or VisualDashboard button on the main menu or through the Tools/Analyze Data optionavailable from the top menu. These data may have been collected using Epi Info 7or another type of database. Currently, Analysis can read data formats in MS
Access, Excel, SQL server, and ASCII. It offers simple and intuitive tools to producemany forms of useful statistics and graphs for epidemiologists and other publichealth professionals. For more information, see Introduction to Analysis.
Map
The mapping component of Epi Info 7, Map, can be accessed by clicking on theCreate Maps button on the main menu or through the Tools/Create Maps optionlocated on the top menu. Epi Info 7 Map shows data from multiple data formats byrelating data fields to shape files or through point locations containing X and Y coordinates in various symbols, colors, and sizes. Choropleth and Case-Based aresupported. For more information, see Introduction to Map.
7/14/2019 Epi Info 7 User Guide-V1.0 Cleared
http://slidepdf.com/reader/full/epi-info-7-user-guide-v10-cleared-563109dd5013b 10/368
Epi Info 7 User Guide
4
Options
General
Sets background images, default database formats, and map service keys formapping and geocoding.
Language
Translates completed Epi Info 7 programs into non-English languages by creatingand importing translation definition files. Translation can be done without changingthe names of files, and individual translations can be installed or uninstalledwithout affecting the main programs. Switching from one language to another canbe done from the main menu.
Analysis
Displays the current values of Analysis option settings and provides various optionsthat affect the performance and output of data in Analysis. Settings are usedwhenever the Classic Analysis module is used.
Plug-ins
All of the analysis in the Visual Dashboard module is done using gadgets, whichalways appear by default. Currently, the record count, data filtering, data recoding,and formatting gadgets are automatically incorporated in the Visual Dashboard
module. Additional gadgets can be added with future releases of Epi Info 7.
7/14/2019 Epi Info 7 User Guide-V1.0 Cleared
http://slidepdf.com/reader/full/epi-info-7-user-guide-v10-cleared-563109dd5013b 11/368
Getting Started
5
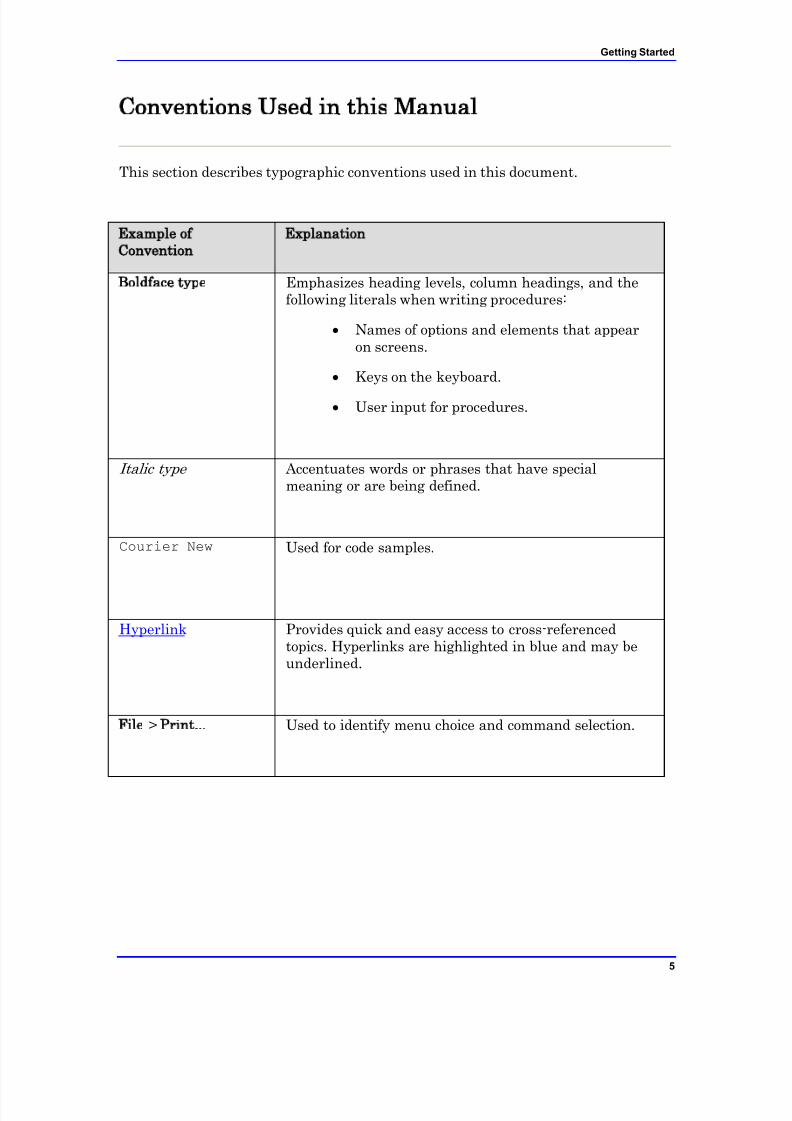
Conventions Used in this Manual
This section describes typographic conventions used in this document.
Example ofConvention
Explanation
Boldface type Emphasizes heading levels, column headings, and thefollowing literals when writing procedures:
Names of options and elements that appearon screens.
Keys on the keyboard.
User input for procedures.
Italic type Accentuates words or phrases that have specialmeaning or are being defined.
Courier New Used for code samples.
Hyperlink Provides quick and easy access to cross-referencedtopics. Hyperlinks are highlighted in blue and may beunderlined.
File > Print... Used to identify menu choice and command selection.
7/14/2019 Epi Info 7 User Guide-V1.0 Cleared
http://slidepdf.com/reader/full/epi-info-7-user-guide-v10-cleared-563109dd5013b 12/368
Epi Info 7 User Guide
6
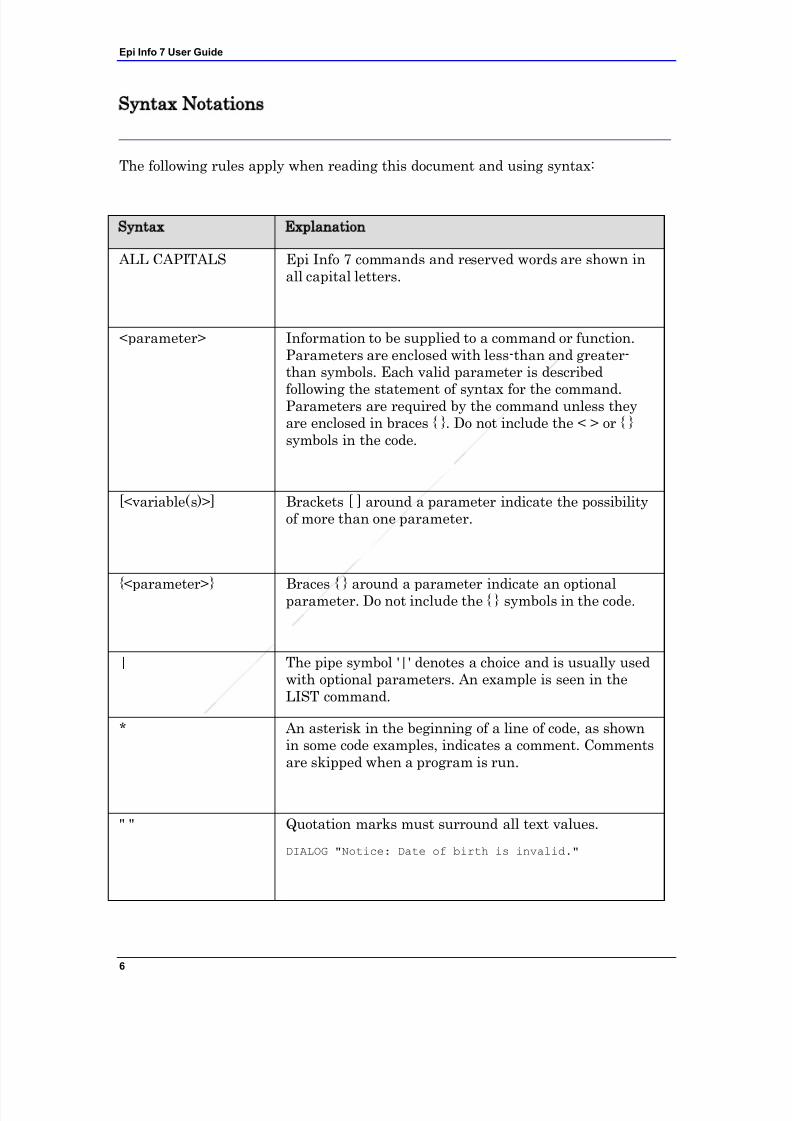
Syntax Notations
The following rules apply when reading this document and using syntax:
Syntax Explanation
ALL CAPITALS Epi Info 7 commands and reserved words are shown inall capital letters.
<parameter> Information to be supplied to a command or function.Parameters are enclosed with less-than and greater-than symbols. Each valid parameter is described
following the statement of syntax for the command.Parameters are required by the command unless theyare enclosed in braces { }. Do not include the < > or { }symbols in the code.
[<variable(s)>] Brackets [ ] around a parameter indicate the possibilityof more than one parameter.
{<parameter>} Braces { } around a parameter indicate an optionalparameter. Do not include the { } symbols in the code.
| The pipe symbol '|' denotes a choice and is usually usedwith optional parameters. An example is seen in theLIST command.
* An asterisk in the beginning of a line of code, as shownin some code examples, indicates a comment. Commentsare skipped when a program is run.
" " Quotation marks must surround all text values.
DIALOG "Notice: Date of birth is invalid."
7/14/2019 Epi Info 7 User Guide-V1.0 Cleared
http://slidepdf.com/reader/full/epi-info-7-user-guide-v10-cleared-563109dd5013b 13/368
Getting Started
7
System Requirements
Microsoft Windows XP or above
Microsoft .NET Framework 3.5 or above
Recommended - 1 GHz processor
Recommended - 256 MB RAM
NOTES
Epi Info 7 may be downloaded in two different formats: As a “zip” or a “setup” file. The followingexplains what scenarios may be best suited for each format.
ZIP (.zip file) Installation Can be downloaded to most user desktops and run without requiring administrative or
elevated privileges.
Can be extracted to and run from any folder that the user has read/write/execute privileges
on (including thumb drives).
Assumes that the machine already has Microsoft .NET 3.5 and other prerequisites
installed.
Recommended for disconnected laptops and other emergency use if IT support or
infrastructure is unavailable.
Setup (.msi file) Installation
Traditional setup mechanism that deploys Epi Info™ 7 to the location required by IT
policy.
Allows network administrators to centrally manage and push Epi Info™ 7, including
updates and patches, to users using Microsoft System Center Configuration Manager.
Ensures that the machine's configuration matches the software‟s minimum requirements.
Pre-compiles and registers Epi Info™ 7 components on the machine which enables certain
components to run faster.
Requires administrative or elevated privileges during installation.
Recommended for centrally managed IT environments.
7/14/2019 Epi Info 7 User Guide-V1.0 Cleared
http://slidepdf.com/reader/full/epi-info-7-user-guide-v10-cleared-563109dd5013b 14/368
Epi Info 7 User Guide
8
Navigate Epi Info 7
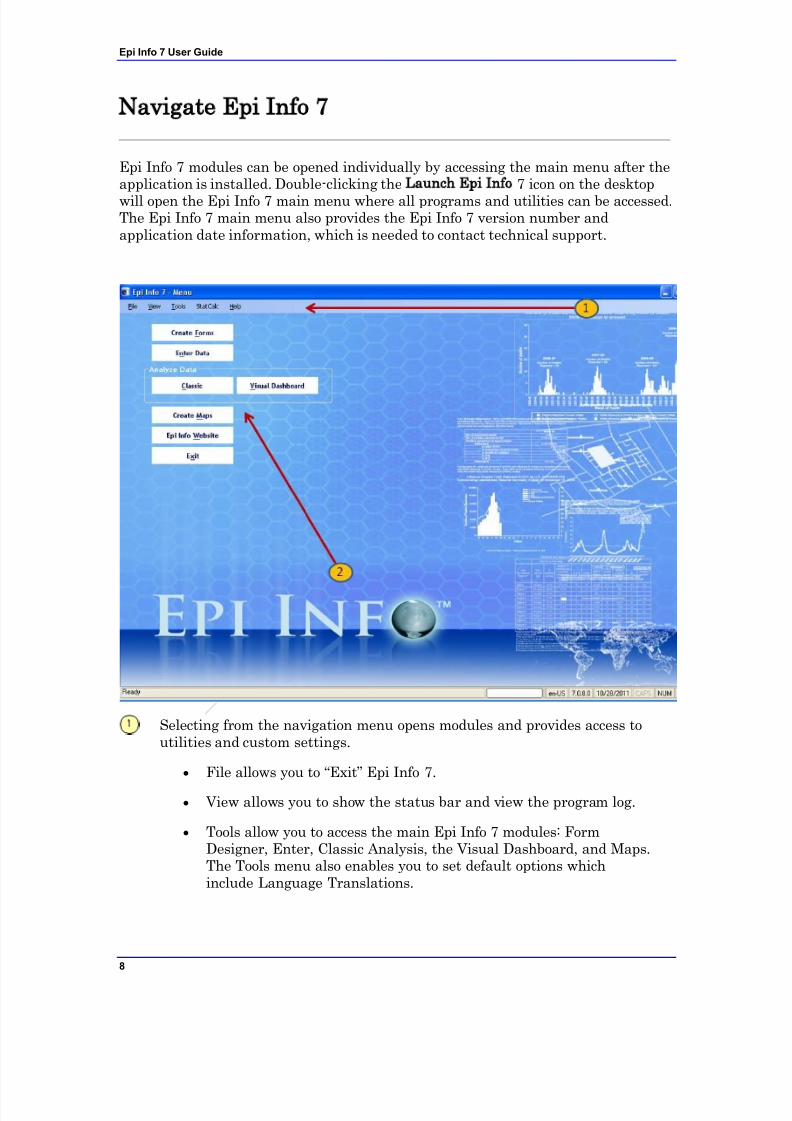
Epi Info 7 modules can be opened individually by accessing the main menu after theapplication is installed. Double-clicking the Launch Epi Info 7 icon on the desktop
will open the Epi Info 7 main menu where all programs and utilities can be accessed.The Epi Info 7 main menu also provides the Epi Info 7 version number andapplication date information, which is needed to contact technical support.
Selecting from the navigation menu opens modules and provides access toutilities and custom settings.
File allows you to “Exit” Epi Info 7.
View allows you to show the status bar and view the program log.
Tools allow you to access the main Epi Info 7 modules: FormDesigner, Enter, Classic Analysis, the Visual Dashboard, and Maps.The Tools menu also enables you to set default options whichinclude Language Translations.
7/14/2019 Epi Info 7 User Guide-V1.0 Cleared
http://slidepdf.com/reader/full/epi-info-7-user-guide-v10-cleared-563109dd5013b 15/368
Getting Started
9
StatCalc is a sample size calculator.
Help provides access to the online help videos, an Epi Infodiscussion forum, instructions on how to contact the Help Desk, andan About Epi Info page.
Clicking the menu buttons allows easy access to the most used modules:Form Designer, Enter, Classic Analysis, the Visual Dashboard, Maps, theEpi Info website (requires Internet connection), and the ability to exit theapplication.
7/14/2019 Epi Info 7 User Guide-V1.0 Cleared
http://slidepdf.com/reader/full/epi-info-7-user-guide-v10-cleared-563109dd5013b 16/368
Epi Info 7 User Guide
10
Tech Support and Contact Information
CDC provides funding for the Epi Info Help Desk, which offers free technical supportto all Epi Info users from 8:30 a.m. to 4:30 p.m.
If you have any questions or issues with Epi Info systems, contact the Epi Info HelpDesk:
Epi Info Help Desk: 404-498-6190
Epi Info E-mail: [email protected]
Website
The latest version of the Epi Info software, shapefiles for Epi Map, comprehensivetutorials, and translations can be downloaded from the Epi Info website.
Epi Info User Community Website
The Epi Info User Community Website provides a forum for user questions andanswers. Join the group by creating a user account athttp://www.phconnect.org/group/epiinfo. Complete the instructions for joining.

7/14/2019 Epi Info 7 User Guide-V1.0 Cleared
http://slidepdf.com/reader/full/epi-info-7-user-guide-v10-cleared-563109dd5013b 17/368
Getting Started
11
Acknowledgements
A Database and Statistics Program for Public Health Professionals
CDC Core Team (in alphabetical order):
José Aponte
Harold Collins
John Copeland
James Haines (McKing Consulting)
Asad Islam (Team Leader)
Gerald Jones
Erik Knudsen
David McKing (McKing Consulting)
Roger Mir
David Nitschke
Carol Worsham
Special thanks to: Sara Bedrosian
Doug Bialecki
Karl August Brendel, III
Andy Dean
Robert Fagan
Gabriel Rainisch
Donald Chris Smith
Enrique Nieves

7/14/2019 Epi Info 7 User Guide-V1.0 Cleared
http://slidepdf.com/reader/full/epi-info-7-user-guide-v10-cleared-563109dd5013b 18/368
Epi Info 7 User Guide
12
Suggested citation: Dean AG, Arner TG, Sunki GG, Friedman R,Lantinga M, Sangam S, Zubieta JC, Sullivan KM, Brendel KA, Gao Z,Fontaine N, Shu M, Fuller G, Smith DC, Nitschke DA, and Fagan RF.Epi Info™, a database and statistics program for public healthprofessionals. CDC, Atlanta, GA, USA, 2011.
Additional thanks to:
EIS Epi Info 7 Workgroup
Sudhir Bunga
Timothy Cunningham
Nancy Fleischer
Alyson Goodman
Asha Ivy Jeffrey Miller Timothy Minniear (Chairperson)
Diane Morof
Cyrus Shahpar
Danielle Tack
Christopher Taylor
Ellen Yard
PHPS Epi Info 7 Workgroup
Tegan L. Callahan
Sarah Elkerholm
Coby E. Jansen
Amy V. Neuwelt
Cristina M. Rodriguez Hart Tina J. Sang
Anna S. Talman (Chairperson)
Angela s. Tang
Sharron H. Wyatt
7/14/2019 Epi Info 7 User Guide-V1.0 Cleared
http://slidepdf.com/reader/full/epi-info-7-user-guide-v10-cleared-563109dd5013b 19/368
Getting Started
13
Special thanks to past contributions:
Previous versions produced in collaboration with the World Health Organization(WHO), Geneva, Switzerland, by Andrew G. Dean, Jeffrey A. Dean, Denis
Coulombier, Anthony H. Burton, Karl A. Brendel, Donald C. Smith, Richard C.Dicker, Kevin M. Sullivan, Thomas G. Arner, and Robert F. Fagan.
Manual by Andrew G. Dean, Juan Carlos Zubieta, Kevin M. Sullivan, CecileDelhumeau, Ralph H. Lord, Jr., Shonna Luten, and Shannon Jones.
Tutorial exercises by Juan Carlos Zubieta, Consuelo M. Beck-Sagué, G. AllenTindol, Karen DeRosa, Jinghong Ma, and Shannon Jones.
Division of Epidemiology and Analytic Methods
Epidemiology and Analysis Program OfficeOffice of Surveillance, Epidemiology, and Laboratory Services
Centers for Disease Control and Prevention (CDC)
1600 Clifton Road, (Mail Stop E-33)
Atlanta, GA 30333
This manual and the programs are in the public domain and may be freely copied,translated, and distributed. All are available at www.cdc.gov/epiinfo.
Epi Info Help Desk for Technical Assistance
(404) 498-6190 voice
7/14/2019 Epi Info 7 User Guide-V1.0 Cleared
http://slidepdf.com/reader/full/epi-info-7-user-guide-v10-cleared-563109dd5013b 20/368
Epi Info 7 User Guide
14
Additional Acknowledgements
StatClac algorithms and formulas provided by OpenEpi.com.
Aberration detection algorithms provided by the CDC‟s Early Aberration ReportingSystem (EARS). For more information on EARS visit:http://emergency.cdc.gov/surveillance/ears/
Equations Acknowledgements
We thank Drs. David Martin and Harland Austin for use of their source code forcomputing exact and mid-p exact statistical tests and confidence intervals for theodds and rate ratios. Thanks to reviewers of this chapter who provided comments,and to the software testers.
Epi Info's Nutrition Project File (replaces NutStat) Acknowledgements
Special thanks to Kevin Sullivan, Ph.D., Department of Pediatrics, School of Medicine and Department of Epidemiology, Rollins School of Public Health, EmoryUniversity, Atlanta, GA; Nathan Gorstein, WHO; Phillip Neibrug, M.D., M.P.H.,Norman Staehling, M.S., Ronald Fichtner, Ph.D., and Frederick Trowbridge, M.D.,CDC, for their assistance in preparing the Epi Info™ 6 manual upon which portionsof this manual are based.
Notes
These programs are provided in the public domain to promote public health. We
encourage you to provide copies of the programs and the manual to friends andcolleagues. The programs may be freely translated, copied, distributed, or even soldwithout restriction except as noted below. No warranty is made or implied for use of the software for any particular purpose.
"Epi Info" is a trademark of the CDC. Please observe the following requests:
The programs can be translated and the examples altered for regional use, but mustbe distributed in essentially the form supplied by CDC.
Epi Info is written in C# .NET and runs on version 3.5 of the Microsoft .NETFramework.
Microsoft, Windows, Word, and Visual Basic are registered trademarks of MicrosoftCorp. Trade names are used for identification or examples; no endorsement of particular products is intended or implied. The use of trade names or trademarks inthis manual does not imply that such names, as understood by the Trade Marks andMerchandise Marks Act, may be used freely by anyone.
7/14/2019 Epi Info 7 User Guide-V1.0 Cleared
http://slidepdf.com/reader/full/epi-info-7-user-guide-v10-cleared-563109dd5013b 21/368
Getting Started
15
Technical Support
For new versions of the software and answers to commonly asked questions, pleasevisit the Epi Info website at http://www.cdc.gov/epiinfo. Technical assistance isprovided by e-mail or telephone. Information for obtaining Epi Info technicalassistance is provided on the title page.
The Epi Info WebBoard provides a forum for user questions and answers. Join thegroup by creating a user account at http://phconnect.org/group/epiinfo.Follow theinstructions to join.
Contact Us
Please send comments and suggestions for future versions to:
Epi Info Hotline
(404) 498-6190 voice

7/14/2019 Epi Info 7 User Guide-V1.0 Cleared
http://slidepdf.com/reader/full/epi-info-7-user-guide-v10-cleared-563109dd5013b 22/368
16
Form Designer
Introduction
Epi Info 7 may use the Microsoft Access database format or a SQL server databaseto create projects. Each project contains one or more forms, and each form may haveone or more data tables. Form Designer allows you to place prompts and data entryfields on one or more pages within the form. Since this process also defines thedatabase(s) that are created, Form Designer can be regarded as the database designenvironment.
The form and the data table are located inside an Epi Info 7 project. An unlimitedamount of forms may be contained inside a project. When data are entered into aform through the Enter module, it will be populated into the form‟s correspondingdata table.
Inside each form, fields (called variables in Analysis) are created to hold data. TheCheck Code Editor component of the Form Designer can be used to add intelligenceto a form (e.g., allowing for skip patterns, hiding fields from view, and performingmath calculations). It can also be used to implement data validation checks.Functions are provided for importing files from Epi Info 3.5.x, aligning fields, andplacing a layout grid on the workspace. Fields can also be grouped for display andused in Classic Analysis or Visual Dashboard.
7/14/2019 Epi Info 7 User Guide-V1.0 Cleared
http://slidepdf.com/reader/full/epi-info-7-user-guide-v10-cleared-563109dd5013b 23/368
Form Designer
17
Navigate the Form Designer Workspace
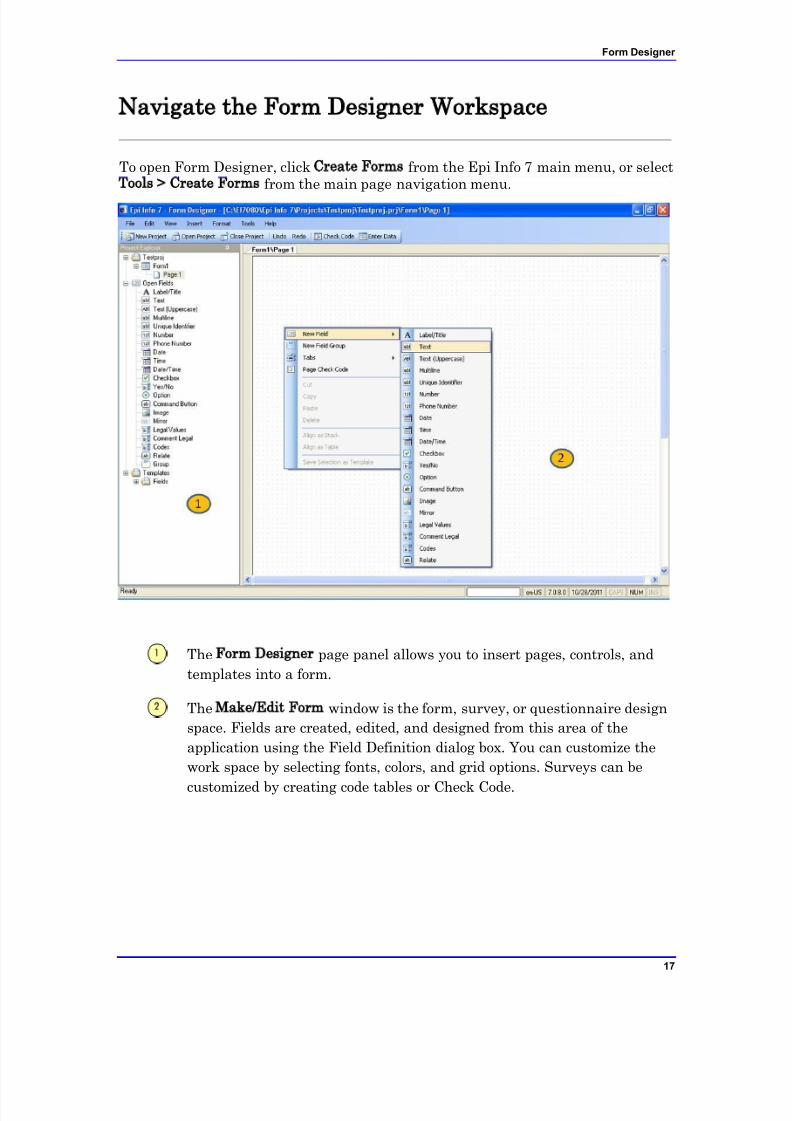
To open Form Designer, click Create Forms from the Epi Info 7 main menu, or selectTools > Create Forms from the main page navigation menu.
The Form Designer page panel allows you to insert pages, controls, and
templates into a form.
The Make/Edit Form window is the form, survey, or questionnaire design
space. Fields are created, edited, and designed from this area of the
application using the Field Definition dialog box. You can customize the
work space by selecting fonts, colors, and grid options. Surveys can be
customized by creating code tables or Check Code.
7/14/2019 Epi Info 7 User Guide-V1.0 Cleared
http://slidepdf.com/reader/full/epi-info-7-user-guide-v10-cleared-563109dd5013b 24/368
Epi Info 7 User Guide
18
Available Field or Variable Types
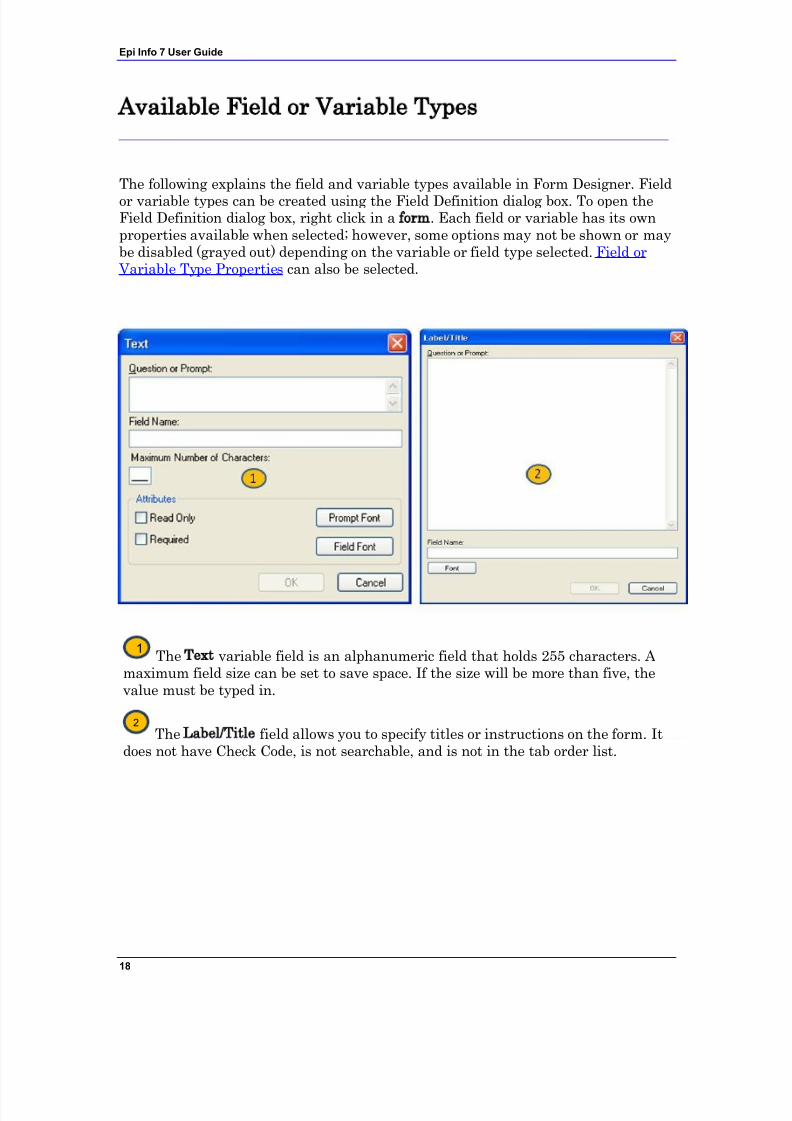
The following explains the field and variable types available in Form Designer. Field
or variable types can be created using the Field Definition dialog box. To open theField Definition dialog box, right click in a form. Each field or variable has its ownproperties available when selected; however, some options may not be shown or maybe disabled (grayed out) depending on the variable or field type selected. Field or
Variable Type Properties can also be selected.
The Text variable field is an alphanumeric field that holds 255 characters. A maximum field size can be set to save space. If the size will be more than five, thevalue must be typed in.
The Label/Title field allows you to specify titles or instructions on the form. Itdoes not have Check Code, is not searchable, and is not in the tab order list.
1
2
7/14/2019 Epi Info 7 User Guide-V1.0 Cleared
http://slidepdf.com/reader/full/epi-info-7-user-guide-v10-cleared-563109dd5013b 25/368
Form Designer
19
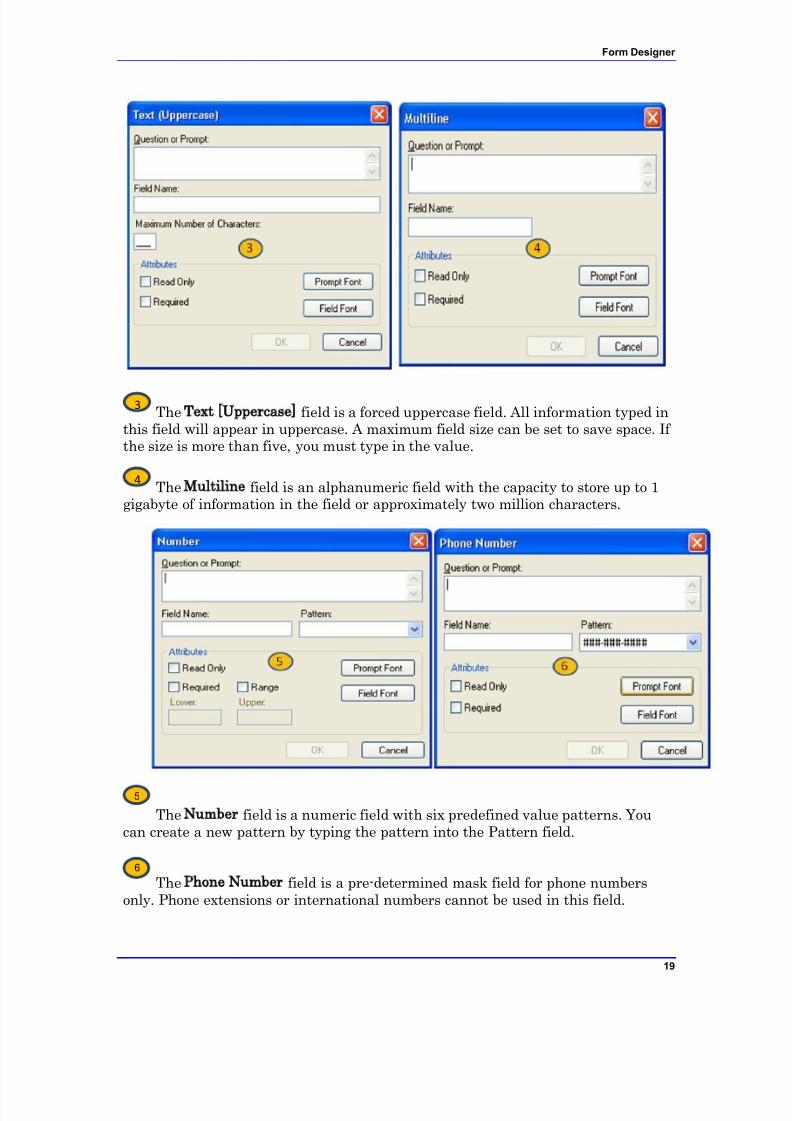
The Text [Uppercase] field is a forced uppercase field. All information typed inthis field will appear in uppercase. A maximum field size can be set to save space. If the size is more than five, you must type in the value.
The Multiline field is an alphanumeric field with the capacity to store up to 1gigabyte of information in the field or approximately two million characters.
The Number field is a numeric field with six predefined value patterns. Youcan create a new pattern by typing the pattern into the Pattern field.
The Phone Number field is a pre-determined mask field for phone numbersonly. Phone extensions or international numbers cannot be used in this field.
3
4
5
6
7/14/2019 Epi Info 7 User Guide-V1.0 Cleared
http://slidepdf.com/reader/full/epi-info-7-user-guide-v10-cleared-563109dd5013b 26/368
Epi Info 7 User Guide
20
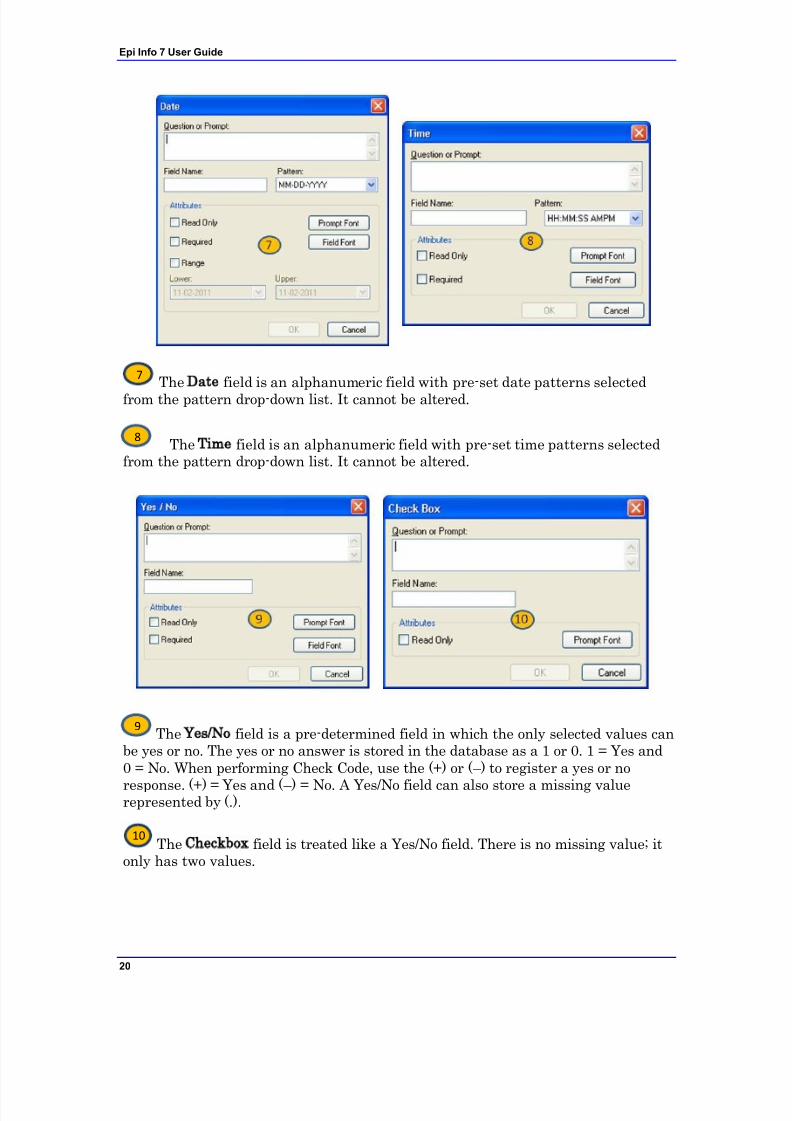
The Date field is an alphanumeric field with pre-set date patterns selectedfrom the pattern drop-down list. It cannot be altered.
The Time field is an alphanumeric field with pre-set time patterns selectedfrom the pattern drop-down list. It cannot be altered.
The Yes/No field is a pre-determined field in which the only selected values canbe yes or no. The yes or no answer is stored in the database as a 1 or 0. 1 = Yes and0 = No. When performing Check Code, use the (+) or ( – ) to register a yes or no
response. (+) = Yes and ( – ) = No. A Yes/No field can also store a missing valuerepresented by (.).
The Checkbox field is treated like a Yes/No field. There is no missing value; itonly has two values.
7
8
9
10
7/14/2019 Epi Info 7 User Guide-V1.0 Cleared
http://slidepdf.com/reader/full/epi-info-7-user-guide-v10-cleared-563109dd5013b 27/368
Form Designer
21
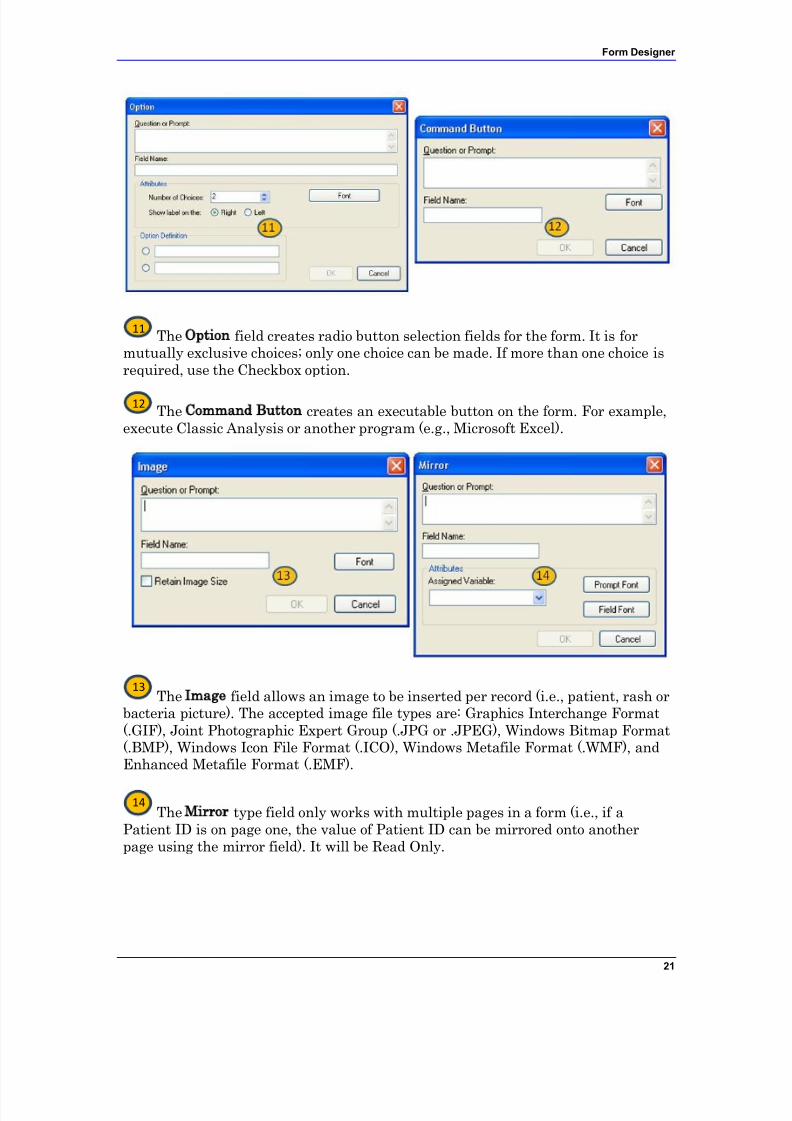
The Option field creates radio button selection fields for the form. It is formutually exclusive choices; only one choice can be made. If more than one choice isrequired, use the Checkbox option.
The Command Button creates an executable button on the form. For example,execute Classic Analysis or another program (e.g., Microsoft Excel).
The Image field allows an image to be inserted per record (i.e., patient, rash orbacteria picture). The accepted image file types are: Graphics Interchange Format(.GIF), Joint Photographic Expert Group (.JPG or .JPEG), Windows Bitmap Format(.BMP), Windows Icon File Format (.ICO), Windows Metafile Format (.WMF), andEnhanced Metafile Format (.EMF).
The Mirror type field only works with multiple pages in a form (i.e., if aPatient ID is on page one, the value of Patient ID can be mirrored onto anotherpage using the mirror field). It will be Read Only.
11
12
13
14
7/14/2019 Epi Info 7 User Guide-V1.0 Cleared
http://slidepdf.com/reader/full/epi-info-7-user-guide-v10-cleared-563109dd5013b 28/368
Epi Info 7 User Guide
22
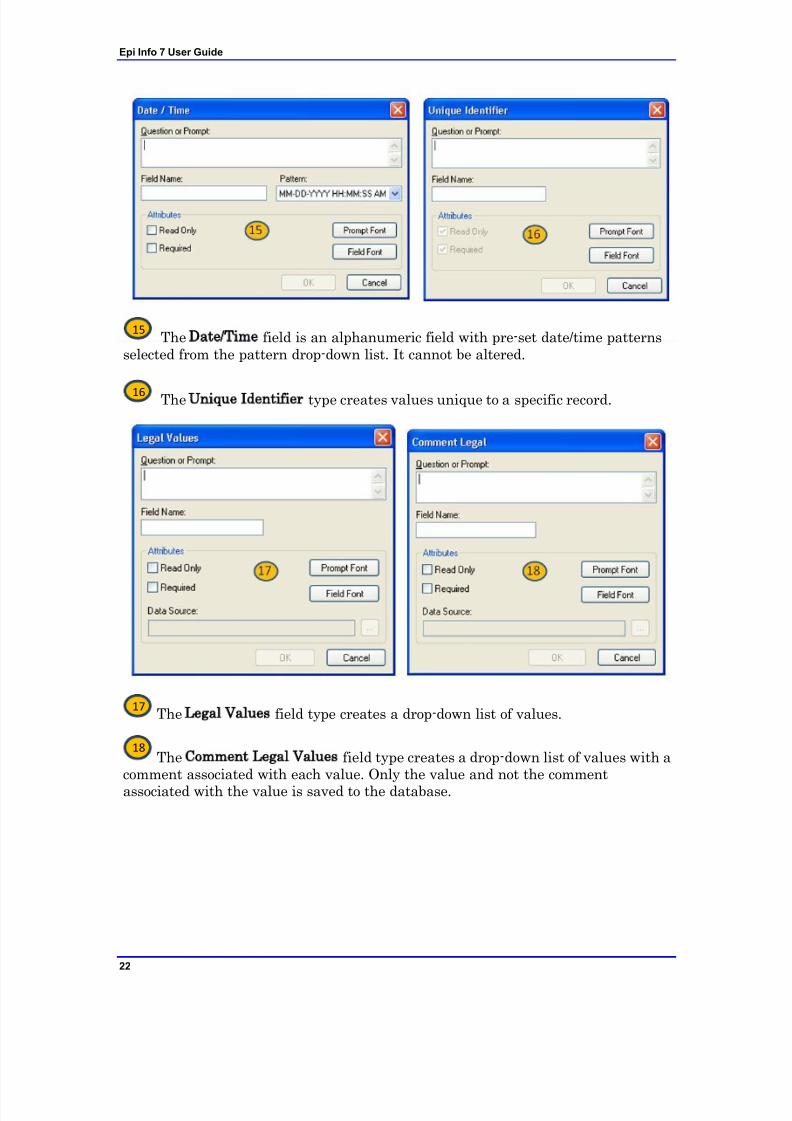
The Date/Time field is an alphanumeric field with pre-set date/time patternsselected from the pattern drop-down list. It cannot be altered.
The Unique Identifier type creates values unique to a specific record.
The Legal Values field type creates a drop-down list of values.
The Comment Legal Values field type creates a drop-down list of values with acomment associated with each value. Only the value and not the comment
associated with the value is saved to the database.
15
16
17
18
7/14/2019 Epi Info 7 User Guide-V1.0 Cleared
http://slidepdf.com/reader/full/epi-info-7-user-guide-v10-cleared-563109dd5013b 29/368
Form Designer
23
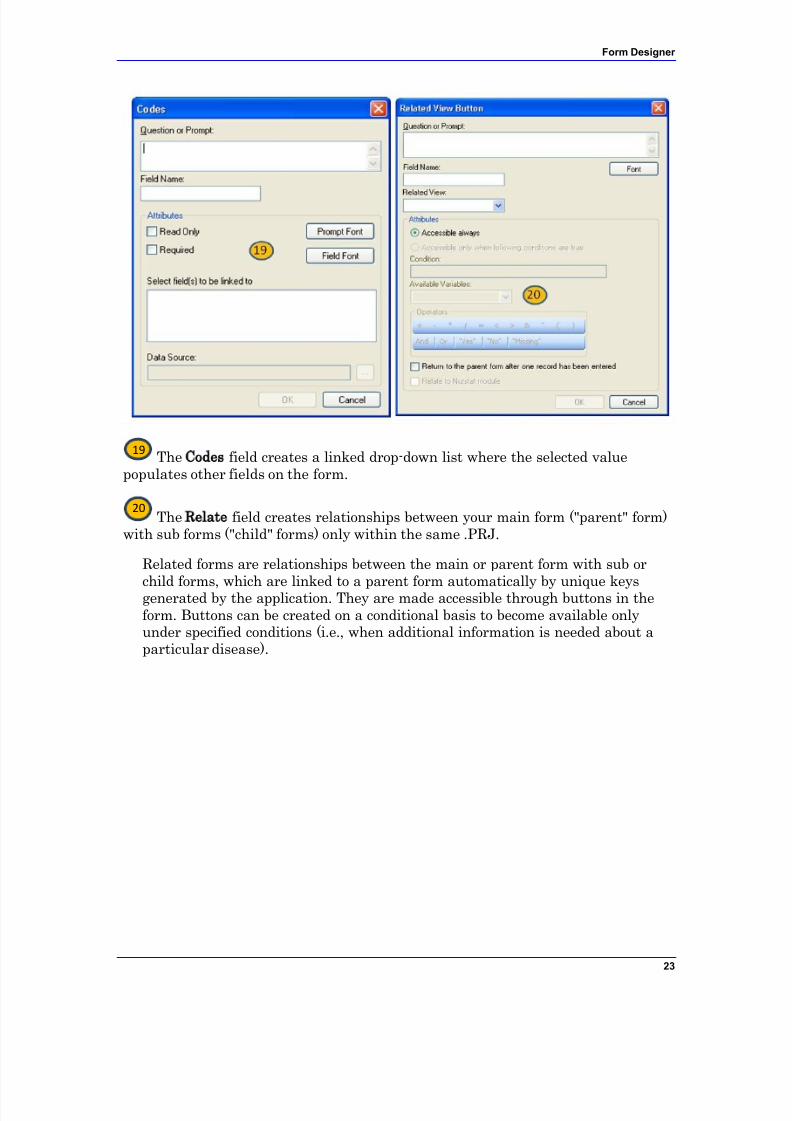
The Codes field creates a linked drop-down list where the selected valuepopulates other fields on the form.
The Relate field creates relationships between your main form ("parent" form)with sub forms ("child" forms) only within the same .PRJ.
Related forms are relationships between the main or parent form with sub orchild forms, which are linked to a parent form automatically by unique keysgenerated by the application. They are made accessible through buttons in theform. Buttons can be created on a conditional basis to become available onlyunder specified conditions (i.e., when additional information is needed about aparticular disease).
19
20
7/14/2019 Epi Info 7 User Guide-V1.0 Cleared
http://slidepdf.com/reader/full/epi-info-7-user-guide-v10-cleared-563109dd5013b 30/368
Epi Info 7 User Guide
24
Field Properties
Select Field types by right-clicking on the Form Designer canvas by using the NewField option. Each field has a set of available field properties; however, some optionsmay not be shown or may be disabled (grayed out) depending on the field typeselected.
A Required field is mandatory. It cannot be used in combination with ReadOnly because the properties are mutually exclusive. If a page contains aRequired field, the Enter module will not allow further page navigation untila value has been entered. To avoid gridlock, use this property sparingly.
A Read Only field does not allow the placement of the cursor in the field ordata entry. It is particularly useful for calculated fields that will not bechanged directly. Read Only cannot be used in combination with Requiredbecause those properties are mutually exclusive.
Retain Image Size maintains the size of the original image and does not alterthe size to fit the image box in the form.
The Range property can be applied to Number or Date field types. It allowsfor a specified value between one setting and another. Values falling outsidea specified range will prompt the user with a warning message in the Entermodule. Missing values are accepted unless the field is designated Required.
7/14/2019 Epi Info 7 User Guide-V1.0 Cleared
http://slidepdf.com/reader/full/epi-info-7-user-guide-v10-cleared-563109dd5013b 31/368
Form Designer
25
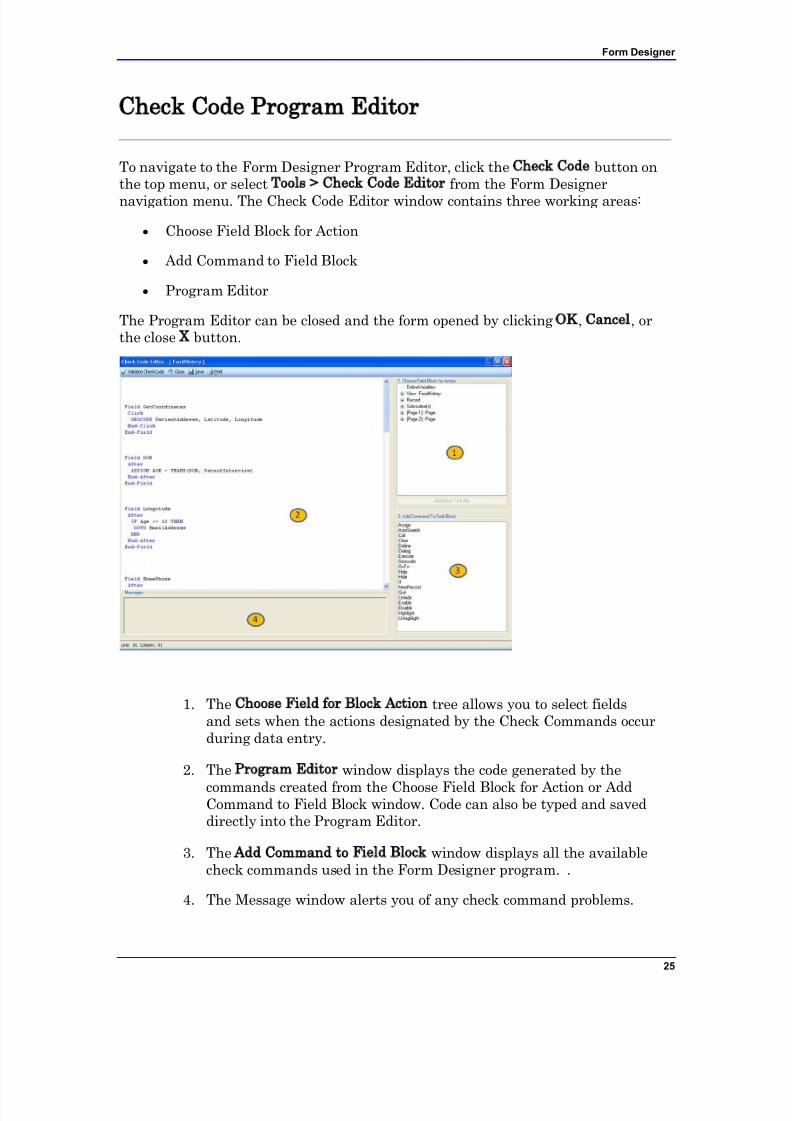
Check Code Program Editor
To navigate to the Form Designer Program Editor, click the Check Code button onthe top menu, or select Tools > Check Code Editor from the Form Designer
navigation menu. The Check Code Editor window contains three working areas:
Choose Field Block for Action
Add Command to Field Block
Program Editor
The Program Editor can be closed and the form opened by clicking OK, Cancel, orthe close X button.
1. The Choose Field for Block Action tree allows you to select fieldsand sets when the actions designated by the Check Commands occurduring data entry.
2. The Program Editor window displays the code generated by the
commands created from the Choose Field Block for Action or AddCommand to Field Block window. Code can also be typed and saveddirectly into the Program Editor.
3. The Add Command to Field Block window displays all the availablecheck commands used in the Form Designer program. .
4. The Message window alerts you of any check command problems.
7/14/2019 Epi Info 7 User Guide-V1.0 Cleared
http://slidepdf.com/reader/full/epi-info-7-user-guide-v10-cleared-563109dd5013b 32/368
Epi Info 7 User Guide
26
How To:
Create a New Project and Form
1. From the Epi Info main menu, select Create Forms or select Tools > CreateForms. The Form Designer window opens.
2. Select File > New Project. The New Project window opens.
3. Type a project (file) name.
4. Tab to, or select the Form Name field.
5. Type a Form Name for the new form.
Use only letters and numbers.
Do not start a form name with a number.
Do not use any spaces.
6. Click OK. The Form Designer page appears with the new form name and pageon the tab at the top left of the page.
7. To create fields, right click in the workspace to open the Field Definition dialogbox.
Create a New Form in an Existing Project1. Select File > New Form. The Name the form dialog box opens.
2. Type a Form Name.
3. Click OK. The new form appears in the workspace.
A new form is created in the existing project.
7/14/2019 Epi Info 7 User Guide-V1.0 Cleared
http://slidepdf.com/reader/full/epi-info-7-user-guide-v10-cleared-563109dd5013b 33/368
Form Designer
27
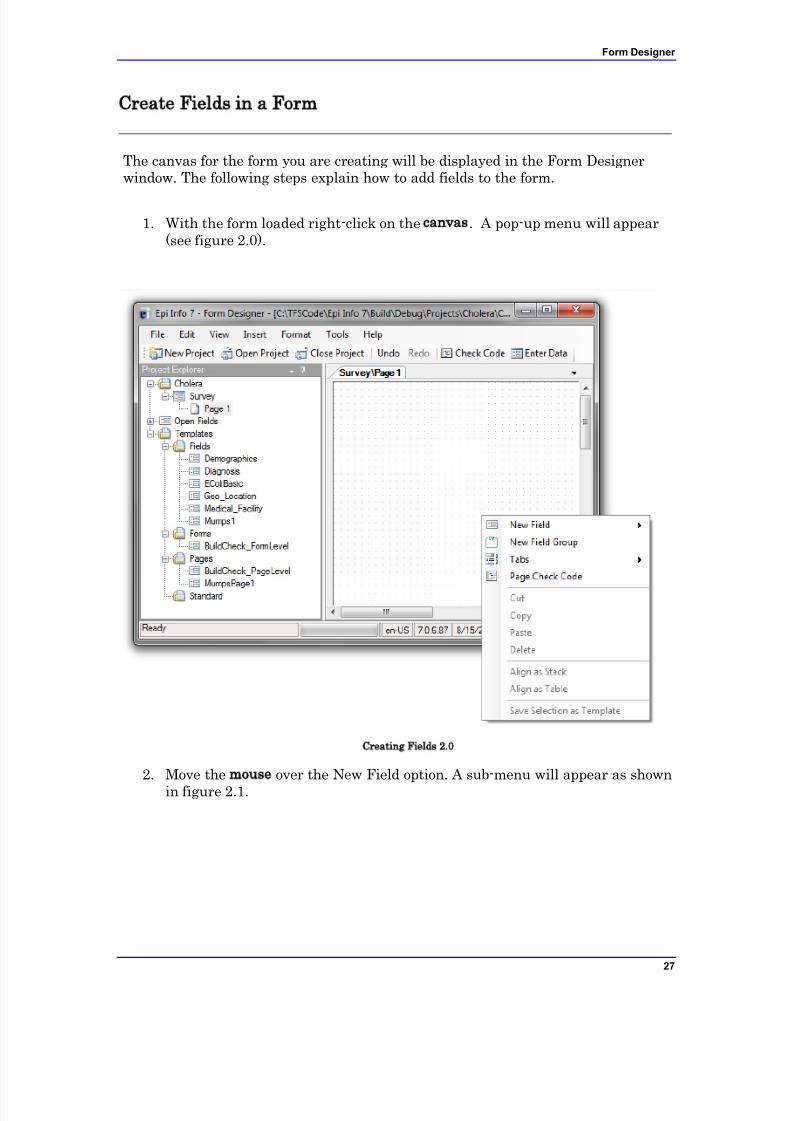
Create Fields in a Form
The canvas for the form you are creating will be displayed in the Form Designerwindow. The following steps explain how to add fields to the form.
1. With the form loaded right-click on the canvas. A pop-up menu will appear(see figure 2.0).
Creating Fields 2.0
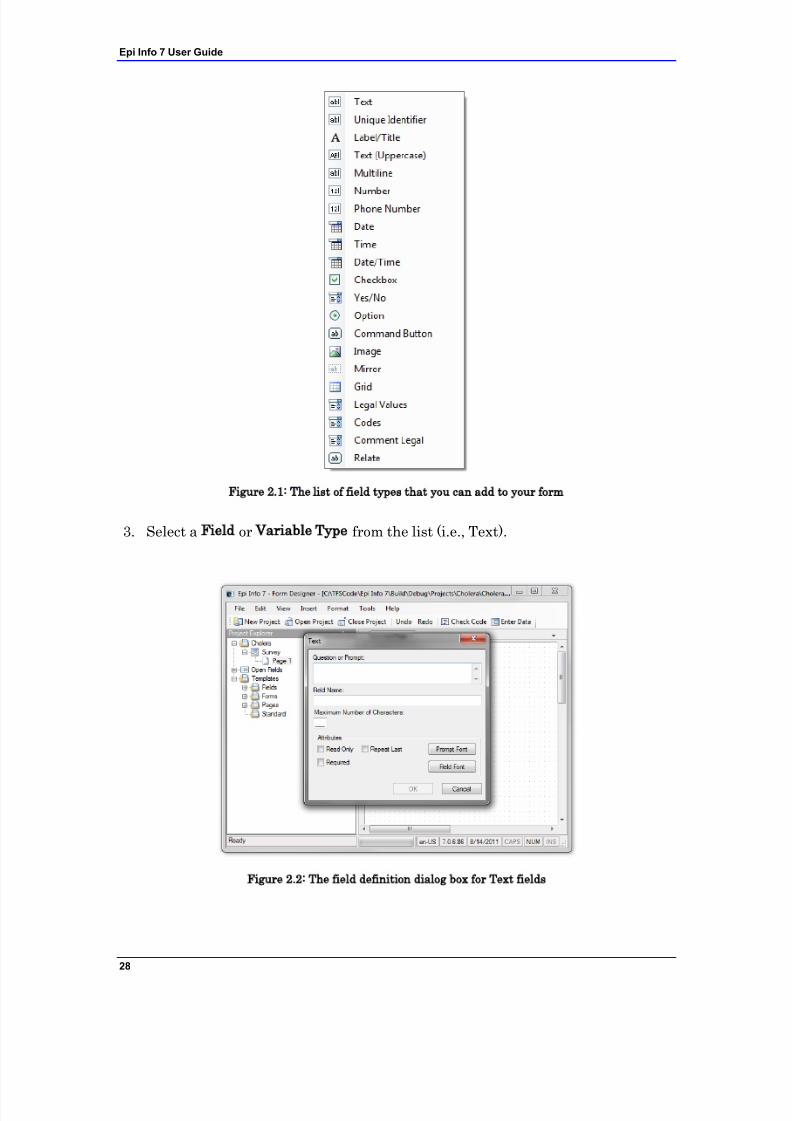
2. Move the mouse over the New Field option. A sub-menu will appear as shownin figure 2.1.
7/14/2019 Epi Info 7 User Guide-V1.0 Cleared
http://slidepdf.com/reader/full/epi-info-7-user-guide-v10-cleared-563109dd5013b 34/368
Epi Info 7 User Guide
28
Figure 2.1: The list of field types that you can add to your form
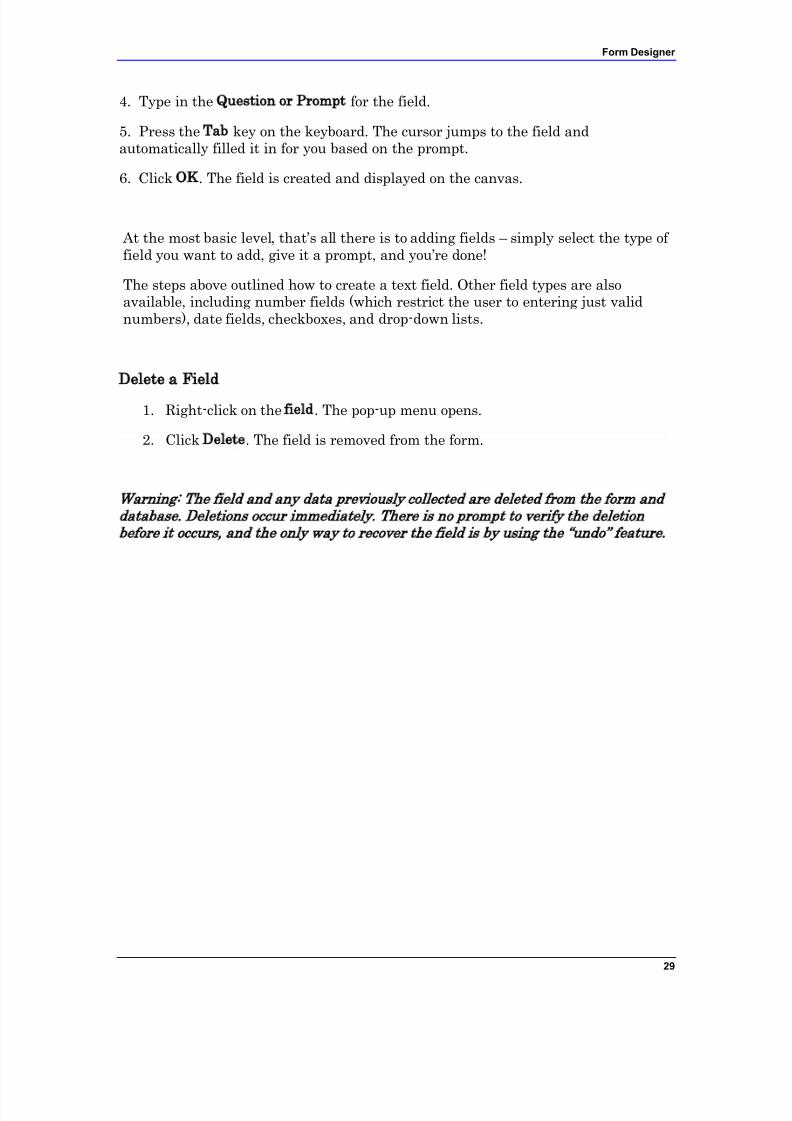
3. Select a Field or Variable Type from the list (i.e., Text).
Figure 2.2: The field definition dialog box for Text fields
7/14/2019 Epi Info 7 User Guide-V1.0 Cleared
http://slidepdf.com/reader/full/epi-info-7-user-guide-v10-cleared-563109dd5013b 35/368
Form Designer
29
4. Type in the Question or Prompt for the field.
5. Press the Tab key on the keyboard. The cursor jumps to the field andautomatically filled it in for you based on the prompt.
6. Click OK. The field is created and displayed on the canvas.
At the most basic level, that‟s all there is to adding fields – simply select the type of field you want to add, give it a prompt, and you‟re done!
The steps above outlined how to create a text field. Other field types are alsoavailable, including number fields (which restrict the user to entering just validnumbers), date fields, checkboxes, and drop-down lists.
Delete a Field
1. Right-click on the field. The pop-up menu opens.
2. Click Delete. The field is removed from the form.
Warning: The field and any data previously collected are deleted from the form and
database. Deletions occur immediately. There is no prom pt to verify the deletion
before it occurs, and the only w ay to recover the field is by using the “undo” feature.
7/14/2019 Epi Info 7 User Guide-V1.0 Cleared
http://slidepdf.com/reader/full/epi-info-7-user-guide-v10-cleared-563109dd5013b 36/368
Epi Info 7 User Guide
30
Edit a Field in a Form
To edit a field, right-click on the field. The Field Definition dialog box appearsfor that field/variable.
If a data table has not been created in Form Designer, or if no records exist init, use the Field Definition dialog box to change names, field types, andpatterns.
Once the data table contains entries, the field name cannot be changed, butthe field type can. Form Designer will attempt to transfer the data into thenew type. In some cases, however, it will discard incompatible data items.Changing the type of a text field to a numeric field will transfer numericdata, but Form Designer cannot handle certain numbers (i.e., "M0111") andwill assign a missing value. Since both contain text, a text field can safely bechanged to a multi-line field.
Delete an Existing Data Table without Deleting the Form
1. From the Form Designer navigation menu, select Tools > Delete Data Table.The Form Designer warning message appears.
2. Click Yes.
If the data table is deleted, any entered data associated with the formis deleted from the project. Before accepting the warning, be absolutelysure you do not need the data previously entered.
7/14/2019 Epi Info 7 User Guide-V1.0 Cleared
http://slidepdf.com/reader/full/epi-info-7-user-guide-v10-cleared-563109dd5013b 37/368
Form Designer
31
Set a Field or Prompt Font
Default prompt and field fonts can be overwritten using Field Font and Prompt Font buttons in the Field Definition dialog box. Prompt Font and Field Font are applied
per field. To apply fonts to future fields, set a default font for the project using theFormat menu.
1. From the Field Definition dialog box, click Prompt Font or Field Font. The Fontdialog box opens.
2. Select a font, font style, and sizes.
3. Click OK. The Field Definition dialog box appears.
4. Click OK. The font is applied to the question/prompt or field.

7/14/2019 Epi Info 7 User Guide-V1.0 Cleared
http://slidepdf.com/reader/full/epi-info-7-user-guide-v10-cleared-563109dd5013b 38/368
Epi Info 7 User Guide
32
Change Workspace Settings
Use the Format settings to customize the Form Designer workspace.
1. From the Form Designer navigation menu, select Format. The drop-down menuopens allowing you to customize your workspace.
2. Select Format>Grid Settings to open the grid settings dialog box.
Check the Snap to Grid box to force fields in the form to snap to the gridnearest the field edge.
Check the Show Grid box to see the grid as the workspace background.
Use the up and down arrows in the character widths between grid linesfield to alter the displayed widths between grid lines.
Select either the Snap prompt to grid or Snap entry field to grid radiobutton depending on whether you want prompts or fields aligned.
3. Click OK. The Form Designer page appears with new settings.
7/14/2019 Epi Info 7 User Guide-V1.0 Cleared
http://slidepdf.com/reader/full/epi-info-7-user-guide-v10-cleared-563109dd5013b 39/368
Form Designer
33
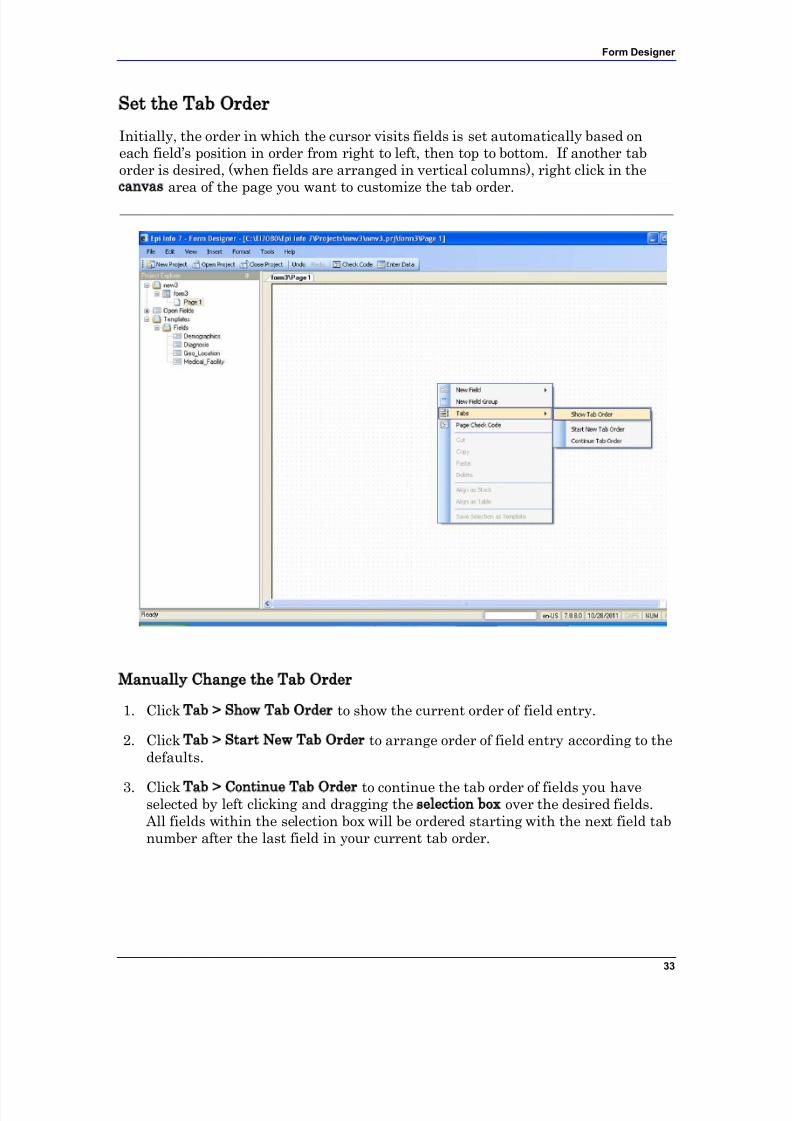
Set the Tab Order
Initially, the order in which the cursor visits fields is set automatically based oneach field‟s position in order from right to left, then top to bottom. If another taborder is desired, (when fields are arranged in vertical columns), right click in thecanvas area of the page you want to customize the tab order.
Manually Change the Tab Order
1. Click Tab > Show Tab Order to show the current order of field entry.
2. Click Tab > Start New Tab Order to arrange order of field entry according to thedefaults.
3. Click Tab > Continue Tab Order to continue the tab order of fields you haveselected by left clicking and dragging the selection box over the desired fields.
All fields within the selection box will be ordered starting with the next field tabnumber after the last field in your current tab order.
7/14/2019 Epi Info 7 User Guide-V1.0 Cleared
http://slidepdf.com/reader/full/epi-info-7-user-guide-v10-cleared-563109dd5013b 40/368
Epi Info 7 User Guide
34
Set a Default Font
If set prior to creating fields on the form, default fonts facilitate a consistent look toyour fields.
1. From the Form Designer navigation bar, select Format > Set Default PromptFont or Set Default Field Font. The Font dialog box opens.
2. Select a new font, font style, or size.
3. Click OK. A new default font is set.
The default font settings affect new prompts created using the FieldDefinition box and not update any existing field fonts in the form.
The default font is set at the Form Designer level, and not just the formlevel. The default font will appear in all forms/fields created with FormDesigner.
Default fonts can be overwritten using Font for Prompt option in the FieldDefinition dialog box.
7/14/2019 Epi Info 7 User Guide-V1.0 Cleared
http://slidepdf.com/reader/full/epi-info-7-user-guide-v10-cleared-563109dd5013b 41/368
Form Designer
35
Copy, Cut, and Paste Fields
1. Left click, hold, and drag a rectangle around the fields to be copied or cut.
2. From the Form Designer navigation menu, select Edit > Copy or Cut from thedrop-down list.
3. Click in the new section of the form or select a new page in the project.
4. Select Edit > Paste. The copied fields appear in the form.
Note: You can also use the right-click pop-up menu to copy, cut, or paste instead of using the Edit menu.
Note: If copied to the same page, the copied fields will be placed directly over the
original fields. Drag the new fields to a new position on the page. The new field willhave the same name as the original with a number '1' appended to the name. If thename already has a number appended to it, it will be incremented by one or have anadditional number appended to it.

7/14/2019 Epi Info 7 User Guide-V1.0 Cleared
http://slidepdf.com/reader/full/epi-info-7-user-guide-v10-cleared-563109dd5013b 42/368
Epi Info 7 User Guide
36
Align Fields
Fields can be aligned vertically or horizontally.
1. Click and hold the left mouse button to draw a rectangle around the fields to bealigned.
2. Select Format > Alignment > As Stack (vertical alignment) or Format > Alignment > As Table (horizontal arrangement with rows). Theselected fields align based on the selection.
7/14/2019 Epi Info 7 User Guide-V1.0 Cleared
http://slidepdf.com/reader/full/epi-info-7-user-guide-v10-cleared-563109dd5013b 43/368
Form Designer
37
Insert a Background Image or Color
Insert a Background Image on a Form
1. From the Form Designer navigation menu, select Format > Background. TheBackground dialog box opens.
2. From the Background Image section, click Choose Image. The BackgroundImage box opens.
3. Locate the image file. Click Open. The selected image appears in theBackground Image dialog box. Image formats include bitmap (.bmp), picture(.ico), and JPEG (.jpg).
4. Use the Image Layout drop down selection to customize the image on the screen(None, Tile, Center, and Stretch).
5. From the Image and Color section, use the radio buttons to Apply to all pages orApply to the current page only.
6. Click OK. The image appears in the form.
To remove the image, select Clear Image from the Background Image box.
Insert a Background Color to a Form
1. From the Form Designer navigation menu, select Format > Background. The
Background dialog box opens.2. From the Background Image section, click Change Color. The Color dialog box
opens.
3. Select a background color from the palette or select Define Custom Colors toenter a more specific color request.
4. Click OK. The selected color previews in the background box.
5. From the Image and Color section, use the radio buttons to Apply to all pages orApply to the current page only.
6. Click OK. The color appears in the form as a background.
To remove the color, select Clear Color from the Background Color box.
7/14/2019 Epi Info 7 User Guide-V1.0 Cleared
http://slidepdf.com/reader/full/epi-info-7-user-guide-v10-cleared-563109dd5013b 44/368
Epi Info 7 User Guide
38
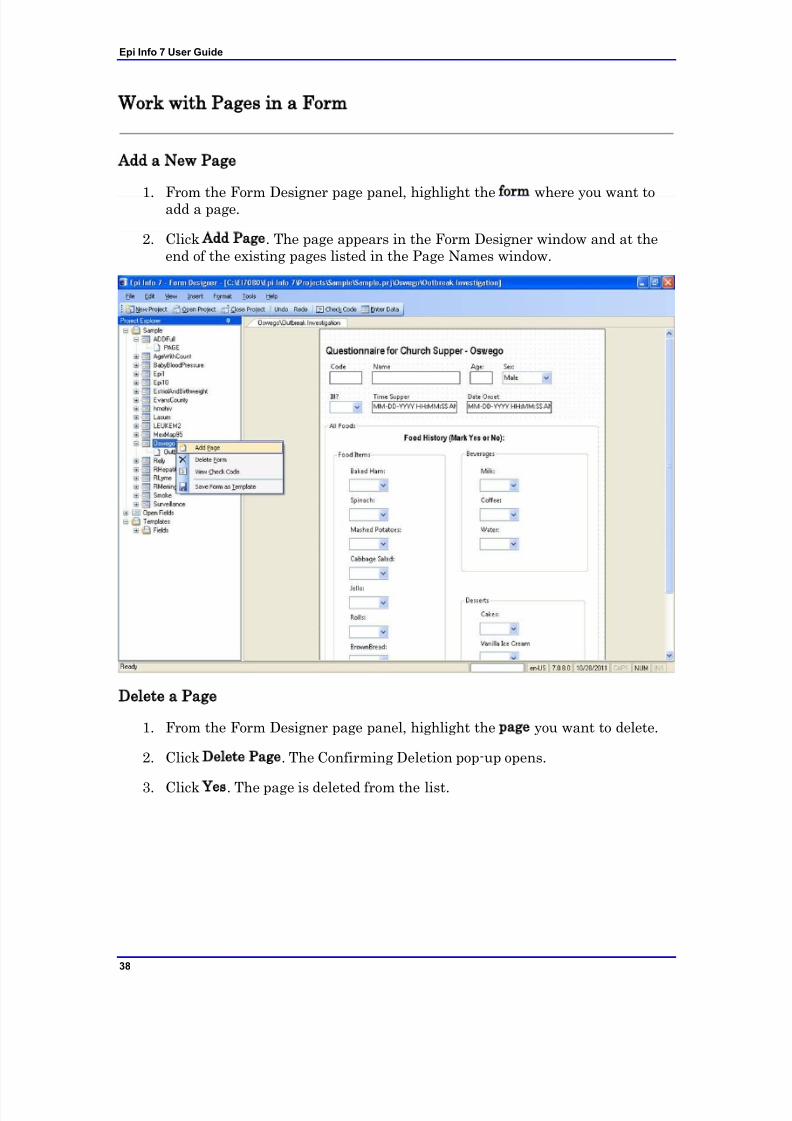
Work with Pages in a Form
Add a New Page
1. From the Form Designer page panel, highlight the form where you want toadd a page.
2. Click Add Page. The page appears in the Form Designer window and at theend of the existing pages listed in the Page Names window.
Delete a Page
1. From the Form Designer page panel, highlight the page you want to delete.
2. Click Delete Page. The Confirming Deletion pop-up opens.
3. Click Yes. The page is deleted from the list.
7/14/2019 Epi Info 7 User Guide-V1.0 Cleared
http://slidepdf.com/reader/full/epi-info-7-user-guide-v10-cleared-563109dd5013b 45/368
Form Designer
39
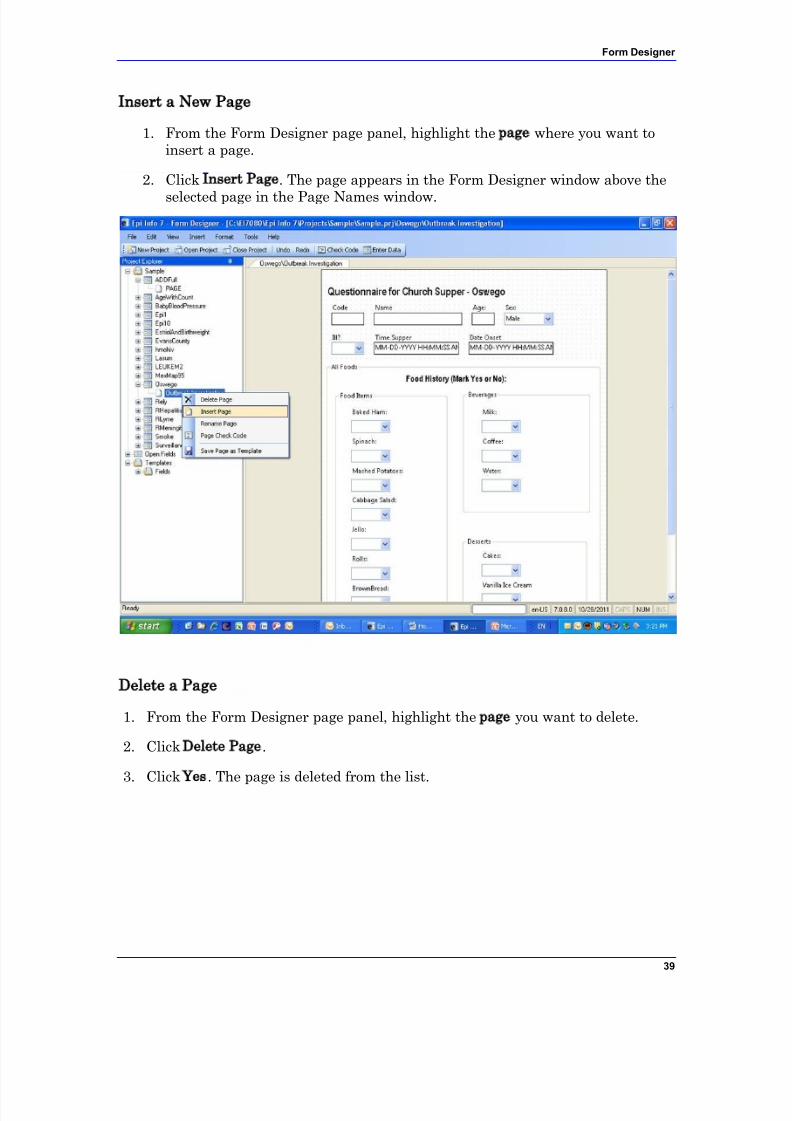
Insert a New Page
1. From the Form Designer page panel, highlight the page where you want toinsert a page.
2. Click Insert Page. The page appears in the Form Designer window above the
selected page in the Page Names window.
Delete a Page
1. From the Form Designer page panel, highlight the page you want to delete.
2. Click Delete Page.
3. Click Yes. The page is deleted from the list.
7/14/2019 Epi Info 7 User Guide-V1.0 Cleared
http://slidepdf.com/reader/full/epi-info-7-user-guide-v10-cleared-563109dd5013b 46/368
Epi Info 7 User Guide
40
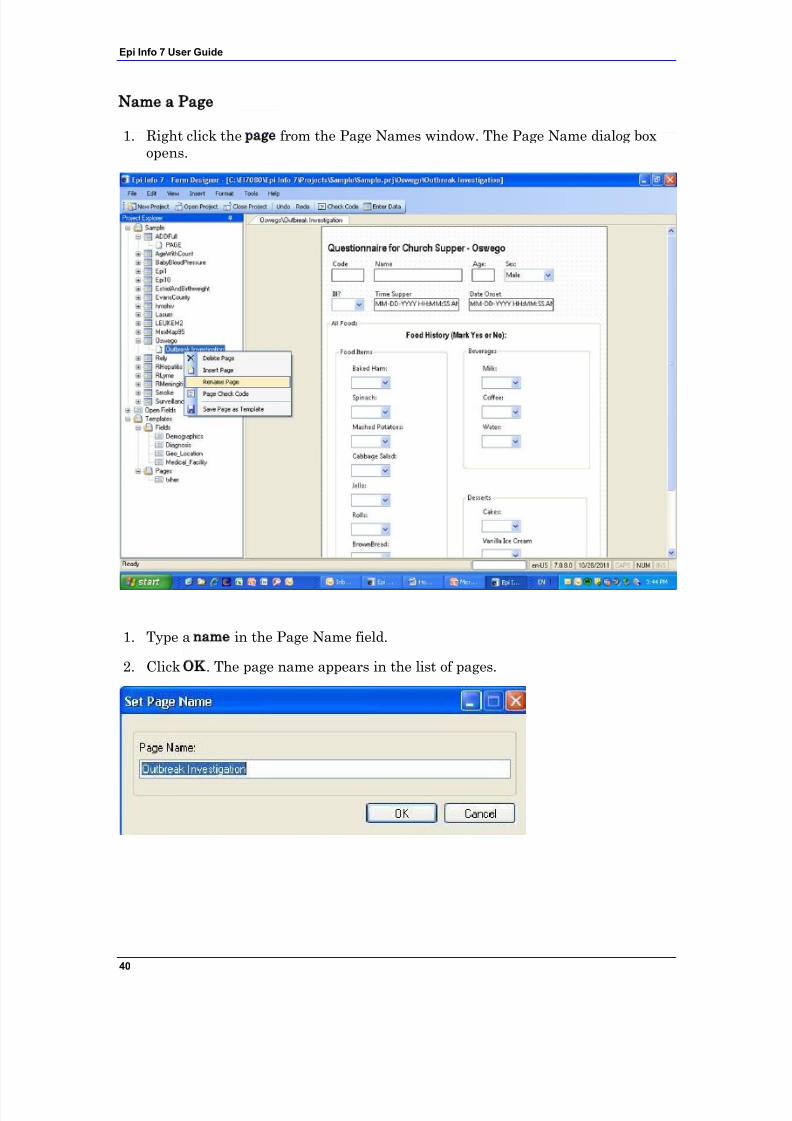
Name a Page
1. Right click the page from the Page Names window. The Page Name dialog boxopens.
1. Type a name in the Page Name field.
2. Click OK. The page name appears in the list of pages.
7/14/2019 Epi Info 7 User Guide-V1.0 Cleared
http://slidepdf.com/reader/full/epi-info-7-user-guide-v10-cleared-563109dd5013b 47/368
Form Designer
41
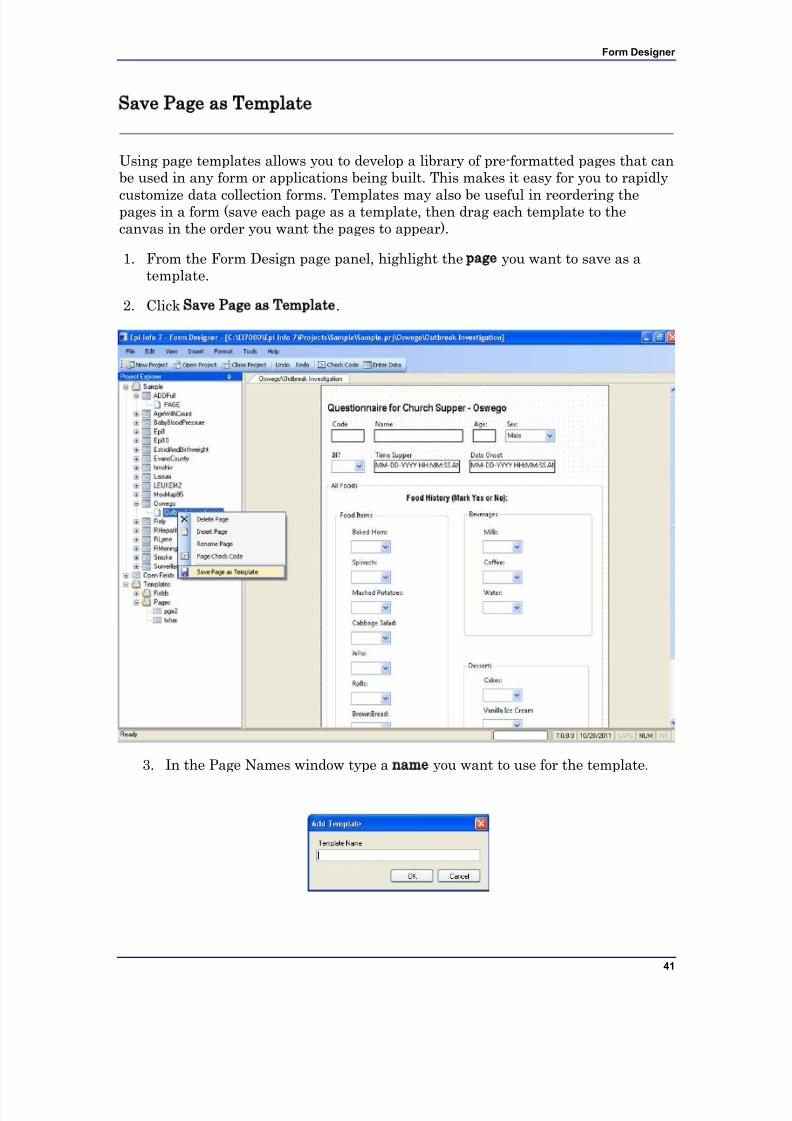
Save Page as Template
Using page templates allows you to develop a library of pre-formatted pages that canbe used in any form or applications being built. This makes it easy for you to rapidly
customize data collection forms. Templates may also be useful in reordering thepages in a form (save each page as a template, then drag each template to thecanvas in the order you want the pages to appear).
1. From the Form Design page panel, highlight the page you want to save as atemplate.
2. Click Save Page as Template.
3. In the Page Names window type a name you want to use for the template.
7/14/2019 Epi Info 7 User Guide-V1.0 Cleared
http://slidepdf.com/reader/full/epi-info-7-user-guide-v10-cleared-563109dd5013b 48/368
Epi Info 7 User Guide
42
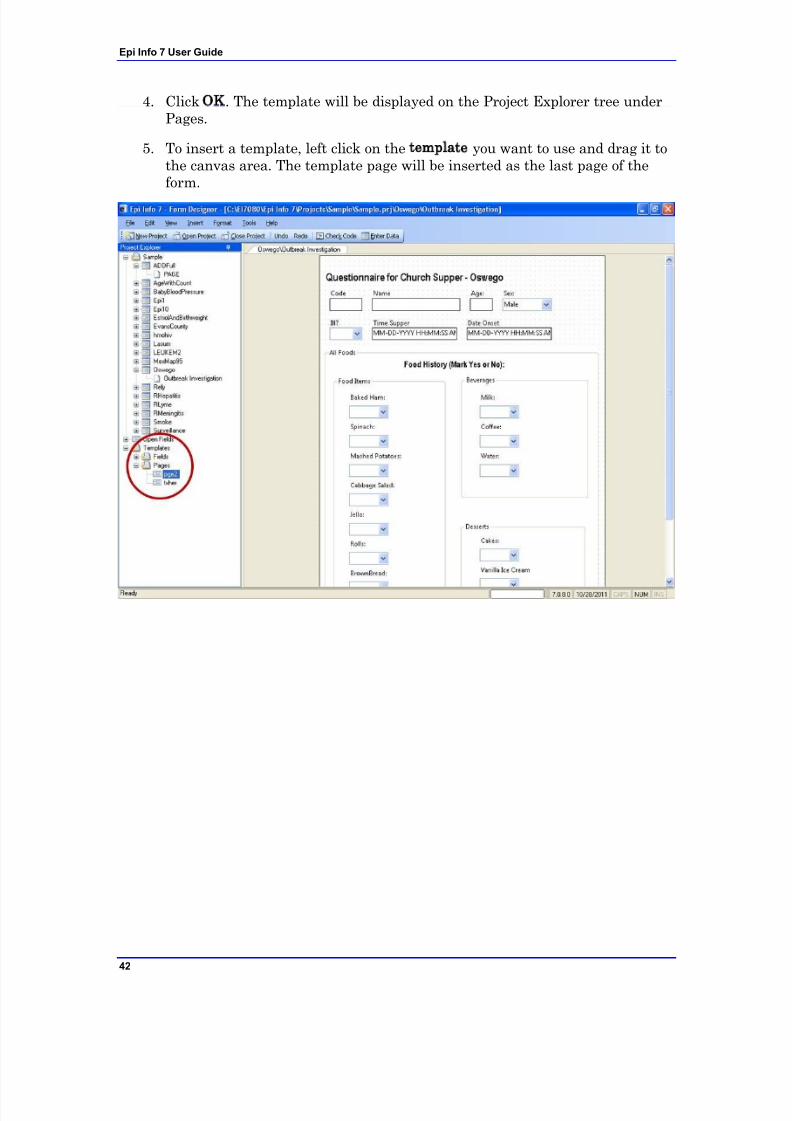
4. Click OK. The template will be displayed on the Project Explorer tree underPages.
5. To insert a template, left click on the template you want to use and drag it tothe canvas area. The template page will be inserted as the last page of theform.
7/14/2019 Epi Info 7 User Guide-V1.0 Cleared
http://slidepdf.com/reader/full/epi-info-7-user-guide-v10-cleared-563109dd5013b 49/368
Form Designer
43
View a Data Dictionary
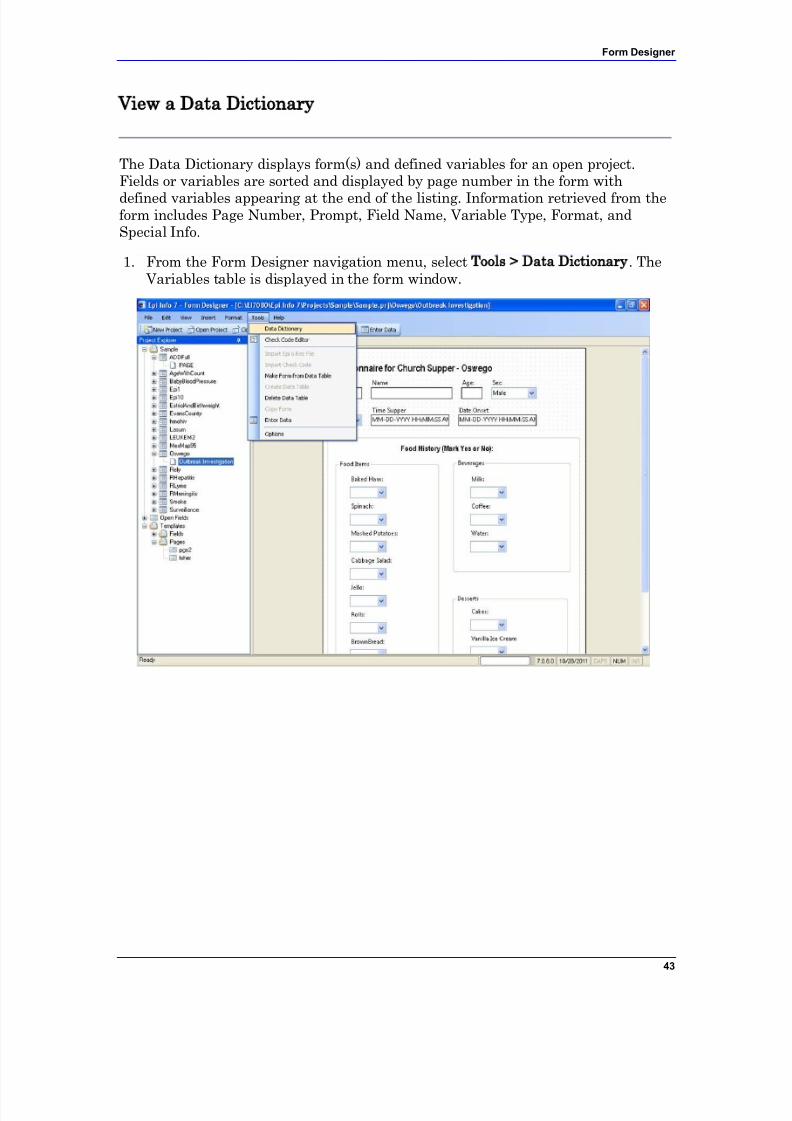
The Data Dictionary displays form(s) and defined variables for an open project.Fields or variables are sorted and displayed by page number in the form with
defined variables appearing at the end of the listing. Information retrieved from theform includes Page Number, Prompt, Field Name, Variable Type, Format, andSpecial Info.
1. From the Form Designer navigation menu, select Tools > Data Dictionary. The Variables table is displayed in the form window.
7/14/2019 Epi Info 7 User Guide-V1.0 Cleared
http://slidepdf.com/reader/full/epi-info-7-user-guide-v10-cleared-563109dd5013b 50/368
Epi Info 7 User Guide
44
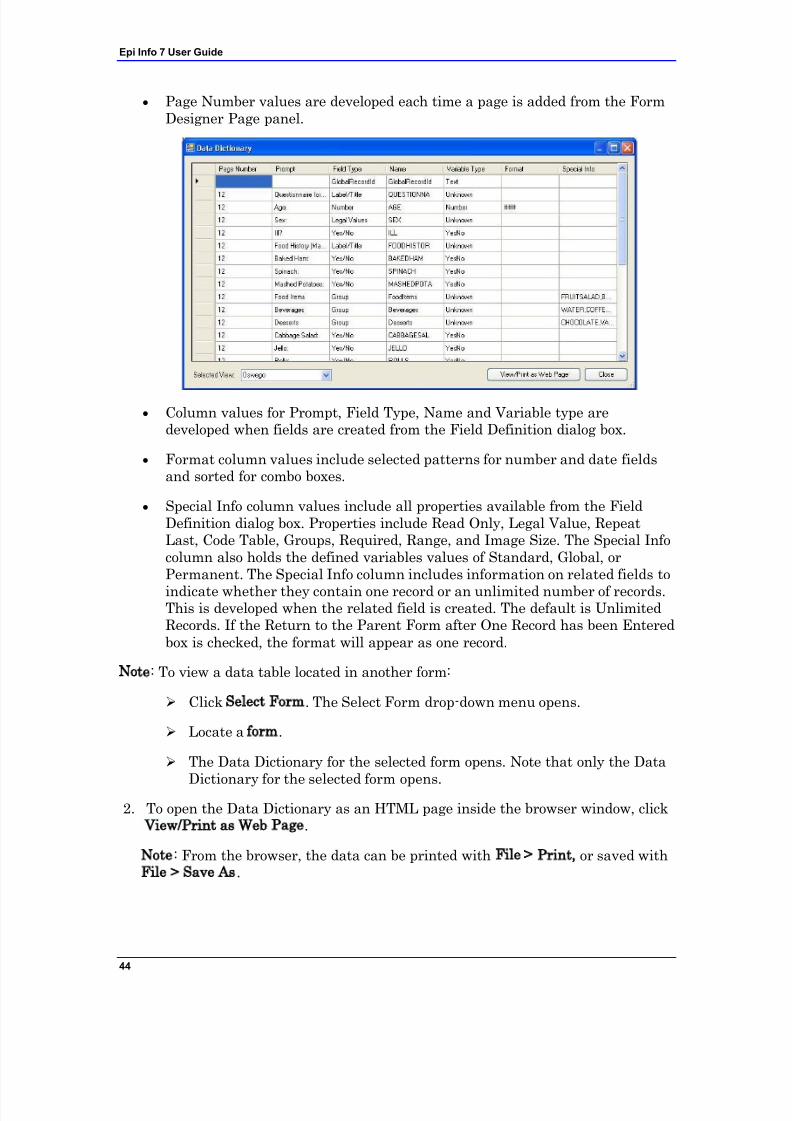
Page Number values are developed each time a page is added from the FormDesigner Page panel.
Column values for Prompt, Field Type, Name and Variable type aredeveloped when fields are created from the Field Definition dialog box.
Format column values include selected patterns for number and date fieldsand sorted for combo boxes.
Special Info column values include all properties available from the FieldDefinition dialog box. Properties include Read Only, Legal Value, RepeatLast, Code Table, Groups, Required, Range, and Image Size. The Special Infocolumn also holds the defined variables values of Standard, Global, orPermanent. The Special Info column includes information on related fields to
indicate whether they contain one record or an unlimited number of records.This is developed when the related field is created. The default is UnlimitedRecords. If the Return to the Parent Form after One Record has been Enteredbox is checked, the format will appear as one record.
Note: To view a data table located in another form:
Click Select Form. The Select Form drop-down menu opens.
Locate a form.
The Data Dictionary for the selected form opens. Note that only the Data
Dictionary for the selected form opens.2. To open the Data Dictionary as an HTML page inside the browser window, click
View/Print as Web Page.
Note: From the browser, the data can be printed with File > Print, or saved withFile > Save As.
7/14/2019 Epi Info 7 User Guide-V1.0 Cleared
http://slidepdf.com/reader/full/epi-info-7-user-guide-v10-cleared-563109dd5013b 51/368
Form Designer
45
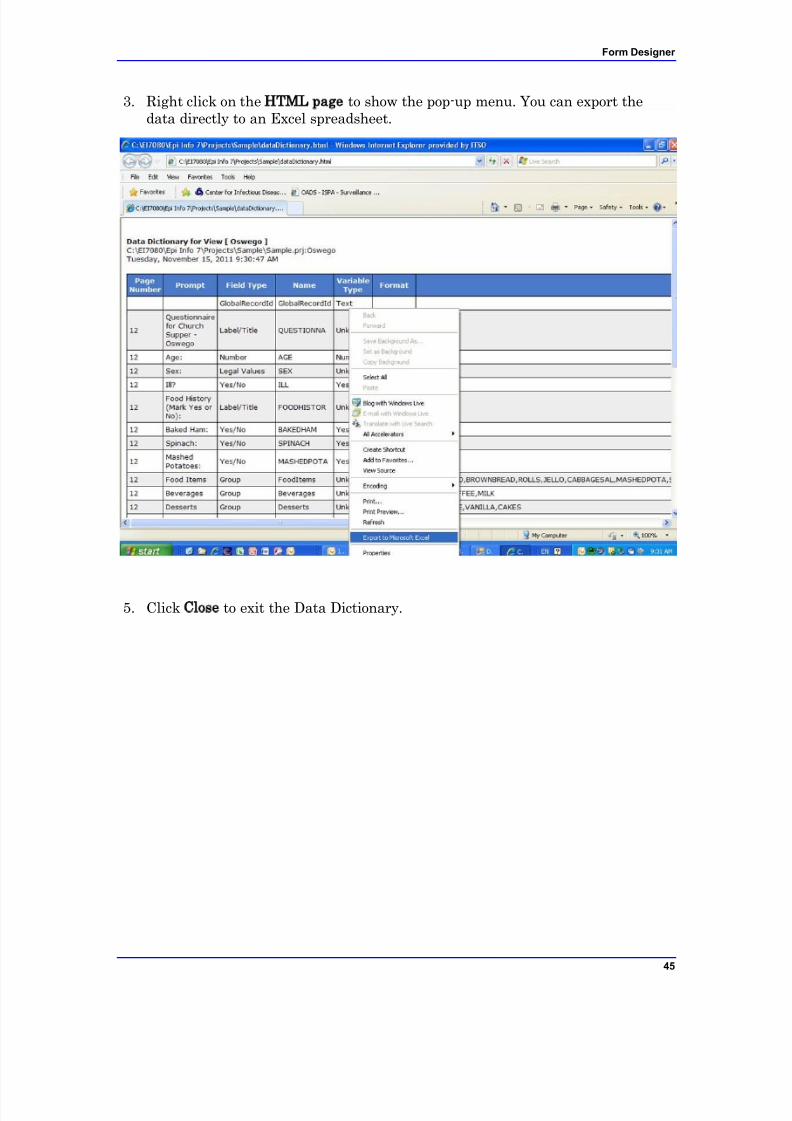
3. Right click on the HTML page to show the pop-up menu. You can export thedata directly to an Excel spreadsheet.
5. Click Close to exit the Data Dictionary.
7/14/2019 Epi Info 7 User Guide-V1.0 Cleared
http://slidepdf.com/reader/full/epi-info-7-user-guide-v10-cleared-563109dd5013b 52/368
Epi Info 7 User Guide
46
Create a Group
In the Classic Analysis or Visual Dashboard module, statistics can be run on a groupof variables as a whole or on the individual variables inside the group.
1. Left click, hold, and drag a rectangle around the fields slated to be grouped. A line rectangle appears around the selected fields.
2. From the Form Designer navigation menu, select Insert > Group. The GroupProperties dialog box appears.
3. Type a group name in the Question or Prompt box.
4. Click Font to change the font type and size.
5. Click OK to accept the group options. The fields appear in the group box.
Move the group by clicking and holding the group name with the mouse. Resize the group box by double-clicking inside the group to change the
cursor to the resize arrows. If the new size includes additional fields, theybecome members of the group.
Edit a Group
The following steps delete the group, ungroup variables, or change the group name:
1. Right click on the group name. Select Properties. The Edit Group window
opens.
2. Change the Group Name by typing a new name in the Group Name field.
3. Click OK. The group appears with the selected edits.
4. To delete a group box, right click anywhere on the box to open the pop-up box.Click Delete to delete the group box.
Note: This will not delete your fields.
7/14/2019 Epi Info 7 User Guide-V1.0 Cleared
http://slidepdf.com/reader/full/epi-info-7-user-guide-v10-cleared-563109dd5013b 53/368
Form Designer
47
Create a Mirror Field
A mirror field is used to mirror or echo data from another field onto one or morepages of a project. They can be used across pages, but cannot be included in Related
Forms.
To create a mirror field:
1. Open a project that contains at least two pages.
2. From the page that requires a mirror field, right-click on the canvas. The pop-upmenu will appear.
3. Move the mouse over the New Field option. A sub-menu will appear. SelectMirror as the variable type.
4. The Assign Variable to Mirror Field dialog box opens.
5. Enter a value in the Question or Prompt box. (This will populate the Field Namewhen you tab or click out of the Question or Prompt box).
6. Click the drop-down box for the Assigned Variable in the Attributes Group toshow a list of variables that can be mirrored.
7. Select the variable to be mirrored. (Field and Prompt font may also be edited inthis group).
8. Click OK. The new variable appears on the current page.
Mirror fields are Read Only.
When data are entered into the original field, the value of that field willbe reflected in the newly-created mirror field.
Mirror fields can be copied and pasted to subsequent pages.
Command buttons cannot be selected as source fields to mirror.
7/14/2019 Epi Info 7 User Guide-V1.0 Cleared
http://slidepdf.com/reader/full/epi-info-7-user-guide-v10-cleared-563109dd5013b 54/368
Epi Info 7 User Guide
48
Create an Option Box
Option boxes should be used when the choices presented to you are mutuallyexclusive. If you make more than one choice, use checkboxes.
To create an option box field:
1. Open the page where you want the Option Box field to be placed.
2. From the page that requires an Option Box field, right-click on the canvas.The pop-up menu will appear.
3. Move the cursor over the New Field option. A sub-menu will appear.
4. Select Option as the field type. The Option dialog box appears.
5. In the Number of Choices field, enter a number (the option definition fields
will increase with an increase in the number of choices).
6. Select Right or Left for the placement of the Option box (radio button).
7. Type the option information in each field.
8. Click OK. The Option box appears in the form.
7/14/2019 Epi Info 7 User Guide-V1.0 Cleared
http://slidepdf.com/reader/full/epi-info-7-user-guide-v10-cleared-563109dd5013b 55/368
Form Designer
49
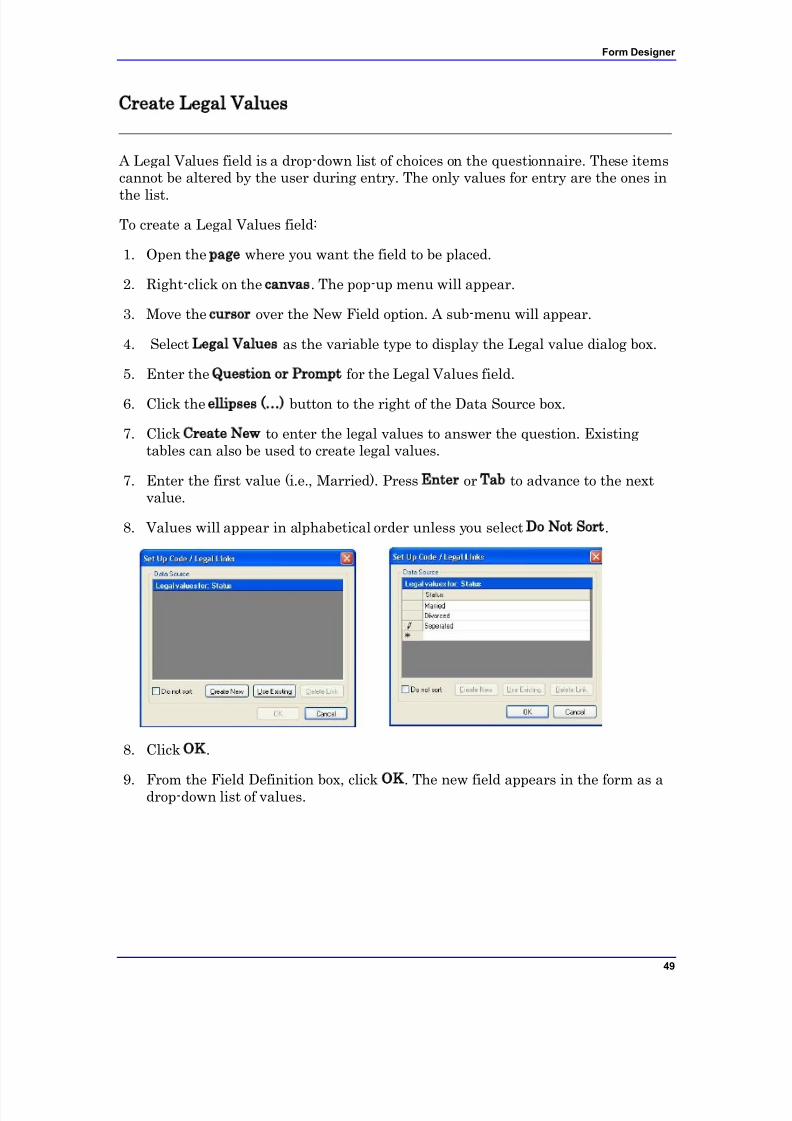
Create Legal Values
A Legal Values field is a drop-down list of choices on the questionnaire. These itemscannot be altered by the user during entry. The only values for entry are the ones in
the list.
To create a Legal Values field:
1. Open the page where you want the field to be placed.
2. Right-click on the canvas. The pop-up menu will appear.
3. Move the cursor over the New Field option. A sub-menu will appear.
4. Select Legal Values as the variable type to display the Legal value dialog box.
5. Enter the Question or Prompt for the Legal Values field.
6. Click the ellipses (…) button to the right of the Data Source box.
7. Click Create New to enter the legal values to answer the question. Existingtables can also be used to create legal values.
7. Enter the first value (i.e., Married). Press Enter or Tab to advance to the nextvalue.
8. Values will appear in alphabetical order unless you select Do Not Sort.
8. Click OK.
9. From the Field Definition box, click OK. The new field appears in the form as adrop-down list of values.
7/14/2019 Epi Info 7 User Guide-V1.0 Cleared
http://slidepdf.com/reader/full/epi-info-7-user-guide-v10-cleared-563109dd5013b 56/368
Epi Info 7 User Guide
50
Create a Comment Legal
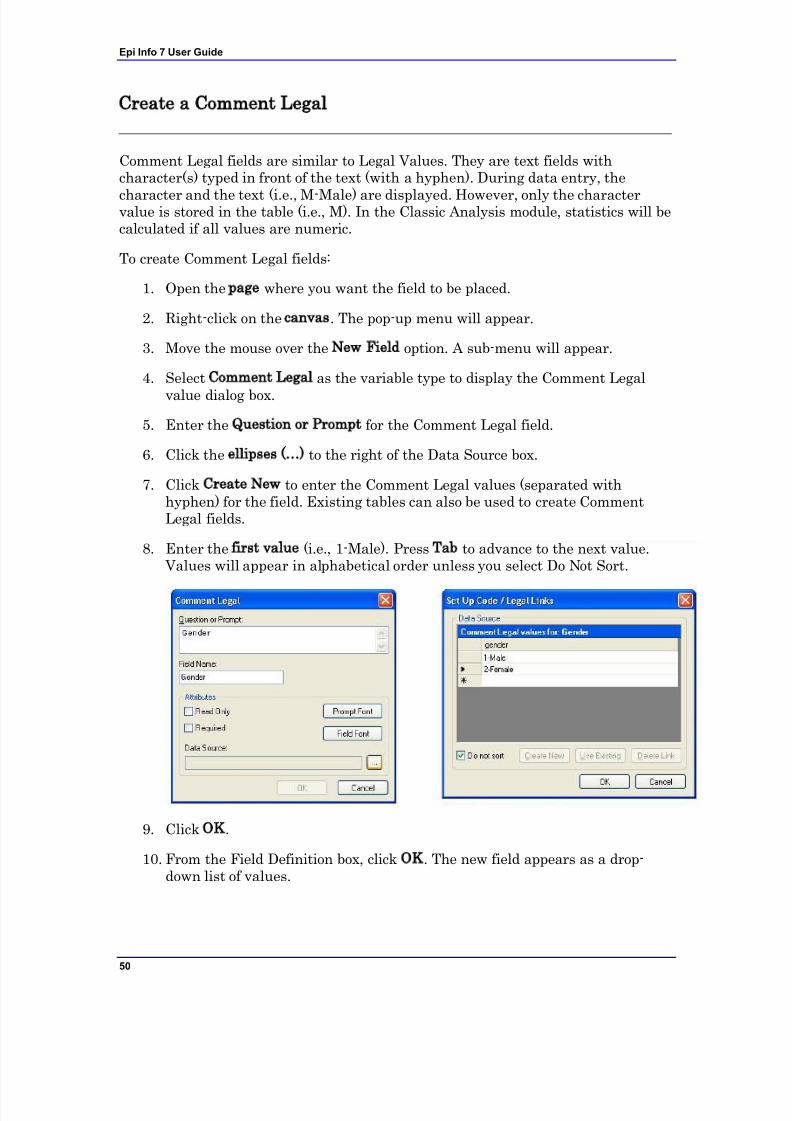
Comment Legal fields are similar to Legal Values. They are text fields withcharacter(s) typed in front of the text (with a hyphen). During data entry, the
character and the text (i.e., M-Male) are displayed. However, only the charactervalue is stored in the table (i.e., M). In the Classic Analysis module, statistics will becalculated if all values are numeric.
To create Comment Legal fields:
1. Open the page where you want the field to be placed.
2. Right-click on the canvas. The pop-up menu will appear.
3. Move the mouse over the New Field option. A sub-menu will appear.
4. Select Comment Legal as the variable type to display the Comment Legal
value dialog box.
5. Enter the Question or Prompt for the Comment Legal field.
6. Click the ellipses (…) to the right of the Data Source box.
7. Click Create New to enter the Comment Legal values (separated withhyphen) for the field. Existing tables can also be used to create CommentLegal fields.
8. Enter the first value (i.e., 1-Male). Press Tab to advance to the next value. Values will appear in alphabetical order unless you select Do Not Sort.
9. Click OK.
10. From the Field Definition box, click OK. The new field appears as a drop-down list of values.
7/14/2019 Epi Info 7 User Guide-V1.0 Cleared
http://slidepdf.com/reader/full/epi-info-7-user-guide-v10-cleared-563109dd5013b 57/368
Form Designer
51
Codes
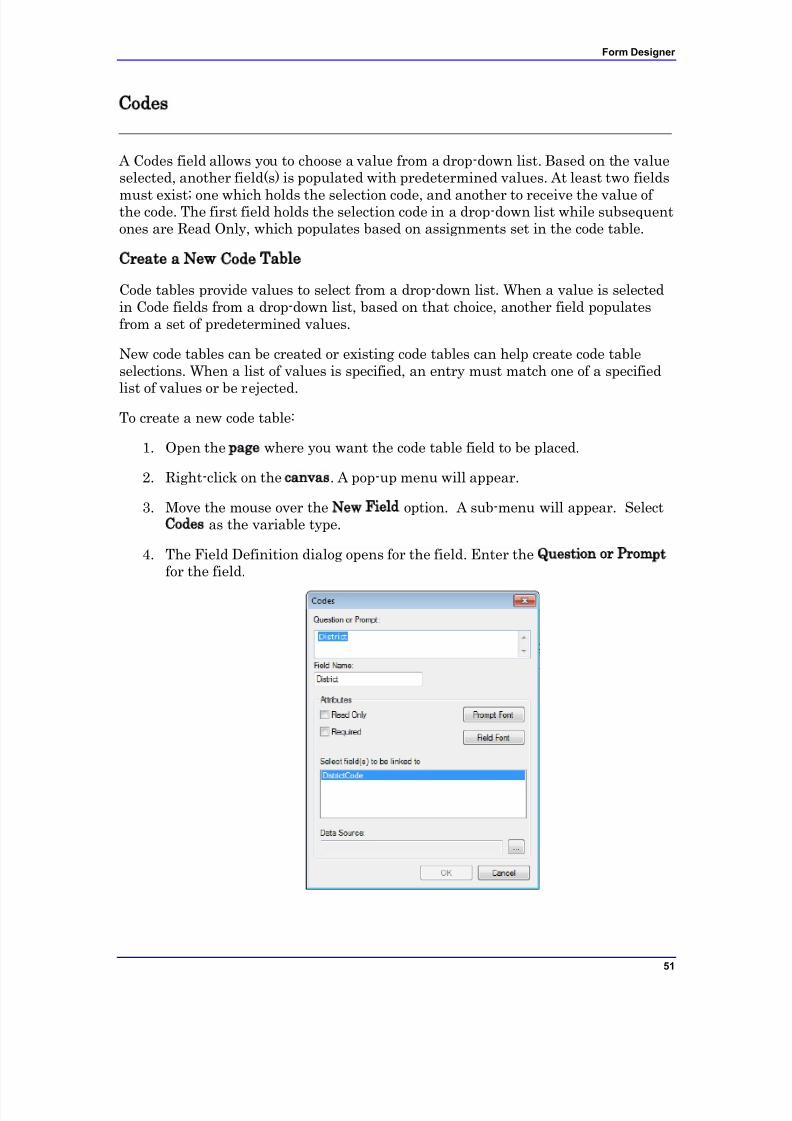
A Codes field allows you to choose a value from a drop-down list. Based on the valueselected, another field(s) is populated with predetermined values. At least two fields
must exist; one which holds the selection code, and another to receive the value of the code. The first field holds the selection code in a drop-down list while subsequentones are Read Only, which populates based on assignments set in the code table.
Create a New Code Table
Code tables provide values to select from a drop-down list. When a value is selectedin Code fields from a drop-down list, based on that choice, another field populatesfrom a set of predetermined values.
New code tables can be created or existing code tables can help create code tableselections. When a list of values is specified, an entry must match one of a specified
list of values or be rejected.To create a new code table:
1. Open the page where you want the code table field to be placed.
2. Right-click on the canvas. A pop-up menu will appear.
3. Move the mouse over the New Field option. A sub-menu will appear. SelectCodes as the variable type.
4. The Field Definition dialog opens for the field. Enter the Question or Prompt for the field.
7/14/2019 Epi Info 7 User Guide-V1.0 Cleared
http://slidepdf.com/reader/full/epi-info-7-user-guide-v10-cleared-563109dd5013b 58/368
Epi Info 7 User Guide
52
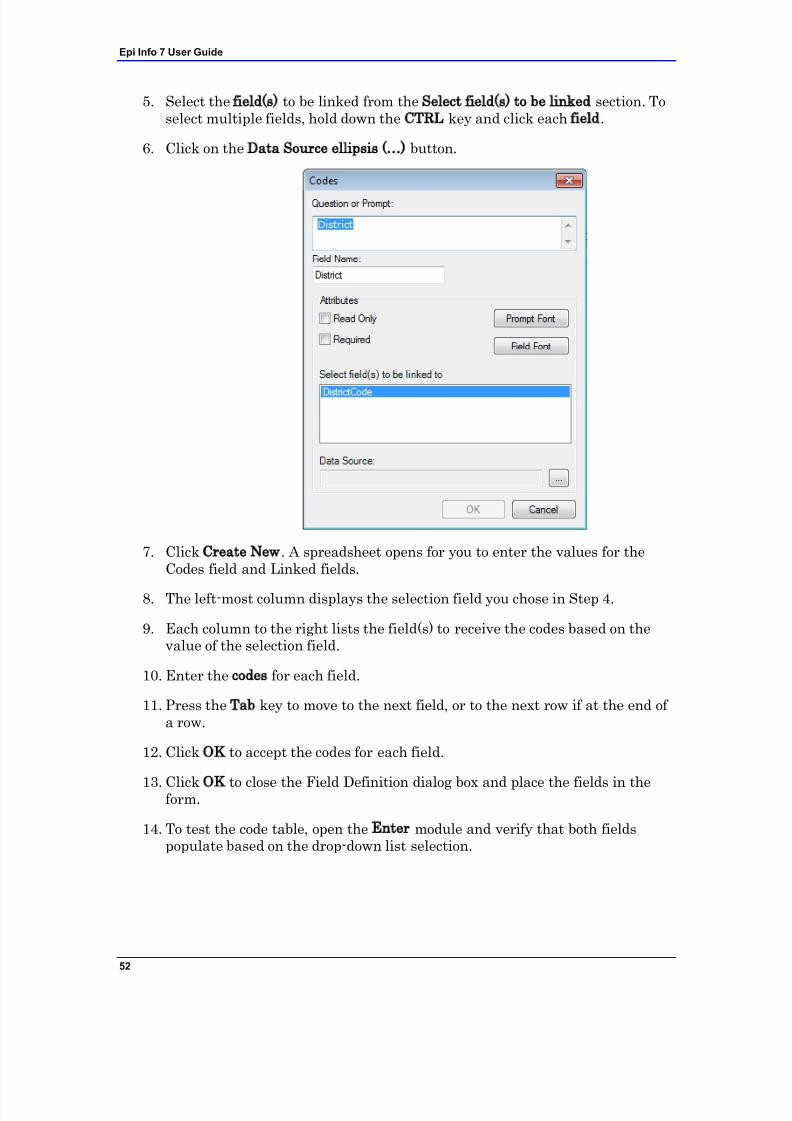
5. Select the field(s) to be linked from the Select field(s) to be linked section. Toselect multiple fields, hold down the CTRL key and click each field.
6. Click on the Data Source ellipsis (…) button.
7. Click Create New. A spreadsheet opens for you to enter the values for theCodes field and Linked fields.
8. The left-most column displays the selection field you chose in Step 4.
9. Each column to the right lists the field(s) to receive the codes based on thevalue of the selection field.
10. Enter the codes for each field.
11. Press the Tab key to move to the next field, or to the next row if at the end of a row.
12. Click OK to accept the codes for each field.
13. Click OK to close the Field Definition dialog box and place the fields in theform.
14. To test the code table, open the Enter module and verify that both fieldspopulate based on the drop-down list selection.
7/14/2019 Epi Info 7 User Guide-V1.0 Cleared
http://slidepdf.com/reader/full/epi-info-7-user-guide-v10-cleared-563109dd5013b 59/368
Form Designer
53
Create Codes with Existing Table
A code table can be used for more than one field in a form (i.e., values of “agree” and“disagree.”) If you click on the Data Source ellipsis button after creating a new
Codes field, an option to Use Existing is displayed. Follow the steps below to set upan existing code table for a different Codes field.
To create a Codes field using an existing code table:
1. Open the page where you want to place the code table field.
2. Right-click on the canvas. The pop-up menu will appear.
3. Move the mouse over the New Field option. A sub-menu will appear. SelectCodes as the variable type.
4. The Field Definition dialog opens for the field. Enter the Question or Prompt
for the field.
5. Select the field(s) to be linked from the Select field(s) to be linked to abovefield list box.
6. To select multiple fields, hold down the CTRL key and click each field.
7. Click on the Data Source ellipsis button.
8. Click Use Existing. The Tables dialog box opens.
9. Select a table from the list. Click OK.
10. Follow the instructions to make the associations in the Match Fields section.
7/14/2019 Epi Info 7 User Guide-V1.0 Cleared
http://slidepdf.com/reader/full/epi-info-7-user-guide-v10-cleared-563109dd5013b 60/368
Epi Info 7 User Guide
54
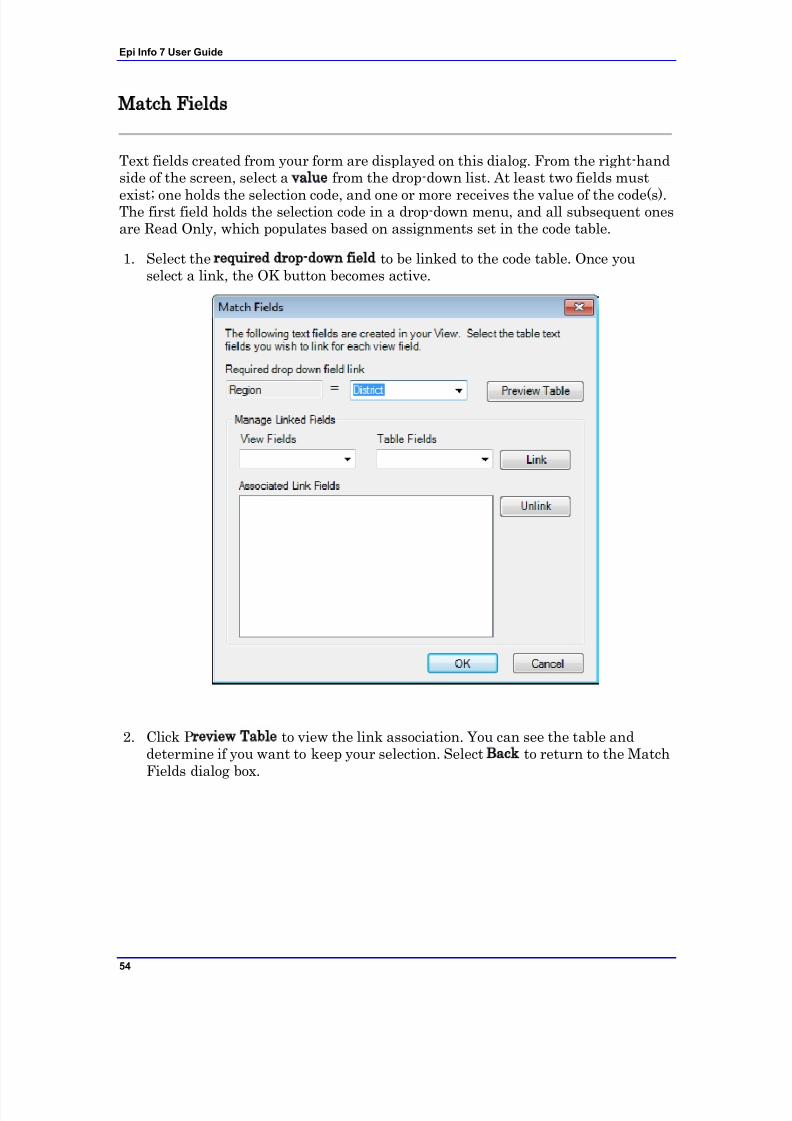
Match Fields
Text fields created from your form are displayed on this dialog. From the right-handside of the screen, select a value from the drop-down list. At least two fields must
exist; one holds the selection code, and one or more receives the value of the code(s).The first field holds the selection code in a drop-down menu, and all subsequent onesare Read Only, which populates based on assignments set in the code table.
1. Select the required drop-down field to be linked to the code table. Once youselect a link, the OK button becomes active.
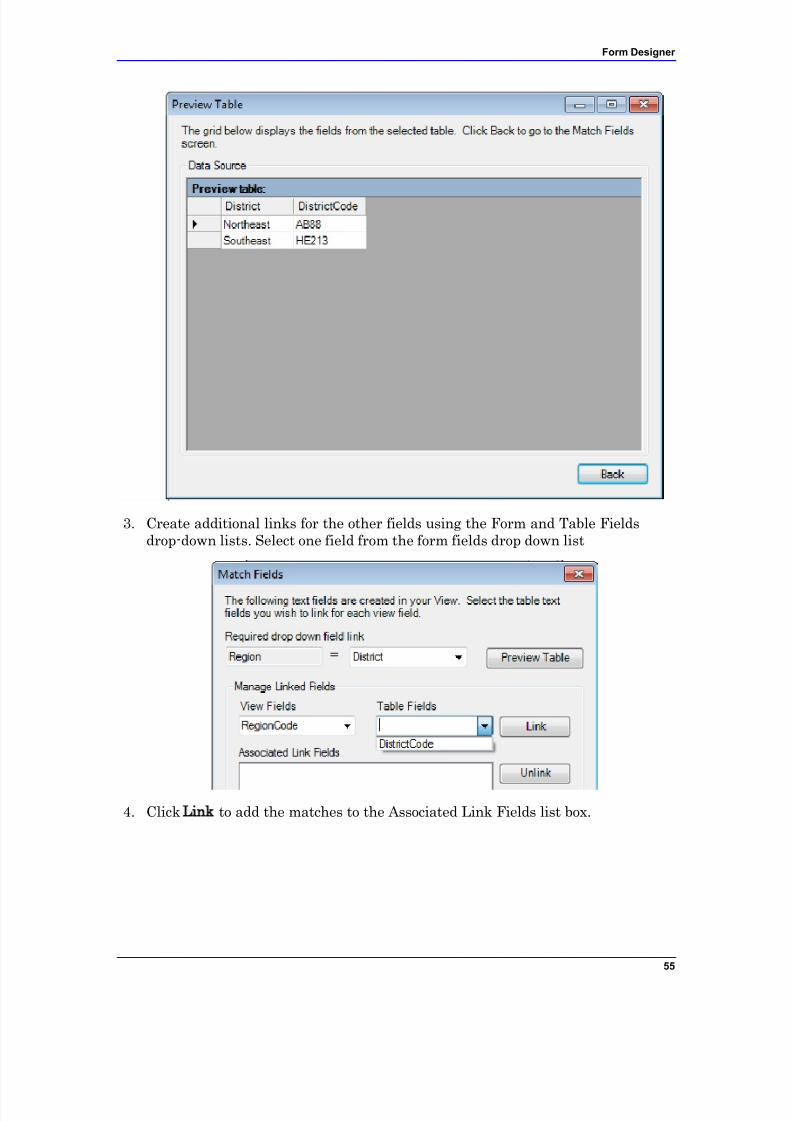
2. Click Preview Table to view the link association. You can see the table anddetermine if you want to keep your selection. Select Back to return to the MatchFields dialog box.
7/14/2019 Epi Info 7 User Guide-V1.0 Cleared
http://slidepdf.com/reader/full/epi-info-7-user-guide-v10-cleared-563109dd5013b 61/368
Form Designer
55
3. Create additional links for the other fields using the Form and Table Fieldsdrop-down lists. Select one field from the form fields drop down list
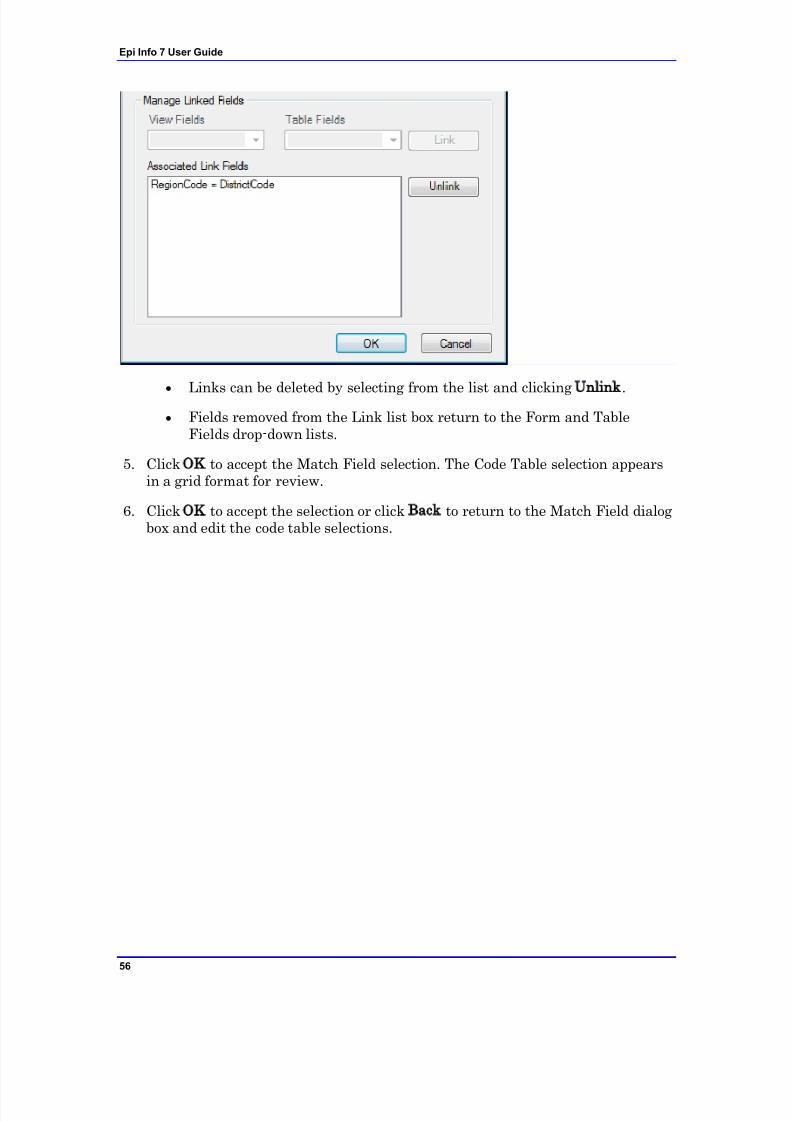
4. Click Link to add the matches to the Associated Link Fields list box.
7/14/2019 Epi Info 7 User Guide-V1.0 Cleared
http://slidepdf.com/reader/full/epi-info-7-user-guide-v10-cleared-563109dd5013b 62/368
Epi Info 7 User Guide
56
Links can be deleted by selecting from the list and clicking Unlink. Fields removed from the Link list box return to the Form and Table
Fields drop-down lists.
5. Click OK to accept the Match Field selection. The Code Table selection appearsin a grid format for review.
6. Click OK to accept the selection or click Back to return to the Match Field dialogbox and edit the code table selections.
7/14/2019 Epi Info 7 User Guide-V1.0 Cleared
http://slidepdf.com/reader/full/epi-info-7-user-guide-v10-cleared-563109dd5013b 63/368
Form Designer
57
Insert a Line as an Image
1. Open a field definition dialog box for a Label/Title field on the page you want toinsert the line.
2. In the Question or Prompt field, hold the SHIFT key and type an underscore tocreate a line.
3. Click Font for Prompt. The Font dialog box opens.
4. Select a font size and bold.
5. Click OK.
6. Create a Field Name for the variable.
7. Click OK. The line appears in the form.
8. The line can be resized, moved, copied and pasted as needed.
7/14/2019 Epi Info 7 User Guide-V1.0 Cleared
http://slidepdf.com/reader/full/epi-info-7-user-guide-v10-cleared-563109dd5013b 64/368
Epi Info 7 User Guide
58
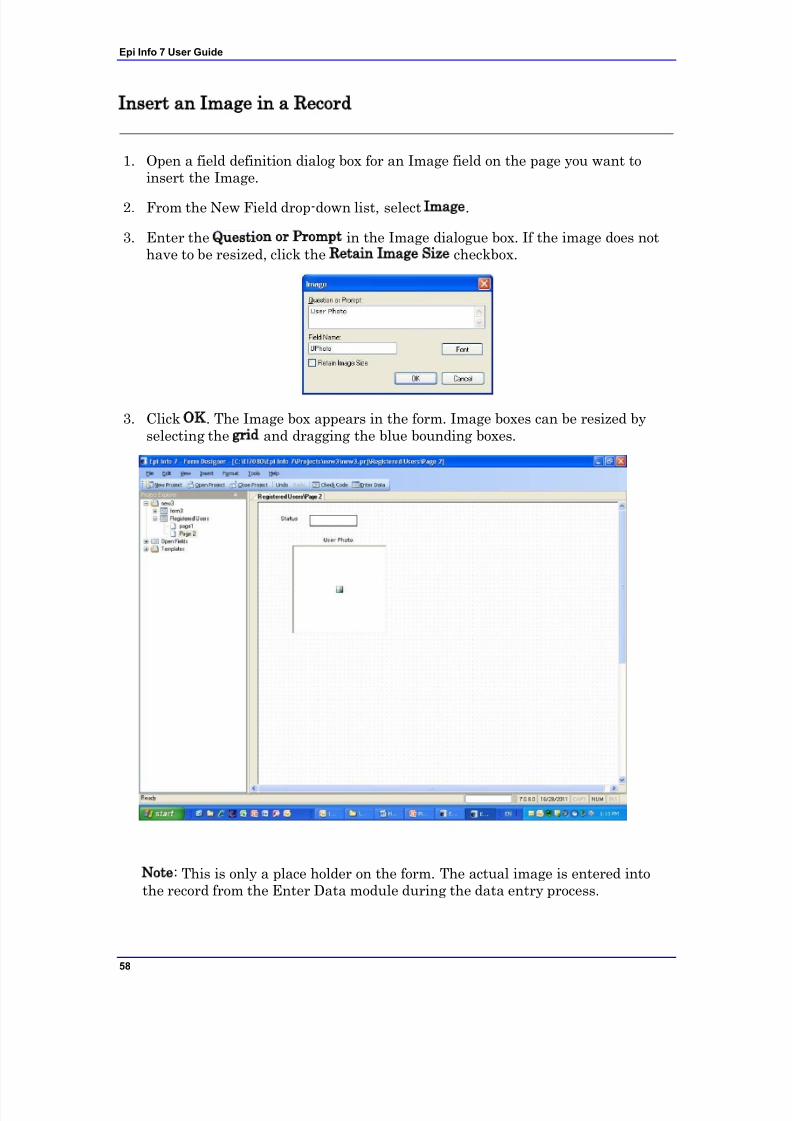
Insert an Image in a Record
1. Open a field definition dialog box for an Image field on the page you want toinsert the Image.
2. From the New Field drop-down list, select Image.
3. Enter the Question or Prompt in the Image dialogue box. If the image does nothave to be resized, click the Retain Image Size checkbox.
3. Click OK. The Image box appears in the form. Image boxes can be resized byselecting the grid and dragging the blue bounding boxes.
Note: This is only a place holder on the form. The actual image is entered intothe record from the Enter Data module during the data entry process.
7/14/2019 Epi Info 7 User Guide-V1.0 Cleared
http://slidepdf.com/reader/full/epi-info-7-user-guide-v10-cleared-563109dd5013b 65/368
Form Designer
59
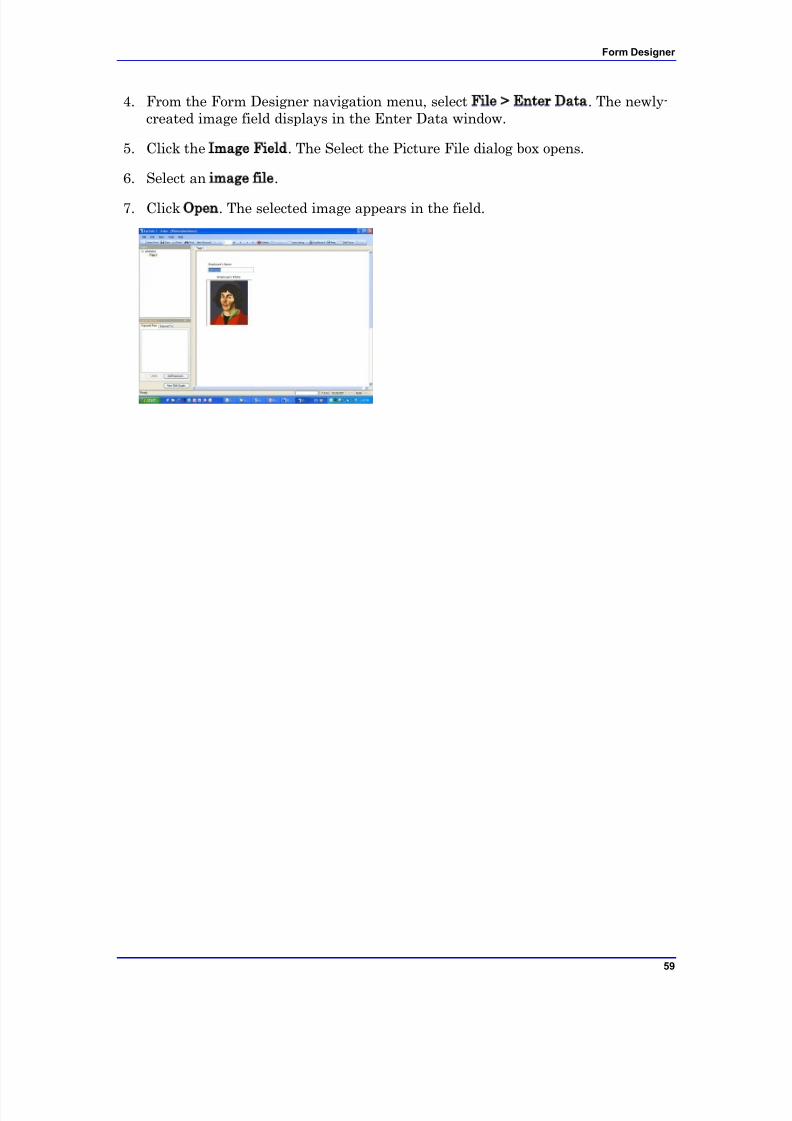
4. From the Form Designer navigation menu, select File > Enter Data. The newly-created image field displays in the Enter Data window.
5. Click the Image Field. The Select the Picture File dialog box opens.
6. Select an image file.
7. Click Open. The selected image appears in the field.
7/14/2019 Epi Info 7 User Guide-V1.0 Cleared
http://slidepdf.com/reader/full/epi-info-7-user-guide-v10-cleared-563109dd5013b 66/368
Epi Info 7 User Guide
60
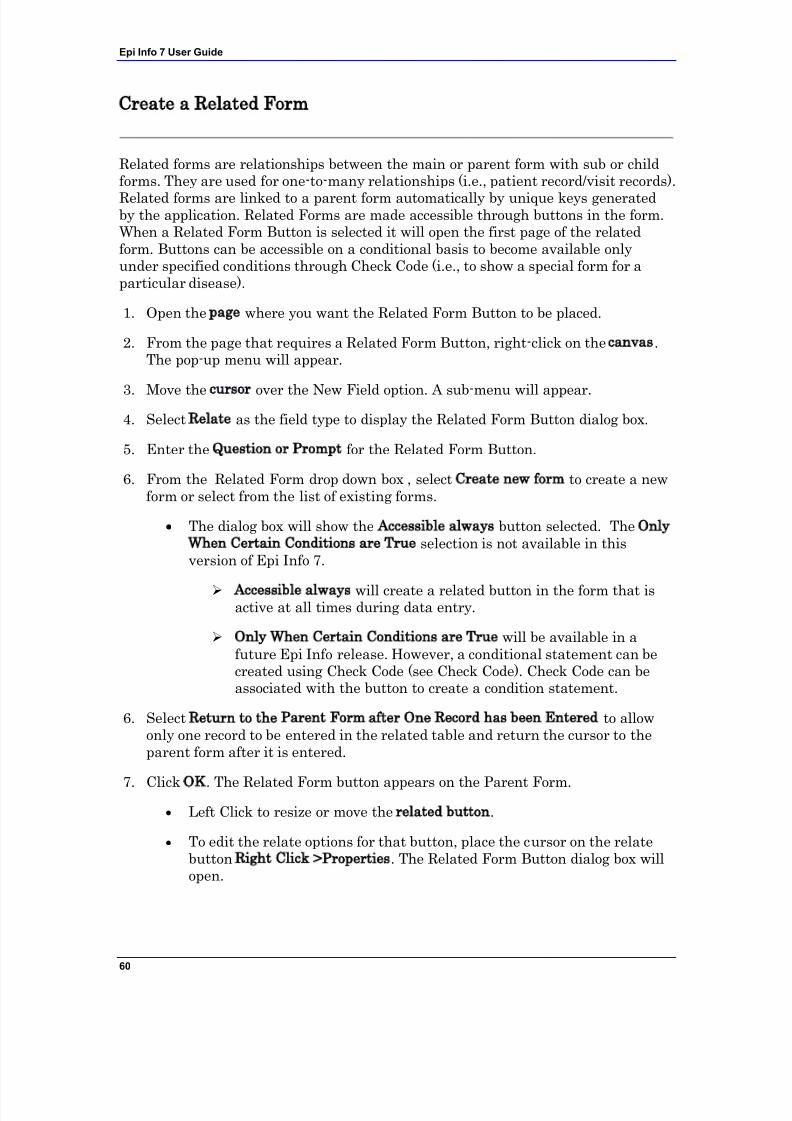
Create a Related Form
Related forms are relationships between the main or parent form with sub or childforms. They are used for one-to-many relationships (i.e., patient record/visit records).
Related forms are linked to a parent form automatically by unique keys generatedby the application. Related Forms are made accessible through buttons in the form.When a Related Form Button is selected it will open the first page of the relatedform. Buttons can be accessible on a conditional basis to become available onlyunder specified conditions through Check Code (i.e., to show a special form for aparticular disease).
1. Open the page where you want the Related Form Button to be placed.
2. From the page that requires a Related Form Button, right-click on the canvas.The pop-up menu will appear.
3. Move the cursor over the New Field option. A sub-menu will appear.
4. Select Relate as the field type to display the Related Form Button dialog box.
5. Enter the Question or Prompt for the Related Form Button.
6. From the Related Form drop down box , select Create new form to create a newform or select from the list of existing forms.
The dialog box will show the Accessible always button selected. The OnlyWhen Certain Conditions are True selection is not available in thisversion of Epi Info 7.
Accessible always will create a related button in the form that isactive at all times during data entry.
Only When Certain Conditions are True will be available in afuture Epi Info release. However, a conditional statement can becreated using Check Code (see Check Code). Check Code can beassociated with the button to create a condition statement.
6. Select Return to the Parent Form after One Record has been Entered to allowonly one record to be entered in the related table and return the cursor to theparent form after it is entered.
7. Click OK. The Related Form button appears on the Parent Form. Left Click to resize or move the related button.
To edit the relate options for that button, place the cursor on the relatebutton Right Click >Properties. The Related Form Button dialog box willopen.
7/14/2019 Epi Info 7 User Guide-V1.0 Cleared
http://slidepdf.com/reader/full/epi-info-7-user-guide-v10-cleared-563109dd5013b 67/368
Form Designer
61
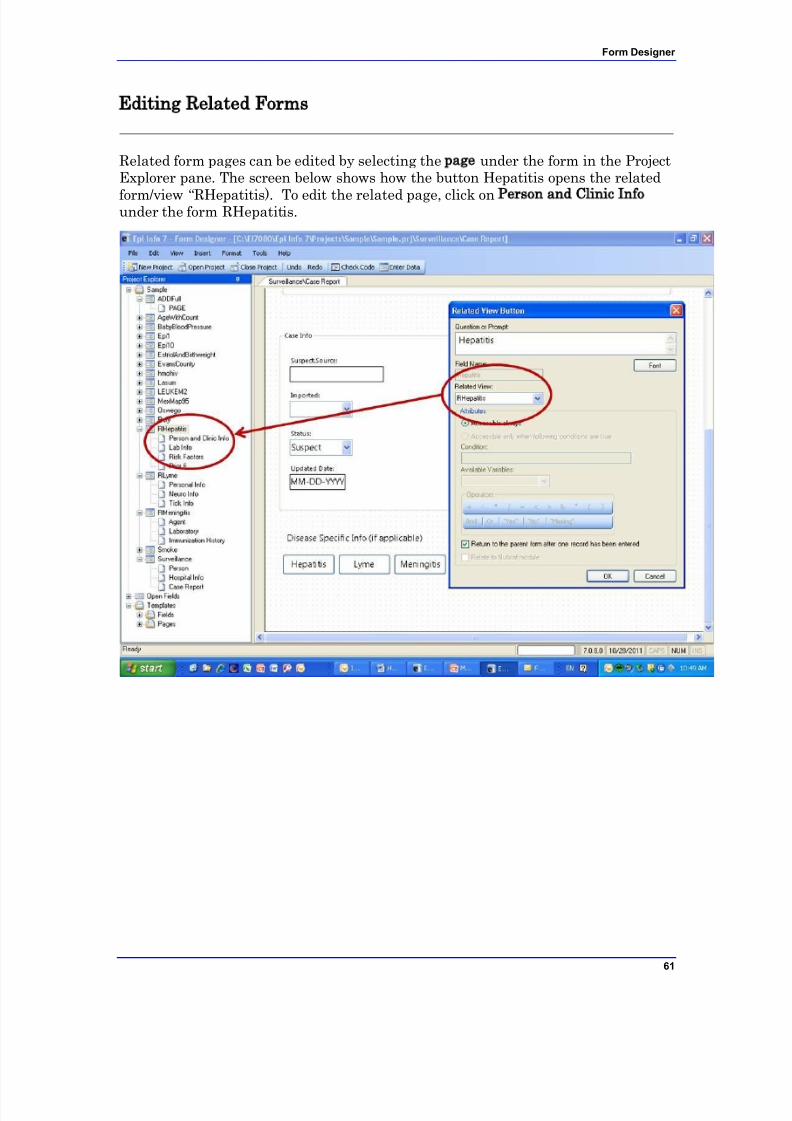
Editing Related Forms
Related form pages can be edited by selecting the page under the form in the ProjectExplorer pane. The screen below shows how the button Hepatitis opens the related
form/view “RHepatitis). To edit the related page, click on Person and Clinic Info under the form RHepatitis.
7/14/2019 Epi Info 7 User Guide-V1.0 Cleared
http://slidepdf.com/reader/full/epi-info-7-user-guide-v10-cleared-563109dd5013b 68/368
Epi Info 7 User Guide
62
Delete an Existing Data Table Without Deleting the Form
To delete an existing data table without deleting the form, perform the followingsteps:
1. From the Form Designer navigation menu, select Tools > Delete Data Table.The Form Designer warning message appears.
2. Click Yes. The data table associated with your form is deleted. The form remainsintact. A new data table will be made next time you use it in Enter.
If the data table is deleted, any entered data associated with the form aredeleted from the project. Be absolutely sure you do not need the records.
WARNING!
This function should be used only if you want to delete the data. All data will bedeleted.

7/14/2019 Epi Info 7 User Guide-V1.0 Cleared
http://slidepdf.com/reader/full/epi-info-7-user-guide-v10-cleared-563109dd5013b 69/368
Form Designer
63
7/14/2019 Epi Info 7 User Guide-V1.0 Cleared
http://slidepdf.com/reader/full/epi-info-7-user-guide-v10-cleared-563109dd5013b 70/368
64
Check CodeOverview
To create Check Code, open the Program Editor by selecting the Check Code buttonlocated on the toolbar, or select Tools > Check Code Editor from the Form Designernavigation menu.
Check Code validates data entry and enters data faster and more accurately. Withadvance planning, code can be created to perform calculations, skip questions basedon prior answers, prompt the user with dialog boxes, and populate fields acrosspages and records. Basically, Check Code is a set of rules for you to follow whileentering data. It helps eliminate errors that can occur when you enter largeamounts of information. Check Code is created using the Check Code Editor.
Check Commands must be placed in a block of commands corresponding to avariable in the database. Special sections are provided to execute commandsbefore or after you display a form, page, or record.
Comments preceded by two forward slashes ("//") may be placed within blocksof commands.
Commands in a block are activated before or after you make an entry in thefield. By default, commands are performed after an entry has been completedwith <Enter>, <PgUp>, <PgDn>, or <Tab>, or another command causes thecursor to leave the field (e.g., GOTO).
Check commands for each field are stored in the form in a record associatedwith a particular field.
Commands are inserted automatically through interaction with the dialogboxes. Text versions appear in the Check Code Editor when generated by thedialogs. Text can also be edited and saved there.
Before commands can be inserted into the Check Code Editor, a Check CodeBlock corresponding to a form, page, record, or field can be created. CheckCode Blocks are created using the following steps:
Select the form, page, record, or field that will receive the commands.
7/14/2019 Epi Info 7 User Guide-V1.0 Cleared
http://slidepdf.com/reader/full/epi-info-7-user-guide-v10-cleared-563109dd5013b 71/368
Check Code
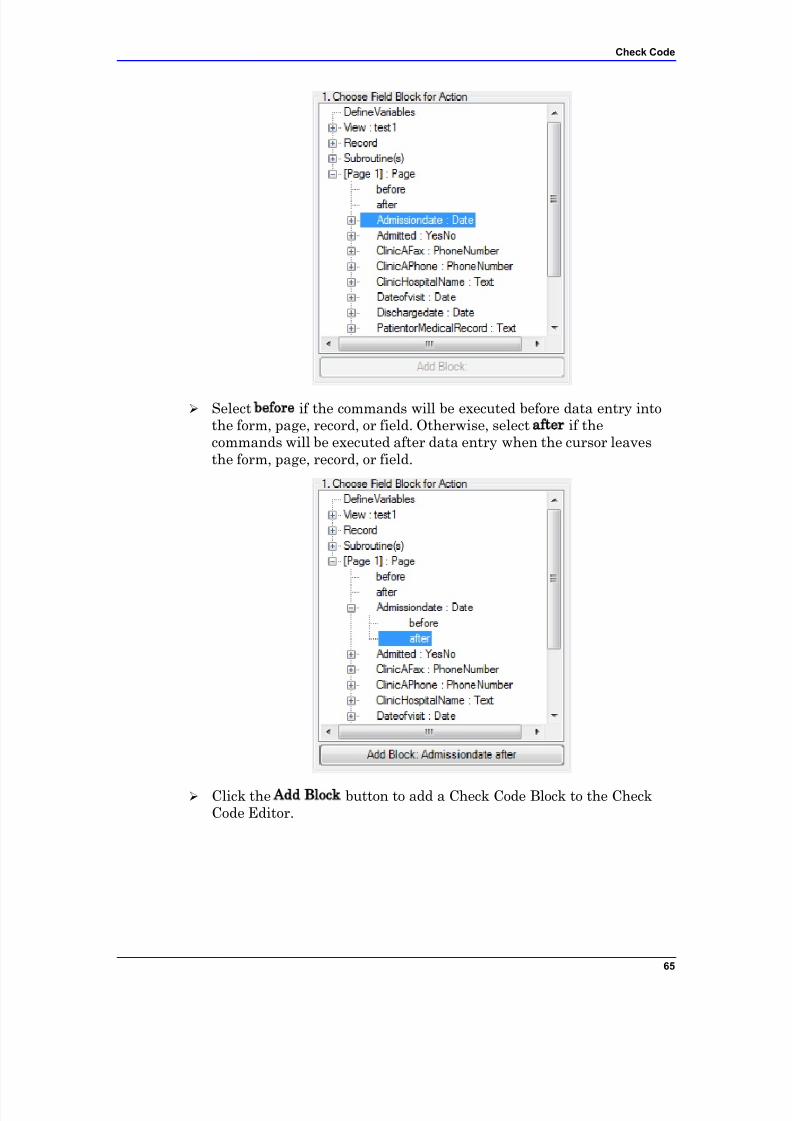
65
Select before if the commands will be executed before data entry intothe form, page, record, or field. Otherwise, select after if thecommands will be executed after data entry when the cursor leavesthe form, page, record, or field.
Click the Add Block button to add a Check Code Block to the CheckCode Editor.
7/14/2019 Epi Info 7 User Guide-V1.0 Cleared
http://slidepdf.com/reader/full/epi-info-7-user-guide-v10-cleared-563109dd5013b 72/368
Epi Info 7 User Guide
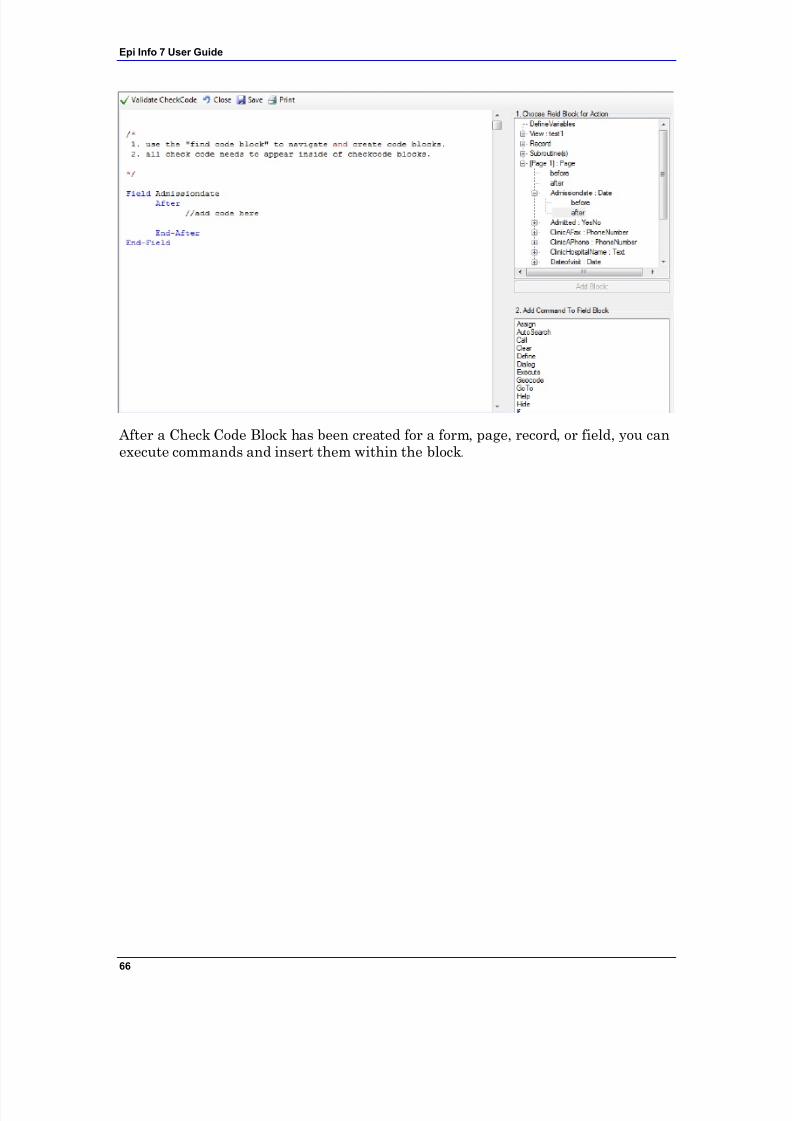
66
After a Check Code Block has been created for a form, page, record, or field, you canexecute commands and insert them within the block.

7/14/2019 Epi Info 7 User Guide-V1.0 Cleared
http://slidepdf.com/reader/full/epi-info-7-user-guide-v10-cleared-563109dd5013b 73/368
Check Code
67
Delete a Row of Code from the Check Code Editor
To delete a row from the Check Code Editor:
1. Highlight the text.2. On the keyboard, press Delete.
3. From the Check Code Editor toolbar, click Save.
Be sure of all deletions. No confirmation prompt or undo button will appearprior to deletion.
7/14/2019 Epi Info 7 User Guide-V1.0 Cleared
http://slidepdf.com/reader/full/epi-info-7-user-guide-v10-cleared-563109dd5013b 74/368
Epi Info 7 User Guide
68
Create a Skip Pattern with GOTO
You can create skip patterns by changing the tab order and setting a new cursorsequence through a questionnaire, or by creating Check Code using the GOTO
command. Skip patterns can also be created based on the answers to questions usingan IF/THEN statement.
1. Open a form that contains at least three fields.
2. Click Check Code. The Check Code Editor opens.
3. Select the first field from the Choose Field Block for Action list box.
4. Select after from the Before or After Section.
5. Click the Add Block button. This creates code to run after the first field isentered and accepted.
6. Click GoTo from the Add Command to Field Block list box. The GOTO dialog boxopens.
7. Select a field for the cursor to jump to after you enter the first field. The codewill run after the cursor leaves the field.
8. Click OK. The code appears in the Check Code Editor.
9. Click Save.
10. Click Close to return to the form.
To test the skip pattern, open the form in the data entry module. Use the tabkey to ensure that upon leaving the field with the GOTO command, thecursor goes to the specified field.
Create a Skip Pattern Using IF/THEN and GoTo
Use IF/THEN statements to create skip patterns based on the answers to questionsin the survey or questionnaire. This example creates code which states that if theperson answered Yes (+) to being ill, then the cursor jumps to a field that asks forthe diagnosis. If the person answered No (-), the cursor subsequently jumps to (or
skips) to the field for vaccination information.
1. Click Check Code. The Check Code Editor opens.
2. From the Choose Field Block for Action list box, select the field which containsthe action. For this example, select Ill.
3. The action needs to occur after data are entered into the Ill field. Select after from the Before or After section.
7/14/2019 Epi Info 7 User Guide-V1.0 Cleared
http://slidepdf.com/reader/full/epi-info-7-user-guide-v10-cleared-563109dd5013b 75/368
Check Code
69
4. Click the Add Block button. This creates code to run after the first field isentered and accepted.
5. Click If from the Add Command to Field Block list box. The IF dialog box opens.
6. From the Available Variables drop-down list, select the field to contain the
action. For this example, select Ill. The selected variable appears in the If Condition field.
7. From the Operators, click =.
8. From the Operators, click Yes. The If Condition field will read Ill=(+).
7. Click the Code Snippet button in the Then section. A list of available commandsappears.
8. From the command list, select GoTo. The GOTO dialog box opens.
9. Select the field for the cursor to jump to based on a Yes answer from the list of
variables. For this example, select Diagnosis.
10. In the GOTO dialog box, click OK to return to the IF dialog box.
11. Click the Code Snippet button in the Else section. A list of available commandsappears.
12. From the command list, select GoTo. The GOTO dialog box opens.
13. Select the field for the cursor to jump to based on a No answer from the list of variables. For this example, select Vaccinated.
14. In the GOTO dialog box, click OK to return to the IF dialog box.
15. Click OK. The code appears in the Check Code Editor. The example codeappears as:
IF Ill = (+) THENGOTO Diagnosis
ELSEGOTO Vaccinated
END-IF
16. Click Save from the Check Code Editor.
7/14/2019 Epi Info 7 User Guide-V1.0 Cleared
http://slidepdf.com/reader/full/epi-info-7-user-guide-v10-cleared-563109dd5013b 76/368
Epi Info 7 User Guide
70
Assign a Date
To program a mathematical function, use the Program Editor and the ASSIGNcommand. Check Code can be created to calculate and enter the age of a respondent
based on the date of birth and the date the survey was completed, or the system dateof the computer when data were entered.
This example uses a field called DateOfBirth and a field called Age to demonstratethe use of the ASSIGN command and the function YEARS.
1. From the Form Designer, click Check Code or select Tools > Check Code Editor.The Check Code Editor opens.
2. Select the DateOfBirth field from the Choose Field Block for Action list box.
3. Select after from the Before or After Section.
4. Click the Add Block button. This creates code to run after the DateOfBirth fieldis entered and accepted.
5. Click Assign from the Add Command to Field Block list box. The Assign dialogbox opens.
3. From the Assign Variable drop-down, select the field where the calculated valueshould appear. For this example, select the Age field.
4. In the = Expression field, type the function YEARS.
5. Type or click the left parenthesis (. Do not put a space before it.
Statements of a function must be enclosed in parentheses. Use theOperator buttons or type them in from your keyboard.
7. From the Available Variables drop-down list, select the DateOfBirth field.
8. Type a comma.
9. Type the survey date in a MM/DD/YYYY format or type the functionSYSTEMDATE to calculate using the computer clock.
10. Type or click the right parenthesis).
11. Click OK. Check Code can appear in the Check Code Editor in two ways.ASSIGN Age = YEARS(DateOfBirth, 06/21/2010)
ASSIGN Age = YEARS(DateOfBirth, SYSTEMDATE)
12. Click the Save button in the Check Code Editor.
Always save Check Code. Code will not update unless saved. The Savefeature also verifies syntax.
7/14/2019 Epi Info 7 User Guide-V1.0 Cleared
http://slidepdf.com/reader/full/epi-info-7-user-guide-v10-cleared-563109dd5013b 77/368
Check Code
71
Create a Dialog
The DIALOG command provides interaction with data entry personnel from withina program. Dialogs can display information, ask for and receive input, and offer lists
to make choices.
In this example, you can use the DIALOG command to create a reminder that allfields on page two of the survey must be completed.
1. From the form, click Check Code or select Tools > Check Code Editor. The CheckCode Editor opens.
2. From the Choose Field Block for Action list box, select Page 2. The action shouldoccur after the cursor leaves the page.
3. Select after from the Before or After Section.
4. Click the Add Block button.
5. From the Add Command to Field Block list box, select Dialog. The DIALOG boxopens.
3. In the Title field, type Alert. The Dialog Type radio button should be Simple.
5. In the Prompt field, type All fields on page two must be completed.
6. Click OK. The code appears in the Check Code Editor.
DIALOG "All fields on page two must be completed." TITLETEXT="Alert"
7. Click Save in the Check Code Editor.
7/14/2019 Epi Info 7 User Guide-V1.0 Cleared
http://slidepdf.com/reader/full/epi-info-7-user-guide-v10-cleared-563109dd5013b 78/368
Epi Info 7 User Guide
72
Use Autosearch
During data entry, fields with Autosearch Check Code are automatically searchedfor one or more matching records. A match can be displayed and edited or be
ignored. Data entry can continue on the current record. Autosearch can alert you topotential duplicate records, not prevent them from being entered.
1. Open a form. Click Check Code. The Check Code Editor opens.
2. From the Choose Field Block for Action list box, select the field to be searched.
3. Select After from the Before or After Section.
4. Click the Add Block button.
5. From the Add Command to Field Block list box, click Autosearch. The Autosearch window opens.
6. Select the variable(s) to be searched during data entry. This selection shouldmatch the variable selected from the Choose Field Block for Action list box.
7. Click OK. The code appears in the Check Code Editor window.
8. Click Save.
9. Click Close to return to the form.
When a duplicate record is entered from the data entry module, the Autosearch dialog box opens with all the matching records listed.
To view the potential duplicate record, double-click the arrow thatappears next to the record. The field where the potential duplicate wasentered is cleared.
Alternatively, click Cancel to remain on the current record and accept theduplicate value.
Note: For more information on using Autosearch, please see the Autosearch topic inthe Command Reference.

7/14/2019 Epi Info 7 User Guide-V1.0 Cleared
http://slidepdf.com/reader/full/epi-info-7-user-guide-v10-cleared-563109dd5013b 79/368
Check Code
73
Set a European Date Format
Date literals in Check Code and Analysis Programs (.PGMs) must use four-digit years. If not, an error message will appear once per session.
Date literals with two-digit years are treated according to the computer'slocal settings.
7/14/2019 Epi Info 7 User Guide-V1.0 Cleared
http://slidepdf.com/reader/full/epi-info-7-user-guide-v10-cleared-563109dd5013b 80/368
Epi Info 7 User Guide
74
Copy the Value of a Field from a Main to a Related Form
Check Code must be created for a value from a field in the main form to appear in arelated form (i.e., there may be an ID Number or Name that needs to be visible in
the Parent and Child Forms).
The following instructions assume the Parent and Child Forms already exist. Thefield to be copied needs to exist in the main form or be created in the main form priorto beginning.
1. Note the name of the field on the Parent form whose value will be copied to theChild form.
2. Open the Child form.
3. Create a new field. The new field must be the same field type as the field beingcopied from the Parent form.
3. Select the Read Only option.
4. Click OK. The new field appears in the form. This is where the Parent formvalues will be assigned and appear in data entry.
5. Click Check Code. The Check Code Editor appears.
6. From the Choose Field Block for Action list box, select the variable just createdin the Child form.
7. Select before from the Before or After Section.
8. Click the Add Block button.
8. From the Add Command to Field Block list box, click Assign. The ASSIGNdialog box appears.
9. From the Assign Variable drop-down list, select the new variable.
10. In the = Expression area, type the field name from Step 1.
If the Child Form already has a field with the same name as the onebeing copied from the Parent Form, it is important to distinguish theparent‟s field name. This field name must be prefixed by the Parent
Form‟s name followed by a period in the Assign expression: Demographics.PatientID
11. Click OK. The code appears in the Check Code Editor.
If the Child form does not have a field with the same name as the onebeing copied from the Parent form, the Check Code may appear asfollows:

7/14/2019 Epi Info 7 User Guide-V1.0 Cleared
http://slidepdf.com/reader/full/epi-info-7-user-guide-v10-cleared-563109dd5013b 81/368
Check Code
75
ASSIGN VisitsPatientID = PatientID
If the Child form already has a field with the same name as the onebeing copied from the Parent form, it is important to distinguish theParent‟s field name. In this example, Visits is the name of the form forthe child while Demographics is the name of the form for the parent.
The Check Code will appear as follows:ASSIGN Visits.PatientID = Demographics.PatientID
12.
13. Click Save.
7/14/2019 Epi Info 7 User Guide-V1.0 Cleared
http://slidepdf.com/reader/full/epi-info-7-user-guide-v10-cleared-563109dd5013b 82/368
Epi Info 7 User Guide
76
Concatenate Fields
If you write field concatenation code in Check Code Editor, future records will beprogrammed. The code will not go back and populate previously entered data. If
previously entered data need to be concatenated, use concatenation commands fromthe Analysis module.
Concatenate Fields with the Ampersand '&' Operator
This example illustrates how to join data from two fields and assign it into a thirdfield using the „&‟ operator. In this case, Patient Full Name will be assigned theconcatenation of First Name and Last Name.
1. From the Form Designer, click Check Code. The Check Code Editor opens.
2. From the Choose Field Block for Action list box, select the field that the codeshould run after. In this example, the code needs to run after you complete theLast Name field.
3. Select after from the Before or After Section.
4. Click the Add Block button.
3. From the Add Command to Field Block list box, click Assign. The ASSIGNdialog opens.
4. From the Assign Variable drop-down list, select the field to contain theconcatenated value.
5. Create the = Expression using the '&' operator. ASSIGN TargetField = FieldA & FieldB & … & FieldZ.
In this example, ASSIGN PatientFullName = FirstName &LastName.
If in Enter, FirstName was entered the name "Carl" and LastNamewas entered the name "Gao", the result of PatientFullName would be"CarlGao." There are no spaces between the names. To add a spacebetween the names, simply modify the ASSIGN statement by adding ablank space in quotes between the first and last names as in thefollowing statement:
ASSIGN PatientFullName = FirstName & " " & LastName
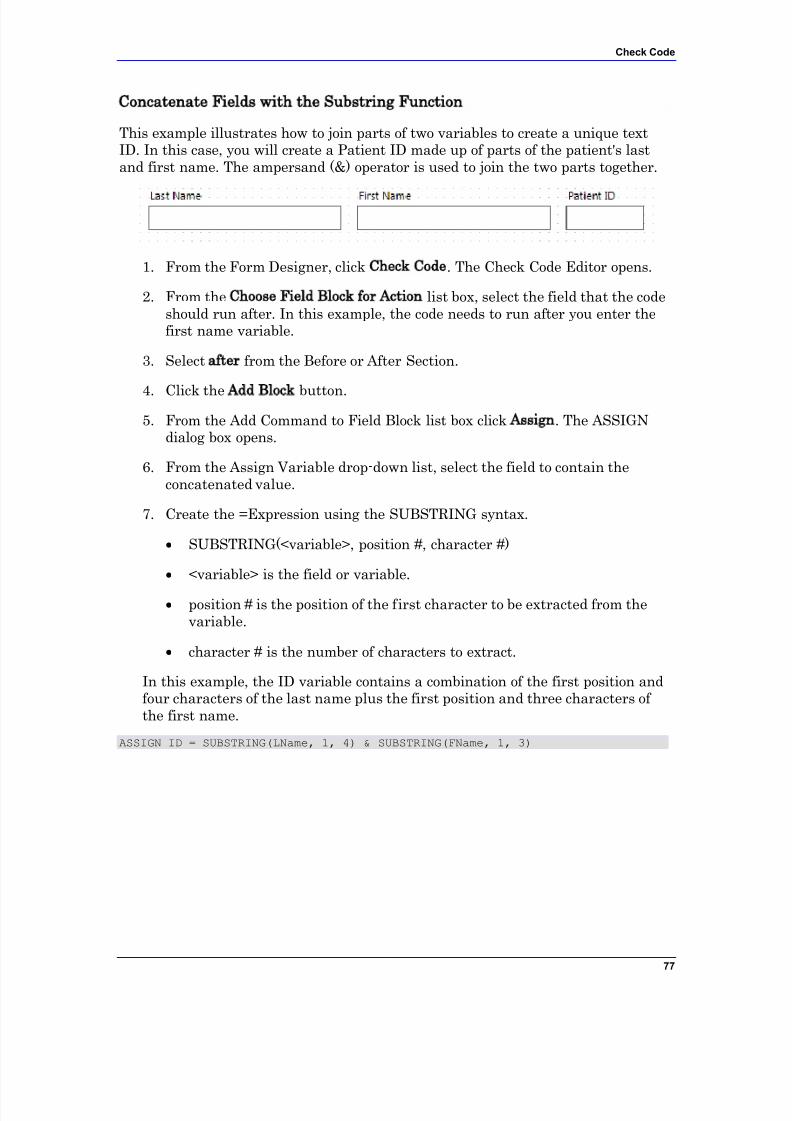
7/14/2019 Epi Info 7 User Guide-V1.0 Cleared
http://slidepdf.com/reader/full/epi-info-7-user-guide-v10-cleared-563109dd5013b 83/368
Check Code
77
Concatenate Fields with the Substring Function
This example illustrates how to join parts of two variables to create a unique textID. In this case, you will create a Patient ID made up of parts of the patient's lastand first name. The ampersand (&) operator is used to join the two parts together.
1. From the Form Designer, click Check Code. The Check Code Editor opens.
2. From the Choose Field Block for Action list box, select the field that the codeshould run after. In this example, the code needs to run after you enter thefirst name variable.
3. Select after from the Before or After Section.
4. Click the Add Block button.
5. From the Add Command to Field Block list box click Assign. The ASSIGNdialog box opens.
6. From the Assign Variable drop-down list, select the field to contain theconcatenated value.
7. Create the =Expression using the SUBSTRING syntax.
SUBSTRING(<variable>, position #, character #)
<variable> is the field or variable.
position # is the position of the first character to be extracted from thevariable.
character # is the number of characters to extract.
In this example, the ID variable contains a combination of the first position andfour characters of the last name plus the first position and three characters of the first name.
ASSIGN ID = SUBSTRING(LName, 1, 4) & SUBSTRING(FName, 1, 3)
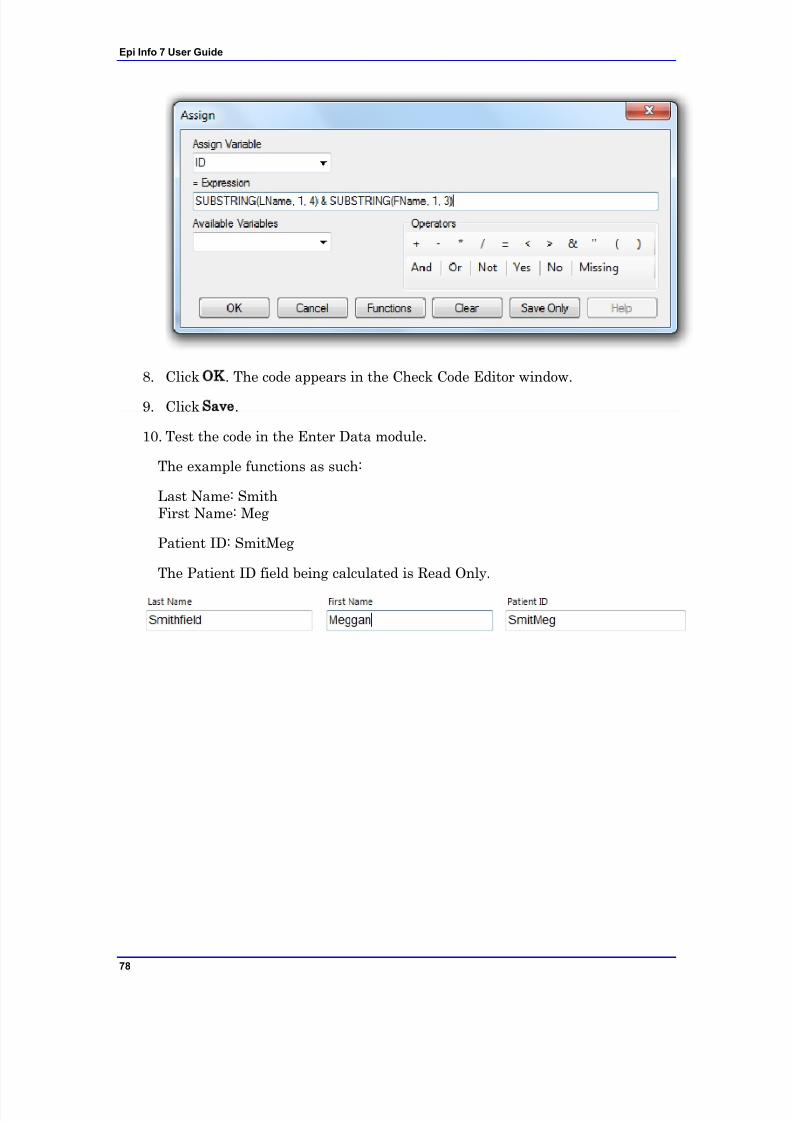
7/14/2019 Epi Info 7 User Guide-V1.0 Cleared
http://slidepdf.com/reader/full/epi-info-7-user-guide-v10-cleared-563109dd5013b 84/368
Epi Info 7 User Guide
78
8. Click OK. The code appears in the Check Code Editor window.
9. Click Save.
10. Test the code in the Enter Data module.
The example functions as such:
Last Name: SmithFirst Name: Meg
Patient ID: SmitMeg
The Patient ID field being calculated is Read Only.
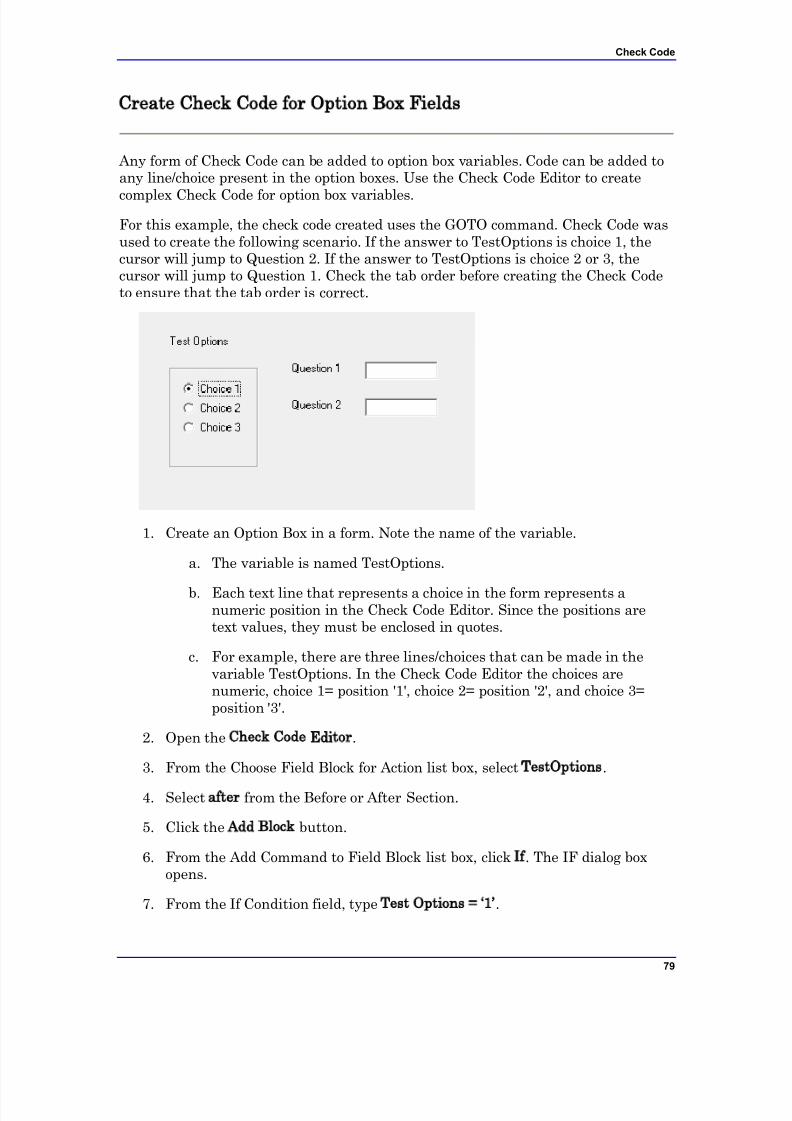
7/14/2019 Epi Info 7 User Guide-V1.0 Cleared
http://slidepdf.com/reader/full/epi-info-7-user-guide-v10-cleared-563109dd5013b 85/368
Check Code
79
Create Check Code for Option Box Fields
Any form of Check Code can be added to option box variables. Code can be added toany line/choice present in the option boxes. Use the Check Code Editor to create
complex Check Code for option box variables.
For this example, the check code created uses the GOTO command. Check Code wasused to create the following scenario. If the answer to TestOptions is choice 1, thecursor will jump to Question 2. If the answer to TestOptions is choice 2 or 3, thecursor will jump to Question 1. Check the tab order before creating the Check Codeto ensure that the tab order is correct.
1. Create an Option Box in a form. Note the name of the variable.
a. The variable is named TestOptions.
b. Each text line that represents a choice in the form represents anumeric position in the Check Code Editor. Since the positions aretext values, they must be enclosed in quotes.
c. For example, there are three lines/choices that can be made in thevariable TestOptions. In the Check Code Editor the choices arenumeric, choice 1= position '1', choice 2= position '2', and choice 3=position '3'.
2. Open the Check Code Editor.
3. From the Choose Field Block for Action list box, select TestOptions.
4. Select after from the Before or After Section.
5. Click the Add Block button.
6. From the Add Command to Field Block list box, click If. The IF dialog boxopens.
7. From the If Condition field, type Test Options = „1‟.
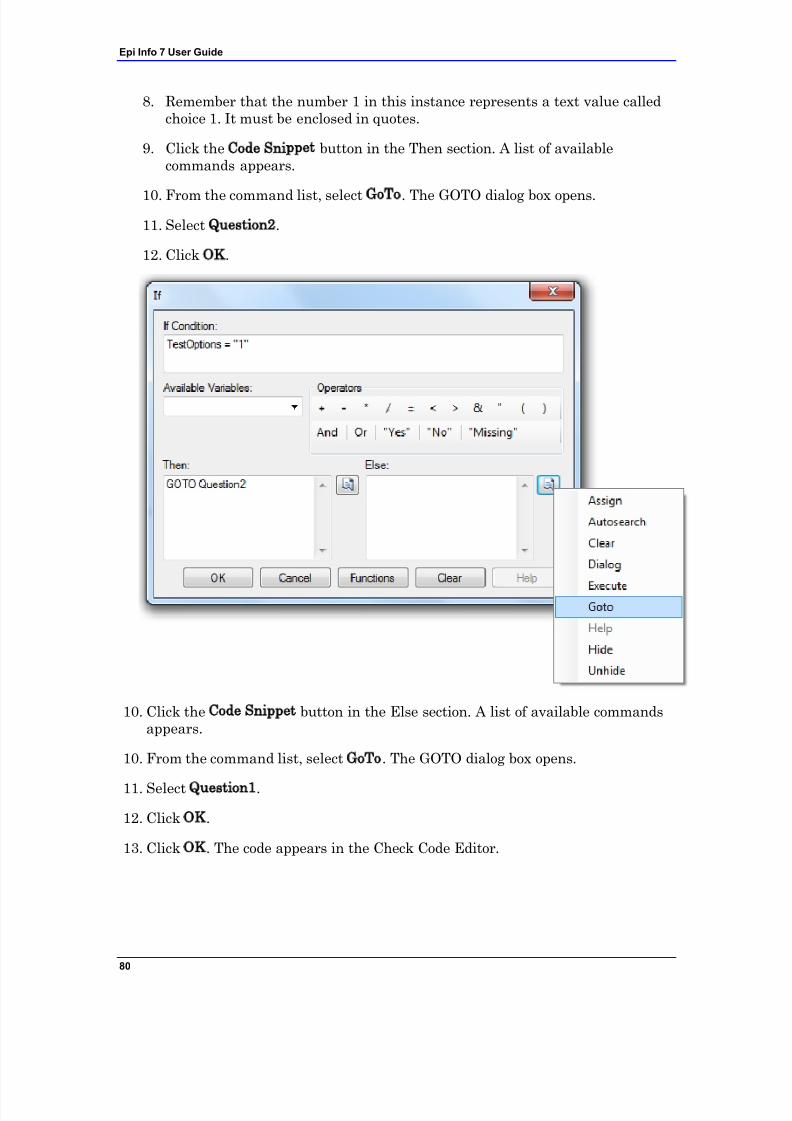
7/14/2019 Epi Info 7 User Guide-V1.0 Cleared
http://slidepdf.com/reader/full/epi-info-7-user-guide-v10-cleared-563109dd5013b 86/368
Epi Info 7 User Guide
80
8. Remember that the number 1 in this instance represents a text value calledchoice 1. It must be enclosed in quotes.
9. Click the Code Snippet button in the Then section. A list of availablecommands appears.
10. From the command list, select GoTo. The GOTO dialog box opens.
11. Select Question2.
12. Click OK.
10. Click the Code Snippet button in the Else section. A list of available commandsappears.
10. From the command list, select GoTo. The GOTO dialog box opens.
11. Select Question1.
12. Click OK.
13. Click OK. The code appears in the Check Code Editor.
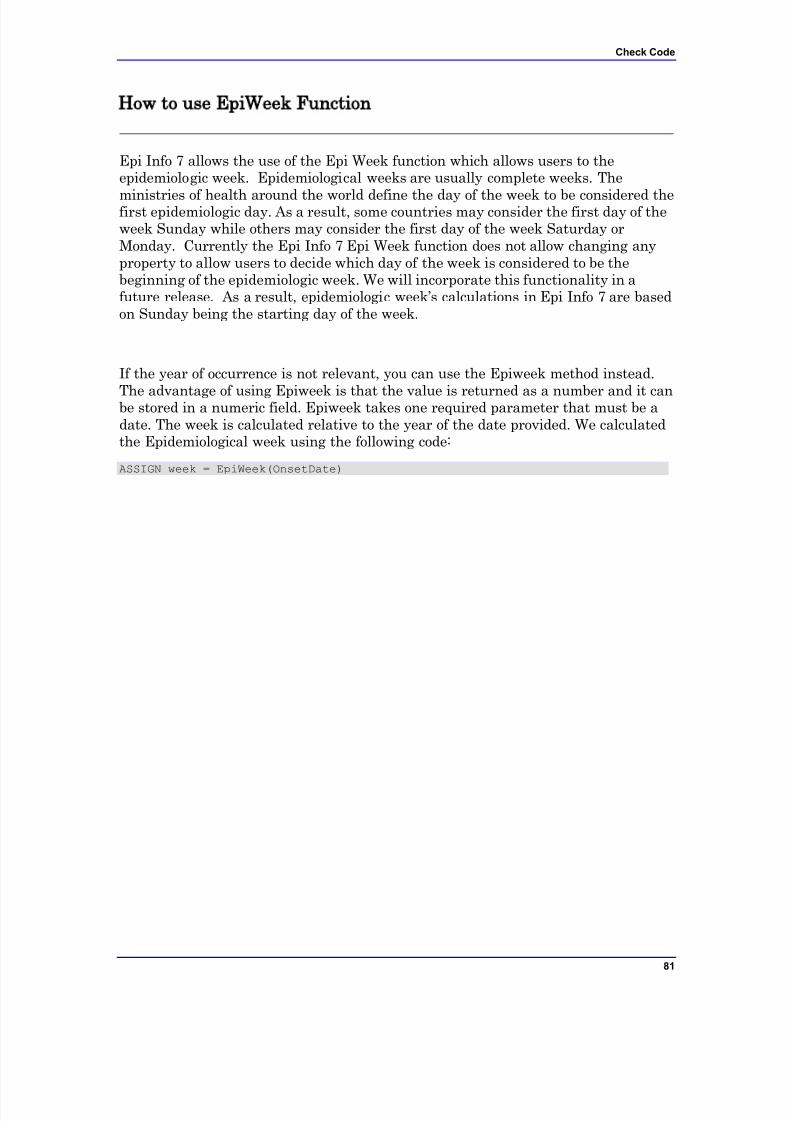
7/14/2019 Epi Info 7 User Guide-V1.0 Cleared
http://slidepdf.com/reader/full/epi-info-7-user-guide-v10-cleared-563109dd5013b 87/368
Check Code
81
How to use EpiWeek Function
Epi Info 7 allows the use of the Epi Week function which allows users to theepidemiologic week. Epidemiological weeks are usually complete weeks. The
ministries of health around the world define the day of the week to be considered thefirst epidemiologic day. As a result, some countries may consider the first day of theweek Sunday while others may consider the first day of the week Saturday orMonday. Currently the Epi Info 7 Epi Week function does not allow changing anyproperty to allow users to decide which day of the week is considered to be thebeginning of the epidemiologic week. We will incorporate this functionality in afuture release. As a result, epidemiologic week‟s calculations in Epi Info 7 are basedon Sunday being the starting day of the week.
If the year of occurrence is not relevant, you can use the Epiweek method instead.
The advantage of using Epiweek is that the value is returned as a number and it canbe stored in a numeric field. Epiweek takes one required parameter that must be adate. The week is calculated relative to the year of the date provided. We calculatedthe Epidemiological week using the following code:
ASSIGN week = EpiWeek(OnsetDate)
7/14/2019 Epi Info 7 User Guide-V1.0 Cleared
http://slidepdf.com/reader/full/epi-info-7-user-guide-v10-cleared-563109dd5013b 88/368
82
Enter Data
Introduction
The Enter program displays Forms constructed in Form Designer. Enter controls thedata entry process using settings and Check Code specified in Form Designer.Information entered into the form is stored in MS Access .MDB or MS SQL serverdata tables.
You can access the Enter program by clicking the Enter Data button on the Epi Infomain menu. It can also be accessed from the Tools>Enter Data sub menu option. InForm Designer, you can access Enter Data by clicking the Enter Data button. Thisbutton is a convenient method to switch between designing a form and entering datato test your form design.
Enter can be used to enter new data, modify existing data, or search for records.When data are entered into a form, the data table inside the project is populated.The Find function allows records to be located based on a series of matchedvariables. As data are entered, the cursor moves from field-to-field, page-to-page,and saves data as you move to a new page. If you try to exit a page before data issaved, you will be prompted to save the data (Yes or No).
Navigation is provided for using the New Record button and navigation buttons for,next ( ), previous ( ), first ( ), and last ( ) records. When entering datainto a child form you will also have the “Back” button to take you back to the parentform.
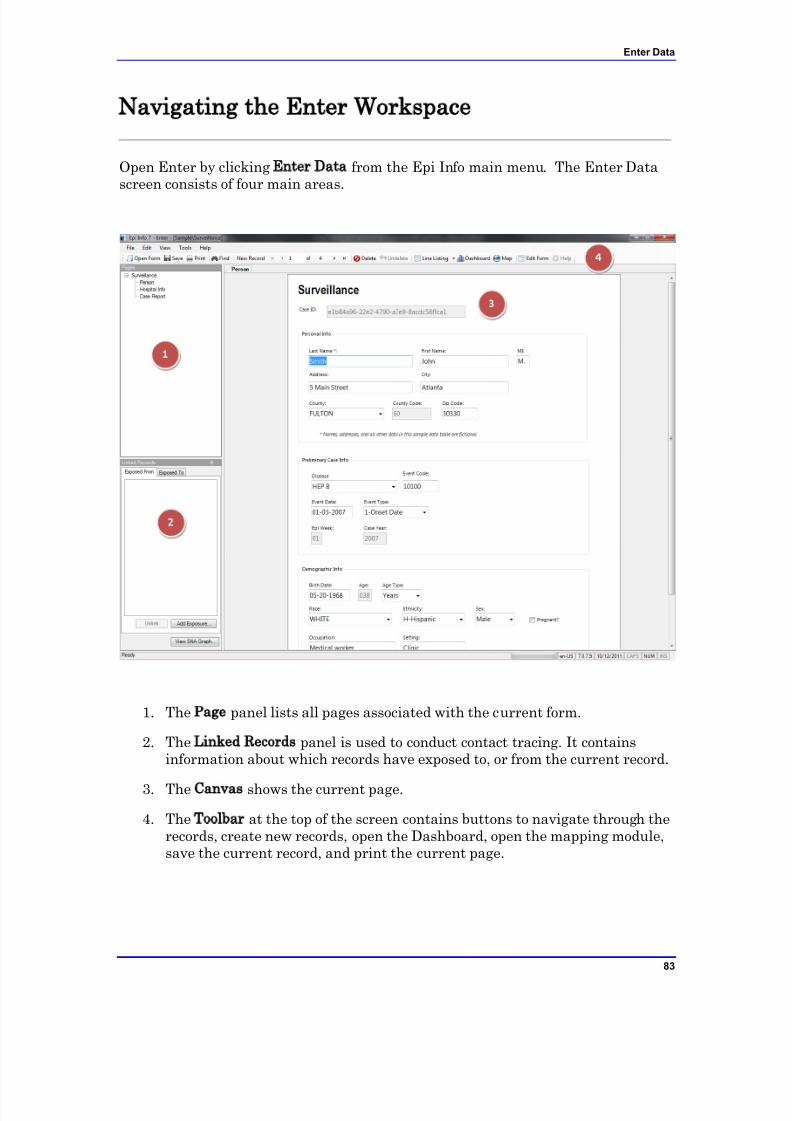
7/14/2019 Epi Info 7 User Guide-V1.0 Cleared
http://slidepdf.com/reader/full/epi-info-7-user-guide-v10-cleared-563109dd5013b 89/368
Enter Data
83
Navigating the Enter Workspace
Open Enter by clicking Enter Data from the Epi Info main menu. The Enter Datascreen consists of four main areas.
1. The Page panel lists all pages associated with the current form.
2. The Linked Records panel is used to conduct contact tracing. It containsinformation about which records have exposed to, or from the current record.
3. The Canvas shows the current page.
4. The Toolbar at the top of the screen contains buttons to navigate through therecords, create new records, open the Dashboard, open the mapping module,save the current record, and print the current page.
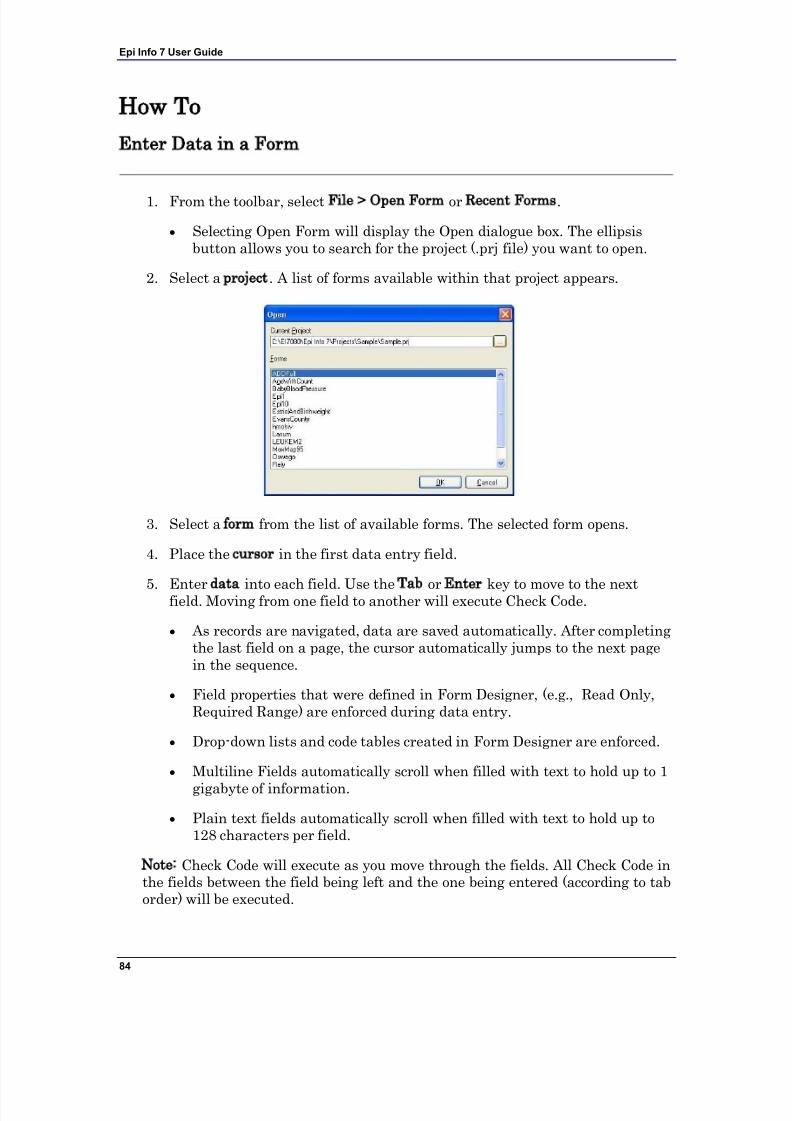
7/14/2019 Epi Info 7 User Guide-V1.0 Cleared
http://slidepdf.com/reader/full/epi-info-7-user-guide-v10-cleared-563109dd5013b 90/368
Epi Info 7 User Guide
84
How To
Enter Data in a Form
1. From the toolbar, select File > Open Form or Recent Forms.
Selecting Open Form will display the Open dialogue box. The ellipsisbutton allows you to search for the project (.prj file) you want to open.
2. Select a project. A list of forms available within that project appears.
3. Select a form from the list of available forms. The selected form opens.
4. Place the cursor in the first data entry field.
5. Enter data into each field. Use the Tab or Enter key to move to the nextfield. Moving from one field to another will execute Check Code.
As records are navigated, data are saved automatically. After completingthe last field on a page, the cursor automatically jumps to the next pagein the sequence.
Field properties that were defined in Form Designer, (e.g., Read Only,Required Range) are enforced during data entry.
Drop-down lists and code tables created in Form Designer are enforced.
Multiline Fields automatically scroll when filled with text to hold up to 1
gigabyte of information.
Plain text fields automatically scroll when filled with text to hold up to128 characters per field.
Note: Check Code will execute as you move through the fields. All Check Code inthe fields between the field being left and the one being entered (according to taborder) will be executed.
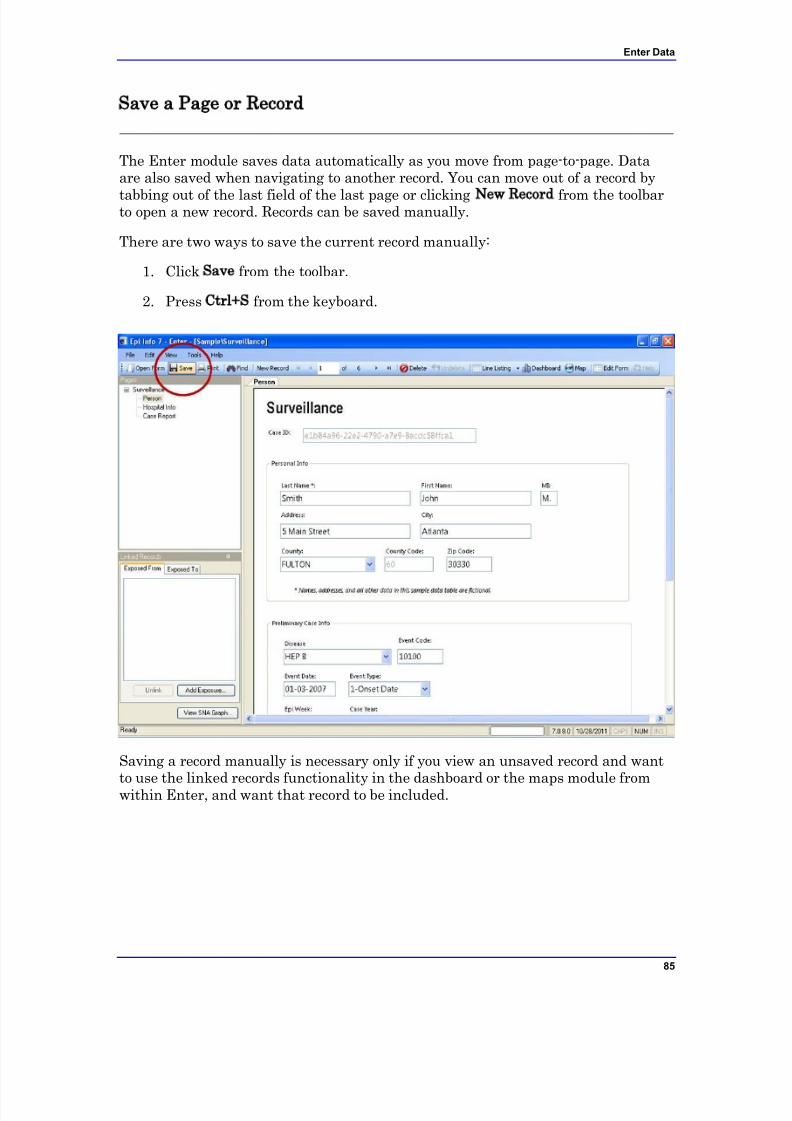
7/14/2019 Epi Info 7 User Guide-V1.0 Cleared
http://slidepdf.com/reader/full/epi-info-7-user-guide-v10-cleared-563109dd5013b 91/368
Enter Data
85
Save a Page or Record
The Enter module saves data automatically as you move from page-to-page. Dataare also saved when navigating to another record. You can move out of a record by
tabbing out of the last field of the last page or clicking New Record from the toolbarto open a new record. Records can be saved manually.
There are two ways to save the current record manually:
1. Click Save from the toolbar.
2. Press Ctrl+S from the keyboard.
Saving a record manually is necessary only if you view an unsaved record and wantto use the linked records functionality in the dashboard or the maps module fromwithin Enter, and want that record to be included.
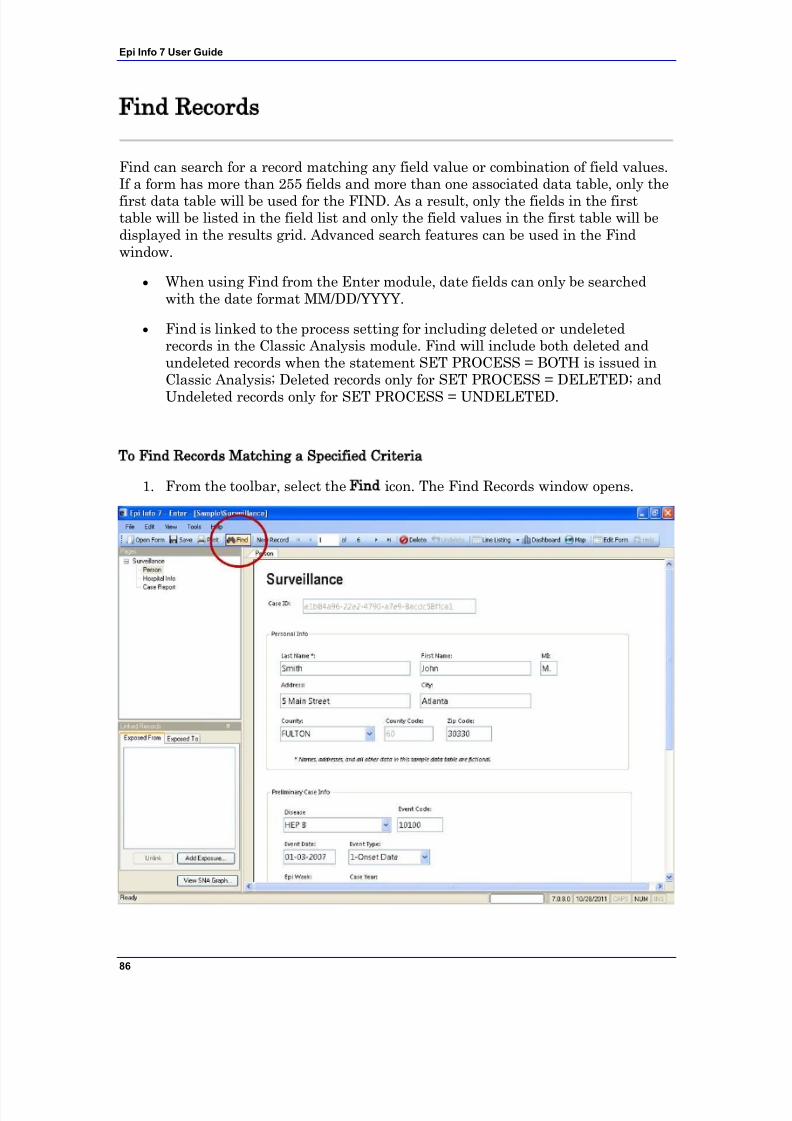
7/14/2019 Epi Info 7 User Guide-V1.0 Cleared
http://slidepdf.com/reader/full/epi-info-7-user-guide-v10-cleared-563109dd5013b 92/368
Epi Info 7 User Guide
86
Find Records
Find can search for a record matching any field value or combination of field values.If a form has more than 255 fields and more than one associated data table, only the
first data table will be used for the FIND. As a result, only the fields in the firsttable will be listed in the field list and only the field values in the first table will bedisplayed in the results grid. Advanced search features can be used in the Findwindow.
When using Find from the Enter module, date fields can only be searchedwith the date format MM/DD/YYYY.
Find is linked to the process setting for including deleted or undeletedrecords in the Classic Analysis module. Find will include both deleted andundeleted records when the statement SET PROCESS = BOTH is issued inClassic Analysis; Deleted records only for SET PROCESS = DELETED; and
Undeleted records only for SET PROCESS = UNDELETED.
To Find Records Matching a Specified Criteria
1. From the toolbar, select the Find icon. The Find Records window opens.
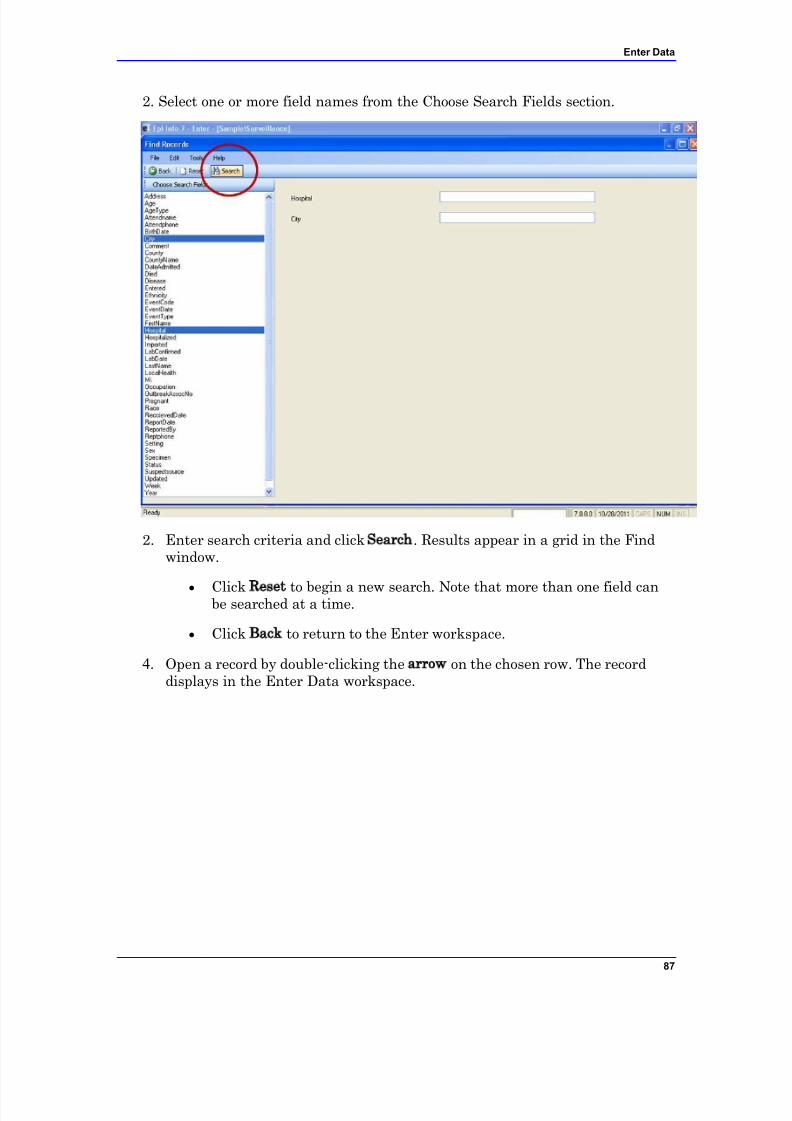
7/14/2019 Epi Info 7 User Guide-V1.0 Cleared
http://slidepdf.com/reader/full/epi-info-7-user-guide-v10-cleared-563109dd5013b 93/368
Enter Data
87
2. Select one or more field names from the Choose Search Fields section.
2. Enter search criteria and click Search. Results appear in a grid in the Findwindow.
Click Reset to begin a new search. Note that more than one field canbe searched at a time.
Click Back to return to the Enter workspace.
4. Open a record by double-clicking the arrow on the chosen row. The recorddisplays in the Enter Data workspace.
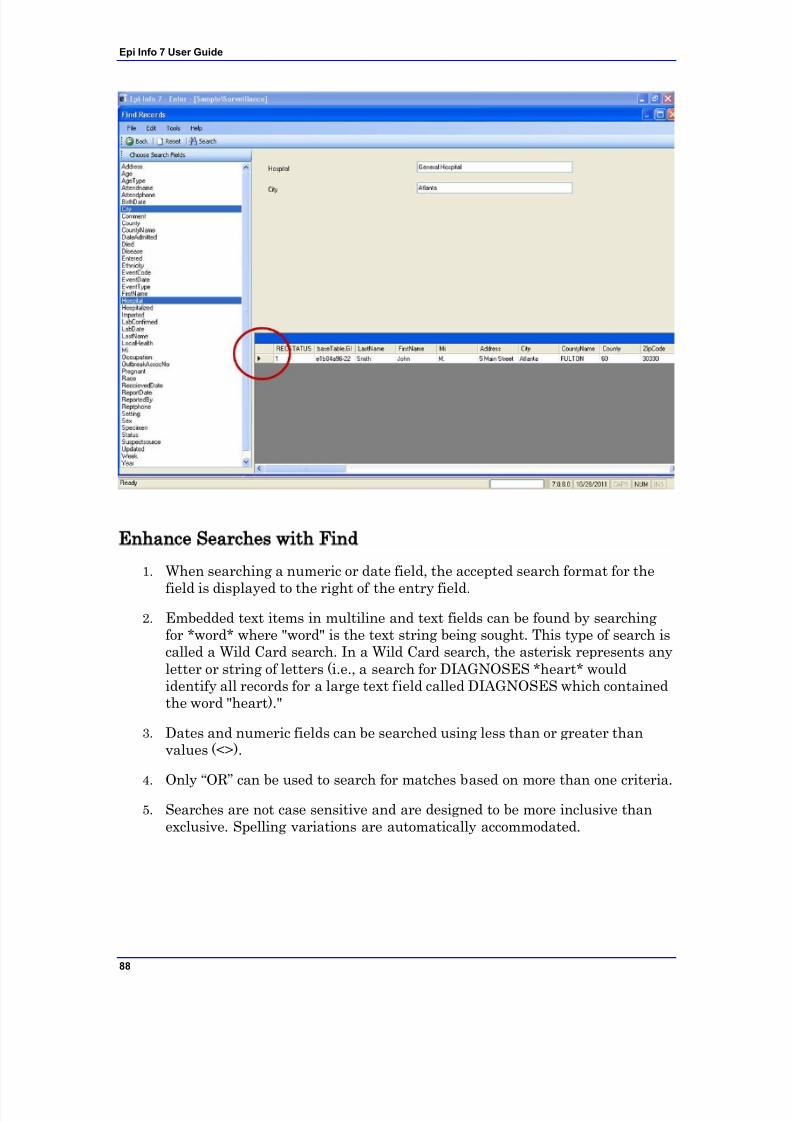
7/14/2019 Epi Info 7 User Guide-V1.0 Cleared
http://slidepdf.com/reader/full/epi-info-7-user-guide-v10-cleared-563109dd5013b 94/368
Epi Info 7 User Guide
88
Enhance Searches with Find
1. When searching a numeric or date field, the accepted search format for the
field is displayed to the right of the entry field.
2. Embedded text items in multiline and text fields can be found by searchingfor *word* where "word" is the text string being sought. This type of search iscalled a Wild Card search. In a Wild Card search, the asterisk represents anyletter or string of letters (i.e., a search for DIAGNOSES *heart* wouldidentify all records for a large text field called DIAGNOSES which containedthe word "heart)."
3. Dates and numeric fields can be searched using less than or greater thanvalues (<>).
4. Only “OR” can be used to search for matches based on more than one criteria.5. Searches are not case sensitive and are designed to be more inclusive than
exclusive. Spelling variations are automatically accommodated.

7/14/2019 Epi Info 7 User Guide-V1.0 Cleared
http://slidepdf.com/reader/full/epi-info-7-user-guide-v10-cleared-563109dd5013b 95/368
Enter Data
89
7/14/2019 Epi Info 7 User Guide-V1.0 Cleared
http://slidepdf.com/reader/full/epi-info-7-user-guide-v10-cleared-563109dd5013b 96/368
90
Classic Analysis
Introduction
Classic Analysis manipulates, manages, and analyzes data. It acts as a statisticaltoolbox providing many ways to transform data and perform statistical Classic
Analysis. Data can be selected, sorted, listed, or manipulated with a series of commands, functions, and operators. Available statistics include frequencies, means,and more advanced processes (i.e., Kaplan-Meier Survival Classic Analysis andLogistic Regression). Classic Analysis can be accessed by clicking Classic from theEpi Info™ main window or by selecting Tools > Analyze Data>Classic . It reads datafiles created in Form Designer and other types of databases (e.g., MS Access, MSExcel, SQL Server, and ASCII). Classic Analysis can also produce graphs to presentgraphic representations of data.
Classic Analysis provides access to existing data directly or through forms created inForm Designer. It reads data from files and tables created in Epi Info 7, Microsoft
Access, Microsoft Excel, SQL Server, and ASCII.
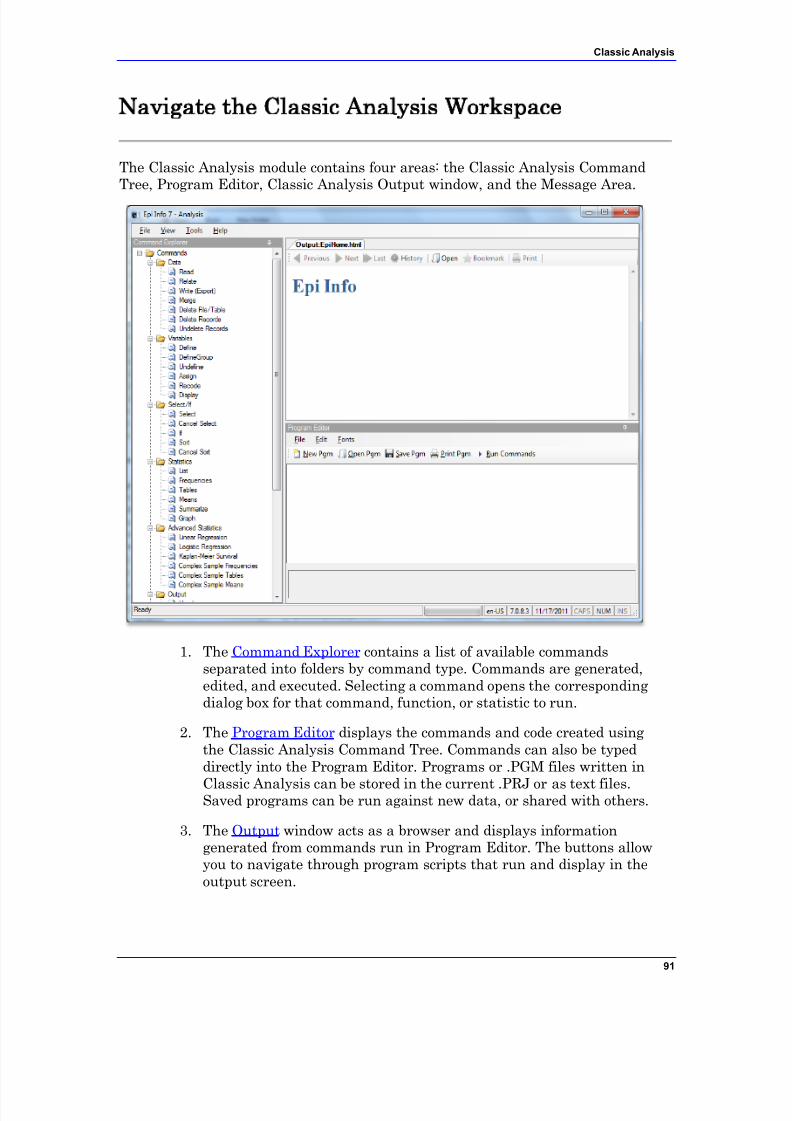
7/14/2019 Epi Info 7 User Guide-V1.0 Cleared
http://slidepdf.com/reader/full/epi-info-7-user-guide-v10-cleared-563109dd5013b 97/368
Classic Analysis
91
Navigate the Classic Analysis Workspace
The Classic Analysis module contains four areas: the Classic Analysis CommandTree, Program Editor, Classic Analysis Output window, and the Message Area.
1. The Command Explorer contains a list of available commandsseparated into folders by command type. Commands are generated,edited, and executed. Selecting a command opens the correspondingdialog box for that command, function, or statistic to run.
2. The Program Editor displays the commands and code created usingthe Classic Analysis Command Tree. Commands can also be typeddirectly into the Program Editor. Programs or .PGM files written in
Classic Analysis can be stored in the current .PRJ or as text files.Saved programs can be run against new data, or shared with others.
3. The Output window acts as a browser and displays informationgenerated from commands run in Program Editor. The buttons allowyou to navigate through program scripts that run and display in theoutput screen.

7/14/2019 Epi Info 7 User Guide-V1.0 Cleared
http://slidepdf.com/reader/full/epi-info-7-user-guide-v10-cleared-563109dd5013b 98/368
Epi Info 7 User Guide
92
4. The Message window alerts you if any problems occur with anyexecuted commands.
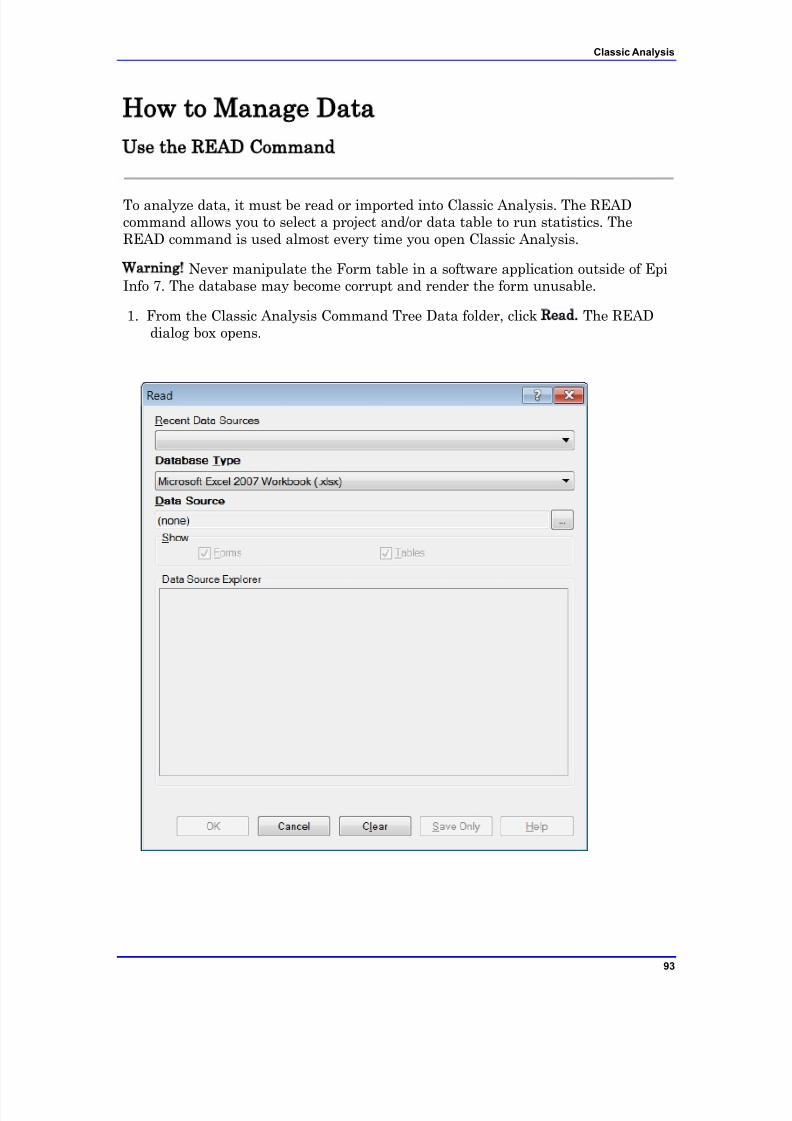
7/14/2019 Epi Info 7 User Guide-V1.0 Cleared
http://slidepdf.com/reader/full/epi-info-7-user-guide-v10-cleared-563109dd5013b 99/368
Classic Analysis
93
How to Manage Data
Use the READ Command
To analyze data, it must be read or imported into Classic Analysis. The READcommand allows you to select a project and/or data table to run statistics. TheREAD command is used almost every time you open Classic Analysis.
Warning! Never manipulate the Form table in a software application outside of EpiInfo 7. The database may become corrupt and render the form unusable.
1. From the Classic Analysis Command Tree Data folder, click Read. The READdialog box opens.
7/14/2019 Epi Info 7 User Guide-V1.0 Cleared
http://slidepdf.com/reader/full/epi-info-7-user-guide-v10-cleared-563109dd5013b 100/368
Epi Info 7 User Guide
94
The Database Type field indicates the database file to be loaded (.PRJ,.MDB, .XLS). Specify the data format for the data to be read. Unlessotherwise specified, output files created from these data are stored in thisdestination folder.
The Data Source field indicates the file location/path. If you use an SQL
Server database, the Data Source field will require server and databasenames.
2. The Recent Data Sources field provides a list of recently-accessed databases inClassic Analysis or Visual Dashboard. By selecting one of the data sourcesavailable on the list, you do not need to provide Database Type or Data Sourceinformation. Only data tables or forms will need to be selected again. If you arereading an Epi Info 7 project file from the Data Source section, select the Forms checkbox to view available forms in the project, or select the Tables checkbox toview all project tables.
3. From the Forms section, select a form in your project. This reads the data table
associated with your form.
4. Click OK. The READ command is saved in the Program Editor and runsimultaneously. The current form file location, Record Count, and Date appearin the Classic Analysis Output window; the READ command appears in theProgram Editor.
Click Save Only to save the command in the Program Editor. Thecommand does not run and the Record Count is not displayed.

7/14/2019 Epi Info 7 User Guide-V1.0 Cleared
http://slidepdf.com/reader/full/epi-info-7-user-guide-v10-cleared-563109dd5013b 101/368
Classic Analysis
95
Read a Microsoft Excel File
1. From the Classic Analysis Command Tree, click Read. The READ dialog boxopens.
2. From the Data Formats drop-down list, select either MS Excel 97-2003Workbook or MS Excel 2007 Workbook.
3. In the Data Source field, click on the ellipsis button to browse and select theworkbook (.xls or .xlsx) to import into Classic Analysis.
4. Click Open.
First Row Contains Field Names is checked by default. If the first row of the spreadsheet does not contain field names, deselect the checkbox.
5. Click OK
6. Select a Worksheet from the list provided in the Data Source Explorer.
7. Click OK. The Record Count and file information appear in the Classic AnalysisOutput window.
7/14/2019 Epi Info 7 User Guide-V1.0 Cleared
http://slidepdf.com/reader/full/epi-info-7-user-guide-v10-cleared-563109dd5013b 102/368
Epi Info 7 User Guide
96
Read a Microsoft Access File
1. From the Classic Analysis Command Tree, click Read. The READ dialog boxopens.
2. From the Data Formats drop-down list, select either MS Access 2002-2003(.mdb) or MS Access 2007(.accdb).
3. In the Data Source field, click on the ellipsis button to browse and select thefile to import into Classic Analysis.
4. Click OK.
5. Select a data table from the list provided in the Data Source Explorer.
6. Click OK. The Record Count and file information appear in the Classic AnalysisOutput window.
Read an ASCII Text File
1. From the Classic Analysis Command Tree, click Read. The READ dialog boxopens.
2. From the Data Formats drop-down list, select Flat ASCII File.
3. In the Data Source field, click the ellipsis button to browse.
4. Click the ellipsis button again. Select directory of the file to import into Classic Analysis.
5. Click OK.
6. Select the file from the list provided in the Data Source Explorer
7. Click OK.
Note: There are two forms of text files. Since both have only one table per file, youdo not have to specify a table. Both put the data for one record on a single line. The
difference is in how the fields are indicated.
7/14/2019 Epi Info 7 User Guide-V1.0 Cleared
http://slidepdf.com/reader/full/epi-info-7-user-guide-v10-cleared-563109dd5013b 103/368
Classic Analysis
97
Read an SQL Server Database
1. From the Classic Analysis Command Tree, click Read. The READ dialog boxopens.
2. From the Data Formats drop-down list, select Microsoft SQL Server Database.
3. In the Data Source field, click the ellipsis button to browse.
4. When the Connect to SQL Server Database dialog opens, specify the servername and database name to connect and import into Classic Analysis.
5. Click OK.
6. From the list provided in the Data Source Explorer, select a data table.
7. Click OK. The Record Count and file information appear in the Classic Analysis
Output window.
Use Related Forms
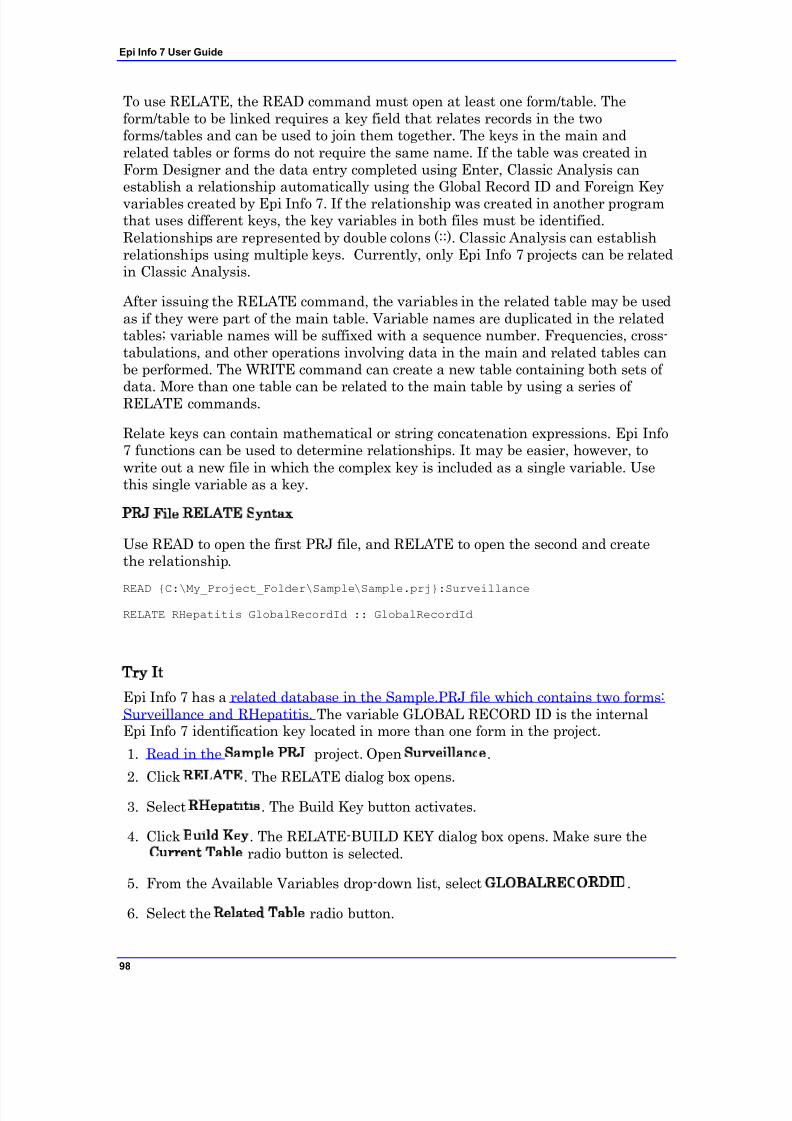
7/14/2019 Epi Info 7 User Guide-V1.0 Cleared
http://slidepdf.com/reader/full/epi-info-7-user-guide-v10-cleared-563109dd5013b 104/368
Epi Info 7 User Guide
98
To use RELATE, the READ command must open at least one form/table. Theform/table to be linked requires a key field that relates records in the twoforms/tables and can be used to join them together. The keys in the main andrelated tables or forms do not require the same name. If the table was created inForm Designer and the data entry completed using Enter, Classic Analysis canestablish a relationship automatically using the Global Record ID and Foreign Keyvariables created by Epi Info 7. If the relationship was created in another programthat uses different keys, the key variables in both files must be identified.Relationships are represented by double colons (::). Classic Analysis can establishrelationships using multiple keys. Currently, only Epi Info 7 projects can be relatedin Classic Analysis.
After issuing the RELATE command, the variables in the related table may be usedas if they were part of the main table. Variable names are duplicated in the relatedtables; variable names will be suffixed with a sequence number. Frequencies, cross-tabulations, and other operations involving data in the main and related tables canbe performed. The WRITE command can create a new table containing both sets of
data. More than one table can be related to the main table by using a series of RELATE commands.
Relate keys can contain mathematical or string concatenation expressions. Epi Info7 functions can be used to determine relationships. It may be easier, however, towrite out a new file in which the complex key is included as a single variable. Usethis single variable as a key.
PRJ File RELATE Syntax
Use READ to open the first PRJ file, and RELATE to open the second and createthe relationship.
READ {C:\My_Project_Folder\Sample\Sample.prj}:Surveillance
RELATE RHepatitis GlobalRecordId :: GlobalRecordId
Try It
Epi Info 7 has a related database in the Sample.PRJ file which contains two forms:Surveillance and RHepatitis. The variable GLOBAL RECORD ID is the internalEpi Info 7 identification key located in more than one form in the project.
1. Read in the Sample.PRJ project. Open Surveillance.
2. Click RELATE. The RELATE dialog box opens.
3. Select RHepatitis. The Build Key button activates.
4. Click Build Key. The RELATE-BUILD KEY dialog box opens. Make sure theCurrent Table radio button is selected.
5. From the Available Variables drop-down list, select GLOBALRECORDID.
6. Select the Related Table radio button.
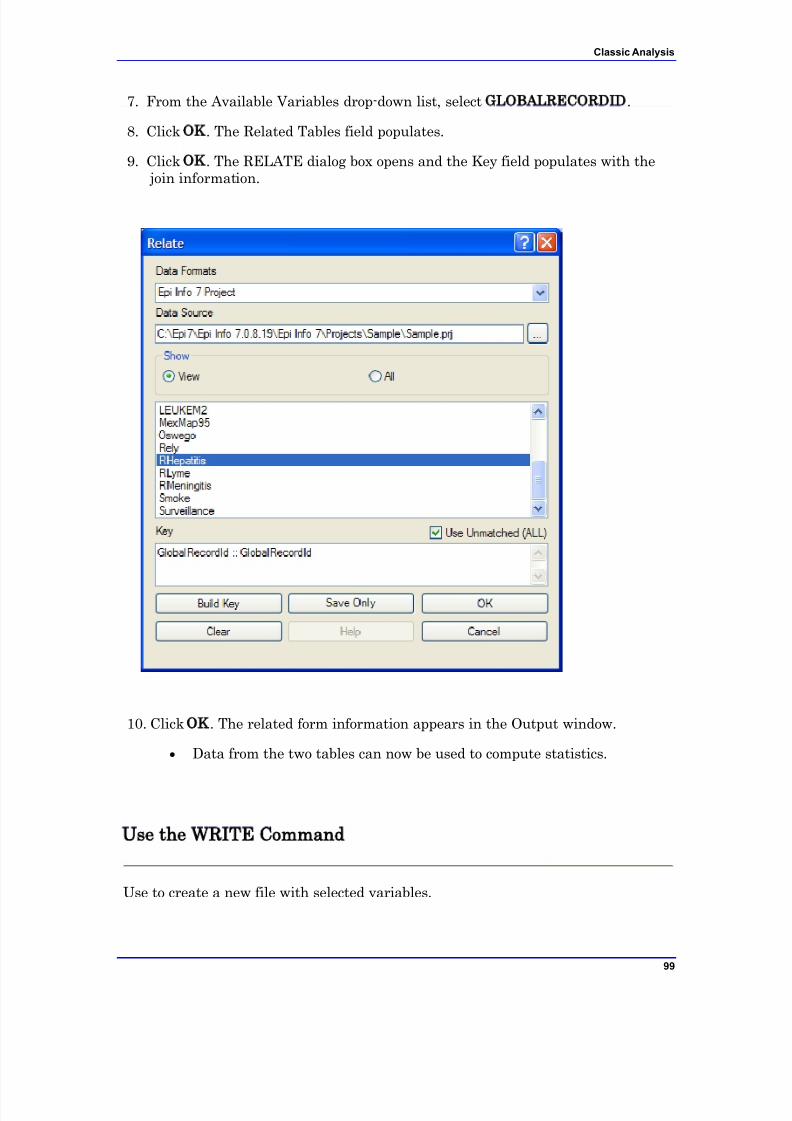
7/14/2019 Epi Info 7 User Guide-V1.0 Cleared
http://slidepdf.com/reader/full/epi-info-7-user-guide-v10-cleared-563109dd5013b 105/368
Classic Analysis
99
7. From the Available Variables drop-down list, select GLOBALRECORDID.
8. Click OK. The Related Tables field populates.
9. Click OK. The RELATE dialog box opens and the Key field populates with the join information.
10. Click OK. The related form information appears in the Output window.
Data from the two tables can now be used to compute statistics.
Use the WRITE Command
Use to create a new file with selected variables.
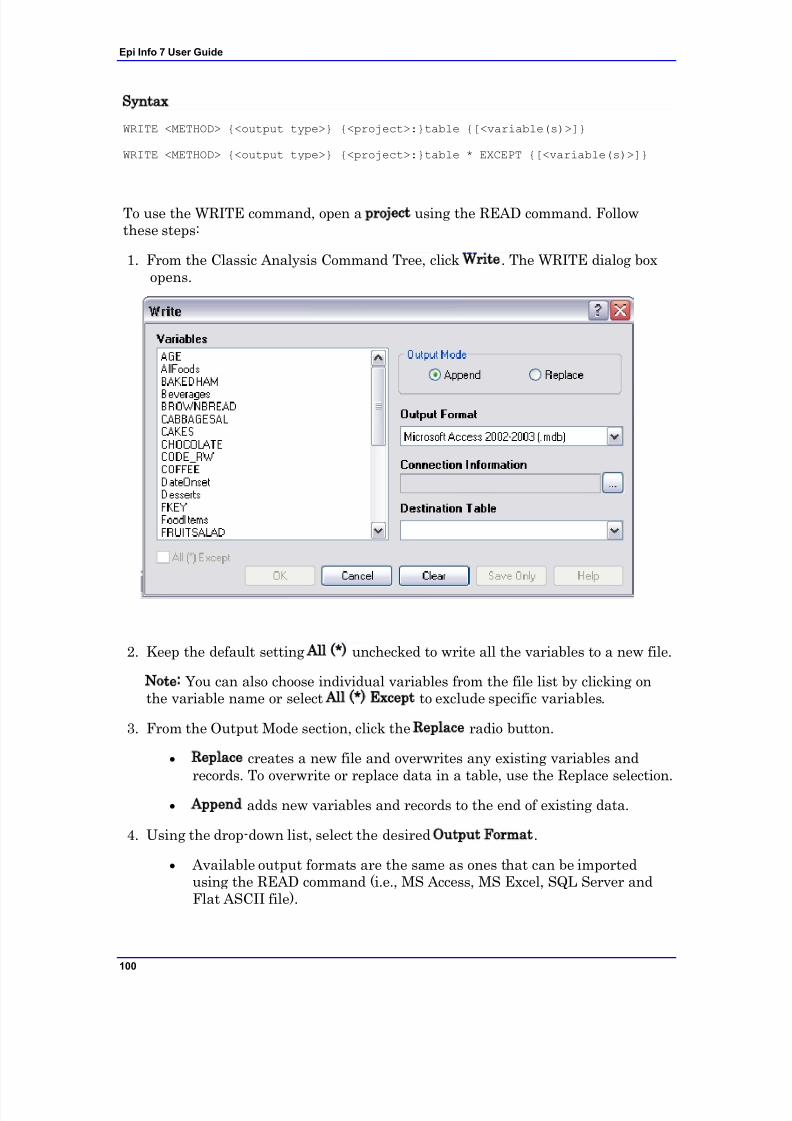
7/14/2019 Epi Info 7 User Guide-V1.0 Cleared
http://slidepdf.com/reader/full/epi-info-7-user-guide-v10-cleared-563109dd5013b 106/368
Epi Info 7 User Guide
100
Syntax
WRITE <METHOD> {<output type>} {<project>:}table {[<variable(s)>]}
WRITE <METHOD> {<output type>} {<project>:}table * EXCEPT {[<variable(s)>]}
To use the WRITE command, open a project using the READ command. Followthese steps:
1. From the Classic Analysis Command Tree, click Write. The WRITE dialog boxopens.
2. Keep the default setting All (*) unchecked to write all the variables to a new file.
Note: You can also choose individual variables from the file list by clicking onthe variable name or select All (*) Except to exclude specific variables.
3. From the Output Mode section, click the Replace radio button.
Replace creates a new file and overwrites any existing variables andrecords. To overwrite or replace data in a table, use the Replace selection.
Append adds new variables and records to the end of existing data.
4. Using the drop-down list, select the desired Output Format.
Available output formats are the same as ones that can be importedusing the READ command (i.e., MS Access, MS Excel, SQL Server andFlat ASCII file).
7/14/2019 Epi Info 7 User Guide-V1.0 Cleared
http://slidepdf.com/reader/full/epi-info-7-user-guide-v10-cleared-563109dd5013b 107/368
Classic Analysis
101
5. Click the ellipsis button in the Connection Information field to specify filename and location.
6. Click OK.
7. Establish a name for the Destination Table or select a table name from the dropdown list (if the table already exists).
8. Click OK.
To see the data, use the READ command to open the newly-createdproject.
The WRITE command will not create a form and cannot create a datatable to work with a form. To preserve forms, use the MERGE command.
Not all output formats support all possible input formats.
Use the MERGE Command
Use the MERGE command to join records. MERGE is only supported if the READdata source is an Epi Info 7 project. A merge requires a key, called the GLOBALRECORD ID, which represents an internal matching variable inside both sets of data.
Syntax
MERGE <table specification> <key(s)> <type>
1. From the Classic Analysis Command Tree, use the READ command to open aPRJ project file.
2. From the Classic Analysis Command Tree, click Data > Merge. The MERGEdialog box opens.
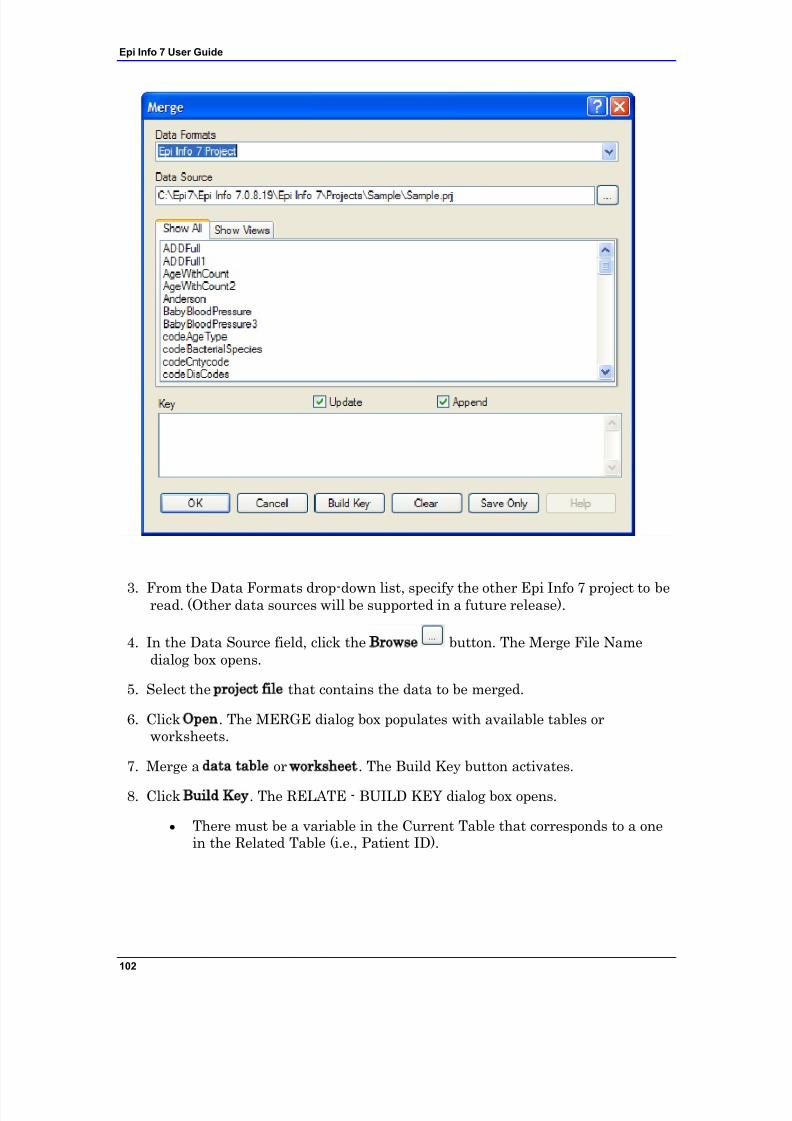
7/14/2019 Epi Info 7 User Guide-V1.0 Cleared
http://slidepdf.com/reader/full/epi-info-7-user-guide-v10-cleared-563109dd5013b 108/368
Epi Info 7 User Guide
102
3. From the Data Formats drop-down list, specify the other Epi Info 7 project to beread. (Other data sources will be supported in a future release).
4. In the Data Source field, click the Browse button. The Merge File Namedialog box opens.
5. Select the project file that contains the data to be merged.
6. Click Open. The MERGE dialog box populates with available tables orworksheets.
7. Merge a data table or worksheet. The Build Key button activates.
8. Click Build Key. The RELATE - BUILD KEY dialog box opens.
There must be a variable in the Current Table that corresponds to a onein the Related Table (i.e., Patient ID).
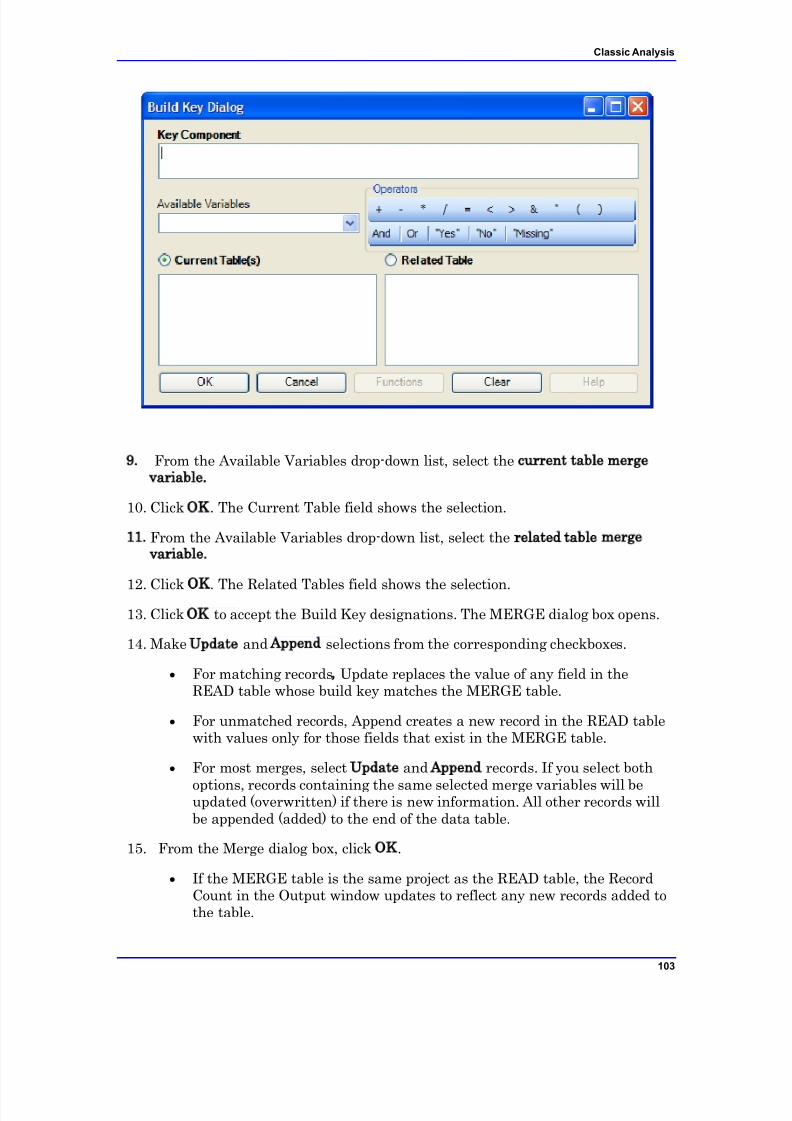
7/14/2019 Epi Info 7 User Guide-V1.0 Cleared
http://slidepdf.com/reader/full/epi-info-7-user-guide-v10-cleared-563109dd5013b 109/368
Classic Analysis
103
9. From the Available Variables drop-down list, select the current table mergevariable.
10. Click OK. The Current Table field shows the selection.
11. From the Available Variables drop-down list, select the related table mergevariable.
12. Click OK. The Related Tables field shows the selection.13. Click OK to accept the Build Key designations. The MERGE dialog box opens.
14. Make Update and Append selections from the corresponding checkboxes.
For matching records, Update replaces the value of any field in theREAD table whose build key matches the MERGE table.
For unmatched records, Append creates a new record in the READ tablewith values only for those fields that exist in the MERGE table.
For most merges, select Update and Append records. If you select both
options, records containing the same selected merge variables will beupdated (overwritten) if there is new information. All other records willbe appended (added) to the end of the data table.
15. From the Merge dialog box, click OK.
If the MERGE table is the same project as the READ table, the RecordCount in the Output window updates to reflect any new records added tothe table.
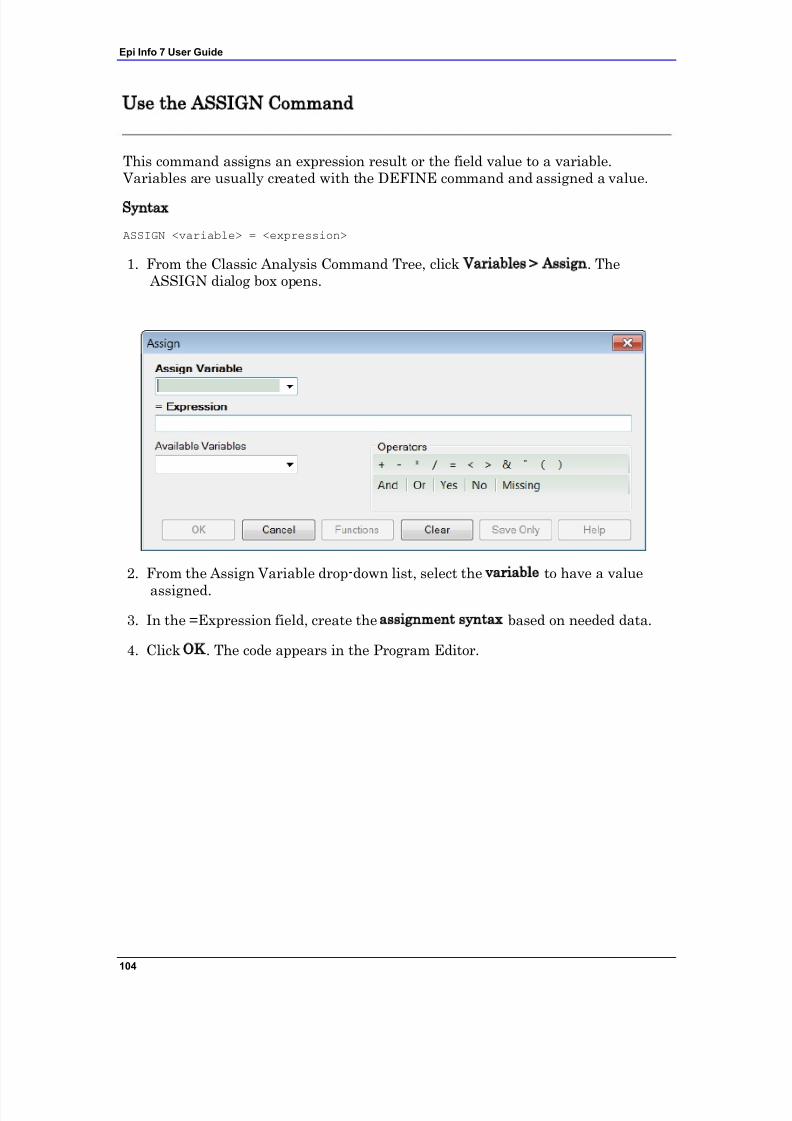
7/14/2019 Epi Info 7 User Guide-V1.0 Cleared
http://slidepdf.com/reader/full/epi-info-7-user-guide-v10-cleared-563109dd5013b 110/368
Epi Info 7 User Guide
104
Use the ASSIGN Command
This command assigns an expression result or the field value to a variable. Variables are usually created with the DEFINE command and assigned a value.
Syntax
ASSIGN <variable> = <expression>
1. From the Classic Analysis Command Tree, click Variables > Assign. The ASSIGN dialog box opens.
2. From the Assign Variable drop-down list, select the variable to have a value
assigned.
3. In the =Expression field, create the assignment syntax based on needed data.
4. Click OK. The code appears in the Program Editor.
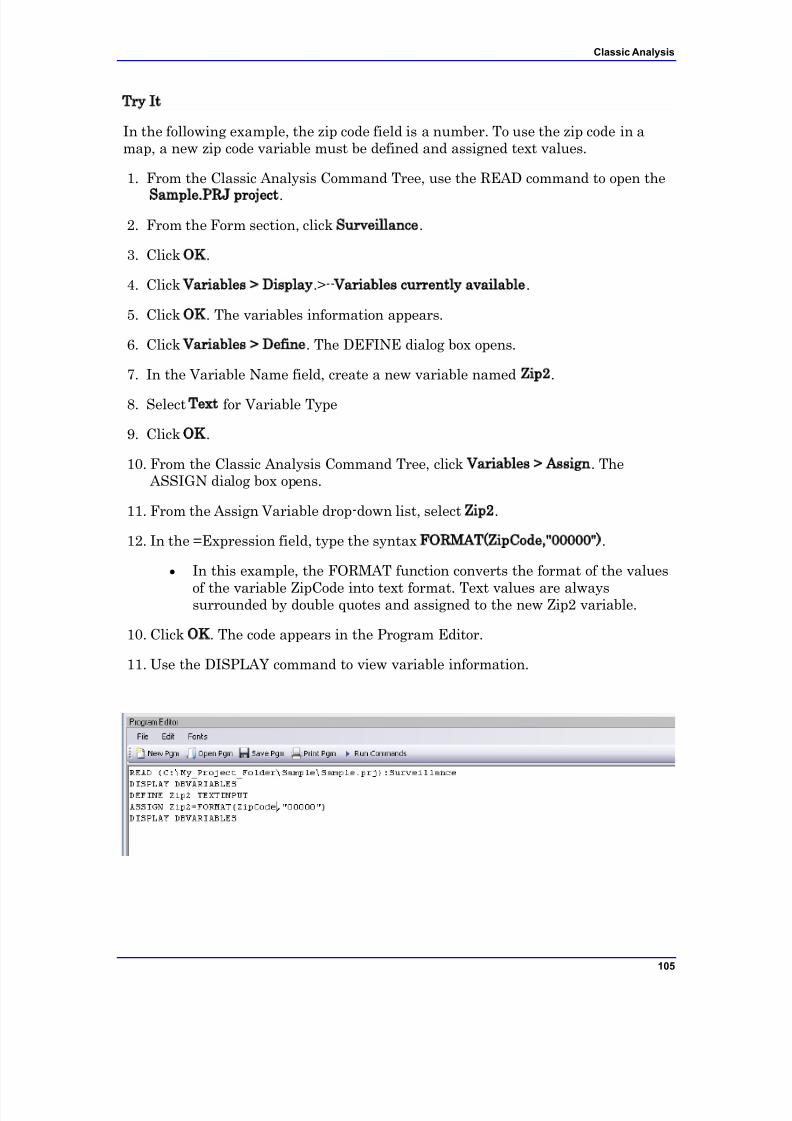
7/14/2019 Epi Info 7 User Guide-V1.0 Cleared
http://slidepdf.com/reader/full/epi-info-7-user-guide-v10-cleared-563109dd5013b 111/368
Classic Analysis
105
Try It
In the following example, the zip code field is a number. To use the zip code in amap, a new zip code variable must be defined and assigned text values.
1. From the Classic Analysis Command Tree, use the READ command to open the
Sample.PRJ project.
2. From the Form section, click Surveillance.
3. Click OK.
4. Click Variables > Display.>--Variables currently available.
5. Click OK. The variables information appears.
6. Click Variables > Define. The DEFINE dialog box opens.
7. In the Variable Name field, create a new variable named Zip2.
8. Select Text for Variable Type
9. Click OK.
10. From the Classic Analysis Command Tree, click Variables > Assign. The ASSIGN dialog box opens.
11. From the Assign Variable drop-down list, select Zip2.
12. In the =Expression field, type the syntax FORMAT(ZipCode,"00000") .
In this example, the FORMAT function converts the format of the values
of the variable ZipCode into text format. Text values are alwayssurrounded by double quotes and assigned to the new Zip2 variable.
10. Click OK. The code appears in the Program Editor.
11. Use the DISPLAY command to view variable information.
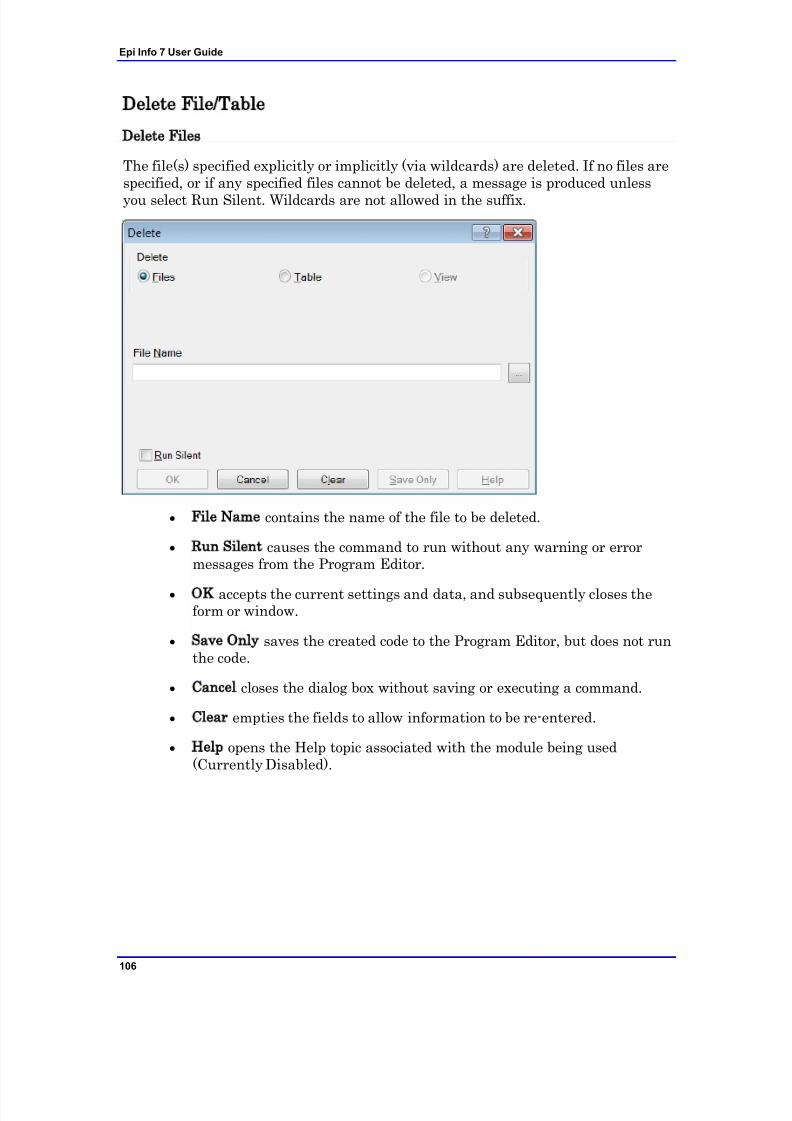
7/14/2019 Epi Info 7 User Guide-V1.0 Cleared
http://slidepdf.com/reader/full/epi-info-7-user-guide-v10-cleared-563109dd5013b 112/368
Epi Info 7 User Guide
106
Delete File/Table
Delete Files
The file(s) specified explicitly or implicitly (via wildcards) are deleted. If no files arespecified, or if any specified files cannot be deleted, a message is produced unless
you select Run Silent. Wildcards are not allowed in the suffix.
File Name contains the name of the file to be deleted.
Run Silent causes the command to run without any warning or errormessages from the Program Editor.
OK accepts the current settings and data, and subsequently closes theform or window.
Save Only saves the created code to the Program Editor, but does not runthe code.
Cancel closes the dialog box without saving or executing a command.
Clear empties the fields to allow information to be re-entered.
Help opens the Help topic associated with the module being used(Currently Disabled).
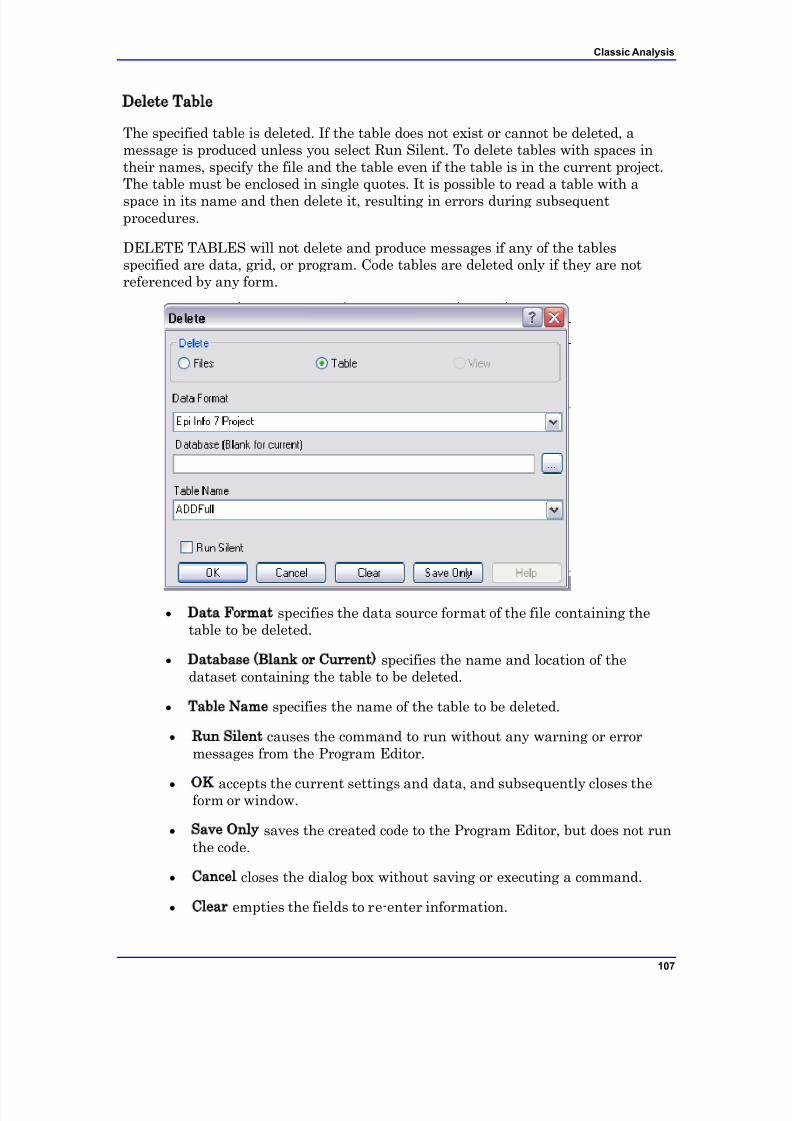
7/14/2019 Epi Info 7 User Guide-V1.0 Cleared
http://slidepdf.com/reader/full/epi-info-7-user-guide-v10-cleared-563109dd5013b 113/368
Classic Analysis
107
Delete Table
The specified table is deleted. If the table does not exist or cannot be deleted, amessage is produced unless you select Run Silent. To delete tables with spaces intheir names, specify the file and the table even if the table is in the current project.The table must be enclosed in single quotes. It is possible to read a table with a
space in its name and then delete it, resulting in errors during subsequentprocedures.
DELETE TABLES will not delete and produce messages if any of the tablesspecified are data, grid, or program. Code tables are deleted only if they are notreferenced by any form.
Data Format specifies the data source format of the file containing thetable to be deleted.
Database (Blank or Current) specifies the name and location of thedataset containing the table to be deleted.
Table Name specifies the name of the table to be deleted.
Run Silent causes the command to run without any warning or errormessages from the Program Editor.
OK accepts the current settings and data, and subsequently closes theform or window.
Save Only saves the created code to the Program Editor, but does not runthe code.
Cancel closes the dialog box without saving or executing a command.
Clear empties the fields to re-enter information.

7/14/2019 Epi Info 7 User Guide-V1.0 Cleared
http://slidepdf.com/reader/full/epi-info-7-user-guide-v10-cleared-563109dd5013b 114/368
Epi Info 7 User Guide
108
Help opens the Help topic associated with the module being used.(Currently Disabled).
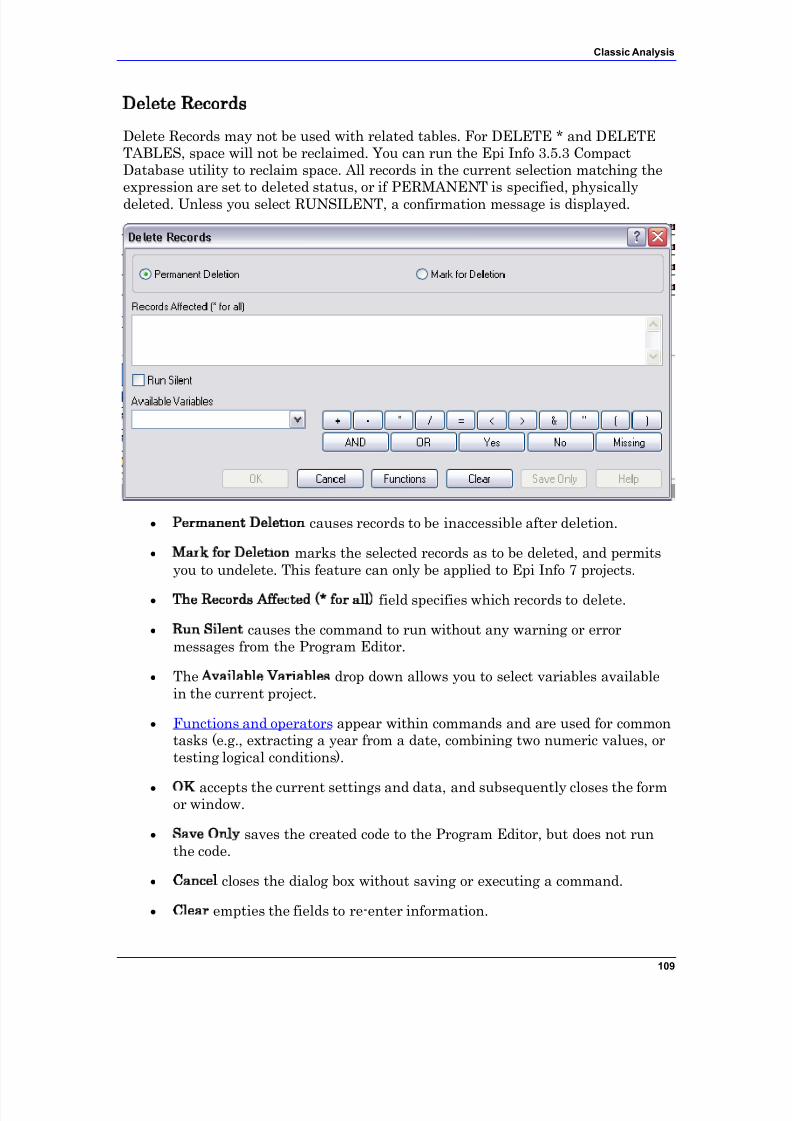
7/14/2019 Epi Info 7 User Guide-V1.0 Cleared
http://slidepdf.com/reader/full/epi-info-7-user-guide-v10-cleared-563109dd5013b 115/368
Classic Analysis
109
Delete Records
Delete Records may not be used with related tables. For DELETE * and DELETETABLES, space will not be reclaimed. You can run the Epi Info 3.5.3 CompactDatabase utility to reclaim space. All records in the current selection matching theexpression are set to deleted status, or if PERMANENT is specified, physicallydeleted. Unless you select RUNSILENT, a confirmation message is displayed.
Permanent Deletion causes records to be inaccessible after deletion.
Mark for Deletion marks the selected records as to be deleted, and permitsyou to undelete. This feature can only be applied to Epi Info 7 projects.
The Records Affected (* for all) field specifies which records to delete.
Run Silent causes the command to run without any warning or errormessages from the Program Editor.
The Available Variables drop down allows you to select variables availablein the current project.
Functions and operators appear within commands and are used for commontasks (e.g., extracting a year from a date, combining two numeric values, ortesting logical conditions).
OK accepts the current settings and data, and subsequently closes the formor window.
Save Only saves the created code to the Program Editor, but does not runthe code.
Cancel closes the dialog box without saving or executing a command.
Clear empties the fields to re-enter information.

7/14/2019 Epi Info 7 User Guide-V1.0 Cleared
http://slidepdf.com/reader/full/epi-info-7-user-guide-v10-cleared-563109dd5013b 116/368
Epi Info 7 User Guide
110
Help opens the Help topic associated with the module being used.(Currently Disabled).
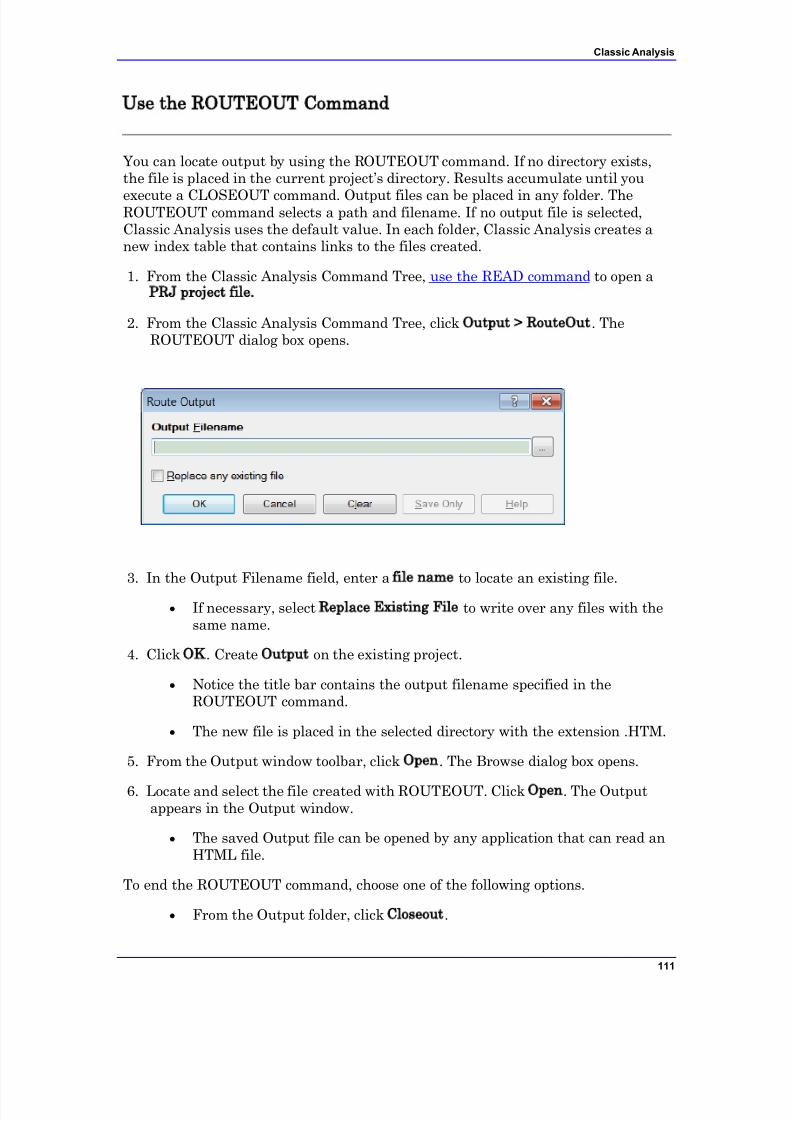
7/14/2019 Epi Info 7 User Guide-V1.0 Cleared
http://slidepdf.com/reader/full/epi-info-7-user-guide-v10-cleared-563109dd5013b 117/368
Classic Analysis
111
Use the ROUTEOUT Command
You can locate output by using the ROUTEOUT command. If no directory exists,the file is placed in the current project‟s directory. Results accumulate until you
execute a CLOSEOUT command. Output files can be placed in any folder. TheROUTEOUT command selects a path and filename. If no output file is selected,Classic Analysis uses the default value. In each folder, Classic Analysis creates anew index table that contains links to the files created.
1. From the Classic Analysis Command Tree, use the READ command to open aPRJ project file.
2. From the Classic Analysis Command Tree, click Output > RouteOut. TheROUTEOUT dialog box opens.
3. In the Output Filename field, enter a file name to locate an existing file.
If necessary, select Replace Existing File to write over any files with thesame name.
4. Click OK. Create Output on the existing project.
Notice the title bar contains the output filename specified in theROUTEOUT command.
The new file is placed in the selected directory with the extension .HTM.
5. From the Output window toolbar, click Open. The Browse dialog box opens.
6. Locate and select the file created with ROUTEOUT. Click Open. The Outputappears in the Output window.
The saved Output file can be opened by any application that can read anHTML file.
To end the ROUTEOUT command, choose one of the following options.
From the Output folder, click Closeout.

7/14/2019 Epi Info 7 User Guide-V1.0 Cleared
http://slidepdf.com/reader/full/epi-info-7-user-guide-v10-cleared-563109dd5013b 118/368
Epi Info 7 User Guide
112
READ in a new project.
Close Epi Info 7.
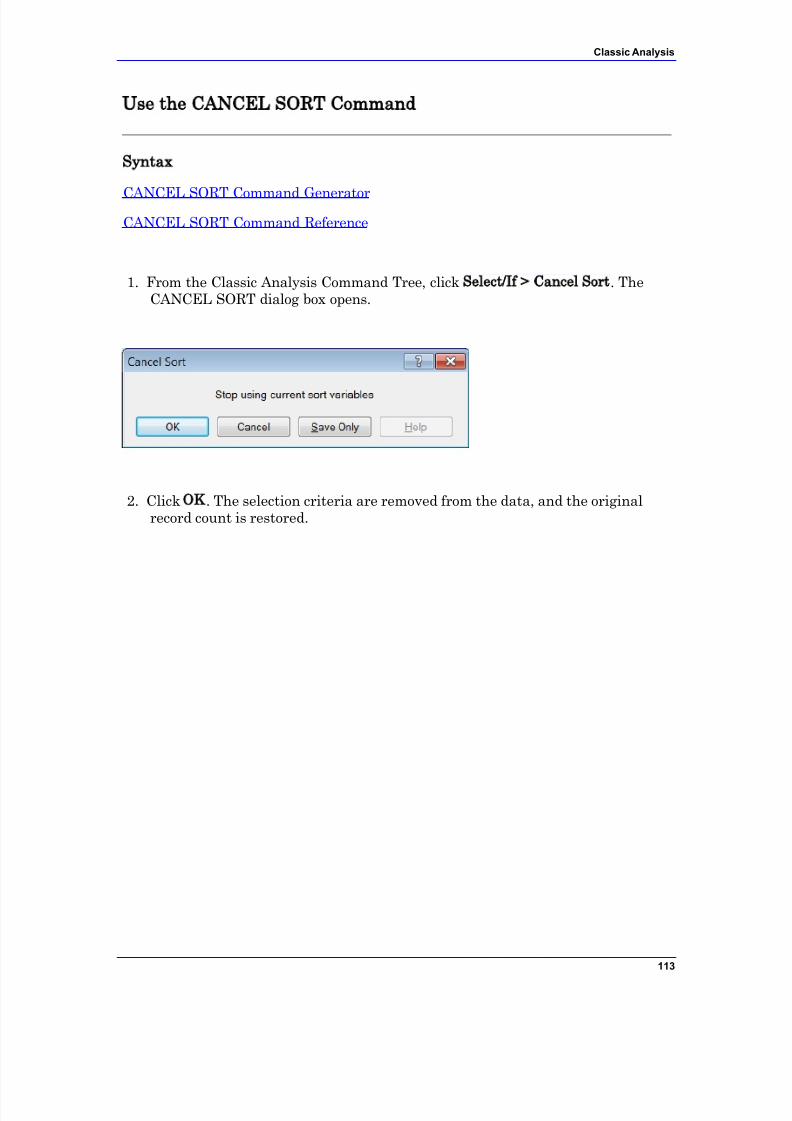
7/14/2019 Epi Info 7 User Guide-V1.0 Cleared
http://slidepdf.com/reader/full/epi-info-7-user-guide-v10-cleared-563109dd5013b 119/368
Classic Analysis
113
Use the CANCEL SORT Command
Syntax
CANCEL SORT Command Generator
CANCEL SORT Command Reference
1. From the Classic Analysis Command Tree, click Select/If > Cancel Sort. TheCANCEL SORT dialog box opens.
2. Click OK. The selection criteria are removed from the data, and the originalrecord count is restored.
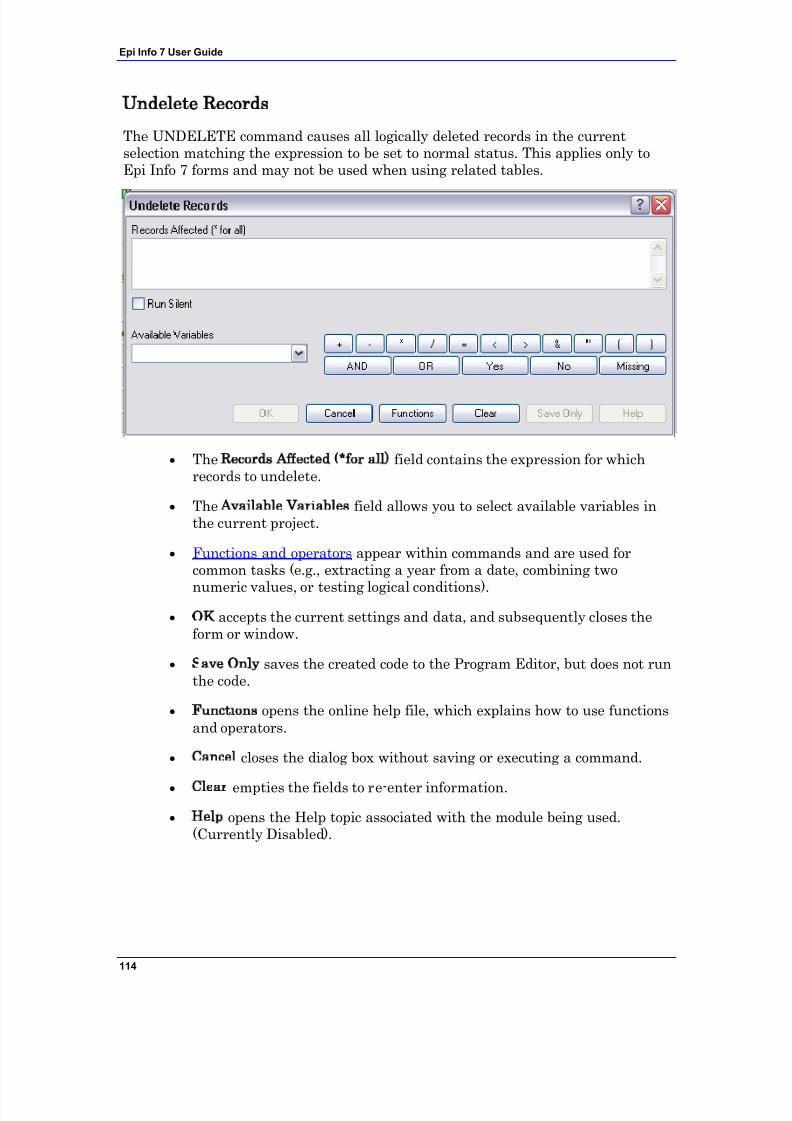
7/14/2019 Epi Info 7 User Guide-V1.0 Cleared
http://slidepdf.com/reader/full/epi-info-7-user-guide-v10-cleared-563109dd5013b 120/368
Epi Info 7 User Guide
114
Undelete Records
The UNDELETE command causes all logically deleted records in the currentselection matching the expression to be set to normal status. This applies only toEpi Info 7 forms and may not be used when using related tables.
The Records Affected (*for all) field contains the expression for whichrecords to undelete.
The Available Variables field allows you to select available variables inthe current project.
Functions and operators appear within commands and are used forcommon tasks (e.g., extracting a year from a date, combining two
numeric values, or testing logical conditions).
OK accepts the current settings and data, and subsequently closes theform or window.
Save Only saves the created code to the Program Editor, but does not runthe code.
Functions opens the online help file, which explains how to use functionsand operators.
Cancel closes the dialog box without saving or executing a command.
Clear empties the fields to re-enter information.
Help opens the Help topic associated with the module being used.(Currently Disabled).
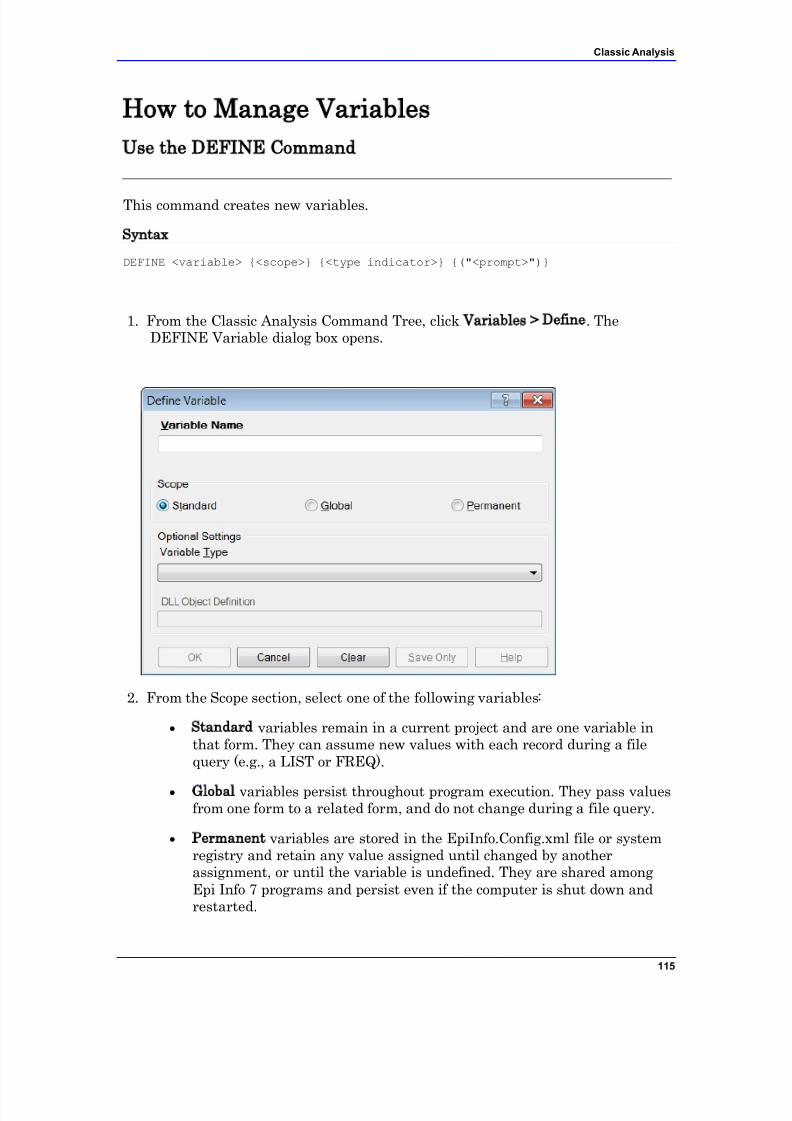
7/14/2019 Epi Info 7 User Guide-V1.0 Cleared
http://slidepdf.com/reader/full/epi-info-7-user-guide-v10-cleared-563109dd5013b 121/368
Classic Analysis
115
How to Manage Variables
Use the DEFINE Command
This command creates new variables.
Syntax
DEFINE <variable> {<scope>} {<type indicator>} {("<prompt>")}
1. From the Classic Analysis Command Tree, click Variables > Define. TheDEFINE Variable dialog box opens.
2. From the Scope section, select one of the following variables:
Standard variables remain in a current project and are one variable inthat form. They can assume new values with each record during a filequery (e.g., a LIST or FREQ).
Global variables persist throughout program execution. They pass valuesfrom one form to a related form, and do not change during a file query.
Permanent variables are stored in the EpiInfo.Config.xml file or systemregistry and retain any value assigned until changed by anotherassignment, or until the variable is undefined. They are shared amongEpi Info 7 programs and persist even if the computer is shut down andrestarted.
7/14/2019 Epi Info 7 User Guide-V1.0 Cleared
http://slidepdf.com/reader/full/epi-info-7-user-guide-v10-cleared-563109dd5013b 122/368
Epi Info 7 User Guide
116
3. From the Variable Type drop-down list, select one of the following types: Date,Numeric, Text, or Yes-No.
4. Optional: Variable Type is required and cannot be used if <scope> is omitted.<type indicator> is the data type of the new variable and must be one of thefollowing reserved words: NUMERIC, TEXTINPUT, YN, or DATEFORMAT. If
omitted, the variable type will be inferred based on the data type of the firstvalue assigned to the variable. However, omitting field type is notrecommended.
5. Click OK.
Define a Group
To define a group, take the following steps:
1. From the Classic Analysis Command Tree, click Variables > Define Group. TheDEFINE GROUP dialog box opens.
2. In the Group Variable field, type a name.
3. From the Variables list box, select the variables to be included in the group.
4. Click OK.
Convert a Number to Text
Numbers can be converted to text using the FORMAT function. FORMAT changesthe format of one variable type to another.
Syntax
FORMAT(<variable>, {"<format specifcation>"})
Example
The Format function can be used to convert a numeric postal code or zip code fieldto a text type variable for mapping.
The READ command opens a new file that contains a numeric field calledzipcode. To use Epi Map with the zipcode values, change the values to text.
The DEFINE command creates a new variable called NewZip. The variableNewZip will hold the values of zipcode in a text format. The code appears inthe Program Editor as DEFINE NewZip.
7/14/2019 Epi Info 7 User Guide-V1.0 Cleared
http://slidepdf.com/reader/full/epi-info-7-user-guide-v10-cleared-563109dd5013b 123/368
Classic Analysis
117
The ASSIGN command formats the variable NewZip with the values of ZipCode and the format of text. Text values are enclosed in quotes. The codeappears in the Program Editor as:
ASSIGN NewZip=FORMAT(ZipCode,"00000")
The variable NewZip can now be used as a geographic variable in Epi Mapbecause it is a text type variable that contains numeric data.
Try It
For this example, use the Classic Analysis Program Editor to create the code.
1. Read in the Sample.PRJ project. Open Oswego. Seventy five (75) records shouldbe listed in the Output window.
2. In the Program Editor window, place the cursor under the created Read
command. Type DEFINE MyAge TEXTINPUT
Do not press the Enter key. Leave your cursor on the line of code you justcreated.
3. In the Program Editor window, type the following: ASSIGN MyAge = FORMAT(Age, "00").
4. From the Program Editor navigation menu, click Run Commands. The code willturn gray to indicate a syntax review.
5. From the Classic Analysis Command Tree, click Statistics > List. Click OK. Therecords appear.
Notice that the values in „MyAge‟ are all two characters with a leading „0‟before each single digit year. The leading zero is present because of the„00‟ format specification.
7. From the Classic Analysis Command Tree, click Variables > Display. Click OK.The variable types appear.
The variable MyAge now contains the values of Age and the format typeof Text.

7/14/2019 Epi Info 7 User Guide-V1.0 Cleared
http://slidepdf.com/reader/full/epi-info-7-user-guide-v10-cleared-563109dd5013b 124/368
Epi Info 7 User Guide
118
Use IF Statements with Permanent or Global Variables
If the condition of an IF statement depends on global or permanentvariables, the value is computed immediately and only the true or false
branch, as appropriate, is followed. If the condition of an IF statement depends on a field variable, neither
branch is followed. However, computations within the branches are savedfor execution as appropriate on each record. In the second case, non-computational commands (e.g., READ, SELECT, SORT, HEADER, andROUTEOUT) are never executed.
7/14/2019 Epi Info 7 User Guide-V1.0 Cleared
http://slidepdf.com/reader/full/epi-info-7-user-guide-v10-cleared-563109dd5013b 125/368
Classic Analysis
119
Handle Date Fields
Date formats are often determined by default computer settings. To access RegionalSettings in a Windows environment, click Start > Control Panel > Regional and
Language Options. Date fields in forms are entered in European, American, or ISO format as
specified in Form Designer. They are stored in the database in a neutralformat.
Date fields in Excel, and Text files are read into Classic Analysisaccording to the date format found in Regional Settings, and stored in aneutral format. Excel files prepared with one date format often do notimport properly on machines with a different date format.
Date fields in forms are displayed in European, American, or ISO formatas specified in Form Designer by the following Classic Analysiscommands: LIST, LIST GRIDTABLE, TABLES, and FREQ.
Date fields in forms are displayed according to the date format found inRegional Settings in the following Classic Analysis commands: DISPLAY,and GRAPH.
Date fields in tables without forms are displayed according to the dateformat found in Regional Settings.
Date fields written to Excel or Text files are written according to the dateformat in Regional Settings.
Date literals in Form Designer, Check Code, or Classic AnalysisPrograms; and date-type permanent variables in the EpiInfo.Config.xmlfile, should be in American format unless enclosed in braces or pipesymbols. European date format (DD/MM/YYYY) literals must be enclosedin braces (i.e., {23/11/2007}). ISO date literals (YYYY/MM/DD) must beenclosed in pipe symbols (i.e.,|.,2007/11/23|.
Dates formatted with the FORMAT function are formatted according tothe date format found in Regional Settings when no format is specified asa second argument.
Dates converted from text with TXTTODATE are converted to a neutral
format according to the date format found in Regional Settings. Formulti-national applications, it may be safer to use the NUMTODATEfunction.
If you are not sure, conduct experiments and examine the results.
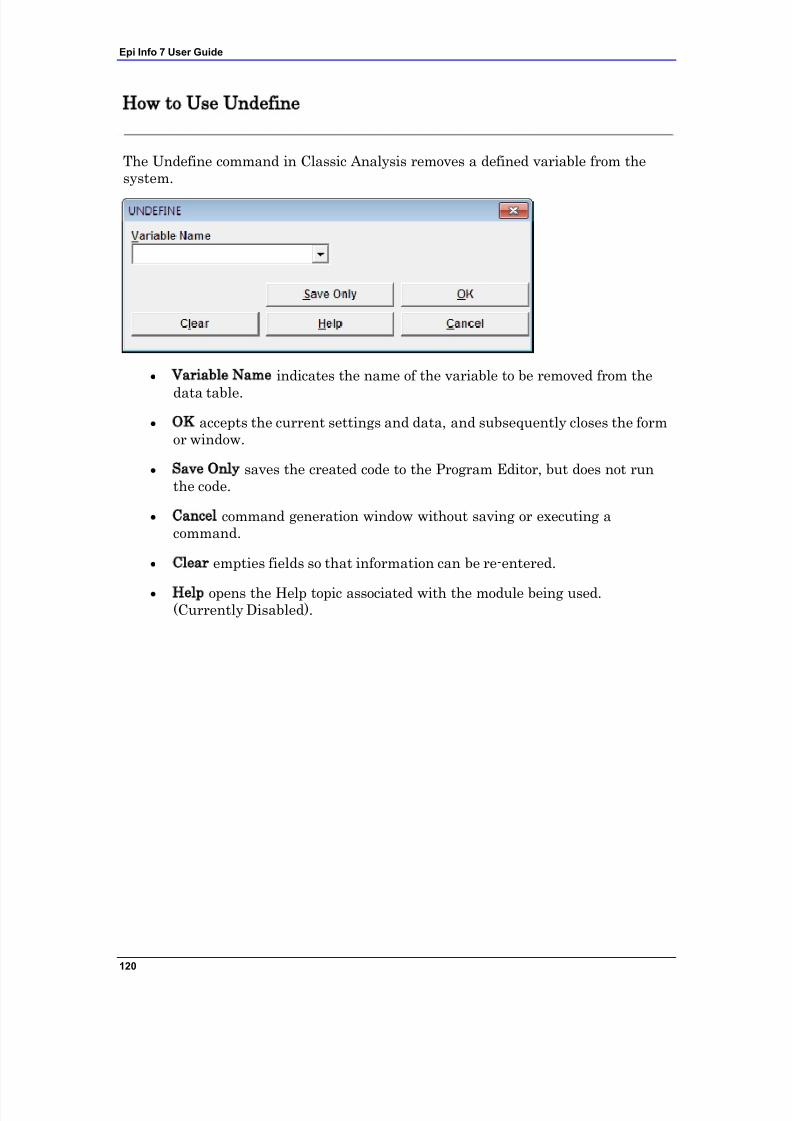
7/14/2019 Epi Info 7 User Guide-V1.0 Cleared
http://slidepdf.com/reader/full/epi-info-7-user-guide-v10-cleared-563109dd5013b 126/368
Epi Info 7 User Guide
120
How to Use Undefine
The Undefine command in Classic Analysis removes a defined variable from thesystem.
Variable Name indicates the name of the variable to be removed from the
data table.
OK accepts the current settings and data, and subsequently closes the formor window.
Save Only saves the created code to the Program Editor, but does not runthe code.
Cancel command generation window without saving or executing acommand.
Clear empties fields so that information can be re-entered.
Help opens the Help topic associated with the module being used.(Currently Disabled).
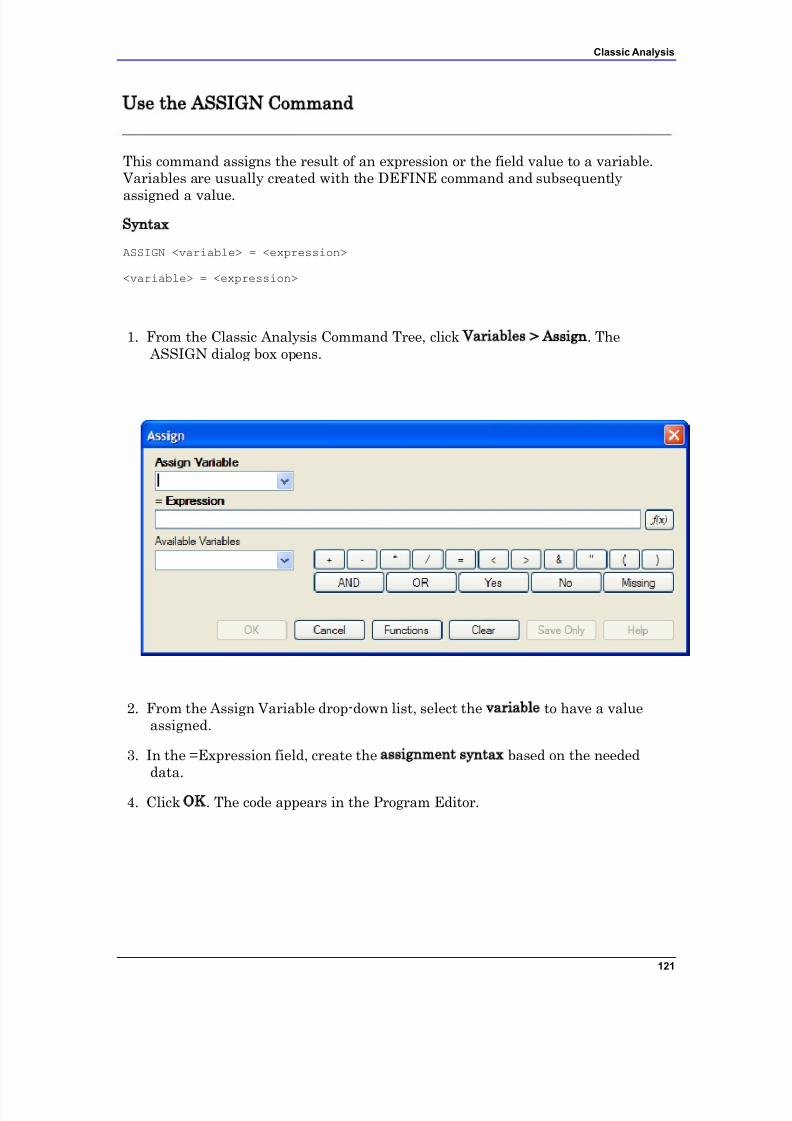
7/14/2019 Epi Info 7 User Guide-V1.0 Cleared
http://slidepdf.com/reader/full/epi-info-7-user-guide-v10-cleared-563109dd5013b 127/368
Classic Analysis
121
Use the ASSIGN Command
This command assigns the result of an expression or the field value to a variable. Variables are usually created with the DEFINE command and subsequently
assigned a value.
Syntax
ASSIGN <variable> = <expression>
<variable> = <expression>
1. From the Classic Analysis Command Tree, click Variables > Assign. The ASSIGN dialog box opens.
2. From the Assign Variable drop-down list, select the variable to have a valueassigned.
3. In the =Expression field, create the assignment syntax based on the neededdata.
4. Click OK. The code appears in the Program Editor.
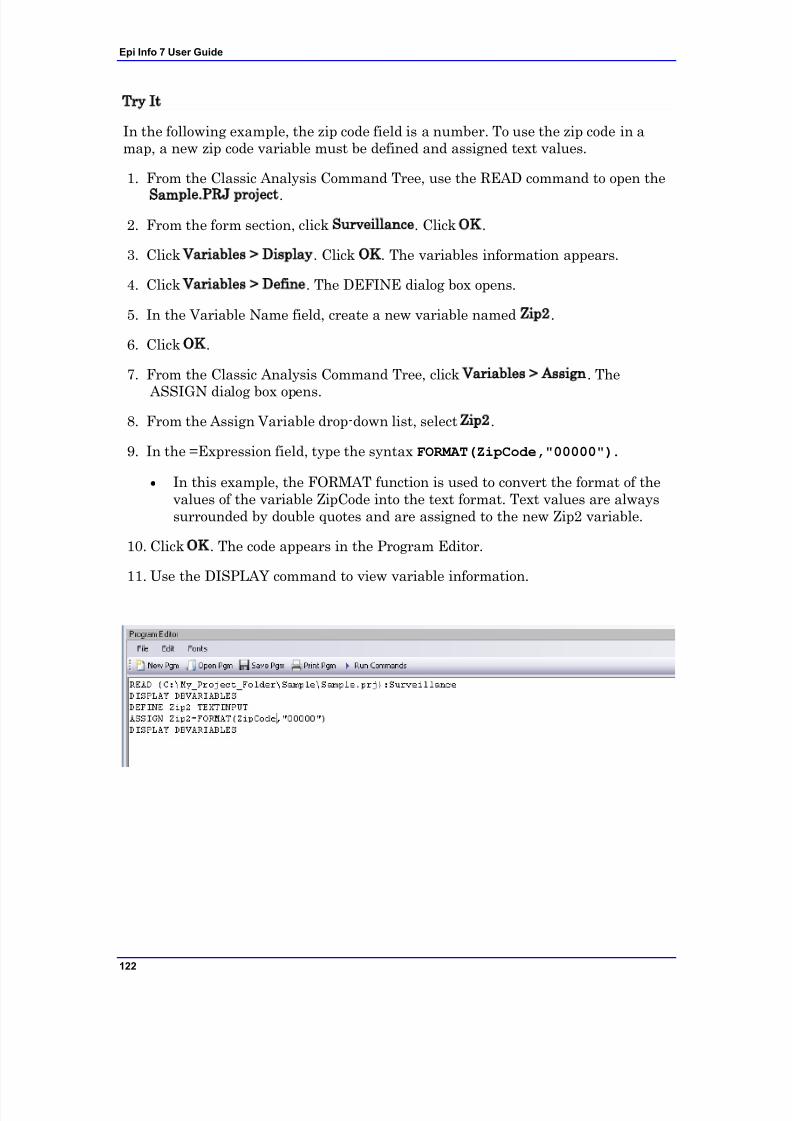
7/14/2019 Epi Info 7 User Guide-V1.0 Cleared
http://slidepdf.com/reader/full/epi-info-7-user-guide-v10-cleared-563109dd5013b 128/368
Epi Info 7 User Guide
122
Try It
In the following example, the zip code field is a number. To use the zip code in amap, a new zip code variable must be defined and assigned text values.
1. From the Classic Analysis Command Tree, use the READ command to open the
Sample.PRJ project.
2. From the form section, click Surveillance. Click OK.
3. Click Variables > Display. Click OK. The variables information appears.
4. Click Variables > Define. The DEFINE dialog box opens.
5. In the Variable Name field, create a new variable named Zip2.
6. Click OK.
7. From the Classic Analysis Command Tree, click Variables > Assign. The
ASSIGN dialog box opens.
8. From the Assign Variable drop-down list, select Zip2.
9. In the =Expression field, type the syntax FORMAT(ZipCode,"00000").
In this example, the FORMAT function is used to convert the format of thevalues of the variable ZipCode into the text format. Text values are alwayssurrounded by double quotes and are assigned to the new Zip2 variable.
10. Click OK. The code appears in the Program Editor.
11. Use the DISPLAY command to view variable information.
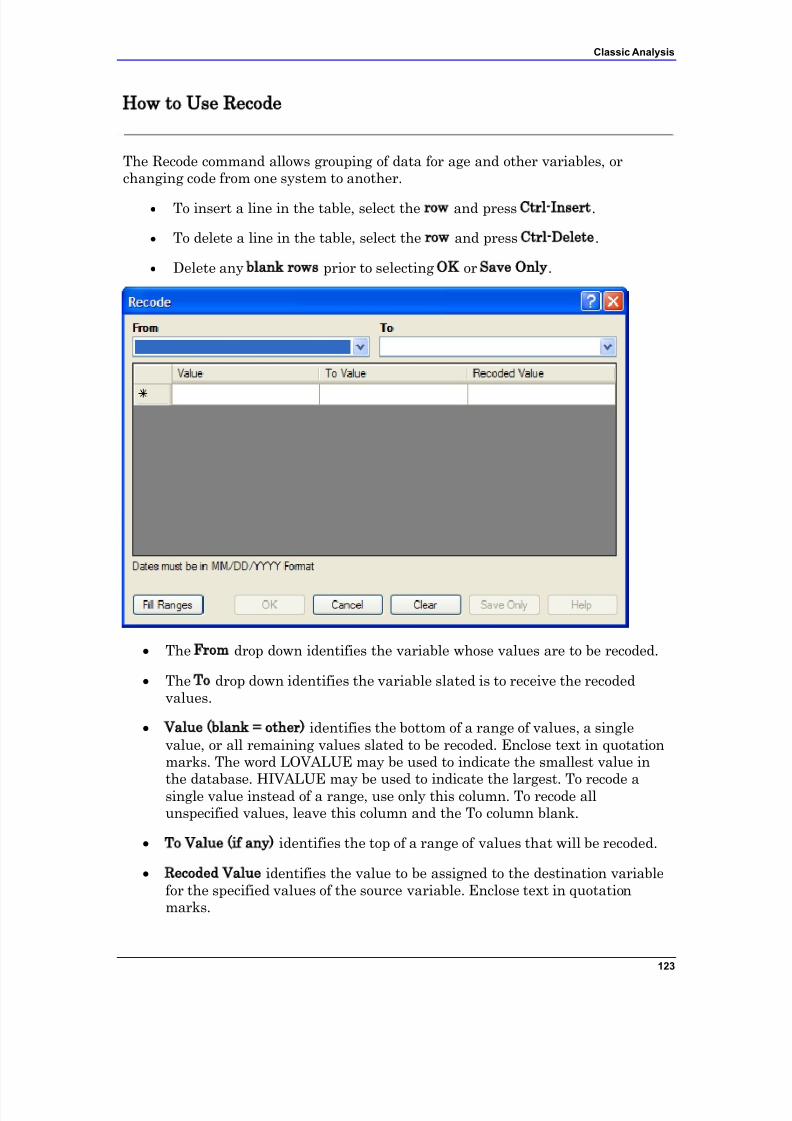
7/14/2019 Epi Info 7 User Guide-V1.0 Cleared
http://slidepdf.com/reader/full/epi-info-7-user-guide-v10-cleared-563109dd5013b 129/368
Classic Analysis
123
How to Use Recode
The Recode command allows grouping of data for age and other variables, orchanging code from one system to another.
To insert a line in the table, select the row and press Ctrl-Insert.
To delete a line in the table, select the row and press Ctrl-Delete.
Delete any blank rows prior to selecting OK or Save Only.
The From drop down identifies the variable whose values are to be recoded.
The To drop down identifies the variable slated is to receive the recodedvalues.
Value (blank = other) identifies the bottom of a range of values, a singlevalue, or all remaining values slated to be recoded. Enclose text in quotationmarks. The word LOVALUE may be used to indicate the smallest value in
the database. HIVALUE may be used to indicate the largest. To recode asingle value instead of a range, use only this column. To recode allunspecified values, leave this column and the To column blank.
To Value (if any) identifies the top of a range of values that will be recoded.
Recoded Value identifies the value to be assigned to the destination variablefor the specified values of the source variable. Enclose text in quotationmarks.

7/14/2019 Epi Info 7 User Guide-V1.0 Cleared
http://slidepdf.com/reader/full/epi-info-7-user-guide-v10-cleared-563109dd5013b 130/368
Epi Info 7 User Guide
124
Fill Ranges allows you to redefine recoded ranges of equaldistribution.
OK accepts the current settings and data, and closes the form orwindow.
Save Only saves the created code to the Program Editor, but does notrun the code.
Cancel command generation window without saving or executing acommand.
Clear empties fields so information can be re-entered.
Help opens the Help topic associated with the module being used.(Currently Disabled).
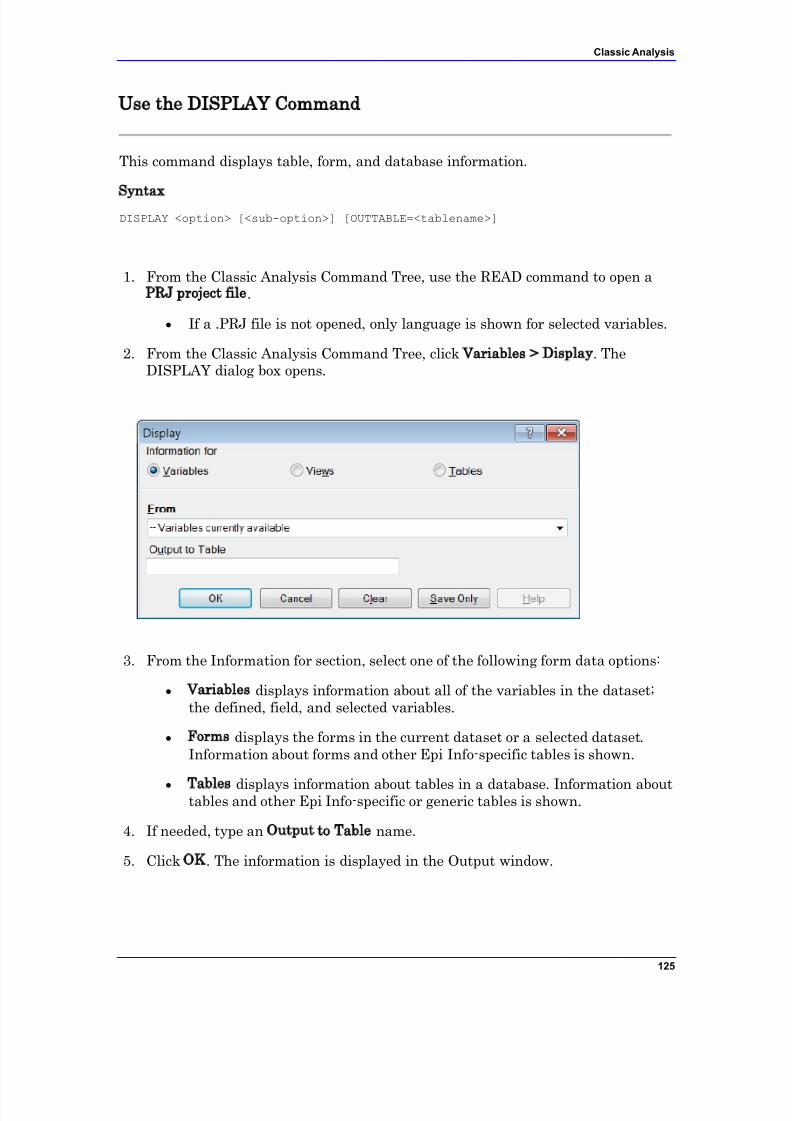
7/14/2019 Epi Info 7 User Guide-V1.0 Cleared
http://slidepdf.com/reader/full/epi-info-7-user-guide-v10-cleared-563109dd5013b 131/368
Classic Analysis
125
Use the DISPLAY Command
This command displays table, form, and database information.
SyntaxDISPLAY <option> [<sub-option>] [OUTTABLE=<tablename>]
1. From the Classic Analysis Command Tree, use the READ command to open aPRJ project file.
If a .PRJ file is not opened, only language is shown for selected variables.
2. From the Classic Analysis Command Tree, click Variables > Display. TheDISPLAY dialog box opens.
3. From the Information for section, select one of the following form data options:
Variables displays information about all of the variables in the dataset;the defined, field, and selected variables.
Forms displays the forms in the current dataset or a selected dataset.Information about forms and other Epi Info-specific tables is shown.
Tables displays information about tables in a database. Information abouttables and other Epi Info-specific or generic tables is shown.
4. If needed, type an Output to Table name.
5. Click OK. The information is displayed in the Output window.
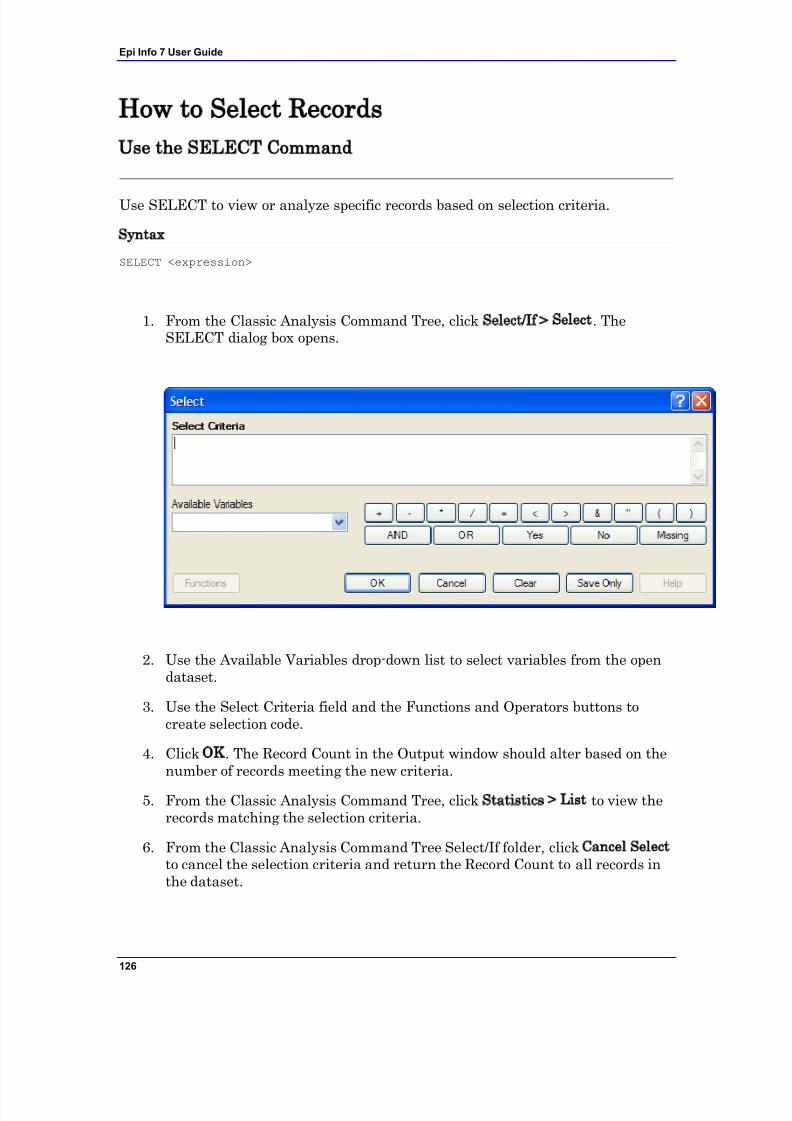
7/14/2019 Epi Info 7 User Guide-V1.0 Cleared
http://slidepdf.com/reader/full/epi-info-7-user-guide-v10-cleared-563109dd5013b 132/368
Epi Info 7 User Guide
126
How to Select Records
Use the SELECT Command
Use SELECT to view or analyze specific records based on selection criteria.
Syntax
SELECT <expression>
1. From the Classic Analysis Command Tree, click Select/If > Select. TheSELECT dialog box opens.
2. Use the Available Variables drop-down list to select variables from the opendataset.
3. Use the Select Criteria field and the Functions and Operators buttons tocreate selection code.
4. Click OK. The Record Count in the Output window should alter based on thenumber of records meeting the new criteria.
5. From the Classic Analysis Command Tree, click Statistics > List to view therecords matching the selection criteria.
6. From the Classic Analysis Command Tree Select/If folder, click Cancel Select to cancel the selection criteria and return the Record Count to all records inthe dataset.
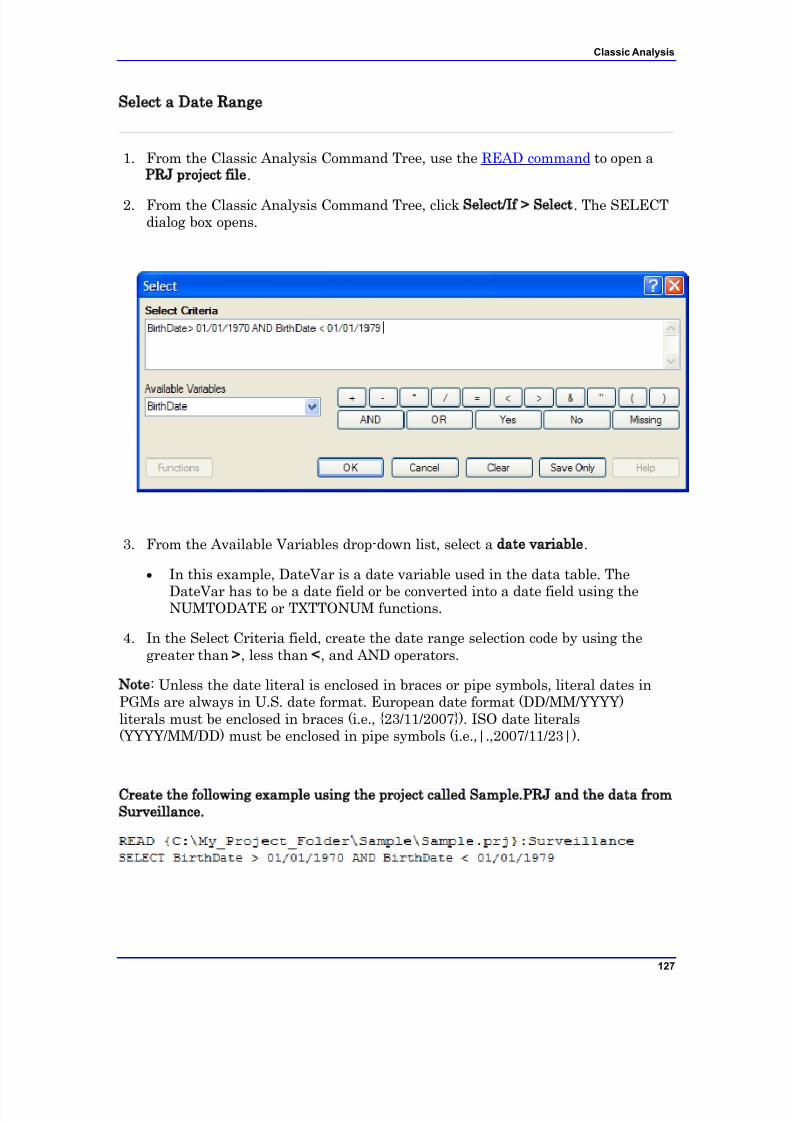
7/14/2019 Epi Info 7 User Guide-V1.0 Cleared
http://slidepdf.com/reader/full/epi-info-7-user-guide-v10-cleared-563109dd5013b 133/368
Classic Analysis
127
Select a Date Range
1. From the Classic Analysis Command Tree, use the READ command to open aPRJ project file.
2. From the Classic Analysis Command Tree, click Select/If > Select. The SELECTdialog box opens.
3. From the Available Variables drop-down list, select a date variable.
In this example, DateVar is a date variable used in the data table. The
DateVar has to be a date field or be converted into a date field using theNUMTODATE or TXTTONUM functions.
4. In the Select Criteria field, create the date range selection code by using thegreater than >, less than <, and AND operators.
Note: Unless the date literal is enclosed in braces or pipe symbols, literal dates inPGMs are always in U.S. date format. European date format (DD/MM/YYYY)literals must be enclosed in braces (i.e., {23/11/2007}). ISO date literals(YYYY/MM/DD) must be enclosed in pipe symbols (i.e.,|.,2007/11/23|).
Create the following example using the project called Sample.PRJ and the data fromSurveillance.
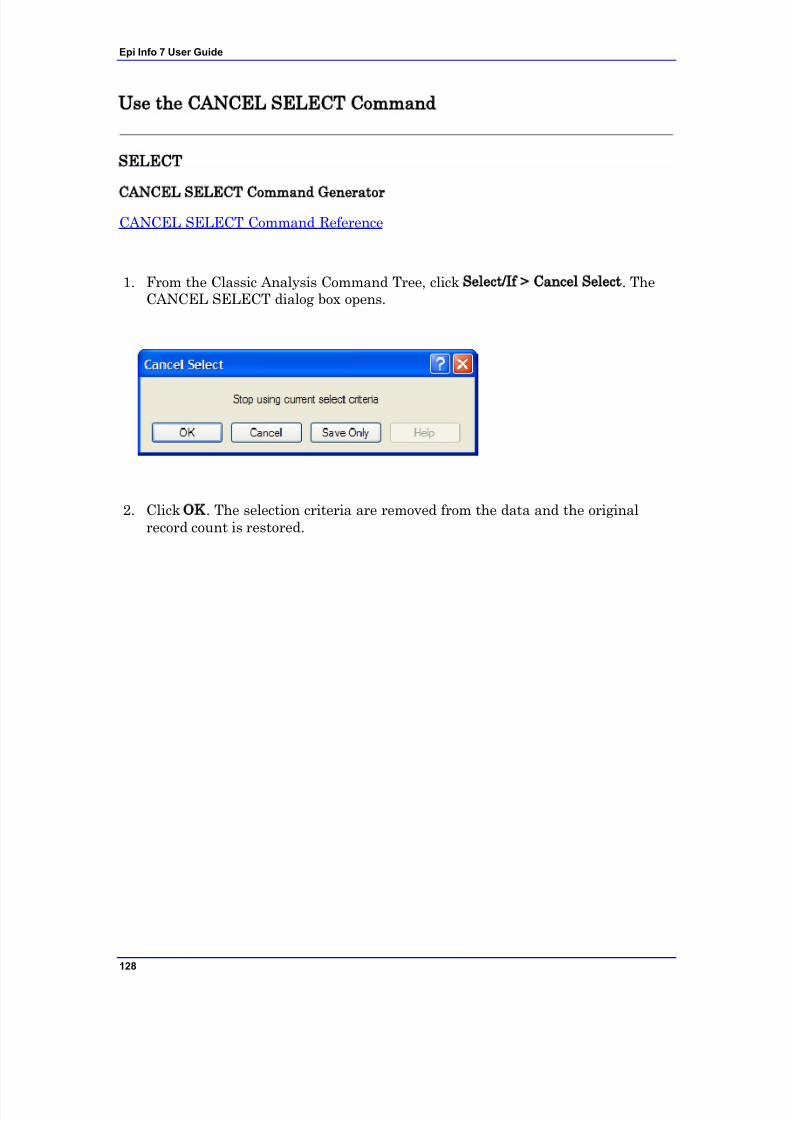
7/14/2019 Epi Info 7 User Guide-V1.0 Cleared
http://slidepdf.com/reader/full/epi-info-7-user-guide-v10-cleared-563109dd5013b 134/368
Epi Info 7 User Guide
128
Use the CANCEL SELECT Command
SELECT
CANCEL SELECT Command Generator
CANCEL SELECT Command Reference
1. From the Classic Analysis Command Tree, click Select/If > Cancel Select. TheCANCEL SELECT dialog box opens.
2. Click OK. The selection criteria are removed from the data and the originalrecord count is restored.
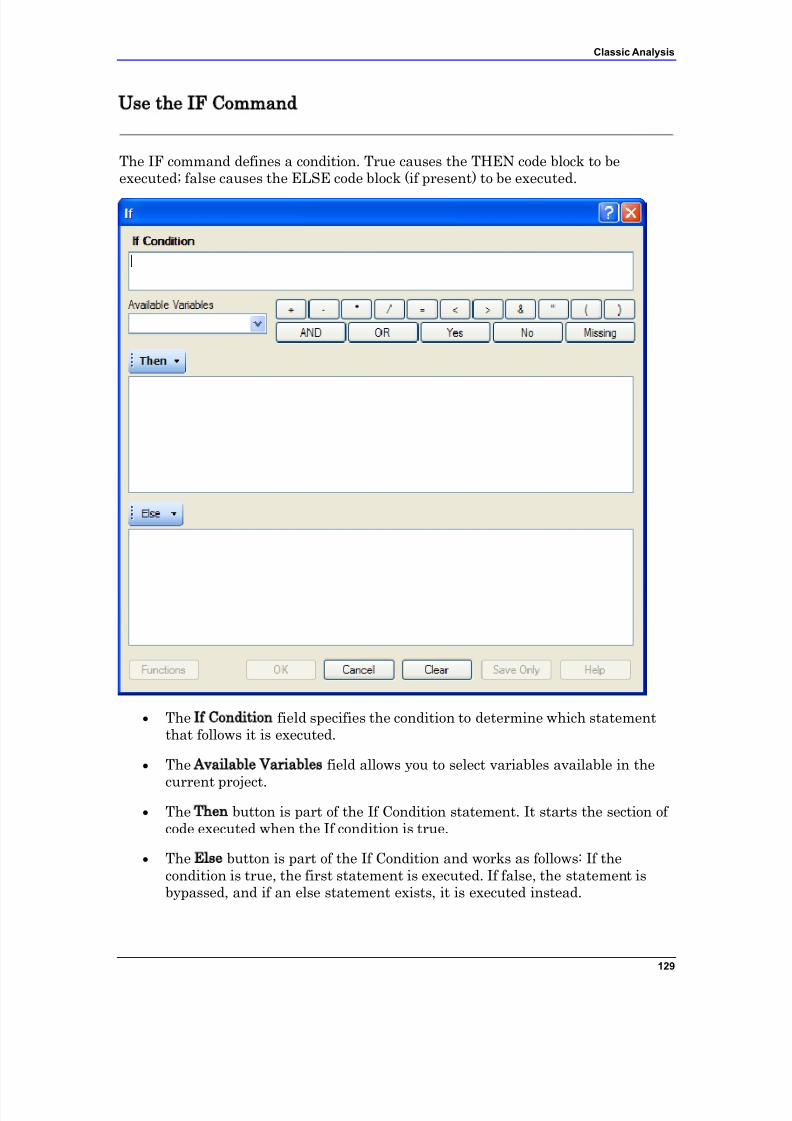
7/14/2019 Epi Info 7 User Guide-V1.0 Cleared
http://slidepdf.com/reader/full/epi-info-7-user-guide-v10-cleared-563109dd5013b 135/368
Classic Analysis
129
Use the IF Command
The IF command defines a condition. True causes the THEN code block to beexecuted; false causes the ELSE code block (if present) to be executed.
The If Condition field specifies the condition to determine which statementthat follows it is executed.
The Available Variables field allows you to select variables available in the
current project. The Then button is part of the If Condition statement. It starts the section of
code executed when the If condition is true.
The Else button is part of the If Condition and works as follows: If thecondition is true, the first statement is executed. If false, the statement isbypassed, and if an else statement exists, it is executed instead.
7/14/2019 Epi Info 7 User Guide-V1.0 Cleared
http://slidepdf.com/reader/full/epi-info-7-user-guide-v10-cleared-563109dd5013b 136/368
Epi Info 7 User Guide
130
Functions and operators appear within commands and are used forcommon tasks (e.g., extracting a year from a date, combining twonumeric values, or testing logical conditions).
OK accepts the current settings and data, and subsequently closes theform or window.
Save Only saves the created code to the Program Editor, but does not runthe code.
Functions opens the online Help file which explains the functions andoperators. (Currently Disabled).
Cancel closes the dialog box without saving or executing a command.
Clear empties the fields so information can be re-entered.
Help opens the Help topic associated with the module being used.(Currently Disabled).
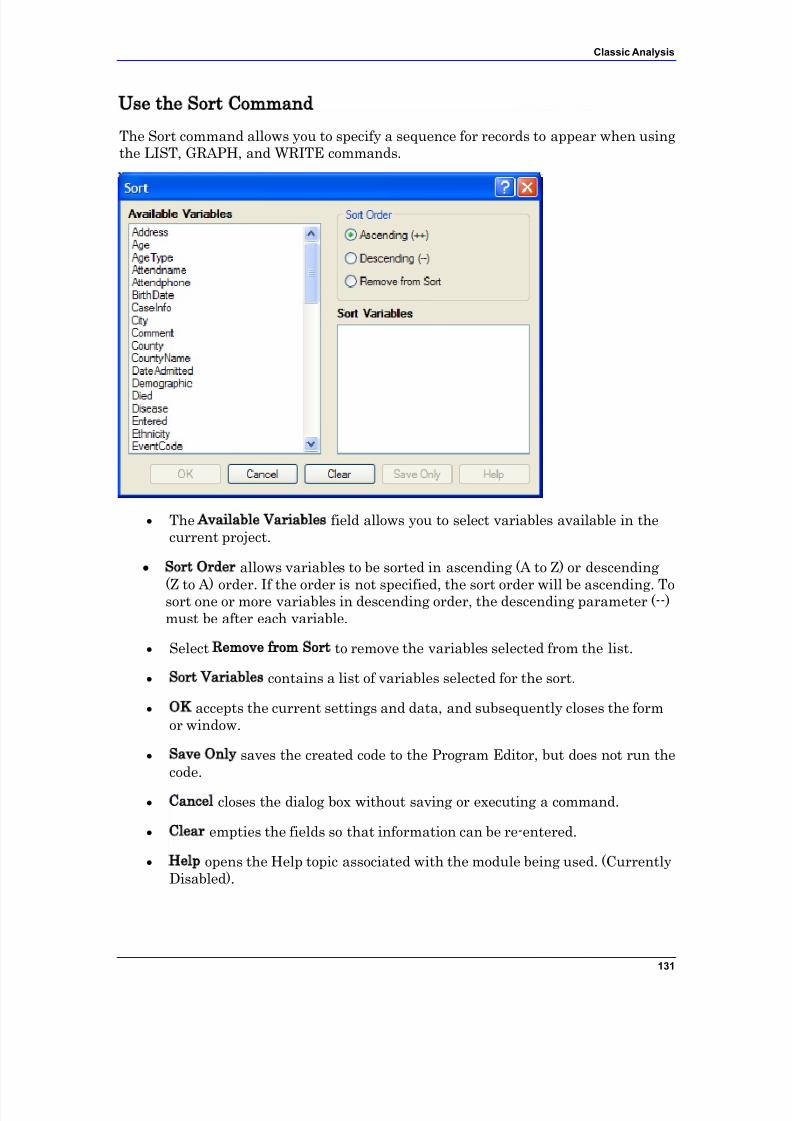
7/14/2019 Epi Info 7 User Guide-V1.0 Cleared
http://slidepdf.com/reader/full/epi-info-7-user-guide-v10-cleared-563109dd5013b 137/368
Classic Analysis
131
Use the Sort Command
The Sort command allows you to specify a sequence for records to appear when usingthe LIST, GRAPH, and WRITE commands.
The Available Variables field allows you to select variables available in thecurrent project.
Sort Order allows variables to be sorted in ascending (A to Z) or descending
(Z to A) order. If the order is not specified, the sort order will be ascending. Tosort one or more variables in descending order, the descending parameter (--)must be after each variable.
Select Remove from Sort to remove the variables selected from the list.
Sort Variables contains a list of variables selected for the sort.
OK accepts the current settings and data, and subsequently closes the formor window.
Save Only saves the created code to the Program Editor, but does not run thecode.
Cancel closes the dialog box without saving or executing a command.
Clear empties the fields so that information can be re-entered.
Help opens the Help topic associated with the module being used. (CurrentlyDisabled).
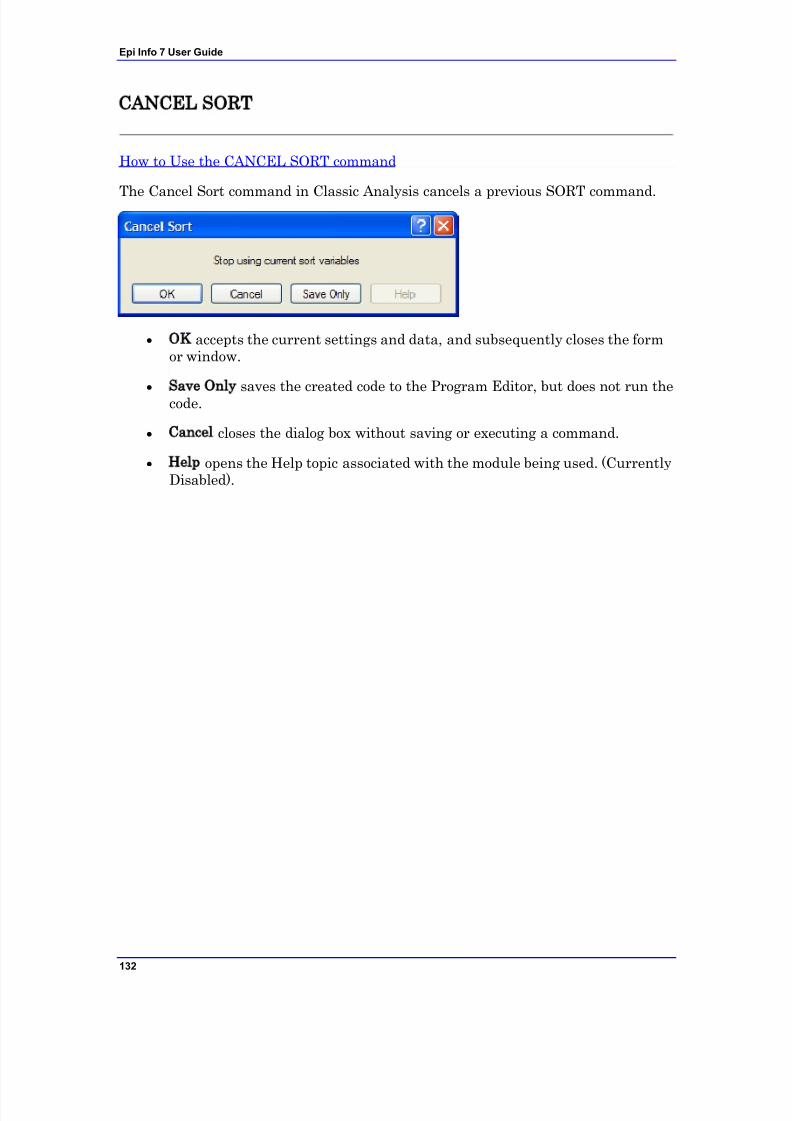
7/14/2019 Epi Info 7 User Guide-V1.0 Cleared
http://slidepdf.com/reader/full/epi-info-7-user-guide-v10-cleared-563109dd5013b 138/368
Epi Info 7 User Guide
132
CANCEL SORT
How to Use the CANCEL SORT command
The Cancel Sort command in Classic Analysis cancels a previous SORT command.
OK accepts the current settings and data, and subsequently closes the formor window.
Save Only saves the created code to the Program Editor, but does not run thecode.
Cancel closes the dialog box without saving or executing a command.
Help opens the Help topic associated with the module being used. (CurrentlyDisabled).
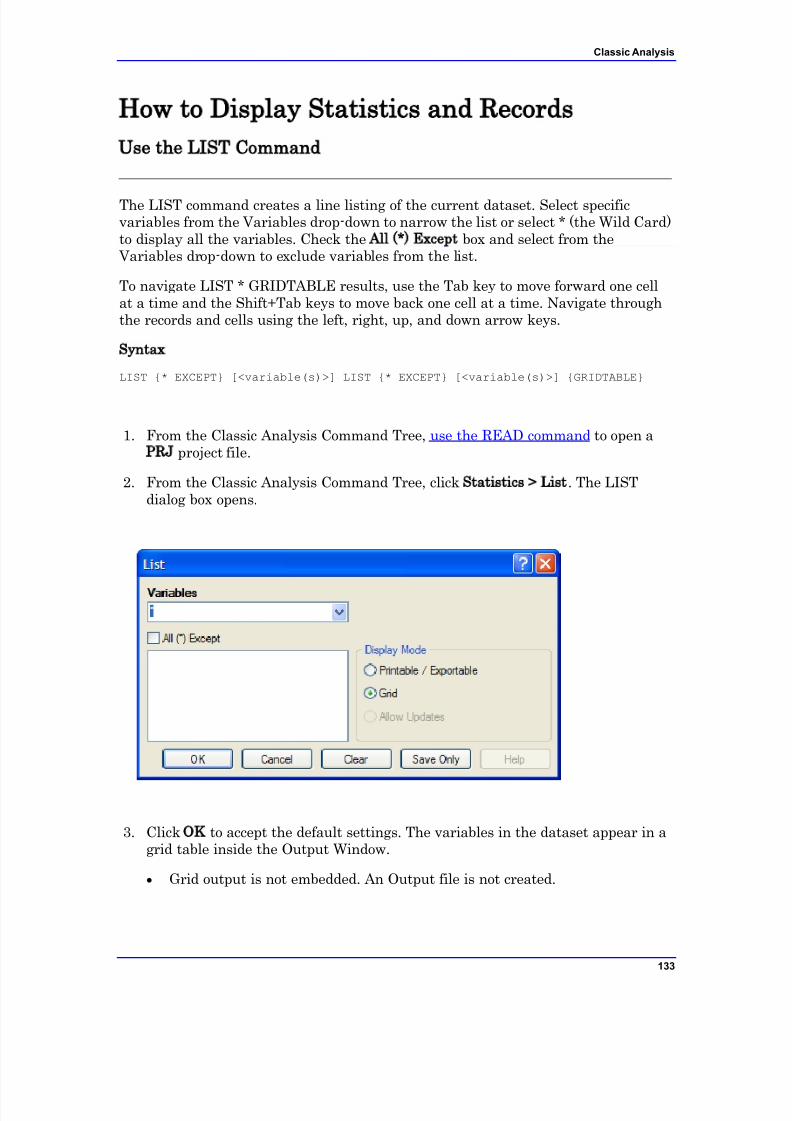
7/14/2019 Epi Info 7 User Guide-V1.0 Cleared
http://slidepdf.com/reader/full/epi-info-7-user-guide-v10-cleared-563109dd5013b 139/368
Classic Analysis
133
How to Display Statistics and Records
Use the LIST Command
The LIST command creates a line listing of the current dataset. Select specificvariables from the Variables drop-down to narrow the list or select * (the Wild Card)to display all the variables. Check the All (*) Except box and select from the
Variables drop-down to exclude variables from the list.
To navigate LIST * GRIDTABLE results, use the Tab key to move forward one cellat a time and the Shift+Tab keys to move back one cell at a time. Navigate throughthe records and cells using the left, right, up, and down arrow keys.
Syntax
LIST {* EXCEPT} [<variable(s)>] LIST {* EXCEPT} [<variable(s)>] {GRIDTABLE}
1. From the Classic Analysis Command Tree, use the READ command to open aPRJ project file.
2. From the Classic Analysis Command Tree, click Statistics > List. The LISTdialog box opens.
3. Click OK to accept the default settings. The variables in the dataset appear in agrid table inside the Output Window.
Grid output is not embedded. An Output file is not created.
7/14/2019 Epi Info 7 User Guide-V1.0 Cleared
http://slidepdf.com/reader/full/epi-info-7-user-guide-v10-cleared-563109dd5013b 140/368
Epi Info 7 User Guide
134
Create a Web Format List
1. From the Classic Analysis Command Tree, click Statistics > List. The LISTdialog box opens.
2. From the Display Mode section, select the Printable / Exportable radio button.
3. Click OK. The List appears in the Output window in a web table format. Webdisplay mode creates an embedded output file.
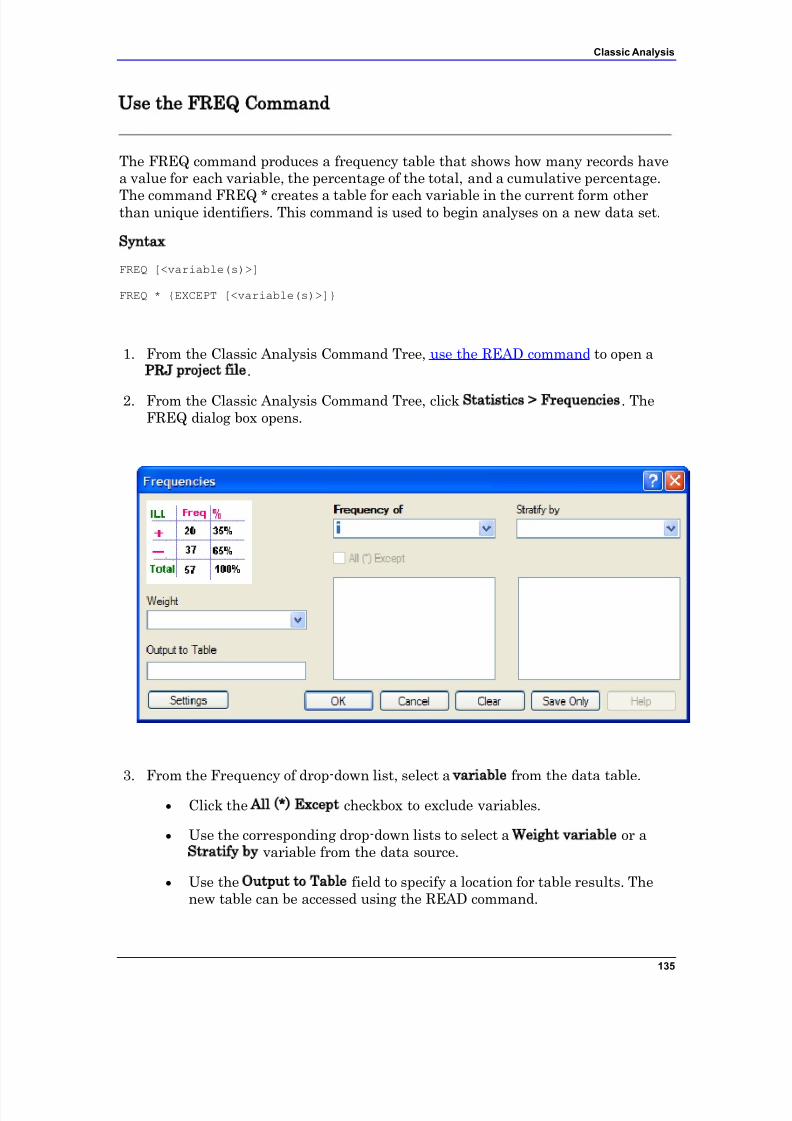
7/14/2019 Epi Info 7 User Guide-V1.0 Cleared
http://slidepdf.com/reader/full/epi-info-7-user-guide-v10-cleared-563109dd5013b 141/368
Classic Analysis
135
Use the FREQ Command
The FREQ command produces a frequency table that shows how many records havea value for each variable, the percentage of the total, and a cumulative percentage.
The command FREQ * creates a table for each variable in the current form otherthan unique identifiers. This command is used to begin analyses on a new data set.
Syntax
FREQ [<variable(s)>]
FREQ * {EXCEPT [<variable(s)>]}
1. From the Classic Analysis Command Tree, use the READ command to open aPRJ project file.
2. From the Classic Analysis Command Tree, click Statistics > Frequencies. TheFREQ dialog box opens.
3. From the Frequency of drop-down list, select a variable from the data table.
Click the All (*) Except checkbox to exclude variables.
Use the corresponding drop-down lists to select a Weight variable or aStratify by variable from the data source.
Use the Output to Table field to specify a location for table results. Thenew table can be accessed using the READ command.
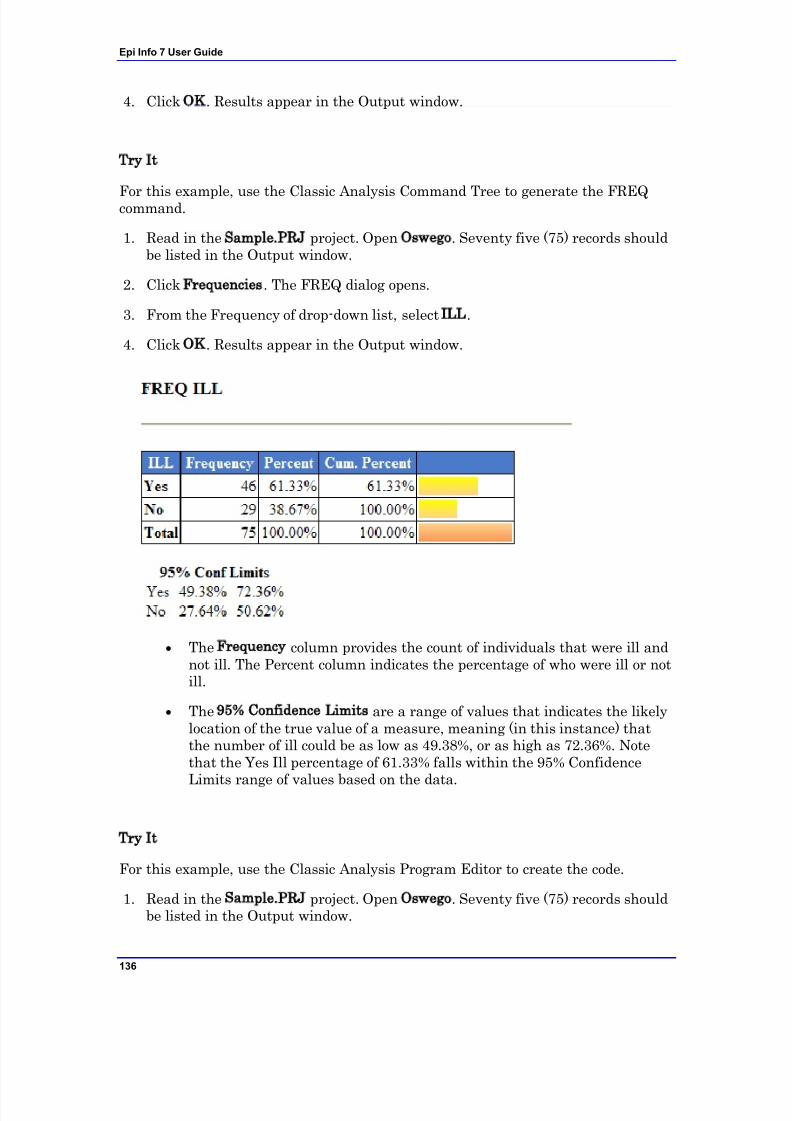
7/14/2019 Epi Info 7 User Guide-V1.0 Cleared
http://slidepdf.com/reader/full/epi-info-7-user-guide-v10-cleared-563109dd5013b 142/368
Epi Info 7 User Guide
136
4. Click OK. Results appear in the Output window.
Try It
For this example, use the Classic Analysis Command Tree to generate the FREQcommand.
1. Read in the Sample.PRJ project. Open Oswego. Seventy five (75) records shouldbe listed in the Output window.
2. Click Frequencies. The FREQ dialog opens.
3. From the Frequency of drop-down list, select ILL.
4. Click OK. Results appear in the Output window.
The Frequency column provides the count of individuals that were ill andnot ill. The Percent column indicates the percentage of who were ill or notill.
The 95% Confidence Limits are a range of values that indicates the likelylocation of the true value of a measure, meaning (in this instance) thatthe number of ill could be as low as 49.38%, or as high as 72.36%. Notethat the Yes Ill percentage of 61.33% falls within the 95% Confidence
Limits range of values based on the data.
Try It
For this example, use the Classic Analysis Program Editor to create the code.
1. Read in the Sample.PRJ project. Open Oswego. Seventy five (75) records shouldbe listed in the Output window.
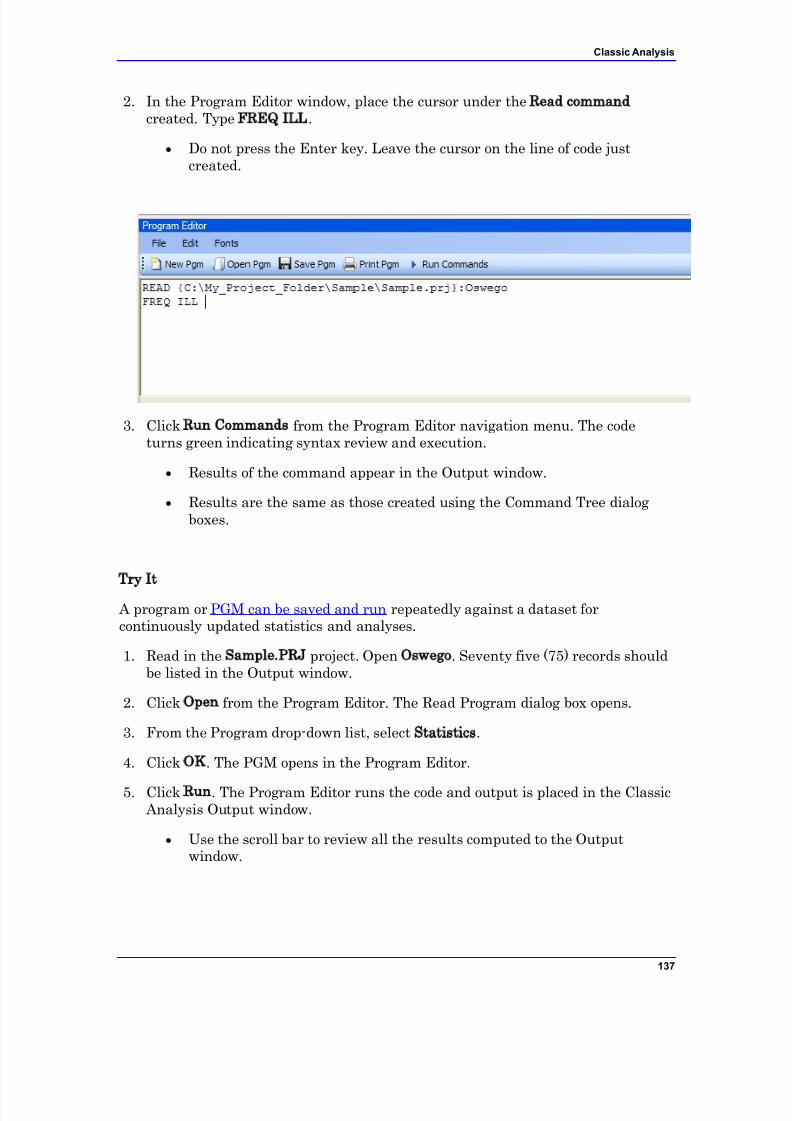
7/14/2019 Epi Info 7 User Guide-V1.0 Cleared
http://slidepdf.com/reader/full/epi-info-7-user-guide-v10-cleared-563109dd5013b 143/368
Classic Analysis
137
2. In the Program Editor window, place the cursor under the Read command created. Type FREQ ILL.
Do not press the Enter key. Leave the cursor on the line of code justcreated.
3. Click Run Commands from the Program Editor navigation menu. The codeturns green indicating syntax review and execution.
Results of the command appear in the Output window.
Results are the same as those created using the Command Tree dialogboxes.
Try It
A program or PGM can be saved and run repeatedly against a dataset forcontinuously updated statistics and analyses.
1. Read in the Sample.PRJ project. Open Oswego. Seventy five (75) records shouldbe listed in the Output window.
2. Click Open from the Program Editor. The Read Program dialog box opens.
3. From the Program drop-down list, select Statistics.
4. Click OK. The PGM opens in the Program Editor.
5. Click Run. The Program Editor runs the code and output is placed in the Classic Analysis Output window.
Use the scroll bar to review all the results computed to the Outputwindow.
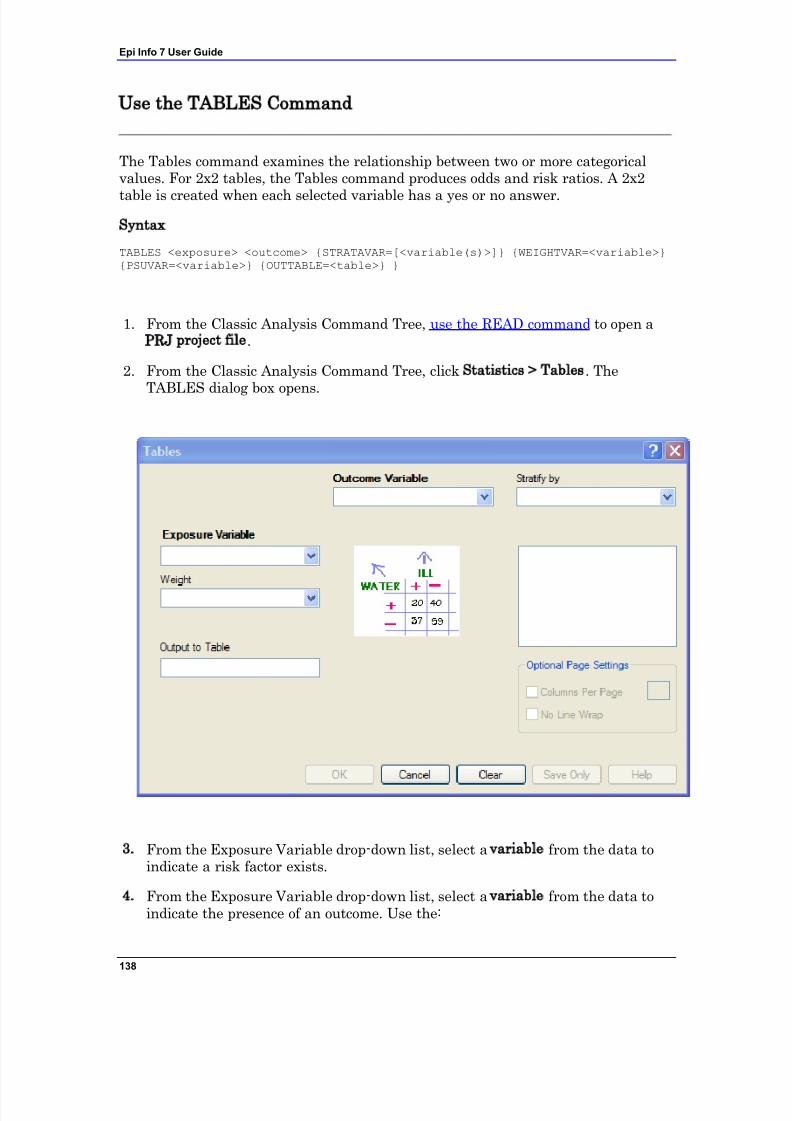
7/14/2019 Epi Info 7 User Guide-V1.0 Cleared
http://slidepdf.com/reader/full/epi-info-7-user-guide-v10-cleared-563109dd5013b 144/368
Epi Info 7 User Guide
138
Use the TABLES Command
The Tables command examines the relationship between two or more categoricalvalues. For 2x2 tables, the Tables command produces odds and risk ratios. A 2x2
table is created when each selected variable has a yes or no answer.
Syntax
TABLES <exposure> <outcome> {STRATAVAR=[<variable(s)>]} {WEIGHTVAR=<variable>}{PSUVAR=<variable>} {OUTTABLE=<table>} }
1. From the Classic Analysis Command Tree, use the READ command to open aPRJ project file.
2. From the Classic Analysis Command Tree, click Statistics > Tables. The
TABLES dialog box opens.
3. From the Exposure Variable drop-down list, select a variable from the data toindicate a risk factor exists.
4. From the Exposure Variable drop-down list, select a variable from the data toindicate the presence of an outcome. Use the:
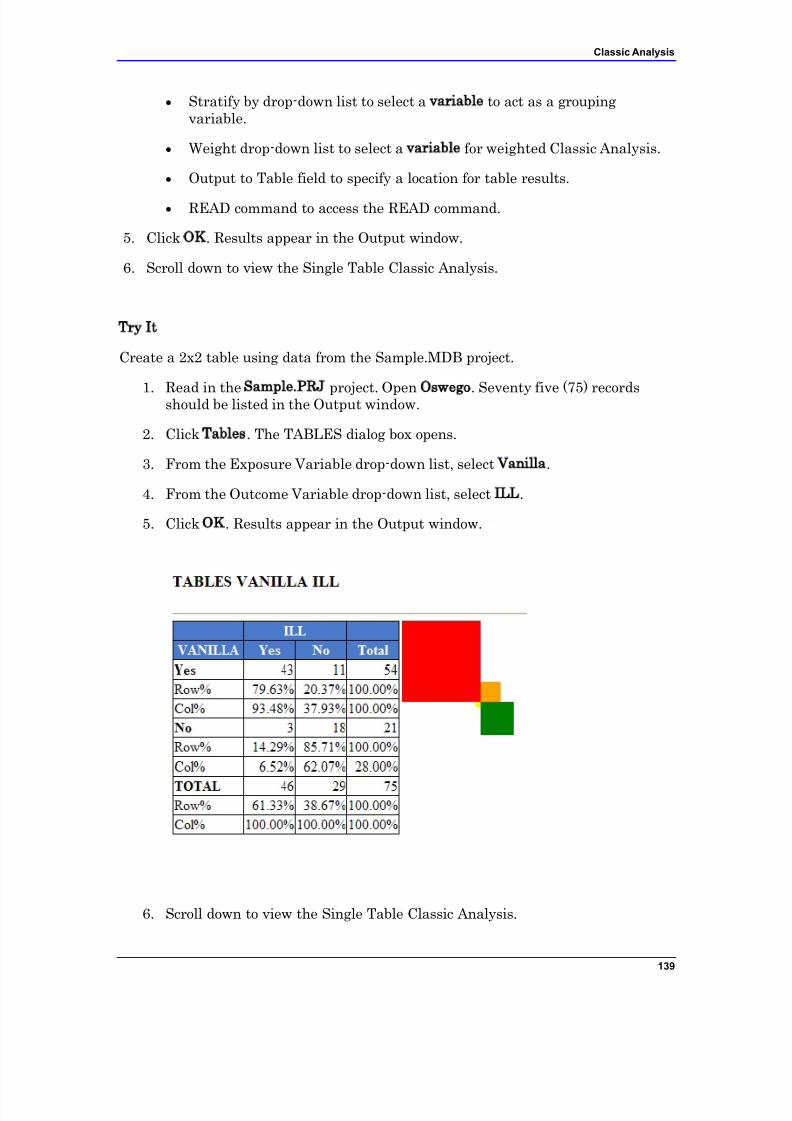
7/14/2019 Epi Info 7 User Guide-V1.0 Cleared
http://slidepdf.com/reader/full/epi-info-7-user-guide-v10-cleared-563109dd5013b 145/368
Classic Analysis
139
Stratify by drop-down list to select a variable to act as a groupingvariable.
Weight drop-down list to select a variable for weighted Classic Analysis.
Output to Table field to specify a location for table results.
READ command to access the READ command.
5. Click OK. Results appear in the Output window.
6. Scroll down to view the Single Table Classic Analysis.
Try It
Create a 2x2 table using data from the Sample.MDB project.
1. Read in the Sample.PRJ project. Open Oswego. Seventy five (75) recordsshould be listed in the Output window.
2. Click Tables. The TABLES dialog box opens.
3. From the Exposure Variable drop-down list, select Vanilla.
4. From the Outcome Variable drop-down list, select ILL.
5. Click OK. Results appear in the Output window.
6. Scroll down to view the Single Table Classic Analysis.
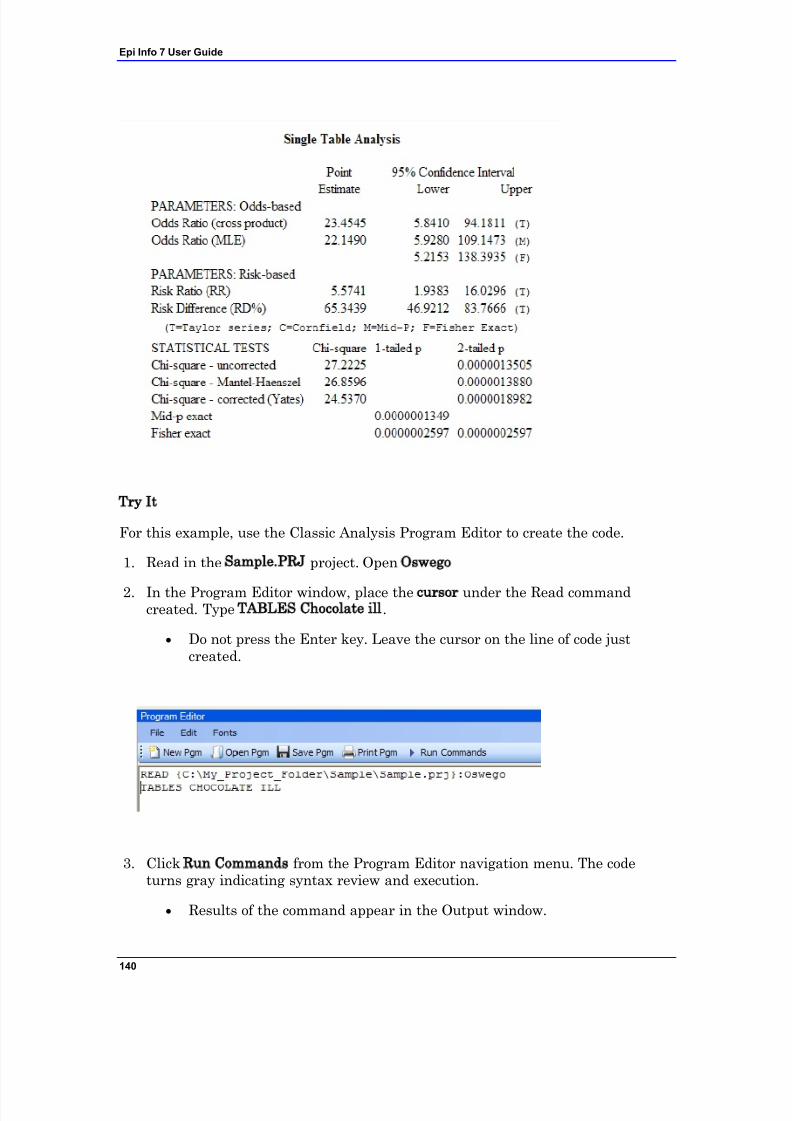
7/14/2019 Epi Info 7 User Guide-V1.0 Cleared
http://slidepdf.com/reader/full/epi-info-7-user-guide-v10-cleared-563109dd5013b 146/368
Epi Info 7 User Guide
140
Try It
For this example, use the Classic Analysis Program Editor to create the code.
1. Read in the Sample.PRJ project. Open Oswego
2. In the Program Editor window, place the cursor under the Read commandcreated. Type TABLES Chocolate ill.
Do not press the Enter key. Leave the cursor on the line of code justcreated.
3. Click Run Commands from the Program Editor navigation menu. The codeturns gray indicating syntax review and execution.
Results of the command appear in the Output window.
7/14/2019 Epi Info 7 User Guide-V1.0 Cleared
http://slidepdf.com/reader/full/epi-info-7-user-guide-v10-cleared-563109dd5013b 147/368
Classic Analysis
141
Results are the same as those created using the Command Tree dialogboxes.
Try It
A program or PGM can be saved and run repeatedly against a dataset forcontinuously updated statistics and analyses.
1. To see an example of a PGM, read in the Sample.PRJ project. Open Oswego.
2. From the Program Editor, click Open Pgm. The Read Program dialog boxopens.
3. From the Program drop-down list, select Statistics.
4. Click OK. The PGM opens in the Program Editor.
5. Click Run Commands. The Program Editor runs the code and output isplaced in the Classic Analysis Output window. Use the scroll bar to review allthe results computed to the Output window.
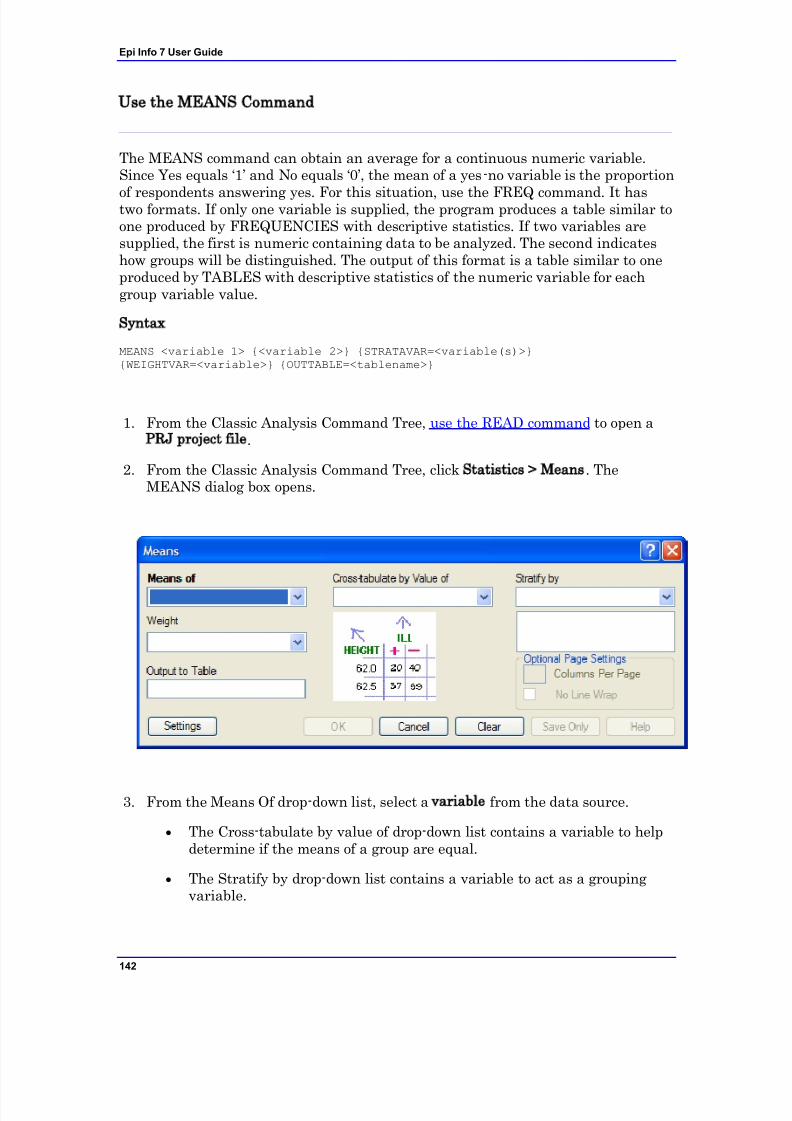
7/14/2019 Epi Info 7 User Guide-V1.0 Cleared
http://slidepdf.com/reader/full/epi-info-7-user-guide-v10-cleared-563109dd5013b 148/368
Epi Info 7 User Guide
142
Use the MEANS Command
The MEANS command can obtain an average for a continuous numeric variable.Since Yes equals „1‟ and No equals „0‟, the mean of a yes-no variable is the proportion
of respondents answering yes. For this situation, use the FREQ command. It hastwo formats. If only one variable is supplied, the program produces a table similar toone produced by FREQUENCIES with descriptive statistics. If two variables aresupplied, the first is numeric containing data to be analyzed. The second indicateshow groups will be distinguished. The output of this format is a table similar to oneproduced by TABLES with descriptive statistics of the numeric variable for eachgroup variable value.
Syntax
MEANS <variable 1> {<variable 2>} {STRATAVAR=<variable(s)>}{WEIGHTVAR=<variable>} {OUTTABLE=<tablename>}
1. From the Classic Analysis Command Tree, use the READ command to open aPRJ project file.
2. From the Classic Analysis Command Tree, click Statistics > Means. TheMEANS dialog box opens.
3. From the Means Of drop-down list, select a variable from the data source.
The Cross-tabulate by value of drop-down list contains a variable to helpdetermine if the means of a group are equal.
The Stratify by drop-down list contains a variable to act as a groupingvariable.
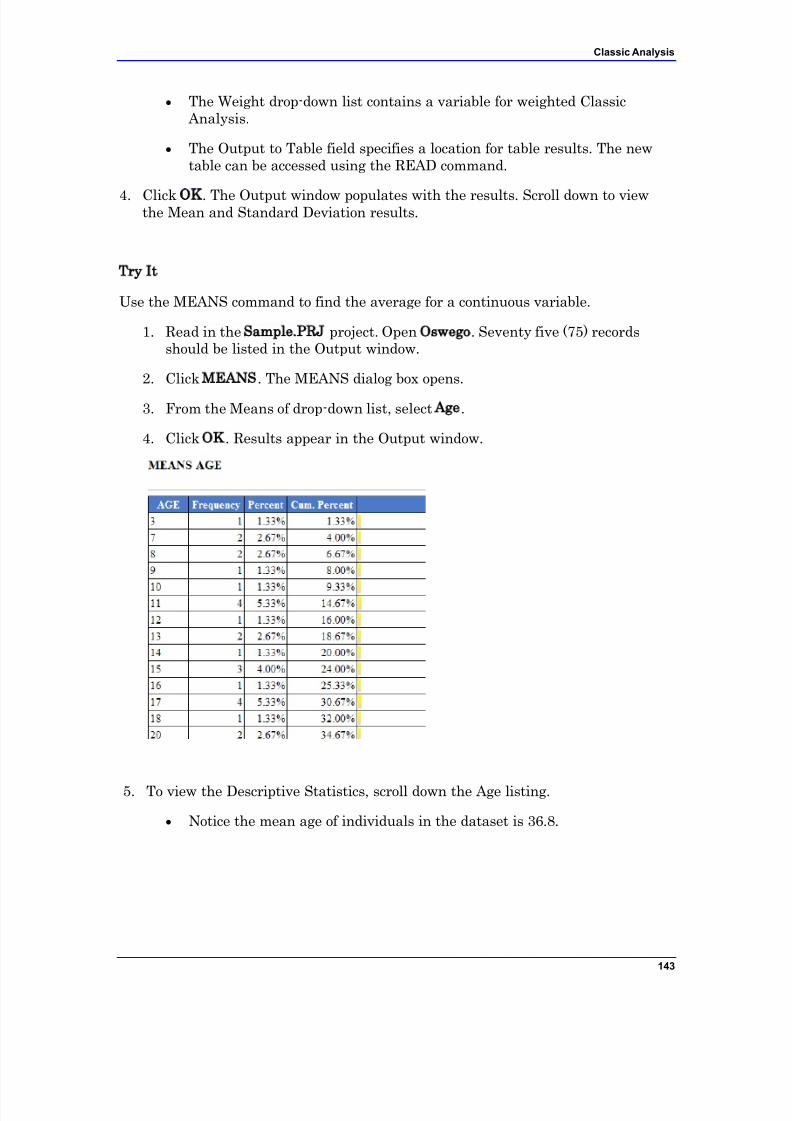
7/14/2019 Epi Info 7 User Guide-V1.0 Cleared
http://slidepdf.com/reader/full/epi-info-7-user-guide-v10-cleared-563109dd5013b 149/368
Classic Analysis
143
The Weight drop-down list contains a variable for weighted Classic Analysis.
The Output to Table field specifies a location for table results. The newtable can be accessed using the READ command.
4. Click OK. The Output window populates with the results. Scroll down to viewthe Mean and Standard Deviation results.
Try It
Use the MEANS command to find the average for a continuous variable.
1. Read in the Sample.PRJ project. Open Oswego. Seventy five (75) recordsshould be listed in the Output window.
2. Click MEANS. The MEANS dialog box opens.
3. From the Means of drop-down list, select Age.
4. Click OK. Results appear in the Output window.
5. To view the Descriptive Statistics, scroll down the Age listing.
Notice the mean age of individuals in the dataset is 36.8.
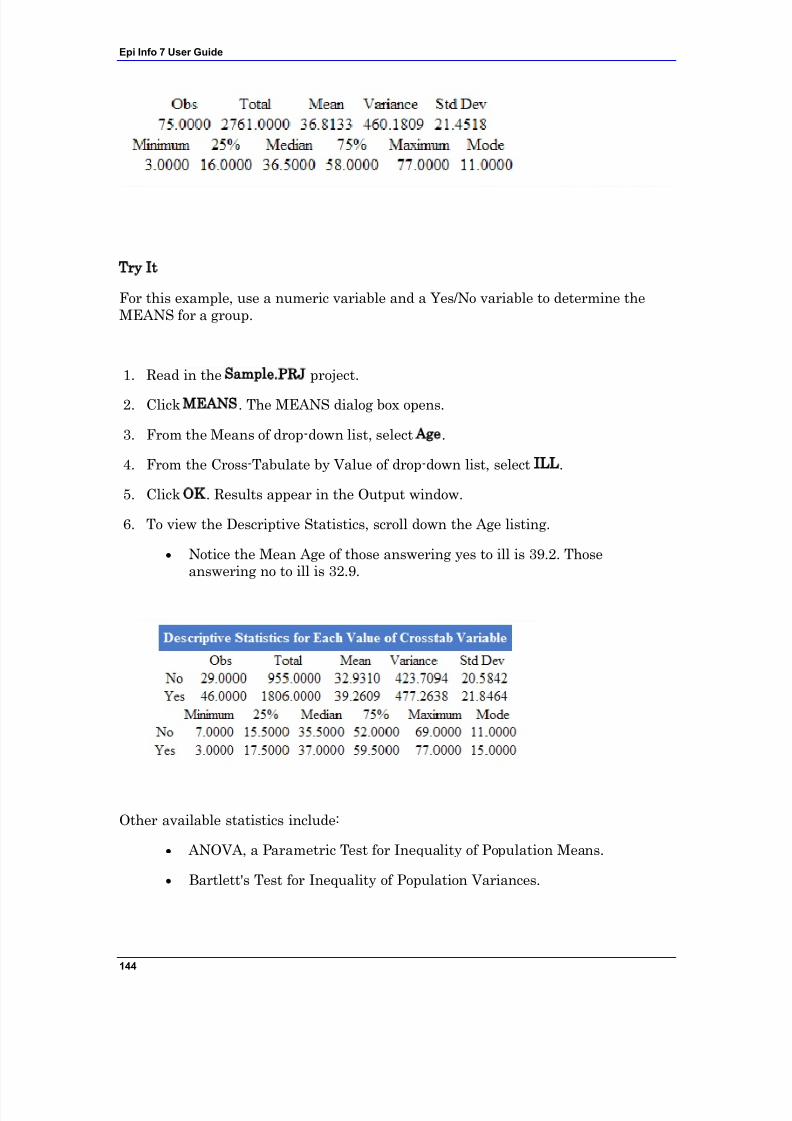
7/14/2019 Epi Info 7 User Guide-V1.0 Cleared
http://slidepdf.com/reader/full/epi-info-7-user-guide-v10-cleared-563109dd5013b 150/368
Epi Info 7 User Guide
144
Try It
For this example, use a numeric variable and a Yes/No variable to determine theMEANS for a group.
1. Read in the Sample.PRJ project.
2. Click MEANS. The MEANS dialog box opens.
3. From the Means of drop-down list, select Age.
4. From the Cross-Tabulate by Value of drop-down list, select ILL.
5. Click OK. Results appear in the Output window.
6. To view the Descriptive Statistics, scroll down the Age listing.
Notice the Mean Age of those answering yes to ill is 39.2. Thoseanswering no to ill is 32.9.
Other available statistics include:
ANOVA, a Parametric Test for Inequality of Population Means.
Bartlett's Test for Inequality of Population Variances.
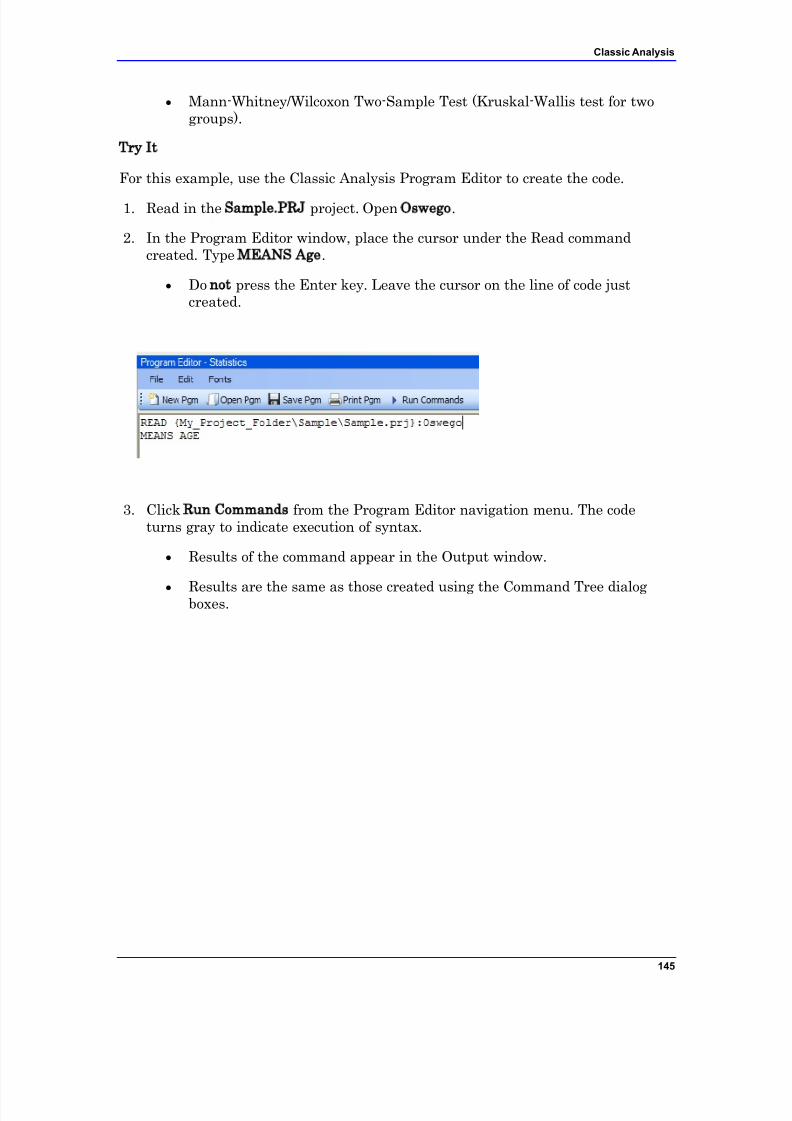
7/14/2019 Epi Info 7 User Guide-V1.0 Cleared
http://slidepdf.com/reader/full/epi-info-7-user-guide-v10-cleared-563109dd5013b 151/368
Classic Analysis
145
Mann-Whitney/Wilcoxon Two-Sample Test (Kruskal-Wallis test for twogroups).
Try It
For this example, use the Classic Analysis Program Editor to create the code.
1. Read in the Sample.PRJ project. Open Oswego.
2. In the Program Editor window, place the cursor under the Read commandcreated. Type MEANS Age.
Do not press the Enter key. Leave the cursor on the line of code justcreated.
3. Click Run Commands from the Program Editor navigation menu. The codeturns gray to indicate execution of syntax.
Results of the command appear in the Output window.
Results are the same as those created using the Command Tree dialogboxes.
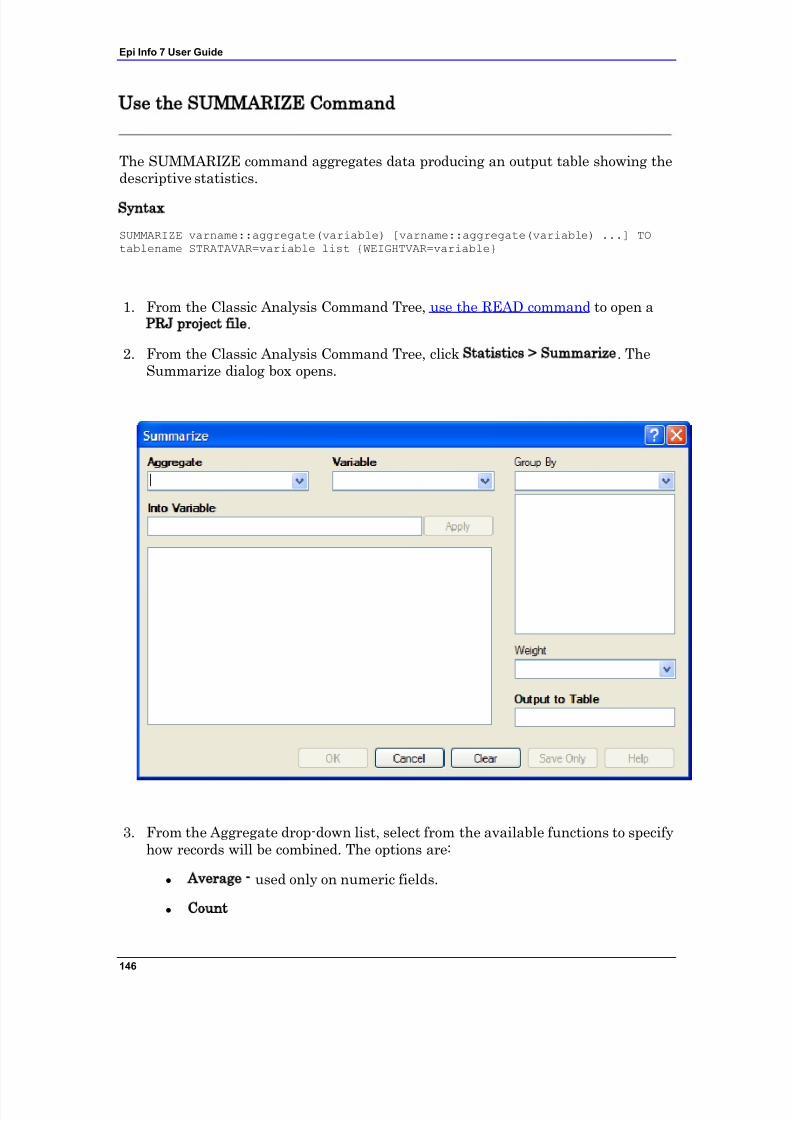
7/14/2019 Epi Info 7 User Guide-V1.0 Cleared
http://slidepdf.com/reader/full/epi-info-7-user-guide-v10-cleared-563109dd5013b 152/368
Epi Info 7 User Guide
146
Use the SUMMARIZE Command
The SUMMARIZE command aggregates data producing an output table showing thedescriptive statistics.
Syntax
SUMMARIZE varname::aggregate(variable) [varname::aggregate(variable) ...] TOtablename STRATAVAR=variable list {WEIGHTVAR=variable}
1. From the Classic Analysis Command Tree, use the READ command to open aPRJ project file.
2. From the Classic Analysis Command Tree, click Statistics > Summarize. TheSummarize dialog box opens.
3. From the Aggregate drop-down list, select from the available functions to specifyhow records will be combined. The options are:
Average - used only on numeric fields.
Count
7/14/2019 Epi Info 7 User Guide-V1.0 Cleared
http://slidepdf.com/reader/full/epi-info-7-user-guide-v10-cleared-563109dd5013b 153/368
Classic Analysis
147
First - based on sorts order.
Last - based on sorts order.
Maximum
Minimum StdDev - Standard Deviation.
StdDev(Pop)
Sum - only used on numeric fields.
Var- Variance - only used on numeric fields.
Var(Pop)
4. From the Variable drop-down list, select from the variables in the dataset.
5. In the Into Variable field, type a name to title the summarized variable.
6. Click Apply. The code appears in the open field.
If grouping is necessary, use the Group By drop-down list to select avariable to group the aggregated data.
If a weight variable exists, use the Weight drop-down list to select avariable to weight the aggregated data.
7. In the Output to Table field, type a name for the new data table.
8. Click OK. The following message appears in the Output window: Output tablecreated: location listed.
9. Click Read/Import. The READ dialog box opens.
10. Click the All radio button. All the tables in the dataset appear in a list.
11. Locate and select the summary table just created.
12. Click OK. The Output window populates with the Record Count for thesummary table.
13. Use the LIST command to view the summary table.
Try It
1. Read in the Sample.PRJ project. Open ADDFull. Three hundred and fifty nine(359) records should be listed in the Output window.
2. Click Statistics > Summarize. The SUMMARIZE dialog box opens.
7/14/2019 Epi Info 7 User Guide-V1.0 Cleared
http://slidepdf.com/reader/full/epi-info-7-user-guide-v10-cleared-563109dd5013b 154/368
Epi Info 7 User Guide
148
3. From the Aggregate drop-down list, select Average.
4. From the Variable drop-down list, select the variable GPA.
5. In the Into Variable field, type AverageGPA.
6. Click Apply. The code appears in the open field.7. From the Group By drop-down list, select the variable GENDER.
8. In the Output to Table field, type DATATABLE1.
9. Click OK. The following message appears in the Output window:
SUMMARIZE AverageGPA :: Avg(GPA) TO DATATABLE1 STRATAVAR = GENDER
10. Click Read/Import. The READ dialog box opens.
11. Click the Tables checkbox. All the tables in your dataset appear in a list.
12. Select the summary table DATATABLE1.
13. Click OK. The Output window populates with a record count of two for thesummary table.
14. Use the LIST command to view the summary table.
7/14/2019 Epi Info 7 User Guide-V1.0 Cleared
http://slidepdf.com/reader/full/epi-info-7-user-guide-v10-cleared-563109dd5013b 155/368
Classic Analysis
149
Use the GRAPH Command
The following steps create a basic graph containing one main variable. The GRAPHcommand opens the Epi Graph application and creates a variety of graph types
based on the types of data available in the project.
Syntax
GRAPH [<Variable(s)>] GRAPHTYPE ="<GraphType>" [<OptionName>=OptionValue]
GRAPH [<Variable(s)>] * <Crosstab> GRAPHTYPE ="<GraphType>"[<OptionName>=OptionValue]
GRAPH [<Variable(s)>] GRAPHTYPE="<GraphType>" XTITLE="<string>"YTITLE="<string>"
1. From the Classic Analysis Command Tree, use the READ command to open anEpi Info 7 .PRJ file.
2. From the Classic Analysis Command Tree, click Statistics > Graph. The GRAPHdialog box opens.
The default graph selection is Bar.
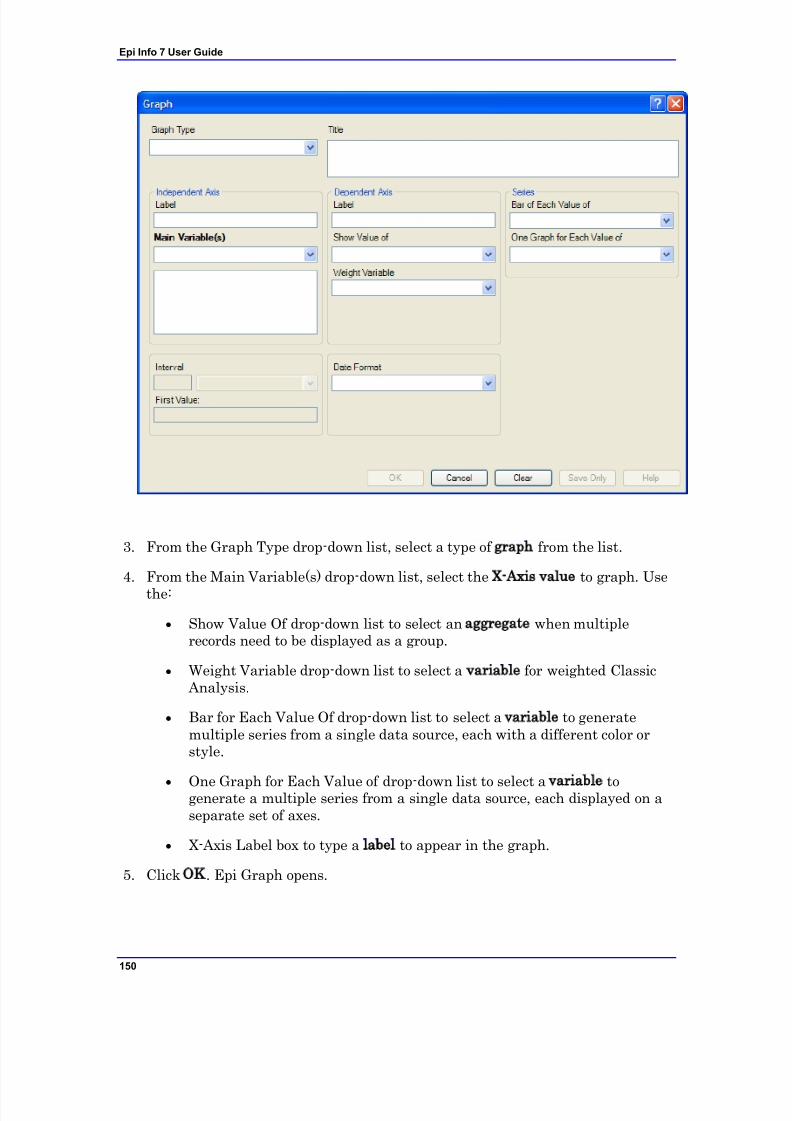
7/14/2019 Epi Info 7 User Guide-V1.0 Cleared
http://slidepdf.com/reader/full/epi-info-7-user-guide-v10-cleared-563109dd5013b 156/368
Epi Info 7 User Guide
150
3. From the Graph Type drop-down list, select a type of graph from the list.
4. From the Main Variable(s) drop-down list, select the X-Axis value to graph. Use
the:
Show Value Of drop-down list to select an aggregate when multiplerecords need to be displayed as a group.
Weight Variable drop-down list to select a variable for weighted Classic Analysis.
Bar for Each Value Of drop-down list to select a variable to generatemultiple series from a single data source, each with a different color orstyle.
One Graph for Each Value of drop-down list to select a variable togenerate a multiple series from a single data source, each displayed on aseparate set of axes.
X-Axis Label box to type a label to appear in the graph.
5. Click OK. Epi Graph opens.
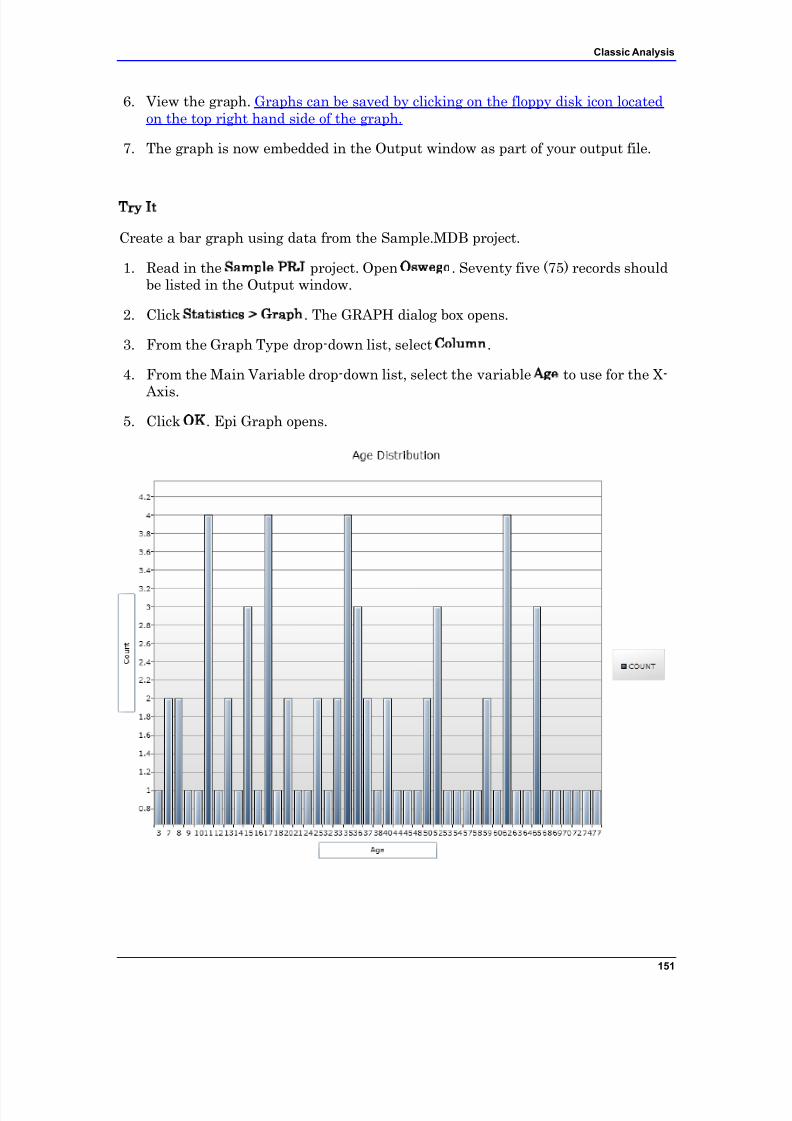
7/14/2019 Epi Info 7 User Guide-V1.0 Cleared
http://slidepdf.com/reader/full/epi-info-7-user-guide-v10-cleared-563109dd5013b 157/368
Classic Analysis
151
6. View the graph. Graphs can be saved by clicking on the floppy disk icon locatedon the top right hand side of the graph.
7. The graph is now embedded in the Output window as part of your output file.
Try It
Create a bar graph using data from the Sample.MDB project.
1. Read in the Sample.PRJ project. Open Oswego. Seventy five (75) records shouldbe listed in the Output window.
2. Click Statistics > Graph. The GRAPH dialog box opens.
3. From the Graph Type drop-down list, select Column.
4. From the Main Variable drop-down list, select the variable Age to use for the X-
Axis.
5. Click OK. Epi Graph opens.

7/14/2019 Epi Info 7 User Guide-V1.0 Cleared
http://slidepdf.com/reader/full/epi-info-7-user-guide-v10-cleared-563109dd5013b 158/368
Epi Info 7 User Guide
152
6. The bar graph is now embedded in the Output window and part of the outputfile.
Notice the Graph code that appears in the Program Editor.
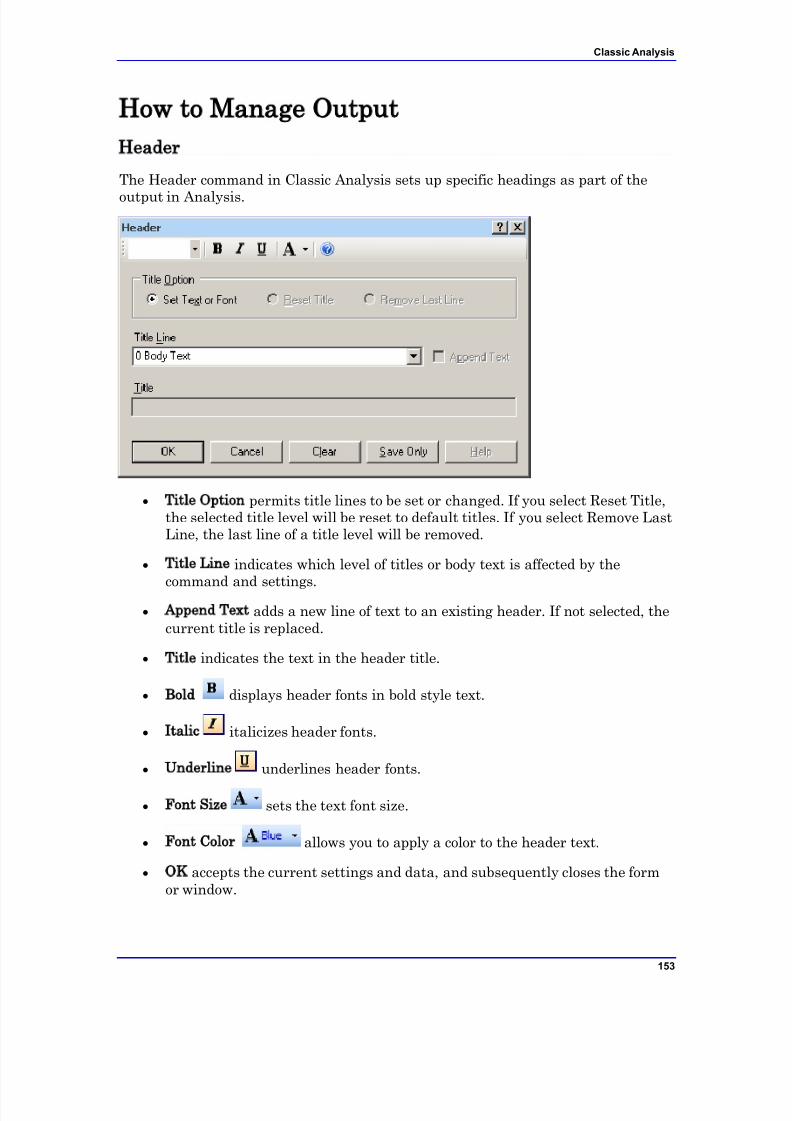
7/14/2019 Epi Info 7 User Guide-V1.0 Cleared
http://slidepdf.com/reader/full/epi-info-7-user-guide-v10-cleared-563109dd5013b 159/368
Classic Analysis
153
How to Manage Output
Header
The Header command in Classic Analysis sets up specific headings as part of the
output in Analysis.
Title Option permits title lines to be set or changed. If you select Reset Title,the selected title level will be reset to default titles. If you select Remove LastLine, the last line of a title level will be removed.
Title Line indicates which level of titles or body text is affected by thecommand and settings.
Append Text adds a new line of text to an existing header. If not selected, thecurrent title is replaced.
Title indicates the text in the header title.
Bold displays header fonts in bold style text.
Italic italicizes header fonts.
Underline underlines header fonts.
Font Size sets the text font size.
Font Color allows you to apply a color to the header text.
OK accepts the current settings and data, and subsequently closes the formor window.

7/14/2019 Epi Info 7 User Guide-V1.0 Cleared
http://slidepdf.com/reader/full/epi-info-7-user-guide-v10-cleared-563109dd5013b 160/368
Epi Info 7 User Guide
154
Save Only saves the created code to the Program Editor, but does not run thecode.
Cancel closes the dialog box without saving or executing a command.
Clear empties the fields so information can be re-entered.
Help opens the Help topic associated with the module being used. (CurrentlyDisabled).
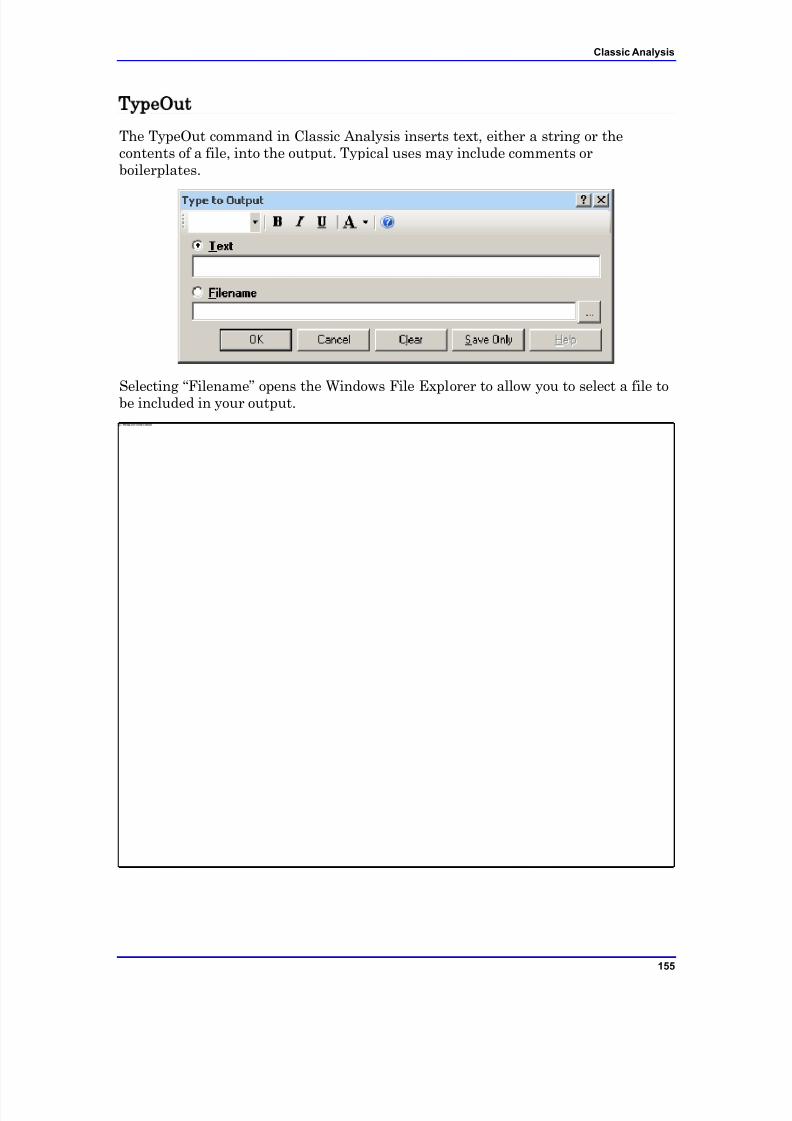
7/14/2019 Epi Info 7 User Guide-V1.0 Cleared
http://slidepdf.com/reader/full/epi-info-7-user-guide-v10-cleared-563109dd5013b 161/368
Classic Analysis
155
TypeOut
The TypeOut command in Classic Analysis inserts text, either a string or thecontents of a file, into the output. Typical uses may include comments orboilerplates.
Selecting “Filename” opens the Windows File Explorer to allow you to select a file tobe included in your output.
7/14/2019 Epi Info 7 User Guide-V1.0 Cleared
http://slidepdf.com/reader/full/epi-info-7-user-guide-v10-cleared-563109dd5013b 162/368
Epi Info 7 User Guide
156
The Text or Filename field contains the text or file name to be inserted in theoutput file.
Bold displays type fonts in bold style text.
Italic italicizes type fonts.
Underline underlines type fonts.
Font Size sets the type text font size.
Font Color allows you to apply a color to the type text.
Type a filename or click the ellipse to locate a file (e.g., HTM, JPEG, XML).
OK accepts the current settings and data, and subsequently closes the formor window.
Save Only saves the created code to the Program Editor, but does not run thecode.
Cancel closes the dialog box without saving or executing a command.
Clear empties the fields so information can be re-entered.
Help opens the Help topic associated with the module being used. (CurrentlyDisabled).
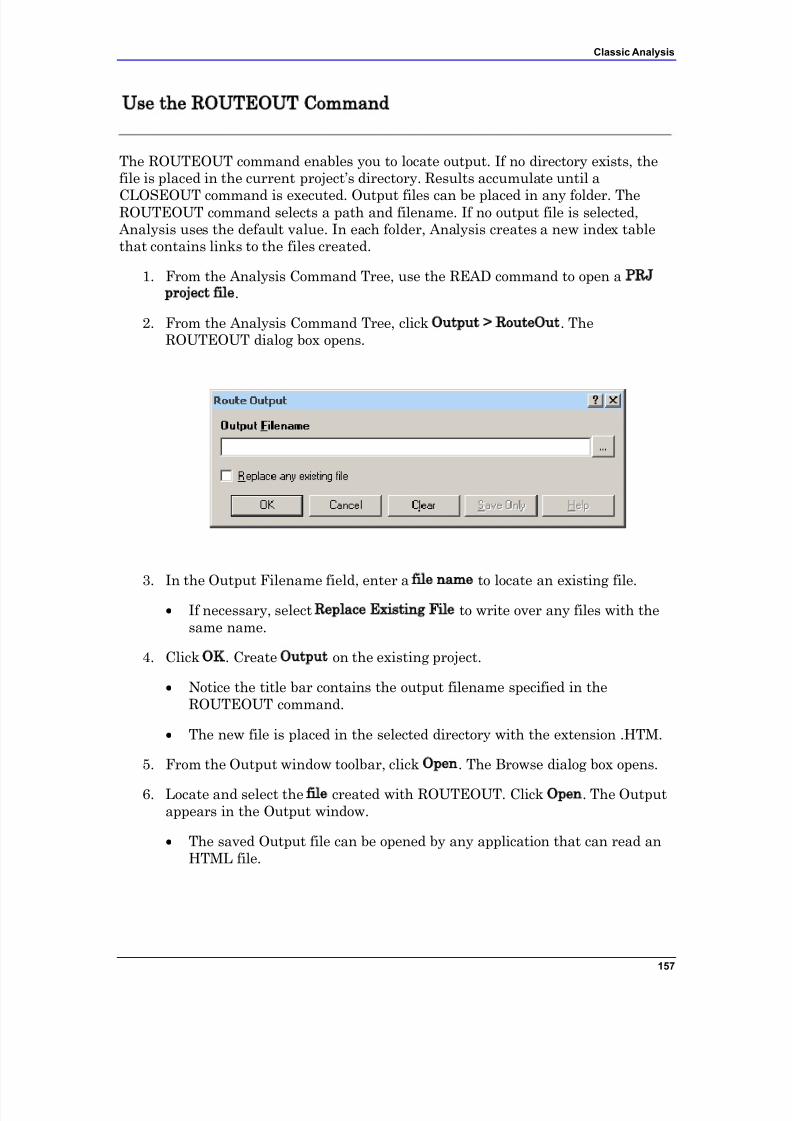
7/14/2019 Epi Info 7 User Guide-V1.0 Cleared
http://slidepdf.com/reader/full/epi-info-7-user-guide-v10-cleared-563109dd5013b 163/368
Classic Analysis
157
Use the ROUTEOUT Command
The ROUTEOUT command enables you to locate output. If no directory exists, thefile is placed in the current project‟s directory. Results accumulate until a
CLOSEOUT command is executed. Output files can be placed in any folder. TheROUTEOUT command selects a path and filename. If no output file is selected,
Analysis uses the default value. In each folder, Analysis creates a new index tablethat contains links to the files created.
1. From the Analysis Command Tree, use the READ command to open a PRJproject file.
2. From the Analysis Command Tree, click Output > RouteOut. TheROUTEOUT dialog box opens.
3. In the Output Filename field, enter a file name to locate an existing file.
If necessary, select Replace Existing File to write over any files with thesame name.
4. Click OK. Create Output on the existing project.
Notice the title bar contains the output filename specified in theROUTEOUT command.
The new file is placed in the selected directory with the extension .HTM.
5. From the Output window toolbar, click Open. The Browse dialog box opens.
6. Locate and select the file created with ROUTEOUT. Click Open. The Outputappears in the Output window.
The saved Output file can be opened by any application that can read anHTML file.
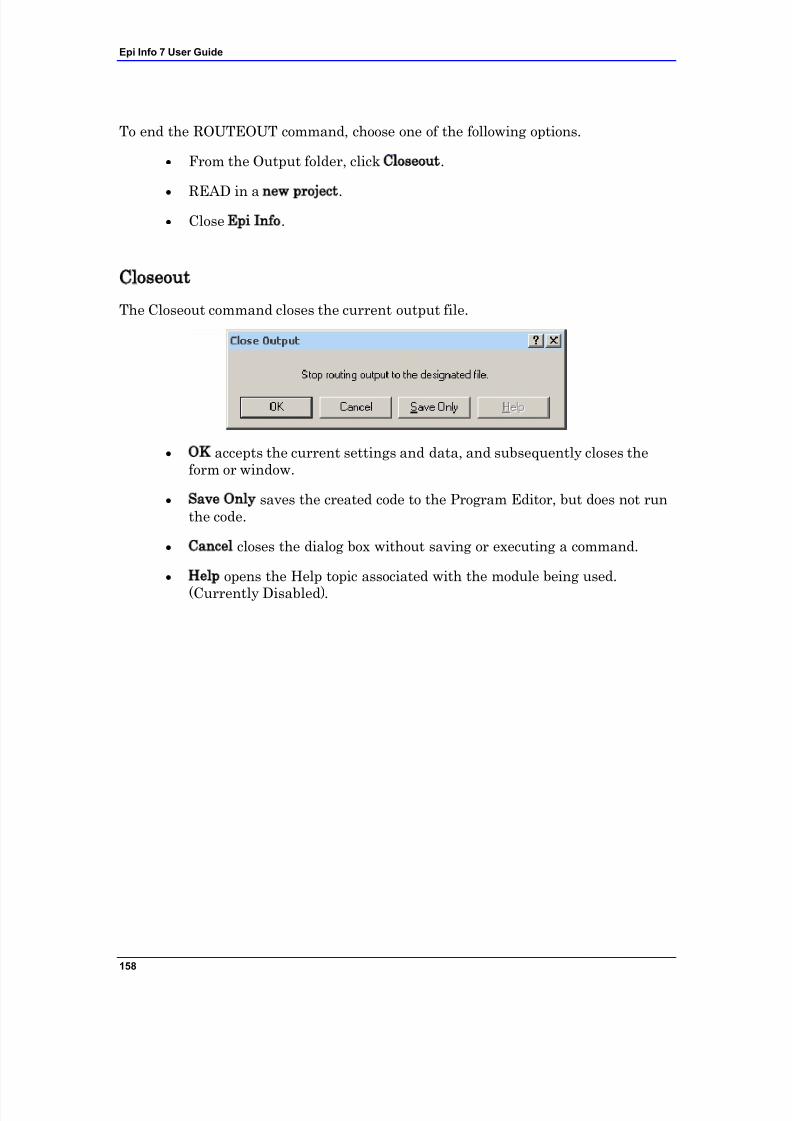
7/14/2019 Epi Info 7 User Guide-V1.0 Cleared
http://slidepdf.com/reader/full/epi-info-7-user-guide-v10-cleared-563109dd5013b 164/368
Epi Info 7 User Guide
158
To end the ROUTEOUT command, choose one of the following options.
From the Output folder, click Closeout.
READ in a new project. Close Epi Info.
Closeout
The Closeout command closes the current output file.
OK accepts the current settings and data, and subsequently closes theform or window.
Save Only saves the created code to the Program Editor, but does not runthe code.
Cancel closes the dialog box without saving or executing a command.
Help opens the Help topic associated with the module being used.
(Currently Disabled).
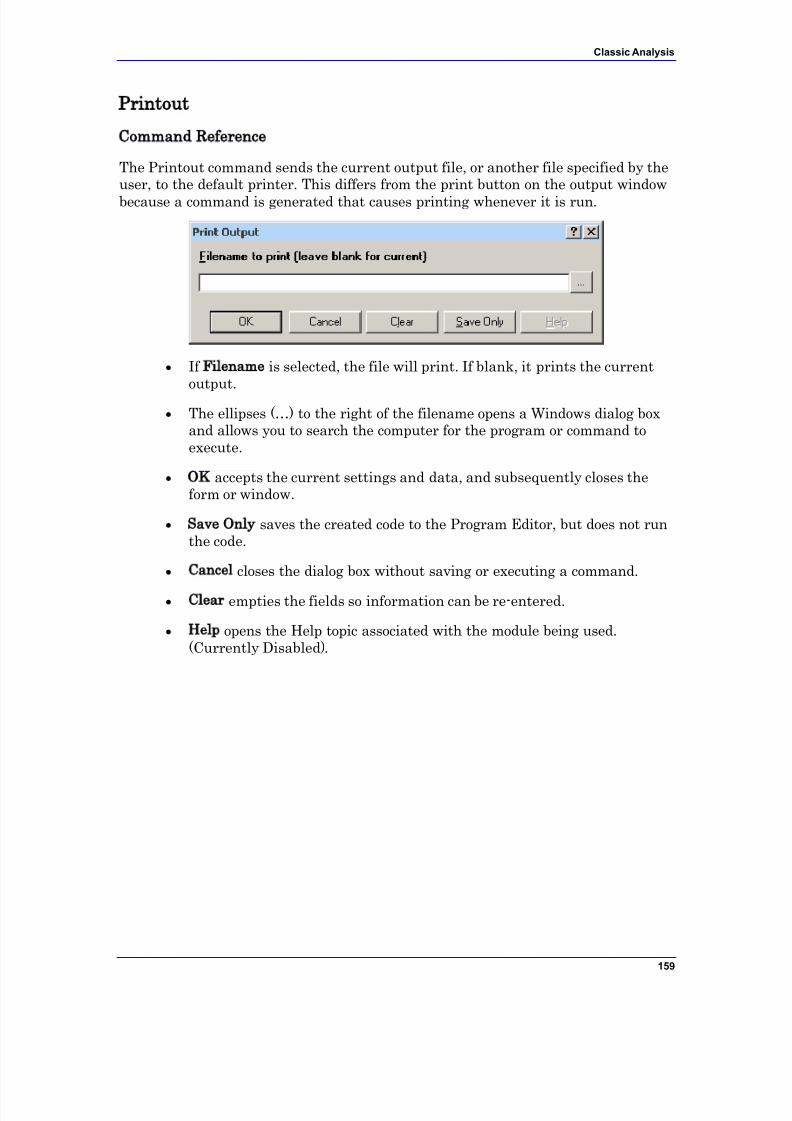
7/14/2019 Epi Info 7 User Guide-V1.0 Cleared
http://slidepdf.com/reader/full/epi-info-7-user-guide-v10-cleared-563109dd5013b 165/368
Classic Analysis
159
Printout
Command Reference
The Printout command sends the current output file, or another file specified by theuser, to the default printer. This differs from the print button on the output window
because a command is generated that causes printing whenever it is run.
If Filename is selected, the file will print. If blank, it prints the currentoutput.
The ellipses (…) to the right of the filename opens a Windows dialog boxand allows you to search the computer for the program or command toexecute.
OK accepts the current settings and data, and subsequently closes theform or window.
Save Only saves the created code to the Program Editor, but does not runthe code.
Cancel closes the dialog box without saving or executing a command.
Clear empties the fields so information can be re-entered.
Help opens the Help topic associated with the module being used.(Currently Disabled).
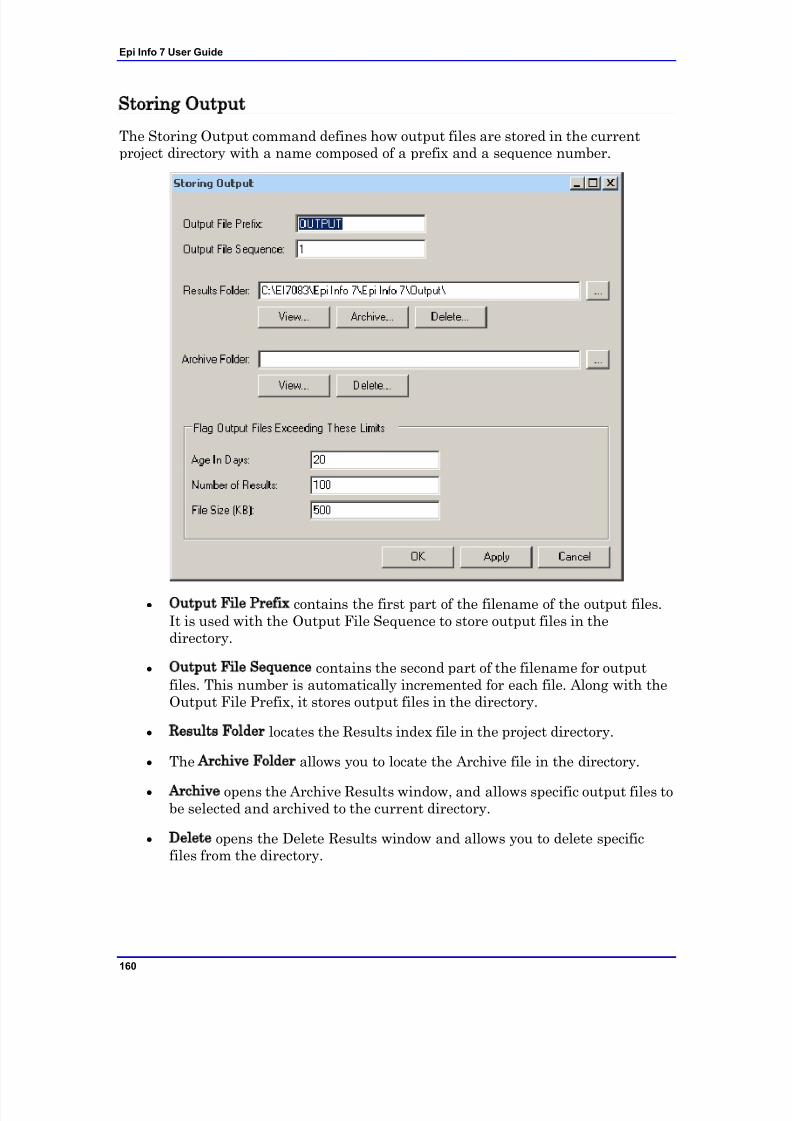
7/14/2019 Epi Info 7 User Guide-V1.0 Cleared
http://slidepdf.com/reader/full/epi-info-7-user-guide-v10-cleared-563109dd5013b 166/368
Epi Info 7 User Guide
160
Storing Output
The Storing Output command defines how output files are stored in the currentproject directory with a name composed of a prefix and a sequence number.
Output File Prefix contains the first part of the filename of the output files.It is used with the Output File Sequence to store output files in thedirectory.
Output File Sequence contains the second part of the filename for outputfiles. This number is automatically incremented for each file. Along with theOutput File Prefix, it stores output files in the directory.
Results Folder locates the Results index file in the project directory.
The Archive Folder allows you to locate the Archive file in the directory.
Archive opens the Archive Results window, and allows specific output files tobe selected and archived to the current directory.
Delete opens the Delete Results window and allows you to delete specificfiles from the directory.
7/14/2019 Epi Info 7 User Guide-V1.0 Cleared
http://slidepdf.com/reader/full/epi-info-7-user-guide-v10-cleared-563109dd5013b 167/368
Classic Analysis
161
Age in Days marks output files older than the indicated number of days inthe form window if Flags are active. If output file limits are placed onnumber of days, it appears in the Flag Files operation.
Number of Results marks output files in excess of the number indicated inthe form window if Flags are active.
File Size marks output files in excess of the size indicated in the formwindow if Flags are active. Enter output file size limits in this field.
OK accepts the current settings and data, and subsequently closes the formor window.
Apply accepts the current settings and data, and subsequently closes theform or window.
Cancel exits the dialog box without saving or executing a command.
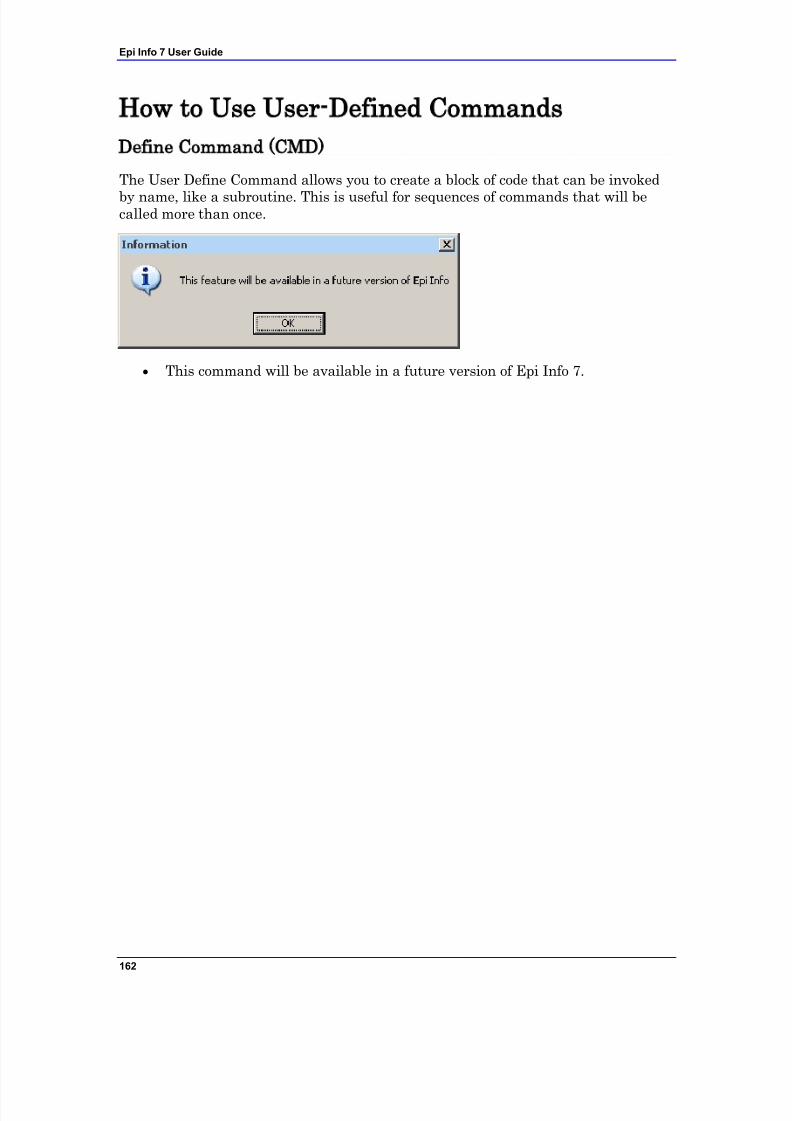
7/14/2019 Epi Info 7 User Guide-V1.0 Cleared
http://slidepdf.com/reader/full/epi-info-7-user-guide-v10-cleared-563109dd5013b 168/368
Epi Info 7 User Guide
162
How to Use User-Defined Commands
Define Command (CMD)
The User Define Command allows you to create a block of code that can be invoked
by name, like a subroutine. This is useful for sequences of commands that will becalled more than once.
This command will be available in a future version of Epi Info 7.
7/14/2019 Epi Info 7 User Guide-V1.0 Cleared
http://slidepdf.com/reader/full/epi-info-7-user-guide-v10-cleared-563109dd5013b 169/368
Classic Analysis
163
Run Saved Program
Command Reference
The Run Saved Program command in Classic Analysis transfers control to thesecond program returning to the first automatically, beginning with the linefollowing the RUN statement. A program being run from another program is similarto an INCLUDE or subroutine in other systems.
Filename indicates the database or text file containing the program. If thepath or filename contains a space, it must be enclosed in double quotes. If the program to be run is in the current project, the path does not need to besupplied.
Program indicates the program name if it‟s in the database.
OK accepts the current settings and data, and subsequently closes the formor window.
Cancel closes the dialog box without saving or executing a command.
Clear empties the fields so information can be re-entered.
Save Only saves the created code to the Program Editor, but does not run thecode.
Help opens the Help topic associated with the module being used. (CurrentlyDisabled).
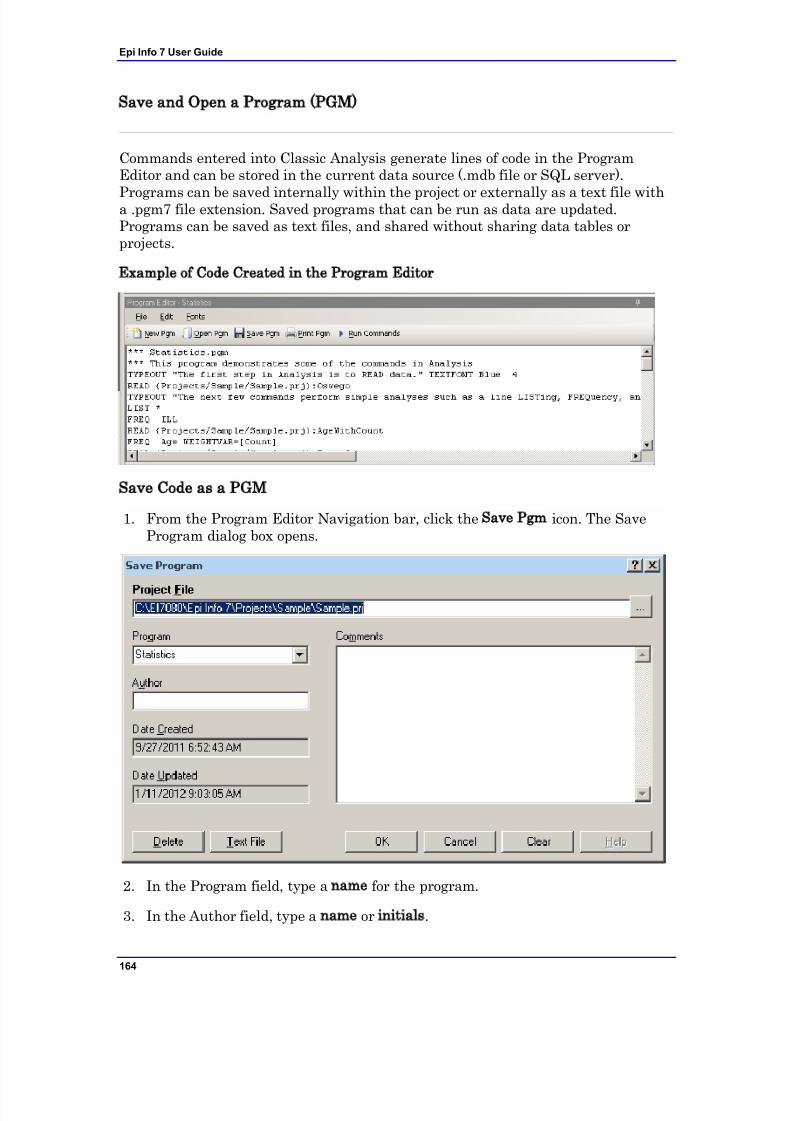
7/14/2019 Epi Info 7 User Guide-V1.0 Cleared
http://slidepdf.com/reader/full/epi-info-7-user-guide-v10-cleared-563109dd5013b 170/368
Epi Info 7 User Guide
164
Save and Open a Program (PGM)
Commands entered into Classic Analysis generate lines of code in the ProgramEditor and can be stored in the current data source (.mdb file or SQL server).
Programs can be saved internally within the project or externally as a text file witha .pgm7 file extension. Saved programs that can be run as data are updated.Programs can be saved as text files, and shared without sharing data tables orprojects.
Example of Code Created in the Program Editor
Save Code as a PGM
1. From the Program Editor Navigation bar, click the Save Pgm icon. The SaveProgram dialog box opens.
2. In the Program field, type a name for the program.
3. In the Author field, type a name or initials.
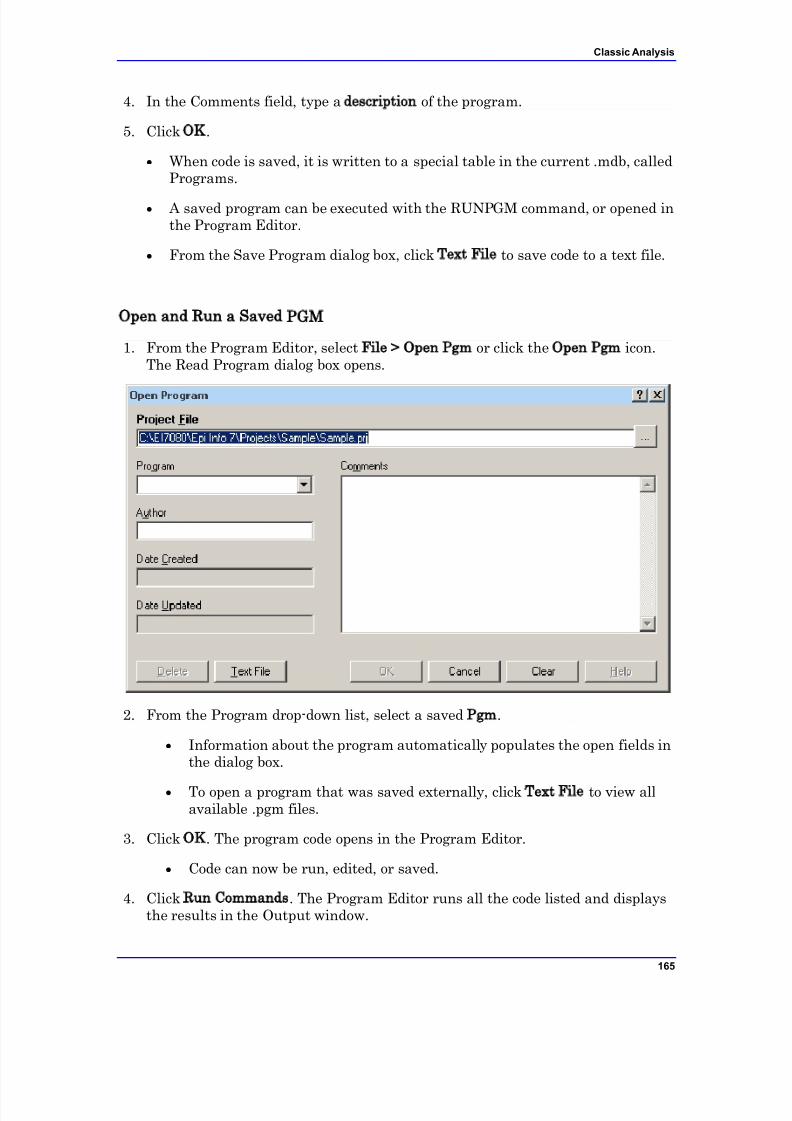
7/14/2019 Epi Info 7 User Guide-V1.0 Cleared
http://slidepdf.com/reader/full/epi-info-7-user-guide-v10-cleared-563109dd5013b 171/368
Classic Analysis
165
4. In the Comments field, type a description of the program.
5. Click OK.
When code is saved, it is written to a special table in the current .mdb, calledPrograms.
A saved program can be executed with the RUNPGM command, or opened inthe Program Editor.
From the Save Program dialog box, click Text File to save code to a text file.
Open and Run a Saved PGM
1. From the Program Editor, select File > Open Pgm or click the Open Pgm icon.The Read Program dialog box opens.
2. From the Program drop-down list, select a saved Pgm.
Information about the program automatically populates the open fields inthe dialog box.
To open a program that was saved externally, click Text File to view allavailable .pgm files.
3. Click OK. The program code opens in the Program Editor.
Code can now be run, edited, or saved.
4. Click Run Commands. The Program Editor runs all the code listed and displaysthe results in the Output window.

7/14/2019 Epi Info 7 User Guide-V1.0 Cleared
http://slidepdf.com/reader/full/epi-info-7-user-guide-v10-cleared-563109dd5013b 172/368
Epi Info 7 User Guide
166
To run individual commands, use the cursor to highlight the commands youwant to run. Click Run Commands.
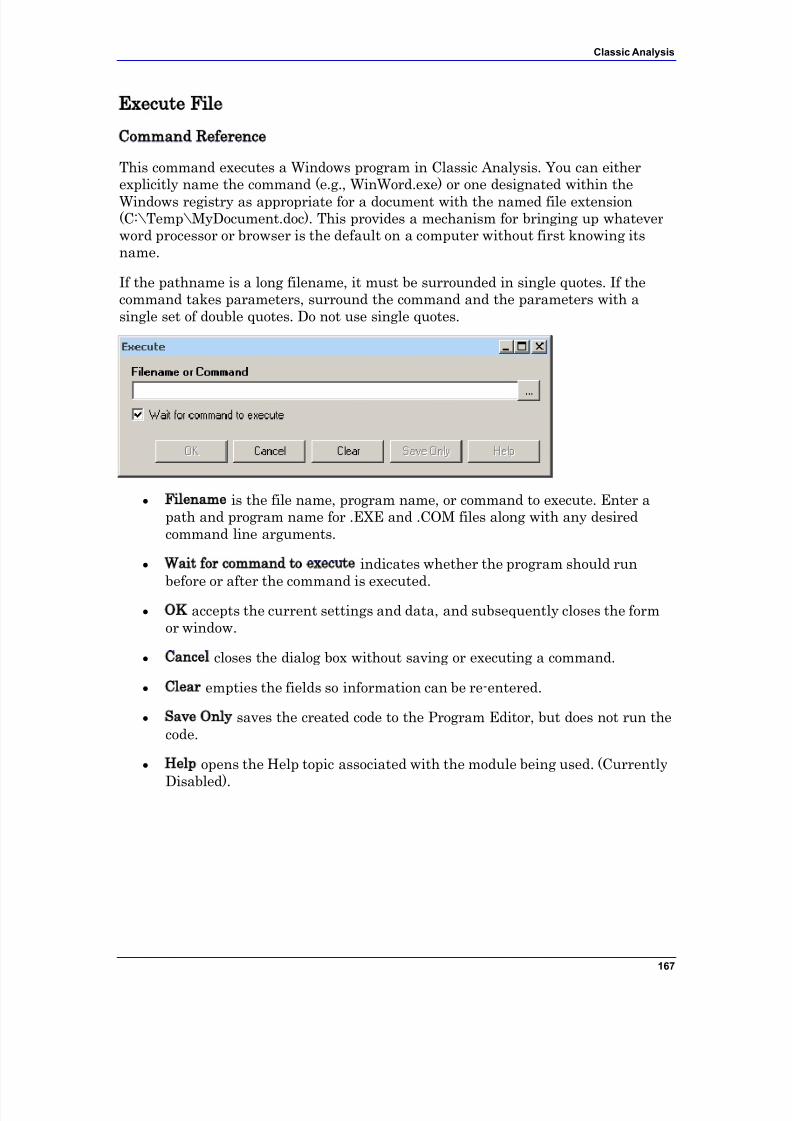
7/14/2019 Epi Info 7 User Guide-V1.0 Cleared
http://slidepdf.com/reader/full/epi-info-7-user-guide-v10-cleared-563109dd5013b 173/368
Classic Analysis
167
Execute File
Command Reference
This command executes a Windows program in Classic Analysis. You can eitherexplicitly name the command (e.g., WinWord.exe) or one designated within the
Windows registry as appropriate for a document with the named file extension(C:\Temp\MyDocument.doc). This provides a mechanism for bringing up whateverword processor or browser is the default on a computer without first knowing itsname.
If the pathname is a long filename, it must be surrounded in single quotes. If thecommand takes parameters, surround the command and the parameters with asingle set of double quotes. Do not use single quotes.
Filename is the file name, program name, or command to execute. Enter apath and program name for .EXE and .COM files along with any desiredcommand line arguments.
Wait for command to execute indicates whether the program should runbefore or after the command is executed.
OK accepts the current settings and data, and subsequently closes the formor window.
Cancel closes the dialog box without saving or executing a command.
Clear empties the fields so information can be re-entered.
Save Only saves the created code to the Program Editor, but does not run thecode.
Help opens the Help topic associated with the module being used. (Currently
Disabled).
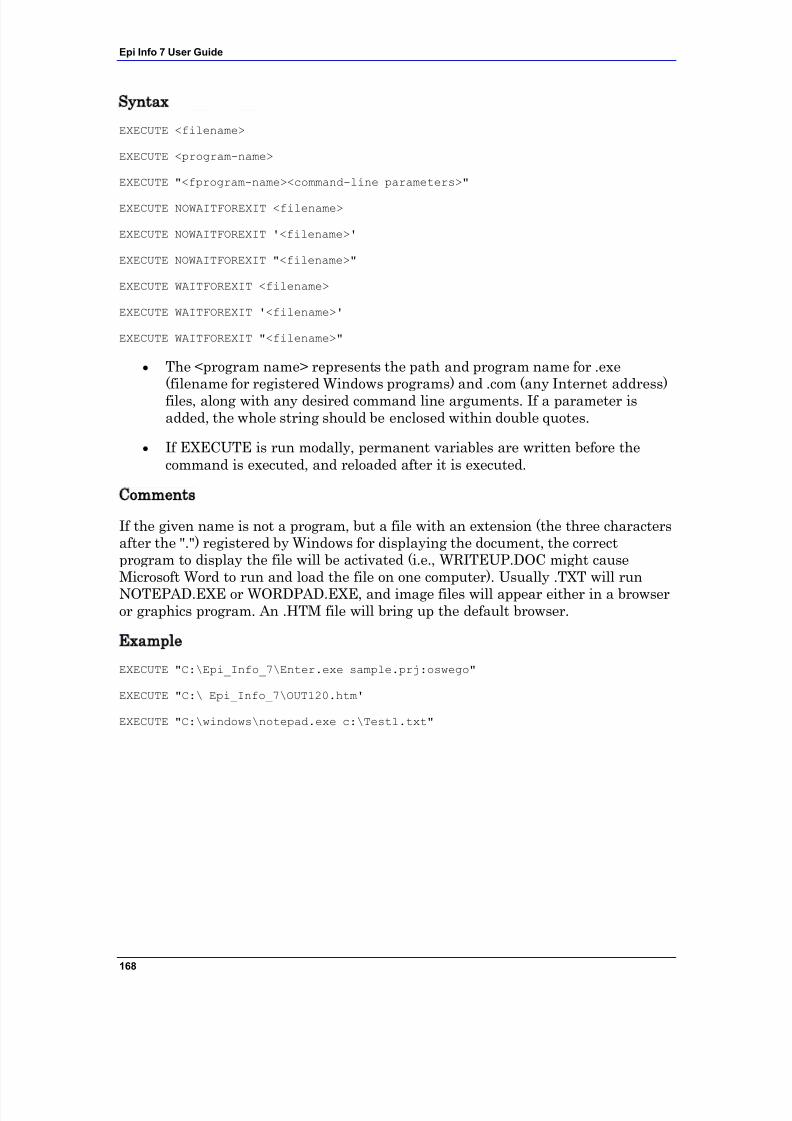
7/14/2019 Epi Info 7 User Guide-V1.0 Cleared
http://slidepdf.com/reader/full/epi-info-7-user-guide-v10-cleared-563109dd5013b 174/368
Epi Info 7 User Guide
168
Syntax
EXECUTE <filename>
EXECUTE <program-name>
EXECUTE "<fprogram-name><command-line parameters>"
EXECUTE NOWAITFOREXIT <filename>
EXECUTE NOWAITFOREXIT '<filename>'
EXECUTE NOWAITFOREXIT "<filename>"
EXECUTE WAITFOREXIT <filename>
EXECUTE WAITFOREXIT '<filename>'
EXECUTE WAITFOREXIT "<filename>"
The <program name> represents the path and program name for .exe(filename for registered Windows programs) and .com (any Internet address)files, along with any desired command line arguments. If a parameter isadded, the whole string should be enclosed within double quotes.
If EXECUTE is run modally, permanent variables are written before thecommand is executed, and reloaded after it is executed.
Comments
If the given name is not a program, but a file with an extension (the three charactersafter the ".") registered by Windows for displaying the document, the correctprogram to display the file will be activated (i.e., WRITEUP.DOC might causeMicrosoft Word to run and load the file on one computer). Usually .TXT will run
NOTEPAD.EXE or WORDPAD.EXE, and image files will appear either in a browseror graphics program. An .HTM file will bring up the default browser.
Example
EXECUTE "C:\Epi_Info_7\Enter.exe sample.prj:oswego"
EXECUTE "C:\ Epi_Info_7\OUT120.htm'
EXECUTE "C:\windows\notepad.exe c:\Test1.txt"
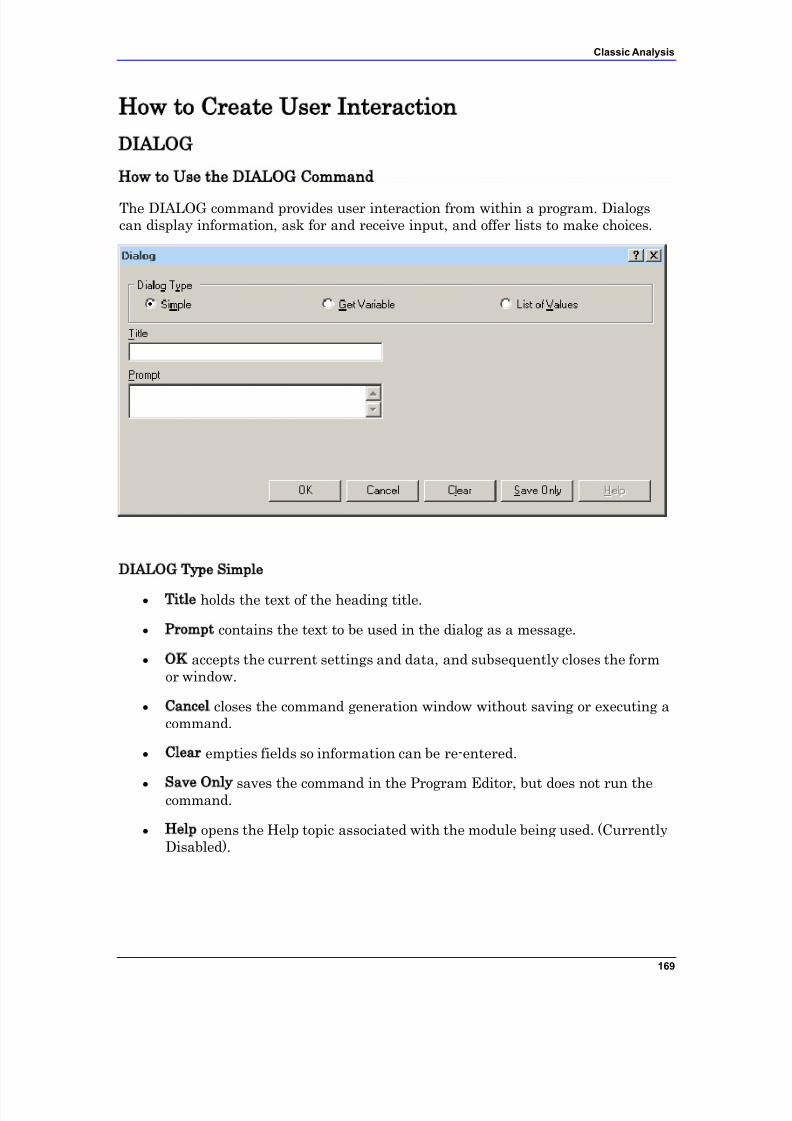
7/14/2019 Epi Info 7 User Guide-V1.0 Cleared
http://slidepdf.com/reader/full/epi-info-7-user-guide-v10-cleared-563109dd5013b 175/368
Classic Analysis
169
How to Create User Interaction
DIALOG
How to Use the DIALOG Command
The DIALOG command provides user interaction from within a program. Dialogscan display information, ask for and receive input, and offer lists to make choices.
DIALOG Type Simple
Title holds the text of the heading title.
Prompt contains the text to be used in the dialog as a message.
OK accepts the current settings and data, and subsequently closes the formor window.
Cancel closes the command generation window without saving or executing acommand.
Clear empties fields so information can be re-entered.
Save Only saves the command in the Program Editor, but does not run thecommand.
Help opens the Help topic associated with the module being used. (CurrentlyDisabled).
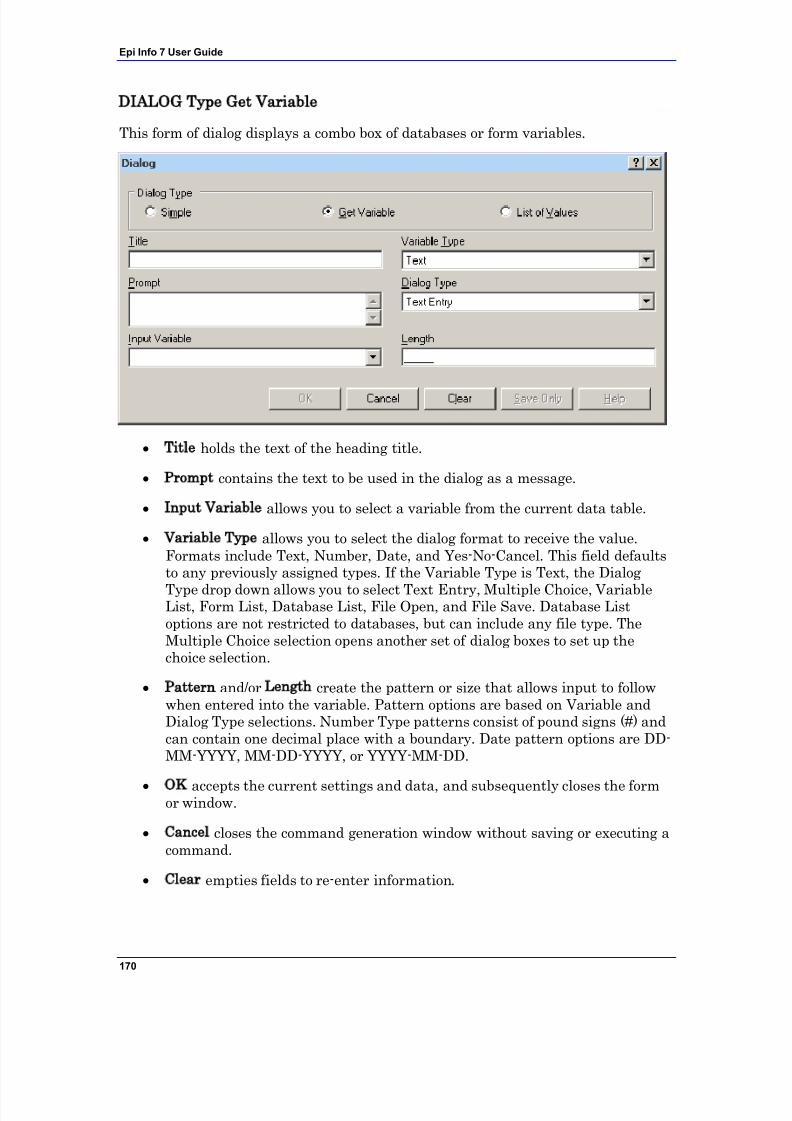
7/14/2019 Epi Info 7 User Guide-V1.0 Cleared
http://slidepdf.com/reader/full/epi-info-7-user-guide-v10-cleared-563109dd5013b 176/368
Epi Info 7 User Guide
170
DIALOG Type Get Variable
This form of dialog displays a combo box of databases or form variables.
Title holds the text of the heading title.
Prompt contains the text to be used in the dialog as a message.
Input Variable allows you to select a variable from the current data table.
Variable Type allows you to select the dialog format to receive the value.Formats include Text, Number, Date, and Yes-No-Cancel. This field defaultsto any previously assigned types. If the Variable Type is Text, the Dialog
Type drop down allows you to select Text Entry, Multiple Choice, VariableList, Form List, Database List, File Open, and File Save. Database Listoptions are not restricted to databases, but can include any file type. TheMultiple Choice selection opens another set of dialog boxes to set up thechoice selection.
Pattern and/or Length create the pattern or size that allows input to followwhen entered into the variable. Pattern options are based on Variable andDialog Type selections. Number Type patterns consist of pound signs (#) andcan contain one decimal place with a boundary. Date pattern options are DD-MM-YYYY, MM-DD-YYYY, or YYYY-MM-DD.
OK accepts the current settings and data, and subsequently closes the formor window.
Cancel closes the command generation window without saving or executing acommand.
Clear empties fields to re-enter information.
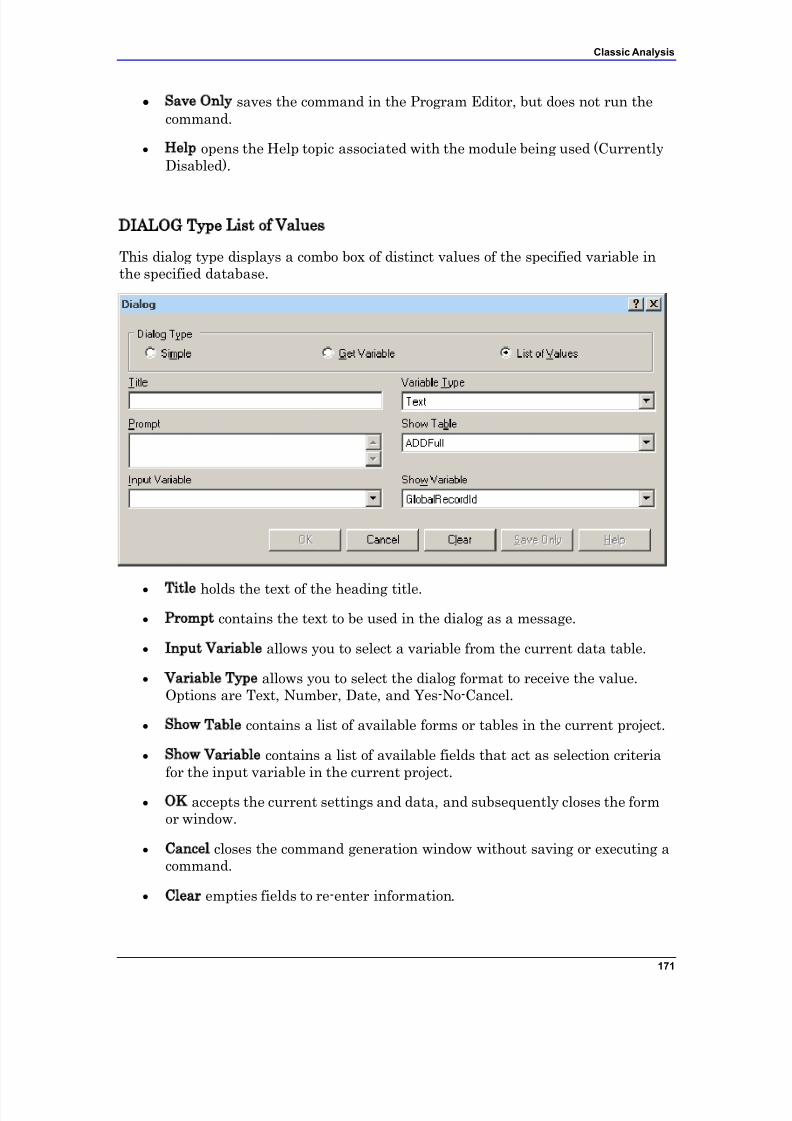
7/14/2019 Epi Info 7 User Guide-V1.0 Cleared
http://slidepdf.com/reader/full/epi-info-7-user-guide-v10-cleared-563109dd5013b 177/368
Classic Analysis
171
Save Only saves the command in the Program Editor, but does not run thecommand.
Help opens the Help topic associated with the module being used (CurrentlyDisabled).
DIALOG Type List of Values
This dialog type displays a combo box of distinct values of the specified variable inthe specified database.
Title holds the text of the heading title.
Prompt contains the text to be used in the dialog as a message.
Input Variable allows you to select a variable from the current data table.
Variable Type allows you to select the dialog format to receive the value.Options are Text, Number, Date, and Yes-No-Cancel.
Show Table contains a list of available forms or tables in the current project.
Show Variable contains a list of available fields that act as selection criteriafor the input variable in the current project.
OK accepts the current settings and data, and subsequently closes the formor window.
Cancel closes the command generation window without saving or executing acommand.
Clear empties fields to re-enter information.

7/14/2019 Epi Info 7 User Guide-V1.0 Cleared
http://slidepdf.com/reader/full/epi-info-7-user-guide-v10-cleared-563109dd5013b 178/368
Epi Info 7 User Guide
172
Save Only saves the command in the Program Editor, but does not run thecommand.
Help opens the Help topic associated with the module being used (CurrentlyDisabled).
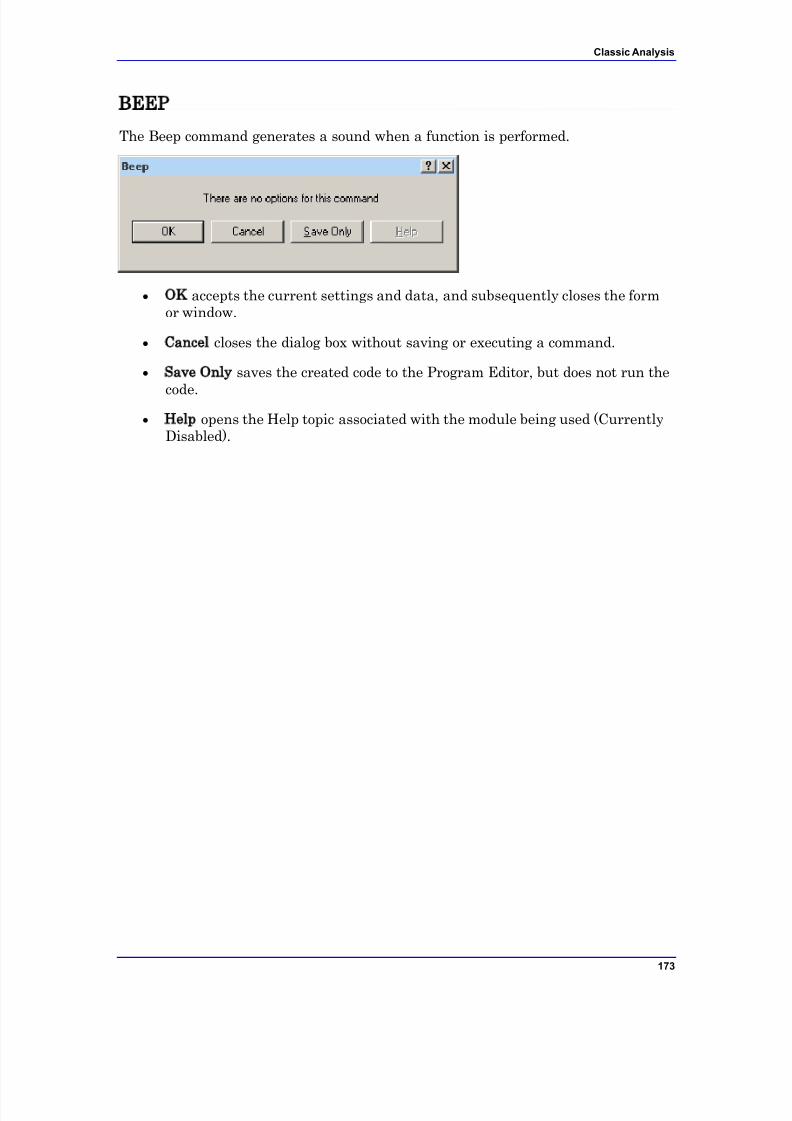
7/14/2019 Epi Info 7 User Guide-V1.0 Cleared
http://slidepdf.com/reader/full/epi-info-7-user-guide-v10-cleared-563109dd5013b 179/368
Classic Analysis
173
BEEP
The Beep command generates a sound when a function is performed.
OK accepts the current settings and data, and subsequently closes the formor window.
Cancel closes the dialog box without saving or executing a command.
Save Only saves the created code to the Program Editor, but does not run the
code.
Help opens the Help topic associated with the module being used (CurrentlyDisabled).
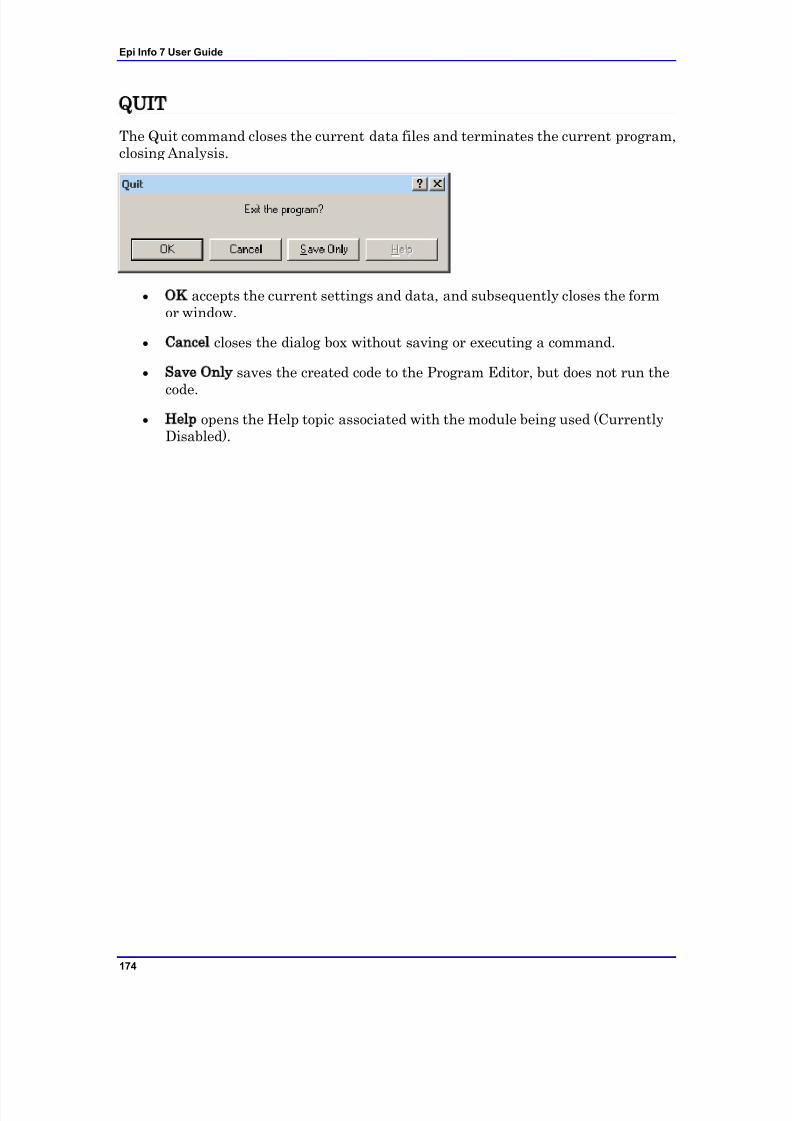
7/14/2019 Epi Info 7 User Guide-V1.0 Cleared
http://slidepdf.com/reader/full/epi-info-7-user-guide-v10-cleared-563109dd5013b 180/368
Epi Info 7 User Guide
174
QUIT
The Quit command closes the current data files and terminates the current program,closing Analysis.
OK accepts the current settings and data, and subsequently closes the formor window.
Cancel closes the dialog box without saving or executing a command.
Save Only saves the created code to the Program Editor, but does not run the
code.
Help opens the Help topic associated with the module being used (CurrentlyDisabled).

7/14/2019 Epi Info 7 User Guide-V1.0 Cleared
http://slidepdf.com/reader/full/epi-info-7-user-guide-v10-cleared-563109dd5013b 181/368
Classic Analysis
175
Use IF Statements with Permanent or Global Variables
If an IF statement condition depends on global or permanent variables, thevalue is computed immediately and only the true or false branch, as
appropriate, is followed. If an IF statement condition depends on a field variable, neither branch is
followed. However, computations within the branches are saved for execution,as appropriate, on each record. In the second case, non-computationalcommands (e.g., READ, SELECT, SORT, HEADER, and ROUTEOUT) arenever executed.
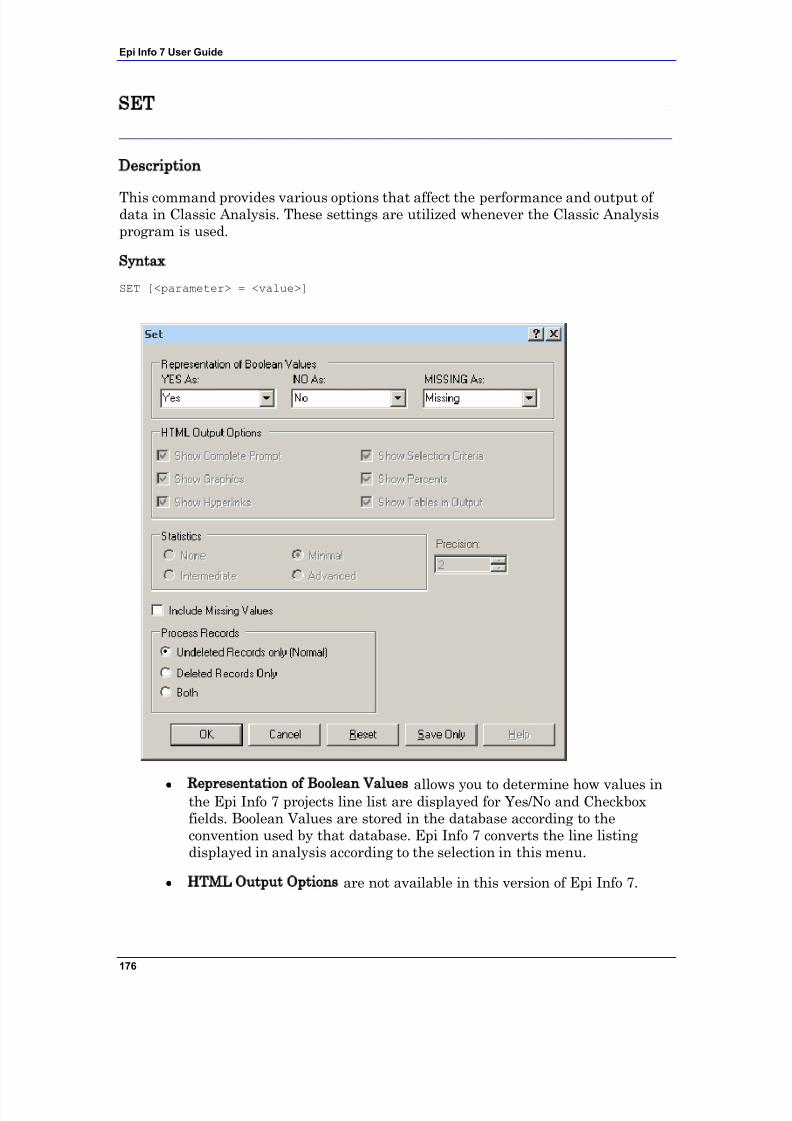
7/14/2019 Epi Info 7 User Guide-V1.0 Cleared
http://slidepdf.com/reader/full/epi-info-7-user-guide-v10-cleared-563109dd5013b 182/368
Epi Info 7 User Guide
176
SET
Description
This command provides various options that affect the performance and output of data in Classic Analysis. These settings are utilized whenever the Classic Analysisprogram is used.
Syntax
SET [<parameter> = <value>]
Representation of Boolean Values allows you to determine how values inthe Epi Info 7 projects line list are displayed for Yes/No and Checkboxfields. Boolean Values are stored in the database according to theconvention used by that database. Epi Info 7 converts the line listingdisplayed in analysis according to the selection in this menu.
HTML Output Options are not available in this version of Epi Info 7.
7/14/2019 Epi Info 7 User Guide-V1.0 Cleared
http://slidepdf.com/reader/full/epi-info-7-user-guide-v10-cleared-563109dd5013b 183/368
Classic Analysis
177
Statistics settings are not available in this version of Epi Info 7. Thegrayed-out display indicates analysis statistics are advanced. The None,Minimal and Intermediate settings will be available in a future release.
Precision setting is not available in this version of Epi Info 7.
Include Missing Values allows you to determine if you want missingvalues to be included if statistical calculations are made.
Process Records selects how records marked for deletion (deleted) will beprocessed. The normal default is to process only the undeleted records.
OK accepts the current settings and data, and subsequently closes theform or window.
Cancel closes the dialog box without saving or executing a command.
Reset clears (removes) any changes and returns all values to their defaultsettings.
Save Only saves the created code to the Program Editor, but does not runthe code.
Help opens the Help topic associated with the module being used.(Currently Disabled).
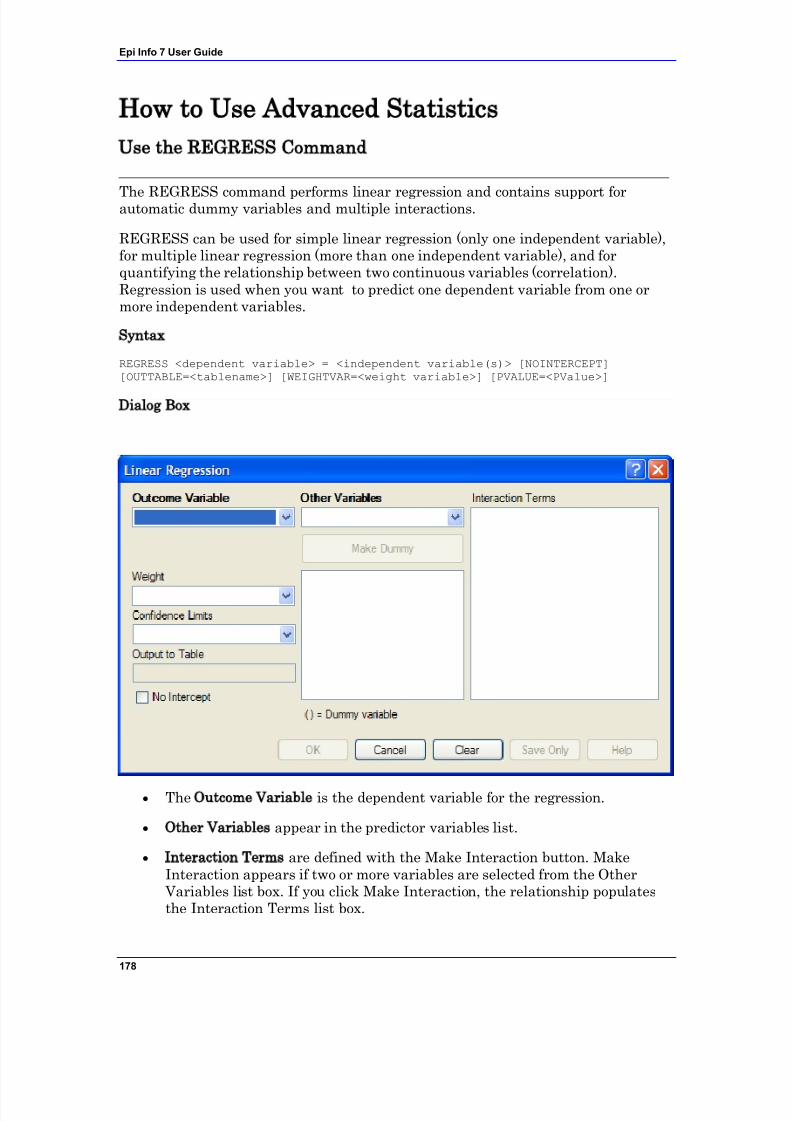
7/14/2019 Epi Info 7 User Guide-V1.0 Cleared
http://slidepdf.com/reader/full/epi-info-7-user-guide-v10-cleared-563109dd5013b 184/368
Epi Info 7 User Guide
178
How to Use Advanced Statistics
Use the REGRESS Command
The REGRESS command performs linear regression and contains support forautomatic dummy variables and multiple interactions.
REGRESS can be used for simple linear regression (only one independent variable),for multiple linear regression (more than one independent variable), and forquantifying the relationship between two continuous variables (correlation).Regression is used when you want to predict one dependent variable from one ormore independent variables.
Syntax
REGRESS <dependent variable> = <independent variable(s)> [NOINTERCEPT][OUTTABLE=<tablename>] [WEIGHTVAR=<weight variable>] [PVALUE=<PValue>]
Dialog Box
The Outcome Variable is the dependent variable for the regression.
Other Variables appear in the predictor variables list.
Interaction Terms are defined with the Make Interaction button. MakeInteraction appears if two or more variables are selected from the Other
Variables list box. If you click Make Interaction, the relationship populatesthe Interaction Terms list box.
7/14/2019 Epi Info 7 User Guide-V1.0 Cleared
http://slidepdf.com/reader/full/epi-info-7-user-guide-v10-cleared-563109dd5013b 185/368
Classic Analysis
179
Make Dummy is activated if you select a predictor variable. If you select anumeric variable, it will be treated as discrete rather than continuous; thevariable is enclosed in parentheses to indicate that dummy variables arebeing created. If a predictor variable enclosed in parentheses is selected inthe list, the Make Dummy button changes to Make Continuous. Selecting itresults in the variable being treated as continuous. If you select more thanone predictor variable, the Make Dummy button changes to MakeInteraction. Selecting it results in all possible combinations of the selectedvariables being added to the regression as interaction terms.
A Weight variable may selected to use in weighted analyses.
Confidence Limits specifies the probability level at which confidence limitsare computed (default=.05).
The Output to Table field identifies a table to receive output from thecommand. (Currently Disabled).
If you select No Intercept, the regression is performed without a constantterm, forcing the regression line through the origin.
OK accepts the current settings and data, and subsequently closes the formor window.
Save Only saves the created code to the Program Editor, but does not run thecode.
Cancel closes the dialog box without saving or executing a command.
Clear empties the fields so information can be re-entered.
Help opens the Help topic associated with the module being used. (CurrentlyDisabled).
How to Use
1. From the Analysis Command Tree, use the READ command to open a PRJproject file. Select a form or table.
2. From the Analysis Command Tree, click Advanced Statistics > LinearRegression. The REGRESS dialog box opens.
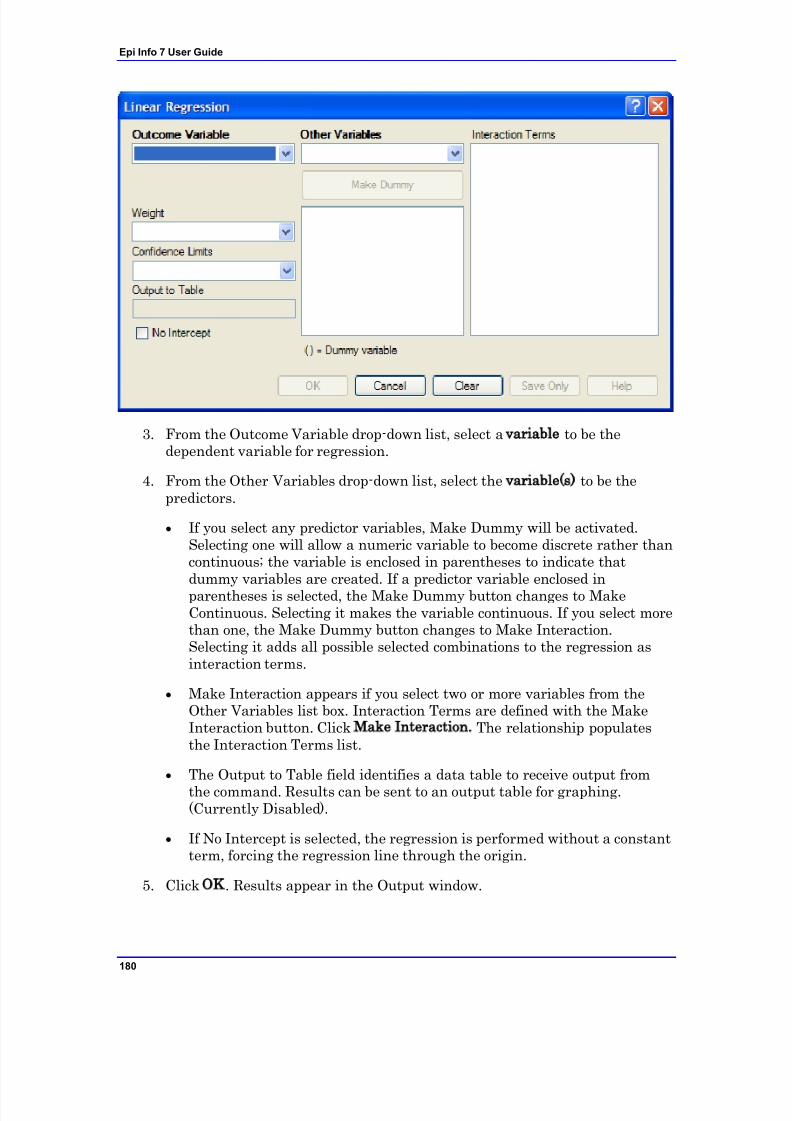
7/14/2019 Epi Info 7 User Guide-V1.0 Cleared
http://slidepdf.com/reader/full/epi-info-7-user-guide-v10-cleared-563109dd5013b 186/368
Epi Info 7 User Guide
180
3. From the Outcome Variable drop-down list, select a variable to be thedependent variable for regression.
4. From the Other Variables drop-down list, select the variable(s) to be thepredictors.
If you select any predictor variables, Make Dummy will be activated.Selecting one will allow a numeric variable to become discrete rather thancontinuous; the variable is enclosed in parentheses to indicate thatdummy variables are created. If a predictor variable enclosed inparentheses is selected, the Make Dummy button changes to MakeContinuous. Selecting it makes the variable continuous. If you select morethan one, the Make Dummy button changes to Make Interaction.Selecting it adds all possible selected combinations to the regression asinteraction terms.
Make Interaction appears if you select two or more variables from theOther Variables list box. Interaction Terms are defined with the MakeInteraction button. Click Make Interaction. The relationship populatesthe Interaction Terms list.
The Output to Table field identifies a data table to receive output fromthe command. Results can be sent to an output table for graphing.(Currently Disabled).
If No Intercept is selected, the regression is performed without a constantterm, forcing the regression line through the origin.
5. Click OK. Results appear in the Output window.
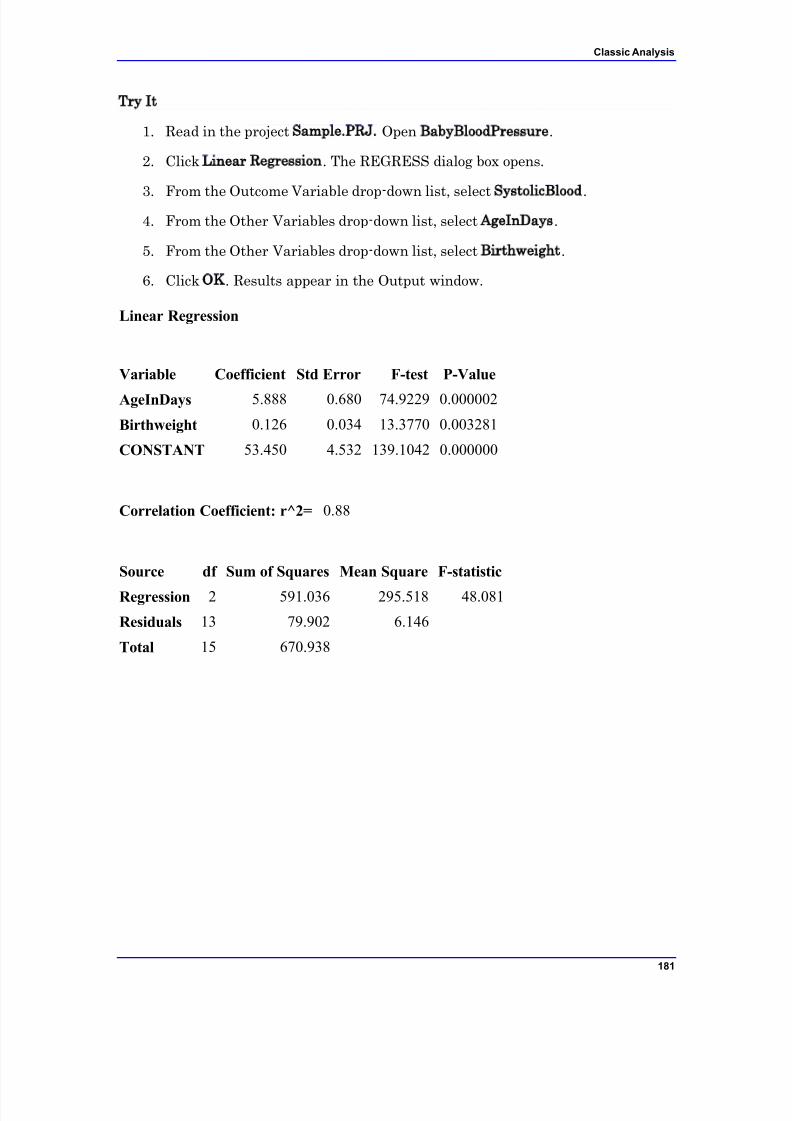
7/14/2019 Epi Info 7 User Guide-V1.0 Cleared
http://slidepdf.com/reader/full/epi-info-7-user-guide-v10-cleared-563109dd5013b 187/368
Classic Analysis
181
Try It
1. Read in the project Sample.PRJ. Open BabyBloodPressure.
2. Click Linear Regression. The REGRESS dialog box opens.
3. From the Outcome Variable drop-down list, select SystolicBlood.4. From the Other Variables drop-down list, select AgeInDays.
5. From the Other Variables drop-down list, select Birthweight.
6. Click OK. Results appear in the Output window.
Linear Regression
Variable Coefficient Std Error F-test P-Value
AgeInDays 5.888 0.680 74.9229 0.000002
Birthweight 0.126 0.034 13.3770 0.003281
CONSTANT 53.450 4.532 139.1042 0.000000
Correlation Coefficient: r^2= 0.88
Source df Sum of Squares Mean Square F-statistic
Regression 2 591.036 295.518 48.081
Residuals 13 79.902 6.146
Total 15 670.938
7/14/2019 Epi Info 7 User Guide-V1.0 Cleared
http://slidepdf.com/reader/full/epi-info-7-user-guide-v10-cleared-563109dd5013b 188/368
Epi Info 7 User Guide
182
Use the LOGISTIC Command
The Logistic Regression command performs conditional or unconditionalmultivariate logistic regression with automatic dummy variables and support formultiple interactions.
The dependent (Outcome) variable must have a Yes/No value. Records with missingvalues are excluded from the analyses.
Independent (Other Variables) can be numeric, categorical, or Yes/No variables.Missing is interpreted as missing, 0 is false, and any other response is true.Independent variables are controlled by the Include Missing setting. If IncludeMissing is used with missing values and true and false, dummy variables will bemade automatically, which contribute Yes vs. Missing and No vs. Missing.Independent variables of text type are automatically turned into dummy variables,which compare each value relative to the value lowest in the sort order. Date ornumeric type Independent variables are treated as continuous variables unless
surrounded by parentheses in the command. If that occurs, they automatically turninto dummy variables which compare each value relative to the lowest value.
Syntax
LOGISTIC <dependent variable> = <independent variable(s)> [MATCHVAR=<matchvariable>] [NOINTERCEPT] [OUTTABLE=<tablename>] [WEIGHTVAR=<weight variable>][PVALUE=<PValue>]
Dialog Box
1. From the Analysis Command Tree, use the READ command to open a PRJproject file. Select a form or table.
2. From the Analysis Command Tree, click Advanced Statistics > LogisticRegression. The LOGISTIC dialog box opens.
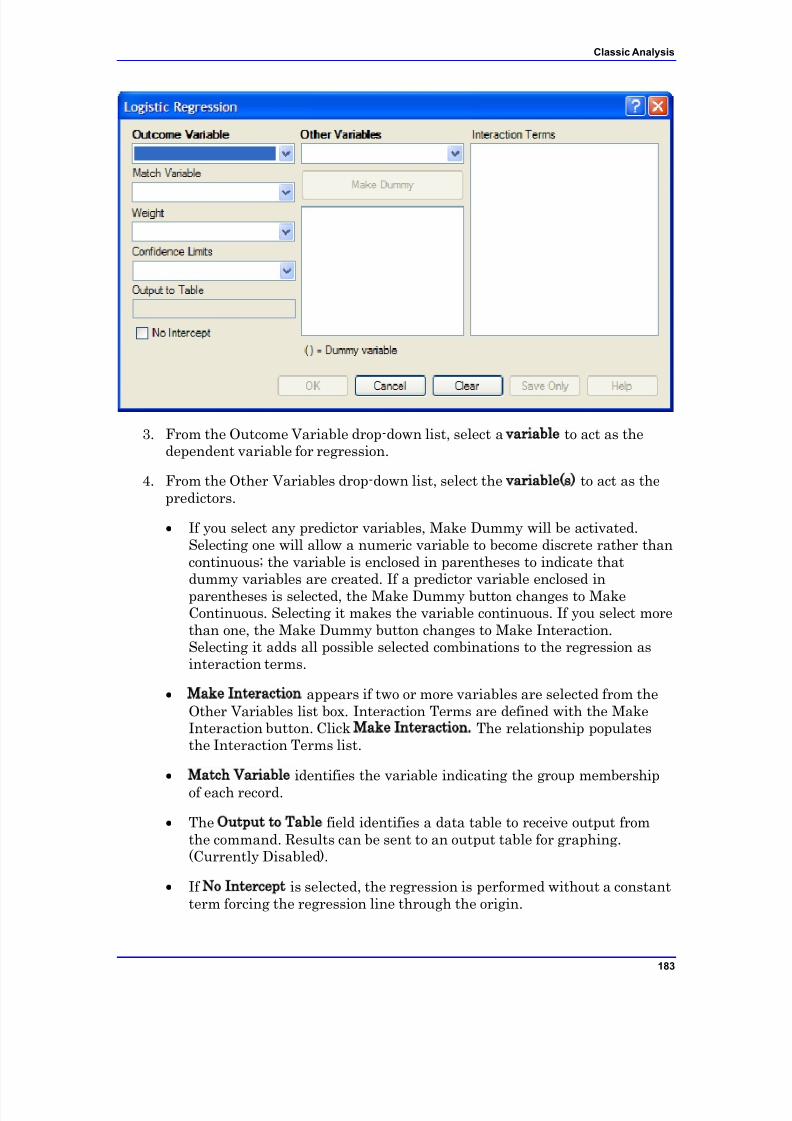
7/14/2019 Epi Info 7 User Guide-V1.0 Cleared
http://slidepdf.com/reader/full/epi-info-7-user-guide-v10-cleared-563109dd5013b 189/368
Classic Analysis
183
3. From the Outcome Variable drop-down list, select a variable to act as thedependent variable for regression.
4. From the Other Variables drop-down list, select the variable(s) to act as thepredictors.
If you select any predictor variables, Make Dummy will be activated.Selecting one will allow a numeric variable to become discrete rather thancontinuous; the variable is enclosed in parentheses to indicate thatdummy variables are created. If a predictor variable enclosed inparentheses is selected, the Make Dummy button changes to MakeContinuous. Selecting it makes the variable continuous. If you select morethan one, the Make Dummy button changes to Make Interaction.Selecting it adds all possible selected combinations to the regression asinteraction terms.
Make Interaction appears if two or more variables are selected from theOther Variables list box. Interaction Terms are defined with the MakeInteraction button. Click Make Interaction. The relationship populatesthe Interaction Terms list.
Match Variable identifies the variable indicating the group membershipof each record.
The Output to Table field identifies a data table to receive output fromthe command. Results can be sent to an output table for graphing.(Currently Disabled).
If No Intercept is selected, the regression is performed without a constantterm forcing the regression line through the origin.
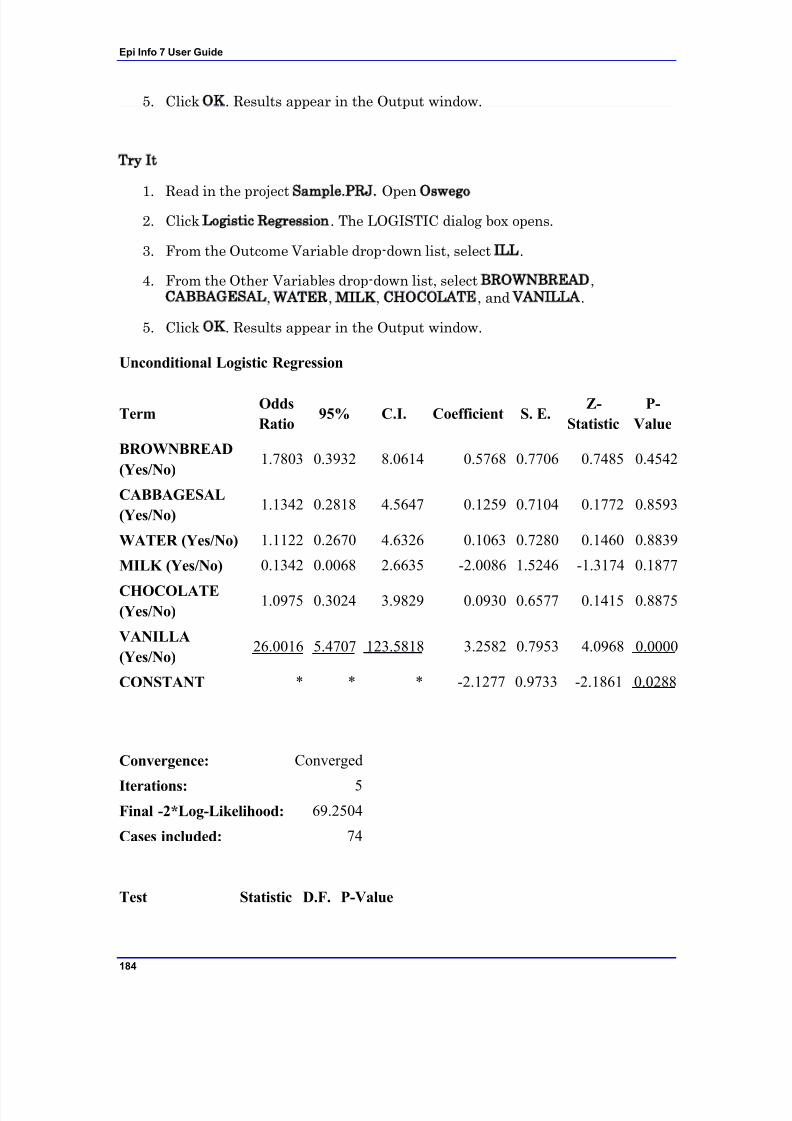
7/14/2019 Epi Info 7 User Guide-V1.0 Cleared
http://slidepdf.com/reader/full/epi-info-7-user-guide-v10-cleared-563109dd5013b 190/368
Epi Info 7 User Guide
184
5. Click OK. Results appear in the Output window.
Try It
1. Read in the project Sample.PRJ. Open Oswego 2. Click Logistic Regression. The LOGISTIC dialog box opens.
3. From the Outcome Variable drop-down list, select ILL.
4. From the Other Variables drop-down list, select BROWNBREAD,CABBAGESAL, WATER, MILK, CHOCOLATE, and VANILLA.
5. Click OK. Results appear in the Output window.
Unconditional Logistic Regression
Convergence: Converged
Iterations: 5
Final -2*Log-Likelihood: 69.2504
Cases included: 74
Term Odds
Ratio 95% C.I. Coefficient S. E.
Z-
Statistic
P-
Value
BROWNBREAD
(Yes/No)1.7803 0.3932 8.0614 0.5768 0.7706 0.7485 0.4542
CABBAGESAL
(Yes/No)1.1342 0.2818 4.5647 0.1259 0.7104 0.1772 0.8593
WATER (Yes/No) 1.1122 0.2670 4.6326 0.1063 0.7280 0.1460 0.8839
MILK (Yes/No) 0.1342 0.0068 2.6635 -2.0086 1.5246 -1.3174 0.1877
CHOCOLATE(Yes/No)
1.0975 0.3024 3.9829 0.0930 0.6577 0.1415 0.8875
VANILLA
(Yes/No)26.0016 5.4707 123.5818 3.2582 0.7953 4.0968 0.0000
CONSTANT * * * -2.1277 0.9733 -2.1861 0.0288
Test Statistic D.F. P-Value
7/14/2019 Epi Info 7 User Guide-V1.0 Cleared
http://slidepdf.com/reader/full/epi-info-7-user-guide-v10-cleared-563109dd5013b 191/368
Classic Analysis
185
Use the KMSURVIVAL Command
The KMSURVIVAL command performs Kaplan-Meier (KM) Survival Analysis. Theobjective of this methodology is to estimate the probability of survival of a definedgroup at a designated time interval. KM uses a non-parametric survival function fora group of patients (their survival probability at time t ) and does not makeassumptions about the survival distribution.
What distinguishes survival analysis from most other statistical methods is thepresence of “censoring” for incomplete observations. In a study following two
different treatment regimens, analysis of the trial typically occurred well before allpatients died. For those still alive at the time of analysis, the true survival time wasknown only to be greater than the time observed to date. These observations arecalled “censored.” Two other sources of incomplete observation are patients “lost tofollow-up,” and the appearance of an event other than the event being studied.
Survival analysis requires censored and time variables, the units of time, and thegroups being compared.
Syntax
KMSURVIVAL <TimeVar> = <GroupVar> * <CensorVar> (<Value>)[TIMEUNIT="<TimeUnit>"] [OUTTABLE=<TableName>] [GRAPHTYPE ="<GraphType>"]
[WEIGHTVAR=<WeightVar>]
Dialog Box
1. From the Analysis Command Tree, use the READ command to open a PRJ project file. Select a form or table.
2. From the Analysis Command Tree, click Advanced Statistics > Kaplan-Meier Survival. The Kaplan-Meier Survival dialog box opens.
3. From the Censored Variable drop-down list, select the variable thatindicates whether the case is a failure or a censored case.
4. From the Value for Uncensored drop-down list, select the value of thecensored variable that indicates a failure.
5. From the Time Variable drop-down list, select the variable that indicates atwhich time the failure or censorship occurred.
6. From the Test Group Variable drop-down list, select the discrete variableused to divide cases into groups.
Score 28.0180 6 0.0001
Likelihood Ratio 29.8484 6 0.0000
7/14/2019 Epi Info 7 User Guide-V1.0 Cleared
http://slidepdf.com/reader/full/epi-info-7-user-guide-v10-cleared-563109dd5013b 192/368
Epi Info 7 User Guide
186
7. Click OK. Results appear in the Output window.
A Survival Probability graph is produced by default. Use the Graph Typedrop-down list to select the Log-Survival graph type or None to view theresults in a table.
Try It
1. Read in the Sample.PRJ project. Open the Addicts table.
2. Click KAPLAN-MEIER SURVIVAL. The Kaplan-Meier Survival dialog boxopens.
3. From the Censored Variable drop-down list, select Status.
4. From the Value for Uncensored drop-down list, select 1.
5. From the Time Variable drop-down list, select Survival_Time_Days .
6. From the Test Group Variable drop-down list, select Clinic.
7. Click OK. Results appear in the Output window.
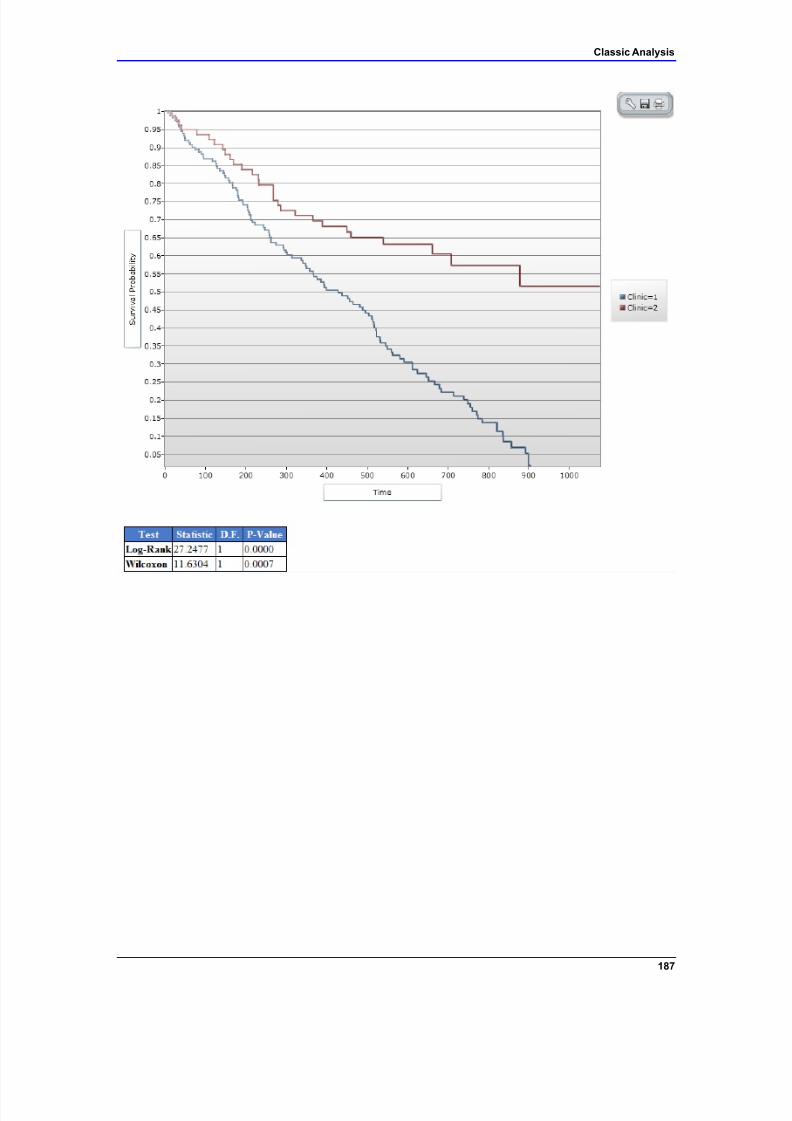
7/14/2019 Epi Info 7 User Guide-V1.0 Cleared
http://slidepdf.com/reader/full/epi-info-7-user-guide-v10-cleared-563109dd5013b 193/368
Classic Analysis
187
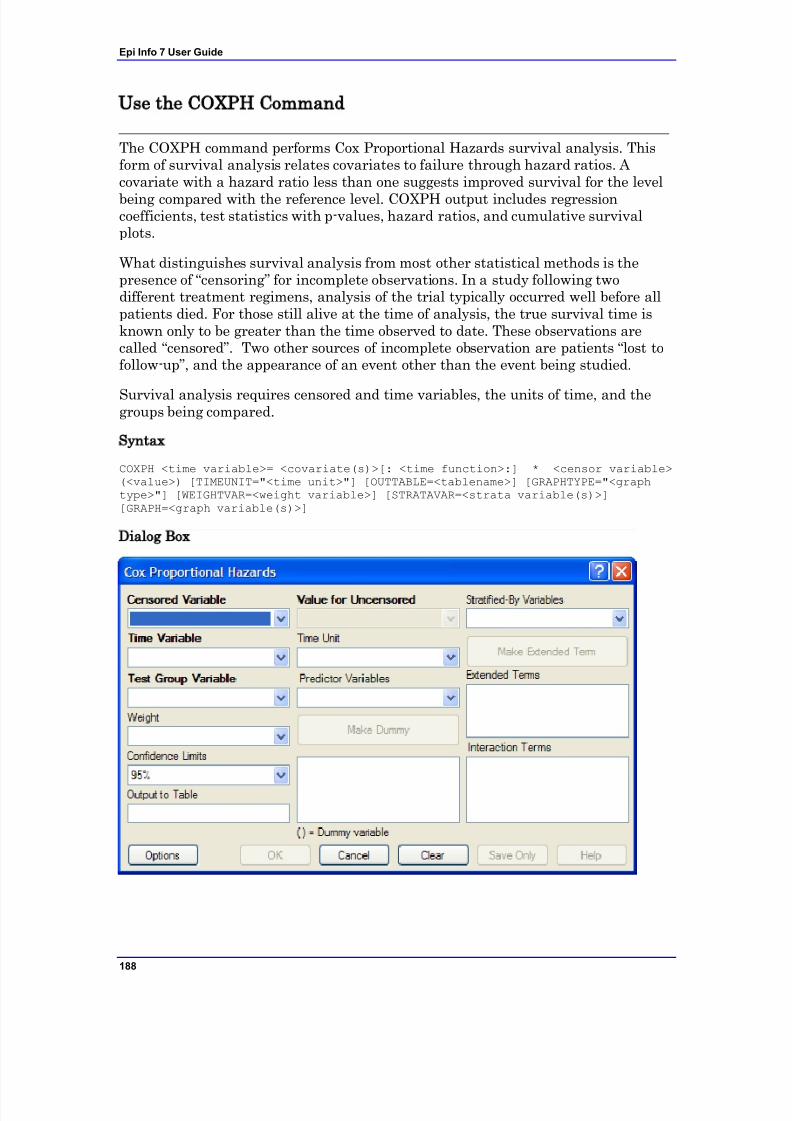
7/14/2019 Epi Info 7 User Guide-V1.0 Cleared
http://slidepdf.com/reader/full/epi-info-7-user-guide-v10-cleared-563109dd5013b 194/368
Epi Info 7 User Guide
188
Use the COXPH Command
The COXPH command performs Cox Proportional Hazards survival analysis. Thisform of survival analysis relates covariates to failure through hazard ratios. A covariate with a hazard ratio less than one suggests improved survival for the level
being compared with the reference level. COXPH output includes regressioncoefficients, test statistics with p-values, hazard ratios, and cumulative survivalplots.
What distinguishes survival analysis from most other statistical methods is thepresence of “censoring” for incomplete observations. In a study following twodifferent treatment regimens, analysis of the trial typically occurred well before allpatients died. For those still alive at the time of analysis, the true survival time isknown only to be greater than the time observed to date. These observations arecalled “censored”. Two other sources of incomplete observation are patients “lost tofollow-up”, and the appearance of an event other than the event being studied.
Survival analysis requires censored and time variables, the units of time, and thegroups being compared.
Syntax
COXPH <time variable>= <covariate(s)>[: <time function>:] * <censor variable>(<value>) [TIMEUNIT="<time unit>"] [OUTTABLE=<tablename>] [GRAPHTYPE="<graphtype>"] [WEIGHTVAR=<weight variable>] [STRATAVAR=<strata variable(s)>][GRAPH=<graph variable(s)>]
Dialog Box
7/14/2019 Epi Info 7 User Guide-V1.0 Cleared
http://slidepdf.com/reader/full/epi-info-7-user-guide-v10-cleared-563109dd5013b 195/368
Classic Analysis
189
The Censored Variable indicates whether the case is a failure or censored.
The Time Variable indicates at which time the failure or censorship occurred.
Test Group Variable is a discrete variable used to divide cases into groups forcomparison. In the Cox model, there is no essential difference between the
group variable and other predictor terms. For this reason, its use is optional.
A Weight variable is selected for use in weighted analyses. The weightvariable applies to all aggregation clauses.
Confidence Limits indicate the probability level at which confidence limitsshould be computed (default=.05).
The Output to Table field identifies a data table to receive output from thecommand. (Currently Disabled).
Value for Uncensored is the value of the censored variable that indicates afailure.
Time Unit is the unit in which the time variable is expressed.
Predictor Variables populates the predictor variables list.
If a predictor variable is selected, Make Dummy is active. If selected, anumeric variable is treated as discrete rather than continuous; the variable isenclosed in parentheses to indicate that dummy variables are being created.If you select a predictor variable enclosed in parentheses, the button changesto Make Continuous. Selecting it results in the variable being treated ascontinuous.
Stratify by identifies the variable (if any) to be used to stratify data.
Options opens the graph selection window and allows you to select variablesfor graphing and graph types.
OK accepts the current settings and data, and subsequently closes the formor window.
Save Only saves the created code to the Program Editor, but does not run thecode.
Cancel closes the dialog box without saving or executing a command.
Clear empties the fields so information can be re-entered.
Help opens the Help topic associated with the module being used. (CurrentlyDisabled).
Try It
7/14/2019 Epi Info 7 User Guide-V1.0 Cleared
http://slidepdf.com/reader/full/epi-info-7-user-guide-v10-cleared-563109dd5013b 196/368
Epi Info 7 User Guide
190
1. From the Analysis Command Tree, use the READ command to open a PRJproject file. Select a form or table.
2. From the Analysis Command Tree, click Advanced Statistics > CoxProportional Hazards. The Cox Proportional Hazards dialog box opens.
3. From the Censored Variable drop-down list, select the variable that indicateswhether the case is a failure or a censored case.
4. From the Value for Uncensored drop-down list, select the value of thecensored variable that indicates a failure.
5. From the Time Variable drop-down list, select the variable that indicates atwhich time the failure or censorship occurred.
6. From the Time Unit drop-down list, select the unit in which the time variableis expressed, if needed.
7. From the Test Group Variable drop-down list, select the discrete variableused to divide cases into groups.
In the Cox model, there is no essential difference between the groupvariable and other predictor terms. For this reason, using the groupvariable is optional.
8. From the Other Variables drop-down list, select the predictor variables.
If you select any predictor variables, Make Dummy will be activated.Selecting will allow a numeric variable to become discrete rather thancontinuous; the variable is enclosed in parentheses to indicate thatdummy variables are created. If a predictor variable enclosed in
parentheses is selected in the list, the Make Dummy button changes toMake Continuous. Selecting it makes the variable continuous. If youselect more than one, the Make Dummy button changes to MakeInteraction. Selecting it results in all possible combinations of the selectedvariables being added to the regression as interaction terms.
9. Click Graph Options. The Cox Graph Options dialog box opens.
10. From the Plot Variables drop-down list, select a graph type.
11. From the list box, select a variable(s) to graph.
12. Clear the Customize Graph checkbox.13. Click OK. The Cox Proportional Hazards dialog box opens.
14. Click OK. Results appear in the Output window.
Try It
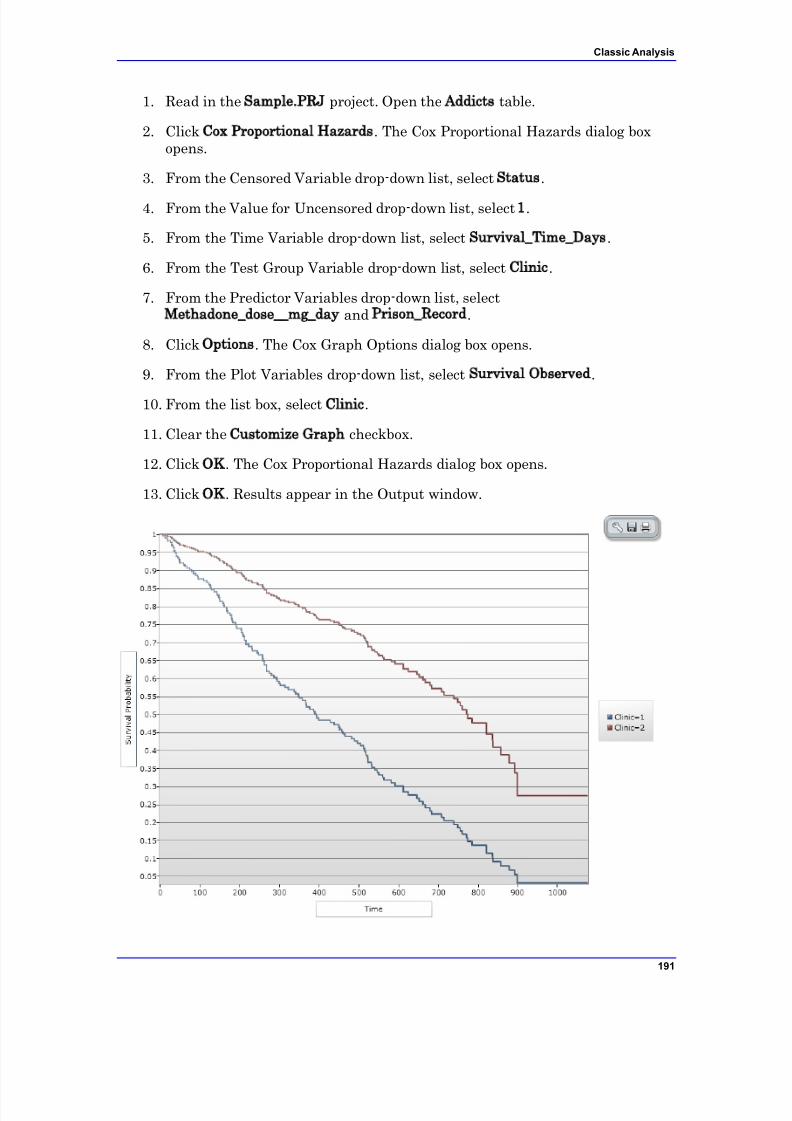
7/14/2019 Epi Info 7 User Guide-V1.0 Cleared
http://slidepdf.com/reader/full/epi-info-7-user-guide-v10-cleared-563109dd5013b 197/368
Classic Analysis
191
1. Read in the Sample.PRJ project. Open the Addicts table.
2. Click Cox Proportional Hazards. The Cox Proportional Hazards dialog boxopens.
3. From the Censored Variable drop-down list, select Status.
4. From the Value for Uncensored drop-down list, select 1.
5. From the Time Variable drop-down list, select Survival_Time_Days .
6. From the Test Group Variable drop-down list, select Clinic.
7. From the Predictor Variables drop-down list, selectMethadone_dose__mg_day and Prison_Record.
8. Click Options. The Cox Graph Options dialog box opens.
9. From the Plot Variables drop-down list, select Survival Observed.
10. From the list box, select Clinic.
11. Clear the Customize Graph checkbox.
12. Click OK. The Cox Proportional Hazards dialog box opens.
13. Click OK. Results appear in the Output window.
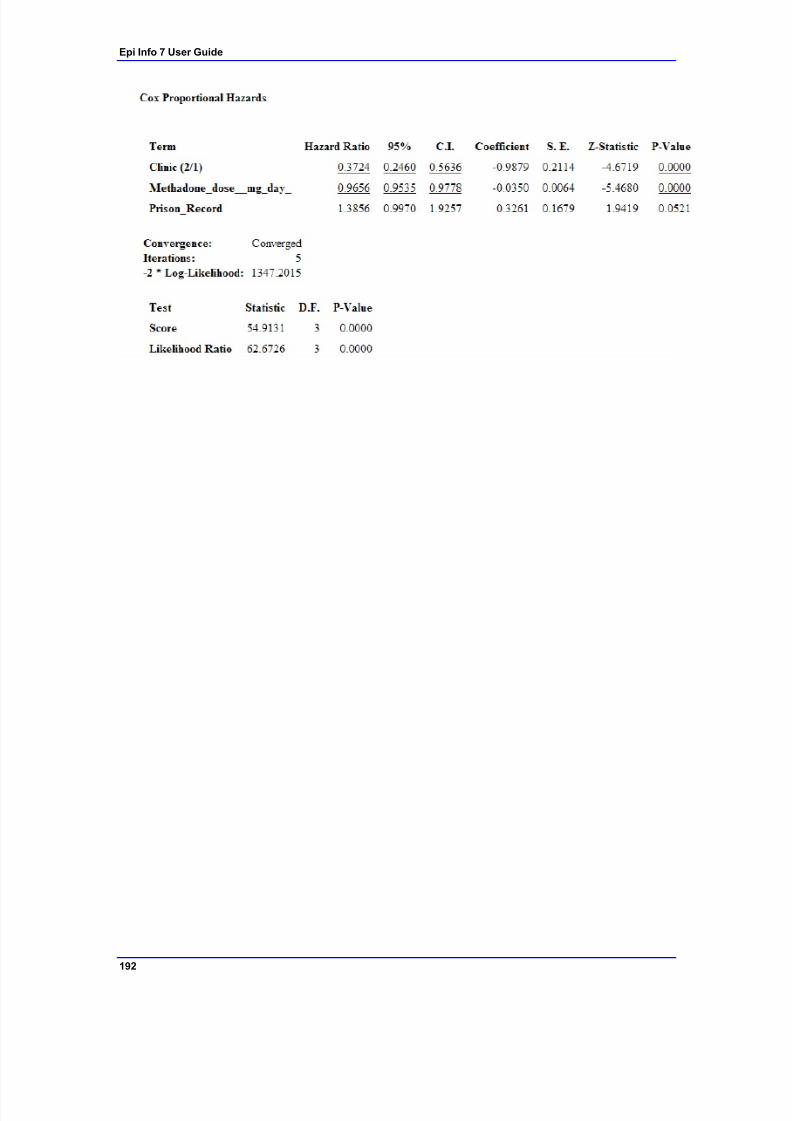
7/14/2019 Epi Info 7 User Guide-V1.0 Cleared
http://slidepdf.com/reader/full/epi-info-7-user-guide-v10-cleared-563109dd5013b 198/368
Epi Info 7 User Guide
192
7/14/2019 Epi Info 7 User Guide-V1.0 Cleared
http://slidepdf.com/reader/full/epi-info-7-user-guide-v10-cleared-563109dd5013b 199/368
Classic Analysis
193
Complex Sample Frequencies, Tables, and Means
The Frequencies (FREQ), Tables (TABLES), and Means (MEANS) commands in theClassic Analysis program perform statistical calculations that assume the datacomes from simple random (or unbiased systematic) samples. More complicatedsampling strategies are used in many survey applications. These may involvesampling features (i.e., stratification, cluster sampling, and the use of unequalsampling fractions). Surveys that include some form of complex sampling include thecoverage surveys of the WHO Expanded Program on Immunization (EPI)(Lemeshow and Robinson, 1985) and CDC‟s Behavioral Risk Factor SurveillanceSystem (Marks et al., 1985).
The CSAMPLE functions compute proportions or means with standard errors andconfidence limits for studies where the data did not come from a simple randomsample. If tables with two dimensions are requested, the odds ratio, risk ratio, andrisk difference are also calculated.
Data from complex sample designs should be analyzed with methods that accountfor the sampling design. In the past, easy-to-use programs were not available foranalysis of such data. CSAMPLE provides these facilities. It can form the basis of acomplete survey system with an understanding of sampling design and analysis.
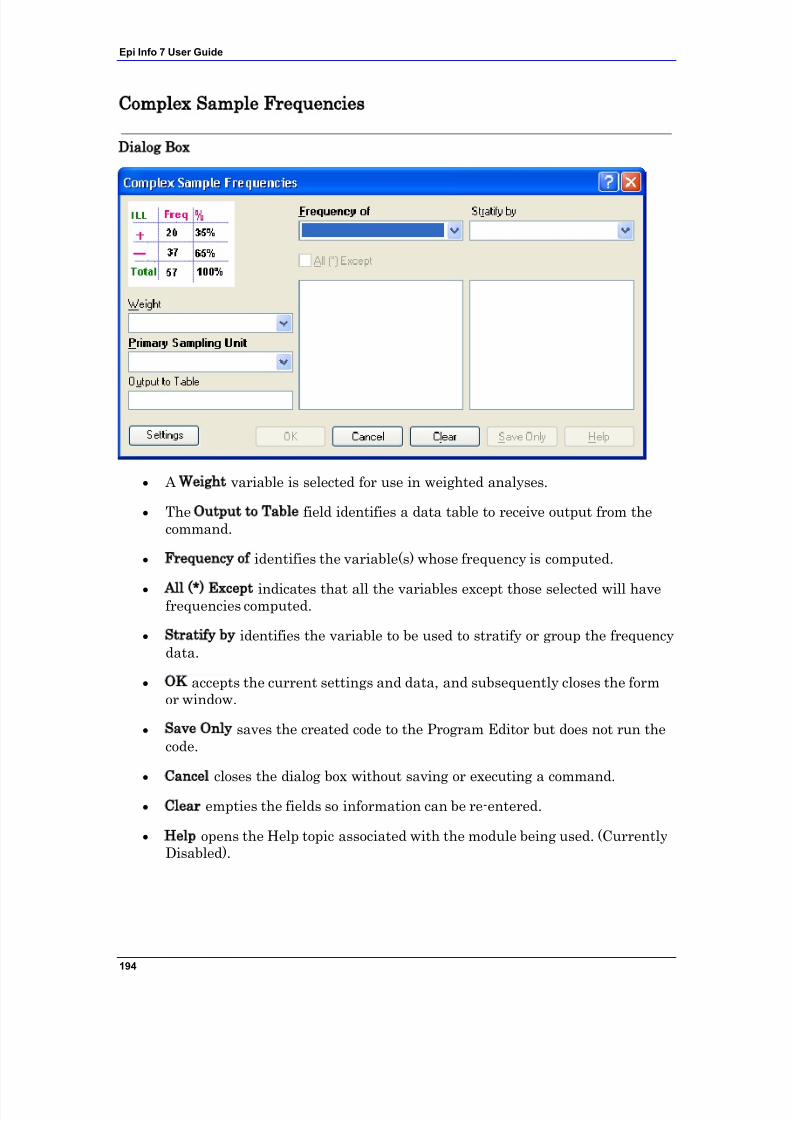
7/14/2019 Epi Info 7 User Guide-V1.0 Cleared
http://slidepdf.com/reader/full/epi-info-7-user-guide-v10-cleared-563109dd5013b 200/368
Epi Info 7 User Guide
194
Complex Sample Frequencies
Dialog Box
A Weight variable is selected for use in weighted analyses.
The Output to Table field identifies a data table to receive output from thecommand.
Frequency of identifies the variable(s) whose frequency is computed.
All (*) Except indicates that all the variables except those selected will havefrequencies computed.
Stratify by identifies the variable to be used to stratify or group the frequencydata.
OK accepts the current settings and data, and subsequently closes the formor window.
Save Only saves the created code to the Program Editor but does not run thecode.
Cancel closes the dialog box without saving or executing a command.
Clear empties the fields so information can be re-entered.
Help opens the Help topic associated with the module being used. (CurrentlyDisabled).
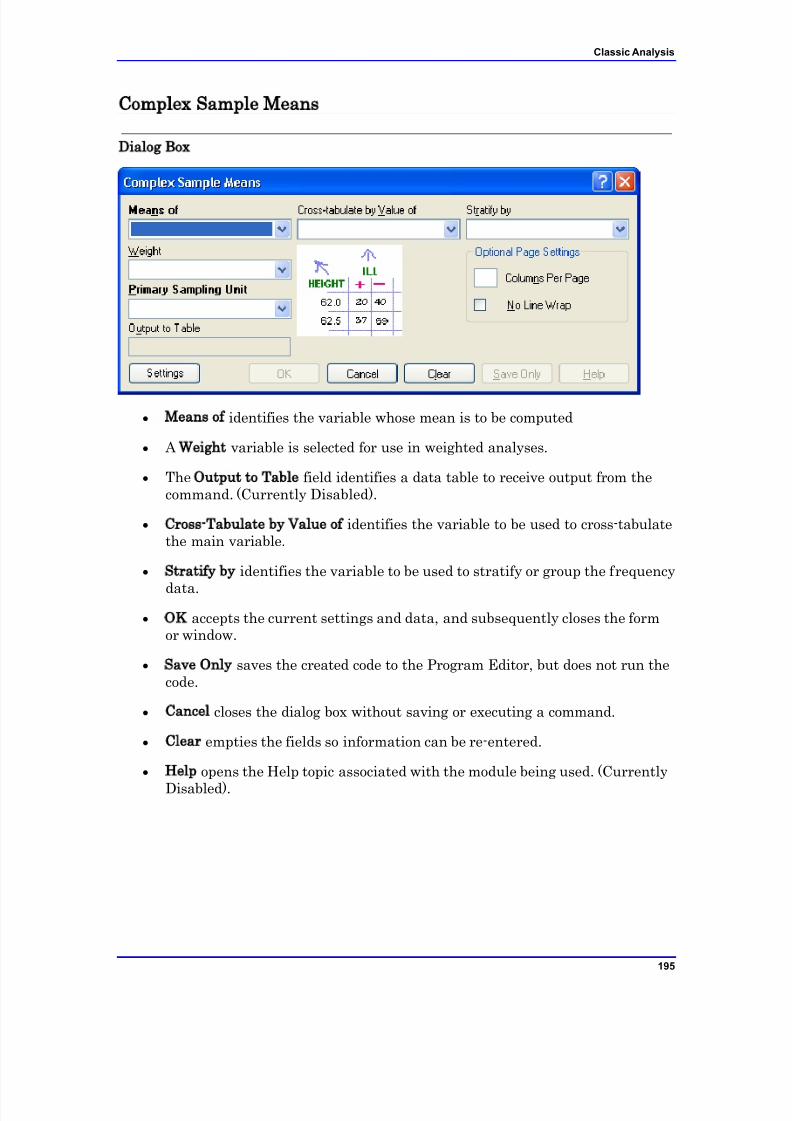
7/14/2019 Epi Info 7 User Guide-V1.0 Cleared
http://slidepdf.com/reader/full/epi-info-7-user-guide-v10-cleared-563109dd5013b 201/368
Classic Analysis
195
Complex Sample Means
Dialog Box
Means of identifies the variable whose mean is to be computed
A Weight variable is selected for use in weighted analyses.
The Output to Table field identifies a data table to receive output from thecommand. (Currently Disabled).
Cross-Tabulate by Value of identifies the variable to be used to cross-tabulatethe main variable.
Stratify by identifies the variable to be used to stratify or group the frequency
data.
OK accepts the current settings and data, and subsequently closes the formor window.
Save Only saves the created code to the Program Editor, but does not run thecode.
Cancel closes the dialog box without saving or executing a command.
Clear empties the fields so information can be re-entered.
Help opens the Help topic associated with the module being used. (Currently
Disabled).
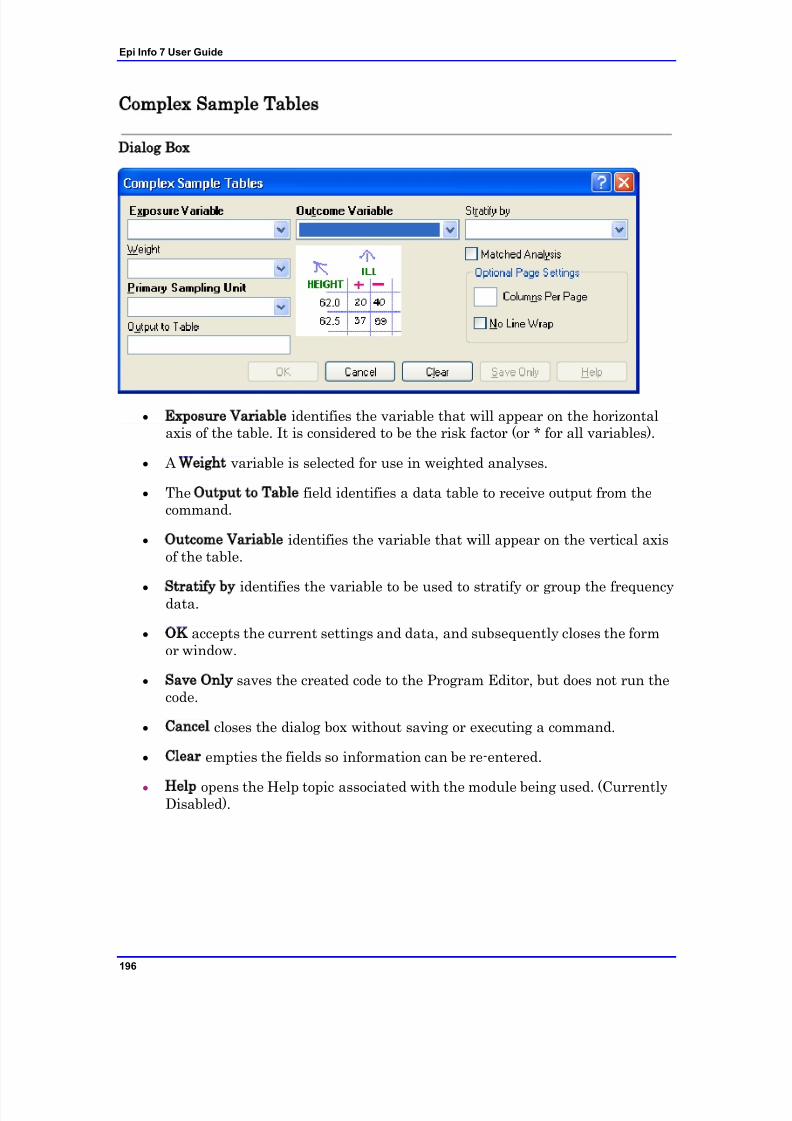
7/14/2019 Epi Info 7 User Guide-V1.0 Cleared
http://slidepdf.com/reader/full/epi-info-7-user-guide-v10-cleared-563109dd5013b 202/368
Epi Info 7 User Guide
196
Complex Sample Tables
Dialog Box
Exposure Variable identifies the variable that will appear on the horizontalaxis of the table. It is considered to be the risk factor (or * for all variables).
A Weight variable is selected for use in weighted analyses.
The Output to Table field identifies a data table to receive output from thecommand.
Outcome Variable identifies the variable that will appear on the vertical axisof the table.
Stratify by identifies the variable to be used to stratify or group the frequencydata.
OK accepts the current settings and data, and subsequently closes the formor window.
Save Only saves the created code to the Program Editor, but does not run thecode.
Cancel closes the dialog box without saving or executing a command.
Clear empties the fields so information can be re-entered.
Help opens the Help topic associated with the module being used. (CurrentlyDisabled).

7/14/2019 Epi Info 7 User Guide-V1.0 Cleared
http://slidepdf.com/reader/full/epi-info-7-user-guide-v10-cleared-563109dd5013b 203/368
Classic Analysis
197
7/14/2019 Epi Info 7 User Guide-V1.0 Cleared
http://slidepdf.com/reader/full/epi-info-7-user-guide-v10-cleared-563109dd5013b 204/368
198
Translation
Features
Translation of Epi Info 7 programs, help files, and exercises into non-Englishlanguages is formulated by placing the translated phrase of all English phrases usedin the programs in an MS Access .MDB database. This database can be placed inany directory accessible by Epi Info 7. It is recommended that you create a“Translation” subdirectory under the main directory of Epi Info (usually \Epi Info7). All translation .MDB database files can be placed under \Epi Info 7\Translationto make them easy to install and distribute. You can have additional translatedphrases, help files, and exercises placed in sub-directories named after the relevantlanguage (e.g., SPANISH). Translation can be done without changing file names,and individual translations can be installed or uninstalled without affecting themain programs. Switching from one language to another can be made from the main
menu, and is changed by setting the LANGUAGE under Tools>Options.
How to:
Translate Epi Info.
Create a New LANGUAGE .MDB Database.
Use an Existing LANGUAGE .MDB Database.
Choose a Language.

7/14/2019 Epi Info 7 User Guide-V1.0 Cleared
http://slidepdf.com/reader/full/epi-info-7-user-guide-v10-cleared-563109dd5013b 205/368
Translation
199
How To Translate Epi Info 7
Epi Info 7 is designed for easy translation into languages other than English. Allthe English phrases that can safely be translated are contained in a table in the
language database. Commands and other reserved words in the Analysis and CheckCommand programming languages should not be translated, however, you cantranslate the screen prompts that lead to their generation. Each Epi Info 7component/object has its own row in a translation database. Each language has itsown database, and needs to be installed into Epi Info 7.
Multiple languages can be installed/loaded at one time. You will need a translated.MDB file for the new language. The Epi Info User Community and the Epi InfoTeam will develop translation files as Epi Info 7 is distributed to the field. Languagetranslations will be available through the Epi Info website.
Currently, there are two ways to use Epi Info 7 with a language other than English.
If you do not have a language translation file to use, create a new language.MDB database for the language of your choice. For more information, see the“Create a New Language.mdb Database” section.
If you obtained a Language database, install it with the latest version of EpiInfo 7. For more information, see the “Use an Existing Language.mdbDatabase” section.
Create a New LANGUAGE .MDB Database
Make sure your Windows Locale setting is set with your local language locale beforefollowing these steps. You will need Microsoft Access to translate the phrases to yourlanguage.
1. From the Epi Info 7 main menu, select Tools>Options 2. Click the Language tab.3. Click the Create Translation File button.
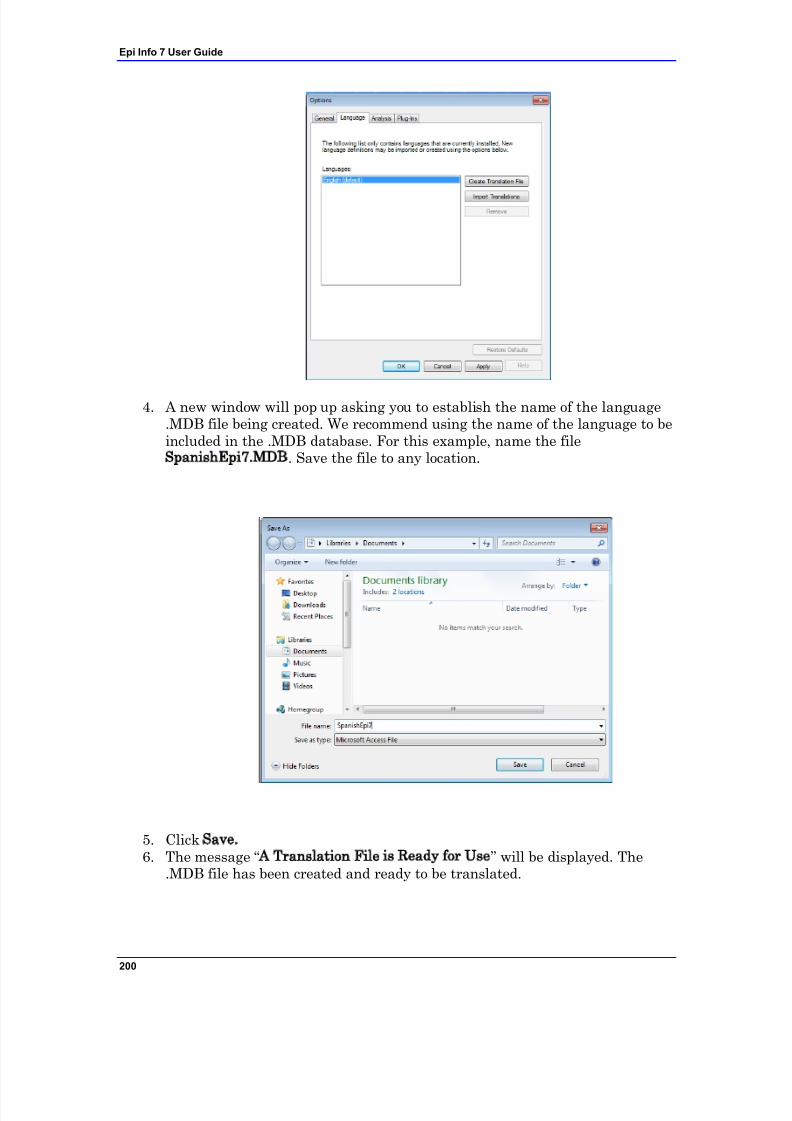
7/14/2019 Epi Info 7 User Guide-V1.0 Cleared
http://slidepdf.com/reader/full/epi-info-7-user-guide-v10-cleared-563109dd5013b 206/368
Epi Info 7 User Guide
200
4. A new window will pop up asking you to establish the name of the language.MDB file being created. We recommend using the name of the language to beincluded in the .MDB database. For this example, name the fileSpanishEpi7.MDB. Save the file to any location.
5. Click Save. 6. The message “A Translation File is Ready for Use” will be displayed. The
.MDB file has been created and ready to be translated.
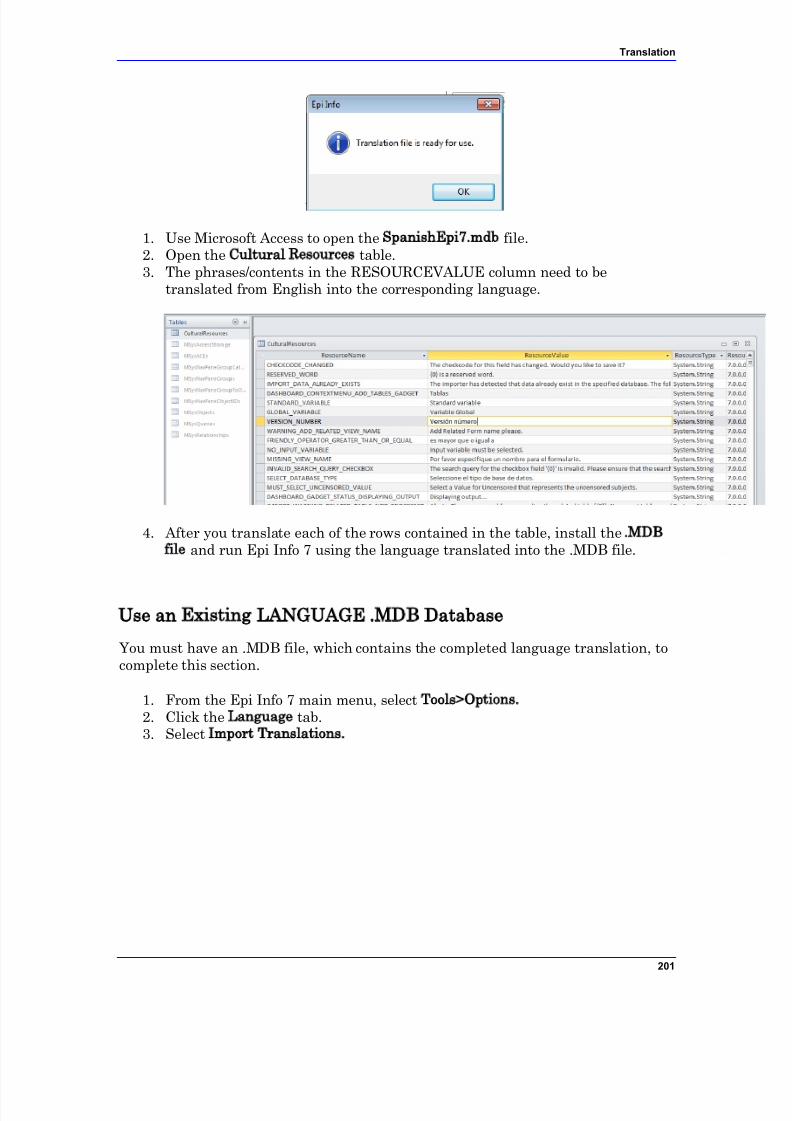
7/14/2019 Epi Info 7 User Guide-V1.0 Cleared
http://slidepdf.com/reader/full/epi-info-7-user-guide-v10-cleared-563109dd5013b 207/368
Translation
201
1. Use Microsoft Access to open the SpanishEpi7.mdb file.2. Open the Cultural Resources table.3. The phrases/contents in the RESOURCEVALUE column need to be
translated from English into the corresponding language.
4. After you translate each of the rows contained in the table, install the .MDBfile and run Epi Info 7 using the language translated into the .MDB file.
Use an Existing LANGUAGE .MDB Database
You must have an .MDB file, which contains the completed language translation, tocomplete this section.
1. From the Epi Info 7 main menu, select Tools>Options. 2. Click the Language tab.3. Select Import Translations.
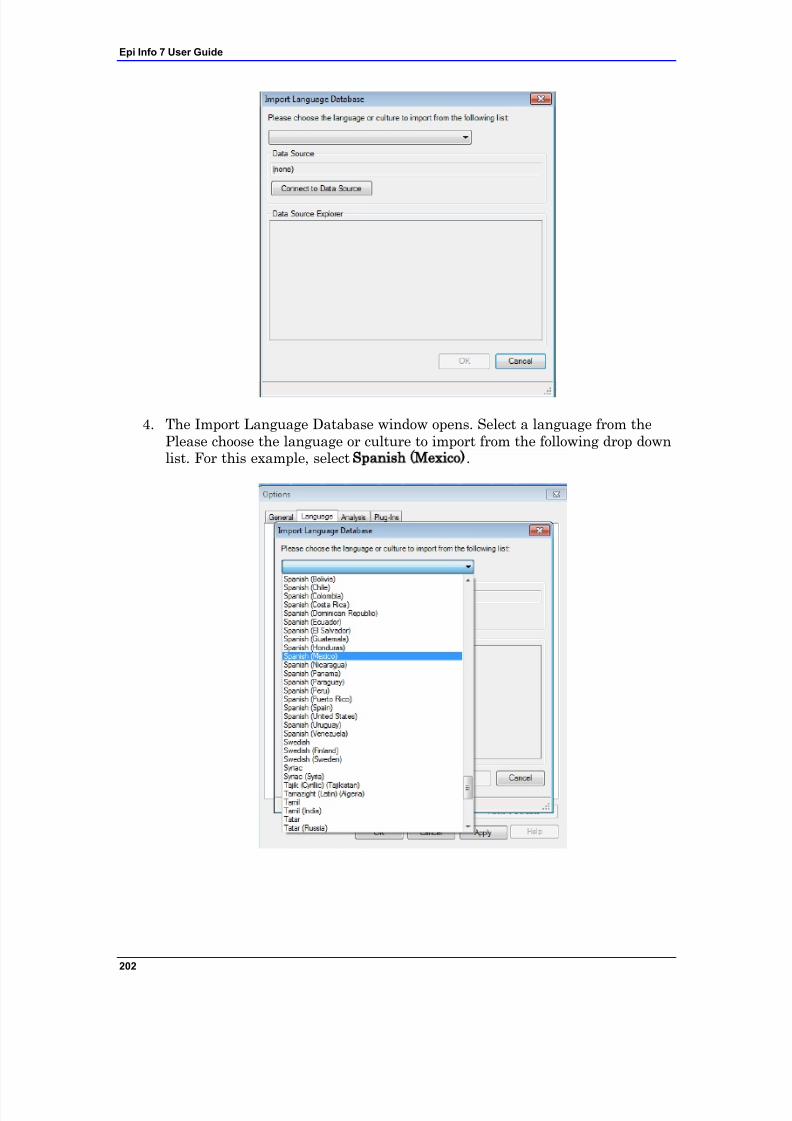
7/14/2019 Epi Info 7 User Guide-V1.0 Cleared
http://slidepdf.com/reader/full/epi-info-7-user-guide-v10-cleared-563109dd5013b 208/368
Epi Info 7 User Guide
202
4. The Import Language Database window opens. Select a language from thePlease choose the language or culture to import from the following drop downlist. For this example, select Spanish (Mexico).
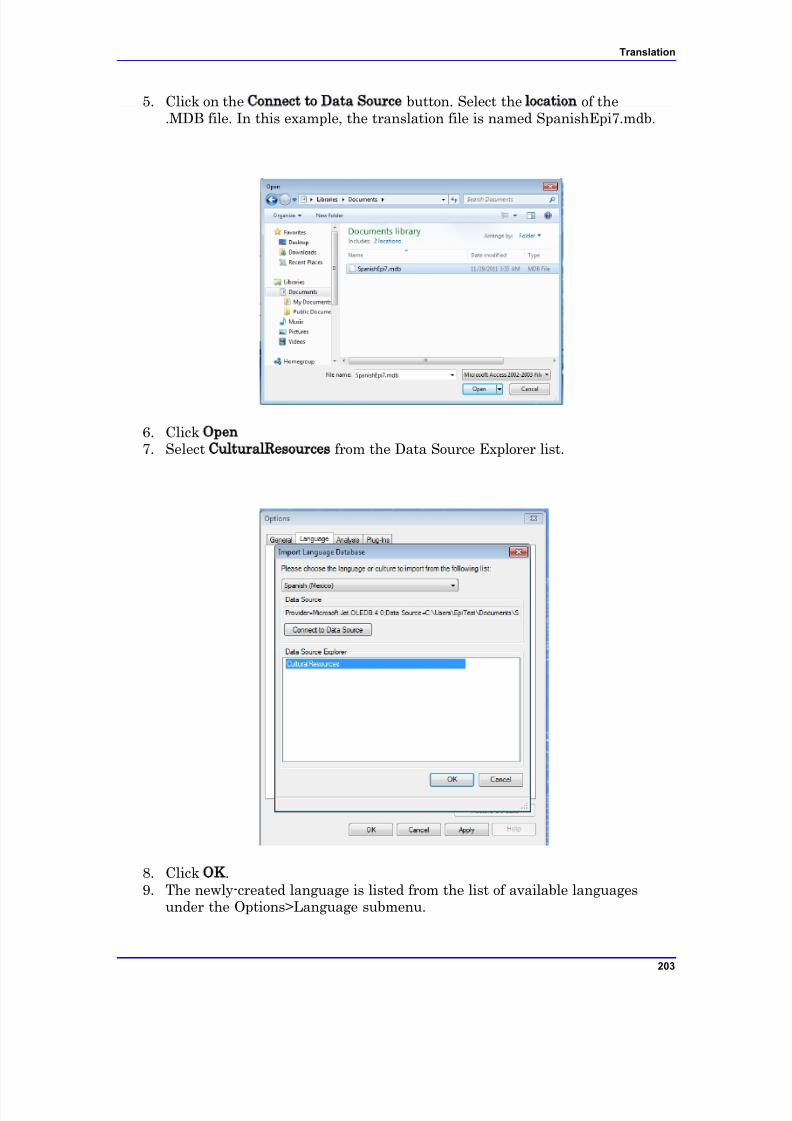
7/14/2019 Epi Info 7 User Guide-V1.0 Cleared
http://slidepdf.com/reader/full/epi-info-7-user-guide-v10-cleared-563109dd5013b 209/368
Translation
203
5. Click on the Connect to Data Source button. Select the location of the.MDB file. In this example, the translation file is named SpanishEpi7.mdb.
6. Click Open 7. Select CulturalResources from the Data Source Explorer list.
8. Click OK.9. The newly-created language is listed from the list of available languages
under the Options>Language submenu.
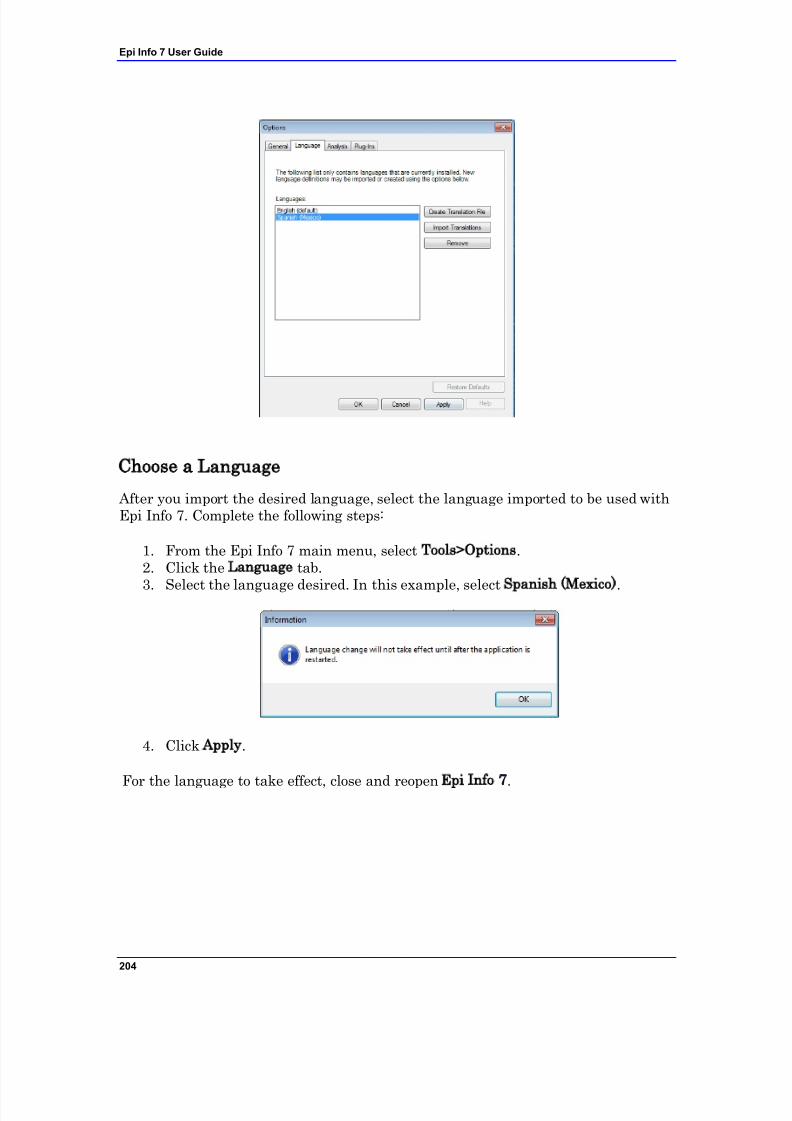
7/14/2019 Epi Info 7 User Guide-V1.0 Cleared
http://slidepdf.com/reader/full/epi-info-7-user-guide-v10-cleared-563109dd5013b 210/368
Epi Info 7 User Guide
204
Choose a Language
After you import the desired language, select the language imported to be used withEpi Info 7. Complete the following steps:
1. From the Epi Info 7 main menu, select Tools>Options.2. Click the Language tab.
3. Select the language desired. In this example, select Spanish (Mexico).
4. Click Apply.
For the language to take effect, close and reopen Epi Info 7.

7/14/2019 Epi Info 7 User Guide-V1.0 Cleared
http://slidepdf.com/reader/full/epi-info-7-user-guide-v10-cleared-563109dd5013b 211/368
Translation
205

7/14/2019 Epi Info 7 User Guide-V1.0 Cleared
http://slidepdf.com/reader/full/epi-info-7-user-guide-v10-cleared-563109dd5013b 212/368
206
Nutritional Anthropometry
This chapter provides an overview on how to use the nutritional anthropometryfunctions. The following topics are included:
Introduction to Nutritional Anthropometry in Epi Info 7.
Using the Nutrition project.
Using the growth charts in the Visual Dashboard.
Using the nutrition functions.
Introduction
Epi Info 7 contains several nutritional anthropometry tools that you can use to
collect, analyze, and graph child growth data. Among these tools are a data entryform to calculate z-scores and percentiles as data are entered, growth chartingcapabilities in the Visual Dashboard, and several nutrition functions in Classic
Analysis that you can use to add z-scores and percentiles to existing sets of data.
Four growth references are available for use: CDC/WHO 1978, CDC 2000, WHOChild Growth Standards, and the WHO Reference 2007. Except for the Nutritionproject, all nutritional anthropometry tools in Epi Info 7 allow you to easily selectthe growth reference.
Users familiar with Epi Info 3 may notice the absence of the NutStat module. Thetools outlined above will replace it.
Using the Nutrition Project
The Nutrition Project is a special data entry form that can be opened in the Entermodule. You can type in a child‟s age, height, weight, and other measurements foreach clinic or doctor‟s office visit. As you enter the measurements, the appropriate z-scores and percentiles are automatically calculated and added to the data set. TheWHO Child Growth Standards are used to calculate z-scores for children 0 to 2 yearsof age and the CDC 2000 reference is used to calculate z-scores for children 2 yearsof age and older. For more information, see www.cdc.gov/growthcarts.
Opening the Nutrition Form
To open the Nutrition project:
1. From the Epi Info 7 menu, click the Enter Data button. The Enter module
loads.
2. From the toolbar, click the Open Form button. The Open Form dialog box
appears.
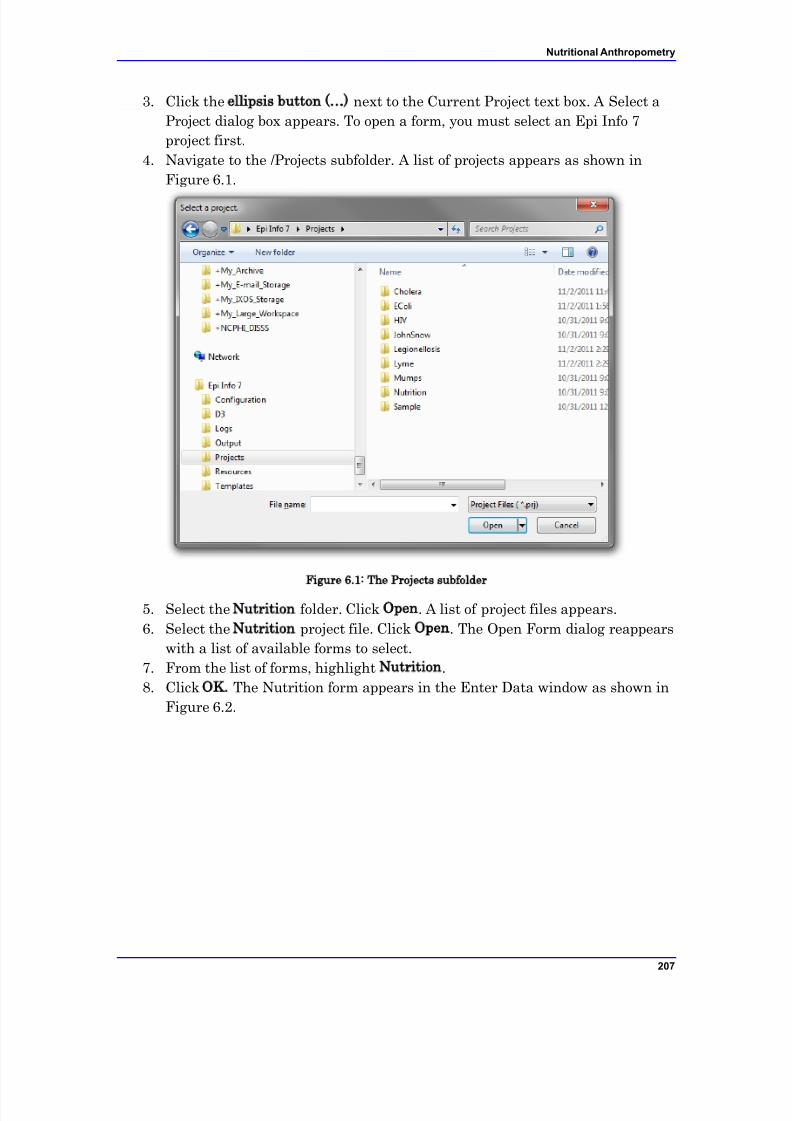
7/14/2019 Epi Info 7 User Guide-V1.0 Cleared
http://slidepdf.com/reader/full/epi-info-7-user-guide-v10-cleared-563109dd5013b 213/368
Nutritional Anthropometry
207
3. Click the ellipsis button (…) next to the Current Project text box. A Select a
Project dialog box appears. To open a form, you must select an Epi Info 7
project first.
4. Navigate to the /Projects subfolder. A list of projects appears as shown in
Figure 6.1.
Figure 6.1: The Projects subfolder
5. Select the Nutrition folder. Click Open. A list of project files appears.
6. Select the Nutrition project file. Click Open. The Open Form dialog reappears
with a list of available forms to select.
7. From the list of forms, highlight Nutrition.
8. Click OK. The Nutrition form appears in the Enter Data window as shown in
Figure 6.2.
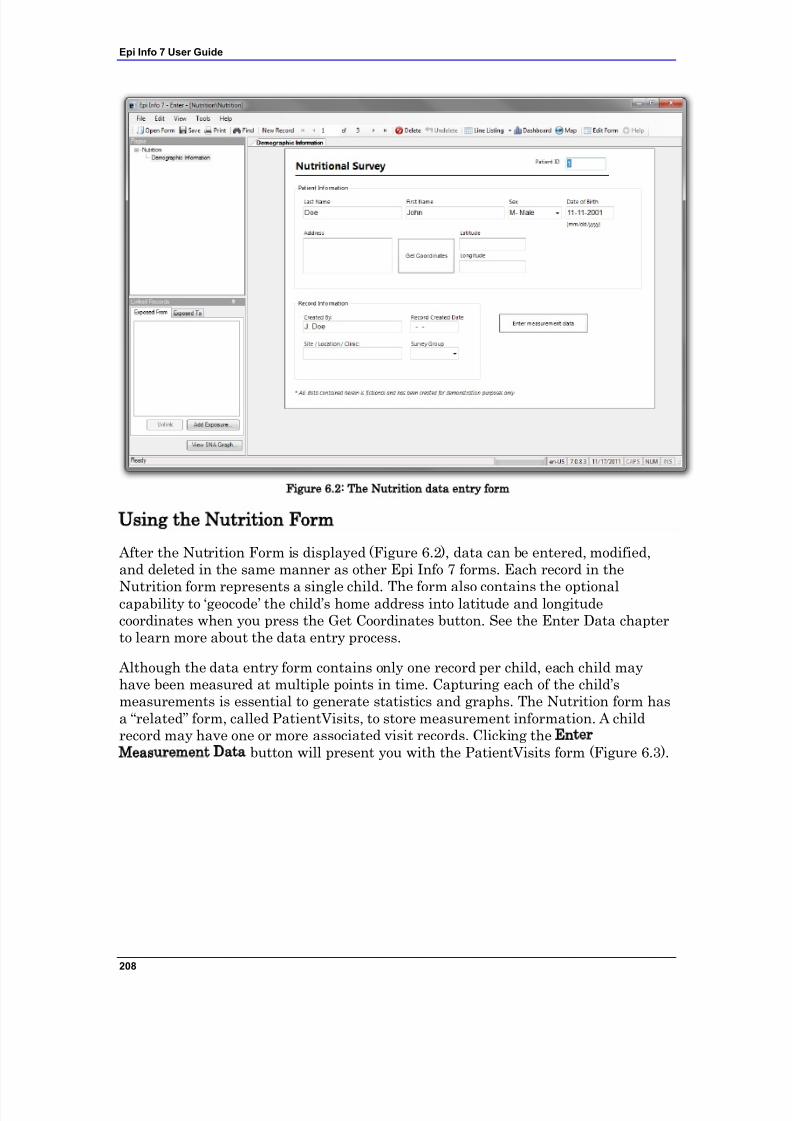
7/14/2019 Epi Info 7 User Guide-V1.0 Cleared
http://slidepdf.com/reader/full/epi-info-7-user-guide-v10-cleared-563109dd5013b 214/368
Epi Info 7 User Guide
208
Figure 6.2: The Nutrition data entry form
Using the Nutrition Form
After the Nutrition Form is displayed (Figure 6.2), data can be entered, modified,and deleted in the same manner as other Epi Info 7 forms. Each record in the
Nutrition form represents a single child. The form also contains the optionalcapability to „geocode‟ the child‟s home address into latitude and longitudecoordinates when you press the Get Coordinates button. See the Enter Data chapterto learn more about the data entry process.
Although the data entry form contains only one record per child, each child mayhave been measured at multiple points in time. Capturing each of the child‟smeasurements is essential to generate statistics and graphs. The Nutrition form hasa “related” form, called PatientVisits, to store measurement information. A childrecord may have one or more associated visit records. Clicking the EnterMeasurement Data button will present you with the PatientVisits form (Figure 6.3).
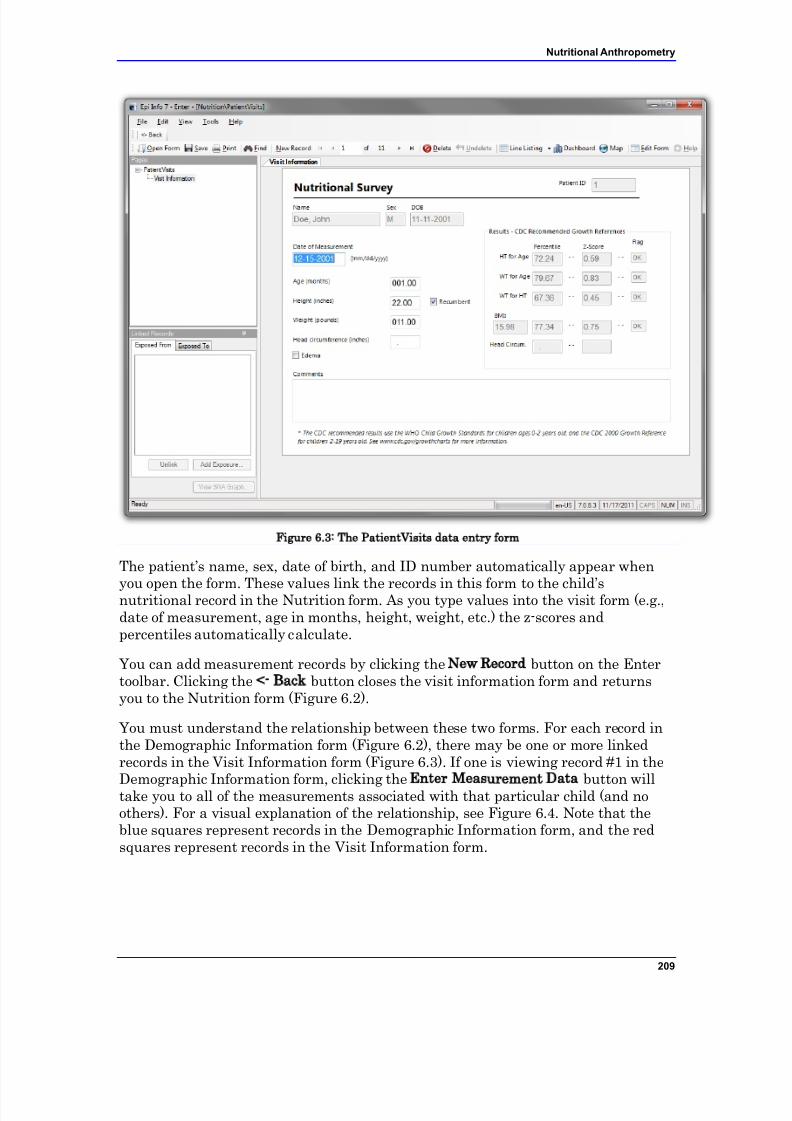
7/14/2019 Epi Info 7 User Guide-V1.0 Cleared
http://slidepdf.com/reader/full/epi-info-7-user-guide-v10-cleared-563109dd5013b 215/368
Nutritional Anthropometry
209
Figure 6.3: The PatientVisits data entry form
The patient‟s name, sex, date of birth, and ID number automatically appear when
you open the form. These values link the records in this form to the child‟snutritional record in the Nutrition form. As you type values into the visit form (e.g.,date of measurement, age in months, height, weight, etc.) the z-scores andpercentiles automatically calculate.
You can add measurement records by clicking the New Record button on the Entertoolbar. Clicking the <- Back button closes the visit information form and returnsyou to the Nutrition form (Figure 6.2).
You must understand the relationship between these two forms. For each record inthe Demographic Information form (Figure 6.2), there may be one or more linkedrecords in the Visit Information form (Figure 6.3). If one is viewing record #1 in the
Demographic Information form, clicking the Enter Measurement Data button willtake you to all of the measurements associated with that particular child (and noothers). For a visual explanation of the relationship, see Figure 6.4. Note that theblue squares represent records in the Demographic Information form, and the redsquares represent records in the Visit Information form.
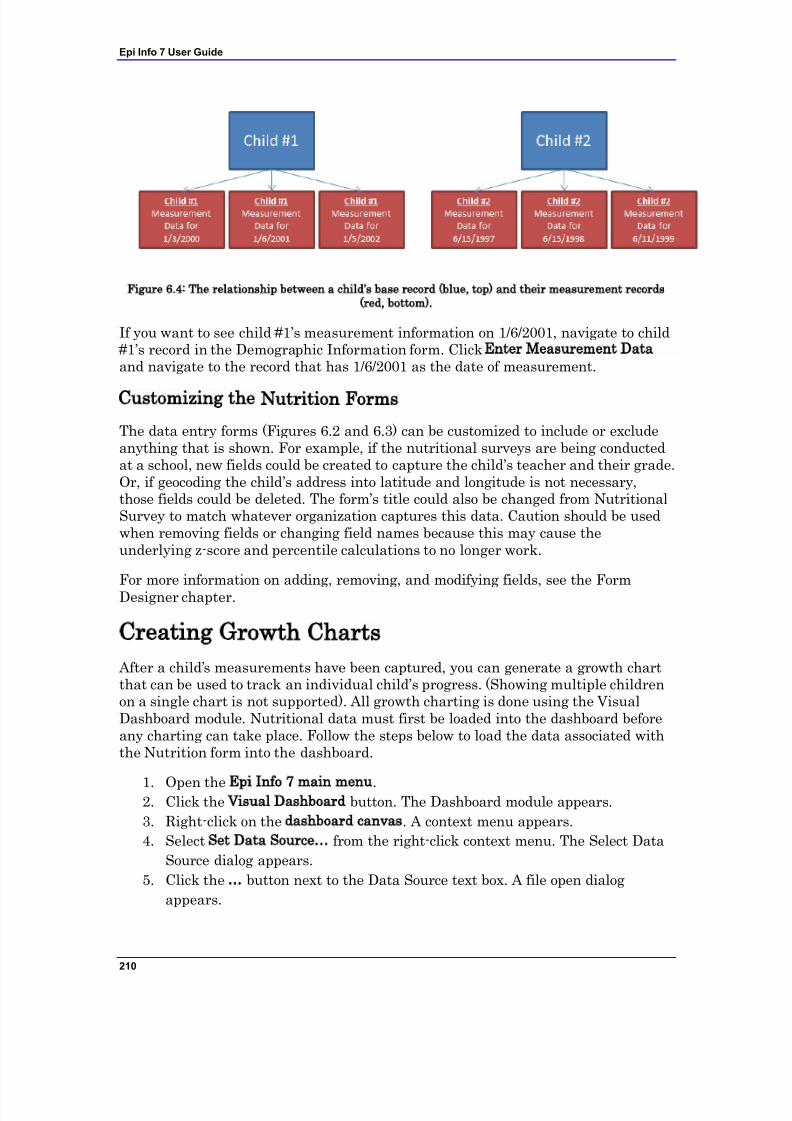
7/14/2019 Epi Info 7 User Guide-V1.0 Cleared
http://slidepdf.com/reader/full/epi-info-7-user-guide-v10-cleared-563109dd5013b 216/368
Epi Info 7 User Guide
210
Figure 6.4: The relationship between a child‟s base record (blue, top) and their measurement records(red, bottom).
If you want to see child #1‟s measurement information on 1/6/2001, navigate to child #1‟s record in the Demographic Information form. Click Enter Measurement Dataand navigate to the record that has 1/6/2001 as the date of measurement.
Customizing the Nutrition Forms
The data entry forms (Figures 6.2 and 6.3) can be customized to include or excludeanything that is shown. For example, if the nutritional surveys are being conductedat a school, new fields could be created to capture the child‟s teacher and their grade.Or, if geocoding the child‟s address into latitude and longitude is not necessary,those fields could be deleted. The form‟s title could also be changed from NutritionalSurvey to match whatever organization captures this data. Caution should be usedwhen removing fields or changing field names because this may cause theunderlying z-score and percentile calculations to no longer work.
For more information on adding, removing, and modifying fields, see the FormDesigner chapter.
Creating Growth Charts
After a child‟s measurements have been captured, you can generate a growth chartthat can be used to track an individual child‟s progress. (Showing multiple childrenon a single chart is not supported). All growth charting is done using the VisualDashboard module. Nutritional data must first be loaded into the dashboard beforeany charting can take place. Follow the steps below to load the data associated withthe Nutrition form into the dashboard.
1. Open the Epi Info 7 main menu.2. Click the Visual Dashboard button. The Dashboard module appears.
3. Right-click on the dashboard canvas. A context menu appears.
4. Select Set Data Source… from the right-click context menu. The Select Data
Source dialog appears.
5. Click the … button next to the Data Source text box. A file open dialog
appears.
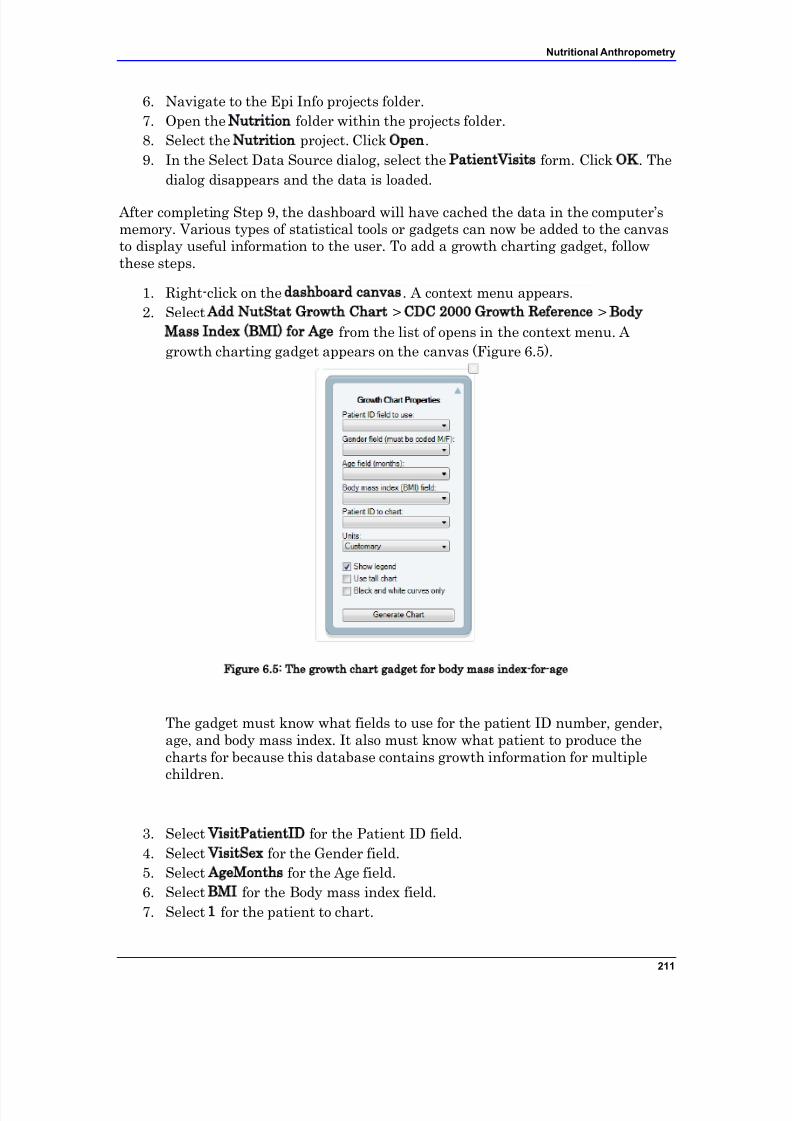
7/14/2019 Epi Info 7 User Guide-V1.0 Cleared
http://slidepdf.com/reader/full/epi-info-7-user-guide-v10-cleared-563109dd5013b 217/368
Nutritional Anthropometry
211
6. Navigate to the Epi Info projects folder.
7. Open the Nutrition folder within the projects folder.
8. Select the Nutrition project. Click Open.
9. In the Select Data Source dialog, select the PatientVisits form. Click OK. The
dialog disappears and the data is loaded.
After completing Step 9, the dashboard will have cached the data in the computer‟smemory. Various types of statistical tools or gadgets can now be added to the canvasto display useful information to the user. To add a growth charting gadget, followthese steps.
1. Right-click on the dashboard canvas. A context menu appears.
2. Select Add NutStat Growth Chart > CDC 2000 Growth Reference > Body
Mass Index (BMI) for Age from the list of opens in the context menu. A
growth charting gadget appears on the canvas (Figure 6.5).
Figure 6.5: The growth chart gadget for body mass index-for-age
The gadget must know what fields to use for the patient ID number, gender,age, and body mass index. It also must know what patient to produce thecharts for because this database contains growth information for multiplechildren.
3. Select VisitPatientID for the Patient ID field.
4. Select VisitSex for the Gender field.
5. Select AgeMonths for the Age field.
6. Select BMI for the Body mass index field.
7. Select 1 for the patient to chart.
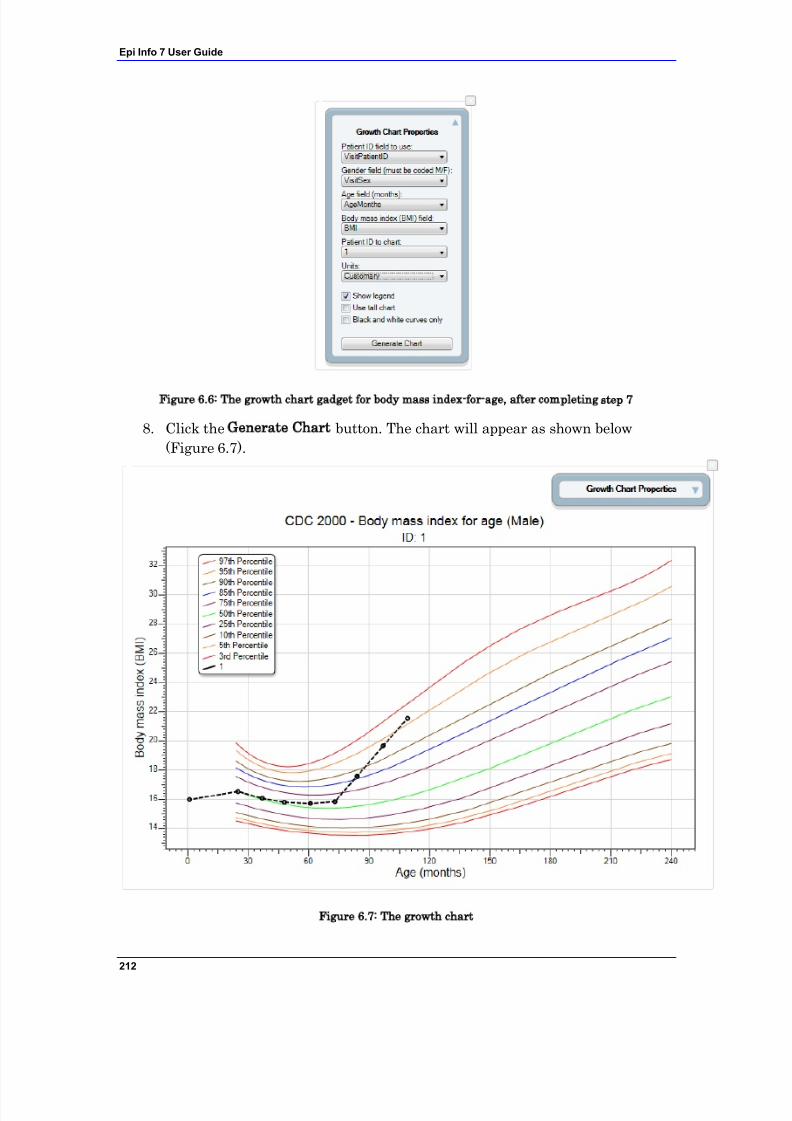
7/14/2019 Epi Info 7 User Guide-V1.0 Cleared
http://slidepdf.com/reader/full/epi-info-7-user-guide-v10-cleared-563109dd5013b 218/368
Epi Info 7 User Guide
212
Figure 6.6: The growth chart gadget for body mass index-for-age, after completing step 7
8. Click the Generate Chart button. The chart will appear as shown below
(Figure 6.7).
Figure 6.7: The growth chart
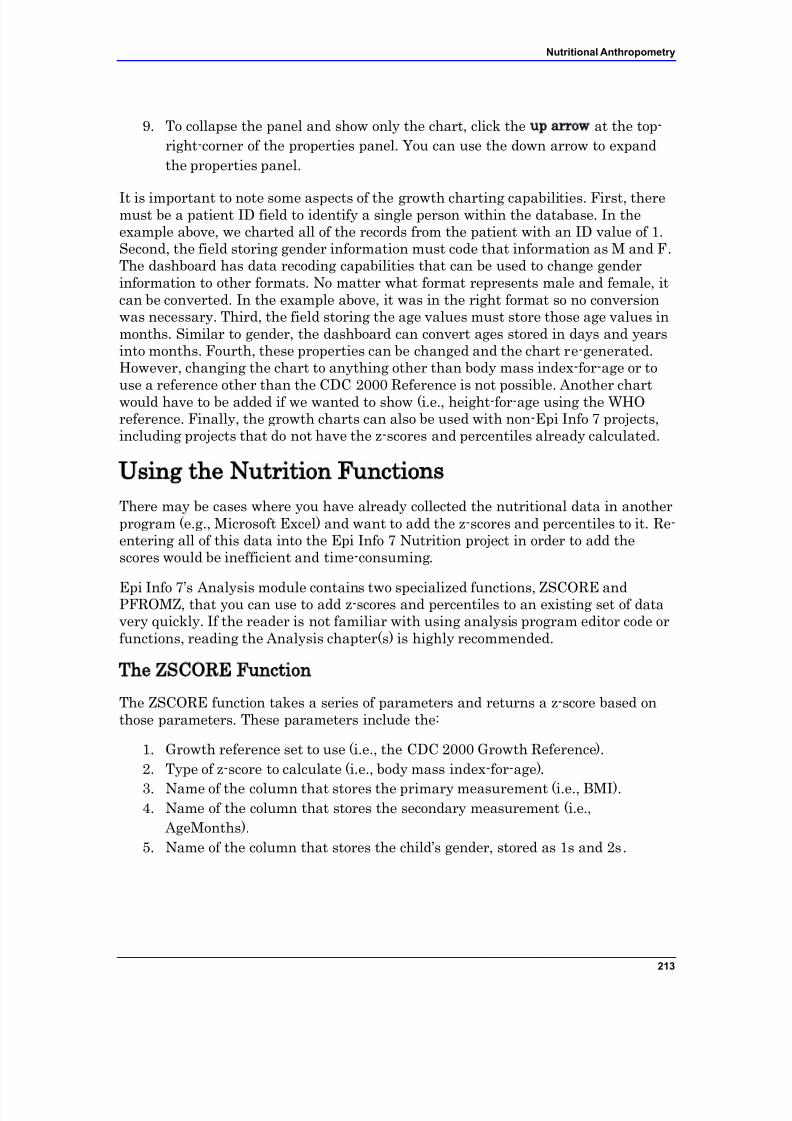
7/14/2019 Epi Info 7 User Guide-V1.0 Cleared
http://slidepdf.com/reader/full/epi-info-7-user-guide-v10-cleared-563109dd5013b 219/368
Nutritional Anthropometry
213
9. To collapse the panel and show only the chart, click the up arrow at the top-
right-corner of the properties panel. You can use the down arrow to expand
the properties panel.
It is important to note some aspects of the growth charting capabilities. First, theremust be a patient ID field to identify a single person within the database. In theexample above, we charted all of the records from the patient with an ID value of 1.Second, the field storing gender information must code that information as M and F.The dashboard has data recoding capabilities that can be used to change genderinformation to other formats. No matter what format represents male and female, itcan be converted. In the example above, it was in the right format so no conversionwas necessary. Third, the field storing the age values must store those age values inmonths. Similar to gender, the dashboard can convert ages stored in days and yearsinto months. Fourth, these properties can be changed and the chart re-generated.However, changing the chart to anything other than body mass index-for-age or touse a reference other than the CDC 2000 Reference is not possible. Another chartwould have to be added if we wanted to show (i.e., height-for-age using the WHOreference. Finally, the growth charts can also be used with non-Epi Info 7 projects,including projects that do not have the z-scores and percentiles already calculated.
Using the Nutrition Functions
There may be cases where you have already collected the nutritional data in anotherprogram (e.g., Microsoft Excel) and want to add the z-scores and percentiles to it. Re-entering all of this data into the Epi Info 7 Nutrition project in order to add thescores would be inefficient and time-consuming.
Epi Info 7‟s Analysis module contains two specialized functions, ZSCORE andPFROMZ, that you can use to add z-scores and percentiles to an existing set of datavery quickly. If the reader is not familiar with using analysis program editor code orfunctions, reading the Analysis chapter(s) is highly recommended.
The ZSCORE Function
The ZSCORE function takes a series of parameters and returns a z-score based onthose parameters. These parameters include the:
1. Growth reference set to use (i.e., the CDC 2000 Growth Reference).
2. Type of z-score to calculate (i.e., body mass index-for-age).
3. Name of the column that stores the primary measurement (i.e., BMI).4. Name of the column that stores the secondary measurement (i.e.,
AgeMonths).
5. Name of the column that stores the child‟s gender, stored as 1s and 2s .
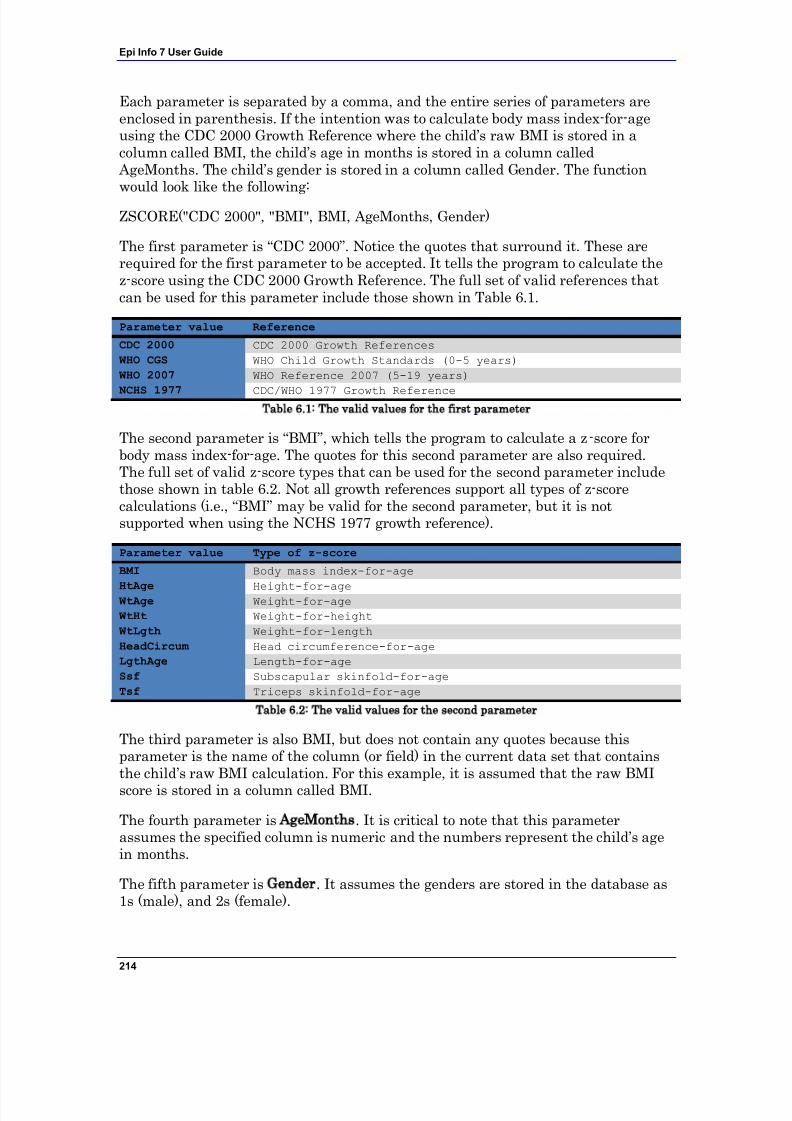
7/14/2019 Epi Info 7 User Guide-V1.0 Cleared
http://slidepdf.com/reader/full/epi-info-7-user-guide-v10-cleared-563109dd5013b 220/368
Epi Info 7 User Guide
214
Each parameter is separated by a comma, and the entire series of parameters areenclosed in parenthesis. If the intention was to calculate body mass index-for-ageusing the CDC 2000 Growth Reference where the child‟s raw BMI is stored in acolumn called BMI, the child‟s age in months is stored in a column called
AgeMonths. The child‟s gender is stored in a column called Gender. The functionwould look like the following:
ZSCORE("CDC 2000", "BMI", BMI, AgeMonths, Gender)
The first parameter is “CDC 2000”. Notice the quotes that surround it. These arerequired for the first parameter to be accepted. It tells the program to calculate thez-score using the CDC 2000 Growth Reference. The full set of valid references thatcan be used for this parameter include those shown in Table 6.1.
Parameter value Reference
CDC 2000 CDC 2000 Growth References
WHO CGS WHO Child Growth Standards (0-5 years)
WHO 2007 WHO Reference 2007 (5-19 years)
NCHS 1977 CDC/WHO 1977 Growth ReferenceTable 6.1: The valid values for the first parameter
The second parameter is “BMI”, which tells the program to calculate a z -score forbody mass index-for-age. The quotes for this second parameter are also required.The full set of valid z-score types that can be used for the second parameter includethose shown in table 6.2. Not all growth references support all types of z-scorecalculations (i.e., “BMI” may be valid for the second parameter, but it is notsupported when using the NCHS 1977 growth reference).
Parameter value Type of z-score
BMI Body mass index-for-age
HtAge Height-for-age WtAge Weight-for-age
WtHt Weight-for-height
WtLgth Weight-for-length
HeadCircum Head circumference-for-age
LgthAge Length-for-age
Ssf Subscapular skinfold-for-age
Tsf Triceps skinfold-for-age
Table 6.2: The valid values for the second parameter
The third parameter is also BMI, but does not contain any quotes because thisparameter is the name of the column (or field) in the current data set that containsthe child‟s raw BMI calculation. For this example, it is assumed that the raw BMI
score is stored in a column called BMI.
The fourth parameter is AgeMonths. It is critical to note that this parameterassumes the specified column is numeric and the numbers represent the child‟s agein months.
The fifth parameter is Gender. It assumes the genders are stored in the database as1s (male), and 2s (female).
7/14/2019 Epi Info 7 User Guide-V1.0 Cleared
http://slidepdf.com/reader/full/epi-info-7-user-guide-v10-cleared-563109dd5013b 221/368
Nutritional Anthropometry
215
Different databases may contain different column names than the example above.The final three parameters may vary considerably depending on what database isbeing read. However, the first two parameters will only ever accept the limited set of inputs displayed in Tables 6.1 and 6.2.
To run this calculation, the ZSCORE function must be paired with an ASSIGN
command. For example:
ASSIGN BMIZ = ZSCORE("CDC 2000", "BMI", BMI, AgeMonths, Gender)
The above code tells Analysis to assign the z-score for body mass index-for-age usingthe CDC 2000 Growth Reference to the BMIZ column. It will do this for every row inthe current dataset, effectively batch-processing all the rows. This should only take afew seconds even on very large data sets.
The PFROMZ Function
The second Nutritional Anthropometry function included with Epi Info 7 is called
PFROMZ. You can use it after a z-score has been calculated and convert the z-scoreinto a percentile. It is simple to use: Simply pass in the column name that contains az-score as a parameter, and the corresponding percentile is returned. For example:
PFROMZ(BMIZ)
The above code assumes the BMIZ column contains the z-scores for body mass index-for-age. Note that the PFROMZ function does not need to know the reference, z-scoretype, gender, etc., of the data. To use it effectively, it must be combined with the
ASSIGN command. For example:
ASSIGN BMIP = PFROMZ(BMIZ)
The above code tells Analysis to assign to the BMIP column the percentile associatedwith the values stored in the BMIZ column. It will do this for every row in thecurrent data set, effectively batch-processing all of the rows and adding percentilesto each of them.
7/14/2019 Epi Info 7 User Guide-V1.0 Cleared
http://slidepdf.com/reader/full/epi-info-7-user-guide-v10-cleared-563109dd5013b 222/368
216
StatCalc
Introduction
StatCalc is an epidemiologic calculator that produces statistics from summary data.Three types of calculations are offered:
Statistics from 2-by-2 to 2-by-9 tables similar to those produced in Analysis.Both single and stratified 2-by-2 tables can be analyzed to produce oddsratios and risk ratios (relative risks) with confidence limits, several types of chi square tests, Fisher exact tests, Mantel-Haenszel summary odds ratiosand chi squares, and associated p-values.
Sample size and power calculations include Population Survey, Cohort orCross-Sectional, and Unmatched Case-Control Study.
Chi-square for trend by the Mantel extension of the Mantel-Haenszelsummary odds ratio and chi square. This tests for the presence of a trend indose response or other case control studies where a series of increasing ordecreasing exposures is being studied.
7/14/2019 Epi Info 7 User Guide-V1.0 Cleared
http://slidepdf.com/reader/full/epi-info-7-user-guide-v10-cleared-563109dd5013b 223/368
StatCalc
217
How to Use StatCalc
Opening StatCalc
1. From the Epi Info 7 main menu, select StatCalc.
2. Select one of the following calculations using the up and down arrow keys orclick: Sample Size & Power, Chi Square for Trend, Tables (2X2, 2Xn), Poisson(rare event vs. std.) or Binomial (proportion vs. std.).
You can also select calculations by pressing the corresponding key on thekeyboard that matches the highlighted letter on the menu. If you select acalculation using the keyboard, the calculation appears immediately.
If you select the Sample size and power calculation, the followingcalculation options appear: Population Survey, Cohort or Cross-Sectional,
Unmatched Case-Control.
Use the tab key or return key to move around the different cells availablefor data entry
4. Enter data for each calculation type. Calculations are performed when you enterdata...
5. To modify values already entered, use the Tab key or click on the cell and enterthe new information.
Right click and select the Print option in order to print the results.
Right click and select the Save as Image option to save a screen shot of your results as an image file.
7/14/2019 Epi Info 7 User Guide-V1.0 Cleared
http://slidepdf.com/reader/full/epi-info-7-user-guide-v10-cleared-563109dd5013b 224/368
Epi Info 7 User Guide
218
Analysis of Single and Stratified Tables
These tables are similar to those produced in Classic Analysis. Both single andstratified 2-by-2 tables can be analyzed to produce odds ratios and risk ratios
(relative risks) with confidence limits, several types of chi square tests, Fisher exacttests, Mantel-Haenszel summary odds ratios and chi squares, and associated pvalues
Assumptions
The values in the cells must be counts representing the number of recordsmeeting the specifications in the marginal and stratum labels.
A case-control study is one in which the ill and well individuals are selected andthe number of exposed and unexposed is subsequently ascertained. In a cohortstudy, the exposed and unexposed are selected and the number of ill in each
group is subsequently ascertained. A cross-sectional study starts with neitherillness nor exposure determined, and ascertains both during the study.
In cohort studies, the relative risk may be calculated from the results. In case-control studies, the odds ratio may be used as an approximation of the relativerisk if the disease is rare in the general population from which cases andcontrols are selected. Fewer than one case in 20 individuals might be taken as astarting point. Thus, in a foodborne outbreak, selecting cases and controls fromthose who ate at a particular restaurant in a given week, the odds ratio couldnot be used to approximate relative risk if half of the individuals became ill. Theodds ratio would, however, be an indicator of the degree of association betweenillness and the consumption of a particular food.
For the results to be valid, the outcomes in each record must be independent of those in other records. The values for one individual do not predict those foranother. Confounding must be removed by stratifying on confounding variables.
Single 2-by-2 Tables
Two-by-two tables are frequently used in epidemiology to explore associationsbetween exposure to risk factors and disease or other outcomes. The table inStatCalc has Exposure on the left and Disease across the top. Not all textbooks andarticles use the same conventions. Carefully observe the labels and transpose dataitems if necessary.
Given a yes-no or other two-choice question describing disease and anotherdescribing exposure to a risk factor, StatCalc produces several kinds of statisticsthat test for relationships between exposure and disease. Generally, an associationis suggested by an odds ratio or relative risk larger or smaller than 1.0. The furtherthe odds ratio or relative risk is from 1.0, the stronger the apparent association.Statistical significance can be assessed by p-values for the Chi square tests that aresmall <.05 if often used, Fisher exact test with a small p value; or confidence limitsfor the odds ratio that do not include 1.0.
7/14/2019 Epi Info 7 User Guide-V1.0 Cleared
http://slidepdf.com/reader/full/epi-info-7-user-guide-v10-cleared-563109dd5013b 225/368
StatCalc
219
The expected value of a cell is the product of the marginal totals for that cell dividedby the grand total for the table. If any expected value is less than five, it isrecommended you use the Fisher Exact test results and the Exact confidence limits.If the numbers in the table are all large, the other tests should indicate nearly thesame result.
Stratified Analysis of 2-by-2 Tables
If confounding is present, associations between disease and exposure can be missedor falsely detected. A confounding factor is one that is associated with the diseaseand the exposure, but may not be of interest or observed. Age is a frequentconfounder, although any factor other than the main exposure being considered canbe treated as a confounder.
Stratification means making a separate table of disease by exposure for eachpossible confounder combinations. In the simplest case, this could mean separatemale and female tables if sex is the potential confounder. If Age, Sex, and City areconfounders, separate tables would be made for each possible combination of age
group, sex, and city.
The Mantel-Haenszel weighted odds ratio, relative risk, summary Chi square, andp-value combine results from different strata to remove confounding caused by thevariables used for stratification. If tables are entered for male and female,confounding by sex is removed. The degree of confounding can be judged bycomparing the crude and weighted odds ratios; if they are identical, there was noconfounding by sex.
The Approximate (Cornfield and Greenland/Robins) and Exact confidence limitsprovide additional measures. If the weighted odds ratio or relative risk (not for case-control studies) has confidence limits that do not include 1.0, there is a statistical
association with 95% confidence between the disease and the exposure withoutconfounding by the stratifying factor.
If the odds ratio or relative risks for strata in a series of stratified tables for the testsare not similar, then interaction between the stratifying factor and the risk factorare present. Logistic regression or other multivariate methods may be indicated (orthe number of subjects is too small to draw definite conclusions). Alternatively, itmay be advisable to present the stratum-specific estimates separately.
Experts in logistic regression recommend you thoroughly explore the data usingstratified analysis before undertaking the regression analysis. If the number of confounding factors is fairly small and the odds ratios are homogeneous from
stratum to stratum, stratified analysis may be all you need.
Example
A study of bladder cancers cases used randomly selected controls to explore thehistory of artificial sweetener use in the two groups.
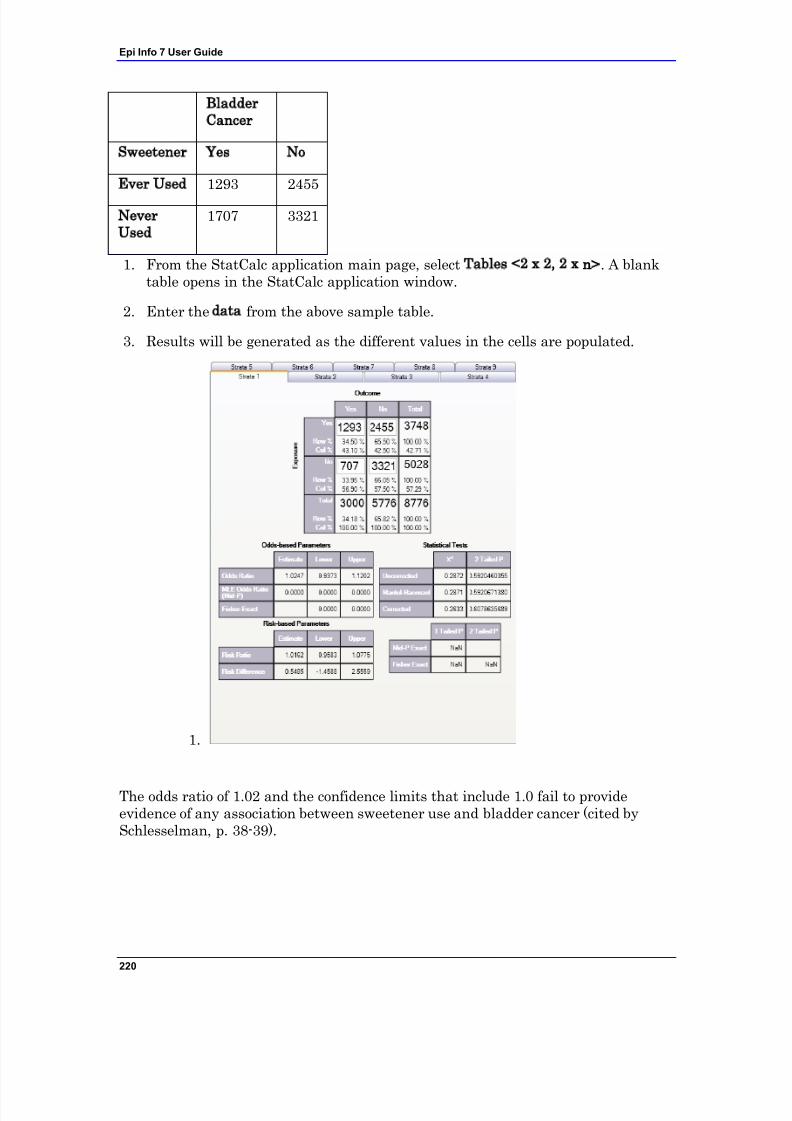
7/14/2019 Epi Info 7 User Guide-V1.0 Cleared
http://slidepdf.com/reader/full/epi-info-7-user-guide-v10-cleared-563109dd5013b 226/368
Epi Info 7 User Guide
220
BladderCancer
Sweetener Yes No
Ever Used 1293 2455
NeverUsed
1707 3321
1. From the StatCalc application main page, select Tables <2 x 2, 2 x n>. A blanktable opens in the StatCalc application window.
2. Enter the data from the above sample table.
3. Results will be generated as the different values in the cells are populated.
1.
The odds ratio of 1.02 and the confidence limits that include 1.0 fail to provideevidence of any association between sweetener use and bladder cancer (cited bySchlesselman, p. 38-39).
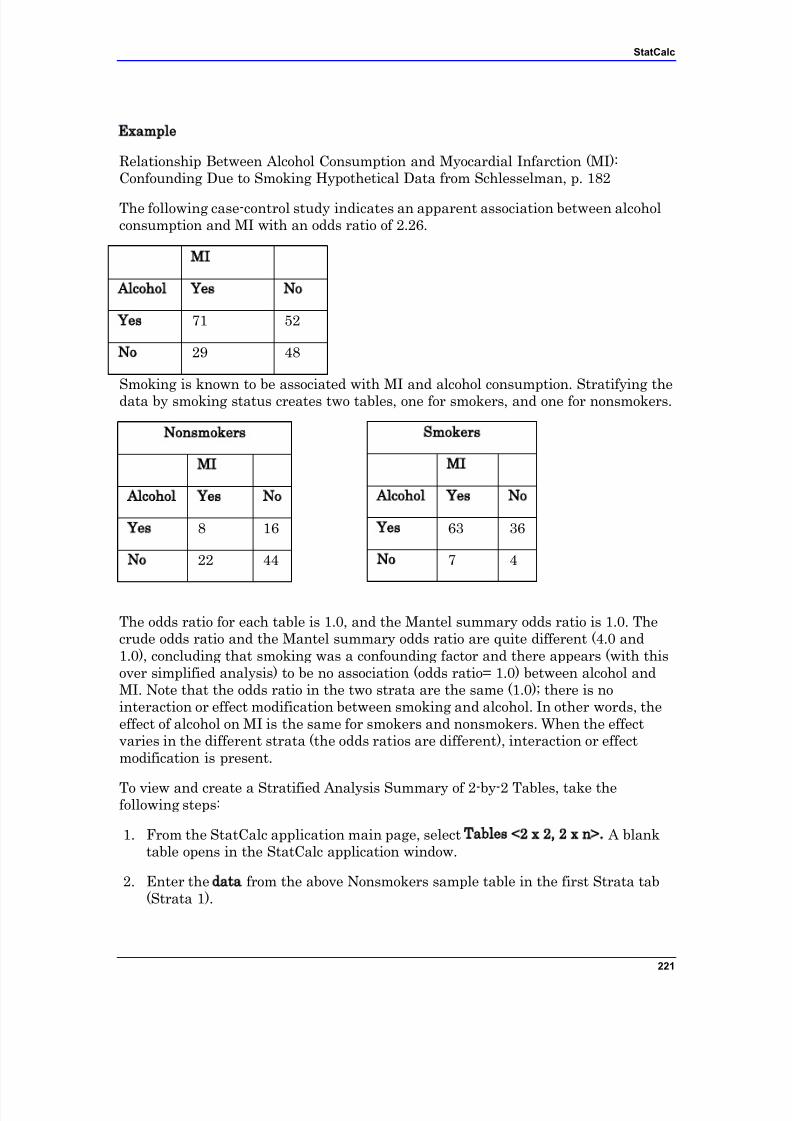
7/14/2019 Epi Info 7 User Guide-V1.0 Cleared
http://slidepdf.com/reader/full/epi-info-7-user-guide-v10-cleared-563109dd5013b 227/368
StatCalc
221
Example
Relationship Between Alcohol Consumption and Myocardial Infarction (MI):Confounding Due to Smoking Hypothetical Data from Schlesselman, p. 182
The following case-control study indicates an apparent association between alcoholconsumption and MI with an odds ratio of 2.26.
MI
Alcohol Yes No
Yes 71 52
No 29 48
Smoking is known to be associated with MI and alcohol consumption. Stratifying thedata by smoking status creates two tables, one for smokers, and one for nonsmokers.
Nonsmokers Smokers
MI MI
Alcohol Yes No Alcohol Yes No
Yes 8 16 Yes 63 36
No 22 44 No 7 4
The odds ratio for each table is 1.0, and the Mantel summary odds ratio is 1.0. Thecrude odds ratio and the Mantel summary odds ratio are quite different (4.0 and1.0), concluding that smoking was a confounding factor and there appears (with thisover simplified analysis) to be no association (odds ratio= 1.0) between alcohol andMI. Note that the odds ratio in the two strata are the same (1.0); there is nointeraction or effect modification between smoking and alcohol. In other words, theeffect of alcohol on MI is the same for smokers and nonsmokers. When the effectvaries in the different strata (the odds ratios are different), interaction or effectmodification is present.
To view and create a Stratified Analysis Summary of 2-by-2 Tables, take thefollowing steps:
1. From the StatCalc application main page, select Tables <2 x 2, 2 x n>. A blanktable opens in the StatCalc application window.
2. Enter the data from the above Nonsmokers sample table in the first Strata tab(Strata 1).
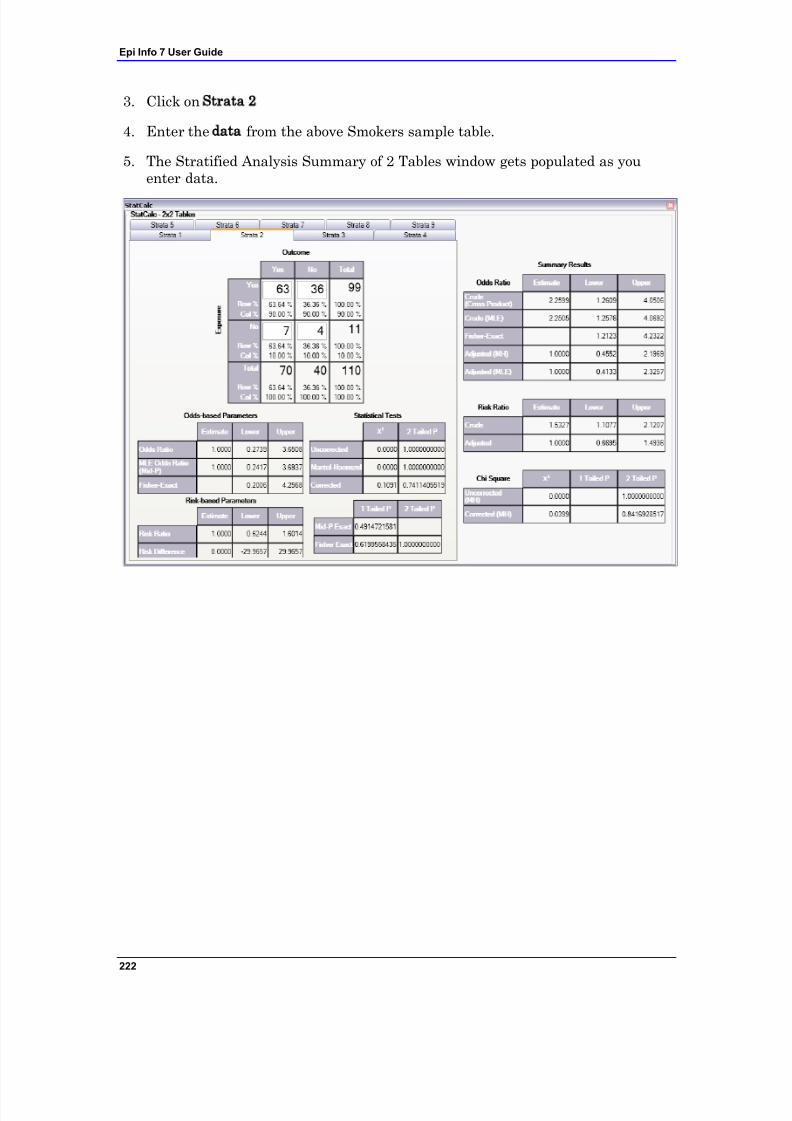
7/14/2019 Epi Info 7 User Guide-V1.0 Cleared
http://slidepdf.com/reader/full/epi-info-7-user-guide-v10-cleared-563109dd5013b 228/368
Epi Info 7 User Guide
222
3. Click on Strata 2
4. Enter the data from the above Smokers sample table.
5. The Stratified Analysis Summary of 2 Tables window gets populated as youenter data.
7/14/2019 Epi Info 7 User Guide-V1.0 Cleared
http://slidepdf.com/reader/full/epi-info-7-user-guide-v10-cleared-563109dd5013b 229/368
StatCalc
223
Population Survey or Descriptive Study
Assumptions
The sample to be taken must be a simple random or representative. A systematic sample (e.g., every fifth person on a list) is acceptable if thesample is representative. Choosing every other person from a list of couples,however, would not give a representative sample because it might select onlymales or only females.
The question being asked must have a Yes-No or other two-choice answer,leading to a proportion of the population (those answering Yes) as the finalresult.
Example
Suppose you want to investigate whether the true prevalence of HIV antibody in apopulation is 10%. A random or systematic sample of the population is planned toestimate the prevalence. A 95% confidence that the true proportion in the entirepopulation will fall within the confidence interval calculated from the sample isdesired.
In StatCalc, enter the population size of 5,000, the estimate of the true prevalence10%, and 10% as the Confidence Limit.Worst Acceptable value. The application willshow the sample size for several different confidence levels including the desired95%.
1. From the StatCalc application main page, select Sample size & power. Thefollowing calculation options appear: Population survey, Cohort or cross-sectional, Unmatched case-control.
2. Select Population Survey. The Population Survey or Descriptive Study UsingRandom (Not Cluster) Sampling window opens.
3. Enter the Population Size of 5,000.
4. Enter the Expected Frequency of 10%.
5. Enter the Confidence Limits as 6%.
The results appear in the window.
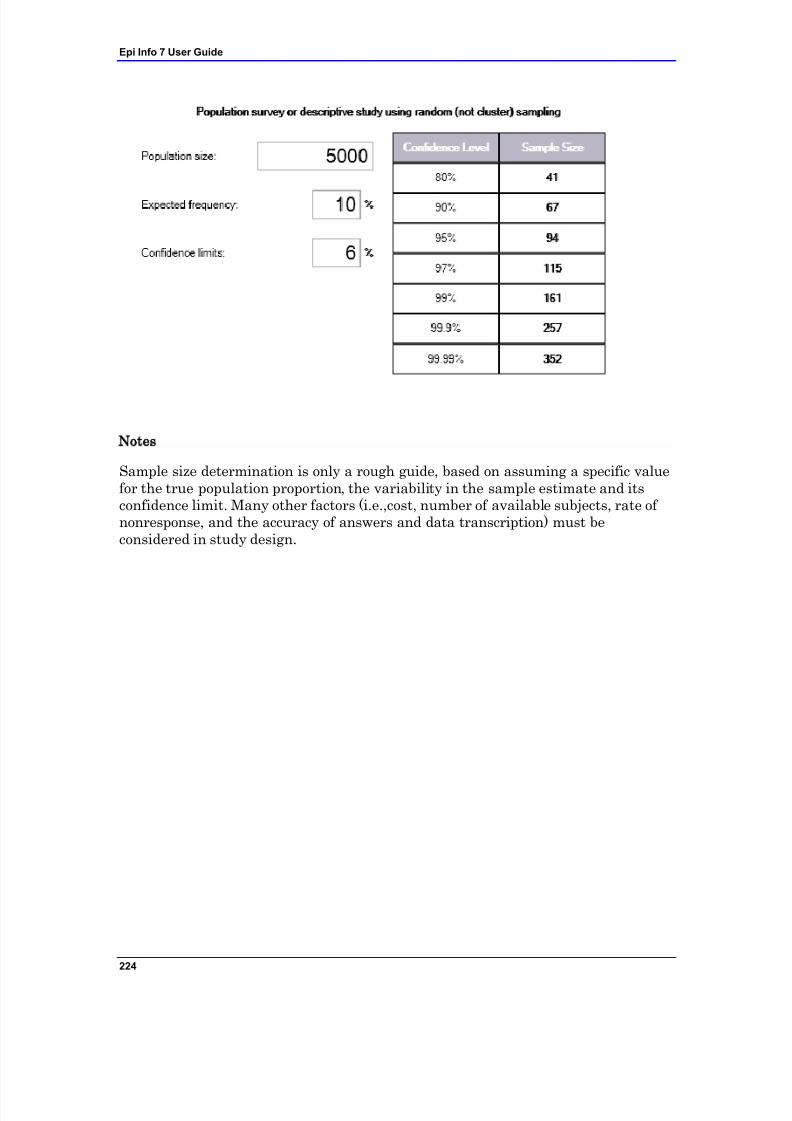
7/14/2019 Epi Info 7 User Guide-V1.0 Cleared
http://slidepdf.com/reader/full/epi-info-7-user-guide-v10-cleared-563109dd5013b 230/368
Epi Info 7 User Guide
224
Notes
Sample size determination is only a rough guide, based on assuming a specific valuefor the true population proportion, the variability in the sample estimate and itsconfidence limit. Many other factors (i.e.,cost, number of available subjects, rate of nonresponse, and the accuracy of answers and data transcription) must beconsidered in study design.

7/14/2019 Epi Info 7 User Guide-V1.0 Cleared
http://slidepdf.com/reader/full/epi-info-7-user-guide-v10-cleared-563109dd5013b 231/368
StatCalc
225
7/14/2019 Epi Info 7 User Guide-V1.0 Cleared
http://slidepdf.com/reader/full/epi-info-7-user-guide-v10-cleared-563109dd5013b 232/368
226
Command Reference
Introduction
Epi Info 7 is easy to operate in interactive mode, but complex or repeated operationsrequire saving the steps as programs. Programs (similar to “scripts” in othersoftware) can be used to set up menus, guide and limit the data entry process,restructure data, and do analyses.
In Form Designer and Classic Analysis, programming consists of interacting with aseries of dialogs that produce the actual program statements. Experienced usersmay want to edit the statements or type them directly in the Program Editor. Forthis reason, the details of command syntax are provided and include a definition of each command and its operation because a single command (e.g., EXECUTE) may befound in Form Designer, Classic Analysis, and Visual Dashboard. Commands are inmodule based chapters with notation of differences that may exist between programimplementation. Some commands are only available in one or two programs. CheckCommands are saved in Form Designer and executed in Enter. Classic Analysiscommands are generated, edited, executed, and may be saved with the ProgramEditor from Classic Analysis.
Functions and operators appear within commands and are used for common tasks(i.e., extracting a year from a date, combining two numeric values, calculatingduration between two dates, or converting numbers to text and vice versa).
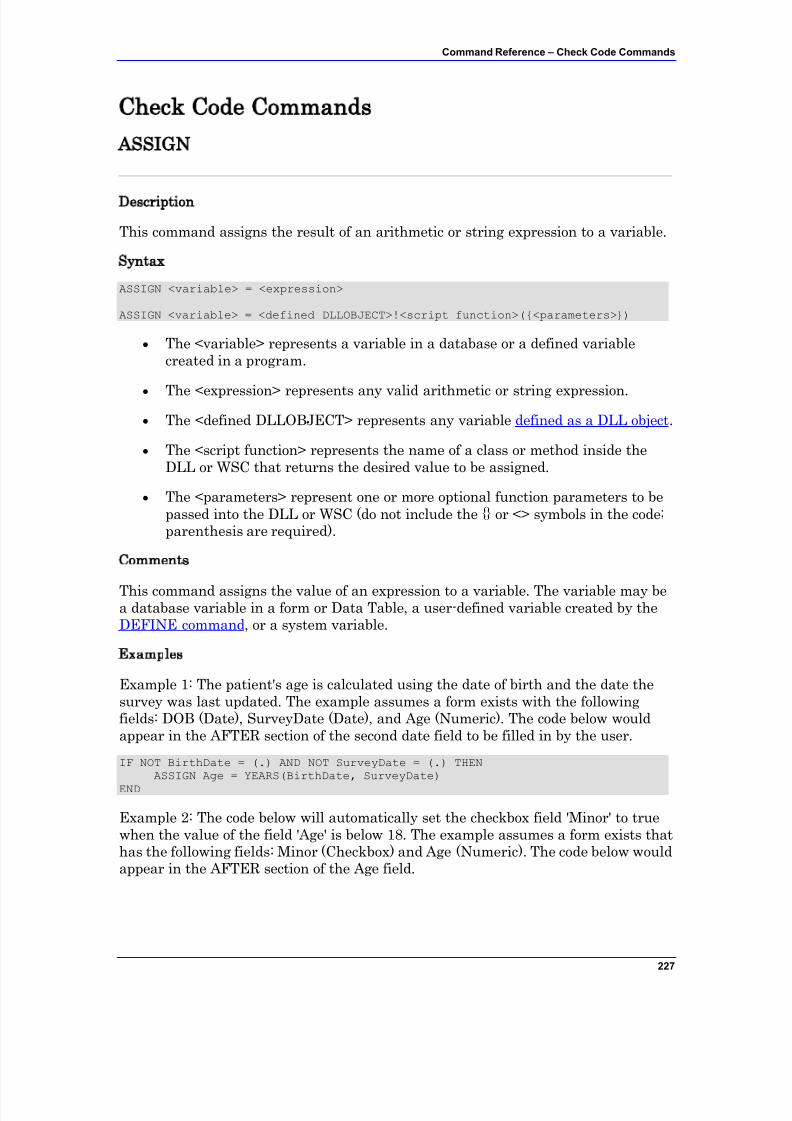
7/14/2019 Epi Info 7 User Guide-V1.0 Cleared
http://slidepdf.com/reader/full/epi-info-7-user-guide-v10-cleared-563109dd5013b 233/368
Command Reference – Check Code Commands
227
Check Code Commands
ASSIGN
Description
This command assigns the result of an arithmetic or string expression to a variable.
Syntax
ASSIGN <variable> = <expression>
ASSIGN <variable> = <defined DLLOBJECT>!<script function>({<parameters>})
The <variable> represents a variable in a database or a defined variablecreated in a program.
The <expression> represents any valid arithmetic or string expression.
The <defined DLLOBJECT> represents any variable defined as a DLL object.
The <script function> represents the name of a class or method inside theDLL or WSC that returns the desired value to be assigned.
The <parameters> represent one or more optional function parameters to bepassed into the DLL or WSC (do not include the {} or <> symbols in the code;parenthesis are required).
Comments
This command assigns the value of an expression to a variable. The variable may bea database variable in a form or Data Table, a user-defined variable created by theDEFINE command, or a system variable.
Examples
Example 1: The patient's age is calculated using the date of birth and the date thesurvey was last updated. The example assumes a form exists with the followingfields: DOB (Date), SurveyDate (Date), and Age (Numeric). The code below wouldappear in the AFTER section of the second date field to be filled in by the user.
IF NOT BirthDate = (.) AND NOT SurveyDate = (.) THENASSIGN Age = YEARS(BirthDate, SurveyDate)
END
Example 2: The code below will automatically set the checkbox field 'Minor' to truewhen the value of the field 'Age' is below 18. The example assumes a form exists thathas the following fields: Minor (Checkbox) and Age (Numeric). The code below wouldappear in the AFTER section of the Age field.
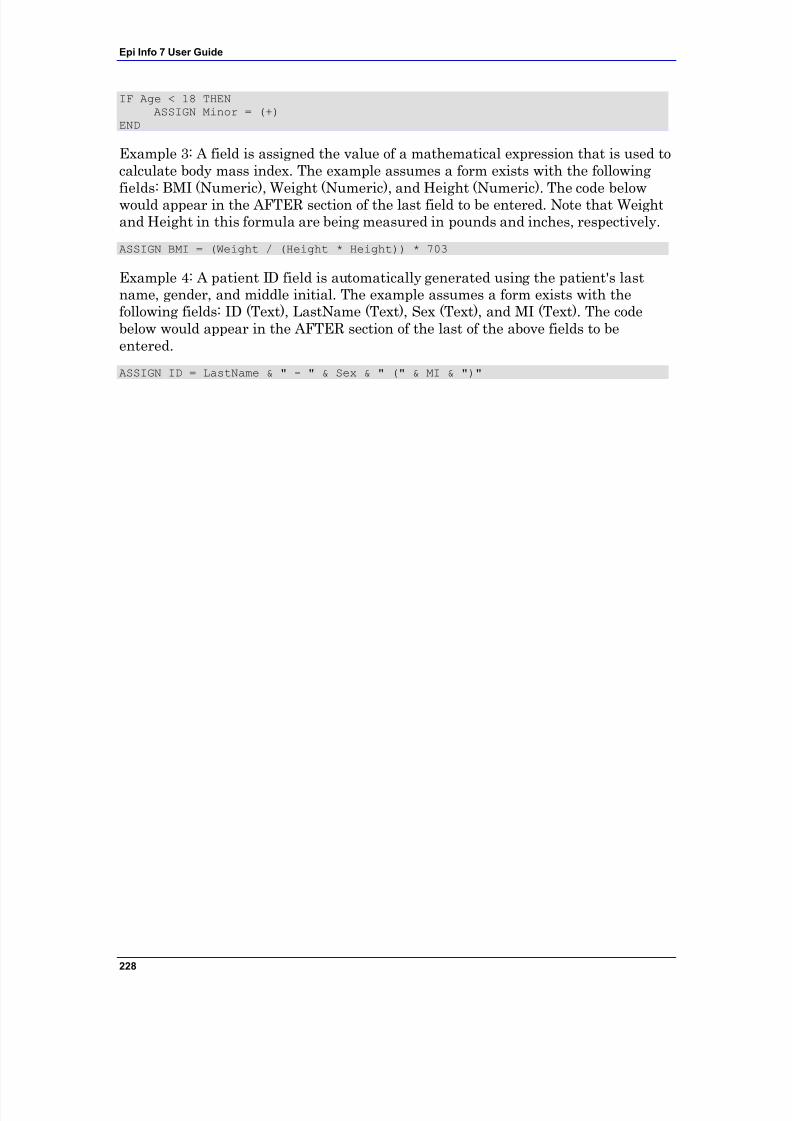
7/14/2019 Epi Info 7 User Guide-V1.0 Cleared
http://slidepdf.com/reader/full/epi-info-7-user-guide-v10-cleared-563109dd5013b 234/368
Epi Info 7 User Guide
228
IF Age < 18 THENASSIGN Minor = (+)
END
Example 3: A field is assigned the value of a mathematical expression that is used tocalculate body mass index. The example assumes a form exists with the followingfields: BMI (Numeric), Weight (Numeric), and Height (Numeric). The code belowwould appear in the AFTER section of the last field to be entered. Note that Weightand Height in this formula are being measured in pounds and inches, respectively.
ASSIGN BMI = (Weight / (Height * Height)) * 703
Example 4: A patient ID field is automatically generated using the patient's lastname, gender, and middle initial. The example assumes a form exists with thefollowing fields: ID (Text), LastName (Text), Sex (Text), and MI (Text). The codebelow would appear in the AFTER section of the last of the above fields to beentered.
ASSIGN ID = LastName & " - " & Sex & " (" & MI & ")"
7/14/2019 Epi Info 7 User Guide-V1.0 Cleared
http://slidepdf.com/reader/full/epi-info-7-user-guide-v10-cleared-563109dd5013b 235/368
Command Reference – Check Code Commands
229
AUTOSEARCH
Description
AUTOSEARCH causes Enter to search for records with values in the specified fieldsthat match ones in the current record. If a match is found, it can be displayed,edited, or ignored, and the current record can continue to be entered.
Syntax
AUTOSEARCH [<field(s)>]
The <field(s)> represents one or more fields to search.
Comments
The results are displayed as a spreadsheet. If you have more records than can be
viewed in a single screen, a scroll bar appears to the right of the spreadsheet. Usethe mouse to see the additional matched records.
To quickly navigate to one of the matched records returned, double-click theintended row. Alternatively, move the cursor to the desired row and press Enter orclick OK. Navigating to a matched record will discard any data entered to the newrecord. All fields will show data from the selected record. The record numberindicator at the lower left will show the record number of the selected record. Toavoid selecting any of the matched records, press Esc or click Cancel to return to thecurrent new record. Data entry will continue for the new record.
Fields displayed from a search are determined as follows:
If a single field is the key field, it will be displayed with as many other fieldsas possible.
Multiple key fields (if any) will be displayed before any others.
Example
The AUTOSEARCH command is used to find duplicate entries during data entry. Inthis example, duplicates are identified by a matching first and last name as in aname-based registry system. The example assumes a form exists with the following
fields: FirstName (Text) and LastName (Text). The code below would appear in the AFTER section of the second field to be filled in by the user.
AUTOSEARCH FirstName LastName

7/14/2019 Epi Info 7 User Guide-V1.0 Cleared
http://slidepdf.com/reader/full/epi-info-7-user-guide-v10-cleared-563109dd5013b 236/368
Epi Info 7 User Guide
230
Note: When searching on multiple fields, put the AUTOSEARCH command in CheckCode for a field after all the key values have been entered. In the example above,both FirstName and LastName are key fields and LastName is the last of the keyfields to be entered. The AUTOSEARCH command should appear in the Check Codefor LastName.
7/14/2019 Epi Info 7 User Guide-V1.0 Cleared
http://slidepdf.com/reader/full/epi-info-7-user-guide-v10-cleared-563109dd5013b 237/368
Command Reference – Check Code Commands
231
BEEP
Description
This command causes the computer to generate a beep sound. It is often used toemphasize a customized message or warning dialog during data entry.
Syntax
BEEP
Comments
Command must be typed into the Program Editor since it is not available using theCommand Tree.
Example
The computer emits a beep when invalid data is detected in the Age field. This codeshould appear in the AFTER section of the Age field.
IF Age > 5 THENBEEPDIALOG "Do not include records for children over 5."
END
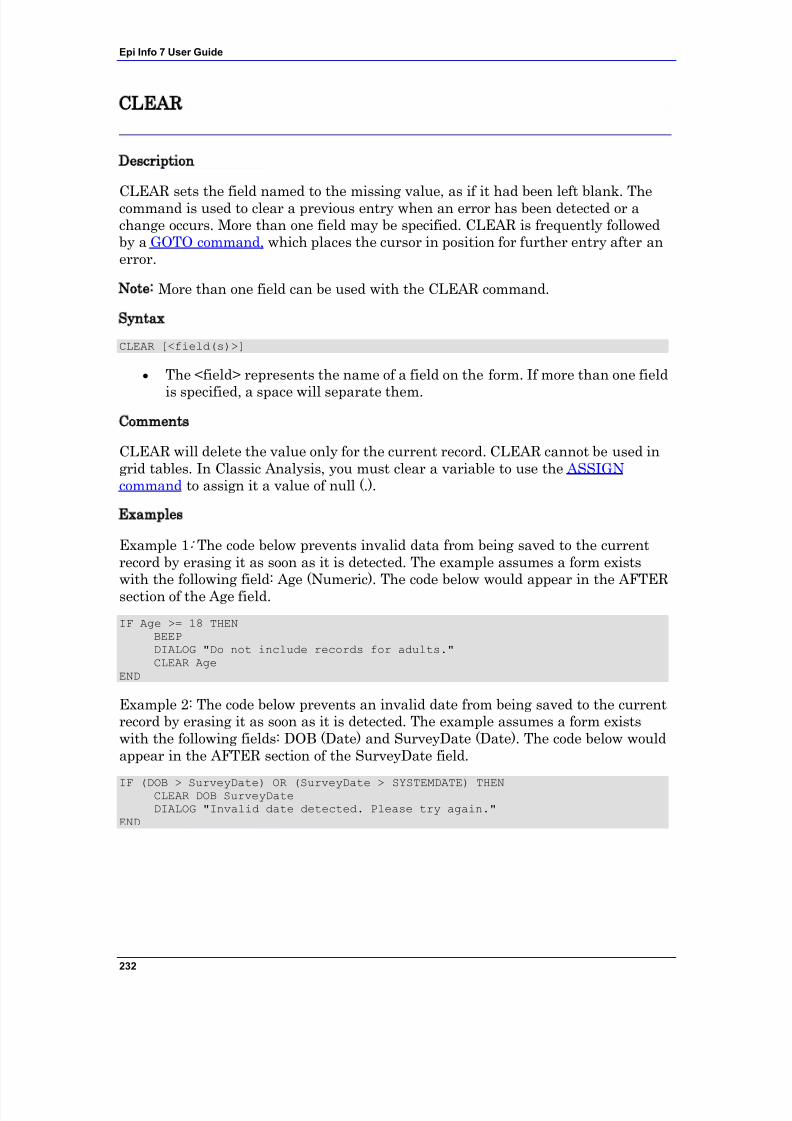
7/14/2019 Epi Info 7 User Guide-V1.0 Cleared
http://slidepdf.com/reader/full/epi-info-7-user-guide-v10-cleared-563109dd5013b 238/368
Epi Info 7 User Guide
232
CLEAR
Description
CLEAR sets the field named to the missing value, as if it had been left blank. Thecommand is used to clear a previous entry when an error has been detected or achange occurs. More than one field may be specified. CLEAR is frequently followedby a GOTO command, which places the cursor in position for further entry after anerror.
Note: More than one field can be used with the CLEAR command.
Syntax
CLEAR [<field(s)>]
The <field> represents the name of a field on the form. If more than one field
is specified, a space will separate them.
Comments
CLEAR will delete the value only for the current record. CLEAR cannot be used ingrid tables. In Classic Analysis, you must clear a variable to use the ASSIGNcommand to assign it a value of null (.).
Examples
Example 1: The code below prevents invalid data from being saved to the currentrecord by erasing it as soon as it is detected. The example assumes a form existswith the following field: Age (Numeric). The code below would appear in the AFTERsection of the Age field.
IF Age >= 18 THENBEEPDIALOG "Do not include records for adults."CLEAR Age
END
Example 2: The code below prevents an invalid date from being saved to the currentrecord by erasing it as soon as it is detected. The example assumes a form existswith the following fields: DOB (Date) and SurveyDate (Date). The code below wouldappear in the AFTER section of the SurveyDate field.
IF (DOB > SurveyDate) OR (SurveyDate > SYSTEMDATE) THENCLEAR DOB SurveyDateDIALOG "Invalid date detected. Please try again."
END
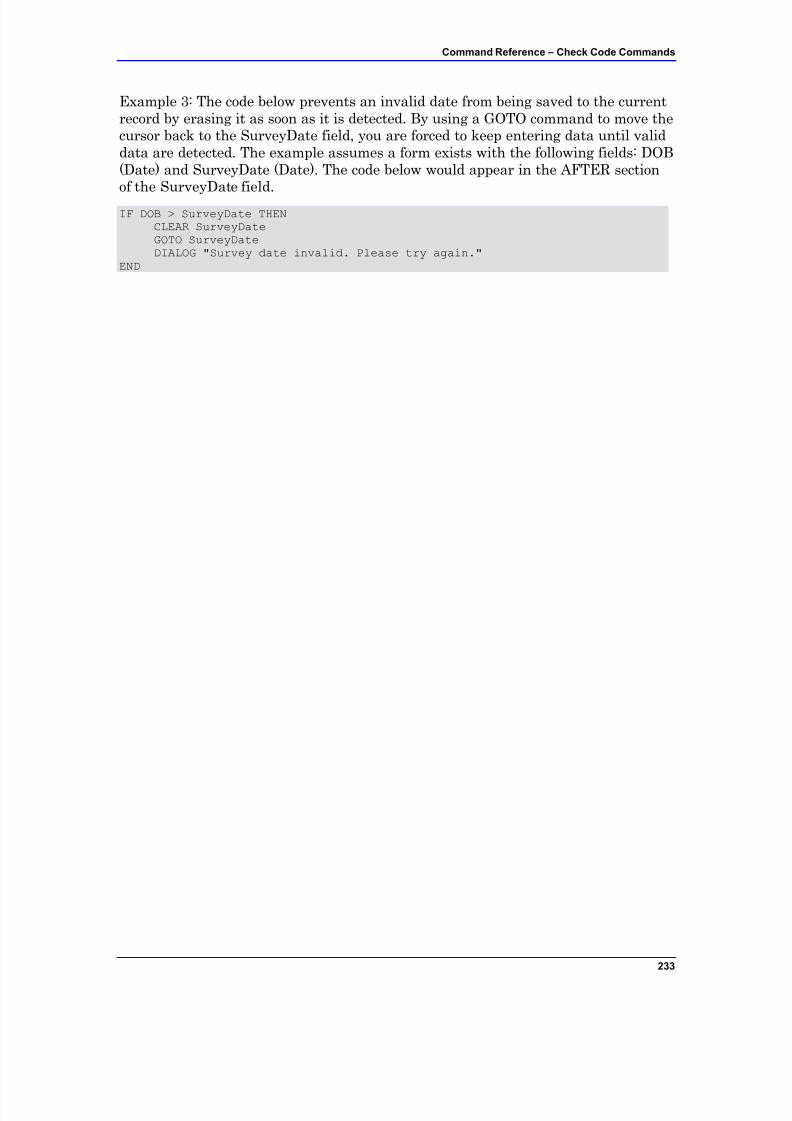
7/14/2019 Epi Info 7 User Guide-V1.0 Cleared
http://slidepdf.com/reader/full/epi-info-7-user-guide-v10-cleared-563109dd5013b 239/368
Command Reference – Check Code Commands
233
Example 3: The code below prevents an invalid date from being saved to the currentrecord by erasing it as soon as it is detected. By using a GOTO command to move thecursor back to the SurveyDate field, you are forced to keep entering data until validdata are detected. The example assumes a form exists with the following fields: DOB(Date) and SurveyDate (Date). The code below would appear in the AFTER sectionof the SurveyDate field.
IF DOB > SurveyDate THENCLEAR SurveyDateGOTO SurveyDateDIALOG "Survey date invalid. Please try again."
END
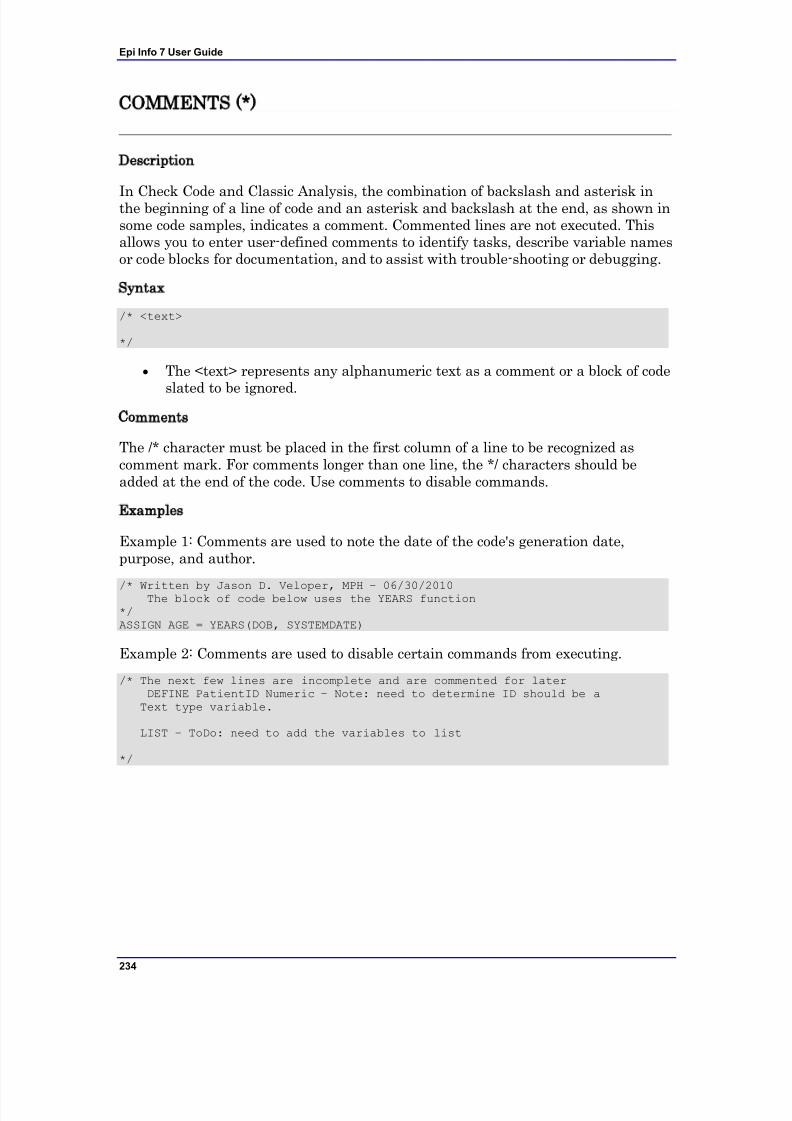
7/14/2019 Epi Info 7 User Guide-V1.0 Cleared
http://slidepdf.com/reader/full/epi-info-7-user-guide-v10-cleared-563109dd5013b 240/368
Epi Info 7 User Guide
234
COMMENTS (*)
Description
In Check Code and Classic Analysis, the combination of backslash and asterisk inthe beginning of a line of code and an asterisk and backslash at the end, as shown insome code samples, indicates a comment. Commented lines are not executed. Thisallows you to enter user-defined comments to identify tasks, describe variable namesor code blocks for documentation, and to assist with trouble-shooting or debugging.
Syntax
/* <text>
*/
The <text> represents any alphanumeric text as a comment or a block of code
slated to be ignored.Comments
The /* character must be placed in the first column of a line to be recognized ascomment mark. For comments longer than one line, the */ characters should beadded at the end of the code. Use comments to disable commands.
Examples
Example 1: Comments are used to note the date of the code's generation date,purpose, and author.
/* Written by Jason D. Veloper, MPH – 06/30/2010The block of code below uses the YEARS function*/ASSIGN AGE = YEARS(DOB, SYSTEMDATE)
Example 2: Comments are used to disable certain commands from executing.
/* The next few lines are incomplete and are commented for laterDEFINE PatientID Numeric – Note: need to determine ID should be aText type variable.
LIST – ToDo: need to add the variables to list
*/
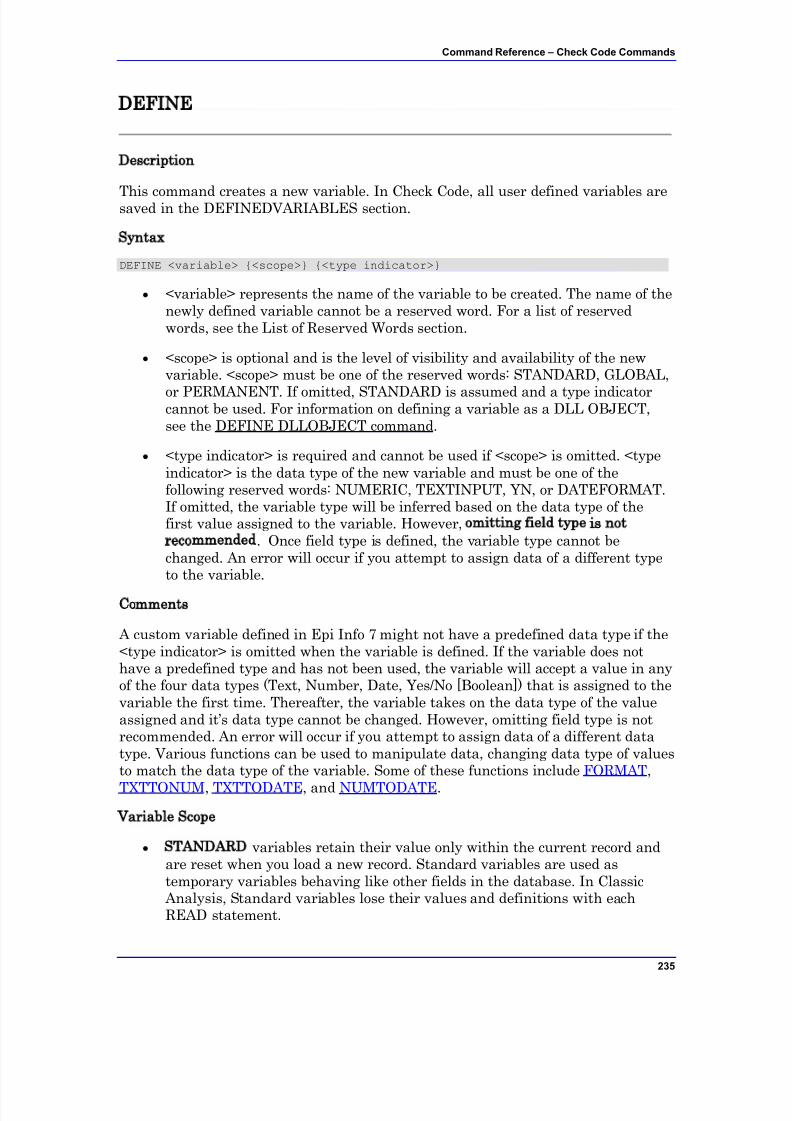
7/14/2019 Epi Info 7 User Guide-V1.0 Cleared
http://slidepdf.com/reader/full/epi-info-7-user-guide-v10-cleared-563109dd5013b 241/368
Command Reference – Check Code Commands
235
DEFINE
Description
This command creates a new variable. In Check Code, all user defined variables aresaved in the DEFINEDVARIABLES section.
Syntax
DEFINE <variable> {<scope>} {<type indicator>}
<variable> represents the name of the variable to be created. The name of thenewly defined variable cannot be a reserved word. For a list of reservedwords, see the List of Reserved Words section.
<scope> is optional and is the level of visibility and availability of the newvariable. <scope> must be one of the reserved words: STANDARD, GLOBAL,
or PERMANENT. If omitted, STANDARD is assumed and a type indicatorcannot be used. For information on defining a variable as a DLL OBJECT,see the DEFINE DLLOBJECT command.
<type indicator> is required and cannot be used if <scope> is omitted. <typeindicator> is the data type of the new variable and must be one of thefollowing reserved words: NUMERIC, TEXTINPUT, YN, or DATEFORMAT.If omitted, the variable type will be inferred based on the data type of thefirst value assigned to the variable. However, omitting field type is notrecommended. Once field type is defined, the variable type cannot bechanged. An error will occur if you attempt to assign data of a different typeto the variable.
Comments
A custom variable defined in Epi Info 7 might not have a predefined data type if the<type indicator> is omitted when the variable is defined. If the variable does nothave a predefined type and has not been used, the variable will accept a value in anyof the four data types (Text, Number, Date, Yes/No [Boolean]) that is assigned to thevariable the first time. Thereafter, the variable takes on the data type of the valueassigned and it‟s data type cannot be changed. However, omitting field type is notrecommended. An error will occur if you attempt to assign data of a different datatype. Various functions can be used to manipulate data, changing data type of valuesto match the data type of the variable. Some of these functions include FORMAT,
TXTTONUM, TXTTODATE, and NUMTODATE.
Variable Scope
STANDARD variables retain their value only within the current record andare reset when you load a new record. Standard variables are used astemporary variables behaving like other fields in the database. In Classic
Analysis, Standard variables lose their values and definitions with eachREAD statement.
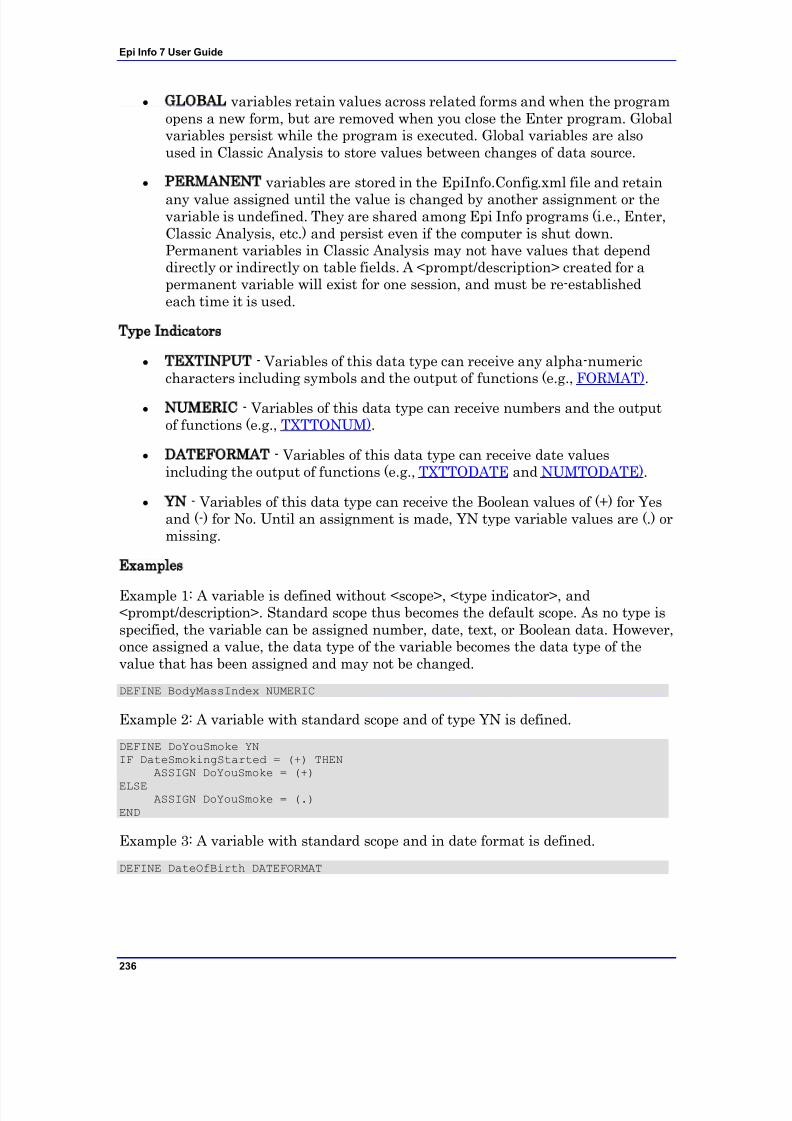
7/14/2019 Epi Info 7 User Guide-V1.0 Cleared
http://slidepdf.com/reader/full/epi-info-7-user-guide-v10-cleared-563109dd5013b 242/368
Epi Info 7 User Guide
236
GLOBAL variables retain values across related forms and when the programopens a new form, but are removed when you close the Enter program. Globalvariables persist while the program is executed. Global variables are alsoused in Classic Analysis to store values between changes of data source.
PERMANENT variables are stored in the EpiInfo.Config.xml file and retain
any value assigned until the value is changed by another assignment or thevariable is undefined. They are shared among Epi Info programs (i.e., Enter,Classic Analysis, etc.) and persist even if the computer is shut down.Permanent variables in Classic Analysis may not have values that dependdirectly or indirectly on table fields. A <prompt/description> created for apermanent variable will exist for one session, and must be re-establishedeach time it is used.
Type Indicators
TEXTINPUT - Variables of this data type can receive any alpha-numericcharacters including symbols and the output of functions (e.g., FORMAT).
NUMERIC - Variables of this data type can receive numbers and the outputof functions (e.g., TXTTONUM).
DATEFORMAT - Variables of this data type can receive date valuesincluding the output of functions (e.g., TXTTODATE and NUMTODATE).
YN - Variables of this data type can receive the Boolean values of (+) for Yesand (-) for No. Until an assignment is made, YN type variable values are (.) ormissing.
Examples
Example 1: A variable is defined without <scope>, <type indicator>, and<prompt/description>. Standard scope thus becomes the default scope. As no type isspecified, the variable can be assigned number, date, text, or Boolean data. However,once assigned a value, the data type of the variable becomes the data type of thevalue that has been assigned and may not be changed.
DEFINE BodyMassIndex NUMERIC
Example 2: A variable with standard scope and of type YN is defined.
DEFINE DoYouSmoke YNIF DateSmokingStarted = (+) THEN
ASSIGN DoYouSmoke = (+)
ELSEASSIGN DoYouSmoke = (.)
END
Example 3: A variable with standard scope and in date format is defined.
DEFINE DateOfBirth DATEFORMAT
7/14/2019 Epi Info 7 User Guide-V1.0 Cleared
http://slidepdf.com/reader/full/epi-info-7-user-guide-v10-cleared-563109dd5013b 243/368
Command Reference – Check Code Commands
237
Example 4: A variable with permanent scope is defined, but with no <typeindicator>. As described in Example 1, the variable data type will be set with thefirst assignment of data and cannot be changed thereafter.
DEFINE StateID PERMANENT
Example 5: A variable with global scope and of type text is defined.DEFINE PatientID GLOBAL TEXTINPUT
7/14/2019 Epi Info 7 User Guide-V1.0 Cleared
http://slidepdf.com/reader/full/epi-info-7-user-guide-v10-cleared-563109dd5013b 244/368
Epi Info 7 User Guide
238
DEFINE DLLOBJECT
Description
This command creates a variable that represents an ActiveX object and a classwithin an ActiveX DLL (dynamic link library) file, ActiveX EXE (executable file), ora Windows Scripting Component (WSC) file.
Syntax
ActiveX DLL File
DEFINE <variable> DLLOBJECT "<ActiveX name>.<class>"
Windows Scripting Component (WSC) File
DEFINE <variable> DLLOBJECT "<filename>"
The <variable> represents the name of the variable to be created. <variable>cannot be a reserved word.
The <ActiveX name> represents the internal name of the ActiveX object thatcontains the class object for the DLL or EXE file.
The <class> represents an internal class name that is defined within the ActiveX component.
The <filename> represents the name of the Windows Scripting Component(WSC) file where the script component resides.
CommentsThe ActiveX name may not be the same as the actual name of the dll (dynamic linklibrary) or executable (exe) file. An ActiveX object is given a name when it‟sdeveloped. This name is required to create the object. The ActiveX object (executableor dll) must be registered before it can be used. Windows Scripting Component(WSC) objects can also be used.
Examples
Example 1: A variable is created that points to a class object within the EpiweekDLL file. This variable can subsequently be used to find the Epi Week for any givendate.
DEFINE Week DLLOBJECT "EIEpiwk.Epiweek"
Example 2: A variable is created that points to a class object within theGetGlobalUniqueID.WSC file. You can use this variable to assign a field a uniqueID.
DEFINE Global_ID DLLOBJECT "GetGlobalUniqueID.WSC"
7/14/2019 Epi Info 7 User Guide-V1.0 Cleared
http://slidepdf.com/reader/full/epi-info-7-user-guide-v10-cleared-563109dd5013b 245/368
Command Reference – Check Code Commands
239
AFTER and END-AFTER
Description
This command divides Check Commands to be executed after data entry. Allcommands in the AFTER and END-AFTER block are executed after entering data tothe field, page, or form.
Syntax
AFTER
AFTER and END-AFTER are only used in Check Code. Command buttonswill not take END-AFTER since all code inserted will be executed when youclick the button.
Comments
This command enables actions to occur after accessing a form, page, or field. Thedefault time to execute commands associated with a variable is after entry.
AFTER must start in the first position of the line and end with END-AFTER.
Example
The following commands represent the Check Code for a variable called Demo1.
BEFOREDIALOG ”This is Before entry” END-BEFORE
AFTERDIALOG ”This is After entry” END-AFTER
7/14/2019 Epi Info 7 User Guide-V1.0 Cleared
http://slidepdf.com/reader/full/epi-info-7-user-guide-v10-cleared-563109dd5013b 246/368
Epi Info 7 User Guide
240
BEFORE and END-BEFORE
Description
This command divides Check Commands to be executed before data entry from thoseexecuted after entry. All commands in the BEFORE and END-BEFORE block areexecuted before data entry to the field, page, or form.
Syntax
END-BEFORE
ENDBEFORE is only used in Check Code. Command buttons will not takeENDBEFORE since all code inserted will be executed when you click thebutton.
Comments
This command enables actions to occur before accessing a form, page, or field. Thedefault time to execute commands associated with a variable is before entry.
BEFORE must start in the first position of the line and end with END-BEFORE.
Example
The following commands represent the Check Code for a variable called Demo1.
BEFOREDIALOG ”This is Before entry” END-BEFORE
AFTERDIALOG ”This is After entry” END-AFTER
7/14/2019 Epi Info 7 User Guide-V1.0 Cleared
http://slidepdf.com/reader/full/epi-info-7-user-guide-v10-cleared-563109dd5013b 247/368
Command Reference – Check Code Commands
241
EXECUTE
Description
Executes a Windows or DOS program - either one explicitly named in the commandor one designated within the Windows registry as appropriate for a document with a
named file extension. This provides a mechanism for bringing up the default wordprocessor or browser on a computer without first knowing its name. The EXECUTEcommand accepts a series of paths, separated by semicolons:
EXECUTE c:\epi_info\myfile.exe;d:\myfile.exe
If the first is not found, the others are tried in succession. In Check Code, theEXECUTE command can be placed in any command block, but is often used with abutton. A button does not have a Before Entry section.
Syntax
EXECUTE <filename>
EXECUTE "<filename> <command-line parameters>"
EXECUTE NOWAITFOREXIT <filename>
EXECUTE NOWAITFOREXIT '<filename>'
EXECUTE NOWAITFOREXIT "<filename>"
EXECUTE WAITFOREXIT <filename>
EXECUTE WAITFOREXIT '<filename>'
EXECUTE WAITFOREXIT "<filename>"
The <filename> represents the path and program name for .exe (filename forregistered Windows programs) and .com (filename for MS-DOS binaryexecutable) files.
The <command-line parameters> represent any additional command-linearguments that the program can accept.
When Wait for Command to Execute (modal) is specified, the commandshould run and Enter should continue running. When Wait for Command toExecute is not specified (non-modal), Enter should wait until the executedprogram closes before continuing. When EXECUTE is run modally,permanent variables are written before the command is executed and
reloaded after it is executed.
Comments
If the name of an executable program, (e.g., ENTER.EXE, MYBATCH.BAT, orMYWEB.HTM) is given, the program will be run in a separate window. The windowcloses when the program terminates.
7/14/2019 Epi Info 7 User Guide-V1.0 Cleared
http://slidepdf.com/reader/full/epi-info-7-user-guide-v10-cleared-563109dd5013b 248/368
Epi Info 7 User Guide
242
If the name given is not a program, but a file with an extension (the three charactersafter the ".") registered by Windows for displaying the document, the correctprogram to display the file will be activated (i.e., WRITEUP.DOC might causeMicrosoft Word© to run and load the file on one computer). Usually .TXT will runNOTEPAD.EXE© or WORDPAD.EXE©, and image files will appear in a browser orin a graphics program. An .HTM file will bring up the default browser.
You will not need to supply the location or even the name of the program that will berun. These details are stored in the Windows registry for common file extensions.The same concept applies to Internet addresses (URLs). Give a URL (UniversalResource Locator) that ends in .HTM or begins with HTTP://“http://www.cdc.gov/epiinfo/” and Windows brings up the default browser, connectsto the Internet (if possible), and goes directly to the site indicated.
Examples
Example 1: A text file on the C drive is opened. The operating system will select anapplication to open the file.
EXECUTE “C:\logfile.txt”
Example 2: An executable file is run.
EXECUTE "C:\Windows\Notepad.exe"
Example 3: Windows Internet Explorer is run and passed http://www.cdc.gov/epiinfoas a command-line parameter. Because WAITFOREXIT is specified, Enter will notallow you to continue entering data until the browser window is closed.
EXECUTE WAITFOREXIT "http://www.cdc.gov/epiinfo"
7/14/2019 Epi Info 7 User Guide-V1.0 Cleared
http://slidepdf.com/reader/full/epi-info-7-user-guide-v10-cleared-563109dd5013b 249/368
Command Reference – Check Code Commands
243
GOTO
Description
This command can be used alone or in an IF statement to transfer the cursor to anamed variable field.
Syntax
GOTO <event>
The <event> can be a +1, -1, page number, or a variable.
Event and Description
+1 Automatically saves the current page if changes have been made, and goesto the next page.
-1 Automatically saves the current page if changes have been made, and goesto the previous page.
<page number> Automatically saves the current page if changes have beenmade, and goes to the page indicated by the number.
<variable name> Goes to the variable indicated. Automatically saves thecurrent page if changes have been made, if the variable is on another page.
Comments
GOTO will be ignored if it is in the Before or After Record event. The GOTO
command skips all the variables in between unavailable for data entry or Read Only.
Examples
Example 1: The form will skip directly from one field to another based on certainuser input. The example assumes a form exists that has the following fields:DoYouSmoke (Yes/No), PacksPerDay (Numeric), and HeartDisease (Yes/No). Thecode below would appear in the AFTER section of the DoYouSmoke field.
IF DoYouSmoke = (+) THENGOTO HeartDisease
ELSEGOTO PacksPerDay
END
Example 2: You will be taken to the second page on the form based upon an answerprovided to a question on lung disease. The example assumes a form exists that hastwo pages and the following fields: LungDisease (Yes/No). The code below wouldappear in the AFTER section of the LungDisease field.
IF LungDisease = (-) THENGOTO 2
END
7/14/2019 Epi Info 7 User Guide-V1.0 Cleared
http://slidepdf.com/reader/full/epi-info-7-user-guide-v10-cleared-563109dd5013b 250/368
Epi Info 7 User Guide
244
Example 3: You will be taken to the page immediately following the one they are oncurrently. The example assumes a form exists that has two pages and the followingfields: DOB (Date) on page 1. The code below would appear in the AFTER section of the DOB field.
IF NOT DOB = (.) THEN
GOTO +1END
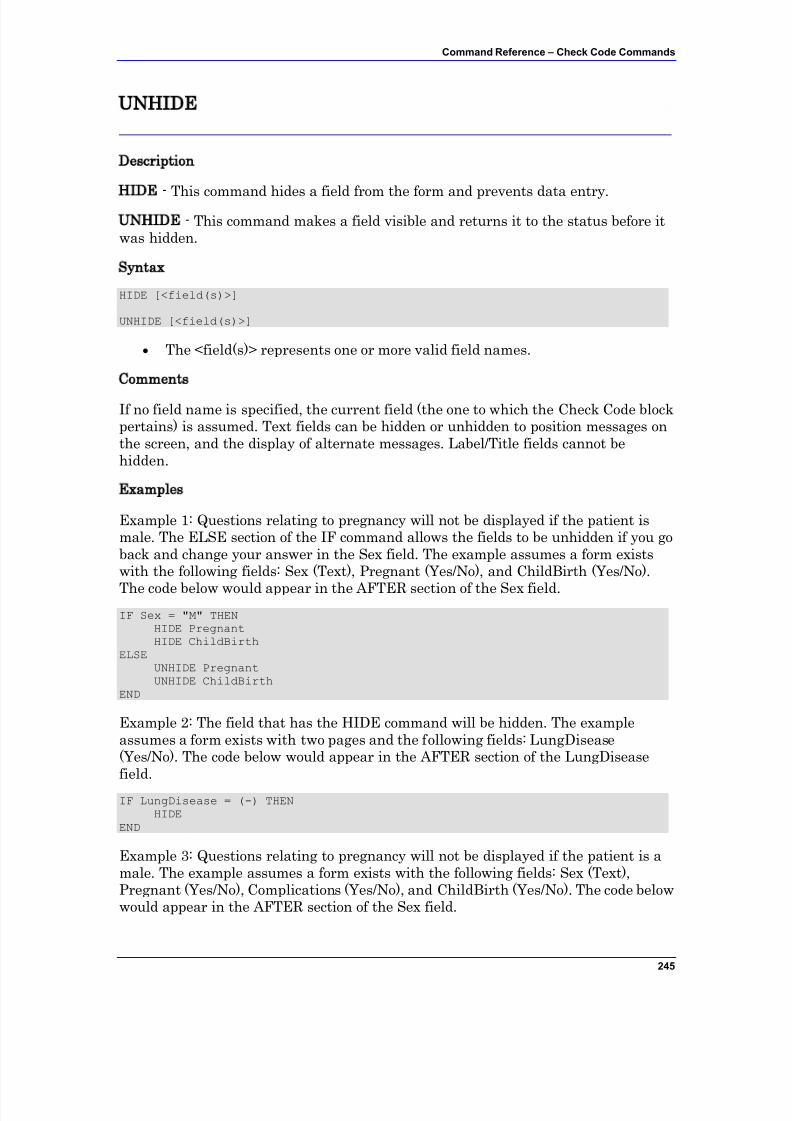
7/14/2019 Epi Info 7 User Guide-V1.0 Cleared
http://slidepdf.com/reader/full/epi-info-7-user-guide-v10-cleared-563109dd5013b 251/368
Command Reference – Check Code Commands
245
UNHIDE
Description
HIDE - This command hides a field from the form and prevents data entry.UNHIDE - This command makes a field visible and returns it to the status before itwas hidden.
Syntax
HIDE [<field(s)>]
UNHIDE [<field(s)>]
The <field(s)> represents one or more valid field names.
Comments
If no field name is specified, the current field (the one to which the Check Code blockpertains) is assumed. Text fields can be hidden or unhidden to position messages onthe screen, and the display of alternate messages. Label/Title fields cannot behidden.
Examples
Example 1: Questions relating to pregnancy will not be displayed if the patient ismale. The ELSE section of the IF command allows the fields to be unhidden if you goback and change your answer in the Sex field. The example assumes a form existswith the following fields: Sex (Text), Pregnant (Yes/No), and ChildBirth (Yes/No).
The code below would appear in the AFTER section of the Sex field.IF Sex = "M" THEN
HIDE PregnantHIDE ChildBirth
ELSEUNHIDE PregnantUNHIDE ChildBirth
END
Example 2: The field that has the HIDE command will be hidden. The exampleassumes a form exists with two pages and the following fields: LungDisease(Yes/No). The code below would appear in the AFTER section of the LungDiseasefield.
IF LungDisease = (-) THENHIDE
END
Example 3: Questions relating to pregnancy will not be displayed if the patient is amale. The example assumes a form exists with the following fields: Sex (Text),Pregnant (Yes/No), Complications (Yes/No), and ChildBirth (Yes/No). The code belowwould appear in the AFTER section of the Sex field.

7/14/2019 Epi Info 7 User Guide-V1.0 Cleared
http://slidepdf.com/reader/full/epi-info-7-user-guide-v10-cleared-563109dd5013b 252/368
Epi Info 7 User Guide
246
IF Sex = "M" THENHIDE Pregnant ChildBirth Complications
END
Note: When hiding a field, it is important that be unhidden (with an
If…Then…Else…) if the value entered is changed.
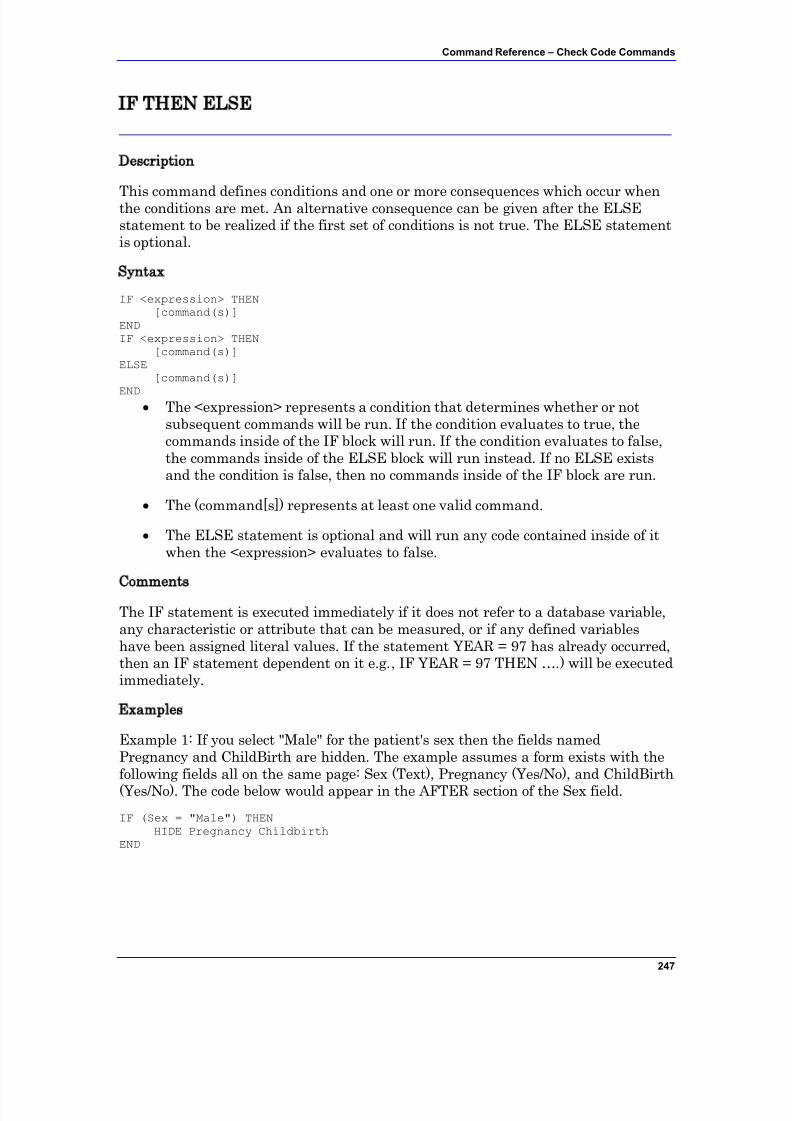
7/14/2019 Epi Info 7 User Guide-V1.0 Cleared
http://slidepdf.com/reader/full/epi-info-7-user-guide-v10-cleared-563109dd5013b 253/368
Command Reference – Check Code Commands
247
IF THEN ELSE
Description
This command defines conditions and one or more consequences which occur whenthe conditions are met. An alternative consequence can be given after the ELSEstatement to be realized if the first set of conditions is not true. The ELSE statementis optional.
Syntax
IF <expression> THEN[command(s)]
ENDIF <expression> THEN
[command(s)]ELSE
[command(s)]
END The <expression> represents a condition that determines whether or not
subsequent commands will be run. If the condition evaluates to true, thecommands inside of the IF block will run. If the condition evaluates to false,the commands inside of the ELSE block will run instead. If no ELSE existsand the condition is false, then no commands inside of the IF block are run.
The (command[s]) represents at least one valid command.
The ELSE statement is optional and will run any code contained inside of itwhen the <expression> evaluates to false.
CommentsThe IF statement is executed immediately if it does not refer to a database variable,any characteristic or attribute that can be measured, or if any defined variableshave been assigned literal values. If the statement YEAR = 97 has already occurred,then an IF statement dependent on it e.g., IF YEAR = 97 THEN ….) will be executedimmediately.
Examples
Example 1: If you select "Male" for the patient's sex then the fields namedPregnancy and ChildBirth are hidden. The example assumes a form exists with thefollowing fields all on the same page: Sex (Text), Pregnancy (Yes/No), and ChildBirth
(Yes/No). The code below would appear in the AFTER section of the Sex field.
IF (Sex = "Male") THENHIDE Pregnancy Childbirth
END
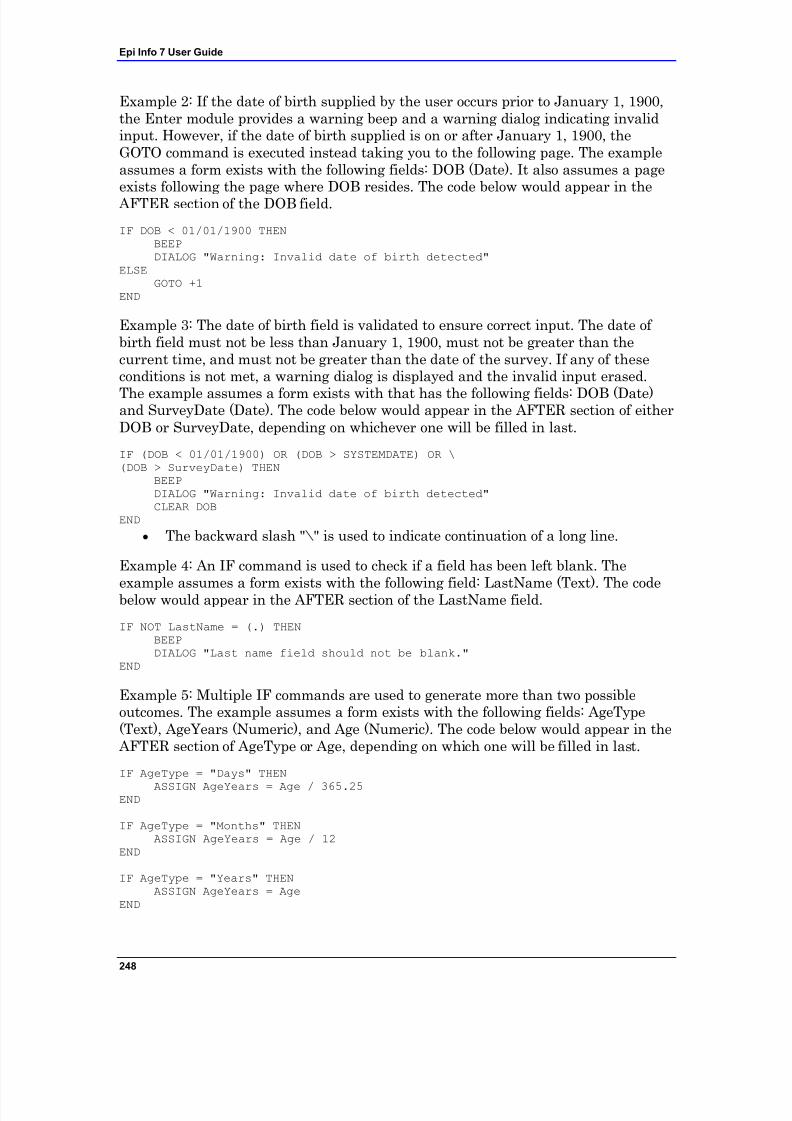
7/14/2019 Epi Info 7 User Guide-V1.0 Cleared
http://slidepdf.com/reader/full/epi-info-7-user-guide-v10-cleared-563109dd5013b 254/368
Epi Info 7 User Guide
248
Example 2: If the date of birth supplied by the user occurs prior to January 1, 1900,the Enter module provides a warning beep and a warning dialog indicating invalidinput. However, if the date of birth supplied is on or after January 1, 1900, theGOTO command is executed instead taking you to the following page. The exampleassumes a form exists with the following fields: DOB (Date). It also assumes a pageexists following the page where DOB resides. The code below would appear in the
AFTER section of the DOB field.
IF DOB < 01/01/1900 THENBEEPDIALOG "Warning: Invalid date of birth detected"
ELSEGOTO +1
END
Example 3: The date of birth field is validated to ensure correct input. The date of birth field must not be less than January 1, 1900, must not be greater than thecurrent time, and must not be greater than the date of the survey. If any of theseconditions is not met, a warning dialog is displayed and the invalid input erased.
The example assumes a form exists with that has the following fields: DOB (Date)and SurveyDate (Date). The code below would appear in the AFTER section of eitherDOB or SurveyDate, depending on whichever one will be filled in last.
IF (DOB < 01/01/1900) OR (DOB > SYSTEMDATE) OR \(DOB > SurveyDate) THEN
BEEPDIALOG "Warning: Invalid date of birth detected"CLEAR DOB
END
The backward slash "\" is used to indicate continuation of a long line.
Example 4: An IF command is used to check if a field has been left blank. The
example assumes a form exists with the following field: LastName (Text). The codebelow would appear in the AFTER section of the LastName field.
IF NOT LastName = (.) THENBEEPDIALOG "Last name field should not be blank."
END
Example 5: Multiple IF commands are used to generate more than two possibleoutcomes. The example assumes a form exists with the following fields: AgeType(Text), AgeYears (Numeric), and Age (Numeric). The code below would appear in the
AFTER section of AgeType or Age, depending on which one will be filled in last.
IF AgeType = "Days" THEN
ASSIGN AgeYears = Age / 365.25END
IF AgeType = "Months" THENASSIGN AgeYears = Age / 12
END
IF AgeType = "Years" THENASSIGN AgeYears = Age
END
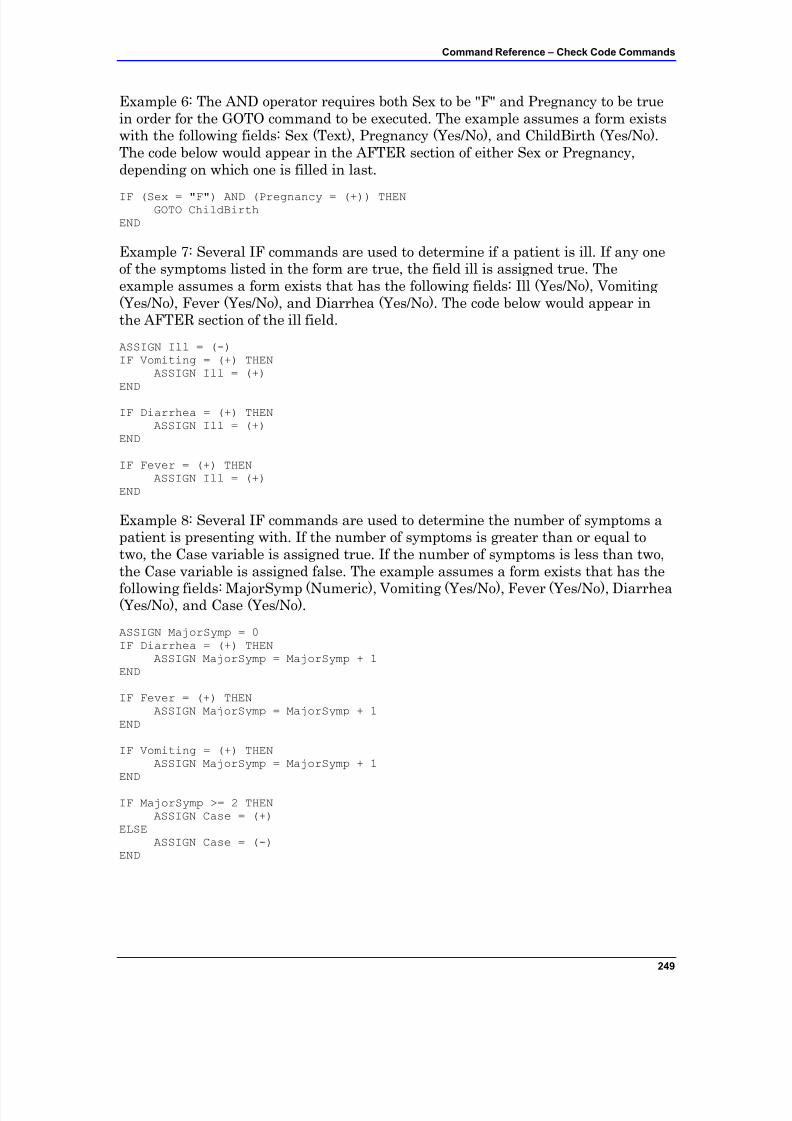
7/14/2019 Epi Info 7 User Guide-V1.0 Cleared
http://slidepdf.com/reader/full/epi-info-7-user-guide-v10-cleared-563109dd5013b 255/368
Command Reference – Check Code Commands
249
Example 6: The AND operator requires both Sex to be "F" and Pregnancy to be truein order for the GOTO command to be executed. The example assumes a form existswith the following fields: Sex (Text), Pregnancy (Yes/No), and ChildBirth (Yes/No).The code below would appear in the AFTER section of either Sex or Pregnancy,depending on which one is filled in last.
IF (Sex = "F") AND (Pregnancy = (+)) THENGOTO ChildBirth
END
Example 7: Several IF commands are used to determine if a patient is ill. If any oneof the symptoms listed in the form are true, the field ill is assigned true. Theexample assumes a form exists that has the following fields: Ill (Yes/No), Vomiting(Yes/No), Fever (Yes/No), and Diarrhea (Yes/No). The code below would appear inthe AFTER section of the ill field.
ASSIGN Ill = (-)IF Vomiting = (+) THEN
ASSIGN Ill = (+)
END
IF Diarrhea = (+) THENASSIGN Ill = (+)
END
IF Fever = (+) THENASSIGN Ill = (+)
END
Example 8: Several IF commands are used to determine the number of symptoms apatient is presenting with. If the number of symptoms is greater than or equal totwo, the Case variable is assigned true. If the number of symptoms is less than two,the Case variable is assigned false. The example assumes a form exists that has the
following fields: MajorSymp (Numeric), Vomiting (Yes/No), Fever (Yes/No), Diarrhea(Yes/No), and Case (Yes/No).
ASSIGN MajorSymp = 0IF Diarrhea = (+) THEN
ASSIGN MajorSymp = MajorSymp + 1END
IF Fever = (+) THENASSIGN MajorSymp = MajorSymp + 1
END
IF Vomiting = (+) THENASSIGN MajorSymp = MajorSymp + 1
END
IF MajorSymp >= 2 THENASSIGN Case = (+)
ELSEASSIGN Case = (-)
END

7/14/2019 Epi Info 7 User Guide-V1.0 Cleared
http://slidepdf.com/reader/full/epi-info-7-user-guide-v10-cleared-563109dd5013b 256/368
Epi Info 7 User Guide
250
NEWRECORD
Description
This command saves the current records data and opens a new record for data entry.Syntax
NEWRECORDExample
DIALOG "This is the last field in my form."NEWRECORD

7/14/2019 Epi Info 7 User Guide-V1.0 Cleared
http://slidepdf.com/reader/full/epi-info-7-user-guide-v10-cleared-563109dd5013b 257/368
Command Reference – Check Code Commands
251
7/14/2019 Epi Info 7 User Guide-V1.0 Cleared
http://slidepdf.com/reader/full/epi-info-7-user-guide-v10-cleared-563109dd5013b 258/368
252
Analysis Commands
ASSIGN
Description
This command assigns numeric or string expression results to a variable. It may bea database variable in a form or data table, or a user-defined variable created by theDEFINE command in a program.
Syntax
ASSIGN <variable> = <expression>LET <variable> = <expression>
(ASSIGN and LET may be omitted)
<variable> = <expression>
The <variable> represents a variable in a database or a defined variablecreated in a program.
The <expression> represents any valid arithmetic or string expression.
Program Specific Feature
If the right side of the assignment does not contain a field variable (one in adatabase table), or a variable that depends on a field variable, the assignment ismade immediately.
DEFINE YEAR NUMERIC
ASSIGN YEAR = 2000
The following code contains two view variables, ONSETDATE andEXPOSUREDATE.
DEFINE INCUBATION NUMERIC
ASSIGN INCUBATION = ONSETDATE-EXPOSUREDATE
In this example, INCUBATION is only calculated during current dataset processing.It is calculated for each record and may be used similar to a dataset variable inprocedures (i.e., TABLES, FREQ, and GRAPH). Prior to and after processing adataset, INCUBATION will have a "missing" value, although it could be assigned a
value with another statement (e.g., INCUBATION = 999).
The value is calculated each time a record that meets the conditions of SELECT isread from the dataset. Any legal expression can be used that combines functions orliteral values and operators (i.e., &, +, -, *, /, ^, and MOD). Boolean expressions arenot supported in assign commands. Standard variables that depend on databasefields must be saved to a table using WRITE before they can be edited using LISTUPDATE.
7/14/2019 Epi Info 7 User Guide-V1.0 Cleared
http://slidepdf.com/reader/full/epi-info-7-user-guide-v10-cleared-563109dd5013b 259/368
Command Reference – Analysis Commands
253
Comments
Temporary variables must be defined before being used and will accept any type of data (i.e., text, numeric, or date). Once they have been assigned a non-missing valueor an expression, their type cannot change.
If an attempt is made to assign an invalid expression to a variable, it retains anyprevious assignment.
Examples
Example 1: The ASSIGN command is used to assign values to defined variables anddatabase variables. Note that literal values (e.g., 42, other variables, and functions)can be used on the right side of the = operator.
READ {C:\My_Project_Folder \Sample\Sample.prj}:Surveillance
DEFINE State TEXTINPUTASSIGN City = "Atlanta"ASSIGN State = "GA"
ASSIGN Address = City & ", " & StateDEFINE Now DATEFORMATASSIGN Now = SYSTEMTIMEDEFINE Duration NUMERICASSIGN Duration = YEARS(01/01/1998, ReportDate)DEFINE Ill YNASSIGN Ill = (-)ASSIGN Age = 42ASSIGN Occupation = "Doctor"LIST Address City State Duration Now Ill Occupation Age GRIDTABLE
7/14/2019 Epi Info 7 User Guide-V1.0 Cleared
http://slidepdf.com/reader/full/epi-info-7-user-guide-v10-cleared-563109dd5013b 260/368
Epi Info 7 User Guide
254
BEEP
Description
This command generates a sound.Syntax
BEEP
Example
If the number of records in the database is greater than 1,000, a beep is generatedand a dialog box appears.
READ {C:\My_Project_Folder \Sample\Sample.prj}:Surveillance
IF RECORDCOUNT > 4 THENBEEPDIALOG "Database greater than 4 records."
END
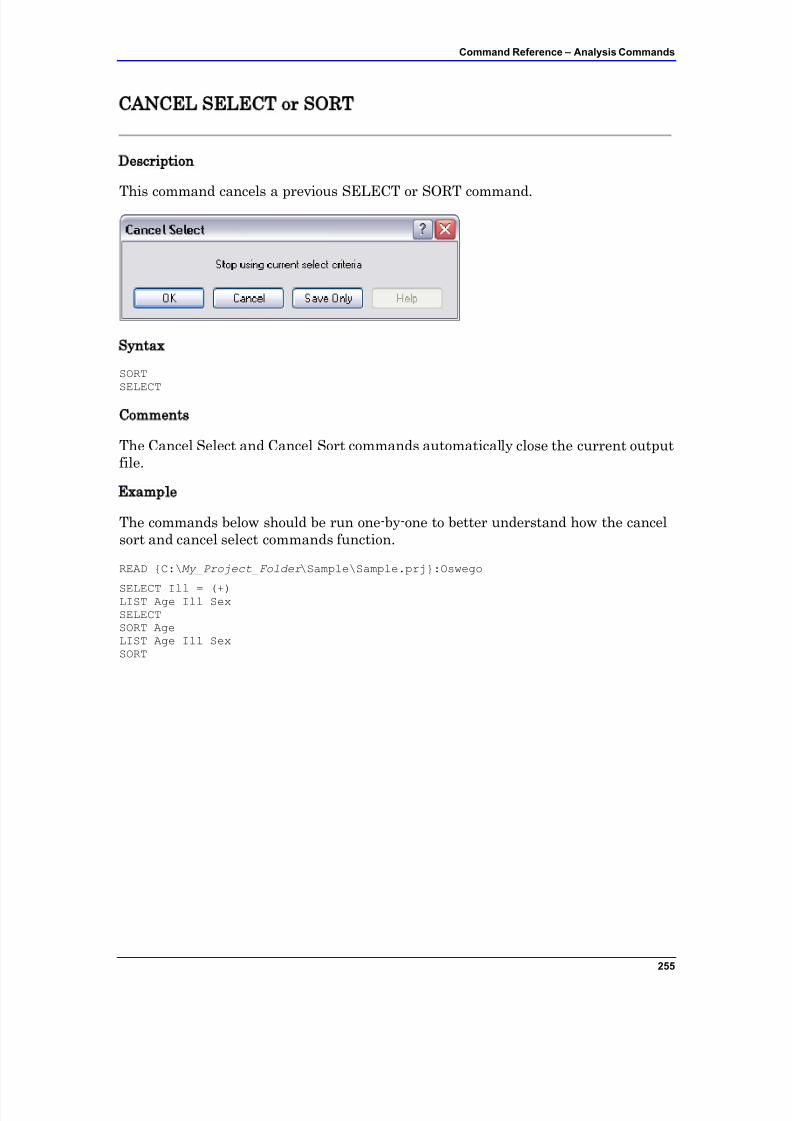
7/14/2019 Epi Info 7 User Guide-V1.0 Cleared
http://slidepdf.com/reader/full/epi-info-7-user-guide-v10-cleared-563109dd5013b 261/368
Command Reference – Analysis Commands
255
CANCEL SELECT or SORT
Description
This command cancels a previous SELECT or SORT command.
Syntax
SORT
SELECT
Comments
The Cancel Select and Cancel Sort commands automatically close the current outputfile.
Example
The commands below should be run one-by-one to better understand how the cancelsort and cancel select commands function.
READ {C:\My_Project_Folder \Sample\Sample.prj}:Oswego
SELECT Ill = (+)LIST Age Ill SexSELECTSORT AgeLIST Age Ill SexSORT
7/14/2019 Epi Info 7 User Guide-V1.0 Cleared
http://slidepdf.com/reader/full/epi-info-7-user-guide-v10-cleared-563109dd5013b 262/368
Epi Info 7 User Guide
256
CLOSEOUT
Description
This command closes the current output file. It is normally used after a ROUTEOUTcommand when all the information to be included in the ROUTEOUT file has beenproduced.
Syntax
CLOSEOUT
Example
READ {C:\My_Project_Folder \Sample\Sample.prj}:Oswego
ROUTEOUT “C:\ My_Project_Folder \Outbreak1.htm” REPLACE TABLES Vanilla Ill STRATAVAR=Sex
MEANS Age IllCLOSEOUT
7/14/2019 Epi Info 7 User Guide-V1.0 Cleared
http://slidepdf.com/reader/full/epi-info-7-user-guide-v10-cleared-563109dd5013b 263/368
Command Reference – Analysis Commands
257
COXPH
Description
This command performs Cox-Proportional Hazards and Extended Cox-ProportionalHazards survival analysis. This form of survival analysis relates covariates tofailure through hazard ratios. A covariate with a hazard ratio greater than onecauses failure. A covariate with a hazard ratio less than one improves survival.Some of the subjects may be unavailable prior to failure; the term "censored" isapplied to them. COXPH is especially constructed to deal with this situation.Statistics showing the risk set by group and time can be written to an OUTTABLEfor later formatting.
Syntax
COXPH <time variable>= <covariate(s)>[: <time function>:] * <censor variable>(<value>) [TIMEUNIT="<time unit>"] [OUTTABLE=<tablename>] [GRAPHTYPE="<graph
type>"] [WEIGHTVAR=<weight variable>] [STRATAVAR=<strata variable(s)>][GRAPH=<graph variable(s)>]
The <time variable> represents a numeric or date variable, specifying whenfailure or censorship occurred.
The <covariate(s)> represent a numeric variable, a non-numeric variable, or avariable specified as non-numeric by parenthesis. Any non-numeric variable,even a variable specified as non-numeric by surrounding with parenthesis, isautomatically recoded into dummy variables. For all but one of the levels of avariable, a dummy variable will be created. It measures the contribution of its level to the excluded level. A covariate may be followed by a time function.
This causes COXPH to run the Extended Cox procedure.
The <time function> represents a numeric expression involving the timevariable.
The <censor variable> indicates whether the event is a failure or a censor.
The <value> indicates which value of the CensorVar represents failure.
The <strata variable(s)> represents a list of variables indicating the differentlevels of strata.
The <weight variable> represents a variable to specify the contribution each
data row has on the output.
The <time unit> represents a value for labeling the time axis.
The <tablename> represents a valid table name.
The <graph type> generates one of the indicated graphs:
7/14/2019 Epi Info 7 User Guide-V1.0 Cleared
http://slidepdf.com/reader/full/epi-info-7-user-guide-v10-cleared-563109dd5013b 264/368
Epi Info 7 User Guide
258
1. Survival Probability shows the adjusted survival curves.
2. Observed shows the observed survival curves.
3. Survival-Observed shows the adjusted and observed survival curves.
4. Log-log Survival shows the logarithm of the negative of the logarithmof the adjusted survival curve.
5. Log-log Observed shows the logarithm of the negative of the logarithmof the observed survival curve.
6. Hazard Function shows the adjusted hazard function.
7. None
The <graph variable(s)> represent a list of variables used to generatesurvival curves. Graph variables that are covariates or stratavariables create curves adjusted by the covariates at all possible
combinations of these graph variables. If a variable is numeric, it isplotted at its average value. Otherwise the graph variable splits thedata into separate groups, each with its own curve.
Comments
COXPH uses the Breslow method to handle ties in the data.
Example
In this example, we will use the Anderson dataset from a clinical trial of leukemiapatients to compare the treatment and placebo group survival.
READ {C:\My_Project_Folder \Sample\Sample.prj}:Anderson
COXPH STIME = (Rx) * Status ( 1 ) TIMEUNIT="Weeks" PVALUE=95% GRAPH=RxGRAPHTYPE="Survival Probability"
7/14/2019 Epi Info 7 User Guide-V1.0 Cleared
http://slidepdf.com/reader/full/epi-info-7-user-guide-v10-cleared-563109dd5013b 265/368
Command Reference – Analysis Commands
259
DEFINE
Description
This command creates a new variable.Syntax
DEFINE <variable> (<scope>) (<type indicator>)
<variable> represents the name of the variable to be created.
<scope> is the level of visibility and availability of the new variable and mustbe one of the reserved words STANDARD, GLOBAL, or PERMANENT. If omitted, STANDARD is assumed and a type indicator may not be used.
<type indicator> is required and cannot be used if <scope> is omitted. <type
indicator> is the data type of the new variable and must be one of thefollowing reserved words: NUMERIC, TEXTINPUT, YN, or DATEFORMAT.If omitted, the variable type will be inferred based on the data type of thefirst value assigned to the variable. However, omitting field type is notrecommended. Once field type is defined, the variable type cannot bechanged. An error will occur if you attempt to assign data of a different typeto the variable.
Comments
A custom variable defined in Epi Info 7 might not have a predefined data type if the<type indicator> is omitted when the variable is defined. If the variable does not
have a predefined type and has not been used, the variable will accept a value in anyof the four data types (Text, Number, Date, Yes/No [Boolean]) that is assigned to thevariable the first time. Thereafter, the variable takes on the data type of the valueassigned and it‟s data type cannot be changed. However, omitting field type is notrecommended. An error will occur if you attempt to assign data of a different datatype. Various functions can be used to manipulate data, changing data type of valuesto match the data type of the variable. Some of these functions include FORMAT,TXTTONUM, TXTTODATE, and NUMTODATE.
Variable Scope
STANDARD variables retain their value only within the current record and
are reset when a new record is loaded. Standard variables are usedtemporarily behaving like other fields in the database. In Classic Analysis,Standard variables lose their values and definitions with each READstatement.
7/14/2019 Epi Info 7 User Guide-V1.0 Cleared
http://slidepdf.com/reader/full/epi-info-7-user-guide-v10-cleared-563109dd5013b 266/368
Epi Info 7 User Guide
260
GLOBAL variables retain values across related forms and when the programopens a new form, but are removed when the Classic Analysis program isclosed. Global variables persist during program execution. Global variablesare also used to store values between changes of data source (e.g., when theREAD command is used). Global variables in Classic Analysis may notdepend directly or indirectly on table fields.
PERMANENT variables are stored in the EpiInfo.Config.xml file and retainany value assigned until the value is changed by another assignment or thevariable is undefined. Permanent variables are shared among Epi Info 7programs (i.e., Menu, Enter, Classic Analysis, etc.) and persist even if thecomputer shuts down. Permanent variables in Classic Analysis may not havevalues that depend directly or indirectly on table fields. A <prompt/description> created for a permanent variable will exist for onesession and must be re-established each time it is used.
Type Indicators
TEXTINPUT - Variables of this data type can receive any alpha-numericcharacters including symbols and the output of functions (e.g., FORMAT).
NUMERIC - Variables of this data type can receive numbers and the outputof functions (e.g., TXTTONUM).
DATEFORMAT - Variables of this data type can receive date valuesincluding the output of functions (e.g., TXTTODATE and NUMTODATE).
YN - Variables of this data type can receive the Boolean values of (+) for Yesand (-) for No. Until an assignment is made, YN type variable values are (.) ormissing.
Example
READ {C:\My_Project_Folder \Sample\Sample.prj}:Surveillance
DEFINE Birthday DATEFORMATASSIGN Birthday = 01/01/2006DEFINE HospitalCode NUMERICASSIGN HospitalCode = 854DEFINE Smoke YNASSIGN Smoke = (+)LIST Birthday HospitalCode Smoke
7/14/2019 Epi Info 7 User Guide-V1.0 Cleared
http://slidepdf.com/reader/full/epi-info-7-user-guide-v10-cleared-563109dd5013b 267/368
Command Reference – Analysis Commands
261
DEFINE DLLOBJECT
Description
This command allows you to create an ActiveX (dynamic link library or executable)object.
Syntax
DLL File
DEFINE <variable> DLLOBJECT "<ActiveX name>.<class>"
WSC File
DEFINE <variable> DLLOBJECT "<filename>"
The <variable> represents the name of the variable to be created.
The <ActiveX name> represents the internal name of the ActiveX object thatcontains the class object for DLL files.
The <class> represents a class name defined within the DLL.
The <filename> represents the name of the WSC file where the scriptcomponent resides.
Comments
The ActiveX name may not be the same as the actual name of the dll (dynamic linklibrary) or executable. When an ActiveX object is developed, it is given a projectname. This name is required to create the object. The ActiveX object (executable ordll) must be registered before it can be used. Windows Scripting Component (WSC)objects can also be used.
Example
DEFINE Week DLLOBJECT "EIEpiwk.Epiweek"
7/14/2019 Epi Info 7 User Guide-V1.0 Cleared
http://slidepdf.com/reader/full/epi-info-7-user-guide-v10-cleared-563109dd5013b 268/368
Epi Info 7 User Guide
262
Define Group Command (Analysis Reference)
Description
This command allows you to create temporary group variablesSyntax
DEFINE <variable> GROUPVAR <variable 1> [<variable 1> ...]
<variable> represents the new group variable being defined.
<variable 1> ... represent the existing variables to which the new groupvariable will be equivalent.
Program Specific Feature
Field variables, not defined variables must be in the group. Variables in the groupmay be from different pages of the same or different forms, in any combination. Theymay themselves be group variables, but each variable will be represented in the newgroup only once no matter how many times it appears in the variable list or in groupvariables in the variable list.
If the group variable being defined exists and is not a group variable, an errormessage is displayed and the command is not processed. If it is a group variable, thenew variable list replaces the existing variable list until the next READ or MERGEcommand or until it is redefined again. Group variables cannot be undefined.
Comments
This command is useful when there are many variables so that the use of * isimpractical or invalid. Group variables can be used in the LIST and WRITEcommands and in some statistical commands (e.g., FREQ, TABLES, and MEANS).Group variables cannot be used in Complex Sample commands.
Example
READ {C:\My_Project_Folder \Sample\Sample.prj}:Oswego
DEFINE Exposure GROUPVAR JELLO CAKES VANILLA CHOCOLATELIST Exposure
7/14/2019 Epi Info 7 User Guide-V1.0 Cleared
http://slidepdf.com/reader/full/epi-info-7-user-guide-v10-cleared-563109dd5013b 269/368
Command Reference – Analysis Commands
263
DELETE FILE/TABLES
Description
This command deletes files, tables, and forms.Syntax
DELETE filename | wildcard {RUNSILENT}DELETE TABLES tablename | filename:tablename {RUNSILENT | SAVEDATA}
Comments
Delete file specifies explicitly or implicitly (via wildcards) files to be deleted. If nofiles are specified, or if some of the specified files cannot be deleted, a message isproduced unless RUNSILENT is specified. Wildcards are not permitted in the suffix.
Delete table specifies a table to be deleted. If the table does not exist or cannot be
deleted, a message is produced unless RUNSILENT is specified. UnlessRUNSILENT is specified, a confirmatory message is displayed prior to deletion.
To delete tables with spaces in their names, specify both the file and the table evenif the table is in the current project. The table must be enclosed in single quotes. Youcan read a table with a space in its name, delete it, causing errors duringsubsequent procedures. To delete a table with space in its name, specify thedatabase even if the table is in the current database.
DELETE TABLES will not delete, and produce a message if any of the specifiedtables are data, grid, or program. Code tables are deleted only if they are notreferenced by any view.
SAVEDATA does not delete the data tables, but removes the RECStatus propertyfrom the table.
Space is not reclaimed until the Compact utility is run.
Analysis will not delete the current project MDB or any table in use by the currentform.
Example
DELETE TABLES Backup2005
7/14/2019 Epi Info 7 User Guide-V1.0 Cleared
http://slidepdf.com/reader/full/epi-info-7-user-guide-v10-cleared-563109dd5013b 270/368
Epi Info 7 User Guide
264
DELETE RECORDS
Description
This command deletes selected records.Syntax
DELETE * {PERMANENT | RUNSILENT}DELETE expression {PERMANENT | RUNSILENT}
Comments
All records in the current selection are set to deleted status, or if PERMANENT isspecified, physically deleted. A confirmation message is displayed unlessRUNSILENT is selected. This applies to Access tables and may not be used whenusing related tables. Use Epi Info 3.5.3 Compact Database utility to reclaim spaceafter deleting tables.
Examples
Example 1: The code below will permanently erase all records in the current datasource where the AgeInDays variable contains a value greater than five. Permanentdeletions cannot be undone.
DELETE AgeInDays > 5 PERMANENT
Example 2: The code below will mark all records in an Epi Info 7 database fordeletion. The UNDELETE Command can restore records that have been marked fordeletion.
DELETE *
7/14/2019 Epi Info 7 User Guide-V1.0 Cleared
http://slidepdf.com/reader/full/epi-info-7-user-guide-v10-cleared-563109dd5013b 271/368
Command Reference – Analysis Commands
265
DIALOG
How to Use the DIALOG Command
DescriptionThis command provides interaction with the user from within a program. Dialogscan display information, ask for and receive input, and offer lists for making choices.
Syntax
Simple Form
DIALOG "<prompt>" {TITLETEXT="<title>"}
<prompt> represents the text to be displayed as message.
<title> represents the text to be used as the caption for the dialog window. If <title> is omitted in the Dialog command, "Analysis" will be displayed on thedialog box's title bar.
Get Variable Form
DIALOG "<prompt>" <variable> <entry type> {TITLETEXT="<title>"}DIALOG "<prompt>" <variable> "<value 1>", "<value 2>", "<value 3>", … ,"<valuen>" {TITLETEXT="<title>"}DIALOG "<file type selection>" <variable> READ {TITLETEXT="<title>"}DIALOG "<file type selection>" <variable> WRITE {TITLETEXT="<title>"}
<variable> represents the variable to store value entered.
<entry type> represents a reserved word and/or mask that defines the type of input to be accepted and stored in the variable. The following are valid entrytypes:
TEXTINPUT specifies the input as text.
YN specifies the input as Boolean.
DATEFORMAT ("<date mask>") specifies the input as a date; if a datemask is not specified, the system short date is used.
"<numeric mask>" specifies the input as numeric. This option is
identified as "Number Only". The numeric mask should be a textstring (e.g., "####" or "##. ###") that indicates the type of data to beentered. # indicates a digit.
If no <entry type> is specified, the input variable is interpreted as anumber if possible. If the value is not a valid number, but is a validdate, it is interpreted as a date. Otherwise, an error occurs.
7/14/2019 Epi Info 7 User Guide-V1.0 Cleared
http://slidepdf.com/reader/full/epi-info-7-user-guide-v10-cleared-563109dd5013b 272/368
Epi Info 7 User Guide
266
<value> represents a value in a drop-down list of choices. Each valueincluded in the command will be shown as a single item in the list.
<file type selection> controls the type of files that are displayed for selection.It consists of alternating description and filter elements separated by verticalbars. The description is displayed for you to select. The corresponding filter
element selects the files. If this element is left blank, all files can be selected.Syntax is created using the File Open and File Save options from the DialogFormat drop down menu.
List of Values Form
DIALOG "<prompt>" <variable> [<list type>] {TITLETEXT="<title>"}DIALOG "<prompt>" <variable> DBVALUES <table name> {TITLETEXT="<title>"}
The [<list type>] are DATABASES and DBVIEWS
Comments
The Simple form of DIALOG places a dialog box on the screen, using the textprovided, with an OK button.
The Get Variable form of DIALOG displays the text prompt and provides a meansfor entering a value.
If YN is specified, "Yes," "No" and "Cancel" buttons are presented and thespecified variable is set to (+), (-), or (.).
If TEXTINPUT or no entry type is specified, an entry field for user responseis provided with OK and Cancel buttons. The variable is assigned the value of the input with a missing value if Cancel is chosen.
The Get Variable form of the DIALOG command can also display a fileselection dialog. If READ is used, only existing files are displayed. If WRITEis used and an existing file is selected, you will see the Overwrite? prompt.
The Multiple Choice form of DIALOG displays the text prompt and provides acombo box for selecting among the values with OK and Cancel buttons. Thevariable is assigned the value of the input with a missing value if Cancel ischosen. Variable will text type.
The Date form of the DIALOG command uses a special control for acceptinginput. Each section of the date (year, month, and day) can be increased or
decreased independently using the drop down calendar. Using this control, itis impossible to select an invalid date.
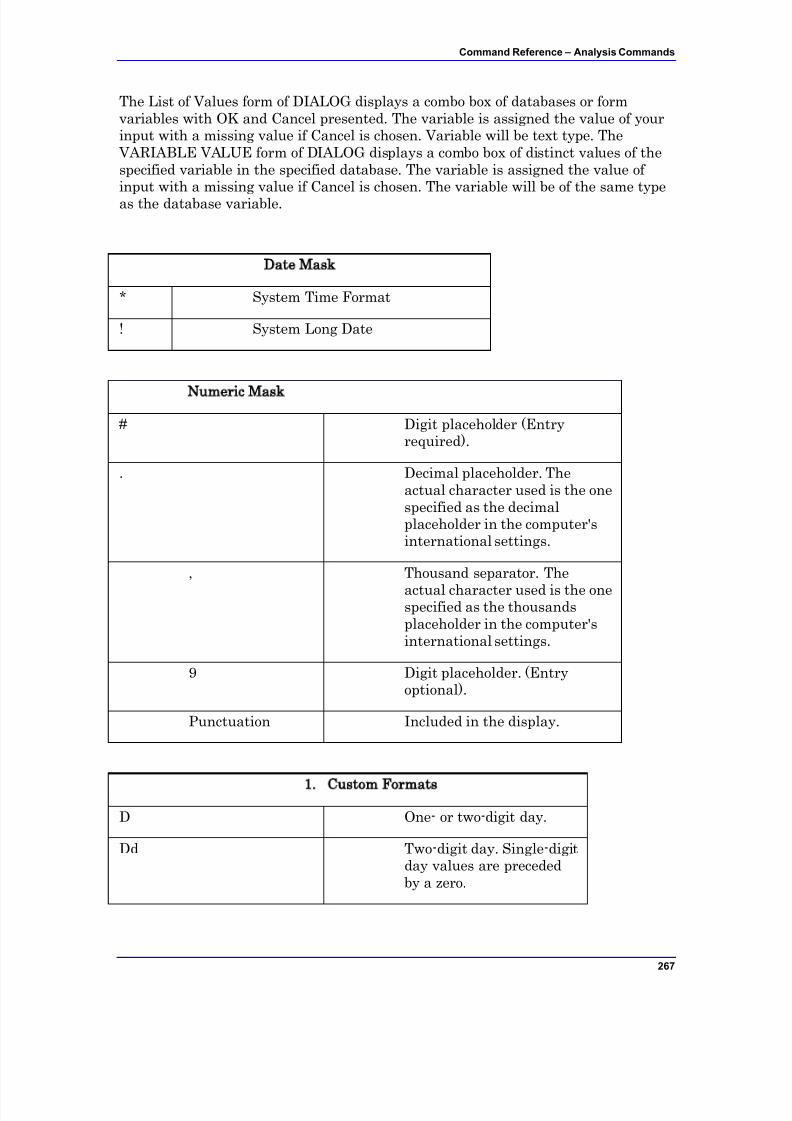
7/14/2019 Epi Info 7 User Guide-V1.0 Cleared
http://slidepdf.com/reader/full/epi-info-7-user-guide-v10-cleared-563109dd5013b 273/368
Command Reference – Analysis Commands
267
The List of Values form of DIALOG displays a combo box of databases or formvariables with OK and Cancel presented. The variable is assigned the value of yourinput with a missing value if Cancel is chosen. Variable will be text type. The
VARIABLE VALUE form of DIALOG displays a combo box of distinct values of thespecified variable in the specified database. The variable is assigned the value of input with a missing value if Cancel is chosen. The variable will be of the same typeas the database variable.
Date Mask
* System Time Format
! System Long Date
Numeric Mask
# Digit placeholder (Entryrequired).
. Decimal placeholder. Theactual character used is the onespecified as the decimalplaceholder in the computer'sinternational settings.
, Thousand separator. The
actual character used is the onespecified as the thousandsplaceholder in the computer'sinternational settings.
9 Digit placeholder. (Entryoptional).
Punctuation Included in the display.
1. Custom Formats
D One- or two-digit day.
Dd Two-digit day. Single-digitday values are precededby a zero.
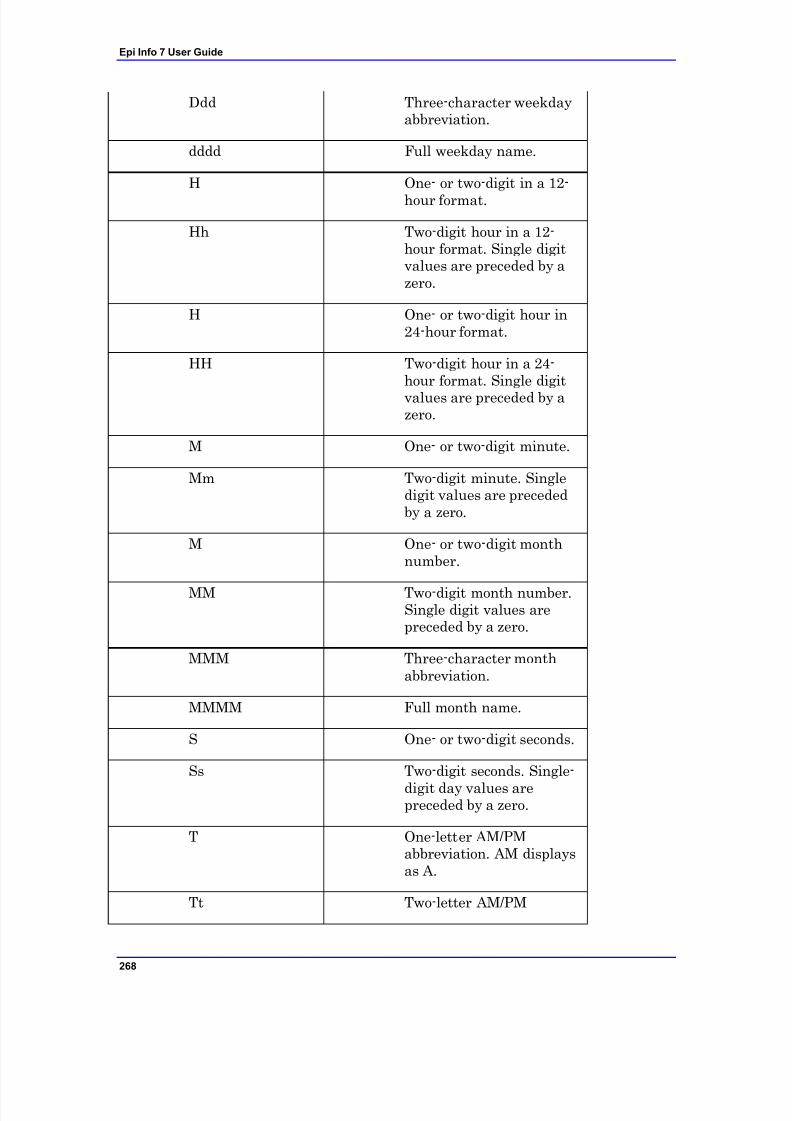
7/14/2019 Epi Info 7 User Guide-V1.0 Cleared
http://slidepdf.com/reader/full/epi-info-7-user-guide-v10-cleared-563109dd5013b 274/368
Epi Info 7 User Guide
268
Ddd Three-character weekdayabbreviation.
dddd Full weekday name.
H One- or two-digit in a 12-
hour format.
Hh Two-digit hour in a 12-hour format. Single digitvalues are preceded by azero.
H One- or two-digit hour in24-hour format.
HH Two-digit hour in a 24-hour format. Single digit
values are preceded by azero.
M One- or two-digit minute.
Mm Two-digit minute. Singledigit values are precededby a zero.
M One- or two-digit monthnumber.
MM Two-digit month number.Single digit values arepreceded by a zero.
MMM Three-character monthabbreviation.
MMMM Full month name.
S One- or two-digit seconds.
Ss Two-digit seconds. Single-
digit day values arepreceded by a zero.
T One-letter AM/PMabbreviation. AM displaysas A.
Tt Two-letter AM/PM
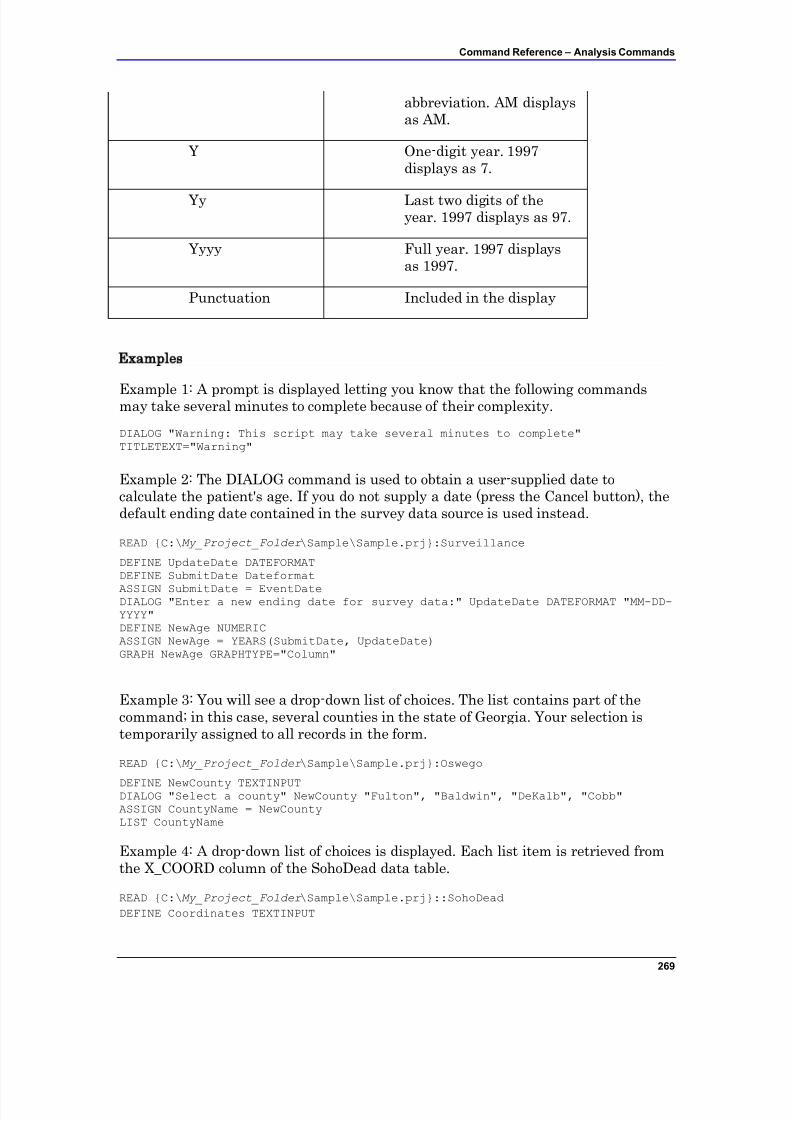
7/14/2019 Epi Info 7 User Guide-V1.0 Cleared
http://slidepdf.com/reader/full/epi-info-7-user-guide-v10-cleared-563109dd5013b 275/368
Command Reference – Analysis Commands
269
abbreviation. AM displaysas AM.
Y One-digit year. 1997displays as 7.
Yy Last two digits of theyear. 1997 displays as 97.
Yyyy Full year. 1997 displaysas 1997.
Punctuation Included in the display
Examples
Example 1: A prompt is displayed letting you know that the following commandsmay take several minutes to complete because of their complexity.
DIALOG "Warning: This script may take several minutes to complete"TITLETEXT="Warning"
Example 2: The DIALOG command is used to obtain a user-supplied date tocalculate the patient's age. If you do not supply a date (press the Cancel button), thedefault ending date contained in the survey data source is used instead.
READ {C:\My_Project_Folder \Sample\Sample.prj}:Surveillance
DEFINE UpdateDate DATEFORMATDEFINE SubmitDate Dateformat
ASSIGN SubmitDate = EventDateDIALOG "Enter a new ending date for survey data:" UpdateDate DATEFORMAT "MM-DD-YYYY"DEFINE NewAge NUMERICASSIGN NewAge = YEARS(SubmitDate, UpdateDate)GRAPH NewAge GRAPHTYPE="Column"
Example 3: You will see a drop-down list of choices. The list contains part of thecommand; in this case, several counties in the state of Georgia. Your selection istemporarily assigned to all records in the form.
READ {C:\My_Project_Folder \Sample\Sample.prj}:Oswego
DEFINE NewCounty TEXTINPUTDIALOG "Select a county" NewCounty "Fulton", "Baldwin", "DeKalb", "Cobb"ASSIGN CountyName = NewCountyLIST CountyName
Example 4: A drop-down list of choices is displayed. Each list item is retrieved fromthe X_COORD column of the SohoDead data table.
READ {C:\My_Project_Folder \Sample\Sample.prj}::SohoDead
DEFINE Coordinates TEXTINPUT
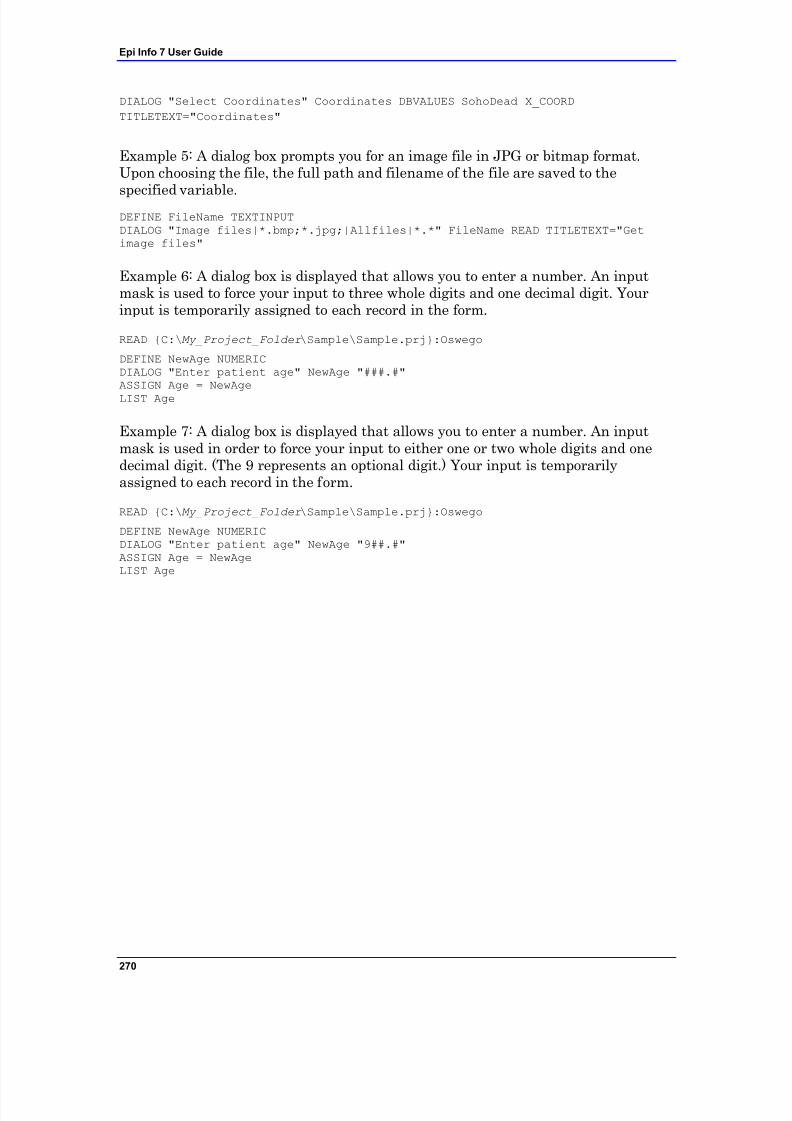
7/14/2019 Epi Info 7 User Guide-V1.0 Cleared
http://slidepdf.com/reader/full/epi-info-7-user-guide-v10-cleared-563109dd5013b 276/368
Epi Info 7 User Guide
270
DIALOG "Select Coordinates" Coordinates DBVALUES SohoDead X_COORD
TITLETEXT="Coordinates"
Example 5: A dialog box prompts you for an image file in JPG or bitmap format.Upon choosing the file, the full path and filename of the file are saved to the
specified variable.DEFINE FileName TEXTINPUTDIALOG "Image files|*.bmp;*.jpg;|Allfiles|*.*" FileName READ TITLETEXT="Getimage files"
Example 6: A dialog box is displayed that allows you to enter a number. An inputmask is used to force your input to three whole digits and one decimal digit. Yourinput is temporarily assigned to each record in the form.
READ {C:\My_Project_Folder \Sample\Sample.prj}:Oswego
DEFINE NewAge NUMERICDIALOG "Enter patient age" NewAge "###.#"ASSIGN Age = NewAgeLIST Age
Example 7: A dialog box is displayed that allows you to enter a number. An inputmask is used in order to force your input to either one or two whole digits and onedecimal digit. (The 9 represents an optional digit.) Your input is temporarilyassigned to each record in the form.
READ {C:\My_Project_Folder \Sample\Sample.prj}:Oswego
DEFINE NewAge NUMERICDIALOG "Enter patient age" NewAge "9##.#"ASSIGN Age = NewAgeLIST Age
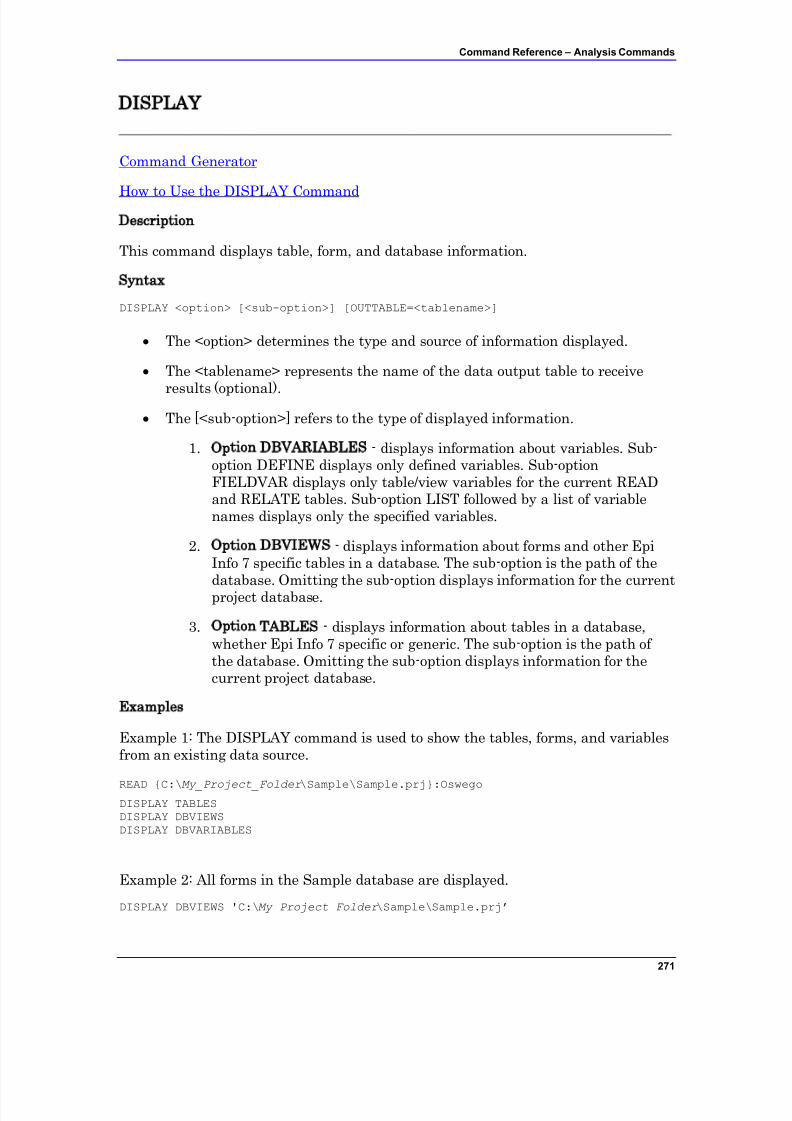
7/14/2019 Epi Info 7 User Guide-V1.0 Cleared
http://slidepdf.com/reader/full/epi-info-7-user-guide-v10-cleared-563109dd5013b 277/368
Command Reference – Analysis Commands
271
DISPLAY
Command Generator
How to Use the DISPLAY Command Description
This command displays table, form, and database information.
Syntax
DISPLAY <option> [<sub-option>] [OUTTABLE=<tablename>]
The <option> determines the type and source of information displayed.
The <tablename> represents the name of the data output table to receive
results (optional). The [<sub-option>] refers to the type of displayed information.
1. Option DBVARIABLES - displays information about variables. Sub-option DEFINE displays only defined variables. Sub-optionFIELDVAR displays only table/view variables for the current READand RELATE tables. Sub-option LIST followed by a list of variablenames displays only the specified variables.
2. Option DBVIEWS - displays information about forms and other EpiInfo 7 specific tables in a database. The sub-option is the path of thedatabase. Omitting the sub-option displays information for the currentproject database.
3. Option TABLES - displays information about tables in a database,whether Epi Info 7 specific or generic. The sub-option is the path of the database. Omitting the sub-option displays information for thecurrent project database.
Examples
Example 1: The DISPLAY command is used to show the tables, forms, and variablesfrom an existing data source.
READ {C:\My_Project_Folder \Sample\Sample.prj}:OswegoDISPLAY TABLESDISPLAY DBVIEWSDISPLAY DBVARIABLES
Example 2: All forms in the Sample database are displayed.
DISPLAY DBVIEWS 'C:\My_Project_Folder \Sample\Sample.prj’

7/14/2019 Epi Info 7 User Guide-V1.0 Cleared
http://slidepdf.com/reader/full/epi-info-7-user-guide-v10-cleared-563109dd5013b 278/368
Epi Info 7 User Guide
272
Example 3: All tables in the Sample database are displayed.
DISPLAY TABLES 'C:\My_Project_Folder \Sample\Sample.prj’
Example 4: All variables in Oswego are written to a new table in the Sample
database called VarInfo.
READ {C:\My_Project_Folder \Sample\Sample.prj}:Oswego
DISPLAY DBVARIABLES OUTTABLE=VarInfo
7/14/2019 Epi Info 7 User Guide-V1.0 Cleared
http://slidepdf.com/reader/full/epi-info-7-user-guide-v10-cleared-563109dd5013b 279/368
Command Reference – Analysis Commands
273
EXECUTE
Description
This command executes a Windows program; one explicitly named in the command,or one designated within the Windows registry as appropriate for a document with anamed file extension. This provides a mechanism for bringing up whatever wordprocessor or browser is the default on a computer without first knowing its name.
If the pathname is a long filename, it must be surrounded in single quotes. If thecommand takes parameters, surround the command and the parameters with asingle set of double quotes. Do not use single quotes.
Program Specific Feature
Link and Activate are not valid command names.
Syntax
EXECUTE <filename>EXECUTE "<filename> <command-line parameters>"EXECUTE NOWAITFOREXIT <filename>EXECUTE NOWAITFOREXIT '<filename>'EXECUTE NOWAITFOREXIT "<filename>"EXECUTE WAITFOREXIT <filename>EXECUTE WAITFOREXIT '<filename>'EXECUTE WAITFOREXIT "<filename>"
The <filename> represents the path and program name for .exe (filename forregistered Windows programs) and .com (filename for MS-DOS binaryexecutable) files.
The <command-line parameters> represent any additional command-linearguments that the program can accept. When used, the entire string shouldbe enclosed within double quotes.
When Wait for Command to Execute (modal) is specified, the command and Analysis should run. When Wait for Command to Execute is not specified(non-modal), Classic Analysis should wait until the executed program closesbefore continuing. When EXECUTE is run modally, permanent variables arewritten before the command is executed, and reloaded after the command isexecuted.
7/14/2019 Epi Info 7 User Guide-V1.0 Cleared
http://slidepdf.com/reader/full/epi-info-7-user-guide-v10-cleared-563109dd5013b 280/368
Epi Info 7 User Guide
274
Comments
If the name given is not a program, but a file with an extension (the three charactersafter the ".") registered by Windows for displaying the document, the correctprogram to display the file will be activated (i.e., WRITEUP.DOC might causeMicrosoft Word © to run and load the file on one computer). On another machine,
however, .DOC might correspond to Corel WordPerfect©. Usually .TXT will runNOTEPAD.EXE© or WORDPAD.EXE©, and image files will appear in a browser orin a graphics program. An .HTM file will bring up the default browser.
Examples
Example 1: The EXECUTE command is used to start the Enter module. Thecommand-line parameter is used to load the Oswego Form from the Sampledatabase.
EXECUTE "C:\Epi Info 7\Epi Info 7\Enter.exe"
Example 2: The output file generated (in this case, Outbreak1.htm) is opened in thecomputer's default web browser.
READ {C:\My_Project_Folder \Sample\Sample.prj}:Oswego
ROUTEOUT “C:\Epi Info 7\Epi Info 7\Output\Outbreak1.htm' REPLACESET STATISTICS=COMPLETETABLES Vanilla Ill STRATAVAR=SexMEANS Chocolate IllCLOSEOUTEXECUTE “C:\Epi Info 7\Epi Info 7\Outbreak1.htm”
7/14/2019 Epi Info 7 User Guide-V1.0 Cleared
http://slidepdf.com/reader/full/epi-info-7-user-guide-v10-cleared-563109dd5013b 281/368
Command Reference – Analysis Commands
275
FREQ
Description
FREQ produces a table from the table(s) specified in the last READ statement,showing how many records have each value of the variable. Exact Confidence limitsfor each proportion are included.
Syntax
FREQ [<variable(s)>] {<settings>}
FREQ * {EXCEPT [<variable(s)>]} {<settings>}
<variable(s)> represents one or more variable names. Group variables may beused.
<settings> represent clauses from the SET command indicating a value of asetting (except PROCESS and HYPERLINKS) which will be used for theduration of the statistical command only.
Comments
Records may be included or excluded from the count by using SELECT statements.Those marked as deleted in Enter will be handled according to the current settingfor SET PROCESS. If more than one variable name is given, FREQ makes aseparate table for each variable. Confidence limits for the binomial proportions areproduced.
If a WEIGHTVAR is specified, the value of the WEIGHTVAR variable is treated as a
count of instances of the variable being computed in the frequency (i.e., in thefollowing command a record containing the value 30 for AGE and 15 for COUNTwould give a result equivalent to 15 individuals of age 30).
FREQ AGE WEIGHTVAR = COUNT
If STRATUM is specified, a separate frequency is produced for each stratifyingvariable value.
FREQ ILL STRATAVAR=SEX, produces a table showing ILL (Yes/No/Unknown) formales and another for females. The same numbers can be obtained using TABLESILL SEX, but the latter produces results in one table rather than in separate tables,
and produces statistics to test for an association between ILL and SEX.
FREQ * makes a table for each variable in the current form other than uniqueidentifiers. It is often used to begin analyses of a new data set.
To do frequencies of all variables except a few, use FREQ * EXCEPT VarName(s)followed by the names of the variables to be excluded.
7/14/2019 Epi Info 7 User Guide-V1.0 Cleared
http://slidepdf.com/reader/full/epi-info-7-user-guide-v10-cleared-563109dd5013b 282/368
Epi Info 7 User Guide
276
Multiline (memo) variables cannot be used in Frequencies. To use a Multilinevariable, define a new variable and assign to it the value SUBSTRING(<oldvariable>,1,255) and use it in the frequency.
Examples
Example 1: The number of ill and healthy people are displayed along with theirpercentages and the total.
READ {C:\My_Project_Folder\Sample\Sample.prj}:OswegoFREQ Ill
Example 2: In this case, the variable 'Desserts' is a group variable containing the Yes/No variables Chocolate, Vanilla, and Cakes. Running a frequency on a groupvariable automatically runs a frequency on every variable contained in the group.
READ {C:\My_Project_Folder\Sample\Sample.prj}:OswegoFREQ Desserts
Example 3: A frequency on two variables is produced. In this case, BakedHam andMilk.
READ {C:\My_Project_Folder\Sample\Sample.prj}:OswegoFREQ BakedHam Milk
Example 4: A frequency on every variable in the current data source is produced.
READ {C:\My_Project_Folder\Sample\Sample.prj}:OswegoFREQ *
Example 5: A frequency on every variable in the current data source (except Age,Code_RW, DateOnset, Name and TimeSupper) is produced.
READ {C:\My_Project_Folder\Sample\Sample.prj}:OswegoFREQ * EXCEPT Age Code_RW DateOnset Name TimeSupper
Example 6: A frequency of ill people is produced, stratified by sex. Using thestratification option will produce two frequencies. In this case, males and females.
READ {C:\My_Project_Folder\Sample\Sample.prj}:OswegoFREQ Ill STRATAVAR=Sex
Example 7: A weighted frequency is conducted. For each record, the value stored inCount is used to represent that record's weight.
READ {C:\My_Project_Folder\Sample\Sample.prj}:LasumFREQ Outcome WEIGHTVAR=Count
Example 8: A complex sample frequency is run using the Epi1 data set.
READ {C:\My_Project_Folder\Sample\Sample.prj}:Epi1SET STATISTICS=COMPLETEFREQ VAC PSUVAR=Cluster
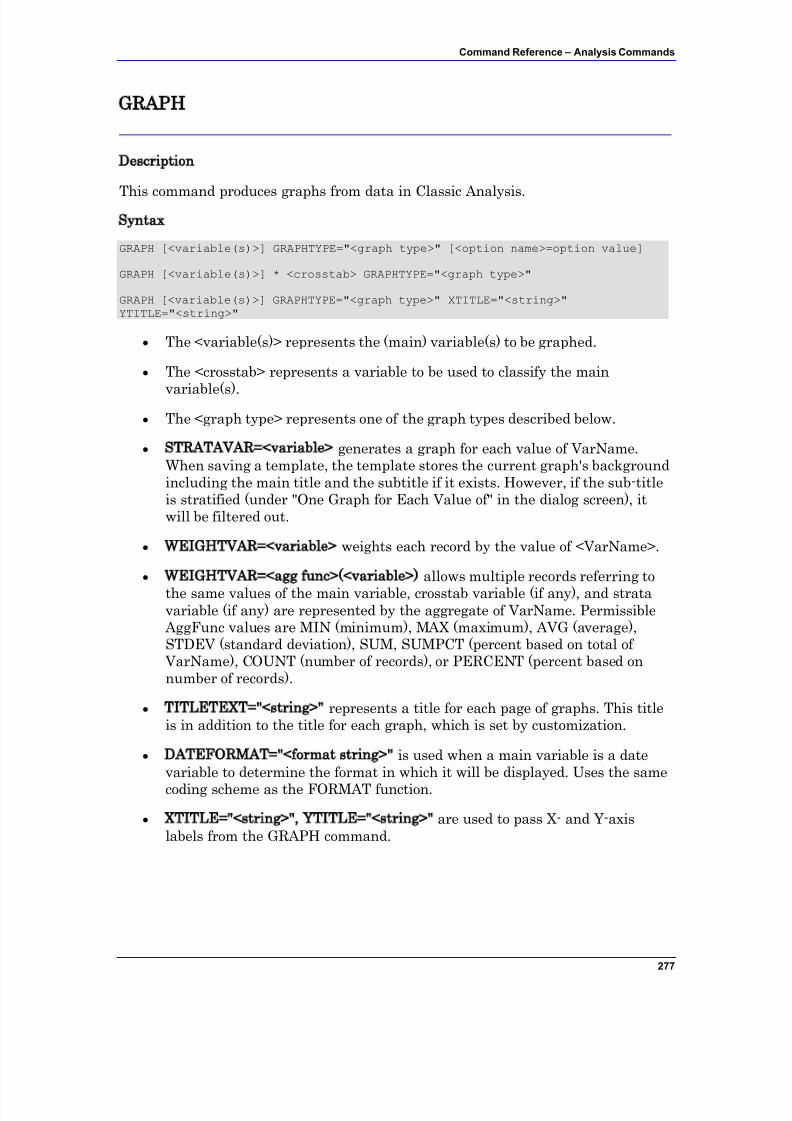
7/14/2019 Epi Info 7 User Guide-V1.0 Cleared
http://slidepdf.com/reader/full/epi-info-7-user-guide-v10-cleared-563109dd5013b 283/368
Command Reference – Analysis Commands
277
GRAPH
Description
This command produces graphs from data in Classic Analysis.Syntax
GRAPH [<variable(s)>] GRAPHTYPE="<graph type>" [<option name>=option value]
GRAPH [<variable(s)>] * <crosstab> GRAPHTYPE="<graph type>"
GRAPH [<variable(s)>] GRAPHTYPE="<graph type>" XTITLE="<string>"YTITLE="<string>"
The <variable(s)> represents the (main) variable(s) to be graphed.
The <crosstab> represents a variable to be used to classify the main
variable(s). The <graph type> represents one of the graph types described below.
STRATAVAR=<variable> generates a graph for each value of VarName.When saving a template, the template stores the current graph's backgroundincluding the main title and the subtitle if it exists. However, if the sub-titleis stratified (under "One Graph for Each Value of" in the dialog screen), itwill be filtered out.
WEIGHTVAR=<variable> weights each record by the value of <VarName>.
WEIGHTVAR=<agg func>(<variable>) allows multiple records referring to
the same values of the main variable, crosstab variable (if any), and stratavariable (if any) are represented by the aggregate of VarName. Permissible
AggFunc values are MIN (minimum), MAX (maximum), AVG (average),STDEV (standard deviation), SUM, SUMPCT (percent based on total of
VarName), COUNT (number of records), or PERCENT (percent based onnumber of records).
TITLETEXT="<string>" represents a title for each page of graphs. This titleis in addition to the title for each graph, which is set by customization.
DATEFORMAT="<format string>" is used when a main variable is a datevariable to determine the format in which it will be displayed. Uses the same
coding scheme as the FORMAT function.
XTITLE="<string>", YTITLE="<string>" are used to pass X- and Y-axislabels from the GRAPH command.
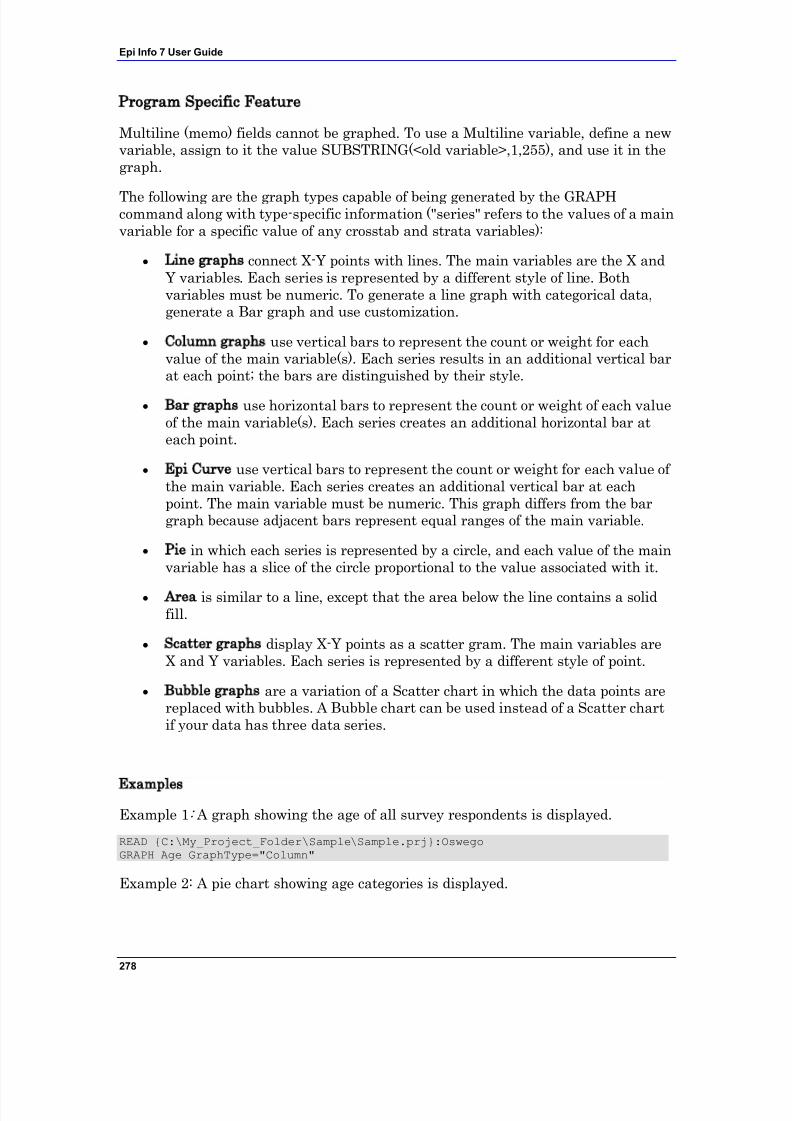
7/14/2019 Epi Info 7 User Guide-V1.0 Cleared
http://slidepdf.com/reader/full/epi-info-7-user-guide-v10-cleared-563109dd5013b 284/368
Epi Info 7 User Guide
278
Program Specific Feature
Multiline (memo) fields cannot be graphed. To use a Multiline variable, define a newvariable, assign to it the value SUBSTRING(<old variable>,1,255), and use it in thegraph.
The following are the graph types capable of being generated by the GRAPHcommand along with type-specific information ("series" refers to the values of a mainvariable for a specific value of any crosstab and strata variables):
Line graphs connect X-Y points with lines. The main variables are the X and Y variables. Each series is represented by a different style of line. Bothvariables must be numeric. To generate a line graph with categorical data,generate a Bar graph and use customization.
Column graphs use vertical bars to represent the count or weight for eachvalue of the main variable(s). Each series results in an additional vertical barat each point; the bars are distinguished by their style.
Bar graphs use horizontal bars to represent the count or weight of each valueof the main variable(s). Each series creates an additional horizontal bar ateach point.
Epi Curve use vertical bars to represent the count or weight for each value of the main variable. Each series creates an additional vertical bar at eachpoint. The main variable must be numeric. This graph differs from the bargraph because adjacent bars represent equal ranges of the main variable.
Pie in which each series is represented by a circle, and each value of the mainvariable has a slice of the circle proportional to the value associated with it.
Area is similar to a line, except that the area below the line contains a solidfill.
Scatter graphs display X-Y points as a scatter gram. The main variables areX and Y variables. Each series is represented by a different style of point.
Bubble graphs are a variation of a Scatter chart in which the data points arereplaced with bubbles. A Bubble chart can be used instead of a Scatter chartif your data has three data series.
Examples
Example 1: A graph showing the age of all survey respondents is displayed.
READ {C:\My_Project_Folder\Sample\Sample.prj}:OswegoGRAPH Age GraphType="Column"
Example 2: A pie chart showing age categories is displayed.
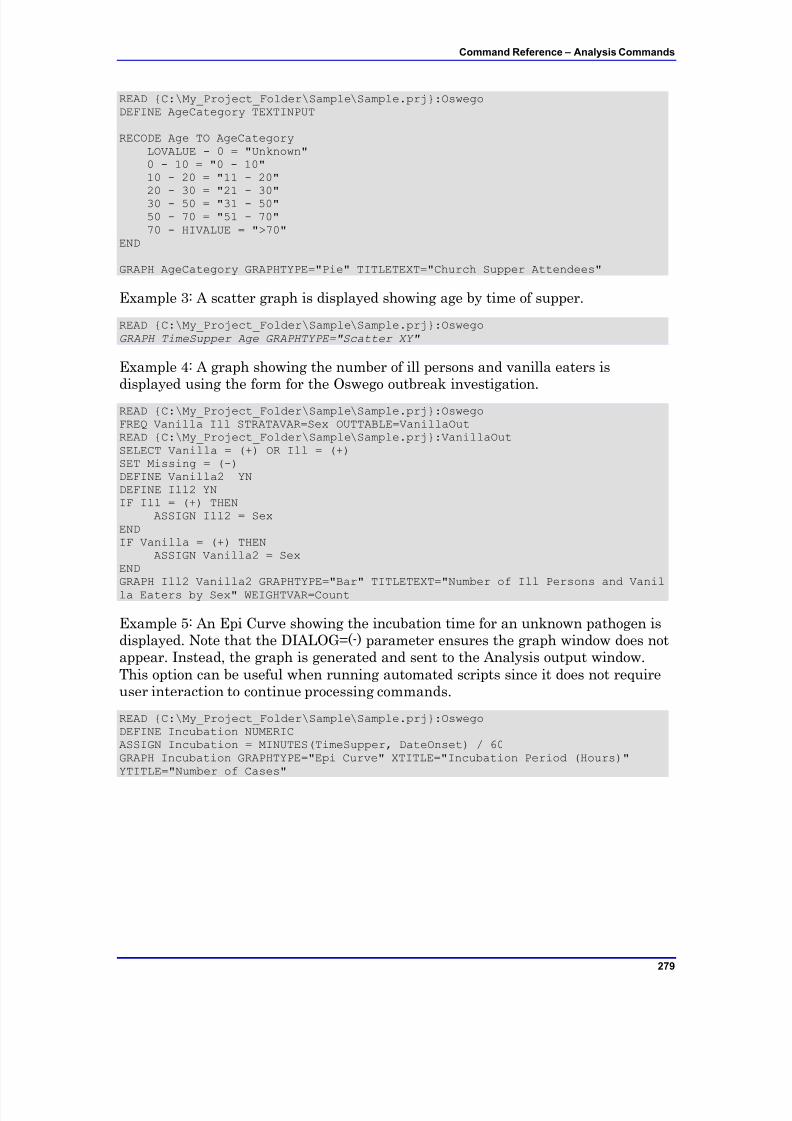
7/14/2019 Epi Info 7 User Guide-V1.0 Cleared
http://slidepdf.com/reader/full/epi-info-7-user-guide-v10-cleared-563109dd5013b 285/368
Command Reference – Analysis Commands
279
READ {C:\My_Project_Folder\Sample\Sample.prj}:OswegoDEFINE AgeCategory TEXTINPUT
RECODE Age TO AgeCategoryLOVALUE - 0 = "Unknown"0 - 10 = "0 - 10"10 - 20 = "11 - 20"
20 - 30 = "21 - 30"30 - 50 = "31 - 50"50 - 70 = "51 - 70"70 - HIVALUE = ">70"
END
GRAPH AgeCategory GRAPHTYPE="Pie" TITLETEXT="Church Supper Attendees"
Example 3: A scatter graph is displayed showing age by time of supper.
READ {C:\My_Project_Folder\Sample\Sample.prj}:OswegoGRAPH TimeSupper Age GRAPHTYPE="Scatter XY"
Example 4: A graph showing the number of ill persons and vanilla eaters isdisplayed using the form for the Oswego outbreak investigation.
READ {C:\My_Project_Folder\Sample\Sample.prj}:OswegoFREQ Vanilla Ill STRATAVAR=Sex OUTTABLE=VanillaOutREAD {C:\My_Project_Folder\Sample\Sample.prj}:VanillaOutSELECT Vanilla = (+) OR Ill = (+)SET Missing = (-)DEFINE Vanilla2 YNDEFINE Ill2 YNIF Ill = (+) THEN
ASSIGN Ill2 = SexENDIF Vanilla = (+) THEN
ASSIGN Vanilla2 = SexENDGRAPH Ill2 Vanilla2 GRAPHTYPE="Bar" TITLETEXT="Number of Ill Persons and Vanilla Eaters by Sex" WEIGHTVAR=Count
Example 5: An Epi Curve showing the incubation time for an unknown pathogen isdisplayed. Note that the DIALOG=(-) parameter ensures the graph window does notappear. Instead, the graph is generated and sent to the Analysis output window.This option can be useful when running automated scripts since it does not requireuser interaction to continue processing commands.
READ {C:\My_Project_Folder\Sample\Sample.prj}:OswegoDEFINE Incubation NUMERICASSIGN Incubation = MINUTES(TimeSupper, DateOnset) / 60GRAPH Incubation GRAPHTYPE="Epi Curve" XTITLE="Incubation Period (Hours)"YTITLE="Number of Cases"
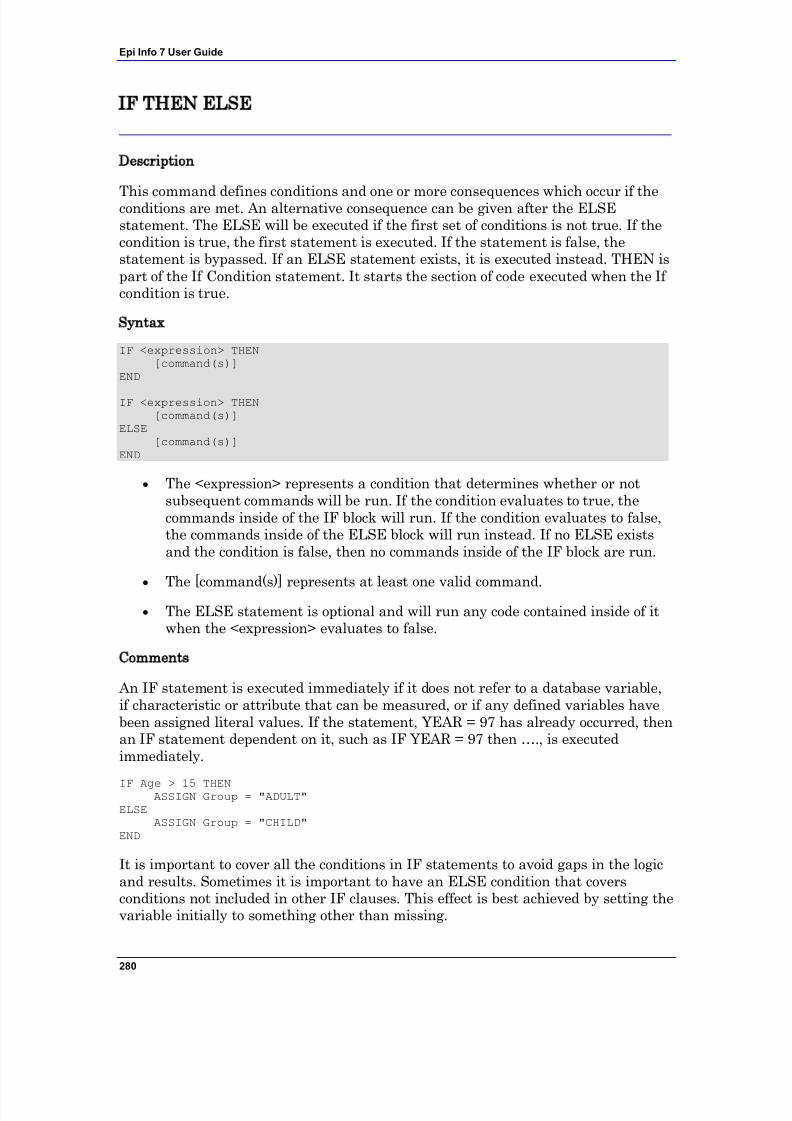
7/14/2019 Epi Info 7 User Guide-V1.0 Cleared
http://slidepdf.com/reader/full/epi-info-7-user-guide-v10-cleared-563109dd5013b 286/368
Epi Info 7 User Guide
280
IF THEN ELSE
Description
This command defines conditions and one or more consequences which occur if theconditions are met. An alternative consequence can be given after the ELSEstatement. The ELSE will be executed if the first set of conditions is not true. If thecondition is true, the first statement is executed. If the statement is false, thestatement is bypassed. If an ELSE statement exists, it is executed instead. THEN ispart of the If Condition statement. It starts the section of code executed when the If condition is true.
Syntax
IF <expression> THEN[command(s)]
END
IF <expression> THEN[command(s)]
ELSE[command(s)]
END
The <expression> represents a condition that determines whether or notsubsequent commands will be run. If the condition evaluates to true, thecommands inside of the IF block will run. If the condition evaluates to false,the commands inside of the ELSE block will run instead. If no ELSE existsand the condition is false, then no commands inside of the IF block are run.
The [command(s)] represents at least one valid command.
The ELSE statement is optional and will run any code contained inside of itwhen the <expression> evaluates to false.
Comments
An IF statement is executed immediately if it does not refer to a database variable,if characteristic or attribute that can be measured, or if any defined variables havebeen assigned literal values. If the statement, YEAR = 97 has already occurred, thenan IF statement dependent on it, such as IF YEAR = 97 then …., is executedimmediately.
IF Age > 15 THENASSIGN Group = "ADULT"
ELSEASSIGN Group = "CHILD"
END
It is important to cover all the conditions in IF statements to avoid gaps in the logicand results. Sometimes it is important to have an ELSE condition that coversconditions not included in other IF clauses. This effect is best achieved by setting thevariable initially to something other than missing.
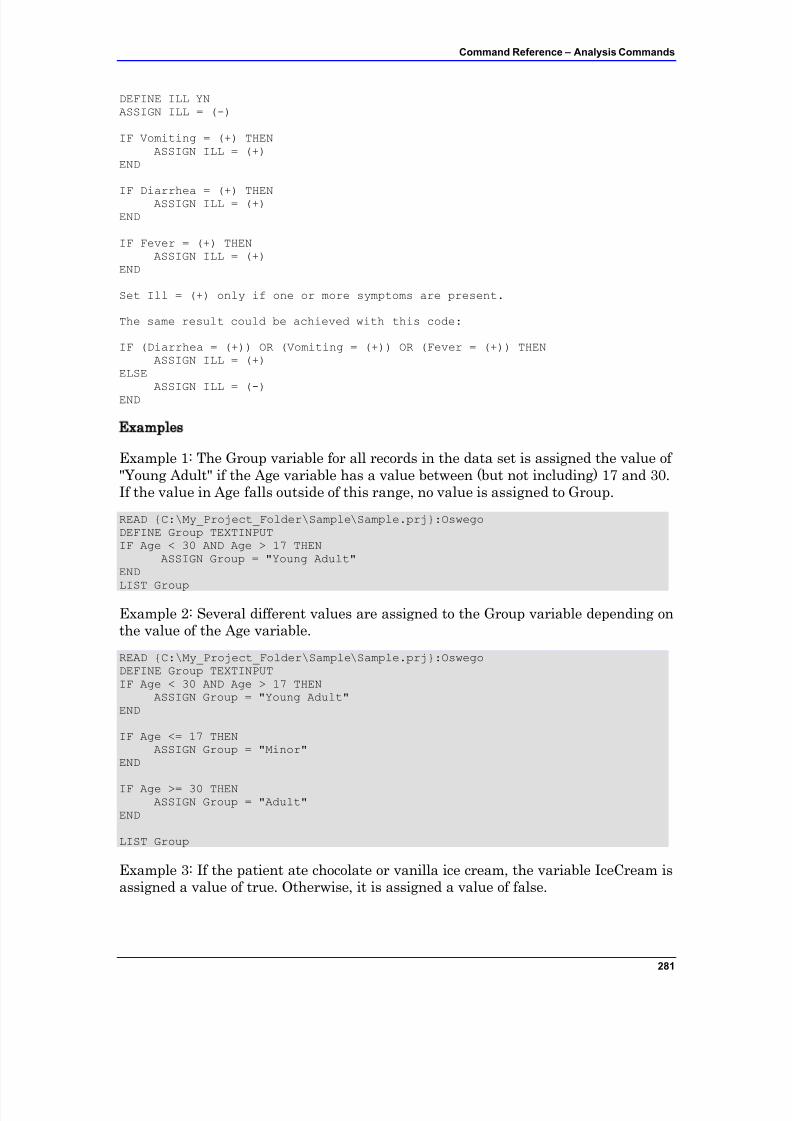
7/14/2019 Epi Info 7 User Guide-V1.0 Cleared
http://slidepdf.com/reader/full/epi-info-7-user-guide-v10-cleared-563109dd5013b 287/368
Command Reference – Analysis Commands
281
DEFINE ILL YNASSIGN ILL = (-)
IF Vomiting = (+) THENASSIGN ILL = (+)
END
IF Diarrhea = (+) THENASSIGN ILL = (+)END
IF Fever = (+) THENASSIGN ILL = (+)
END
Set Ill = (+) only if one or more symptoms are present.
The same result could be achieved with this code:
IF (Diarrhea = (+)) OR (Vomiting = (+)) OR (Fever = (+)) THENASSIGN ILL = (+)
ELSE
ASSIGN ILL = (-)END
Examples
Example 1: The Group variable for all records in the data set is assigned the value of "Young Adult" if the Age variable has a value between (but not including) 17 and 30.If the value in Age falls outside of this range, no value is assigned to Group.
READ {C:\My_Project_Folder\Sample\Sample.prj}:OswegoDEFINE Group TEXTINPUTIF Age < 30 AND Age > 17 THEN
ASSIGN Group = "Young Adult"END
LIST Group
Example 2: Several different values are assigned to the Group variable depending onthe value of the Age variable.
READ {C:\My_Project_Folder\Sample\Sample.prj}:OswegoDEFINE Group TEXTINPUTIF Age < 30 AND Age > 17 THEN
ASSIGN Group = "Young Adult"END
IF Age <= 17 THENASSIGN Group = "Minor"
END
IF Age >= 30 THENASSIGN Group = "Adult"
END
LIST Group
Example 3: If the patient ate chocolate or vanilla ice cream, the variable IceCream isassigned a value of true. Otherwise, it is assigned a value of false.
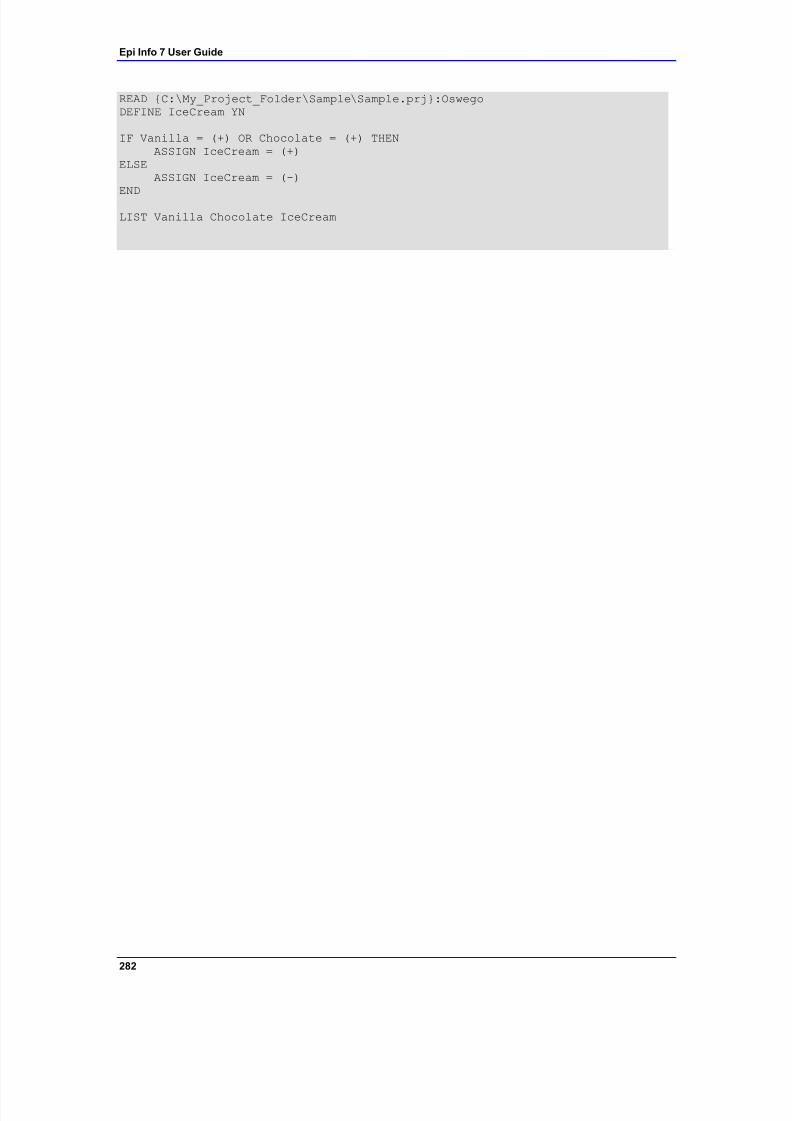
7/14/2019 Epi Info 7 User Guide-V1.0 Cleared
http://slidepdf.com/reader/full/epi-info-7-user-guide-v10-cleared-563109dd5013b 288/368
Epi Info 7 User Guide
282
READ {C:\My_Project_Folder\Sample\Sample.prj}:OswegoDEFINE IceCream YN
IF Vanilla = (+) OR Chocolate = (+) THENASSIGN IceCream = (+)
ELSEASSIGN IceCream = (-)
END
LIST Vanilla Chocolate IceCream
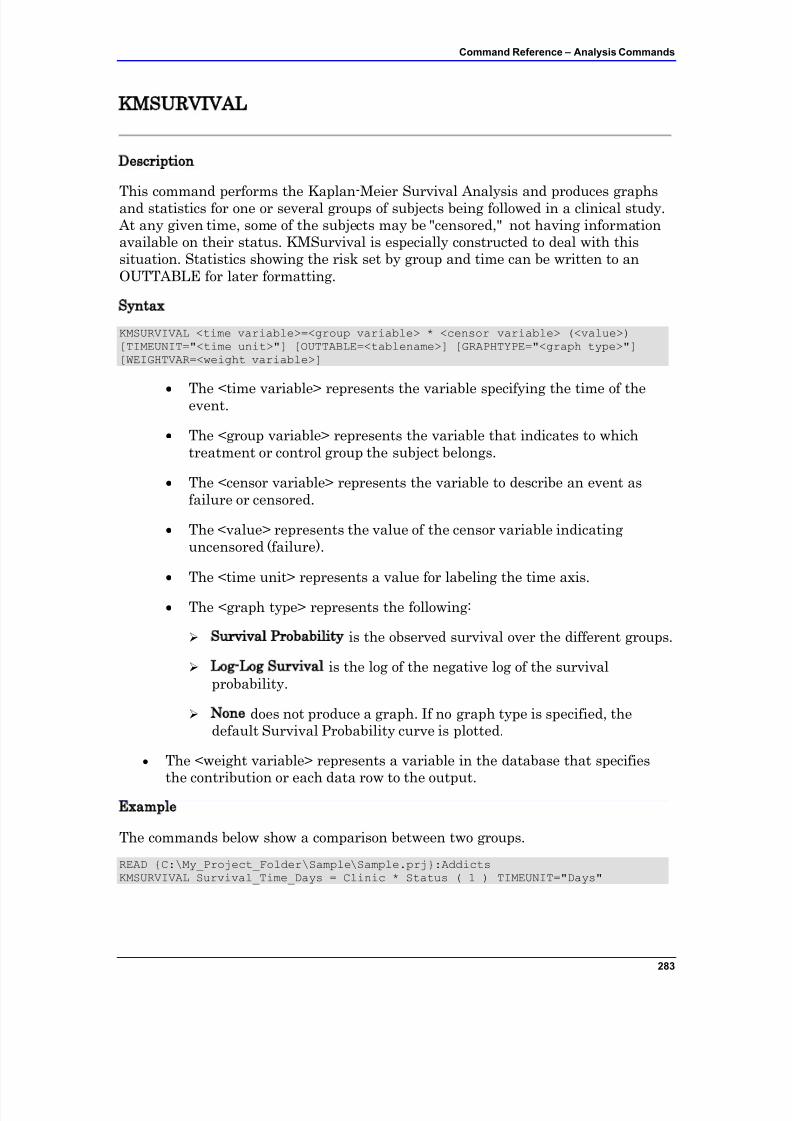
7/14/2019 Epi Info 7 User Guide-V1.0 Cleared
http://slidepdf.com/reader/full/epi-info-7-user-guide-v10-cleared-563109dd5013b 289/368
Command Reference – Analysis Commands
283
KMSURVIVAL
Description
This command performs the Kaplan-Meier Survival Analysis and produces graphsand statistics for one or several groups of subjects being followed in a clinical study. At any given time, some of the subjects may be "censored," not having informationavailable on their status. KMSurvival is especially constructed to deal with thissituation. Statistics showing the risk set by group and time can be written to anOUTTABLE for later formatting.
Syntax
KMSURVIVAL <time variable>=<group variable> * <censor variable> (<value>)[TIMEUNIT="<time unit>"] [OUTTABLE=<tablename>] [GRAPHTYPE="<graph type>"][WEIGHTVAR=<weight variable>]
The <time variable> represents the variable specifying the time of theevent.
The <group variable> represents the variable that indicates to whichtreatment or control group the subject belongs.
The <censor variable> represents the variable to describe an event asfailure or censored.
The <value> represents the value of the censor variable indicatinguncensored (failure).
The <time unit> represents a value for labeling the time axis.
The <graph type> represents the following:
Survival Probability is the observed survival over the different groups.
Log-Log Survival is the log of the negative log of the survivalprobability.
None does not produce a graph. If no graph type is specified, thedefault Survival Probability curve is plotted.
The <weight variable> represents a variable in the database that specifiesthe contribution or each data row to the output.
Example
The commands below show a comparison between two groups.
READ {C:\My_Project_Folder\Sample\Sample.prj}:AddictsKMSURVIVAL Survival_Time_Days = Clinic * Status ( 1 ) TIMEUNIT="Days"
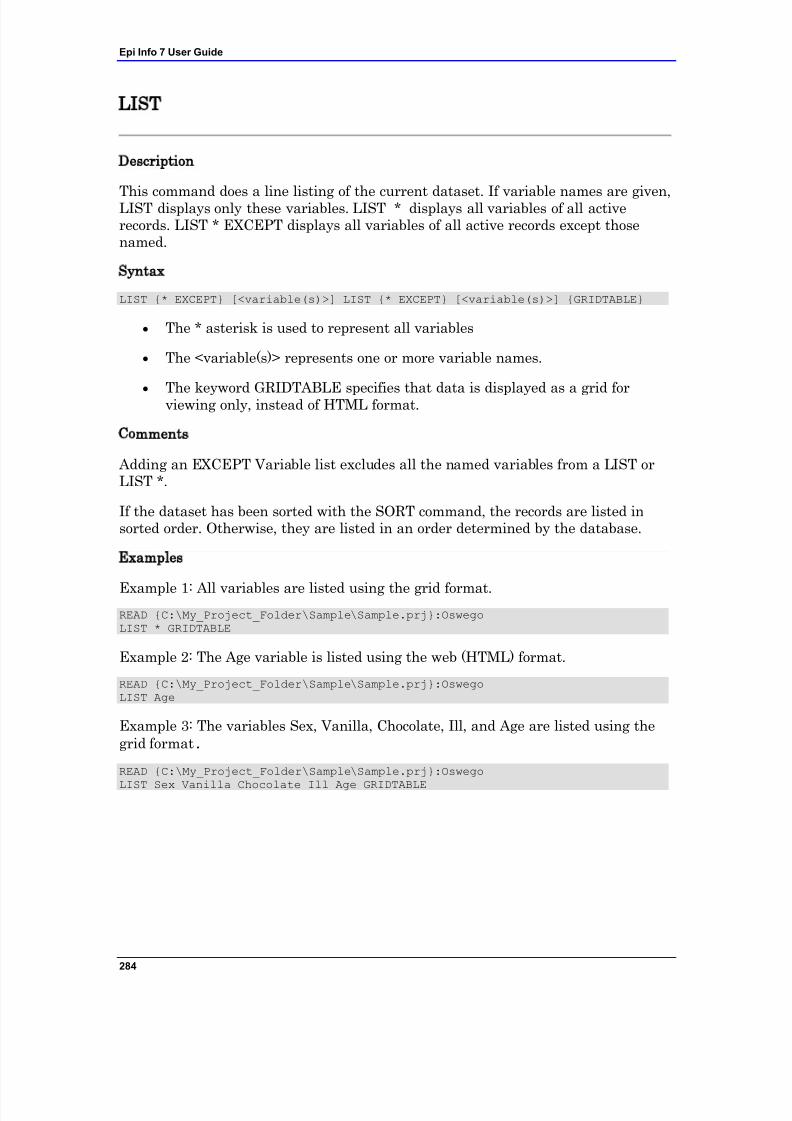
7/14/2019 Epi Info 7 User Guide-V1.0 Cleared
http://slidepdf.com/reader/full/epi-info-7-user-guide-v10-cleared-563109dd5013b 290/368
Epi Info 7 User Guide
284
LIST
Description
This command does a line listing of the current dataset. If variable names are given,LIST displays only these variables. LIST * displays all variables of all activerecords. LIST * EXCEPT displays all variables of all active records except thosenamed.
Syntax
LIST {* EXCEPT} [<variable(s)>] LIST {* EXCEPT} [<variable(s)>] {GRIDTABLE}
The * asterisk is used to represent all variables
The <variable(s)> represents one or more variable names.
The keyword GRIDTABLE specifies that data is displayed as a grid forviewing only, instead of HTML format.
Comments
Adding an EXCEPT Variable list excludes all the named variables from a LIST orLIST *.
If the dataset has been sorted with the SORT command, the records are listed insorted order. Otherwise, they are listed in an order determined by the database.
Examples
Example 1: All variables are listed using the grid format.READ {C:\My_Project_Folder\Sample\Sample.prj}:OswegoLIST * GRIDTABLE
Example 2: The Age variable is listed using the web (HTML) format.
READ {C:\My_Project_Folder\Sample\Sample.prj}:OswegoLIST Age
Example 3: The variables Sex, Vanilla, Chocolate, Ill, and Age are listed using thegrid format.
READ {C:\My_Project_Folder\Sample\Sample.prj}:Oswego
LIST Sex Vanilla Chocolate Ill Age GRIDTABLE
7/14/2019 Epi Info 7 User Guide-V1.0 Cleared
http://slidepdf.com/reader/full/epi-info-7-user-guide-v10-cleared-563109dd5013b 291/368
Command Reference – Analysis Commands
285
LOGISTIC
Description
This command performs conditional or unconditional multivariate logistic regressionwith automatic dummy variables and support for multiple interactions.
Syntax
LOGISTIC <dependent variable> = <independent variable(s)> [MATCHVAR=<matchvariable>] [NOINTERCEPT] [OUTTABLE=<tablename>] [WEIGHTVAR=<weight variable>][PVALUE=<PValue>]
The <dependent variable> represents the dependent variable.
The <independent variable(s)> represents an independent variable that canbe a numeric variable, a non-numeric variable, or a variable surrounded byparenthesis. Any text or yes-no variable, or a variable surrounded withparenthesis, is automatically recoded into dummy variables. A dummyvariable is created for all but one of the levels of a variable. The variablemeasures the contribution of its level relative to the excluded level.Interactions are specified by * between variables.
The <weight variable> represents a variable to specify the contribution eachdata row has to the output.
The <match variable> represents a variable to specify the different groups fora conditional analysis. If a match variable is specified, a conditional analysiswill be performed
The <tablename> represents a table where the residuals are stored. If notable name is present, no residuals are produced.
The <PValue> represents the size of the confidence intervals; this may bespecified as percent or decimal. If greater than .5, 1-PValue is used. Thedefault is 95%.
Comments
LOGISTIC uses the Newton-Rhapson method for maximizing likelihood.
Example
To do an unconditional regression, run the following:
READ {C:\My_Project_Folder\Sample\Sample.prj}:OswegoLOGISTIC Ill = BrownBread CabbageSal Water Milk Chocolate Vanilla
7/14/2019 Epi Info 7 User Guide-V1.0 Cleared
http://slidepdf.com/reader/full/epi-info-7-user-guide-v10-cleared-563109dd5013b 292/368
Epi Info 7 User Guide
286
MEANS
Description
This command is used to compute descriptive statistics for a continuous (numeric)variable. When used with a cross-tabulation variable, it also computes statisticsshowing the likelihood that the means of the groups are equal. The mean of a yes-novariable is the proportion of respondents answering yes.
Syntax
MEANS <variable 1> {<variable 2>} {STRATAVAR=<variable(s)>}{WEIGHTVAR=<variable>} {OUTTABLE=<tablename>}
<variable 1> represents a numeric variable to be used to calculate means (or* for all numeric variables).
<variable 2> represents any variable used for cross-tabulation (optional). <variable(s)> represent variable(s) to be used for stratified analysis.
<variable> represents a variable containing the frequency for the event.
<tablename> represents a name for a table to be created.
Comments
The MEANS command has two formats. If only one variable is supplied, theprogram produces a table similar to one produced by FREQUENCIES, plusdescriptive statistics. If two variables are supplied, the first is a numeric variable
containing data to be analyzed and the second is a variable that indicates howgroups will be distinguished. The output of this format is a table similar to oneproduced by TABLES, plus descriptive statistics of the numeric variable for eachvalue of the group variable.
Multiline (memo) variables cannot be used in MEANS. To use a Multiline variable,define a new variable and assign to it the value SUBSTRING(<old variable>,1,255)and use it in the means.
The f-test which is generated from MEANS is a generalization of the t-test. The t-test only works with two groups while the f-test works with any number of groups.
MEANS produces the following statistical tests: Parametric
ANOVA (for two or more samples)
Student's t-test (for two samples)
Non-parametric
7/14/2019 Epi Info 7 User Guide-V1.0 Cleared
http://slidepdf.com/reader/full/epi-info-7-user-guide-v10-cleared-563109dd5013b 293/368
Command Reference – Analysis Commands
287
Kruskal-Wallis one-way analysis of variance (for two or more samples)
Mann-Whitney U = Wilcoxon Rank Sum Test (for two samples)
Examples
Example 1: Descriptive statistics for the age variable are displayed, including thenumber of observations, the total, the mean, variance, standard deviation, 25%,median, 75%, maximum, minimum, and mode.
READ {C:\My_Project_Folder\Sample\Sample.prj}:OswegoMEANS Age
Example 2: The MEANS command is used to compare two means. An independent t-test and one-way analysis of variance (ANOVA) is performed.
READ {C:\My_Project_Folder\Sample\Sample.prj}:EvansCountyMEANS CHL CHD
Example 3: The average number of cigarettes smoked between males and females is
determined.
READ {C:\My_Project_Folder\Sample\Sample.prj}:SmokeMEANS NumCigar Sex STRATAVAR=Strata WEIGHTVAR=SampW PSUVAR=PSUID

7/14/2019 Epi Info 7 User Guide-V1.0 Cleared
http://slidepdf.com/reader/full/epi-info-7-user-guide-v10-cleared-563109dd5013b 294/368
Epi Info 7 User Guide
288
MERGE
Description
This command merges records in one dataset with those in another the GlobalRecord Identifier contained in every Epi Info 7 project to establish the matchbetween records. Records in the second dataset that do not have matching keys canbe appended to the end of a dataset. Records in the second dataset that do havematching keys can be used to update records in the main dataset. Records in thesecond dataset can be used as the parent in defining an Epi Info 7 parent-childrelationship after records have been merged into the parent and child forms.
Syntax
MERGE <table specification> {LINKNAME=<text>} [<key(s)>] <type>
The <table specification> represents the type and name of a data table to be
read as the Merge file.
The <key(s)> represent the Global Record Identifier on which the match orrelate will be performed. These are in the form:<ExpressionCurrntTable>::<ExpressionMergeTable>
The <MergeType>, may be APPEND, UPDATE or RELATE. If no type isspecified, APPEND and UPDATE are performed. For matching records,UPDATE replaces the value of any field in the READ table whose namematches in the MERGE table with the value from the MERGE table unless ithas a missing value. For unmatched records, APPEND creates a new recordin the READ table with values only for those fields which exist in the
MERGE table.
Currently, Merge is only supported when the READ and MERGE data sourceis an Epi Info 7 project.
Comments
APPEND adds unmatched records in the Merge table to the currently active dataset.Only fields found in both datasets are added.
UPDATE replaces fields of records in the active table with those in the Merge tableif the key expressions match. Only fields found in both datasets with a non-empty
value in the Merge table are replaced.RELATE moves the unique key of the current table to the foreign key of the relatedtable to make a permanent relationship. The related (Merge) table must be an
Access/Epi2000 table. The READ table and the RELATE tables must be Epi Infoforms. READ {C:\My_Project_Folder\Sample\Sample.prj}:

7/14/2019 Epi Info 7 User Guide-V1.0 Cleared
http://slidepdf.com/reader/full/epi-info-7-user-guide-v10-cleared-563109dd5013b 295/368
Command Reference – Analysis Commands
289
Example
MERGE {C:\My_Project_Folder\Sample\Sample.prj}:Surveillance GlobalRecordId ::GlobalRecordId
7/14/2019 Epi Info 7 User Guide-V1.0 Cleared
http://slidepdf.com/reader/full/epi-info-7-user-guide-v10-cleared-563109dd5013b 296/368
Epi Info 7 User Guide
290
PRINTOUT
Description
This command sends the contents of the current output file (the one visible in theoutput window) or some other specified file to the default printer.
Syntax
PRINTOUT <filename>
Example
The output file Oswego.txt is sent to the printer.
READ {C:\My_Project_Folder\Sample\Sample.prj}:OswegoWRITE REPLACE "Text" 'C:\Epi_Info\Oswego.txt' *PRINTOUT 'C:\Epi_Info\Oswego.txt'
7/14/2019 Epi Info 7 User Guide-V1.0 Cleared
http://slidepdf.com/reader/full/epi-info-7-user-guide-v10-cleared-563109dd5013b 297/368
Command Reference – Analysis Commands
291
QUIT
Description
This command closes the current data files and terminates the current program,closing Classic Analysis.
Syntax
QUIT
Program Specific Features
Quit will stop the execution of a program and close Classic Analysis. If there is noQUIT at the end of a .PGM program, Classic Analysis continues to run and offeruser-interaction.
Example You are presented with a dialog box asking if you want to close Analysis. Selecting'Yes' closes Classic Analysis.
DEFINE Results YNDIALOG "Do you wish to close Analysis?" Results YNIF Results = (+) THEN
QUITEND
7/14/2019 Epi Info 7 User Guide-V1.0 Cleared
http://slidepdf.com/reader/full/epi-info-7-user-guide-v10-cleared-563109dd5013b 298/368
Epi Info 7 User Guide
292
READ
Description
This command makes one or more forms the active dataset. It also removes anypreviously active datasets and associated defined variables and dataset-specificcommands (e.g., RELATE, SORT, SELECT or IF statements).
Syntax
READ <table specification> FMT="<file format>" UID="<username>"PWD="<password>" END
The <table specification> and FILESPEC are referred to in the followingparagraphs:
The READ, RELATE, and MERGE commands can operate on many different
types of data. Each type requires a different table specification, and some typesrequired additional information in a file specification. Table specificationsusually consist of a data type (contained in double quotes), a space, a file path(which may be enclosed in single quotes, and must be if it includes a space), acolon, and a table name.
The various file types that can be used are:
Epi Info 7 Forms and Tables
Microsoft Access 97-2003 and MS Access 2007
Microsoft Excel 97-2003 and Excel 2007
SQL Server – Server name and Database name will be requiredwhen accessing tables within an SQL Server database.
7/14/2019 Epi Info 7 User Guide-V1.0 Cleared
http://slidepdf.com/reader/full/epi-info-7-user-guide-v10-cleared-563109dd5013b 299/368
Command Reference – Analysis Commands
293
Text Files – There are two basically different forms of text files.Both forms have only one table per file, so there is no need tospecify a table. Both forms put the data for one record on a singleline. The difference is in how the fields are indicated. One form,called "delimited," uses designated characters to separate fields.The second form, shown in the fourth example, is called "fixed"because each field occupies the same positions in each line. Allcharacter positions through the last field must be accounted foreven if they do not contain useful data (the command generatorwill automatically generate filler fields as required). Even if thefirst line of the file contains field names (HDR="YES"), the namesspecified in field definitions will be used. The text file driveractually reads the file into the database, so changes made to thefile after the READ will not be saved and changes made throughEpi Info will not be saved to the text file (unless it is rewrittenwith the WRITE REPLACE command, which is available only inCSV format).
Examples
Example 1: If the file/form was previously accessed, the Oswego Form is read
READ {config:Sample.prj}:Oswego
Example 2: The Oswego Form is read. Unlike in example 1, the full path to thedatabase file is specified.
READ {C:\Epi Info 7\Epi Info 7\Projects\Sample\Sample.prj}:Oswego
Example 3: If a space appears in the table name in Access, it must be enclosed in
square brackets.READ {C:\Epi Info 7\Epi Info 7\MyData}:[Table Name with Spaces]
Example 4: An Excel spreadsheet is read.
READ {C:\Epi Info 7\Epi Info 7\PlagueData.xls}:[Plague$]
7/14/2019 Epi Info 7 User Guide-V1.0 Cleared
http://slidepdf.com/reader/full/epi-info-7-user-guide-v10-cleared-563109dd5013b 300/368
Epi Info 7 User Guide
294
RECODE
Description
This command is used to change some or all the values of a variable. New values canbe stored in the same variable or in a new one. It can also be used to convert anumeric variable into a character variable or the reverse, or to create a new variablebased on recoded values of an existing variable.
Syntax
RECODE <variable1> TO <variable2>value1 - value2 = <recoded value>value1 – HIVALUE = <recoded value>LOVALUE - value2 = <recoded value>value3 = <recoded value>
ELSE = <recoded value>END
The <variable1> represents the donor variable (where the values are).
The <variable2> represents the receiver variable (where recoded values willbe).
Comments
Text values must be enclosed in quotation marks; numeric, date; yes/no values mustnot. All recoded values must be of the same type. Numeric ranges are separated by aspace, hyphen, and space, as in 1 - 5. Negative values are permitted (i.e.,-10, -9, and-8). The words LOVALUE and HIVALUE may be used to indicate the smallest andlargest values representable in the database. The word ELSE may be used to
indicate all values not falling in the preceding ranges. Recodes take place in theorder stated; if two ranges overlap, the first in order will apply. Analysis cannotRECODE more than about 12 levels of values. If this is a problem, do as manyrecodes as possible, write a new table, READ it, and do more recodes.
Examples
Example 1: The RECODE command is used to generate an age range.
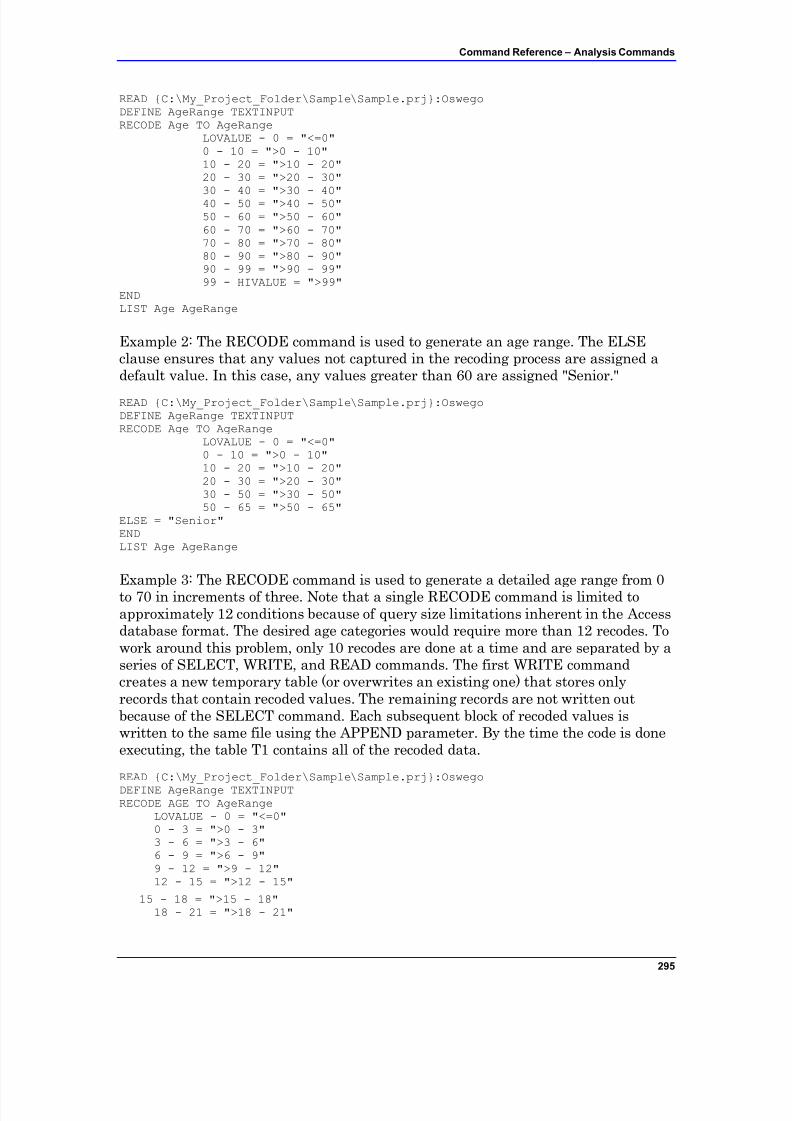
7/14/2019 Epi Info 7 User Guide-V1.0 Cleared
http://slidepdf.com/reader/full/epi-info-7-user-guide-v10-cleared-563109dd5013b 301/368
Command Reference – Analysis Commands
295
READ {C:\My_Project_Folder\Sample\Sample.prj}:OswegoDEFINE AgeRange TEXTINPUTRECODE Age TO AgeRange
LOVALUE - 0 = "<=0"0 - 10 = ">0 - 10"10 - 20 = ">10 - 20"20 - 30 = ">20 - 30"
30 - 40 = ">30 - 40"40 - 50 = ">40 - 50"50 - 60 = ">50 - 60"60 - 70 = ">60 - 70"70 - 80 = ">70 - 80"80 - 90 = ">80 - 90"90 - 99 = ">90 - 99"99 - HIVALUE = ">99"
ENDLIST Age AgeRange
Example 2: The RECODE command is used to generate an age range. The ELSEclause ensures that any values not captured in the recoding process are assigned adefault value. In this case, any values greater than 60 are assigned "Senior."
READ {C:\My_Project_Folder\Sample\Sample.prj}:OswegoDEFINE AgeRange TEXTINPUTRECODE Age TO AgeRange
LOVALUE - 0 = "<=0"0 - 10 = ">0 - 10"10 - 20 = ">10 - 20"20 - 30 = ">20 - 30"30 - 50 = ">30 - 50"50 - 65 = ">50 - 65"
ELSE = "Senior"ENDLIST Age AgeRange
Example 3: The RECODE command is used to generate a detailed age range from 0to 70 in increments of three. Note that a single RECODE command is limited toapproximately 12 conditions because of query size limitations inherent in the Accessdatabase format. The desired age categories would require more than 12 recodes. Towork around this problem, only 10 recodes are done at a time and are separated by aseries of SELECT, WRITE, and READ commands. The first WRITE commandcreates a new temporary table (or overwrites an existing one) that stores onlyrecords that contain recoded values. The remaining records are not written outbecause of the SELECT command. Each subsequent block of recoded values iswritten to the same file using the APPEND parameter. By the time the code is doneexecuting, the table T1 contains all of the recoded data.
READ {C:\My_Project_Folder\Sample\Sample.prj}:OswegoDEFINE AgeRange TEXTINPUTRECODE AGE TO AgeRange
LOVALUE - 0 = "<=0"0 - 3 = ">0 - 3"3 - 6 = ">3 - 6"6 - 9 = ">6 - 9"9 - 12 = ">9 - 12"12 - 15 = ">12 - 15"
15 - 18 = ">15 - 18"18 - 21 = ">18 - 21"
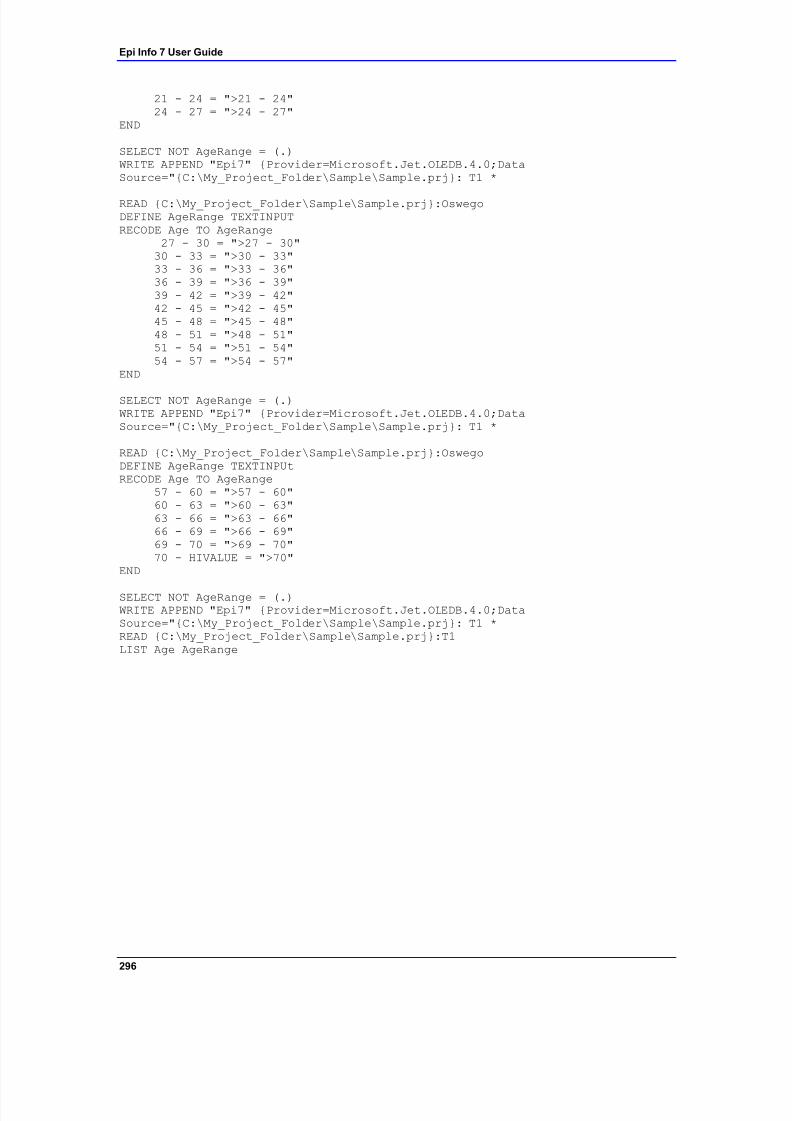
7/14/2019 Epi Info 7 User Guide-V1.0 Cleared
http://slidepdf.com/reader/full/epi-info-7-user-guide-v10-cleared-563109dd5013b 302/368
Epi Info 7 User Guide
296
21 - 24 = ">21 - 24"24 - 27 = ">24 - 27"
END
SELECT NOT AgeRange = (.)WRITE APPEND "Epi7" {Provider=Microsoft.Jet.OLEDB.4.0;DataSource="{C:\My_Project_Folder\Sample\Sample.prj}: T1 *
READ {C:\My_Project_Folder\Sample\Sample.prj}:OswegoDEFINE AgeRange TEXTINPUTRECODE Age TO AgeRange
27 - 30 = ">27 - 30"30 - 33 = ">30 - 33"33 - 36 = ">33 - 36"36 - 39 = ">36 - 39"39 - 42 = ">39 - 42"42 - 45 = ">42 - 45"45 - 48 = ">45 - 48"48 - 51 = ">48 - 51"51 - 54 = ">51 - 54"54 - 57 = ">54 - 57"
END
SELECT NOT AgeRange = (.)WRITE APPEND "Epi7" {Provider=Microsoft.Jet.OLEDB.4.0;DataSource="{C:\My_Project_Folder\Sample\Sample.prj}: T1 *
READ {C:\My_Project_Folder\Sample\Sample.prj}:OswegoDEFINE AgeRange TEXTINPUtRECODE Age TO AgeRange
57 - 60 = ">57 - 60"60 - 63 = ">60 - 63"63 - 66 = ">63 - 66"66 - 69 = ">66 - 69"69 - 70 = ">69 - 70"70 - HIVALUE = ">70"
END
SELECT NOT AgeRange = (.)WRITE APPEND "Epi7" {Provider=Microsoft.Jet.OLEDB.4.0;DataSource="{C:\My_Project_Folder\Sample\Sample.prj}: T1 * READ {C:\My_Project_Folder\Sample\Sample.prj}:T1LIST Age AgeRange
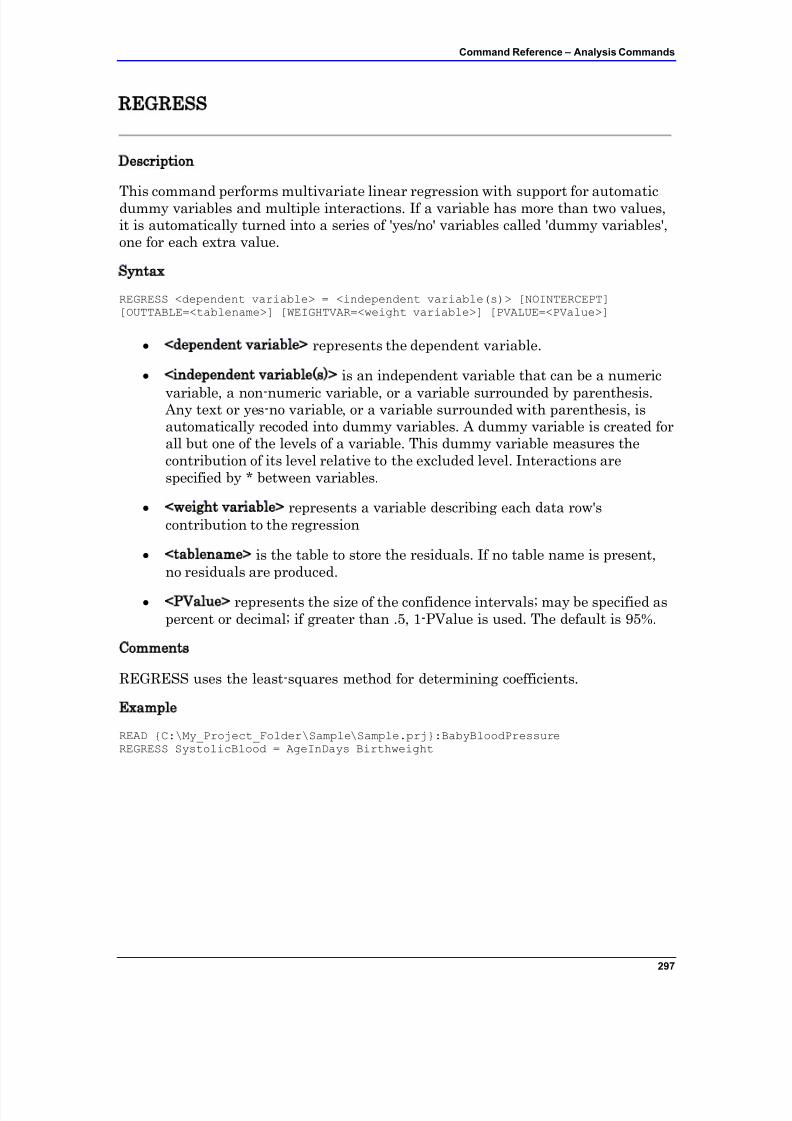
7/14/2019 Epi Info 7 User Guide-V1.0 Cleared
http://slidepdf.com/reader/full/epi-info-7-user-guide-v10-cleared-563109dd5013b 303/368
Command Reference – Analysis Commands
297
REGRESS
Description
This command performs multivariate linear regression with support for automaticdummy variables and multiple interactions. If a variable has more than two values,it is automatically turned into a series of 'yes/no' variables called 'dummy variables',one for each extra value.
Syntax
REGRESS <dependent variable> = <independent variable(s)> [NOINTERCEPT][OUTTABLE=<tablename>] [WEIGHTVAR=<weight variable>] [PVALUE=<PValue>]
<dependent variable> represents the dependent variable.
<independent variable(s)> is an independent variable that can be a numeric
variable, a non-numeric variable, or a variable surrounded by parenthesis. Any text or yes-no variable, or a variable surrounded with parenthesis, isautomatically recoded into dummy variables. A dummy variable is created forall but one of the levels of a variable. This dummy variable measures thecontribution of its level relative to the excluded level. Interactions arespecified by * between variables.
<weight variable> represents a variable describing each data row'scontribution to the regression
<tablename> is the table to store the residuals. If no table name is present,no residuals are produced.
<PValue> represents the size of the confidence intervals; may be specified aspercent or decimal; if greater than .5, 1-PValue is used. The default is 95%.
Comments
REGRESS uses the least-squares method for determining coefficients.
Example
READ {C:\My_Project_Folder\Sample\Sample.prj}:BabyBloodPressureREGRESS SystolicBlood = AgeInDays Birthweight
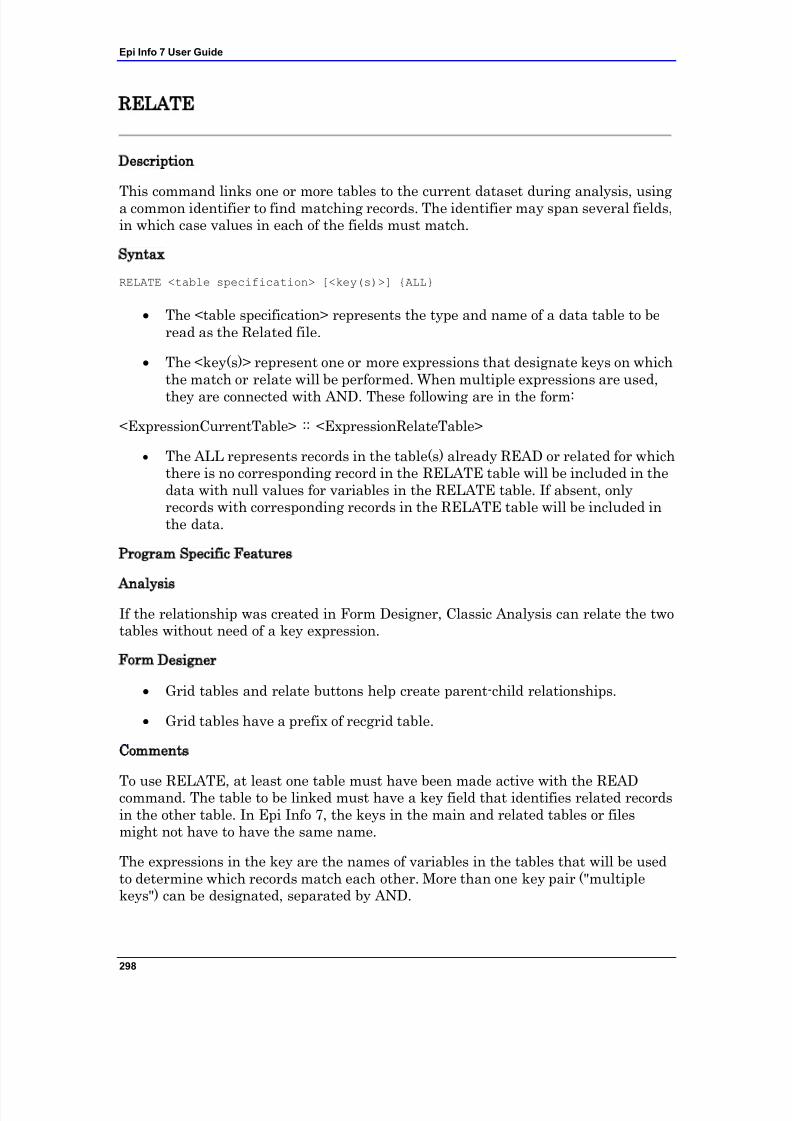
7/14/2019 Epi Info 7 User Guide-V1.0 Cleared
http://slidepdf.com/reader/full/epi-info-7-user-guide-v10-cleared-563109dd5013b 304/368
Epi Info 7 User Guide
298
RELATE
Description
This command links one or more tables to the current dataset during analysis, usinga common identifier to find matching records. The identifier may span several fields,in which case values in each of the fields must match.
Syntax
RELATE <table specification> [<key(s)>] {ALL}
The <table specification> represents the type and name of a data table to beread as the Related file.
The <key(s)> represent one or more expressions that designate keys on whichthe match or relate will be performed. When multiple expressions are used,
they are connected with AND. These following are in the form:
<ExpressionCurrentTable> :: <ExpressionRelateTable>
The ALL represents records in the table(s) already READ or related for whichthere is no corresponding record in the RELATE table will be included in thedata with null values for variables in the RELATE table. If absent, onlyrecords with corresponding records in the RELATE table will be included inthe data.
Program Specific Features
AnalysisIf the relationship was created in Form Designer, Classic Analysis can relate the twotables without need of a key expression.
Form Designer
Grid tables and relate buttons help create parent-child relationships.
Grid tables have a prefix of recgrid table.
Comments
To use RELATE, at least one table must have been made active with the READcommand. The table to be linked must have a key field that identifies related recordsin the other table. In Epi Info 7, the keys in the main and related tables or filesmight not have to have the same name.
The expressions in the key are the names of variables in the tables that will be usedto determine which records match each other. More than one key pair ("multiplekeys") can be designated, separated by AND.
7/14/2019 Epi Info 7 User Guide-V1.0 Cleared
http://slidepdf.com/reader/full/epi-info-7-user-guide-v10-cleared-563109dd5013b 305/368
Command Reference – Analysis Commands
299
After issuing the RELATE command, the variables in the related table may be usedas if they were part of the main table. Where variable names are duplicated in therelated tables, the variable names will be suffixed with a sequence number. Inreferring to a variable in a related table, you may (optionally) use the formHOUSE.AGE to represent the variable AGE in the form HOUSE. This willdistinguish it from another variable AGE that might be in the main table.
Frequencies, cross-tabulations, and other operations involving data in both the mainand related tables can be performed. To preserve the linked structure, the WRITEcommand may be used to create a new table. More than one table may be related tothe main table or related table by using successive RELATE commands.
Example
The records from the RHepatitis data tables are related to the Surveillance datatable.
READ {C:\My_Project_Folder\Sample\Sample.prj}:SurveillanceRELATE RHepatitis GlobalRecordId :: [FKEY]
7/14/2019 Epi Info 7 User Guide-V1.0 Cleared
http://slidepdf.com/reader/full/epi-info-7-user-guide-v10-cleared-563109dd5013b 306/368
Epi Info 7 User Guide
300
ROUTEOUT
Description
This command directs output to the named file until the process is terminated byCLOSEOUT. Output from commands (e.g., FREQ and LIST) is appended to thesame output file as it is produced.
Syntax
ROUTEOUT <filename> {REPLACE | APPEND}
The <filename> represents an HTM document where the output will bestored. If no directory is specified, use the directory of the current project.
The REPLACE | APPEND keyword controls what happens to an existing filewith the same name. If REPLACE is specified, any existing file of the same
name is deleted prior to writing. If APPEND is specified, new output isappended to any existing file with the same name.
Comments
Epi Info 7 sends output to an HTML document that any browser can be read. If nooutput is selected, Epi Info 7 creates a new file (typically called OUTXXX.HTM)where XXX is a sequential number. Output files are placed in the same directory asthe current project. The prefix for output files and a starting sequence number canbe changed from the Storing Output command located in the Output folder.
If no path is specified, or if the directory does not exist, the output file is created in
the directory of the current project.
Example
The output generated by running the commands below is sent to the fileOutbreak1.htm in the C:\My_Project_Folder\folder.
READ {C:\My_Project_Folder\Sample\Sample.prj}:OswegoROUTEOUT “C:\My_Project_Folder\Outbreak1.htm” REPLACE SET STATISTICS=COMPLETETABLES Vanilla Ill STRATAVAR=SexMEANS Chocolate IllCLOSEOUT
7/14/2019 Epi Info 7 User Guide-V1.0 Cleared
http://slidepdf.com/reader/full/epi-info-7-user-guide-v10-cleared-563109dd5013b 307/368
Command Reference – Analysis Commands
301
RUNPGM
Description
This command runs a stored Classic Analysis program. This command is similar toan INCLUDE file or subroutine in other systems.
Syntax
RUNPGM '<file name>':"<program>"RUNPGM '<file name>'
The <file name> represents the path and filename for the MDB or PGM filewhere the program is stored. If the path or filename contains a space, it mustbe enclosed in single quotes. If the program to be run is in the current project,the path need not be supplied.
The <program> represents the Program name. If the program name containsa space, it must be enclosed in double quotes. This is not used for text files.
Comments
Since the filename can include any path and database name, the program to beexecuted can be stored in a different database.
Examples
Example 1: The program editor code contained in the Statistics.pgm file is run.
RUNPGM "C:\MyProject_Folder\Sample\Sample.prj":Statistics
7/14/2019 Epi Info 7 User Guide-V1.0 Cleared
http://slidepdf.com/reader/full/epi-info-7-user-guide-v10-cleared-563109dd5013b 308/368
Epi Info 7 User Guide
302
SELECT
Description
This command allows an expression to be specified that must be true to process arecord. It can also be called a data filter. If the current selection is Age>35, then onlythose records with age greater than 35 are selected. SELECT used alone without anexpression cancels all previous SELECT statements. SELECT statements arecumulative until canceled. Therefore, Select Age > 34, Select Sex = “Male" willchoose males over the age of 34. Cancel Select before doing Select Sex = “Female"because you will get only records that are male and female, or none at all.
Syntax
SELECT <expression>
The <expression> represents any valid Epi Info 7 expression.
Comments
SELECT expressions are cumulative so that the two expressions:
SELECT Age > 35
SELECT Sex = "F"
are equivalent to
SELECT (Age > 35) AND (Sex = "F")
Examples
Example 1: A subset of the data contained in the Food History table is selected. Inthis case, only records where the patient is female and interviewed after 04/15/2011,or where the patient is male and interviewed after 06/01/2011 are selected to be inthe subset. Note the use of parentheses to show relationships.
READ {C:\My_Project_Folder\Ecoli\EColi.prj}:FoodHistorySELECT ((DateofInterview > 04/15/2011) AND (Sex =”F-Female")) OR((DateofInterview > 05/15/2011) AND (Sex = " M-Male"))LIST * GRIDTABLE
Example 2: A subset of the data contained in the Food History data table is selected.
In this case, only records where the patient's first name is "Pam" are selected to bein the subset. Note that "Huber" is not case sensitive, and the SELECT commandwould have also selected "HUBER" and "huber”.
READ {C:\My_Project_Folder\Ecoli\EColi.prj}:FoodHistorySELECT LastName = "Huber"LIST * GRIDTABLE
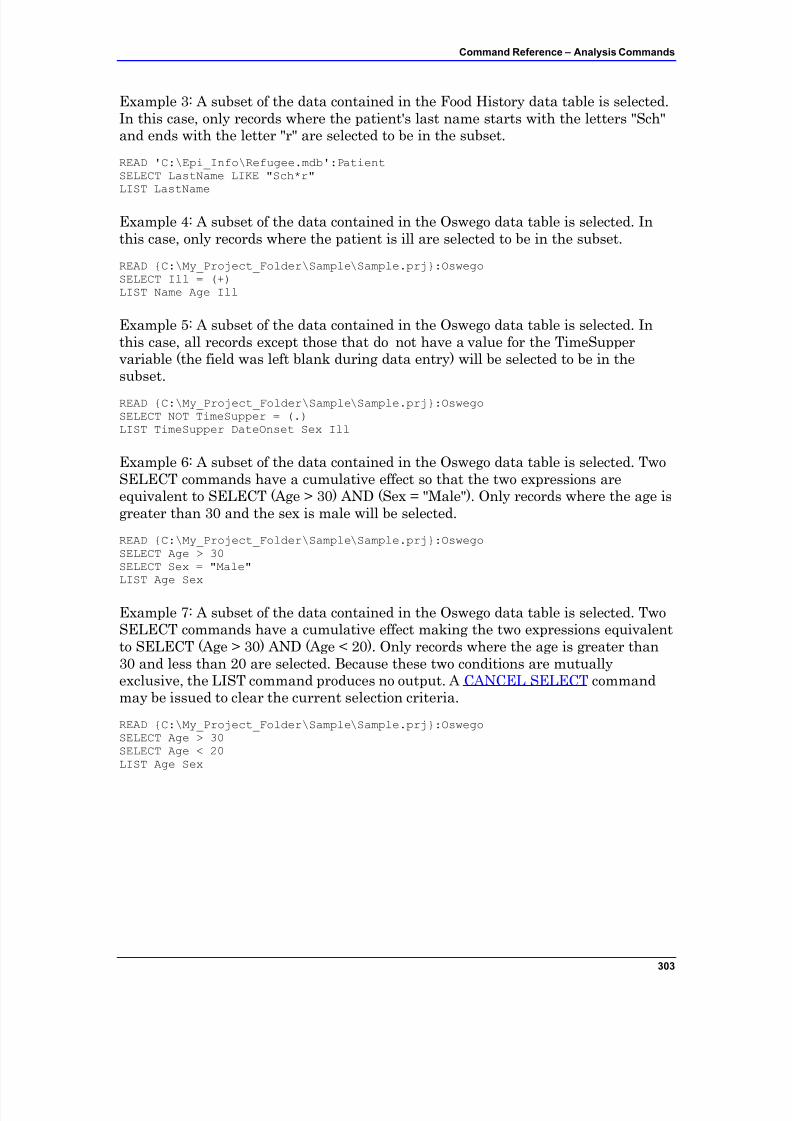
7/14/2019 Epi Info 7 User Guide-V1.0 Cleared
http://slidepdf.com/reader/full/epi-info-7-user-guide-v10-cleared-563109dd5013b 309/368
Command Reference – Analysis Commands
303
Example 3: A subset of the data contained in the Food History data table is selected.In this case, only records where the patient's last name starts with the letters "Sch"and ends with the letter "r" are selected to be in the subset.
READ 'C:\Epi_Info\Refugee.mdb':PatientSELECT LastName LIKE "Sch*r"LIST LastName
Example 4: A subset of the data contained in the Oswego data table is selected. Inthis case, only records where the patient is ill are selected to be in the subset.
READ {C:\My_Project_Folder\Sample\Sample.prj}:OswegoSELECT Ill = (+)LIST Name Age Ill
Example 5: A subset of the data contained in the Oswego data table is selected. Inthis case, all records except those that do not have a value for the TimeSuppervariable (the field was left blank during data entry) will be selected to be in thesubset.
READ {C:\My_Project_Folder\Sample\Sample.prj}:OswegoSELECT NOT TimeSupper = (.)LIST TimeSupper DateOnset Sex Ill
Example 6: A subset of the data contained in the Oswego data table is selected. TwoSELECT commands have a cumulative effect so that the two expressions areequivalent to SELECT (Age > 30) AND (Sex = "Male"). Only records where the age isgreater than 30 and the sex is male will be selected.
READ {C:\My_Project_Folder\Sample\Sample.prj}:OswegoSELECT Age > 30SELECT Sex = "Male"LIST Age Sex
Example 7: A subset of the data contained in the Oswego data table is selected. TwoSELECT commands have a cumulative effect making the two expressions equivalentto SELECT (Age > 30) AND (Age < 20). Only records where the age is greater than30 and less than 20 are selected. Because these two conditions are mutuallyexclusive, the LIST command produces no output. A CANCEL SELECT commandmay be issued to clear the current selection criteria.
READ {C:\My_Project_Folder\Sample\Sample.prj}:OswegoSELECT Age > 30SELECT Age < 20LIST Age Sex
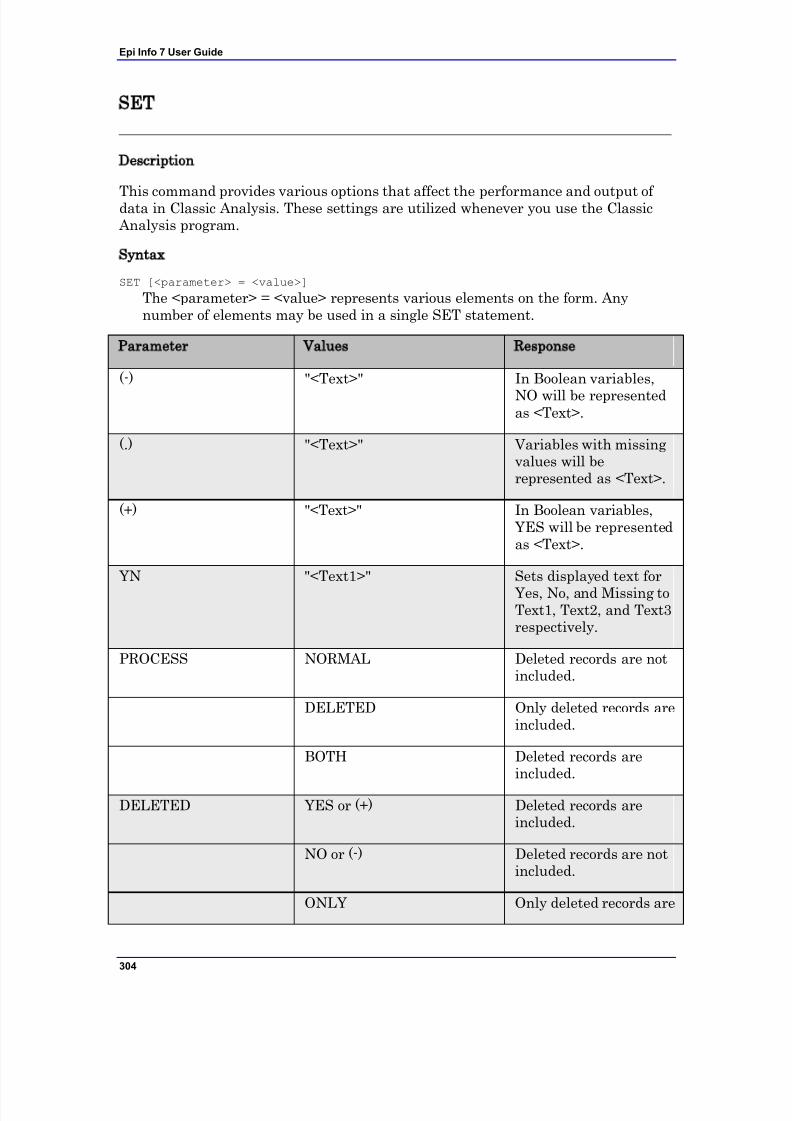
7/14/2019 Epi Info 7 User Guide-V1.0 Cleared
http://slidepdf.com/reader/full/epi-info-7-user-guide-v10-cleared-563109dd5013b 310/368
Epi Info 7 User Guide
304
SET
Description
This command provides various options that affect the performance and output of data in Classic Analysis. These settings are utilized whenever you use the Classic Analysis program.
Syntax
SET [<parameter> = <value>]
The <parameter> = <value> represents various elements on the form. Anynumber of elements may be used in a single SET statement.
Parameter Values Response
(-) "<Text>" In Boolean variables,
NO will be representedas <Text>.
(.) "<Text>" Variables with missingvalues will berepresented as <Text>.
(+) "<Text>" In Boolean variables, YES will be representedas <Text>.
YN "<Text1>" Sets displayed text for
Yes, No, and Missing toText1, Text2, and Text3respectively.
PROCESS NORMAL Deleted records are notincluded.
DELETED Only deleted records areincluded.
BOTH Deleted records areincluded.
DELETED YES or (+) Deleted records areincluded.
NO or (-) Deleted records are notincluded.
ONLY Only deleted records are
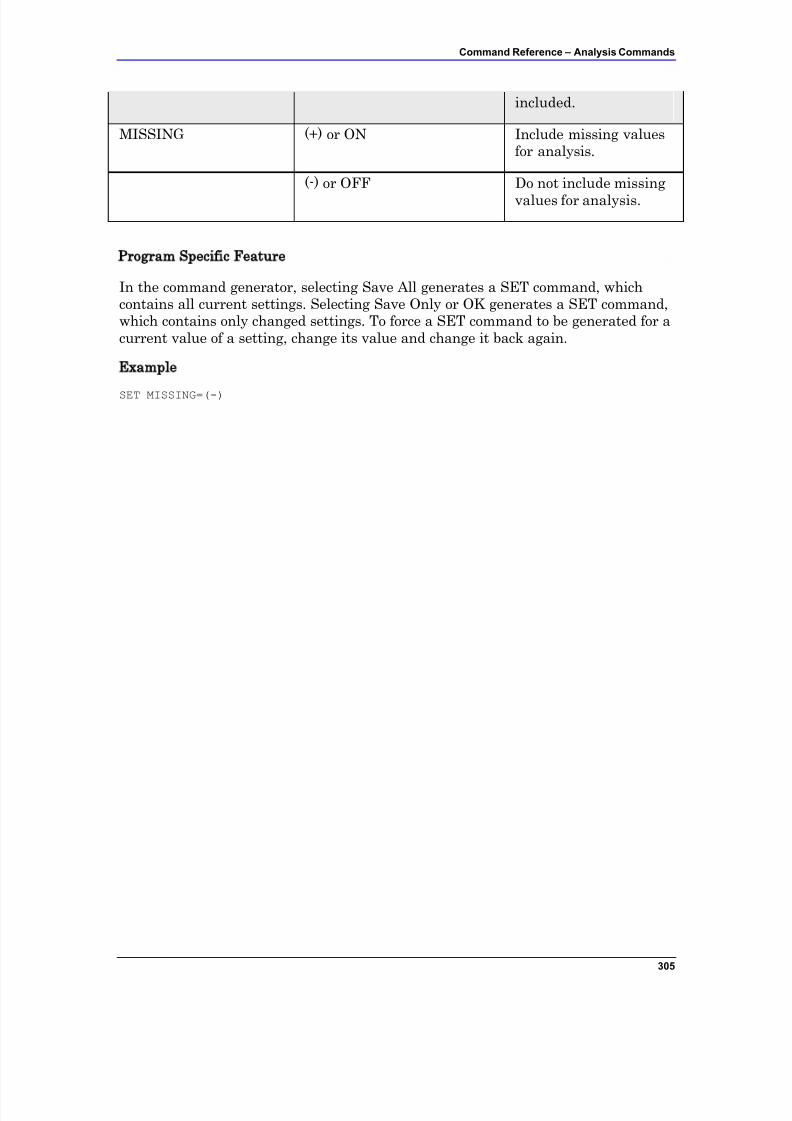
7/14/2019 Epi Info 7 User Guide-V1.0 Cleared
http://slidepdf.com/reader/full/epi-info-7-user-guide-v10-cleared-563109dd5013b 311/368
Command Reference – Analysis Commands
305
included.
MISSING (+) or ON Include missing valuesfor analysis.
(-) or OFF Do not include missing
values for analysis.
Program Specific Feature
In the command generator, selecting Save All generates a SET command, whichcontains all current settings. Selecting Save Only or OK generates a SET command,which contains only changed settings. To force a SET command to be generated for acurrent value of a setting, change its value and change it back again.
Example
SET MISSING=(-)
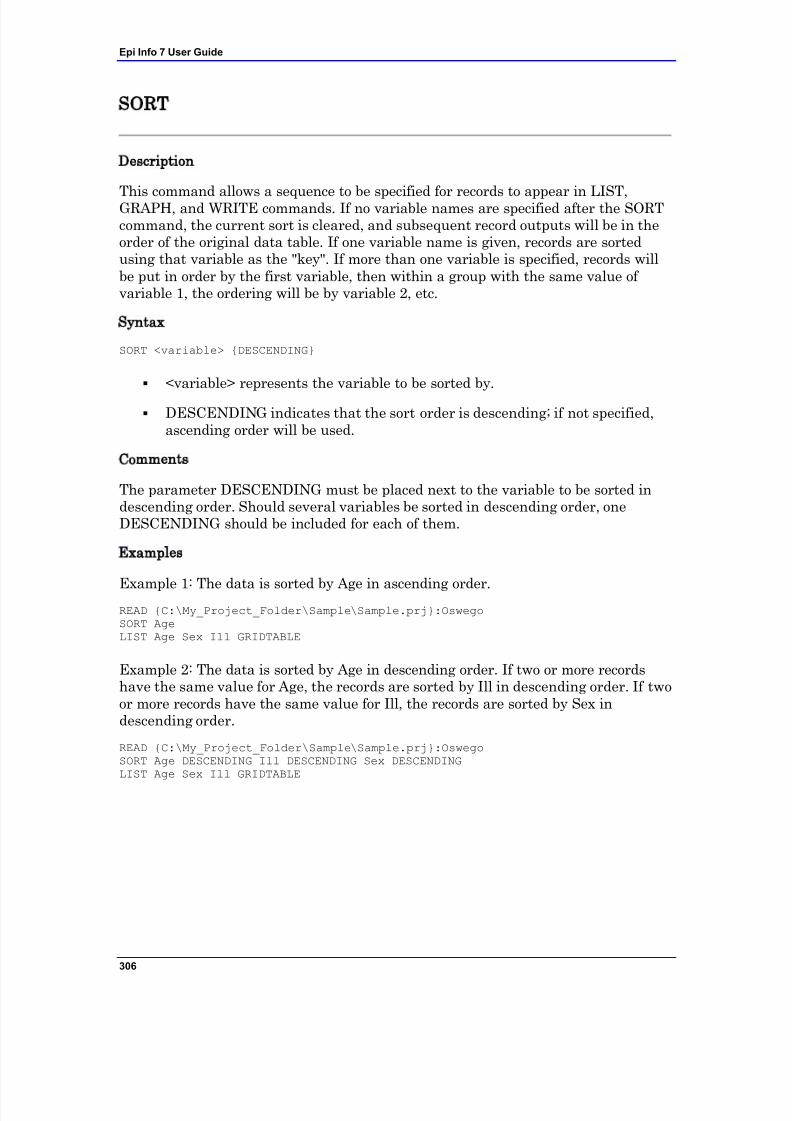
7/14/2019 Epi Info 7 User Guide-V1.0 Cleared
http://slidepdf.com/reader/full/epi-info-7-user-guide-v10-cleared-563109dd5013b 312/368
Epi Info 7 User Guide
306
SORT
Description
This command allows a sequence to be specified for records to appear in LIST,GRAPH, and WRITE commands. If no variable names are specified after the SORTcommand, the current sort is cleared, and subsequent record outputs will be in theorder of the original data table. If one variable name is given, records are sortedusing that variable as the "key". If more than one variable is specified, records willbe put in order by the first variable, then within a group with the same value of variable 1, the ordering will be by variable 2, etc.
Syntax
SORT <variable> {DESCENDING}
<variable> represents the variable to be sorted by.
DESCENDING indicates that the sort order is descending; if not specified,ascending order will be used.
Comments
The parameter DESCENDING must be placed next to the variable to be sorted indescending order. Should several variables be sorted in descending order, oneDESCENDING should be included for each of them.
Examples
Example 1: The data is sorted by Age in ascending order.READ {C:\My_Project_Folder\Sample\Sample.prj}:OswegoSORT AgeLIST Age Sex Ill GRIDTABLE
Example 2: The data is sorted by Age in descending order. If two or more recordshave the same value for Age, the records are sorted by Ill in descending order. If twoor more records have the same value for Ill, the records are sorted by Sex indescending order.
READ {C:\My_Project_Folder\Sample\Sample.prj}:OswegoSORT Age DESCENDING Ill DESCENDING Sex DESCENDINGLIST Age Sex Ill GRIDTABLE
7/14/2019 Epi Info 7 User Guide-V1.0 Cleared
http://slidepdf.com/reader/full/epi-info-7-user-guide-v10-cleared-563109dd5013b 313/368
Command Reference – Analysis Commands
307
SUMMARIZE
Description
This command creates a new table containing summary statistics for the currentdataset or its strata.
Syntax
SUMMARIZE varname::aggregate(variable) [varname::aggregate(variable) ...] TOtablename STRATAVAR=variable list {WEIGHTVAR=variable}
Available aggregates are COUNT, MIN, MAX, SUM, FIRST, LAST, AVG, VARiance and STandardDEViation (Sum, Avg, Var and StDev available onlyfor numeric fields). COUNT may be used without a variable in parenthesis toindicate that a count of the number of records in the table or strata is desired.
You can also use COUNT with a variable in parenthesis to indicate that the
number of records in the table or strata with non-missing values of thespecified group is desired. FIRST and LAST are based on the current sortorder.
Comments
Classic Analysis creates a new table or appends to an existing table (tablename)containing variables (varname) which represent aggregates of variables in thecurrent data source (aggregate[variable]). The aggregates are computed for eachgroup of records, determined by the STRATAVARs, which are also included in thetable. Available aggregates are COUNT, MIN, MAX, SUM, AVG, VARiance andSTandardDEViation (Sum, Avg, Var and StDev available only for numeric fields).
COUNT may be used without a variable in parenthesis to indicate that a count of the number of records in the group is desired, or with a variable in parenthesis toindicate that the number of records in the group with non-missing values of thespecified group is desired.
This command solves some recurring problems for programmers. One is computingpercents; it is difficult to get a denominator. Another is determining the earliest orlatest date in a list of relevant dates, or the highest or lowest of a series of measurements. Many problems can be solved with the OUTTABLE from a TABLESor FREQ command, or with self-joins, but this provides a straightforward method toachieve these results.
Note: Multi-line (memo) fields are not permitted.
Example
READ {C:\My_Project_Folder\Sample\Sample.prj}:EvansCountySUMMARIZE Average_Age :: Avg(AGE) Average_DBP :: Avg(DBP) Number_Records ::Count(AGE) Std_Age :: StDev(AGE) Std_DBP :: StDev(DBP) TO SUMMARY_TABLEREAD {C:\My_Project_Folder\Sample\Sample.prj}:Summary_TableLIST *
7/14/2019 Epi Info 7 User Guide-V1.0 Cleared
http://slidepdf.com/reader/full/epi-info-7-user-guide-v10-cleared-563109dd5013b 314/368
Epi Info 7 User Guide
308
TABLES
Description
This command cross-tabulates specified variables in two or three dimensions. Valuesof the first variable appear across the top of the table while those of the secondvariable appear in the left margin of the table. Unique values of additional variablesare represented as strata. Normally, cells contain counts of records matching thevalues in the corresponding marginal labels. If a WEIGHTVAR parameter is given,the cells represent sums of the weight variable. TABLES DISEASE COUNTY WEIGHTVAR=COUNT provide the same results as SUMTABLES COUNTDISEASE COUNTY in Epi6.
Syntax
TABLES <exposure> <outcome> {STRATAVAR=[<variable(s)>]} {WEIGHTVAR=<variable>}{PSUVAR=<variable>} {OUTTABLE=<table>}
<exposure> represents the variable in the database to be considered the riskfactor (or * for all variables).
<outcome> represents the variable in the database considered disease of consequence (or * for all variables).
<variable> represents the variable in the database.
<table> represents a valid table name to be used to store output.
Comments
For every possible combination of values of the strata variables, a separate table(stratum) for variable 1 by variable 2 is produced. TABLES BAKEDHAM ILLSTRATAVAR=SEX produces a table of BAKEDHAM by ILL for each value of sex-one for M and one for F. TABLES BAKEDHAM ILL STRATAVAR=SEX RACEproduces a separate table of BAKEDHAM by ILL for each combination of SEX andRACE-female/black, female/white, male/black, male/white, etc.
If * is given instead of a variable name, each variable in the dataset is substitutedfor * in turn. To analyze each variable by illness status, use the command TABLES *ILL which produces tables of SEX by ILL, AGE by ILL, etc.
It is important to consider using * or requesting multidimensional tables if thedataset is large (thousands of records), since it may produce more tables thanneeded in terms of time, paper, and other costs. Press Ctrl-Break to exit from alengthy procedure.
7/14/2019 Epi Info 7 User Guide-V1.0 Cleared
http://slidepdf.com/reader/full/epi-info-7-user-guide-v10-cleared-563109dd5013b 315/368
Command Reference – Analysis Commands
309
For 2x2 tables, the command produces odds and risk ratios. For these values to havetheir accepted epidemiological meanings, the value representing presence of theexposure and outcome conditions must appear in the first row and column of thetable. Epi Info yes/no variables are automatically sorted properly. The STATISTICSsetting controls the detail to which the statistics are reported. For tables other than2x2, Chi-square statistics are computed. If an expected value is < 5, the messageChi-square not valid appears. The mid-p and Fisher exact are preferred, especiallyin this case.
Multiline (memo) variables cannot be used in tables. To use a Multiline variable,define a new variable and assign to it the value SUBSTRING(<old variable>,1,255)and use it in the table.
Examples
Example 1: A 2x2 table is generated showing coronary heart disease (CHD) byCatecholamine Level (CAT).
READ {C:\My_Project_Folder\Sample\Sample.prj}:EvansCountyTABLES CAT CHD
Example 2: A 2x2 table is generated showing coronary heart disease (CHD) byCatecholamine Level (CAT), stratified by an age group variable of type yes/no.
READ {C:\My_Project_Folder\Sample\Sample.prj}:EvansCountyTABLES CAT CHD STRATAVAR=AgeG1
Example 3: A 2x2 table is generated for every variable in the database using Ill asthe outcome variable for table.
READ {C:\My_Project_Folder\Sample\Sample.prj}:OswegoTABLES * Ill
Example 4: A 2x2 table is generated and saved to a separate table in the Sampledatabase using the OUTTABLE parameter.
READ {C:\My_Project_Folder\Sample\Sample.prj}:OswegoTABLES Vanilla Ill OUTTABLE = T1READ {C:\My_Project_Folder\Sample\Sample.prj}:T1LIST * GRIDTABLE
Example 5: A 2x2 table is generated showing obesity and disease outcome. Theanalysis is weighted by the value contained in the COUNT column.
READ {C:\My_Project_Folder\Sample\Sample.prj}:LasumTABLES OB OUTCOME WEIGHTVAR=COUNT
Example 6: A complex sample table is generated using a stratified cluster survey.
READ {C:\My_Project_Folder\Sample\Sample.prj}:Epi10TABLES Prenatal VAC STRATAVAR=Location WEIGHTVAR=POPW PSUVAR=Cluster
7/14/2019 Epi Info 7 User Guide-V1.0 Cleared
http://slidepdf.com/reader/full/epi-info-7-user-guide-v10-cleared-563109dd5013b 316/368
Epi Info 7 User Guide
310
TYPEOUT
Description
This command inserts text, a string or file contents, into the output. Typical usesmight include comments or boilerplate.
Syntax
TYPEOUT "text" ([<font property>]) {TEXTFONT <color> <size>}
<text> represents the text to be displayed.
<font property> represents the properties Underline, Bold, or Italic separatedby commas.
<color> represents Aqua, Lime, Red, Black, Silver, Maroon, Blue, Navy, Teal,
Fuchsia, Olive, White, Grey, Purple, Yellow, or Green. Color can also berepresented by hexadecimal digits ###### with pairs of digits representingthe amount of red, green, and blue on a scale of 0 – 255.
Comments
TYPEOUT with a text string is similar to TITLE except that TYPEOUT places thetext once when the command is encountered. HEADER appears at the top of eachsegment of output until cleared.
If no text in quotation marks follows the TYPEOUT command, TYPEOUT sends thefile contents specified to the current output. It can be in text or HTML.
Examples
Example 2: Displays the word "Confidential" underlined and in bold.
TYPEOUT "Confidential" (BOLD,UNDERLINE)
7/14/2019 Epi Info 7 User Guide-V1.0 Cleared
http://slidepdf.com/reader/full/epi-info-7-user-guide-v10-cleared-563109dd5013b 317/368
Command Reference – Analysis Commands
311
UNDEFINE
Description
This command removes a defined variable and any assigned values from the system.Syntax
UNDEFINE <variable>
The <variable> represents a defined variable.
Program Specific Feature
Permanent variables cannot be undefined from the Undefine dialog box. To undefinea permanent variable, type the syntax into the Program Editor and run thecommand.
Comments
A variable that already exists in the database cannot be undefined. To remove adatabase variable from the database, use the WRITE command with the EXCEPTmodifier.
Example
UNDEFINE NewVar
7/14/2019 Epi Info 7 User Guide-V1.0 Cleared
http://slidepdf.com/reader/full/epi-info-7-user-guide-v10-cleared-563109dd5013b 318/368
Epi Info 7 User Guide
312
UNDELETE
Description
This command will mark logically deleted records as normal.Syntax
UNDELETE *UNDELETE expression
Comments
Undelete * or expression causes all logically deleted records in the current selectionmatching the expression to be set to normal status. This applies only to Epi Info 7forms and may not be used when using related tables.
Example
UNDELETE AgeInDays > 5
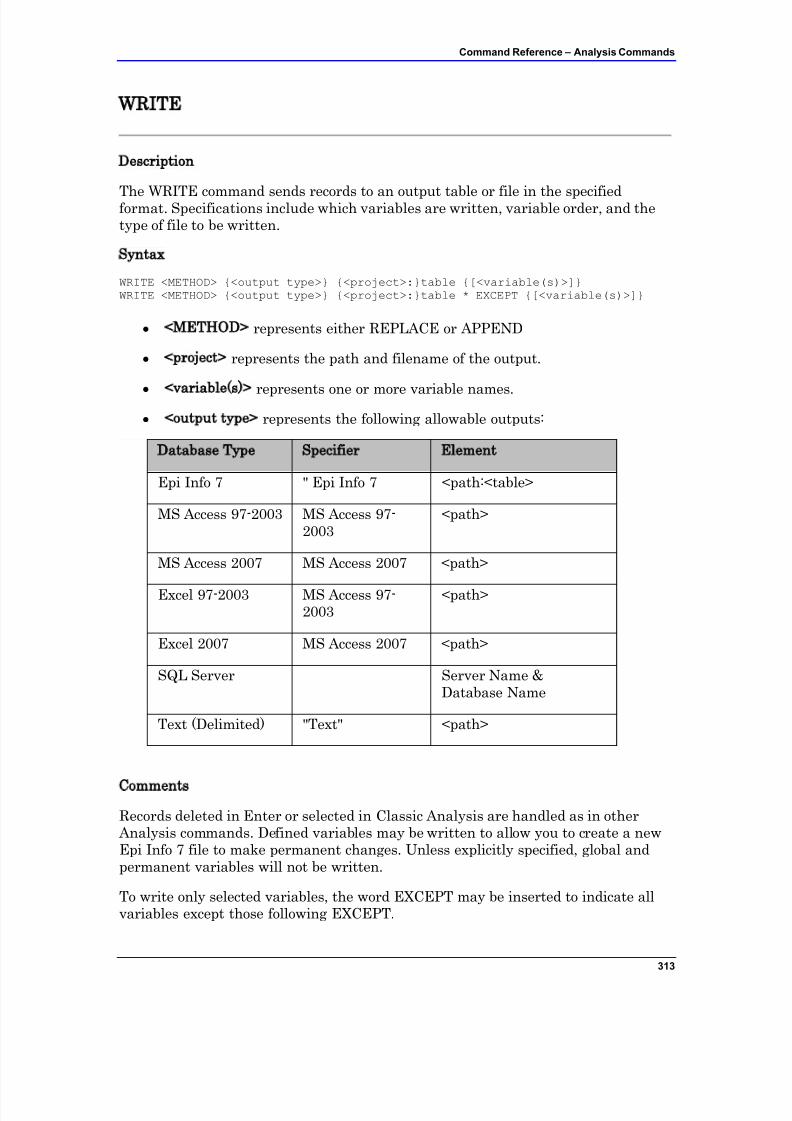
7/14/2019 Epi Info 7 User Guide-V1.0 Cleared
http://slidepdf.com/reader/full/epi-info-7-user-guide-v10-cleared-563109dd5013b 319/368
Command Reference – Analysis Commands
313
WRITE
Description
The WRITE command sends records to an output table or file in the specifiedformat. Specifications include which variables are written, variable order, and thetype of file to be written.
Syntax
WRITE <METHOD> {<output type>} {<project>:}table {[<variable(s)>]}WRITE <METHOD> {<output type>} {<project>:}table * EXCEPT {[<variable(s)>]}
<METHOD> represents either REPLACE or APPEND
<project> represents the path and filename of the output.
<variable(s)> represents one or more variable names.
<output type> represents the following allowable outputs:
Database Type Specifier Element
Epi Info 7 " Epi Info 7 <path:<table>
MS Access 97-2003 MS Access 97-2003
<path>
MS Access 2007 MS Access 2007 <path>
Excel 97-2003 MS Access 97-2003
<path>
Excel 2007 MS Access 2007 <path>
SQL Server Server Name &Database Name
Text (Delimited) "Text" <path>
Comments
Records deleted in Enter or selected in Classic Analysis are handled as in other Analysis commands. Defined variables may be written to allow you to create a newEpi Info 7 file to make permanent changes. Unless explicitly specified, global andpermanent variables will not be written.
To write only selected variables, the word EXCEPT may be inserted to indicate allvariables except those following EXCEPT.
7/14/2019 Epi Info 7 User Guide-V1.0 Cleared
http://slidepdf.com/reader/full/epi-info-7-user-guide-v10-cleared-563109dd5013b 320/368
Epi Info 7 User Guide
314
If the output file specified does not exist, the WRITE command will attempt tocreate it.
Either APPEND or REPLACE must be specified to indicate that an existingfile/table by the same name will be erased or records will be appended to the existingfile/table. If not all of the fields being written match those in an existing file during
an APPEND, the unmatched fields are added to the output table.
Examples
Example 1: The Oswego data table (75 records) from Sample.PRJ is written to adatabase called SampleOutput. The destination table name is called Oswego_1. Thesecond READ command reads the newly-created data table.
READ {C:\My_Project_Folder\Sample\Sample.prj}:OswegoWRITE REPLACE "Epi 2000" 'C:\Epi_Info\SampleOutput.mdb':Oswego_1 *READ {C:\My_Project_Folder\Sample\Sample.prj}:Oswego_1
Example 2: The Oswego data table (75 records) from Sample.PRJ is written to adatabase called SampleOutput three times. The APPEND method ensures that eachWRITE command appends the entire data set several times. After all three WRITEcommands have been run, the Oswego_2 table inside SampleOutput.mdb willcontain 225 records.
READ {C:\My_Project_Folder\Sample\Sample.prj}:OswegoWRITE APPEND "Epi7" {Provider=Microsoft.Jet.OLEDB.4.0;DataSource="C:\My_Project_Folder\SampleOutput.mdb"} : OSWEGO_2 *WRITE APPEND "Epi7" {Provider=Microsoft.Jet.OLEDB.4.0;DataSource="C:\My_Project_Folder\SampleOutput.mdb"} : OSWEGO_2 *WRITE APPEND "Epi7" {Provider=Microsoft.Jet.OLEDB.4.0;Data
Source="C:\My_Project_Folder\SampleOutput.mdb"} : OSWEGO_2 *READ {C:\My_Project_Folder\SampleOutput.mdb”}:OSWEGO_2
Example 3: This example shows how to make defined variables into permanentdatabase variables. The Oswego data table from Sample.PRJ is written to adatabase called SampleOutput. Notice that the defined variable IncubationTimedoes not exist in Sample.PRJ, but after the WRITE command has executed, it is nowa part of the newly-created data table Oswego_3.
READ {C:\My_Project_Folder\Sample\Sample.prj}:OswegoDEFINE IncubationTime NUMERICASSIGN IncubationTime = HOURS(TimeSupper, DateOnset)LIST IncubationTimeWRITE REPLACE "Epi7" {Provider=Microsoft.Jet.OLEDB.4.0;DataSource="C:\My_Project_Folder\SampleOutput.mdb"} : OSWEGO_3 *READ {C:\My_Project_Folder\SampleOutput.mdb”}:OSWEGO_3
LIST * GRIDTABLE
Example 4: The records from the Oswego Form in the Sample database are exportedto an Excel spreadsheet. By specifying age, sex, and incubation time in the WRITEcommand, only those variables will be exported. This example may not work if Microsoft Excel is not installed on the computer.
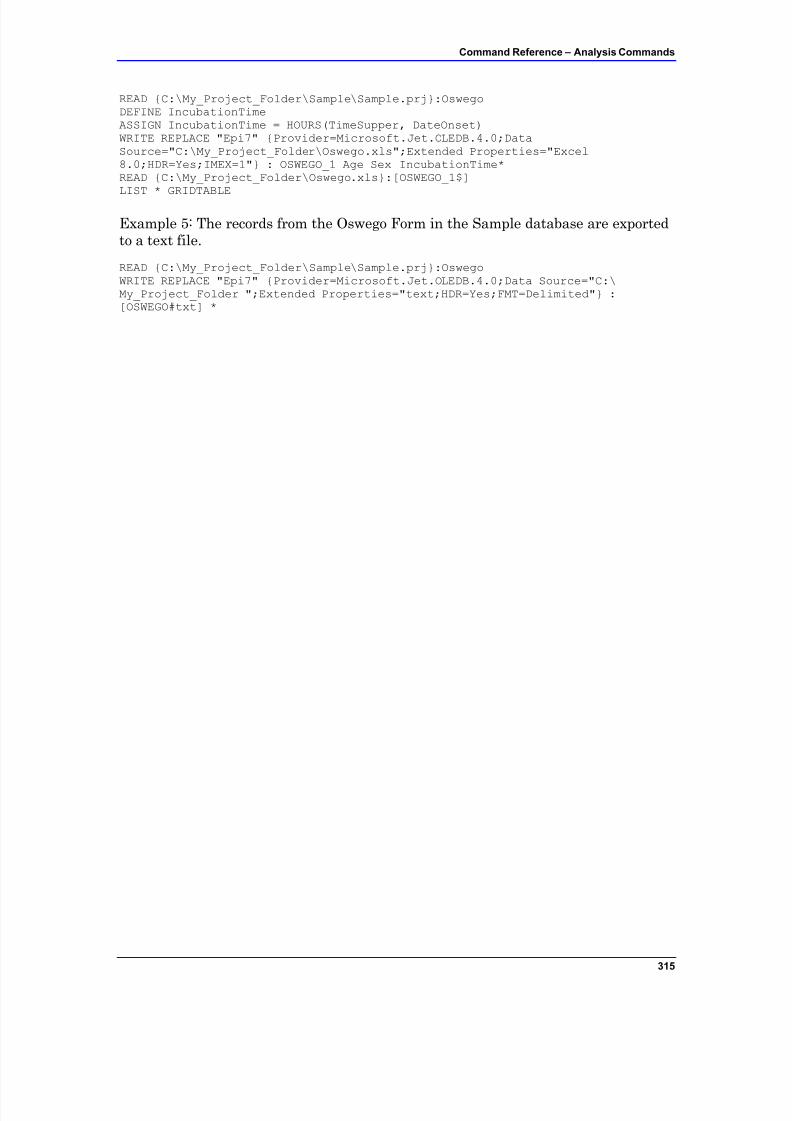
7/14/2019 Epi Info 7 User Guide-V1.0 Cleared
http://slidepdf.com/reader/full/epi-info-7-user-guide-v10-cleared-563109dd5013b 321/368
Command Reference – Analysis Commands
315
READ {C:\My_Project_Folder\Sample\Sample.prj}:OswegoDEFINE IncubationTimeASSIGN IncubationTime = HOURS(TimeSupper, DateOnset)WRITE REPLACE "Epi7" {Provider=Microsoft.Jet.OLEDB.4.0;DataSource="C:\My_Project_Folder\Oswego.xls";Extended Properties="Excel8.0;HDR=Yes;IMEX=1"} : OSWEGO_1 Age Sex IncubationTime*READ {C:\My_Project_Folder\Oswego.xls}:[OSWEGO_1$]
LIST * GRIDTABLE
Example 5: The records from the Oswego Form in the Sample database are exportedto a text file.
READ {C:\My_Project_Folder\Sample\Sample.prj}:OswegoWRITE REPLACE "Epi7" {Provider=Microsoft.Jet.OLEDB.4.0;Data Source="C:\My_Project_Folder ";Extended Properties="text;HDR=Yes;FMT=Delimited"} :[OSWEGO#txt] *
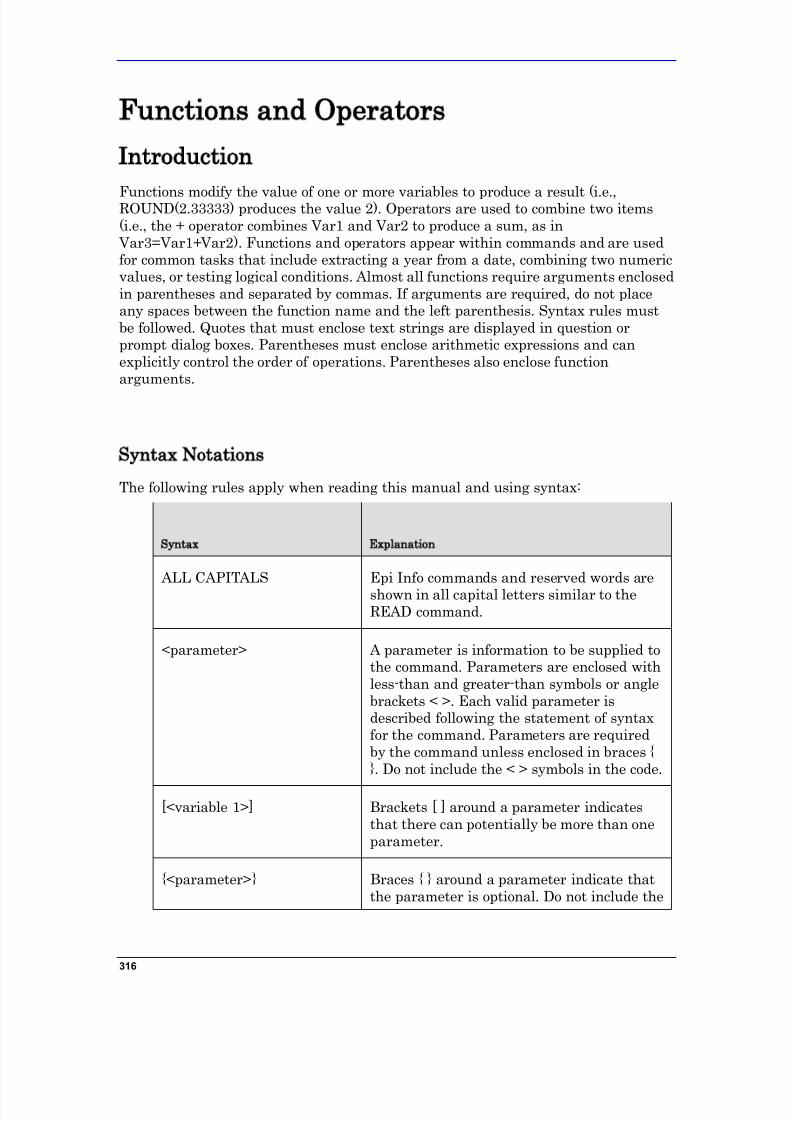
7/14/2019 Epi Info 7 User Guide-V1.0 Cleared
http://slidepdf.com/reader/full/epi-info-7-user-guide-v10-cleared-563109dd5013b 322/368
316
Functions and Operators
Introduction
Functions modify the value of one or more variables to produce a result (i.e.,ROUND(2.33333) produces the value 2). Operators are used to combine two items(i.e., the + operator combines Var1 and Var2 to produce a sum, as in
Var3=Var1+Var2). Functions and operators appear within commands and are usedfor common tasks that include extracting a year from a date, combining two numericvalues, or testing logical conditions. Almost all functions require arguments enclosedin parentheses and separated by commas. If arguments are required, do not placeany spaces between the function name and the left parenthesis. Syntax rules mustbe followed. Quotes that must enclose text strings are displayed in question orprompt dialog boxes. Parentheses must enclose arithmetic expressions and canexplicitly control the order of operations. Parentheses also enclose functionarguments.
Syntax Notations
The following rules apply when reading this manual and using syntax:
Syntax Explanation
ALL CAPITALS Epi Info commands and reserved words are
shown in all capital letters similar to theREAD command.
<parameter> A parameter is information to be supplied tothe command. Parameters are enclosed withless-than and greater-than symbols or anglebrackets < >. Each valid parameter isdescribed following the statement of syntaxfor the command. Parameters are requiredby the command unless enclosed in braces {}. Do not include the < > symbols in the code.
[<variable 1>] Brackets [ ] around a parameter indicatesthat there can potentially be more than oneparameter.
{<parameter>} Braces { } around a parameter indicate thatthe parameter is optional. Do not include the
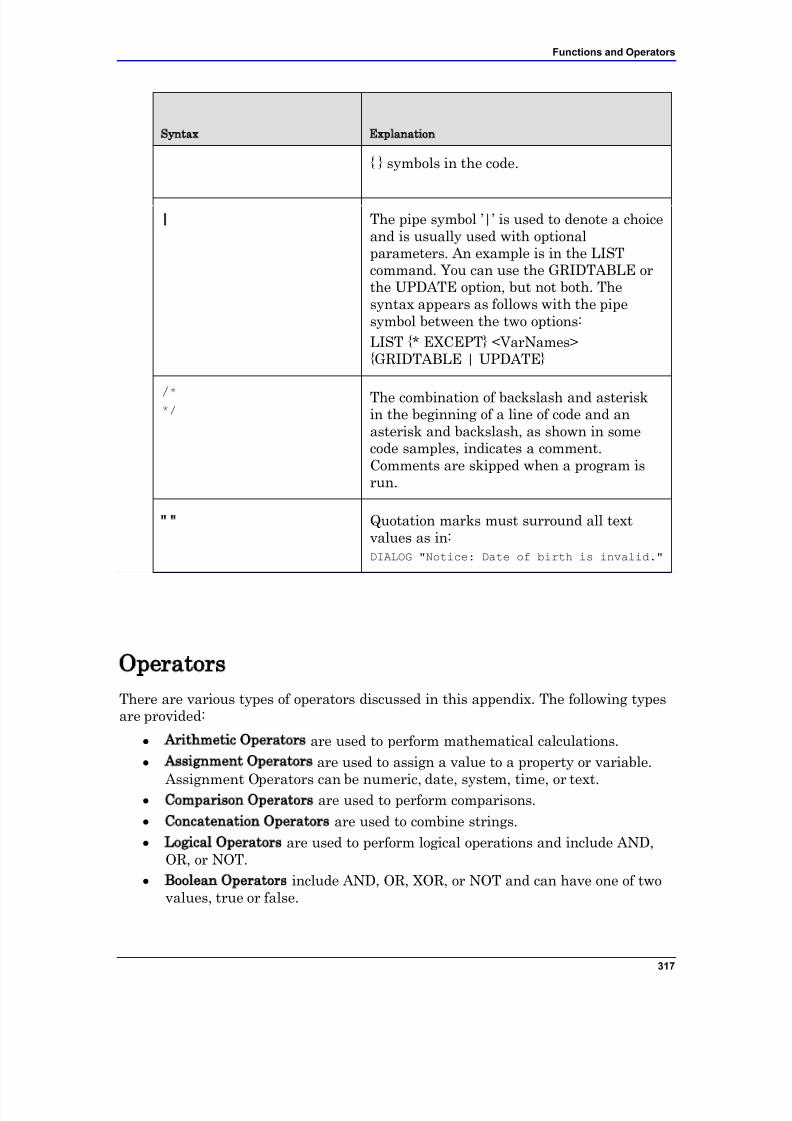
7/14/2019 Epi Info 7 User Guide-V1.0 Cleared
http://slidepdf.com/reader/full/epi-info-7-user-guide-v10-cleared-563109dd5013b 323/368
Functions and Operators
317
Syntax Explanation
{ } symbols in the code.
| The pipe symbol ‟|‟ is used to denote a choiceand is usually used with optionalparameters. An example is in the LISTcommand. You can use the GRIDTABLE orthe UPDATE option, but not both. Thesyntax appears as follows with the pipesymbol between the two options:
LIST {* EXCEPT} <VarNames>{GRIDTABLE | UPDATE}
/**/
The combination of backslash and asteriskin the beginning of a line of code and anasterisk and backslash, as shown in somecode samples, indicates a comment.Comments are skipped when a program isrun.
" " Quotation marks must surround all textvalues as in:DIALOG "Notice: Date of birth is invalid."
Operators
There are various types of operators discussed in this appendix. The following typesare provided:
Arithmetic Operators are used to perform mathematical calculations.
Assignment Operators are used to assign a value to a property or variable.
Assignment Operators can be numeric, date, system, time, or text. Comparison Operators are used to perform comparisons.
Concatenation Operators are used to combine strings.
Logical Operators are used to perform logical operations and include AND,OR, or NOT.
Boolean Operators include AND, OR, XOR, or NOT and can have one of twovalues, true or false.
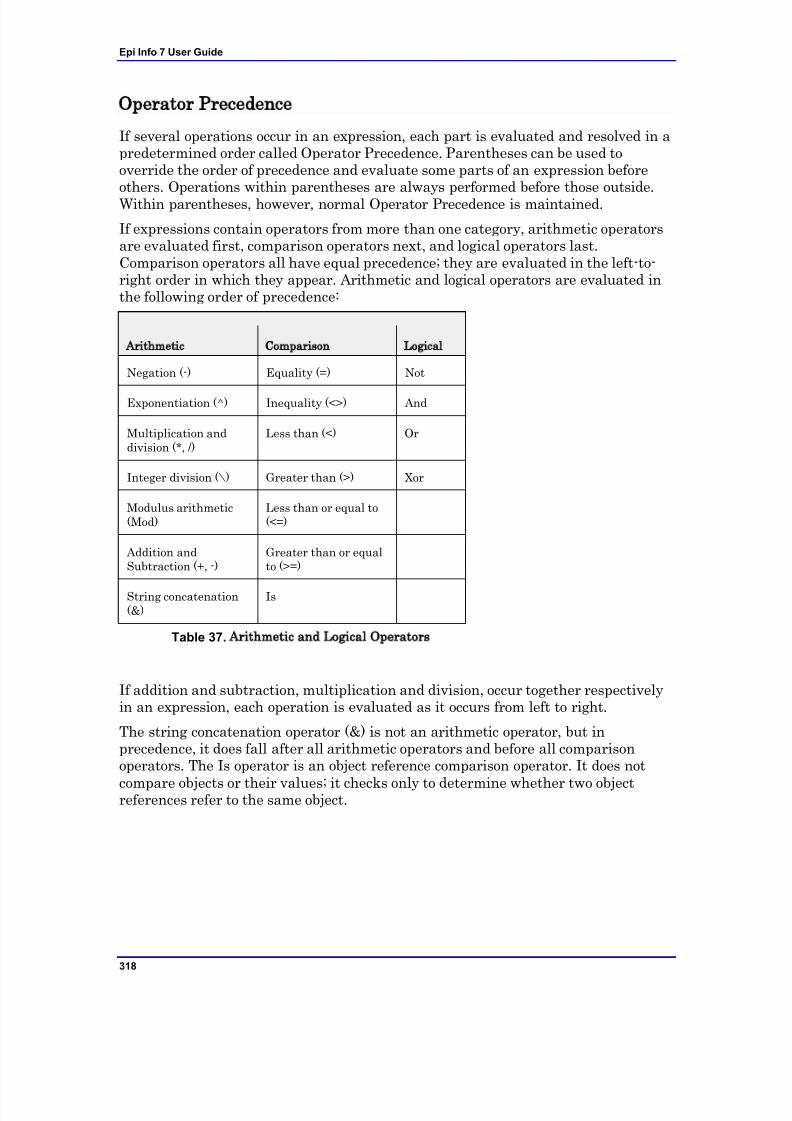
7/14/2019 Epi Info 7 User Guide-V1.0 Cleared
http://slidepdf.com/reader/full/epi-info-7-user-guide-v10-cleared-563109dd5013b 324/368
Epi Info 7 User Guide
318
Operator Precedence
If several operations occur in an expression, each part is evaluated and resolved in apredetermined order called Operator Precedence. Parentheses can be used tooverride the order of precedence and evaluate some parts of an expression beforeothers. Operations within parentheses are always performed before those outside.Within parentheses, however, normal Operator Precedence is maintained.
If expressions contain operators from more than one category, arithmetic operatorsare evaluated first, comparison operators next, and logical operators last.Comparison operators all have equal precedence; they are evaluated in the left-to-right order in which they appear. Arithmetic and logical operators are evaluated inthe following order of precedence:
Arithmetic Comparison Logical
Negation (-) Equality (=) Not
Exponentiation (^) Inequality (<>) And
Multiplication anddivision (*, /)
Less than (<) Or
Integer division (\) Greater than (>) Xor
Modulus arithmetic(Mod)
Less than or equal to(<=)
Addition andSubtraction (+, -)
Greater than or equalto (>=)
String concatenation(&)
Is
Table 37. Arithmetic and Logical Operators
If addition and subtraction, multiplication and division, occur together respectivelyin an expression, each operation is evaluated as it occurs from left to right.
The string concatenation operator (&) is not an arithmetic operator, but inprecedence, it does fall after all arithmetic operators and before all comparisonoperators. The Is operator is an object reference comparison operator. It does not
compare objects or their values; it checks only to determine whether two objectreferences refer to the same object.
7/14/2019 Epi Info 7 User Guide-V1.0 Cleared
http://slidepdf.com/reader/full/epi-info-7-user-guide-v10-cleared-563109dd5013b 325/368
Functions and Operators
319
& Ampersand
Description
This operator forces text string concatenation of two expressions. Text concatenationoperator connects or concatenates two values to produce a continuous text value.
Syntax
<expression> & <expression>
The <expression> represents any valid logical expression.
Whenever an expression is not a string, it is converted to a String subtype. If bothexpressions are Null, the result is Null. However, if only one expression is Null, thatexpression is treated as a zero-length string ("") when concatenated with the otherexpression. Any expression that is Empty is also treated as a zero-length string.
ExampleREAD {C:\My_Project_Folder \Sample\Sample.prj}:Oswego
DEFINE NameVar TEXTINPUT
ASSIGN NameVar=LastName&FirstName
LIST NameVar LastName FirstName
= Equal SignDescription
This operator assigns a value to a variable or property. Comparison operator alsoused as an equal to; the result of comparison operators is usually a logical value,either true or false.
Syntax
<variable> <operator> <value>
The <variable> represents any variable or any writable property.
The <value> represents any numeric or string literal, constant, orexpression.
Comments
7/14/2019 Epi Info 7 User Guide-V1.0 Cleared
http://slidepdf.com/reader/full/epi-info-7-user-guide-v10-cleared-563109dd5013b 326/368
Epi Info 7 User Guide
320
The name on the left side of the equal sign can be a simple scalar variable or anelement of an array. Properties on the left side of the equal sign can only be thosewritable properties at run time.
Example
READ {C:\My_Project_Folder \Sample\Sample.prj}:Oswego
DEFINE Newvar NUMERIC
ASSIGN Newvar =Age
LIST Newvar Age
Addition (+)
Description
This operator provides the sums of two numbers. Basic arithmetic operator used foraddition; the result of an arithmetic operator is usually a numeric value.
Syntax
[expression1] <operator> [expression2]
Comments
Although the + operator can be used to concatenate two character strings, the &operator should be used for concatenation to eliminate ambiguity and provide self-documenting code. If + operator is used, there may be no way to determine whetheraddition or string concatenation will occur. The underlying subtype of theexpressions determines the behavior of the + operator in the following way:
IfThen
Both expressions are numeric Add
Both expressions are strings Concatenate
One expression is numeric and theother is a string
Add
If one or both expressions are Null expressions, the result is Null. If bothexpressions are Empty, the result is an integer subtype. However, if only oneexpression is Empty, the other expression is returned unchanged as a result.
Example
READ {C:\My_Project_Folder \Sample\Sample.prj}:Oswego
DEFINE Newvar NUMERIC
ASSIGN Newvar = Age + 5
7/14/2019 Epi Info 7 User Guide-V1.0 Cleared
http://slidepdf.com/reader/full/epi-info-7-user-guide-v10-cleared-563109dd5013b 327/368
Functions and Operators
321
LIST Age Newvar
AND
Description
This operator performs logical conjunction on two Boolean expressions. If bothexpressions evaluate to True, the AND operator returns True. If either or bothexpressions evaluate to False, the AND operator returns False.
Syntax
[Logical Expression] AND [Logical Expression]
Comments
The expression is any valid logical expression in Epi Info.
Example
READ {C:\My_Project_Folder \Sample\Sample.prj}:Smoke
DEFINE Result TEXTINPUT
IF Age > 75 AND Sex = 2 THEN
ASSIGN Result="Senior"
END
SELECT Result = "Senior"
LIST Result Age Sex
In this case, the value of "Senior" is assigned to all records that meet both criteria Age>65 and Sex=2.
ARITHMETIC
Description
These basic arithmetic operators can be used in combination with other commands.The result is a numeric value.
Syntax
[Expression] <Operator> [Expression]
[Expression] is a numeric value or a variable containing data innumeric format.
7/14/2019 Epi Info 7 User Guide-V1.0 Cleared
http://slidepdf.com/reader/full/epi-info-7-user-guide-v10-cleared-563109dd5013b 328/368
Epi Info 7 User Guide
322
Comments
The results are expressed in numeric format. The basic mathematical operators thatcan be used in Epi Info are as follows:
Addition + Basic arithmetic operator used for addition; the result of an
arithmetic operator is usually a numeric value (i.e., EX. 3 + 3). Subtraction - (Used for subtraction or negation.) Basic arithmetic
operator used for subtraction or negation; the result of an arithmeticoperator is usually a numeric value (i.e., EX. 3 – 1).
Multiplication * (Asterisk) Basic arithmetic operator used formultiplication; the result of an arithmetic operator is usually anumeric value.
Division / Basic arithmetic operator used for division; the result of anarithmetic operator is usually a numeric value.
Exponentiation ̂
Modulus or Remainder MOD
Arithmetic operators are shown in descending order of precedence. Parentheses canbe used to control the order in which operators are evaluated. The default order,however, frequently achieves the correct result.
While it is possible to do date math with dates considered as a number of days (e.g.,IncubationDays = SymptomDateTime - ExposureDateTime), the behavior of thedatabase services underlying Epi Info makes it more efficient to use time intervalfunctions (e.g., IncubationDays = MINUTES(ExposureDateTime, SymptomDateTime)/[24*60]). For doing date math, the following rules apply:
Date + Date produces Date
Date - Date produces DaysDate * Date not permitted
Date / Date not permitted
Date ^ Date not permitted
Date + Number produces Date
Number + Date produces Number
The last two rules apply as well to other math operations: -, *, /, ^
The "zero day" for date math is December 30, 1899.
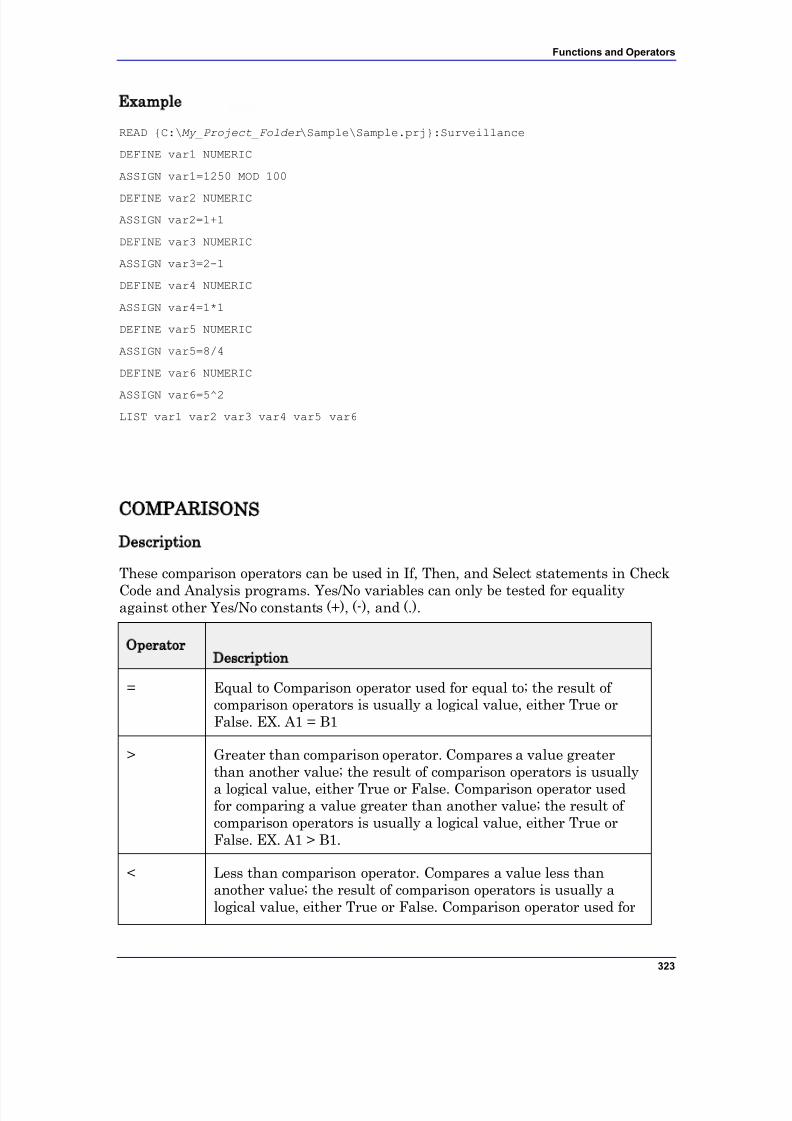
7/14/2019 Epi Info 7 User Guide-V1.0 Cleared
http://slidepdf.com/reader/full/epi-info-7-user-guide-v10-cleared-563109dd5013b 329/368
Functions and Operators
323
Example
READ {C:\My_Project_Folder \Sample\Sample.prj}:Surveillance
DEFINE var1 NUMERIC
ASSIGN var1=1250 MOD 100
DEFINE var2 NUMERIC
ASSIGN var2=1+1
DEFINE var3 NUMERIC
ASSIGN var3=2-1
DEFINE var4 NUMERIC
ASSIGN var4=1*1
DEFINE var5 NUMERIC
ASSIGN var5=8/4
DEFINE var6 NUMERIC
ASSIGN var6=5^2
LIST var1 var2 var3 var4 var5 var6
COMPARISONS
Description
These comparison operators can be used in If, Then, and Select statements in Check
Code and Analysis programs. Yes/No variables can only be tested for equalityagainst other Yes/No constants (+), (-), and (.).
OperatorDescription
= Equal to Comparison operator used for equal to; the result of comparison operators is usually a logical value, either True orFalse. EX. A1 = B1
> Greater than comparison operator. Compares a value greaterthan another value; the result of comparison operators is usually
a logical value, either True or False. Comparison operator usedfor comparing a value greater than another value; the result of comparison operators is usually a logical value, either True orFalse. EX. A1 > B1.
< Less than comparison operator. Compares a value less thananother value; the result of comparison operators is usually alogical value, either True or False. Comparison operator used for
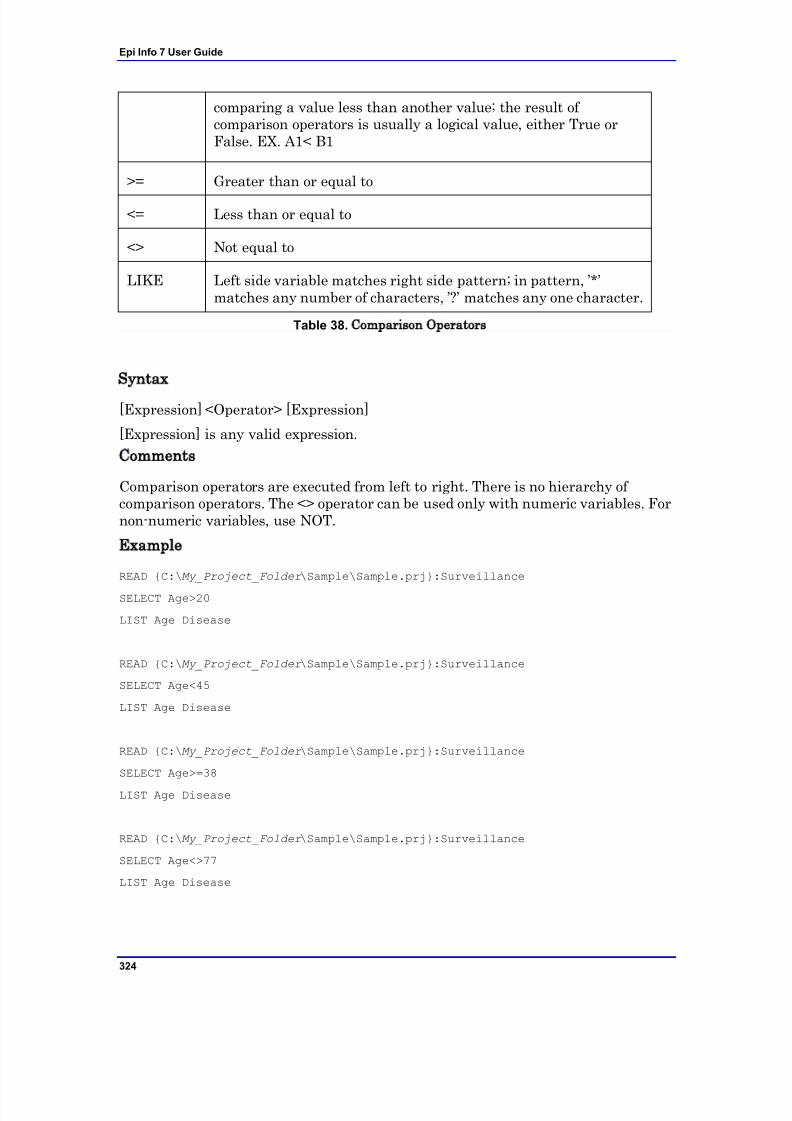
7/14/2019 Epi Info 7 User Guide-V1.0 Cleared
http://slidepdf.com/reader/full/epi-info-7-user-guide-v10-cleared-563109dd5013b 330/368
Epi Info 7 User Guide
324
comparing a value less than another value; the result of comparison operators is usually a logical value, either True orFalse. EX. A1< B1
>= Greater than or equal to
<= Less than or equal to
<> Not equal to
LIKE Left side variable matches right side pattern; in pattern, ‟*‟matches any number of characters, ‟?‟ matches any one character.
Table 38. Comparison Operators
Syntax
[Expression] <Operator> [Expression]
[Expression] is any valid expression.
Comments
Comparison operators are executed from left to right. There is no hierarchy of comparison operators. The <> operator can be used only with numeric variables. Fornon-numeric variables, use NOT.
Example
READ {C:\My_Project_Folder \Sample\Sample.prj}:Surveillance
SELECT Age>20
LIST Age Disease
READ {C:\My_Project_Folder \Sample\Sample.prj}:Surveillance
SELECT Age<45
LIST Age Disease
READ {C:\My_Project_Folder \Sample\Sample.prj}:Surveillance
SELECT Age>=38
LIST Age Disease
READ {C:\My_Project_Folder \Sample\Sample.prj}:Surveillance
SELECT Age<>77
LIST Age Disease
7/14/2019 Epi Info 7 User Guide-V1.0 Cleared
http://slidepdf.com/reader/full/epi-info-7-user-guide-v10-cleared-563109dd5013b 331/368
Functions and Operators
325
LIKE Operator
Description
This operator is used with the SELECT command to locate subsets of informationusing a wildcard search. LIKE can be used only to locate data in text variables and
uses asterisks (*) to define the select value. It can also be used to create IF/THENstatements.
Syntax
SELECT <variable> LIKE "*value*"
SELECT <variable> LIKE "*val*"
SELECT <variable> LIKE "v*"
SELECT <variable> LIKE "*v"
The select variable must be a text type. The value can be a whole or
partial text value. Text variables must be enclosed in quotes.Comments
The results appear in the Output window. Use LIST to view the selected records.
Examples
READ {C:\My_Project_Folder \Sample\Sample.prj}:Surveillance
DEFINE Sick NUMERIC
IF Disease LIKE "h*" THEN
ASSIGN Sick = 0
ENDSELECT Disease LIKE "h*"
LIST Age Disease DateAdmitted Sick GRIDTABLE
NOT
Description
This operator reverses the True or False value of the logical expression that follows.
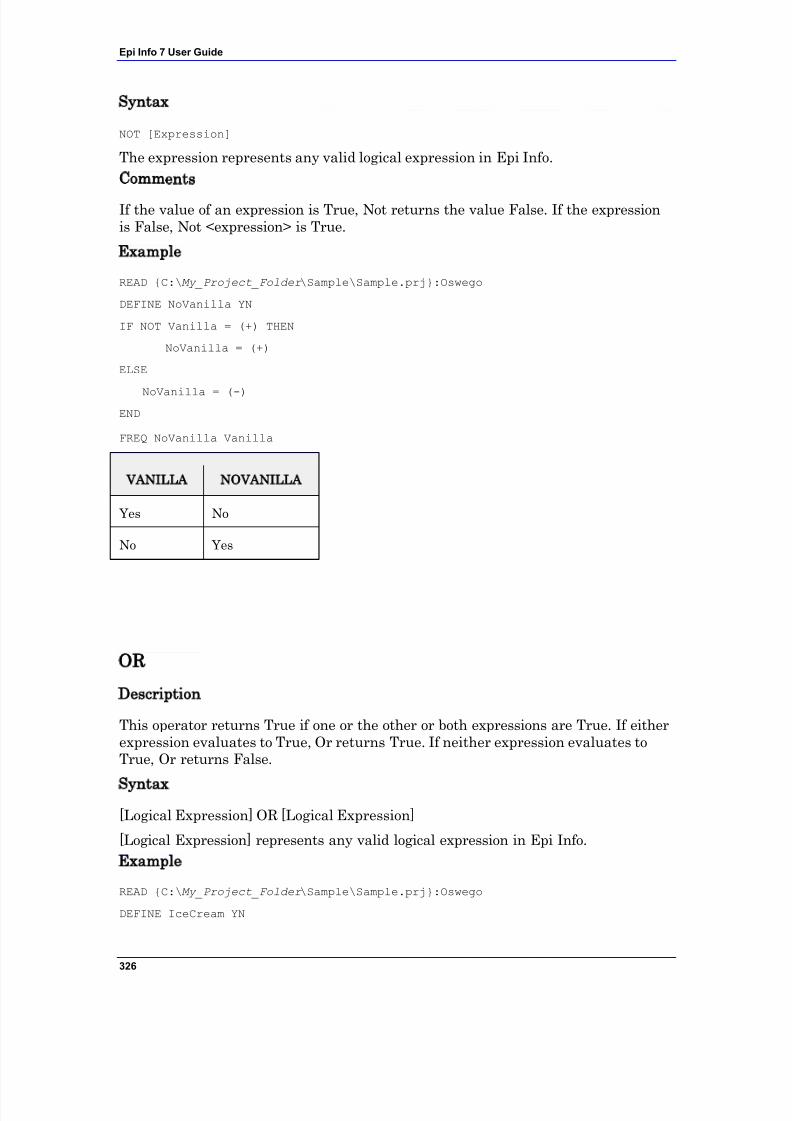
7/14/2019 Epi Info 7 User Guide-V1.0 Cleared
http://slidepdf.com/reader/full/epi-info-7-user-guide-v10-cleared-563109dd5013b 332/368
Epi Info 7 User Guide
326
Syntax
NOT [Expression]
The expression represents any valid logical expression in Epi Info.
Comments
If the value of an expression is True, Not returns the value False. If the expressionis False, Not <expression> is True.
Example
READ {C:\My_Project_Folder \Sample\Sample.prj}:Oswego
DEFINE NoVanilla YN
IF NOT Vanilla = (+) THEN
NoVanilla = (+)
ELSE
NoVanilla = (-)
END
FREQ NoVanilla Vanilla
OR
Description
This operator returns True if one or the other or both expressions are True. If eitherexpression evaluates to True, Or returns True. If neither expression evaluates toTrue, Or returns False.
Syntax
[Logical Expression] OR [Logical Expression]
[Logical Expression] represents any valid logical expression in Epi Info.
Example
READ {C:\My_Project_Folder \Sample\Sample.prj}:Oswego
DEFINE IceCream YN
VANILLA NOVANILLA
Yes No
No Yes
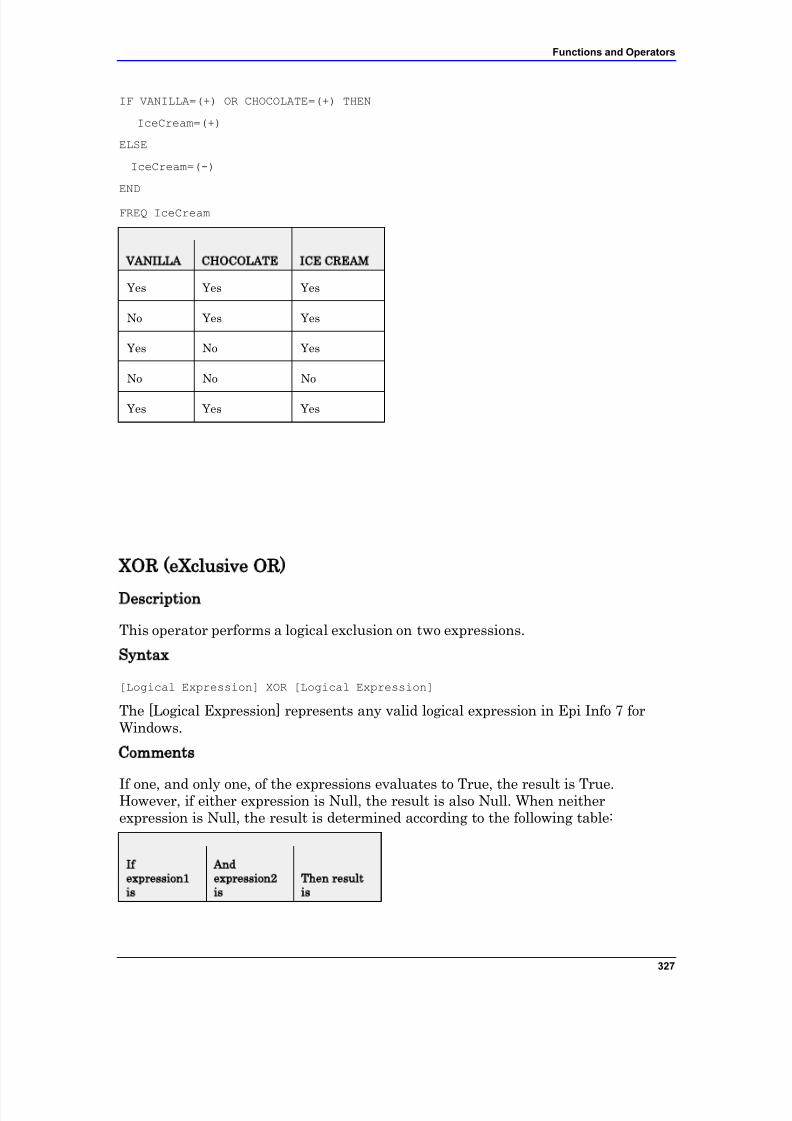
7/14/2019 Epi Info 7 User Guide-V1.0 Cleared
http://slidepdf.com/reader/full/epi-info-7-user-guide-v10-cleared-563109dd5013b 333/368
Functions and Operators
327
IF VANILLA=(+) OR CHOCOLATE=(+) THEN
IceCream=(+)
ELSE
IceCream=(-)
END
FREQ IceCream
VANILLA CHOCOLATE ICE CREAM
Yes Yes Yes
No Yes Yes
Yes No Yes
No No No
Yes Yes Yes
XOR (eXclusive OR)
Description
This operator performs a logical exclusion on two expressions.
Syntax
[Logical Expression] XOR [Logical Expression]
The [Logical Expression] represents any valid logical expression in Epi Info 7 forWindows.
Comments
If one, and only one, of the expressions evaluates to True, the result is True.However, if either expression is Null, the result is also Null. When neitherexpression is Null, the result is determined according to the following table:
Ifexpression1is
Andexpression2is
Then resultis
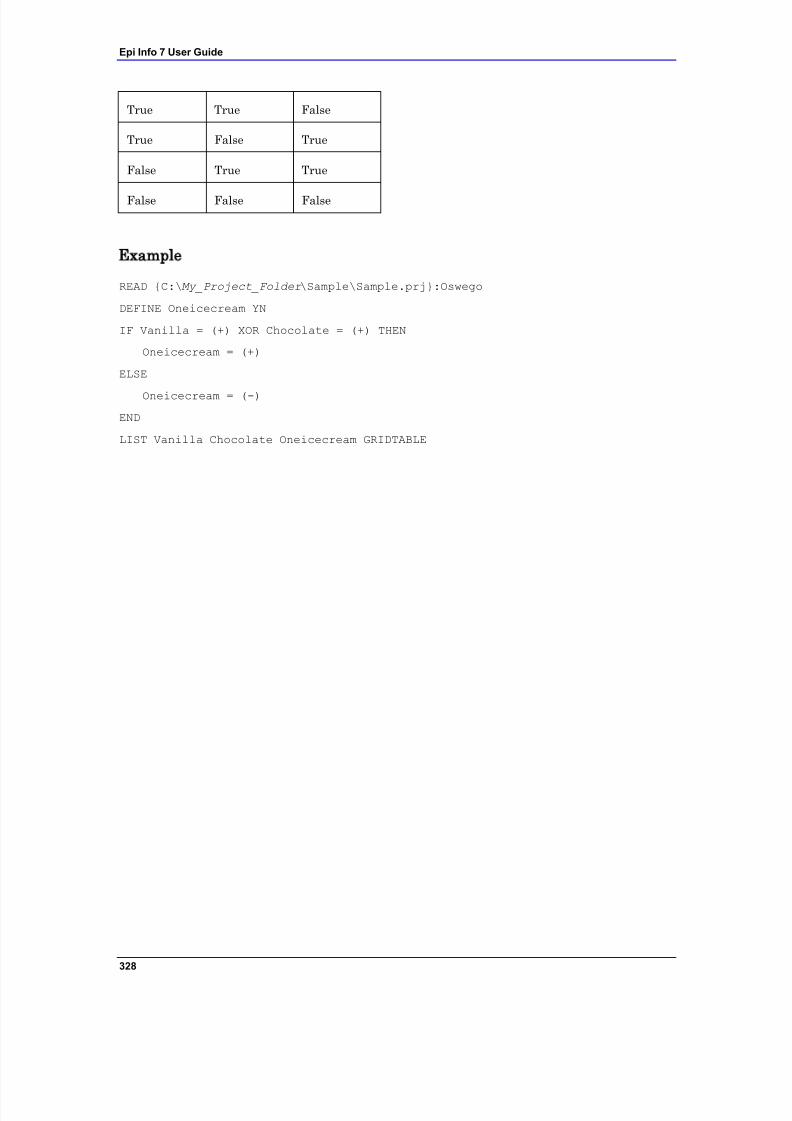
7/14/2019 Epi Info 7 User Guide-V1.0 Cleared
http://slidepdf.com/reader/full/epi-info-7-user-guide-v10-cleared-563109dd5013b 334/368
Epi Info 7 User Guide
328
True True False
True False True
False True True
False False False
Example
READ {C:\My_Project_Folder \Sample\Sample.prj}:Oswego
DEFINE Oneicecream YN
IF Vanilla = (+) XOR Chocolate = (+) THEN
Oneicecream = (+)
ELSE
Oneicecream = (-)
END
LIST Vanilla Chocolate Oneicecream GRIDTABLE
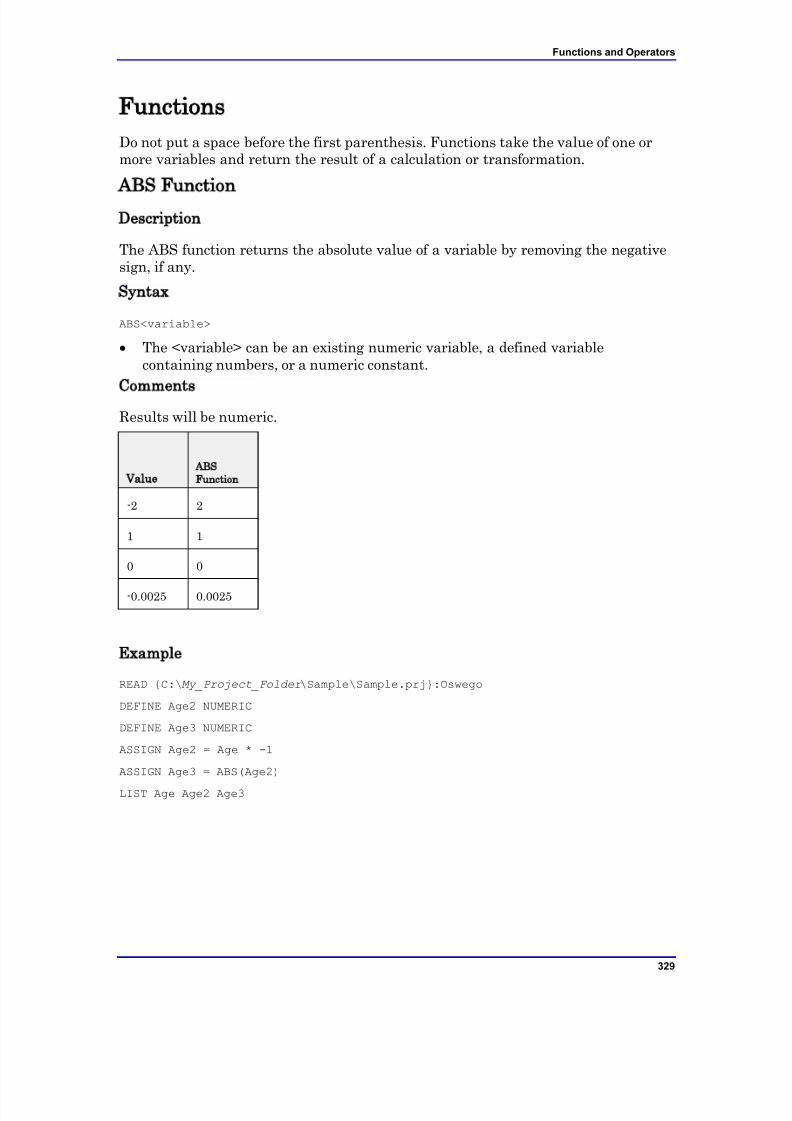
7/14/2019 Epi Info 7 User Guide-V1.0 Cleared
http://slidepdf.com/reader/full/epi-info-7-user-guide-v10-cleared-563109dd5013b 335/368
Functions and Operators
329
Functions
Do not put a space before the first parenthesis. Functions take the value of one ormore variables and return the result of a calculation or transformation.
ABS Function
Description
The ABS function returns the absolute value of a variable by removing the negativesign, if any.
Syntax
ABS<variable>
The <variable> can be an existing numeric variable, a defined variablecontaining numbers, or a numeric constant.
CommentsResults will be numeric.
ValueABSFunction
-2 2
1 1
0 0
-0.0025 0.0025
Example
READ {C:\My_Project_Folder \Sample\Sample.prj}:Oswego
DEFINE Age2 NUMERIC
DEFINE Age3 NUMERIC
ASSIGN Age2 = Age * -1
ASSIGN Age3 = ABS(Age2)
LIST Age Age2 Age3
7/14/2019 Epi Info 7 User Guide-V1.0 Cleared
http://slidepdf.com/reader/full/epi-info-7-user-guide-v10-cleared-563109dd5013b 336/368
Epi Info 7 User Guide
330
DAY
Description
The DAY function extracts the day from the date.
SyntaxDAY (<variable>)
The <variable> is in date format.
Comments
If the date is stored in a text variable, the function will not be processed, and will benull.
Example
READ {C:\My_Project_Folder \Sample\Sample.prj}:Oswego
DEFINE CurrentDay NUMERIC
ASSIGN CurrentDay = DAY(01/15/2007)
LIST CurrentDay
DAYS
Description
The DAYS function returns the number of days between <var2> and <var1>. If anyof the variables or values included in the formula is not a date, the result will benull.
Syntax
DAYS(<var1>, <var2>)
The <variable> is in a date format.
CommentsIf the date stored in <var1> is more recent than that in <var2>, the result is thedifference in days expressed as a negative number.
Example
READ {C:\My_Project_Folder \Sample\Sample.prj}:Oswego
DEFINE SickDays NUMERIC
7/14/2019 Epi Info 7 User Guide-V1.0 Cleared
http://slidepdf.com/reader/full/epi-info-7-user-guide-v10-cleared-563109dd5013b 337/368
Functions and Operators
331
ASSIGN SickDays = DAYS(04/18/1940, DateOnset)
LIST SickDays GRIDTABLE
EXISTSDescription
This function returns True if a file exists. Otherwise, it returns False.
Syntax
EXISTS(<variable>)
<variable> represents the complete file path and name in text format.
Comments
If you do not have permission to access the file, a False may be returned.
Example
READ {C:\My_Project_Folder \Sample\Sample.prj}:Oswego
DEFINE var1 TEXTINPUT
ASSIGN var1="C:\epi_info\epimap.exe"
IF EXISTS(Var1) =(+) then
DIALOG "Hello"
END
IF Exists("C:\Epi_Info\EpiInfo.mnu")=(+) then
DIALOG "File epiInfo.mnu exists"
END
EXP
Description
This function raises the base of the natural logarithm (e) to the power specified.
Syntax
EXP(<variable>)
Comments
This variable can be an existing numeric variable, a defined variable containingnumbers, or a numeric constant.
7/14/2019 Epi Info 7 User Guide-V1.0 Cleared
http://slidepdf.com/reader/full/epi-info-7-user-guide-v10-cleared-563109dd5013b 338/368
Epi Info 7 User Guide
332
Example
READ {C:\My_Project_Folder \Sample\Sample.prj}:Oswego
DEFINE ExpA NUMERIC
ASSIGN ExpA=EXP(Age)
LIST ExpA Age
FILEDATE
Description
This function returns the date a file was last modified or created. If FILEDATE isspecified with a file path that lacks a directory, the current directory is used. If FILEDATE is specified without a file, or with a file that does not exist, the functionreturns missing.
Syntax
FILEDATE(<variable>)
The <variable> represents the complete file path and the name is text format.
Comments
This function is useful when several users are updating a large database.
Example
READ {C:\My_Project_Folder \Sample\Sample.prj}:RHepatitis
DEFINE NewUpdate DATEFORMAT
ASSIGN NewUpdate=FILEDATE("C:\epi_info\Sample.mdb")
IF FILEDATE("C:\epi_info\Sample.mdb") > NewUpdate THEN
DIALOG "This information may be out of date. Please check the source."
TITLETEXT="Warning"
END
LIST NewUpdate
FINDTEXT
Description
This function returns the position in a variable in which the string is located.
Syntax
FINDTEXT(<variable1>,<variable2>)
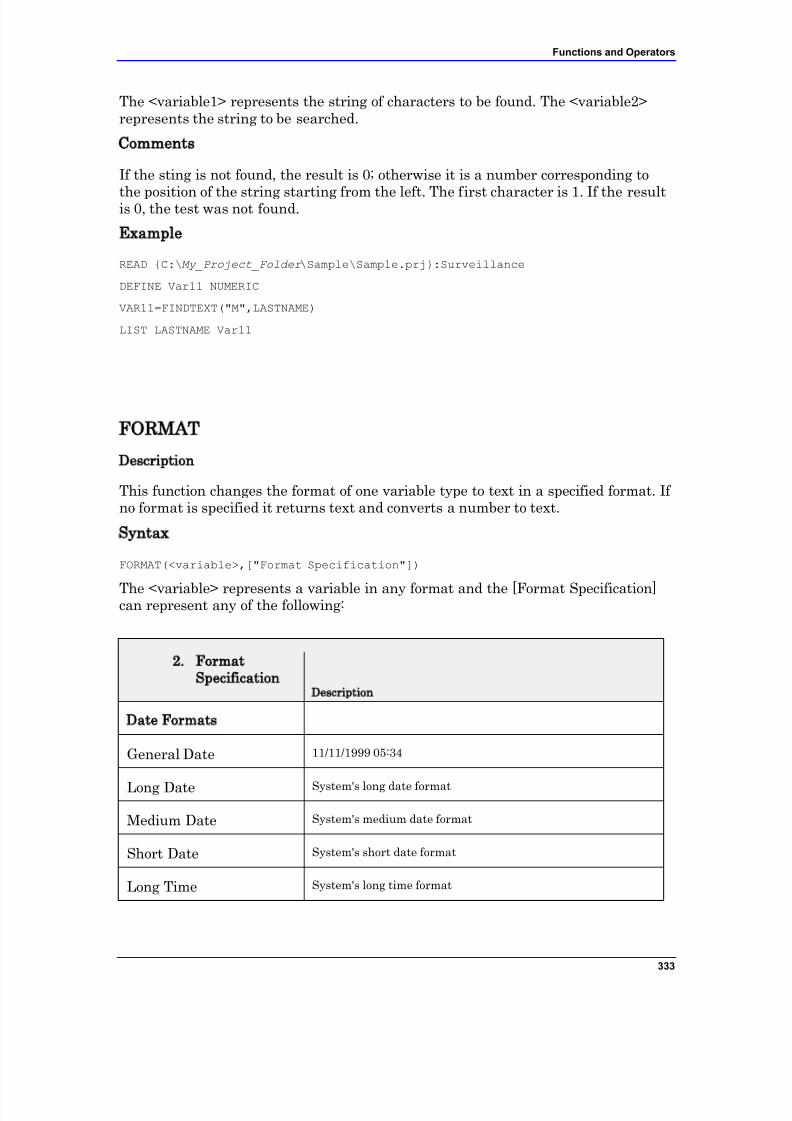
7/14/2019 Epi Info 7 User Guide-V1.0 Cleared
http://slidepdf.com/reader/full/epi-info-7-user-guide-v10-cleared-563109dd5013b 339/368
Functions and Operators
333
The <variable1> represents the string of characters to be found. The <variable2>represents the string to be searched.
Comments
If the sting is not found, the result is 0; otherwise it is a number corresponding to
the position of the string starting from the left. The first character is 1. If the resultis 0, the test was not found.
Example
READ {C:\My_Project_Folder \Sample\Sample.prj}:Surveillance
DEFINE Var11 NUMERIC
VAR11=FINDTEXT("M",LASTNAME)
LIST LASTNAME Var11
FORMAT
Description
This function changes the format of one variable type to text in a specified format. If no format is specified it returns text and converts a number to text.
Syntax
FORMAT(<variable>,["Format Specification"])
The <variable> represents a variable in any format and the [Format Specification]can represent any of the following:
2. FormatSpecification
Description
Date Formats
General Date 11/11/1999 05:34
Long Date System's long date format
Medium Date System's medium date format
Short Date System's short date format
Long Time System's long time format
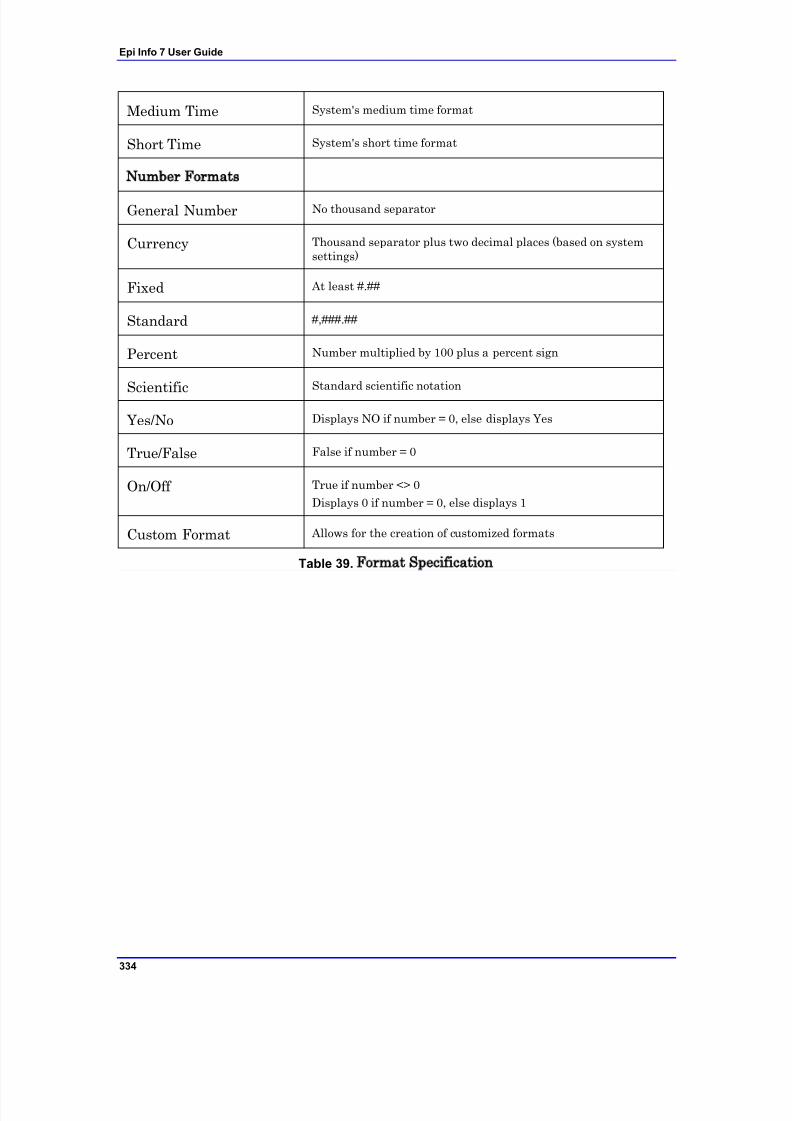
7/14/2019 Epi Info 7 User Guide-V1.0 Cleared
http://slidepdf.com/reader/full/epi-info-7-user-guide-v10-cleared-563109dd5013b 340/368
Epi Info 7 User Guide
334
Medium Time System's medium time format
Short Time System's short time format
Number Formats
General Number No thousand separator
Currency Thousand separator plus two decimal places (based on systemsettings)
Fixed At least #.##
Standard #,###.##
Percent Number multiplied by 100 plus a percent sign
ScientificStandard scientific notation
Yes/No Displays NO if number = 0, else displays Yes
True/False False if number = 0
On/Off True if number <> 0
Displays 0 if number = 0, else displays 1
Custom Format Allows for the creation of customized formats
Table 39. Format Specification
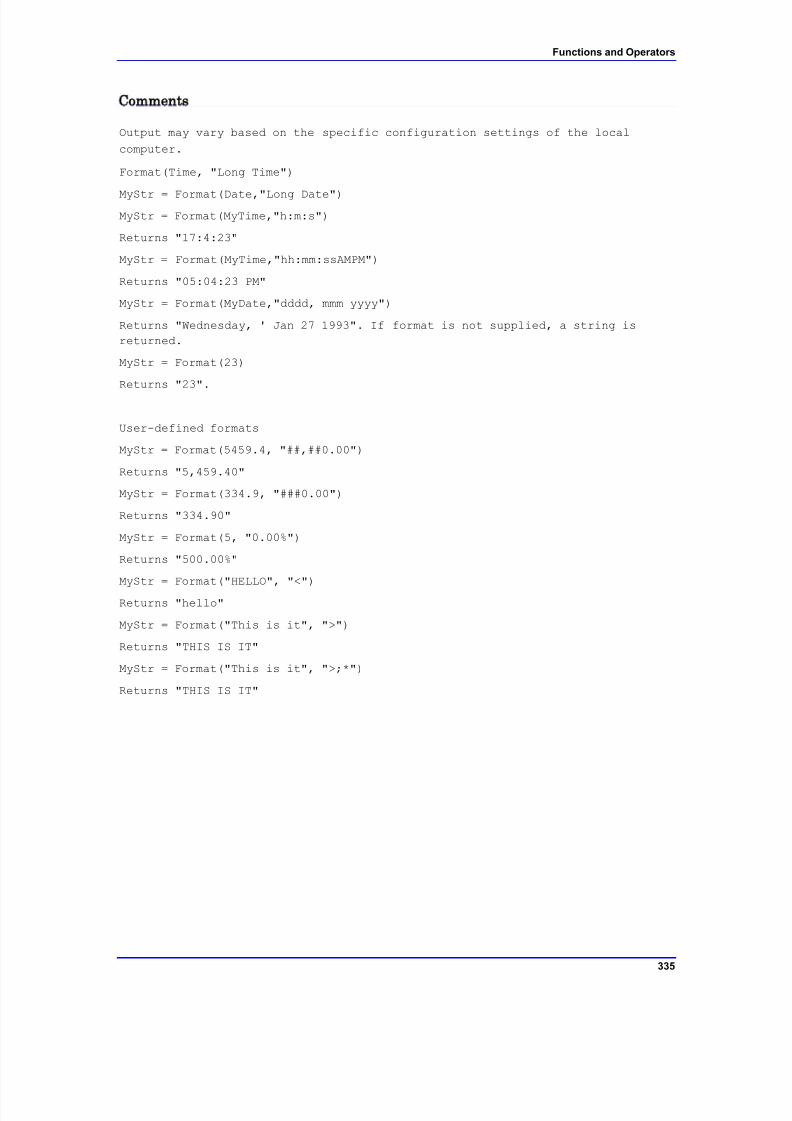
7/14/2019 Epi Info 7 User Guide-V1.0 Cleared
http://slidepdf.com/reader/full/epi-info-7-user-guide-v10-cleared-563109dd5013b 341/368
Functions and Operators
335
Comments
Output may vary based on the specific configuration settings of the local
computer.
Format(Time, "Long Time")
MyStr = Format(Date,"Long Date")
MyStr = Format(MyTime,"h:m:s")
Returns "17:4:23"
MyStr = Format(MyTime,"hh:mm:ssAMPM")
Returns "05:04:23 PM"
MyStr = Format(MyDate,"dddd, mmm yyyy")
Returns "Wednesday, ' Jan 27 1993". If format is not supplied, a string is
returned.
MyStr = Format(23)
Returns "23".
User-defined formats
MyStr = Format(5459.4, "##,##0.00")
Returns "5,459.40"
MyStr = Format(334.9, "###0.00")
Returns "334.90"
MyStr = Format(5, "0.00%")
Returns "500.00%"
MyStr = Format("HELLO", "<")
Returns "hello"
MyStr = Format("This is it", ">")
Returns "THIS IS IT"
MyStr = Format("This is it", ">;*")
Returns "THIS IS IT"
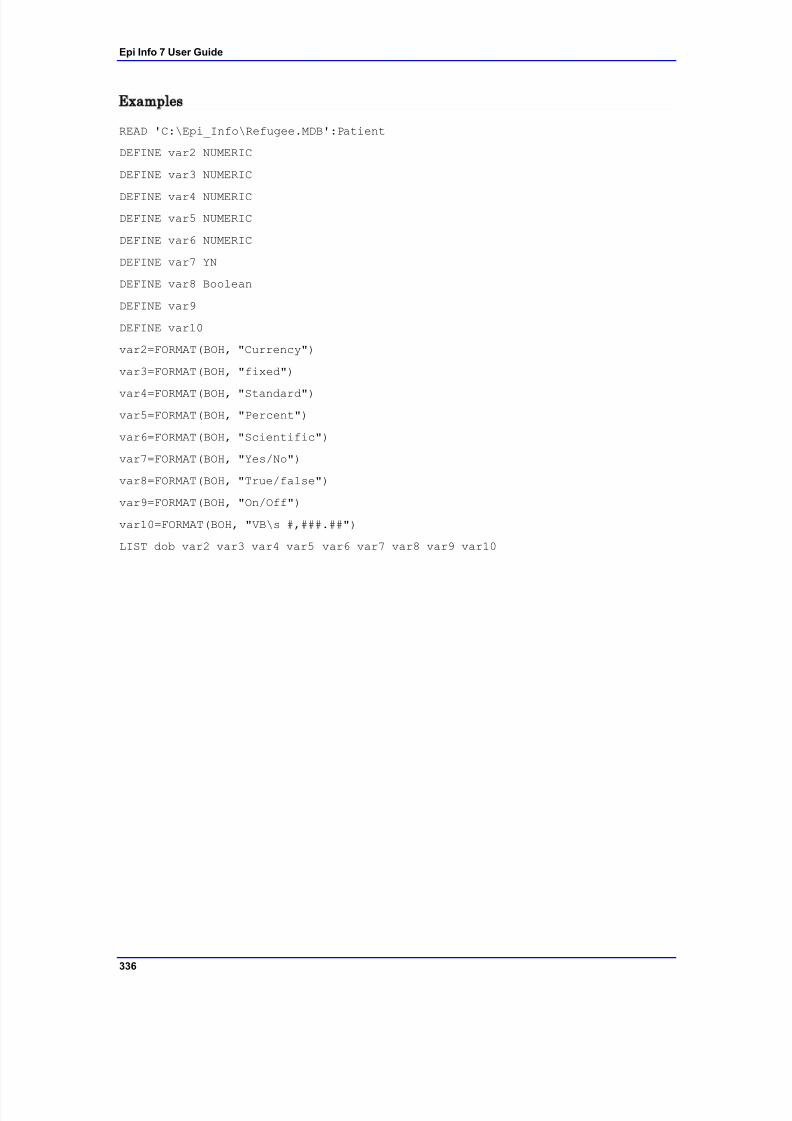
7/14/2019 Epi Info 7 User Guide-V1.0 Cleared
http://slidepdf.com/reader/full/epi-info-7-user-guide-v10-cleared-563109dd5013b 342/368
Epi Info 7 User Guide
336
Examples
READ 'C:\Epi_Info\Refugee.MDB':Patient
DEFINE var2 NUMERIC
DEFINE var3 NUMERIC
DEFINE var4 NUMERIC
DEFINE var5 NUMERIC
DEFINE var6 NUMERIC
DEFINE var7 YN
DEFINE var8 Boolean
DEFINE var9
DEFINE var10
var2=FORMAT(BOH, "Currency")
var3=FORMAT(BOH, "fixed")
var4=FORMAT(BOH, "Standard")
var5=FORMAT(BOH, "Percent")
var6=FORMAT(BOH, "Scientific")
var7=FORMAT(BOH, "Yes/No")
var8=FORMAT(BOH, "True/false")
var9=FORMAT(BOH, "On/Off")
var10=FORMAT(BOH, "VB\s #,###.##")
LIST dob var2 var3 var4 var5 var6 var7 var8 var9 var10
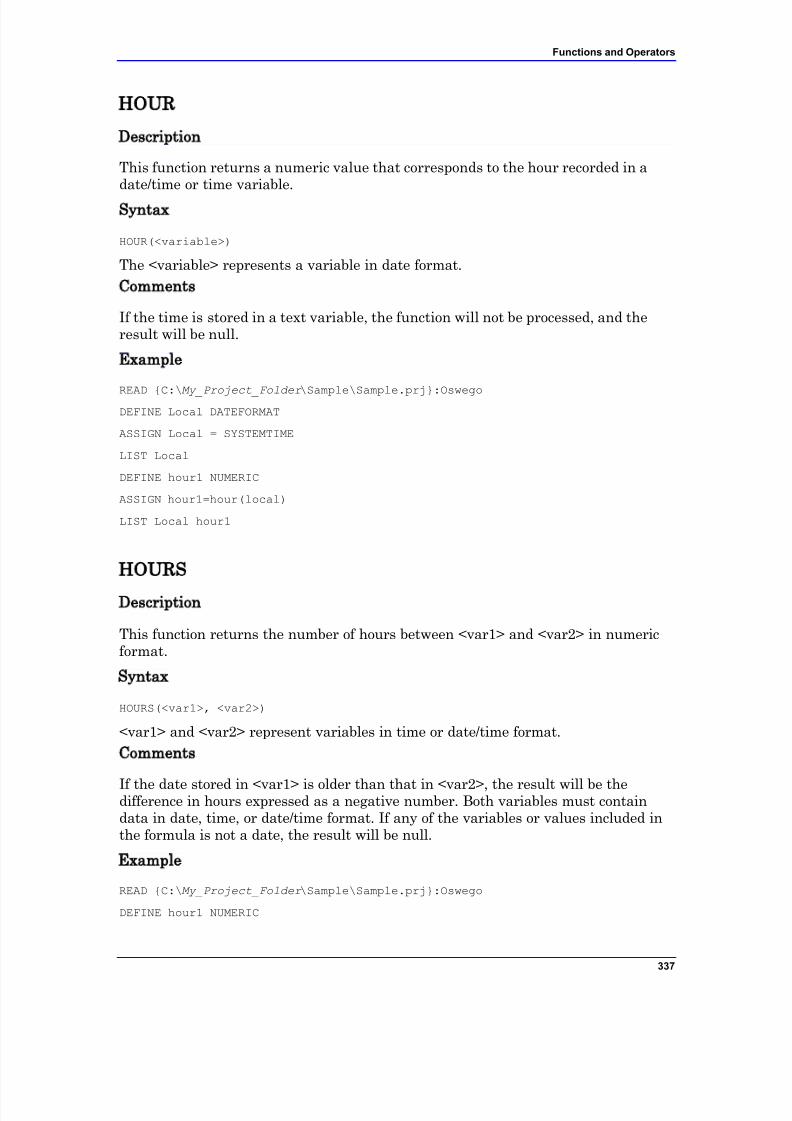
7/14/2019 Epi Info 7 User Guide-V1.0 Cleared
http://slidepdf.com/reader/full/epi-info-7-user-guide-v10-cleared-563109dd5013b 343/368
Functions and Operators
337
HOUR
Description
This function returns a numeric value that corresponds to the hour recorded in adate/time or time variable.
Syntax
HOUR(<variable>)
The <variable> represents a variable in date format.
Comments
If the time is stored in a text variable, the function will not be processed, and theresult will be null.
Example
READ {C:\My_Project_Folder \Sample\Sample.prj}:Oswego
DEFINE Local DATEFORMAT
ASSIGN Local = SYSTEMTIME
LIST Local
DEFINE hour1 NUMERIC
ASSIGN hour1=hour(local)
LIST Local hour1
HOURS
Description
This function returns the number of hours between <var1> and <var2> in numericformat.
Syntax
HOURS(<var1>, <var2>)
<var1> and <var2> represent variables in time or date/time format.
Comments
If the date stored in <var1> is older than that in <var2>, the result will be thedifference in hours expressed as a negative number. Both variables must containdata in date, time, or date/time format. If any of the variables or values included inthe formula is not a date, the result will be null.
Example
READ {C:\My_Project_Folder \Sample\Sample.prj}:Oswego
DEFINE hour1 NUMERIC
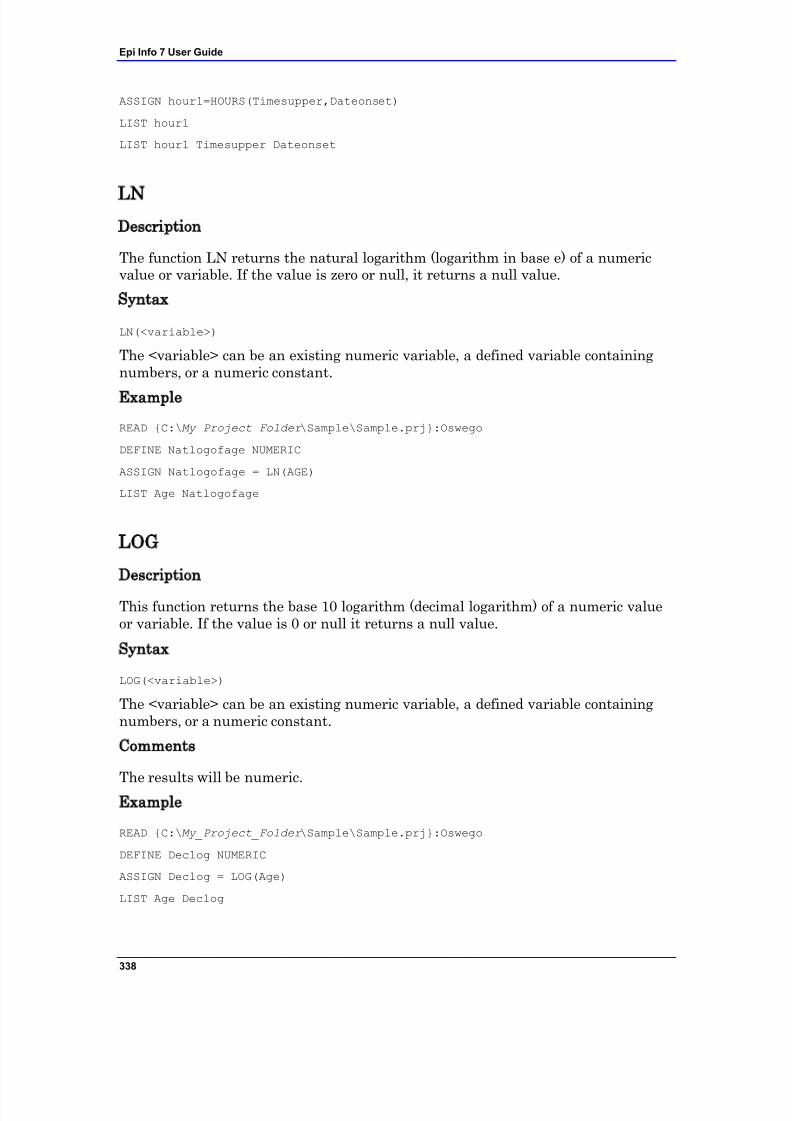
7/14/2019 Epi Info 7 User Guide-V1.0 Cleared
http://slidepdf.com/reader/full/epi-info-7-user-guide-v10-cleared-563109dd5013b 344/368
Epi Info 7 User Guide
338
ASSIGN hour1=HOURS(Timesupper,Dateonset)
LIST hour1
LIST hour1 Timesupper Dateonset
LNDescription
The function LN returns the natural logarithm (logarithm in base e) of a numericvalue or variable. If the value is zero or null, it returns a null value.
Syntax
LN(<variable>)
The <variable> can be an existing numeric variable, a defined variable containingnumbers, or a numeric constant.
Example
READ {C:\My_Project_Folder \Sample\Sample.prj}:Oswego
DEFINE Natlogofage NUMERIC
ASSIGN Natlogofage = LN(AGE)
LIST Age Natlogofage
LOG
Description
This function returns the base 10 logarithm (decimal logarithm) of a numeric valueor variable. If the value is 0 or null it returns a null value.
Syntax
LOG(<variable>)
The <variable> can be an existing numeric variable, a defined variable containingnumbers, or a numeric constant.
Comments
The results will be numeric.
Example
READ {C:\My_Project_Folder \Sample\Sample.prj}:Oswego
DEFINE Declog NUMERIC
ASSIGN Declog = LOG(Age)
LIST Age Declog
7/14/2019 Epi Info 7 User Guide-V1.0 Cleared
http://slidepdf.com/reader/full/epi-info-7-user-guide-v10-cleared-563109dd5013b 345/368
Functions and Operators
339
MINUTES
Description
This function returns the number of minutes between <var1> and <var2> innumeric format.
Syntax
MINUTES(<var1>, <var2>)
<var1> and <var2> represent variables in time or date/time format.
Comments
If the date stored in <var1> is older the one in <var2>, the result will be thedifference in minutes expressed as a negative number. Both variables must containdata in date, time, or date/time format. If any of the variables or values included inthe formula is not a date, the result will be null.
Example
READ {C:\My_Project_Folder \Sample\Sample.prj}:Oswego
DEFINE Min1 NUMERIC
ASSIGN Min1=MINUTES(timesupper,dateonset)
LIST Min1
MONTH
Description
This function extracts the month from the date.
Syntax
MONTH(<variable>)
The <variable> represents a variable in date format.
Comments
If the date is stored in a text variable, the function will not be processed, and theresult will be null.
7/14/2019 Epi Info 7 User Guide-V1.0 Cleared
http://slidepdf.com/reader/full/epi-info-7-user-guide-v10-cleared-563109dd5013b 346/368
Epi Info 7 User Guide
340
Example
READ {C:\My_Project_Folder \Sample\Sample.prj}:Oswego
DEFINE CurrMonth NUMERIC
ASSIGN CurrMonth = MONTH(01/01/2005)
LIST CurrMonth
MONTHS
Description
This function returns the number of months between <var1> and <var2>. If any of the variables or values included in the formula is not a date, the result will be null.
Syntax
MONTHS(<var1>, <var2>)
<var1> and <var2> represent variables in date format.
Comments
If the date stored in <var1> is older than that in <var2>, the result will be thedifference in months expressed as a negative number.
Example
READ {C:\My_Project_Folder \Sample\Sample.prj}:Surveillance
DEFINE AgeMonths NUMERIC
ASSIGN AgeMonths = MONTHS(BirthDate,01/01/2000)
LIST AgeMonths
NUMTODATE
Description
This function transforms three numbers into a date format.
Syntax
NUMTODATE(<year>, <month>, <day>)
<year> represents a numeric variable or a number representing the year.
<month> represents a numeric variable or a number representing themonth.
<day> represents a numeric variable or a number representing the day.
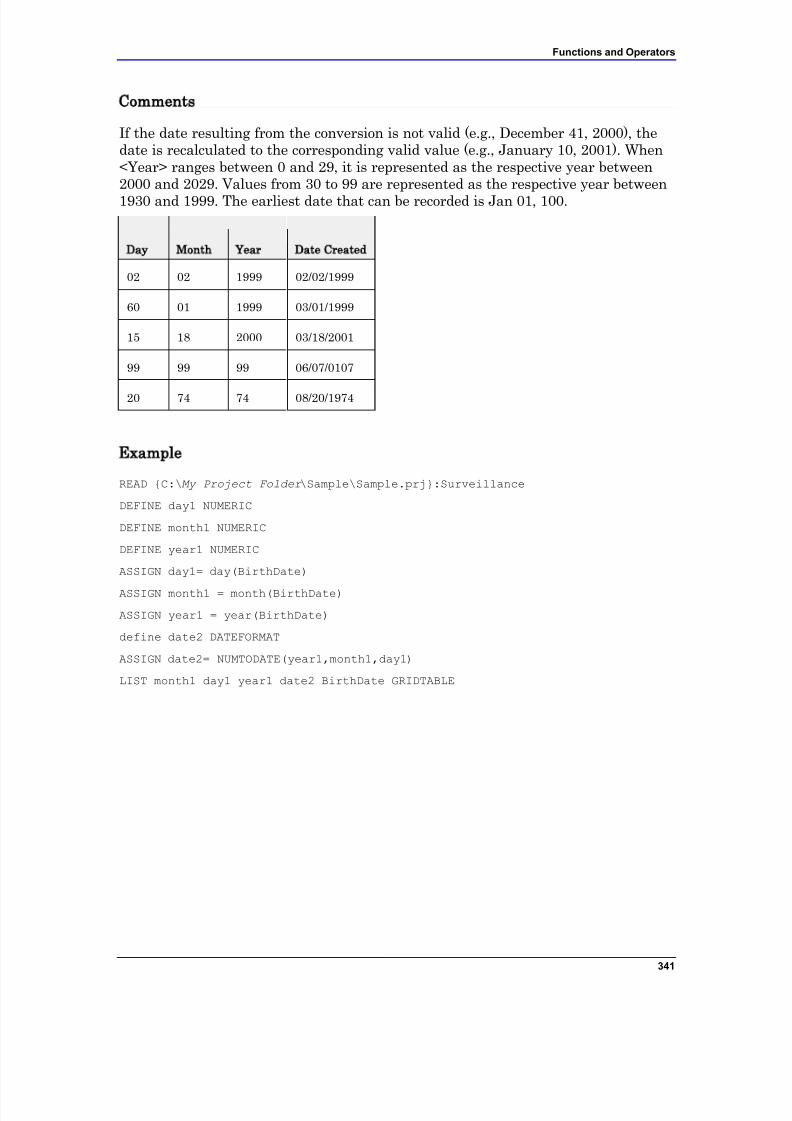
7/14/2019 Epi Info 7 User Guide-V1.0 Cleared
http://slidepdf.com/reader/full/epi-info-7-user-guide-v10-cleared-563109dd5013b 347/368
Functions and Operators
341
Comments
If the date resulting from the conversion is not valid (e.g., December 41, 2000), thedate is recalculated to the corresponding valid value (e.g., January 10, 2001). When<Year> ranges between 0 and 29, it is represented as the respective year between2000 and 2029. Values from 30 to 99 are represented as the respective year between
1930 and 1999. The earliest date that can be recorded is Jan 01, 100.
Day Month Year Date Created
02 02 1999 02/02/1999
60 01 1999 03/01/1999
15 18 2000 03/18/2001
99 99 99 06/07/0107
20 74 74 08/20/1974
Example
READ {C:\My_Project_Folder \Sample\Sample.prj}:Surveillance
DEFINE day1 NUMERIC
DEFINE month1 NUMERIC
DEFINE year1 NUMERIC
ASSIGN day1= day(BirthDate)
ASSIGN month1 = month(BirthDate)
ASSIGN year1 = year(BirthDate)
define date2 DATEFORMAT
ASSIGN date2= NUMTODATE(year1,month1,day1)
LIST month1 day1 year1 date2 BirthDate GRIDTABLE

7/14/2019 Epi Info 7 User Guide-V1.0 Cleared
http://slidepdf.com/reader/full/epi-info-7-user-guide-v10-cleared-563109dd5013b 348/368
Epi Info 7 User Guide
342
NUMTOTIME
Description
This function transforms three numbers into a time or date/time format.
SyntaxNUMTOTIME(<hour>, <minute>, <second>)
<hour> represents a numeric constant or variable representing hours.
<minute> represents a numeric constant or variable representing minutes.
<second> represents a numeric constant or variable representing seconds.
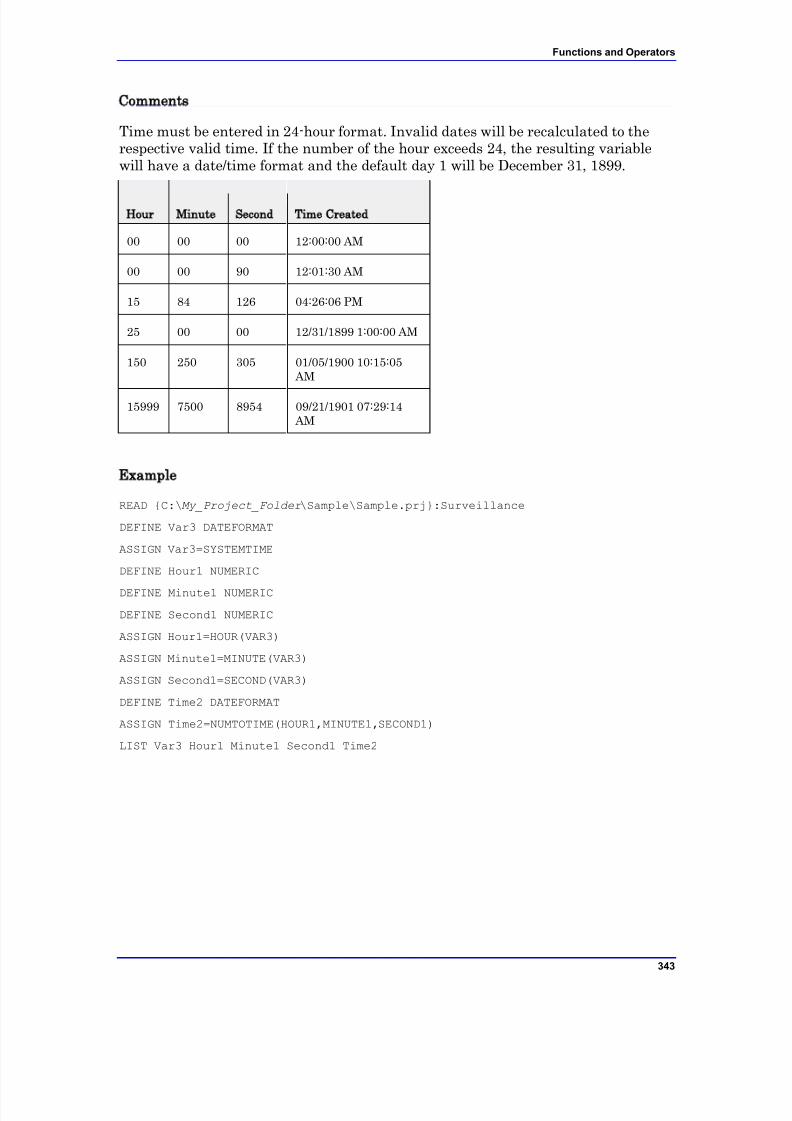
7/14/2019 Epi Info 7 User Guide-V1.0 Cleared
http://slidepdf.com/reader/full/epi-info-7-user-guide-v10-cleared-563109dd5013b 349/368
Functions and Operators
343
Comments
Time must be entered in 24-hour format. Invalid dates will be recalculated to therespective valid time. If the number of the hour exceeds 24, the resulting variablewill have a date/time format and the default day 1 will be December 31, 1899.
Hour Minute Second Time Created
00 00 00 12:00:00 AM
00 00 90 12:01:30 AM
15 84 126 04:26:06 PM
25 00 00 12/31/1899 1:00:00 AM
150 250 305 01/05/1900 10:15:05 AM
15999 7500 8954 09/21/1901 07:29:14 AM
Example
READ {C:\My_Project_Folder \Sample\Sample.prj}:Surveillance
DEFINE Var3 DATEFORMAT
ASSIGN Var3=SYSTEMTIME
DEFINE Hour1 NUMERIC
DEFINE Minute1 NUMERIC
DEFINE Second1 NUMERIC
ASSIGN Hour1=HOUR(VAR3)
ASSIGN Minute1=MINUTE(VAR3)
ASSIGN Second1=SECOND(VAR3)
DEFINE Time2 DATEFORMAT
ASSIGN Time2=NUMTOTIME(HOUR1,MINUTE1,SECOND1)
LIST Var3 Hour1 Minute1 Second1 Time2
7/14/2019 Epi Info 7 User Guide-V1.0 Cleared
http://slidepdf.com/reader/full/epi-info-7-user-guide-v10-cleared-563109dd5013b 350/368
Epi Info 7 User Guide
344
RECORDCOUNT
Description
This function returns the number of records in the current View. In Analysis, thistakes into account any SELECT statement and value of the Process (Deleted)setting.
Syntax
RECORDCOUNT
7/14/2019 Epi Info 7 User Guide-V1.0 Cleared
http://slidepdf.com/reader/full/epi-info-7-user-guide-v10-cleared-563109dd5013b 351/368
Functions and Operators
345
Example
READ {C:\My_Project_Folder \Sample\Sample.prj}:Oswego
IF RECORDCOUNT=0 THEN
DIALOG "No records found."
QUIT
END
RND
Description
This function generates a random number between <var1> and <var2>.
Syntax
RND(<min>, <max>)
The <min> represents a number or numeric variable that corresponds tothe lowest value of the random number to be generated.
The <max> represents a number or numeric variable that corresponds tothe highest possible value for the random number to be generated.
Example
READ {C:\My_Project_Folder \Sample\Sample.prj}:Oswego
DEFINE Random1 NUMERIC
DEFINE Random2 NUMERIC
DEFINE Random3 NUMERIC
ASSIGN Random1=RND(1,100)
ASSIGN Random2=RND(1,100)
ASSIGN Random3=RND(1,100)
LIST Random1 Random2 Random3
7/14/2019 Epi Info 7 User Guide-V1.0 Cleared
http://slidepdf.com/reader/full/epi-info-7-user-guide-v10-cleared-563109dd5013b 352/368
Epi Info 7 User Guide
346
ROUND
Description
This function rounds the number stored in the variable to the closest integer.Positive numbers are rounded up to the next higher integer if the fractional part is
greater than or equal to 0.5. Negative numbers are rounded down to the next lowerinteger if the fractional part is greater than or equal to 0.5.
Syntax
ROUND(<variable>)
The <variable> can be an existing numeric variable, a defined variable containingnumbers, or a numeric constant.
Comments
The results are returned in numeric format.
Differences Between TRUNC and ROUND
Value TRUNC ROUND
0.123456 0 0
7.99999999 7 8
45.545 45 46
ExampleREAD {C:\My_Project_Folder \Sample\Sample.prj}:Oswego
FREQ AGE
DEFINE Decade NUMERIC
ASSIGN Decade=ROUND(AGE/10)+1
LIST AGE Decade
7/14/2019 Epi Info 7 User Guide-V1.0 Cleared
http://slidepdf.com/reader/full/epi-info-7-user-guide-v10-cleared-563109dd5013b 353/368
Functions and Operators
347
SECONDS
Description
This function returns the number of seconds between <var1> and <var2> in numericformat.
Syntax
SECONDS(<var1>, <var2>)
<var1> and <var2> represent variables in time or date/time format.
Comments
If the date stored in <var1> is older than that in <var2>, the result will be thedifference in seconds expressed as a negative number. Both variables must containdata in date, time or date/time format. If any of the variables or values included inthe formula is not a date, the result is null.
ExampleREAD {C:\My_Project_Folder \Sample\Sample.prj}:Oswego
DEFINE Sec1 NUMERIC
ASSIGN Sec1=SECONDS(Timesupper,DateOnset)
LIST Timesupper DateOnset Sec1
SIN, COS, TAN
DescriptionThese functions return the respective trigonometric value for the specified variable.
Syntax
SIN(<variable>)
The <variable> can be an existing numeric variable, a defined variable containingnumbers, or a numeric constant.
Comments
The variable is interpreted as the angle in radians. To convert degrees to radians,
multiply by pi (3.1415926535897932) divided by 180.Example
READ {C:\My_Project_Folder \Sample\Sample.prj}:Oswego
DEFINE SinA NUMERIC
DEFINE SinB NUMERIC
7/14/2019 Epi Info 7 User Guide-V1.0 Cleared
http://slidepdf.com/reader/full/epi-info-7-user-guide-v10-cleared-563109dd5013b 354/368
Epi Info 7 User Guide
348
DEFINE CosA NUMERIC
DEFINE TanA NUMERIC
ASSIGN SinA=SIN(AGE)
ASSIGN SinB=SIN(AGE)*3.14/180
ASSIGN CosA=COS(AGE)
ASSIGN TanA=TAN(AGE)
LIST SinA CosA TanA SinB
SUBSTRING
Description
This function returns a string that is a specified part of the value in the string
parameter.Syntax
SUBSTRING(<variable>, [First], [Length])
The <variable> represents a variable in text format.
The [First] represents the position of the first character to extract from thefile.
The [Length] represents the number of characters to extract.
Comments
This function cannot be used with non-string variables.
Example
READ {C:\My_Project_Folder \Sample\Sample.prj}:Oswego
DEFINE Text1 TEXTINPUT
ASSIGN Text1 ="James Smith"
DEFINE LName TEXTINPUT
ASSIGN LName = SUBSTRING(Text1,7,5)
LIST Text1 LName
SYSTEMDATEDescription
This function returns the date stored in the computer's clock.
Syntax
SYSTEMDATE

7/14/2019 Epi Info 7 User Guide-V1.0 Cleared
http://slidepdf.com/reader/full/epi-info-7-user-guide-v10-cleared-563109dd5013b 355/368
Functions and Operators
349
Comments
The SYSTEMDATE cannot be changed (assigned) from Classic Analysis. To use theSYSTEMDATE for computations, a new variable must be defined.
7/14/2019 Epi Info 7 User Guide-V1.0 Cleared
http://slidepdf.com/reader/full/epi-info-7-user-guide-v10-cleared-563109dd5013b 356/368
Epi Info 7 User Guide
350
Example
To calculate next week's date:
READ {C:\My_Project_Folder \Sample\Sample.prj}:Surveillance
DEFINE TodayDate DATEFORMAT
ASSIGN TodayDate =SYSTEMDATE + 7
LIST TodayDate
SYSTEMTIME
Description
This function returns the time stored in the computer‟s clock at the time thecommand is executed.
Syntax
SYSTEMTIME
Comments
The SYSTEMTIME cannot be changed from Classic Analysis (assigned). To use thesystem time for computations, a new variable must be defined.
Example
To calculate a time two hours after the current time:
READ {C:\My_Project_Folder \Sample\Sample.prj}:Surveillance
DEFINE Later DATEFORMAT
ASSIGN Later =SYSTEMTIME
LIST Later
ASSIGN Later =SYSTEMTIME+(120)
LIST Later
7/14/2019 Epi Info 7 User Guide-V1.0 Cleared
http://slidepdf.com/reader/full/epi-info-7-user-guide-v10-cleared-563109dd5013b 357/368
Functions and Operators
351
TRUNC
Description
This function removes decimals from a numeric variable, returning the integer partof the number. This follows the same logic as rounding toward zero.
Syntax
TRUNC(<variable>)
The <variable> can be an existing numeric variable, a defined variable containingnumbers, or a numeric constant.
Comments
The result will be returned in numeric format.
Example
READ {C:\My_Project_Folder \Sample\Sample.prj}:ADDFullDEFINE Trc1 Numeric
ASSIGN Trc1 = TRUNC(ADDSC)
LIST Trc1 ADDSC
TXTTODATE
Description
This function returns a date value that corresponds to the string.
Syntax
TXTTODATE(<variable>)
The <variable> represents a variable in text format.
Comments
The text variable can be in any format that can be recognized as a date (e.g., "Jan 1,2000", "1/1/2000").
Example
READ {C:\My_Project_Folder \Sample\Sample.prj}:Surveillance
DEFINE Var1 TEXTINPUT
ASSIGN Var1="05/20/2006"
DEFINE Var2 DATEFORMAT
ASSIGN Var2=TXTTODATE(Var1)
DISPLAY DBVARIABLES
7/14/2019 Epi Info 7 User Guide-V1.0 Cleared
http://slidepdf.com/reader/full/epi-info-7-user-guide-v10-cleared-563109dd5013b 358/368
Epi Info 7 User Guide
352
LIST Var1 Var2
TXTTONUM
Description
This function returns a numeric value that corresponds to the string.
Syntax
TXTTONUM(<variable>)
The <variable> represents a variable in text format.
Example
READ {C:\My_Project_Folder \Sample\Sample.prj}:Oswego
DEFINE Var1 TEXTINPUT
ASSIGN Var1="12345"
DEFINE Var2 NUMERIC
ASSIGN Var2=TXTTONUM(Var1)
LIST Var1 Var2
DISPLAY DBVARIABLES
UPPERCASE
Description
This function returns a string (text) variable that has been converted to uppercase.
Syntax
UPPERCASE(<variable>)
The <variable> represents a variable in text format.
7/14/2019 Epi Info 7 User Guide-V1.0 Cleared
http://slidepdf.com/reader/full/epi-info-7-user-guide-v10-cleared-563109dd5013b 359/368
Functions and Operators
353
Comments
Only lowercase letters are converted to uppercase; all uppercase letters and non-letter characters remain unchanged.
Example
READ {C:\My_Project_Folder \Sample\Sample.prj}:Surveillance
DEFINE LastName2 TEXTINPUT
ASSIGN LastName2 = UPPERCASE(LASTNAME)
LIST LastName2 LASTNAME
YEAR
Description
This function extracts the year from a date.
Syntax
YEAR(<variable>)
The <variable> represents a variable in date format.
Comments
The date argument is any expression that can represent a date. If the date variablecontains null, null is returned.
Example
READ {C:\My_Project_Folder \Sample\Sample.prj}:Surveillance
DEFINE CurrentYear NUMERIC
ASSIGN CurrentYear =YEAR(01/01/2006)
LIST CurrentYear
7/14/2019 Epi Info 7 User Guide-V1.0 Cleared
http://slidepdf.com/reader/full/epi-info-7-user-guide-v10-cleared-563109dd5013b 360/368
Epi Info 7 User Guide
354
YEARS
Description
This function returns the number of years from <var1> to <var2> in numeric format.If any of the variables or values included in the formula is not a date, the result will
be null.
Syntax
YEARS(<var1>, <var2>)
<var1> and <var2> are represented in date format.
Comments
If the date stored in <var1> is more recent than that in <var2>, the result will be thedifference in years expressed as a negative number.
Example
READ {C:\My_Project_Folder \Sample\Sample.prj}:Surveillance
DEFINE SurveyDate DATEFORMAT
ASSIGN SurveyDate=05/15/2001
DEFINE AgeYears NUMERIC
ASSIGN AgeYears =YEARS(BirthDate,SurveyDate)
MEANS AgeYears
LIST AgeYears BirthDate SurveyDate

7/14/2019 Epi Info 7 User Guide-V1.0 Cleared
http://slidepdf.com/reader/full/epi-info-7-user-guide-v10-cleared-563109dd5013b 361/368
Functions and Operators
355
7/14/2019 Epi Info 7 User Guide-V1.0 Cleared
http://slidepdf.com/reader/full/epi-info-7-user-guide-v10-cleared-563109dd5013b 362/368
356
Glossary
#.CHK: EpiData was developed for data entry as an update of the principles used
in the DOSprogram Epi Info v6. It is an all-in-one program (one exe file) forWindows (95/98/NT/2000) and Macintosh (with RealPc emulation). EpiDatauses Epi Info v6 format for files (Qes, Rec, and Chk). Data can be exported toCSV, (comma separated data), dBase, Exceland Stata v4-6. Simple (range,legal, date) and enhanced control of logical consistency across variables,
jumps based on the value of entry, and calculations during data entry is easyto define. Lists of data and overall frequency tables can be produced.Compare two files and get a list of differences in data (validate).
.QES: EpiData was developed for data entry as an update of the principles usedin the DOSprogram Epi Info v6. It is an all-in-one program (one exe file) forWindows (95/98/NT/2000) and Macintosh (with RealPc emulation). EpiDatauses Epi Info v6 format for files(Qes, Rec, and Chk). Data can be exported toCSV, (comma separated data), dBase, Exceland Stata v4-6. Simple (range,legal, date) and enhanced control of logical consistency across variables,
jumps based on the value of entry, and calculations during data entry is easyto define. Lists of data and overall frequency tables can be produced.Compare two files and get a list of differences in data (validate).
.REC: EpiData was developed for data entry as an update of the principles usedin the DOSprogram Epi Info v6. It is an all-in-one program (one exe file) forWindows (95/98/NT/2000) and Macintosh (with RealPc emulation). EpiDatauses Epi Info v6 format for files (Qes, Rec and Chk). Data can be exported toCSV, (comma separated data), dBase, Exceland Stata v4-6. Simple (range,legal, date) and enhanced control of logical consistency across variables,
jumps based on the value of entry, and calculations during data entry is easyto define. Lists of data and overall frequency tables can be produced.Compare two files and get a list of differences in data (validate).
95% Confidence Limits: A range of values for a variable that indicates the likelylocation of the true value of a measure.
AAssociation: Statistical relationship between two or more events, characteristics,
or other variables.
Average: Average of the values in the numeric expression.
CCase: In epidemiology, a countable instance in the population or study group of a
particular disease, health disorder, or condition under investigation.Sometimes, an individual with the particular disease.
7/14/2019 Epi Info 7 User Guide-V1.0 Cleared
http://slidepdf.com/reader/full/epi-info-7-user-guide-v10-cleared-563109dd5013b 363/368
Glossary
357
Case Based: An advanced display process that allows users to show differentsymbols based on levels of classification (e.g., Confirmed, Probable,Discarded, Suspected).
Chi Square: A test of statistical significance used to determine how likely anobserved association between an exposure and a disease could have occurred
because of chance alone, if the exposure was not actually related to thedisease. Tests for the presence of a trend in dose response or other casecontrol studies where a series of increasing or decreasing exposures is beingstudied.
Conditional Probability: Estimate of the probability of survival of a defined groupat a designated time interval.
Control: In a case-control study, comparison group of persons without disease.
Count: Number of values in the expression or number of selected rows.
DDate Literals: A specific date used in functions or commands in Check Code or in
Classic Analysis.
DLL: Dynamic Link Library
EElementary outcomes: All possible results of a random experiment.
Epi Info: Epi Info for Windows
Epidemic: The occurrence of more cases of disease than expected in a given area
or among a specific group of people over a particular period of time.Epidemiology: The study of the distribution and determinants of health-related
states or events in specified populations, and the application of this study tothe control of health problems.
Evaluation: A process that attempts to determine as systematically andobjectively as possible the relevance, effectiveness, and impact of activities inthe light of their objectives.
FFrequency: The count in any given interval. The relative frequency is the
proportion of weights in each interval.
GGIS: Geographic Information System
H
7/14/2019 Epi Info 7 User Guide-V1.0 Cleared
http://slidepdf.com/reader/full/epi-info-7-user-guide-v10-cleared-563109dd5013b 364/368
Epi Info 7 User Guide
358
Histogram: A graphical representation of the frequency of data values withinsmall data ranges which are created by dividing the total range of data into 5to 20 equal subintervals. The most common histogram form is the Bell Curve,also known as a Normal Distribution.
IInteraction: The odds ratio (OR) for a variable varies with the value of another
variable.
MMaximum: Highest value in the expression.
Mean: Equal to the average of the data. Add all data together and divide by thenumber of observations.
Median: The measure of central location which divides a set of data into two
equal parts. A center or mid-point of the data. Order the data from thesmallest to the largest and the center point is the median. For odd numbers,it is the center number. For even numbers, it is the average of the centernumbers.
Minimum: Lowest value in the expression.
OODBC: Open Database Connectivity
Odds Ratio: A measure of association that quantifies the relationship between anexposure and health outcome from a comparative study. Also known as thecross-product ratio.
Outbreak: Synonymous with epidemic. Sometimes the preferred word because itmay escape sensationalism. Alternatively, a localized as opposed togeneralized epidemic.
Outliers: The number of data values that are much smaller or larger than therest of the data values.
PP-Value: The probability that an observed association between an exposure and a
disease could have occurred because of chance alone, if the exposure was notactually related to the disease.
PGM Files: Commands entered into Classic Analysis generate lines of code in theProgram Editor and can be stored in the current PRJ file. Programs can besaved internally within the project or externally as a text file with a .pgm7file extension. This makes a neat package of data and programs that can becopied to another system or sent by email for use elsewhere.
7/14/2019 Epi Info 7 User Guide-V1.0 Cleared
http://slidepdf.com/reader/full/epi-info-7-user-guide-v10-cleared-563109dd5013b 365/368
Glossary
359
RRandom experiment: The process of observing the outcome of a chance event.
Ratio: The value obtained by dividing one quantity by another.
Risk: The probability that an event will occur (e.g., an individual will become ill
or die within a stated period of time or age).
Risk Ratio: A comparison of the risk of some health-related event (e.g., disease ordeath in two groups).
SSample space: The set or collection of all elementary outcomes.
Standard Deviation: A statistical summary of how dispersed the values of avariable are around its mean. The average of all distances of each data pointfrom the mean.
Standard Error: (of the mean) The standard deviation of a theoreticaldistribution of sample means of a variable around the true population meanof that variable.
Strata: A population subgroup defined by any number of demographiccharacteristics (e.g., age, gender, race, etc.).
Sum: Total of the values in the numeric expression.
VVariable: Any characteristic or attribute that can be measured.
Variance: A measure of the dispersion shown by a set of observations.
7/14/2019 Epi Info 7 User Guide-V1.0 Cleared
http://slidepdf.com/reader/full/epi-info-7-user-guide-v10-cleared-563109dd5013b 366/368
360
Appendix
Data Quality Check
Date Validation
The Date field is an alphanumeric field with pre-set date patterns selected fromthe pattern drop-down list. It cannot be altered.
The date field offers Range property, which can be applied to Date variabletypes. Range allows for a specified value between one setting and another.
Values falling outside a specified range will prompt you with a warning messagein the Enter module. Unless the field is designated Required, missing values areaccepted.
How to:
Use Form Designer to open the data entry form. Select Oswego from “C:\Epi Info
7\Projects\Sample\Sample.prj\ Oswego”. Right click on the Date Onset field. Select Properties option from the popup menu. Click on Range option. Enter the Lower and Upper date.
Numeric Data Validation – Lower and Upper Bound
The Number field is a numeric field that has six predefined value patterns (e.g.,xxx.xx). A new pattern can be created by simply typing the pattern into thePattern field.
The Number field offers Range property. The Range property can be applied toNumber or Numeric types. The Range allows for a specified value between onesetting and another. Values falling outside a specified range will prompt the userwith a warning message in the Enter module. Missing values are accepted unlessthe field is also designated Required.
How to:
Use Form Designer to open the data entry form:
Select Oswego from “C:\Epi Info7\Projects\Sample\Sample.prj\ Oswego”.
Right click on the Age field.
7/14/2019 Epi Info 7 User Guide-V1.0 Cleared
http://slidepdf.com/reader/full/epi-info-7-user-guide-v10-cleared-563109dd5013b 367/368
Appendix
361
Select Properties option from the popup menu. Click on Range option. Enter the Lower and Upper values.
Legal Values
A Legal Values field is a drop-down list of choices on the questionnaire. Theseitems cannot be altered by the person entering data. The only values legal forentry are the ones in the list.
How to:
See the Legal Value section
Comment Legal Values
Comment Legal variables are similar to Legal Values. Comment Legal fields aretext fields with a code typed in front of text (with a hyphen) so that in populatingfields, the code is entered instead of the text. In the Classic Analysis module, thestatistics are displayed with the codes only.
How To
See the Comment Legal section
Auto Search
During data entry, fields with Autosearch Check Code are automaticallysearched for one or more matching records. If found, a match can be displayedand edited or be ignored and data entry can continue on the current record.
Autosearch is used as an alert to potential duplicate records. However, the Autosearch command does not restrict users from entering duplicate records.
How To
See the AutoSearch section
7/14/2019 Epi Info 7 User Guide-V1.0 Cleared
http://slidepdf.com/reader/full/epi-info-7-user-guide-v10-cleared-563109dd5013b 368/368
Epi Info 7 User Guide
Skip Logic/Patterns
Skip patterns can be created by changing the tab order and setting a new cursorsequence through a questionnaire, or by creating Check Code using the GOTOcommand. Skip patterns can also be created based on the answers to questionsusing an IF/THEN statement.
How To
See the Skip section.
Update Data
This technique allows users to search for existing records and re-enter or updatedata.
How To
See the Data Entry sections.
Must Enter
A Must Enter/Required fie ld is a mandatory field. Since the properties aremutually exclusive, Required cannot be used in combination with Read Only. If apage contains a Required variable, the Enter module will prevent further pagenavigation until a value has been entered. Use this property sparingly to avoidgridlock.
How To
See the Must Enter section.
Calculated Age
If possible, always use the Years command to calculate from the birth and thedata entry date.
How To
See the YEARS function