enzyme flow immunoassay using a protein g column for the screening of triazine herbicides in surface...
TRANSCRIPT
Analytica Chimica Acta 426 (2001) 197–207
Enzyme flow immunoassay using a Protein G column for thescreening of triazine herbicides in surface and waste water
Bjarni Bjarnasona, Luke Chimukaa, Patrik Önnerfjorda, Sergei Ereminb,Jan-Åke Jönssona, Gillis Johanssona, Jenny Emnéusa,∗a Department of Analytical Chemistry, Lund University, Box 124, S-221 00 Lund, Swedenb Chemistry Faculty, M.V. Lomonosov Moscow State University, 119899 Moscow, Russia
Received 27 September 1999; received in revised form 24 February 2000; accepted 24 February 2000
Abstract
A method for screening of triazine herbicides in surface and waste water is presented. The method is based on an enzymeflow immunoassay (EFIA) for the detection of the free fraction of a horse radish peroxidase (HRP)-labelled antigen (tracer).This was accomplished by trapping the bound tracer fraction in a Protein G column, allowing the residual free tracer fractionto pass and be detected spectrophotometrically after incubation with an enzyme substrate. As compared with detecting thebound tracer fraction this reduces the regeneration requirements of the Protein G column used for capturing the bound fractionand, therefore, reduces assay time. A polyclonal antibody directed against simazine showed no reactivity towards tracers thatwere thiopropionic acid derivatives of atrazine, simazine and terbutylazine. It had good sensitivity towards tracers usingderivatives of 2-chloro-4,6-(alkylamino)-s-triazines such as atrazine and simazine. The highest sensitivity was obtained withan Et/Cl/N-C5-HRP tracer because this tracer could be used in combination with the lowest concentration of antibody. Thedetection limit was 0.1mg l−1 with a linear range between 0.1 and 10mg l−1 and an assay throughput of 12 h−1. Naturalwater samples from various locations in Russia were analysed for triazines and the results were compared with a previouslydeveloped fluorescein flow immunoassay for triazines. The results were further verified by supported liquid membrane (SLM)extraction combined with HPLC. The results show that the two immunoassays behave differently and that the sample matrixinfluences their performance, however, no false negative results were obtained. The possible reasons for the different resultsbetween the two immunoassays are discussed. © 2001 Elsevier Science B.V. All rights reserved.
Keywords:Enzyme flow immunoassay; Simazine; Triazines; Pesticides; Horse radish peroxidase; Protein G; Supported liquid membrane;Surface water; Waste water
1. Introduction
Triazines are widely used herbicides for control-ling weeds in agricultural areas. Many pesticides aretoxic and some have even shown to have endocrine
∗ Corresponding author. Tel.:+46-46-222-48-20;fax: +46-46-222-45-44.E-mail address:[email protected] (J. Emneus).
disruptive effects in laboratory and wild life animals[1]. Therefore, the frequent use of these chemicalscall for measures concerning the risk for contamina-tion of drinking and ground water. Many Europeancountries including Sweden have banned the use ofatrazine and simazine, but the problem remains, asthese herbicides are persistent in nature. The problemis even greater in other areas such as in the formerSoviet Union where triazine herbicides can be found
0003-2670/01/$ – see front matter © 2001 Elsevier Science B.V. All rights reserved.PII: S0003-2670(00)00842-4
198 B. Bjarnason et al. / Analytica Chimica Acta 426 (2001) 197–207
in alarmingly high concentrations. Instrumental meth-ods, e.g. LC- and GC-MS, for determining these her-bicides are time consuming and very expensive forroutine analysis and thus fast screening methods couldbe an important complement to traditional methods.In this sense, a large number of samples can be pro-cessed and the positive samples collected and verifiedby other more rigorous methods. This vastly reducesthe number of samples that otherwise must be anal-ysed by the more costly chromatographic methods.It has been suggested that the modern immunoassaycould be one step in this direction [2].
Traditional microplate based immunoassays aremulti-step methods and automation is therefore quitecomplex and costly, however, the microplate for-mat can easily be transferred into a flow configura-tion which in principle is more simple and cheaperto automate. To date many immunoassay formatshave been developed for screening of triazine her-bicides [3–7] and several of these were constructedas flow immunoassays (FIAs). Recently, several dif-ferent competitive flow immunoassay configurationsfor detection of triazine herbicides were developedwithin our department. An enzyme flow immunoas-say (EFIA) method [4] was developed where a HRPlabelled antigen tracer was mixed with the sampleand injected in a column containing immobilised an-tibody. In a second step, the enzyme substrate wasinjected and the enzyme activity registered as a peak.This method was sensitive (LOD=0.02mg l−1) butrather slow as frequent regeneration of the antibodycolumn was required. A fluorecein flow immunoas-say (FFIA) format [3] was also developed where afluorescein labelled hapten was used as the tracer. Arestricted access (RA) column was used for trappingthe free tracer fraction and the eluting immuno com-plex was monitored. The FFIA was quite fast with alimit of detection (LOD) for atrazine of 0.1mg l−1.The latter method has the advantage that it has a moregeneric feature, i.e. it can easily be adapted to otherhapten–antibody systems due to the general abilityof the RA phase to capture small hydrophobic labelssuch as fluorescein. The disadvantage is that enzymelabels cannot be used due to their size and thus lackthe possibility for signal amplification.
The purpose of this work was to develop a fasterEFIA screening method with more generic featuresthan the previously developed EFIA. The system
presented here was based on which a HRP labelledhapten tracer was pre-incubated with sample and anti-body before injecting into a flow system, containing aProtein G column. The formed immuno affinity com-plex was then trapped on a Protein G column and thefree fraction of enzyme tracer detected spectrophoto-metrically after on-line addition of enzyme substrate.This EFIA has a more generic approach than theprevious one in which several different antibody sys-tems can be monitored since Protein G can trap manydifferent antibodies. In addition, since the free tracerfraction is monitored, the regeneration requirement isreduced and the sample throughput can be increased.Detection of the free tracer fraction using a Protein Gcolumn has been done for the detection of the steroidbudesonide before [8], however, not for environmen-tal contaminants. The use of a Protein A column forsequential injection of reagents and detection of alabelled antibody complex was demonstrated for thedetection of atrazine and diuron [5]. Similar typesof systems were developed for theophylline and cy-closporin using Protein A [9–11]. The field of FIAswas recently reviewed by Fintschenko and Wilson[12].
Immunoassays are usually referred to as methodsthat are cheap, simple, sensitive, selective with rel-atively short analysis time. In addition, no organicsolvents are required making them environmentallyfriendly. The drawbacks are that immunoassays arestill not as reliable concerning rigid sample deter-mination as conventional methods such as GC- andLC-MS etc. The main concern is the influence of ma-trix effects on the immunoassay performance. Matrixeffects are less of a problem in clinical analysis due tosimilarities in the matrix composition between patientsamples [13], however, in environmental applicationsthese interferences must be considered since matricescan vary dramatically, e.g. a certain matrix can leadto either false negative or false positive results. Falsenegative results are more serious than false positivesbut the former is also less common, e.g. in enzymelinked immuno sorbent assay (ELISA) [14]. It isknown that antibodies can be influenced by organicsolvents [15], surfactants [16], pH, ionic strength[17–19], as well as by the organic content [6]. In onereport it was observed that unspiked ‘raw water’ pro-duced matrix effects whereas the same spiked waterdid not [5]. To resolve some of these matrix problems
B. Bjarnason et al. / Analytica Chimica Acta 426 (2001) 197–207 199
the samples need to be diluted and made as homoge-nous as possible [18], however, this will evidentlyreduce the LOD of the assay. The main focus onvalidation of immunoassays has been to spike realsamples with herbicides in various concentrations,however, only limited amount of data from realscreening of natural water samples are available. Thescreening of real samples is essential for understand-ing the potentials as well as limitations of these rela-tively new analytical tools for environmental analysis.
In this work, the developed EFIA as well as apreviously developed FFIA [3] was used for screeningof triazines in a number of different unspiked surfaceand waste water samples from Russia. The contentof triazines were further determined using supportedliquid membrane (SLM) extraction in combinationwith HPLC and the results obtained with the threedifferent methods were compared and discussed.
2. Experimental
2.1. Apparatus, reagents, and system set-up for theenzyme flow Immunoassay (EFIA)
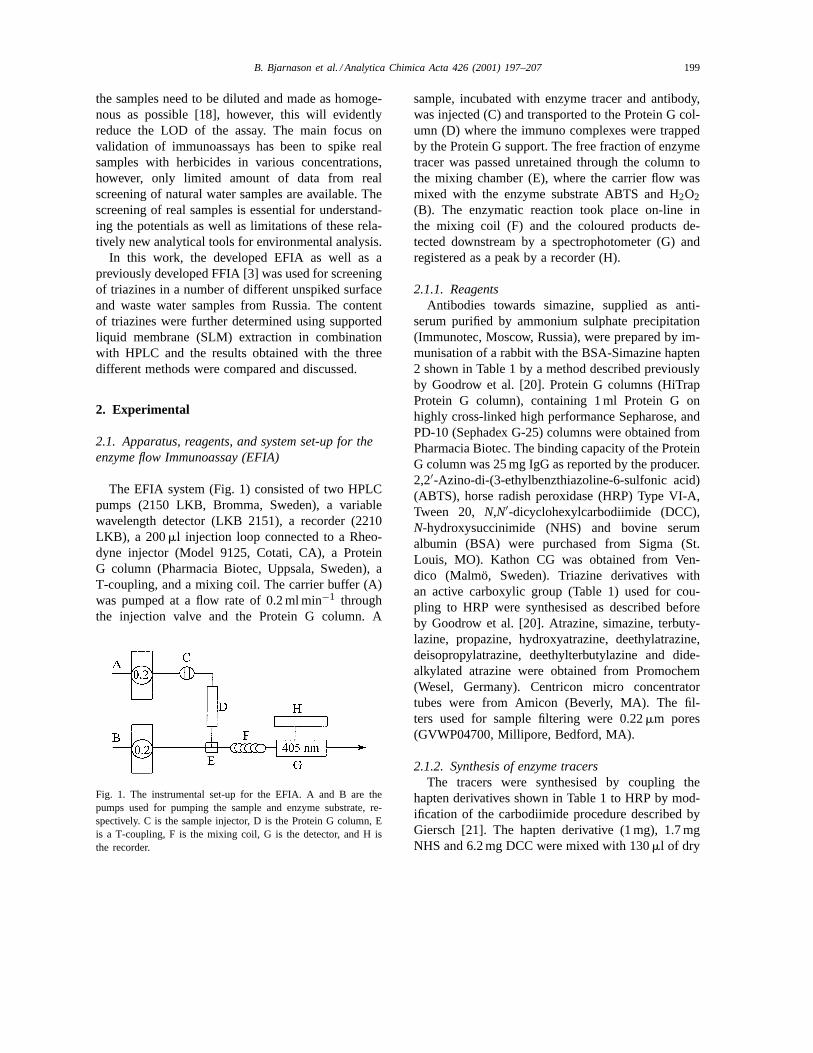
The EFIA system (Fig. 1) consisted of two HPLCpumps (2150 LKB, Bromma, Sweden), a variablewavelength detector (LKB 2151), a recorder (2210LKB), a 200ml injection loop connected to a Rheo-dyne injector (Model 9125, Cotati, CA), a ProteinG column (Pharmacia Biotec, Uppsala, Sweden), aT-coupling, and a mixing coil. The carrier buffer (A)was pumped at a flow rate of 0.2 ml min−1 throughthe injection valve and the Protein G column. A
Fig. 1. The instrumental set-up for the EFIA. A and B are thepumps used for pumping the sample and enzyme substrate, re-spectively. C is the sample injector, D is the Protein G column, Eis a T-coupling, F is the mixing coil, G is the detector, and H isthe recorder.
sample, incubated with enzyme tracer and antibody,was injected (C) and transported to the Protein G col-umn (D) where the immuno complexes were trappedby the Protein G support. The free fraction of enzymetracer was passed unretained through the column tothe mixing chamber (E), where the carrier flow wasmixed with the enzyme substrate ABTS and H2O2(B). The enzymatic reaction took place on-line inthe mixing coil (F) and the coloured products de-tected downstream by a spectrophotometer (G) andregistered as a peak by a recorder (H).
2.1.1. ReagentsAntibodies towards simazine, supplied as anti-
serum purified by ammonium sulphate precipitation(Immunotec, Moscow, Russia), were prepared by im-munisation of a rabbit with the BSA-Simazine hapten2 shown in Table 1 by a method described previouslyby Goodrow et al. [20]. Protein G columns (HiTrapProtein G column), containing 1 ml Protein G onhighly cross-linked high performance Sepharose, andPD-10 (Sephadex G-25) columns were obtained fromPharmacia Biotec. The binding capacity of the ProteinG column was 25 mg IgG as reported by the producer.2,2′-Azino-di-(3-ethylbenzthiazoline-6-sulfonic acid)(ABTS), horse radish peroxidase (HRP) Type VI-A,Tween 20, N,N′-dicyclohexylcarbodiimide (DCC),N-hydroxysuccinimide (NHS) and bovine serumalbumin (BSA) were purchased from Sigma (St.Louis, MO). Kathon CG was obtained from Ven-dico (Malmö, Sweden). Triazine derivatives withan active carboxylic group (Table 1) used for cou-pling to HRP were synthesised as described beforeby Goodrow et al. [20]. Atrazine, simazine, terbuty-lazine, propazine, hydroxyatrazine, deethylatrazine,deisopropylatrazine, deethylterbutylazine and dide-alkylated atrazine were obtained from Promochem(Wesel, Germany). Centricon micro concentratortubes were from Amicon (Beverly, MA). The fil-ters used for sample filtering were 0.22mm pores(GVWP04700, Millipore, Bedford, MA).
2.1.2. Synthesis of enzyme tracersThe tracers were synthesised by coupling the
hapten derivatives shown in Table 1 to HRP by mod-ification of the carbodiimide procedure described byGiersch [21]. The hapten derivative (1 mg), 1.7 mgNHS and 6.2 mg DCC were mixed with 130ml of dry
200 B. Bjarnason et al. / Analytica Chimica Acta 426 (2001) 197–207
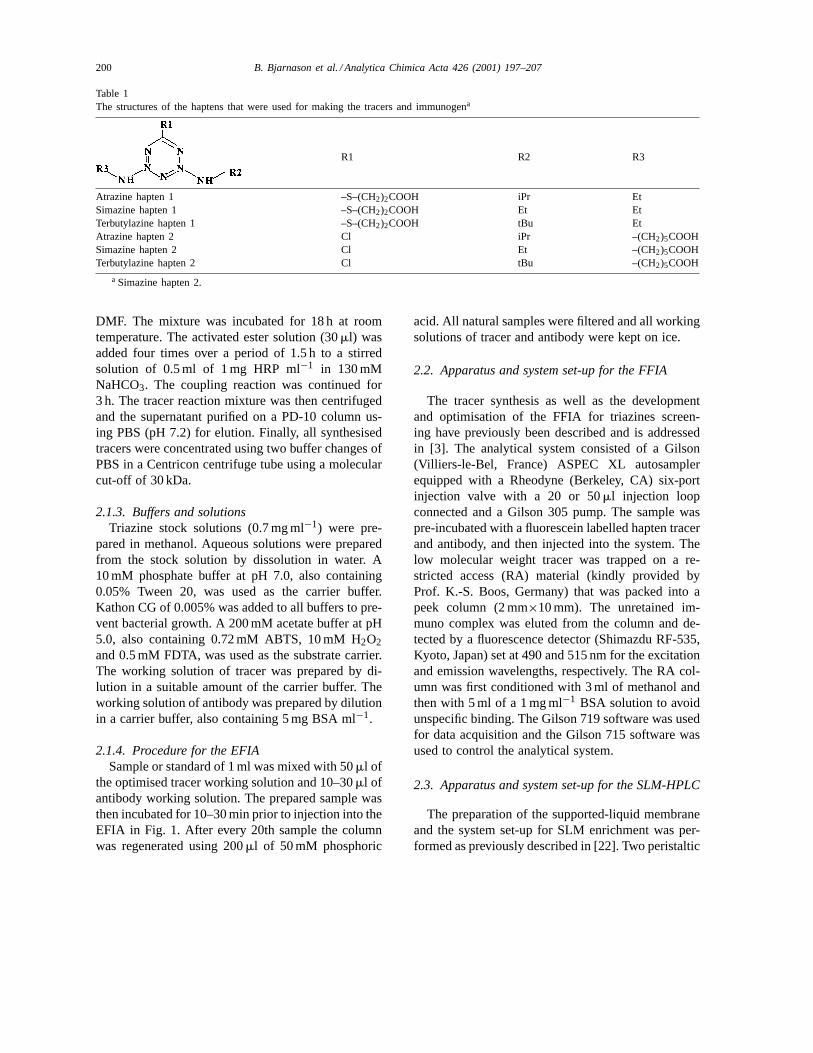
Table 1The structures of the haptens that were used for making the tracers and immunogena
R1 R2 R3
Atrazine hapten 1 –S–(CH2)2COOH iPr EtSimazine hapten 1 –S–(CH2)2COOH Et EtTerbutylazine hapten 1 –S–(CH2)2COOH tBu EtAtrazine hapten 2 Cl iPr –(CH2)5COOHSimazine hapten 2 Cl Et –(CH2)5COOHTerbutylazine hapten 2 Cl tBu –(CH2)5COOH
a Simazine hapten 2.
DMF. The mixture was incubated for 18 h at roomtemperature. The activated ester solution (30ml) wasadded four times over a period of 1.5 h to a stirredsolution of 0.5 ml of 1 mg HRP ml−1 in 130 mMNaHCO3. The coupling reaction was continued for3 h. The tracer reaction mixture was then centrifugedand the supernatant purified on a PD-10 column us-ing PBS (pH 7.2) for elution. Finally, all synthesisedtracers were concentrated using two buffer changes ofPBS in a Centricon centrifuge tube using a molecularcut-off of 30 kDa.
2.1.3. Buffers and solutionsTriazine stock solutions (0.7 mg ml−1) were pre-
pared in methanol. Aqueous solutions were preparedfrom the stock solution by dissolution in water. A10 mM phosphate buffer at pH 7.0, also containing0.05% Tween 20, was used as the carrier buffer.Kathon CG of 0.005% was added to all buffers to pre-vent bacterial growth. A 200 mM acetate buffer at pH5.0, also containing 0.72 mM ABTS, 10 mM H2O2and 0.5 mM FDTA, was used as the substrate carrier.The working solution of tracer was prepared by di-lution in a suitable amount of the carrier buffer. Theworking solution of antibody was prepared by dilutionin a carrier buffer, also containing 5 mg BSA ml−1.
2.1.4. Procedure for the EFIASample or standard of 1 ml was mixed with 50ml of
the optimised tracer working solution and 10–30ml ofantibody working solution. The prepared sample wasthen incubated for 10–30 min prior to injection into theEFIA in Fig. 1. After every 20th sample the columnwas regenerated using 200ml of 50 mM phosphoric
acid. All natural samples were filtered and all workingsolutions of tracer and antibody were kept on ice.
2.2. Apparatus and system set-up for the FFIA
The tracer synthesis as well as the developmentand optimisation of the FFIA for triazines screen-ing have previously been described and is addressedin [3]. The analytical system consisted of a Gilson(Villiers-le-Bel, France) ASPEC XL autosamplerequipped with a Rheodyne (Berkeley, CA) six-portinjection valve with a 20 or 50ml injection loopconnected and a Gilson 305 pump. The sample waspre-incubated with a fluorescein labelled hapten tracerand antibody, and then injected into the system. Thelow molecular weight tracer was trapped on a re-stricted access (RA) material (kindly provided byProf. K.-S. Boos, Germany) that was packed into apeek column (2 mm×10 mm). The unretained im-muno complex was eluted from the column and de-tected by a fluorescence detector (Shimazdu RF-535,Kyoto, Japan) set at 490 and 515 nm for the excitationand emission wavelengths, respectively. The RA col-umn was first conditioned with 3 ml of methanol andthen with 5 ml of a 1 mg ml−1 BSA solution to avoidunspecific binding. The Gilson 719 software was usedfor data acquisition and the Gilson 715 software wasused to control the analytical system.
2.3. Apparatus and system set-up for the SLM-HPLC
The preparation of the supported-liquid membraneand the system set-up for SLM enrichment was per-formed as previously described in [22]. Two peristaltic
B. Bjarnason et al. / Analytica Chimica Acta 426 (2001) 197–207 201
pumps (Minipuls 3; Gilson S.A., Villiers-Le-Bel),using acid resistant tubing (i.d. 1 mm, Acid-Flexible;Elkay Products, Shrewsbury, MA), were used for theoff-line SLM extraction. The flow system was con-nected with 0.5 mm i.d. PTFE tubing and Altex screwfittings. A Waters 600 LC pump (Waters Assoc.,Millford, MA), used to pump the mobile phase, wasconnected to an automatic sample injection system(Waters Assoc., WISP, Model 710). The analyticalcolumn was a C18 column, 5 mm×250 mm×4.6 mmTechsphere (HPLC Technology, Macclesfield, UK)followed by UV detection (Model 119, Gilson) at235 nm.
The SLM extraction procedure was performed asdescribed in [22] except that here the sample solutionwas premixed, i.e. 14 ml of sample was mixed with2 ml of 0.4 M NaH2SO4 to give a donor with a pHof 4.0. A donor flow rate of 0.3 ml min−1 was usedthroughout the work. A blank sample was extractedin between samples in the same way to ensure min-imal carry-over effects to the next sample extracted.The collected extracts were analysed as soon as pos-sible by injecting 100ml into the HPLC system usinga mobile phase composition of 50% acetonitrile and50% 0.05 M sodium acetate adjusted to pH 6.5 with0.5 M sulphuric acid at a flow rate of 1.0 ml min−1.Each sample was extracted twice.
3. Results and discussion
3.1. Enzyme flow immunoassay (EFIA)
3.1.1. ProcedureIn this method, the immuno reagents were
pre-incubated off-line before injection into the EFIAshown in Fig. 1. The free and bound tracer fractionwas then separated on a Protein G column and the freetracer eluted and detected spectrophotometrically af-ter on-line addition of enzyme substrate. In principle,it is possible to detect the bound tracer fraction in thecolumn by substrate injection, however, this wouldrequire regeneration of the column after each analysisand thus lead to a reduced sample throughput. Detec-tion of the free tracer fraction has the disadvantagethat antibody, tracer and sample must be mixed inaccurate amounts, as compared with an immobilisedantibody where the need is only to mix tracer with
sample [4]. This places high demands on exact mix-ing of reagents to give the assay good reproducibilityand repeatability. In addition, the free tracer fractionarrives to the detector at the same time as the samplematrix and this might influence the detector signal.
3.1.2. Selection of tracerAntibody dilution curves for different tracers are
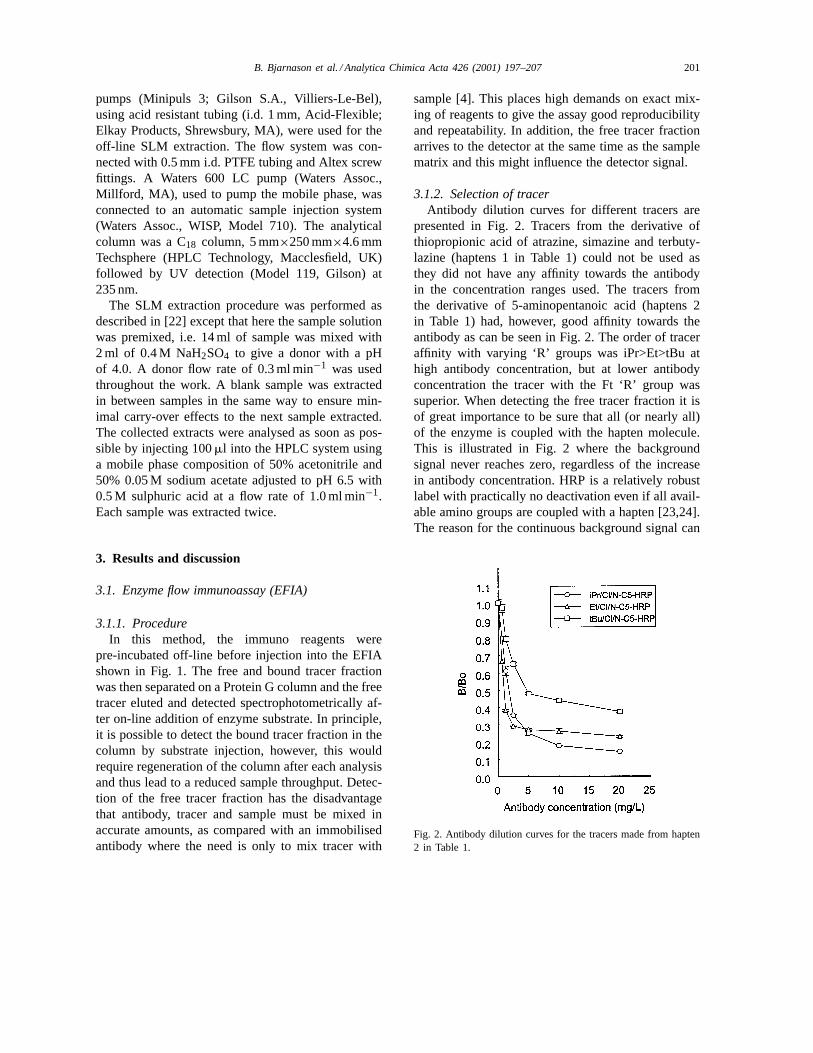
presented in Fig. 2. Tracers from the derivative ofthiopropionic acid of atrazine, simazine and terbuty-lazine (haptens 1 in Table 1) could not be used asthey did not have any affinity towards the antibodyin the concentration ranges used. The tracers fromthe derivative of 5-aminopentanoic acid (haptens 2in Table 1) had, however, good affinity towards theantibody as can be seen in Fig. 2. The order of traceraffinity with varying ‘R’ groups was iPr>Et>tBu athigh antibody concentration, but at lower antibodyconcentration the tracer with the Ft ‘R’ group wassuperior. When detecting the free tracer fraction it isof great importance to be sure that all (or nearly all)of the enzyme is coupled with the hapten molecule.This is illustrated in Fig. 2 where the backgroundsignal never reaches zero, regardless of the increasein antibody concentration. HRP is a relatively robustlabel with practically no deactivation even if all avail-able amino groups are coupled with a hapten [23,24].The reason for the continuous background signal can
Fig. 2. Antibody dilution curves for the tracers made from hapten2 in Table 1.
202 B. Bjarnason et al. / Analytica Chimica Acta 426 (2001) 197–207
be due to the presence of HRP molecules without anybound hapten. Another possibility is the fact that thecommercial HRP preparation contains several differ-ent forms of the enzyme where in certain cases theamine groups available for coupling might be situatedin the inner HRP structure, making the bound haptenunavailable for antibody binding.
3.1.3. Optimisation of the EFIASeveral parameters were optimised including in-
cubation time, tracer dilution, flow rate, injectionloop volume, mixing coil length, antibody concen-tration, and temperature. The incubation times fordifferent antibody concentrations, i.e. 4.5, 3.5, 2.7and 1 mg l−1, were investigated. The antibody con-centration was determined spectrophotometrically at278 nm (usingε=1.4 cm2 mg−1). In general, it couldbe seen that the equilibrium was reached somewhatfaster at higher antibody concentration and that abouthalf of the antibody–tracer complex was formed in thefirst 20 s and most of the complex was formed within10 mm. At an antibody concentration of 1 mg l−1, anincubation time of 20 mm was allowed as more than95% of the equilibrium concentration for the tracerwas reached during this period. The true equilibriumtime need not be used, however, then it is of greatimportance always to use the same incubation time inorder to obtain reproducible results.
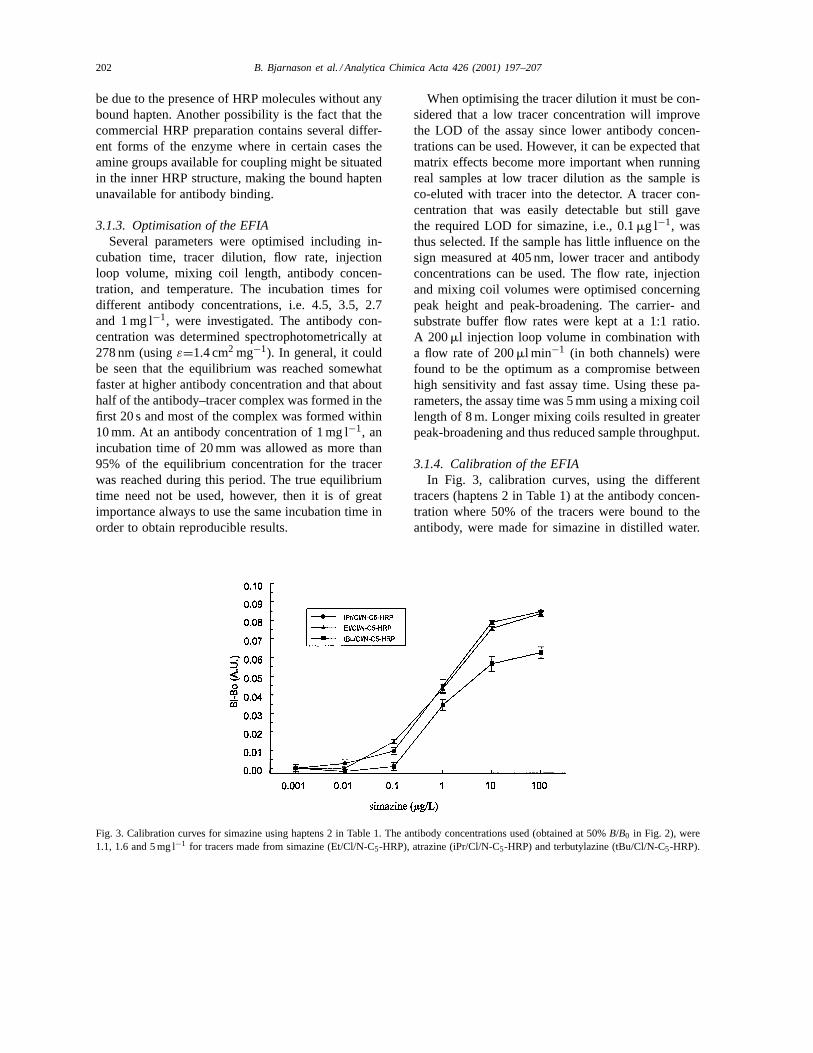
Fig. 3. Calibration curves for simazine using haptens 2 in Table 1. The antibody concentrations used (obtained at 50%B/B0 in Fig. 2), were1.1, 1.6 and 5 mg l−1 for tracers made from simazine (Et/Cl/N-C5-HRP), atrazine (iPr/Cl/N-C5-HRP) and terbutylazine (tBu/Cl/N-C5-HRP).
When optimising the tracer dilution it must be con-sidered that a low tracer concentration will improvethe LOD of the assay since lower antibody concen-trations can be used. However, it can be expected thatmatrix effects become more important when runningreal samples at low tracer dilution as the sample isco-eluted with tracer into the detector. A tracer con-centration that was easily detectable but still gavethe required LOD for simazine, i.e., 0.1mg l−1, wasthus selected. If the sample has little influence on thesign measured at 405 nm, lower tracer and antibodyconcentrations can be used. The flow rate, injectionand mixing coil volumes were optimised concerningpeak height and peak-broadening. The carrier- andsubstrate buffer flow rates were kept at a 1:1 ratio.A 200ml injection loop volume in combination witha flow rate of 200ml min−1 (in both channels) werefound to be the optimum as a compromise betweenhigh sensitivity and fast assay time. Using these pa-rameters, the assay time was 5 mm using a mixing coillength of 8 m. Longer mixing coils resulted in greaterpeak-broadening and thus reduced sample throughput.
3.1.4. Calibration of the EFIAIn Fig. 3, calibration curves, using the different
tracers (haptens 2 in Table 1) at the antibody concen-tration where 50% of the tracers were bound to theantibody, were made for simazine in distilled water.
B. Bjarnason et al. / Analytica Chimica Acta 426 (2001) 197–207 203
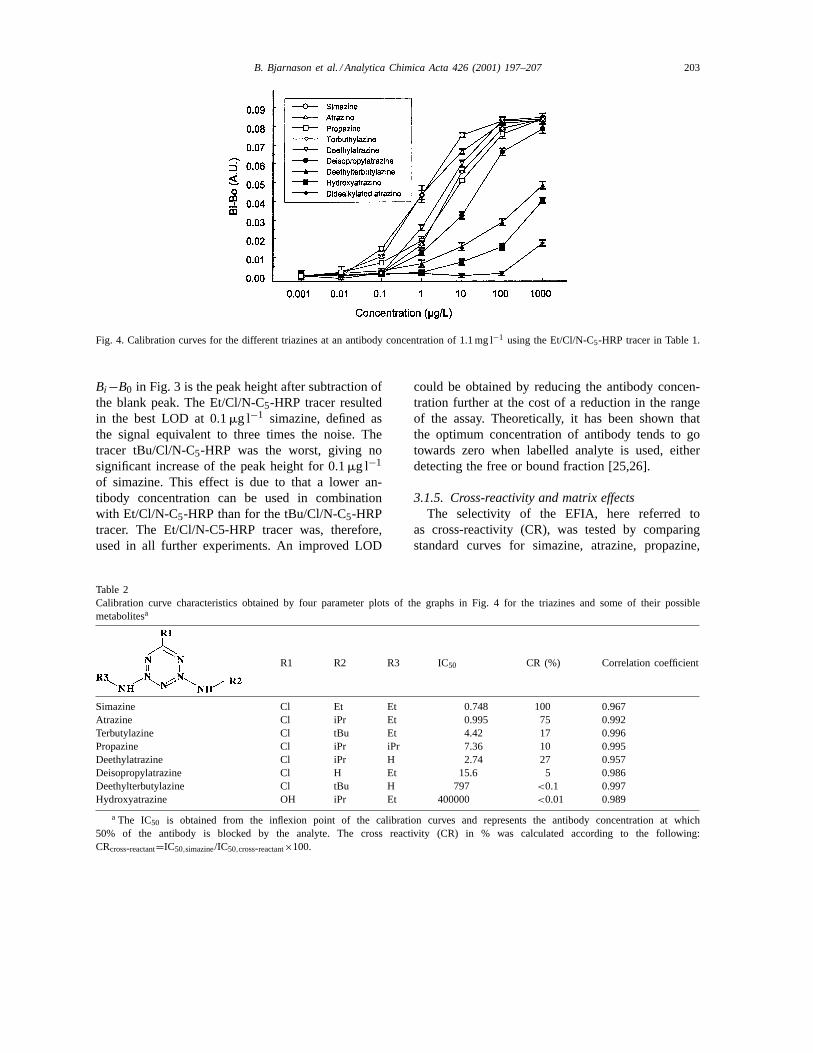
Fig. 4. Calibration curves for the different triazines at an antibody concentration of 1.1 mg l−1 using the Et/Cl/N-C5-HRP tracer in Table 1.
Bi−B0 in Fig. 3 is the peak height after subtraction ofthe blank peak. The Et/Cl/N-C5-HRP tracer resultedin the best LOD at 0.1mg l−1 simazine, defined asthe signal equivalent to three times the noise. Thetracer tBu/Cl/N-C5-HRP was the worst, giving nosignificant increase of the peak height for 0.1mg l−1
of simazine. This effect is due to that a lower an-tibody concentration can be used in combinationwith Et/Cl/N-C5-HRP than for the tBu/Cl/N-C5-HRPtracer. The Et/Cl/N-C5-HRP tracer was, therefore,used in all further experiments. An improved LOD
Table 2Calibration curve characteristics obtained by four parameter plots of the graphs in Fig. 4 for the triazines and some of their possiblemetabolitesa
R1 R2 R3 IC50 CR (%) Correlation coefficient
Simazine Cl Et Et 0.748 100 0.967Atrazine Cl iPr Et 0.995 75 0.992Terbutylazine Cl tBu Et 4.42 17 0.996Propazine Cl iPr iPr 7.36 10 0.995Deethylatrazine Cl iPr H 2.74 27 0.957Deisopropylatrazine Cl H Et 15.6 5 0.986Deethylterbutylazine Cl tBu H 797 <0.1 0.997Hydroxyatrazine OH iPr Et 400000 <0.01 0.989
a The IC50 is obtained from the inflexion point of the calibration curves and represents the antibody concentration at which50% of the antibody is blocked by the analyte. The cross reactivity (CR) in % was calculated according to the following:CRcross-reactant=IC50,simazine/IC50,cross-reactant×100.
could be obtained by reducing the antibody concen-tration further at the cost of a reduction in the rangeof the assay. Theoretically, it has been shown thatthe optimum concentration of antibody tends to gotowards zero when labelled analyte is used, eitherdetecting the free or bound fraction [25,26].
3.1.5. Cross-reactivity and matrix effectsThe selectivity of the EFIA, here referred to
as cross-reactivity (CR), was tested by comparingstandard curves for simazine, atrazine, propazine,
204 B. Bjarnason et al. / Analytica Chimica Acta 426 (2001) 197–207
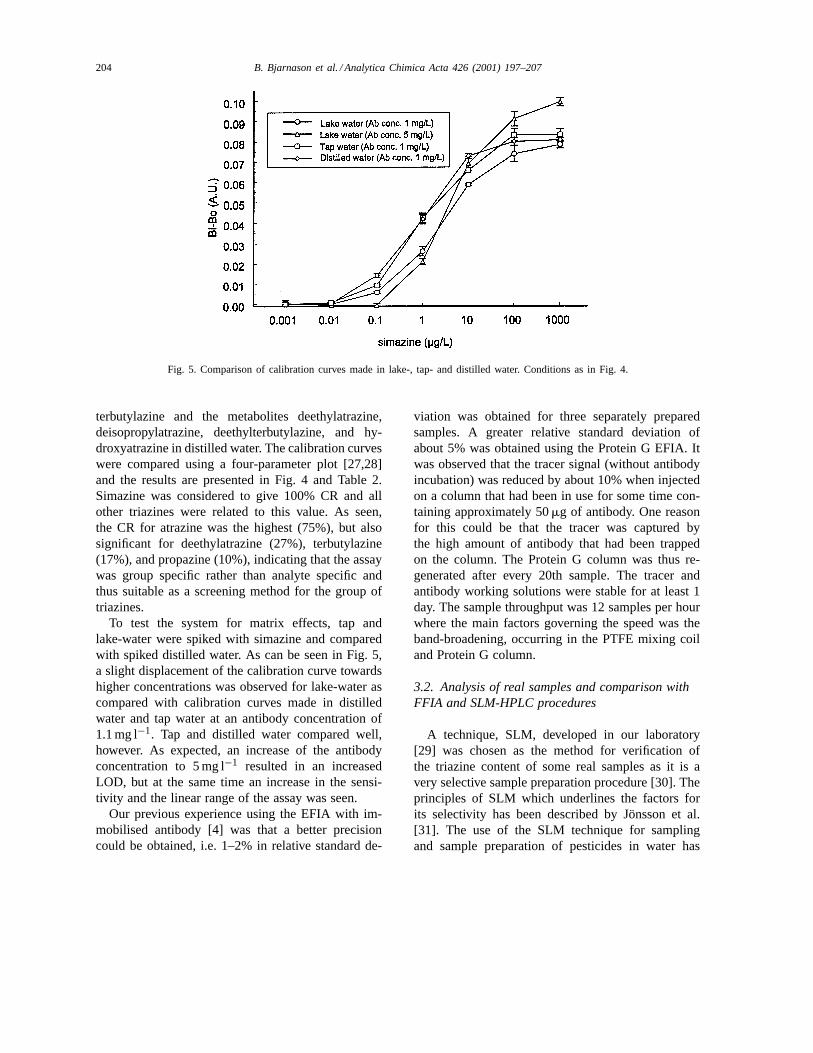
Fig. 5. Comparison of calibration curves made in lake-, tap- and distilled water. Conditions as in Fig. 4.
terbutylazine and the metabolites deethylatrazine,deisopropylatrazine, deethylterbutylazine, and hy-droxyatrazine in distilled water. The calibration curveswere compared using a four-parameter plot [27,28]and the results are presented in Fig. 4 and Table 2.Simazine was considered to give 100% CR and allother triazines were related to this value. As seen,the CR for atrazine was the highest (75%), but alsosignificant for deethylatrazine (27%), terbutylazine(17%), and propazine (10%), indicating that the assaywas group specific rather than analyte specific andthus suitable as a screening method for the group oftriazines.
To test the system for matrix effects, tap andlake-water were spiked with simazine and comparedwith spiked distilled water. As can be seen in Fig. 5,a slight displacement of the calibration curve towardshigher concentrations was observed for lake-water ascompared with calibration curves made in distilledwater and tap water at an antibody concentration of1.1 mg l−1. Tap and distilled water compared well,however. As expected, an increase of the antibodyconcentration to 5 mg l−1 resulted in an increasedLOD, but at the same time an increase in the sensi-tivity and the linear range of the assay was seen.
Our previous experience using the EFIA with im-mobilised antibody [4] was that a better precisioncould be obtained, i.e. 1–2% in relative standard de-
viation was obtained for three separately preparedsamples. A greater relative standard deviation ofabout 5% was obtained using the Protein G EFIA. Itwas observed that the tracer signal (without antibodyincubation) was reduced by about 10% when injectedon a column that had been in use for some time con-taining approximately 50mg of antibody. One reasonfor this could be that the tracer was captured bythe high amount of antibody that had been trappedon the column. The Protein G column was thus re-generated after every 20th sample. The tracer andantibody working solutions were stable for at least 1day. The sample throughput was 12 samples per hourwhere the main factors governing the speed was theband-broadening, occurring in the PTFE mixing coiland Protein G column.
3.2. Analysis of real samples and comparison withFFIA and SLM-HPLC procedures
A technique, SLM, developed in our laboratory[29] was chosen as the method for verification ofthe triazine content of some real samples as it is avery selective sample preparation procedure [30]. Theprinciples of SLM which underlines the factors forits selectivity has been described by Jönsson et al.[31]. The use of the SLM technique for samplingand sample preparation of pesticides in water has
B. Bjarnason et al. / Analytica Chimica Acta 426 (2001) 197–207 205
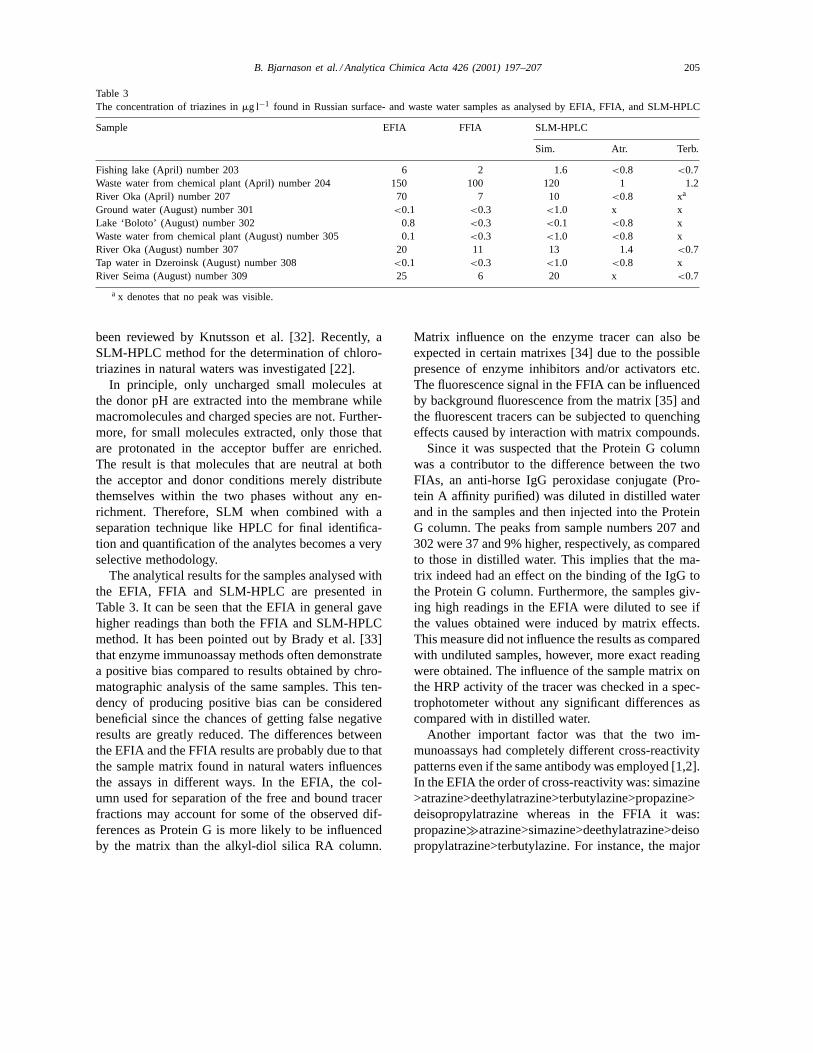
Table 3The concentration of triazines inmg l−1 found in Russian surface- and waste water samples as analysed by EFIA, FFIA, and SLM-HPLC
Sample EFIA FFIA SLM-HPLC
Sim. Atr. Terb.
Fishing lake (April) number 203 6 2 1.6 <0.8 <0.7Waste water from chemical plant (April) number 204 150 100 120 1 1.2River Oka (April) number 207 70 7 10 <0.8 xa
Ground water (August) number 301 <0.1 <0.3 <1.0 x xLake ‘Boloto’ (August) number 302 0.8 <0.3 <0.1 <0.8 xWaste water from chemical plant (August) number 305 0.1 <0.3 <1.0 <0.8 xRiver Oka (August) number 307 20 11 13 1.4 <0.7Tap water in Dzeroinsk (August) number 308 <0.1 <0.3 <1.0 <0.8 xRiver Seima (August) number 309 25 6 20 x <0.7
a x denotes that no peak was visible.
been reviewed by Knutsson et al. [32]. Recently, aSLM-HPLC method for the determination of chloro-triazines in natural waters was investigated [22].
In principle, only uncharged small molecules atthe donor pH are extracted into the membrane whilemacromolecules and charged species are not. Further-more, for small molecules extracted, only those thatare protonated in the acceptor buffer are enriched.The result is that molecules that are neutral at boththe acceptor and donor conditions merely distributethemselves within the two phases without any en-richment. Therefore, SLM when combined with aseparation technique like HPLC for final identifica-tion and quantification of the analytes becomes a veryselective methodology.
The analytical results for the samples analysed withthe EFIA, FFIA and SLM-HPLC are presented inTable 3. It can be seen that the EFIA in general gavehigher readings than both the FFIA and SLM-HPLCmethod. It has been pointed out by Brady et al. [33]that enzyme immunoassay methods often demonstratea positive bias compared to results obtained by chro-matographic analysis of the same samples. This ten-dency of producing positive bias can be consideredbeneficial since the chances of getting false negativeresults are greatly reduced. The differences betweenthe EFIA and the FFIA results are probably due to thatthe sample matrix found in natural waters influencesthe assays in different ways. In the EFIA, the col-umn used for separation of the free and bound tracerfractions may account for some of the observed dif-ferences as Protein G is more likely to be influencedby the matrix than the alkyl-diol silica RA column.
Matrix influence on the enzyme tracer can also beexpected in certain matrixes [34] due to the possiblepresence of enzyme inhibitors and/or activators etc.The fluorescence signal in the FFIA can be influencedby background fluorescence from the matrix [35] andthe fluorescent tracers can be subjected to quenchingeffects caused by interaction with matrix compounds.
Since it was suspected that the Protein G columnwas a contributor to the difference between the twoFIAs, an anti-horse IgG peroxidase conjugate (Pro-tein A affinity purified) was diluted in distilled waterand in the samples and then injected into the ProteinG column. The peaks from sample numbers 207 and302 were 37 and 9% higher, respectively, as comparedto those in distilled water. This implies that the ma-trix indeed had an effect on the binding of the IgG tothe Protein G column. Furthermore, the samples giv-ing high readings in the EFIA were diluted to see ifthe values obtained were induced by matrix effects.This measure did not influence the results as comparedwith undiluted samples, however, more exact readingwere obtained. The influence of the sample matrix onthe HRP activity of the tracer was checked in a spec-trophotometer without any significant differences ascompared with in distilled water.
Another important factor was that the two im-munoassays had completely different cross-reactivitypatterns even if the same antibody was employed [1,2].In the EFIA the order of cross-reactivity was: simazine>atrazine>deethylatrazine>terbutylazine>propazine>deisopropylatrazine whereas in the FFIA it was:propazine�atrazine>simazine>deethylatrazine>deisopropylatrazine>terbutylazine. For instance, the major
206 B. Bjarnason et al. / Analytica Chimica Acta 426 (2001) 197–207
atrazine metabolite, deethylatrazine, had a CR valueof 36% relative to atrazine in the EFIA whereas inthe FFIA the cross-reactivity was only 8%. Thereforeit is likely that deethylatrazine will have a greaterimpact on the EFIA than on the FFIA assay whichthus will give higher readings for the former. Vari-ables that influence the overall selectivity of theFFIA have been discussed by Önnerfjord et al. [3].Some cross reactivity can also be expected to occurfrom other compounds. The EFIA was tested with2,4-dichiorophenoxyacetic acid (2,4-D) to see if thiscommonly used non triazine pesticide could crossreact with the antibody. 2,4-D resulted in a signalat 10 mg l−1, meaning that even if triazines are notpresent, false positives can be obtained in highly con-taminated areas. In a study by Galassi and Boniardi[36] it was concluded that discrepancies between bio-logical and chemical determinations could very likelybe ascribed to triazine metabolites. Our study con-firms this even if sample 207 and 302 gave too highsignals in the EFIA to explain it by metabolites alone.
4. Conclusions
The presented EFIA has been shown to have po-tential as a method for screening for the group of tri-azines at concentrations greater than 0.1mg l−1, sincethe used anti-simazine antibody showed relativelyhigh cross reactivity with the triazine compounds.The developed assay resulted in higher throughput(12 samples per hour) than the previously developedmethod for detection of the bound fraction [4], as re-generation is not required after each sample injection.Regeneration of the Protein G column is, however,recommended at certain intervals to keep the columnfresh. One important advantage of the current EFIAmethod is that it is more general than the former [4]as it in principle can be adapted to be used with allantibodies that can be trapped on a Protein G column,without having to be concerned with the preparationof antibody or antigen affinity supports. The rela-tive standard deviation of the method was somewhatpoorer than that of the former [4], which could bedue to that an additional reagent (the antibody) mustbe mixed with sample (or standard) prior to analysis.
Our study has shown that the EFIA can be usedfor rapid screening of triazine herbicides in real
surface and waste water. The results reveal, however,that despite the high inherent sensitivity and selectiv-ity it is influenced by matrix effects and may requireindependent verification especially if more specificdata is required.
Acknowledgements
The authors gratefully acknowledge financial sup-port from the Swedish Institute (SI), the SwedishNatural Science Research Council (NFR), theSwedish Board for Technical and Industrial Devel-opment (NUTEK), and the European Commission(EC contracts IC15CT98-0910, IC15CT98-0138,ENV4-CT97-0476). Prof. K.-S. Boos and D. Lubda,Merck, are also gratefully acknowledged for provid-ing us with RA material.
References
[1] G.A. LeBlane, L.J. Bain, V.S. Wilson, Mol. Cell. Endocrin.126 (1997) 1.
[2] C.D. Watts, B. Hegarty, Pure Appl. Chem. 67 (1995) 1533.[3] P. Önnerfjord, S.A. Eremin, J. Emnéus, G. Marko-Varga, J.
Chromatogr. A 800 (1998) 219.[4] B. Bjarnason, N. Bousios, S. Eremin, G. Johansson, Anal.
Chim. Acta 347 (1997) 111.[5] P.M. Krämer, B.A. Baumann, P.G. Stoks, Anal. Chim. Acta
347 (1997) 187.[6] J. Gascón, A. Oubiñia, I. Ferrer, P. Önnerfjord, G. Marko-
Varga, B.D. Hammock, M.-P. Marco, D. Barceló, Anal. Chim.Acta 330 (1996) 41.
[7] M. Dietrich, P.M. Krämer, Food Agric. Immunol. 7 (1995)203.
[8] K. Kronkvist, Determination of steroids in biosamples atpicomolar levels using enzyme-immunochemical methods,Doctoral Dissertation, Department of Analytical Chemistry,University of Lund, Lund, Sweden, 1993.
[9] D.A. Palmer, T.E. Edmons, N.J. Seare, Analyst 117 (1992)1679.
[10] P.F. Hernando, J.A. Miller, J. Pharm. Biomed. Anal. 9 (1992)1121.
[11] J.N. Miller, D.A. Palmer, M.T. French, J. Pharm. Biomed.Anal. 9 (1991) 1115.
[12] Y. Fintschenko, G.S. Wilson, Mikrochim. Acta 129 (1998) 7.[13] J.J. Miller, S.S. Levinson, in: E.P. Diamandis, T.K.
Christopolus (Eds.), Academic Press, Immunoassay, SanDiego, CA, 1996, p. 1441.
[14] P. Schneider, S.J. Gee, S.B. Kreissig, A.S. Harris, P. Krämer,M.-P. Marco, A.D. Lucas, B.D. Hammock, in: D.A. Kurtz,J.H. Skerritt, L. Stanker (Eds.), New Frontiers in Agrochemi-cal Immunoassay, AOAC International, 1995, pp. 103–121
B. Bjarnason et al. / Analytica Chimica Acta 426 (2001) 197–207 207
[15] W. Stöcklein, A. Gebbert, R. Schmid, Anal. Lett. 23 (1990)1465.
[16] G. Strangl, M.C. Weller, R. Niessner, Fresenius’ J. Anal.Chem. 351 (1995) 301.
[17] M. Wortberg, M.H. Goodrow, S.J. Gee, B.D. Hammock, JAgric. Food Chem. 44 (1996) 2210.
[18] S.D.W. Comber, C.D. Watts, B. Young, Analyst 121 (1996)1485.
[19] J. Gascón, A. Oubiña, B. Ballesteros, D. Barcelo, F. Camps,M.-P. Marco, M.A.G. Martinez, S. Morais, R. Puchades, A.Maquieira, Anal. Chim. Acta 347 (1997) 149.
[20] M.H. Goodrow, R.O. Harrison, B.D. Hammock, J. Agric.Food Chem. 38 (1990) 990.
[21] T.A. Giersch, J. Agric. Food Chem. 41 (1993) 1006.[22] L. Chimuka, M.M. Nindi, J.-Å. Jönsson, Int. J. Environ. Anal.
Chem. 68 (1997) 429.[23] C. Wittman, B. Hock, Food Agric. Immunol. 12 (1989) 211.[24] J. Guesdon, T. Avrameas, T.S. Ternynck, J. Histochem.
Cytochem. 27 (1979) 1113.[25] R.P. Ekins, in: W.P. Collins (Ed.), Alternative Immunoassay,
Wiley, New York, 1985, pp. 219–239.[26] P. Oroszlan, G.L. Duveneck, M. Ehrat, H.M. Widmer, Sensors
Actuators B 11 (1993) 301.
[27] C.A. Thompson, P. Spoms, J. Agric. Food Chem. 43 (1995)254.
[28] J.J. Manclús, A. Montoya, J. Agric. Food Chem. 44 (1996)3710.
[29] G. Audunsson, Anal. Chem. 58 (1986) 2714.[30] G. Nilvé, M. Knutsson, J.-Å. Jönsson, J. Chromatogr. A 668
(1994) 75.[31] J.-Å. Jönsson, P. Lövkvist, G. Audunsson, G. Nilvé, Anal.
Chim. Acta 277 (1993) 9.[32] M. Knutsson, G. Nilvé, L. Mathiasson, J.-Å. Jönsson, J.
Chromatogr. A 754 (1996) 197.[33] J.F. Brady, G.S. LeMasters, R.K. Williams, J.H. Pittman,
J.P. Daubert, M.W. Cheung, D.H. Skinner, J. Turner, M.A.Rowland, J. Lange, S.M. Sobek, J. Agric. Food Chem. 43(1995) 268.
[34] M. Vanderlaan, L. Stacker, B. Watkins, in: M. Vanderlaan,L. Stacker, B. Watkins, D. Roberts (Eds.), Immunoassaysfor Trace Chemical Analysis, ACS Symp. Ser 451, 1991,pp. 2–13
[35] E. Soini, in: W.P. Collins (Ed.), Alternative Immunoassays,Wiley, UK, 1985, p. 20.
[36] S. Galassi, N. Boniardi, Chimica Oggi 9 (1991) 49.