environmental performance and the cost of capital: evidence from reit bonds and commercial...
TRANSCRIPT
Environmental Performance and the Cost of Capital:
Evidence from REIT Commercial Mortgages and Bonds
Piet Eichholtz
Rogier Holtermans
Nils Kok
Erkan Yönder
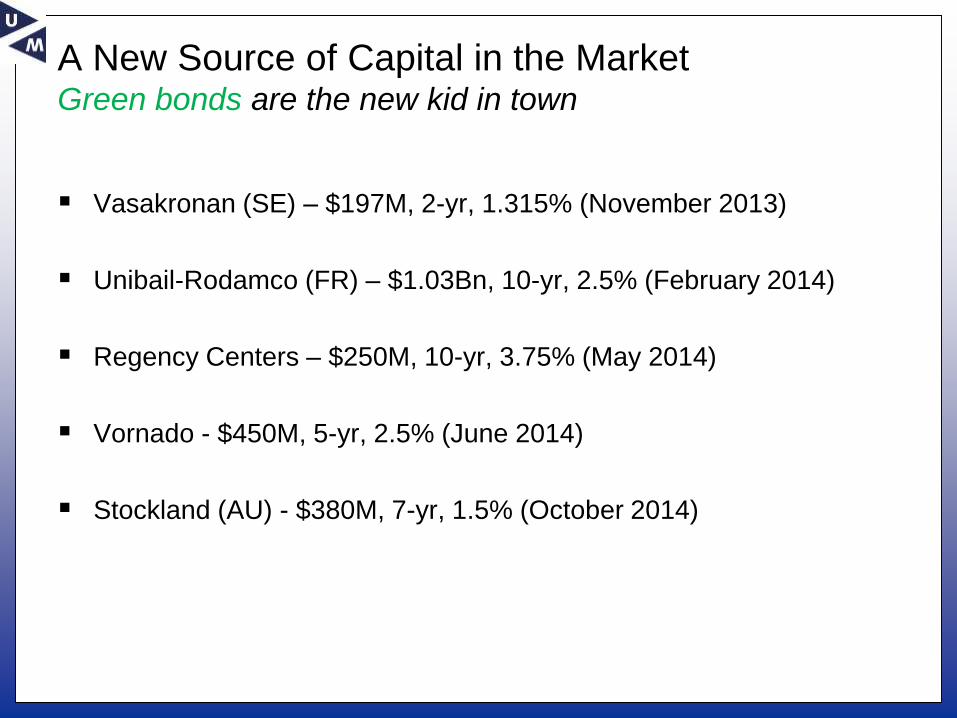
A New Source of Capital in the MarketGreen bonds are the new kid in town
Vasakronan (SE) – $197M, 2-yr, 1.315% (November 2013)
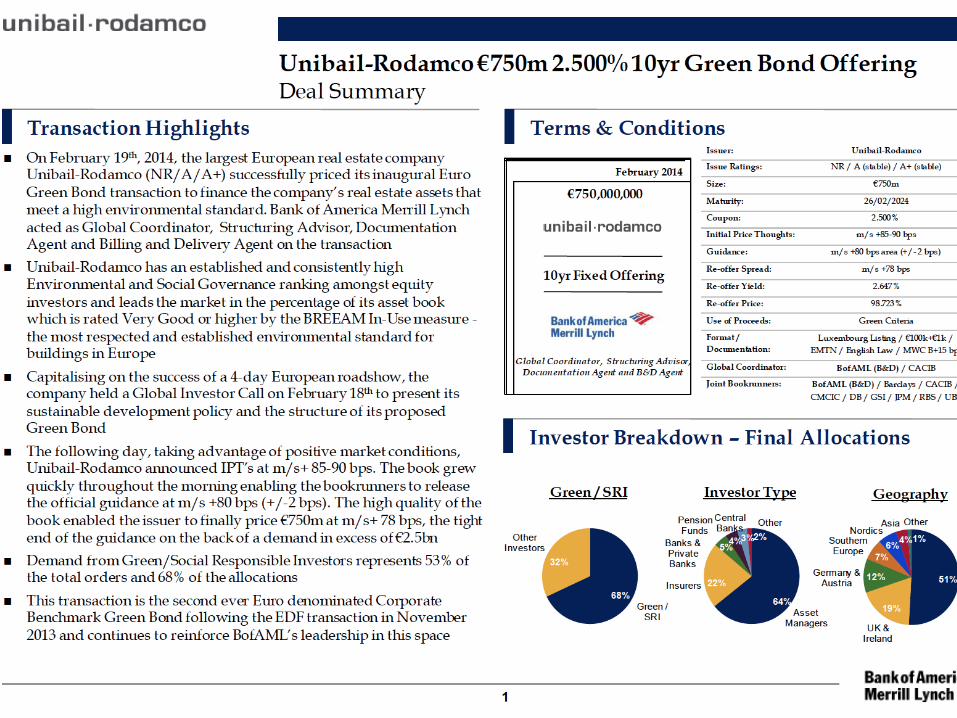
Unibail-Rodamco (FR) – $1.03Bn, 10-yr, 2.5% (February 2014)
Regency Centers – $250M, 10-yr, 3.75% (May 2014)
Vornado - $450M, 5-yr, 2.5% (June 2014)
Stockland (AU) - $380M, 7-yr, 1.5% (October 2014)

Energy Efficiency, Sustainability, and Real EstateBuildings directly exposed to regulatory risk
The real estate sector is responsible
for about 80 percent of US electricity consumption
for 40 percent of global carbon emissions
Increasing attention to carbon emissions from buildings
Mandatory disclosure laws
Real Estate Investment Trusts (REITs) are listed property companies.
Have to generate 75% of their income from real estate
Mainly buy, operate, and sell properties
Large exposure to “stranded asset” risk
Green building certifications “guarantee” certain level of sustainability and environmental performance.
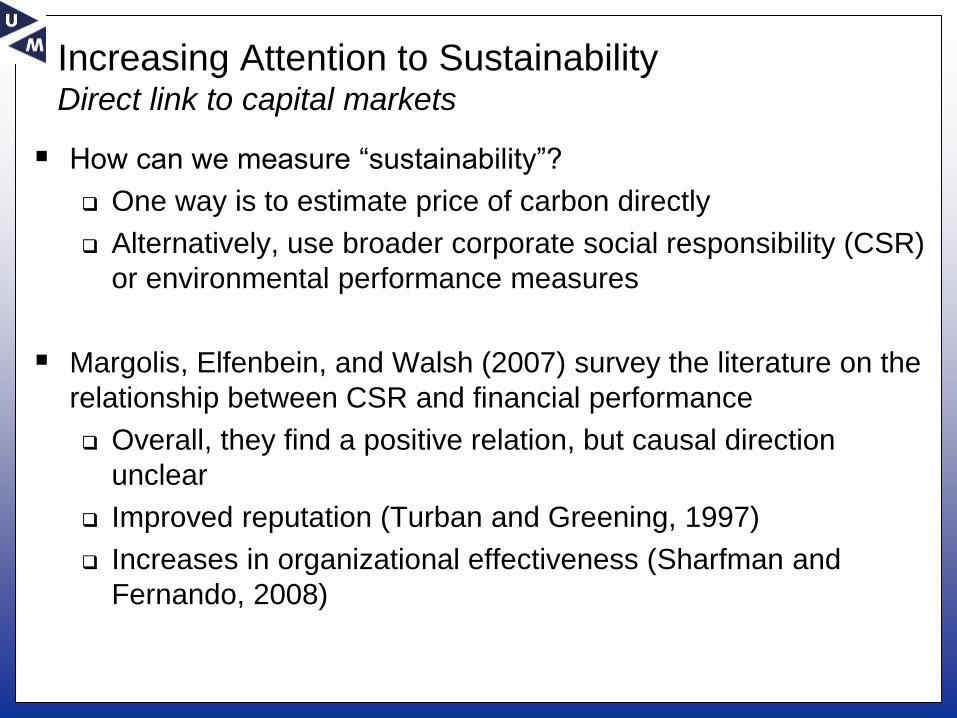
Increasing Attention to SustainabilityDirect link to capital markets
How can we measure “sustainability”?
One way is to estimate price of carbon directly
Alternatively, use broader corporate social responsibility (CSR)
or environmental performance measures
Margolis, Elfenbein, and Walsh (2007) survey the literature on the
relationship between CSR and financial performance
Overall, they find a positive relation, but causal direction
unclear
Improved reputation (Turban and Greening, 1997)
Increases in organizational effectiveness (Sharfman and
Fernando, 2008)
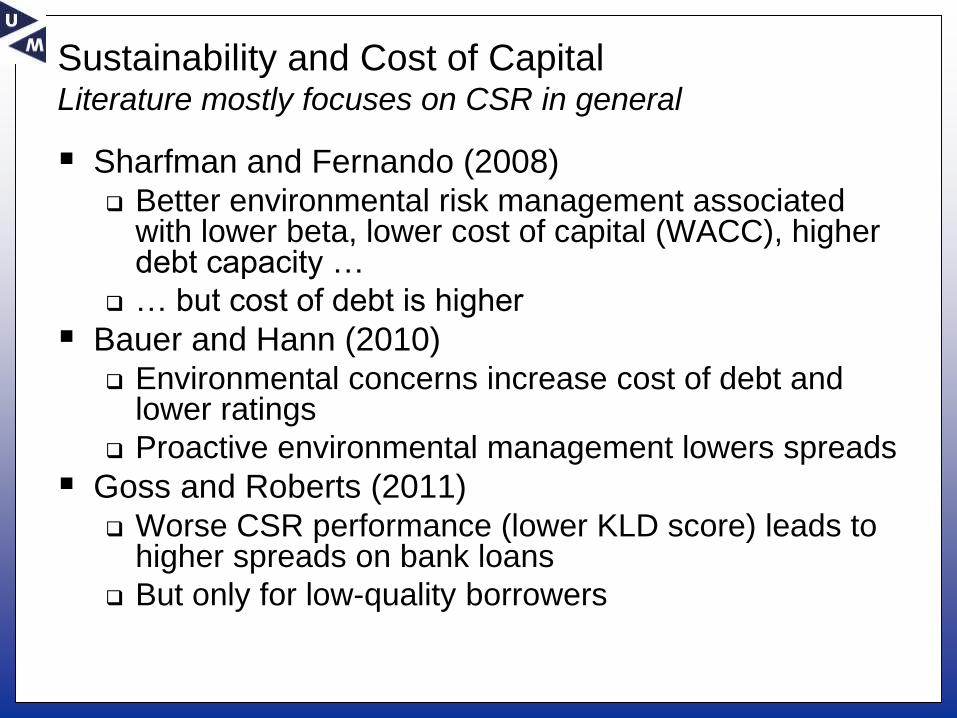
Sustainability and Cost of CapitalLiterature mostly focuses on CSR in general
Sharfman and Fernando (2008) Better environmental risk management associated
with lower beta, lower cost of capital (WACC), higher debt capacity …
… but cost of debt is higher
Bauer and Hann (2010) Environmental concerns increase cost of debt and
lower ratings
Proactive environmental management lowers spreads
Goss and Roberts (2011) Worse CSR performance (lower KLD score) leads to
higher spreads on bank loans
But only for low-quality borrowers
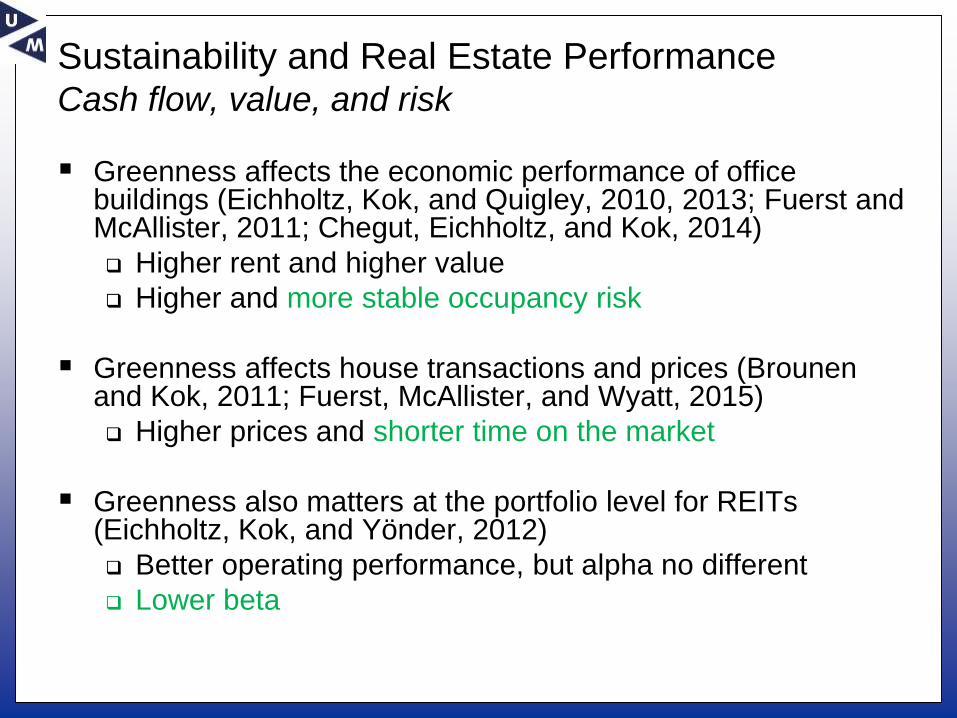
Sustainability and Real Estate PerformanceCash flow, value, and risk
Greenness affects the economic performance of office buildings (Eichholtz, Kok, and Quigley, 2010, 2013; Fuerst and McAllister, 2011; Chegut, Eichholtz, and Kok, 2014)
Higher rent and higher value
Higher and more stable occupancy risk
Greenness affects house transactions and prices (Brounenand Kok, 2011; Fuerst, McAllister, and Wyatt, 2015)
Higher prices and shorter time on the market
Greenness also matters at the portfolio level for REITs (Eichholtz, Kok, and Yönder, 2012)
Better operating performance, but alpha no different
Lower beta
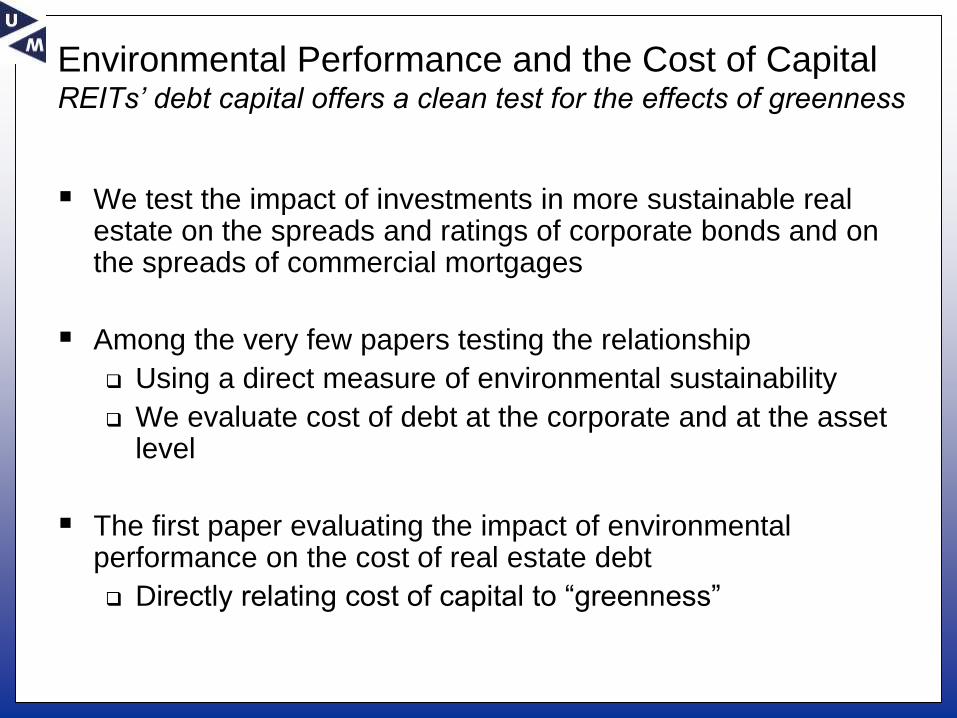
Environmental Performance and the Cost of CapitalREITs’ debt capital offers a clean test for the effects of greenness
We test the impact of investments in more sustainable real estate on the spreads and ratings of corporate bonds and on the spreads of commercial mortgages
Among the very few papers testing the relationship
Using a direct measure of environmental sustainability
We evaluate cost of debt at the corporate and at the asset level
The first paper evaluating the impact of environmental performance on the cost of real estate debt
Directly relating cost of capital to “greenness”

DataREIT corporate bonds and commercial mortgages
We collect data for US REITs’ commercial mortgages and corporate bonds from SNL Financial
We calculate spreads at origination using constant maturity treasury rates
Using the closest time to maturity at origination
Final dataset consists of
3044 properties collateralizing REIT commercial mortgages from 2003 until 2012
412 corporate bond issues of 57 REITs, 2003 - 2011
Bond ratings translated to numbers
In our data set, S&P rating ranges from 7 (B-) to 17 (A) while Moody’s ranges from 8 (B2) to 17 (A2)

We Use LEED and Energy Star Labels to Assess
Greenness
LEED
The program has been initiated by the US Green Building Council (USGBC).
LEED covers six different components of sustainability, including energy performance and material selection.
Energy Star
Founded in 1992 by the U.S. Environment Protection Agency (EPA) and the U.S. Department of Energy (DOE).
Energy star evaluates the efficiency of buildings‘ energy use with respect to a base building of similar size and quality.
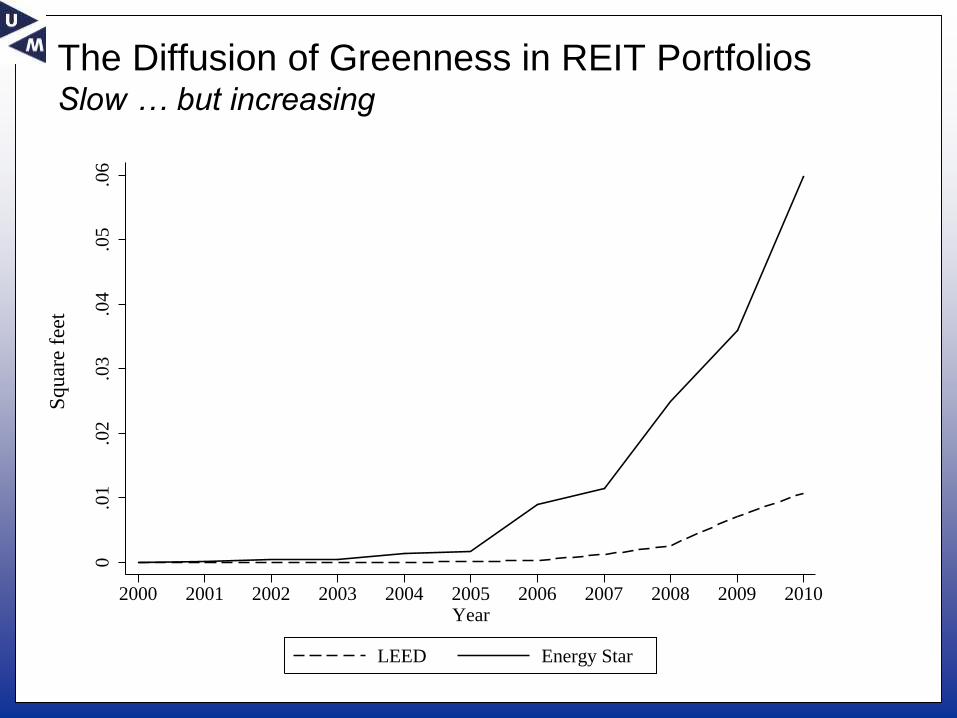
The Diffusion of Greenness in REIT PortfoliosSlow … but increasing
0.0
1.0
2.0
3.0
4.0
5.0
6
2000 2001 2002 2003 2004 2005 2006 2007 2008 2009 2010Year
LEED Energy Star
Sq
uar
e fe
et
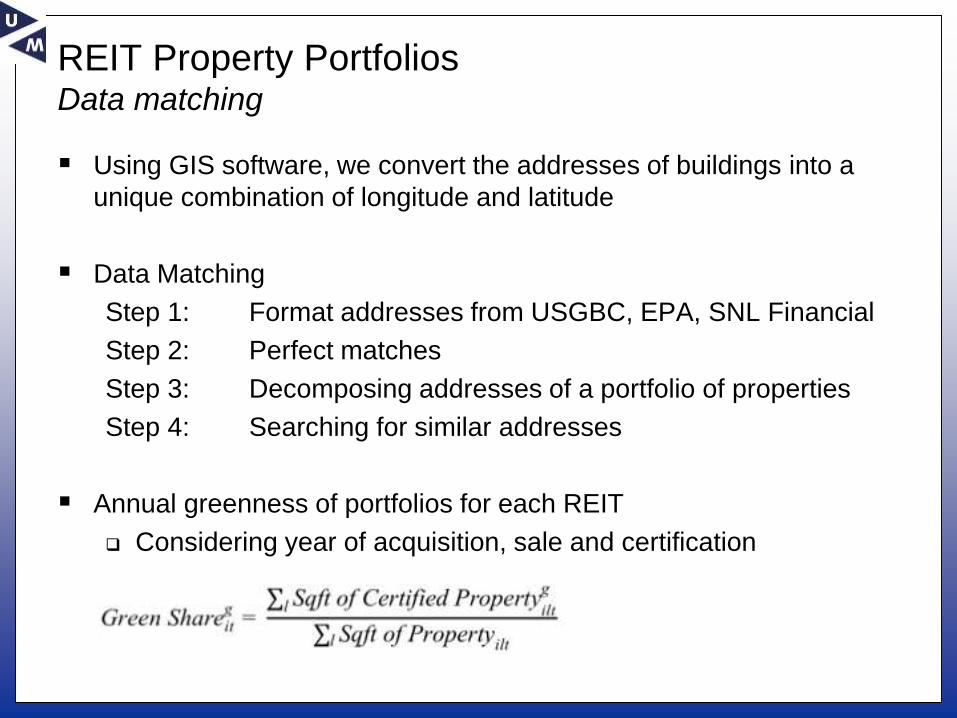
REIT Property PortfoliosData matching
Using GIS software, we convert the addresses of buildings into a
unique combination of longitude and latitude
Data Matching
Step 1: Format addresses from USGBC, EPA, SNL Financial
Step 2: Perfect matches
Step 3: Decomposing addresses of a portfolio of properties
Step 4: Searching for similar addresses
Annual greenness of portfolios for each REIT
Considering year of acquisition, sale and certification
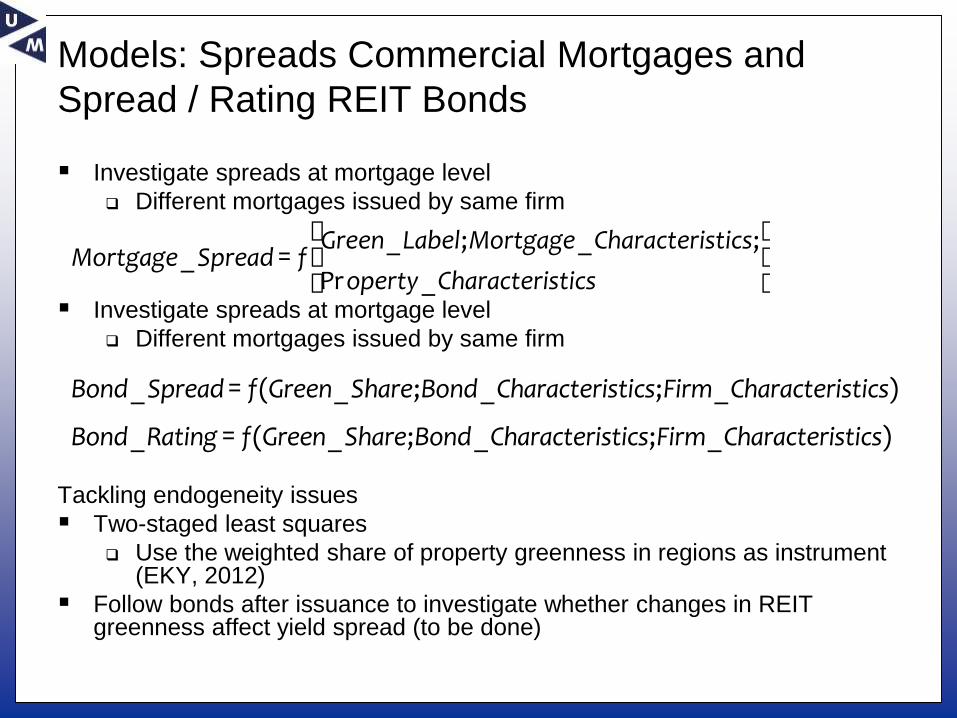
Models: Spreads Commercial Mortgages and
Spread / Rating REIT Bonds
Investigate spreads at mortgage level
Different mortgages issued by same firm
Investigate spreads at mortgage level
Different mortgages issued by same firm
Tackling endogeneity issues
Two-staged least squares
Use the weighted share of property greenness in regions as instrument (EKY, 2012)
Follow bonds after issuance to investigate whether changes in REIT greenness affect yield spread (to be done)
Bond_Spread= f(Green_Share;Bond_Characteristics;Firm_Characteristics)
Bond_Rating = f(Green_Share;Bond_Characteristics;Firm_Characteristics)
Mortgage_Spread= fGreen_Label;Mortgage_Characteristics;
Property_Characteristics
æ
èç
ö
ø÷
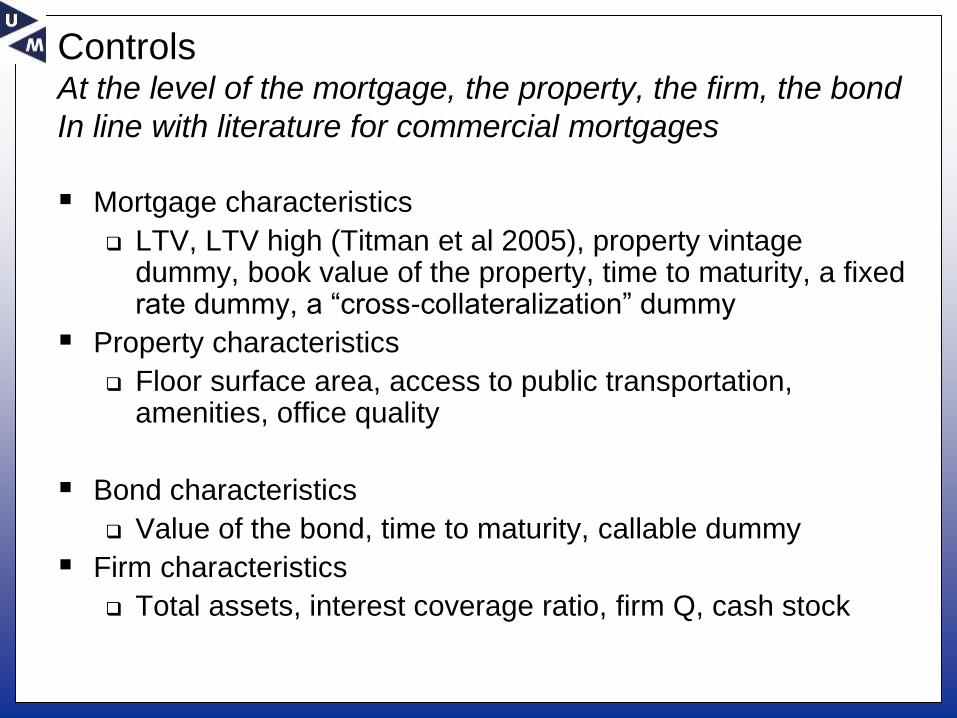
ControlsAt the level of the mortgage, the property, the firm, the bond
In line with literature for commercial mortgages
Mortgage characteristics
LTV, LTV high (Titman et al 2005), property vintage dummy, book value of the property, time to maturity, a fixed rate dummy, a “cross-collateralization” dummy
Property characteristics
Floor surface area, access to public transportation, amenities, office quality
Bond characteristics
Value of the bond, time to maturity, callable dummy
Firm characteristics
Total assets, interest coverage ratio, firm Q, cash stock
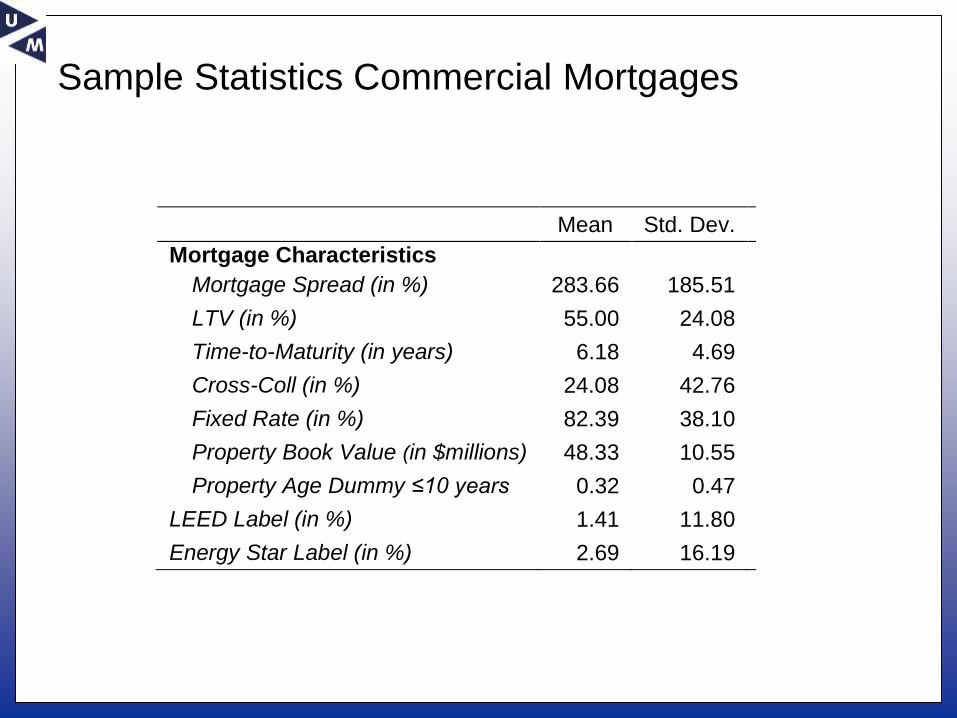
Sample Statistics Commercial Mortgages
Mean Std. Dev. Obs.
Mortgage Characteristics
Mortgage Spread (in %) 283.66 185.51 3044
LTV (in %) 55.00 24.08 3044
Time-to-Maturity (in years) 6.18 4.69 3044
Cross-Coll (in %) 24.08 42.76 3044
Fixed Rate (in %) 82.39 38.10 3044
Property Book Value (in $millions) 48.33 10.55 3044
Property Age Dummy ≤10 years 0.32 0.47 3044
LEED Label (in %) 1.41 11.80 3044
Energy Star Label (in %) 2.69 16.19 3044
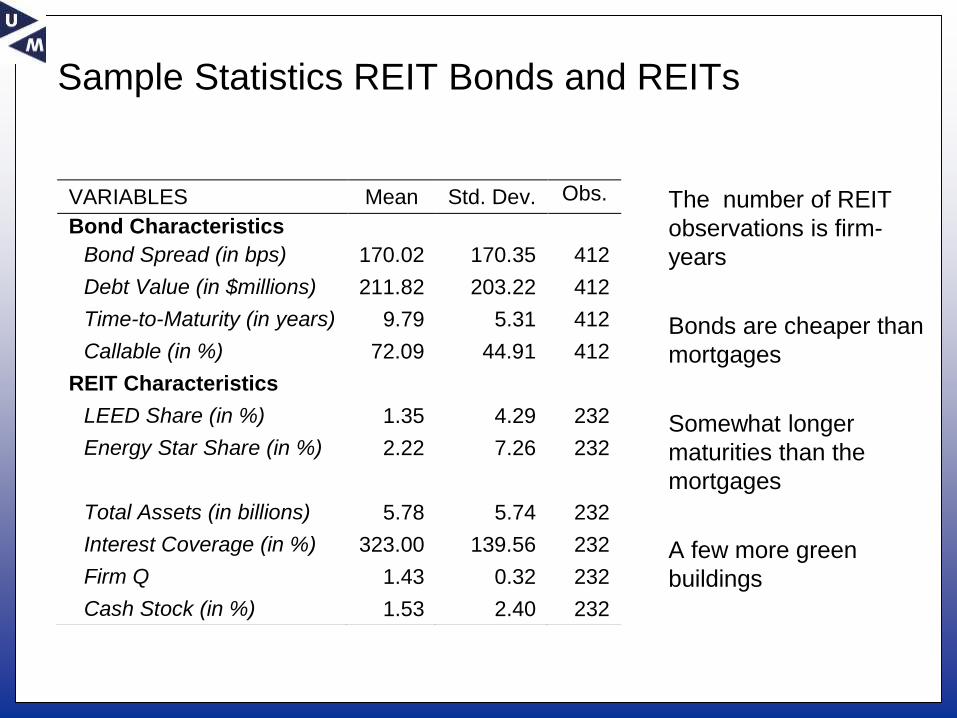
Sample Statistics REIT Bonds and REITs
The number of REIT
observations is firm-
years
Bonds are cheaper than
mortgages
Somewhat longer
maturities than the
mortgages
A few more green
buildings
VARIABLES Mean Std. Dev. Obs.
Bond Characteristics
Bond Spread (in bps) 170.02 170.35 412
Debt Value (in $millions) 211.82 203.22 412
Time-to-Maturity (in years) 9.79 5.31 412
Callable (in %) 72.09 44.91 412
REIT Characteristics
LEED Share (in %) 1.35 4.29 232
Energy Star Share (in %) 2.22 7.26 232
Total Assets (in billions) 5.78 5.74 232
Interest Coverage (in %) 323.00 139.56 232
Firm Q 1.43 0.32 232
Cash Stock (in %) 1.53 2.40 232
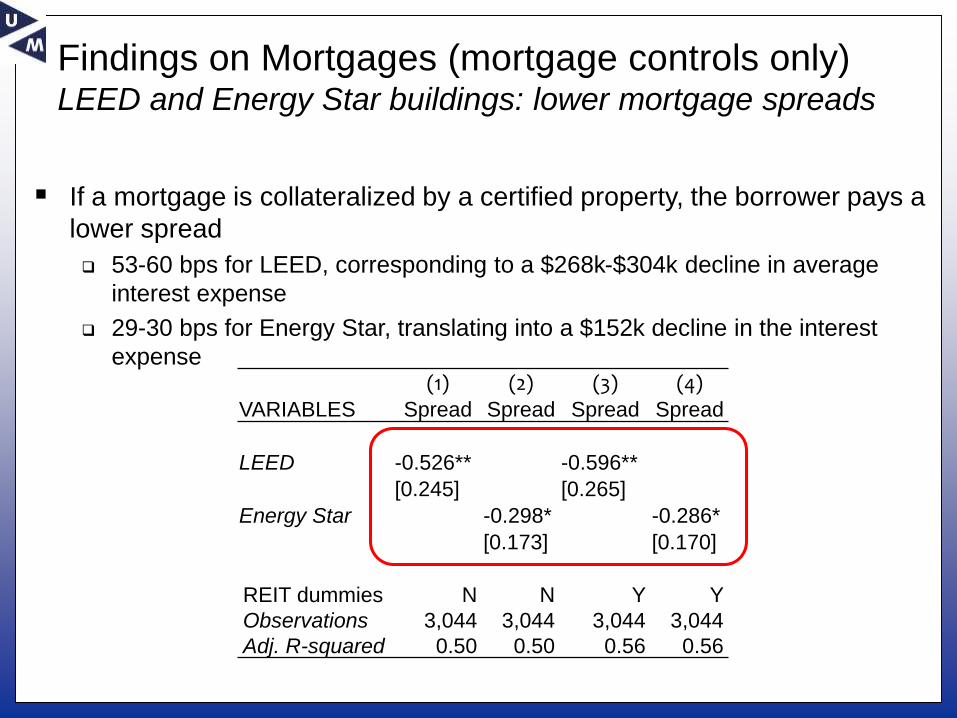
Findings on Mortgages (mortgage controls only)LEED and Energy Star buildings: lower mortgage spreads
(1) (2) (3) (4)
VARIABLES Spread Spread Spread Spread
LEED -0.526** -0.596**
[0.245] [0.265]
Energy Star -0.298* -0.286*
[0.173] [0.170]
REIT dummies N N Y Y
Observations 3,044 3,044 3,044 3,044
Adj. R-squared 0.50 0.50 0.56 0.56
If a mortgage is collateralized by a certified property, the borrower pays a
lower spread
53-60 bps for LEED, corresponding to a $268k-$304k decline in average
interest expense
29-30 bps for Energy Star, translating into a $152k decline in the interest
expense
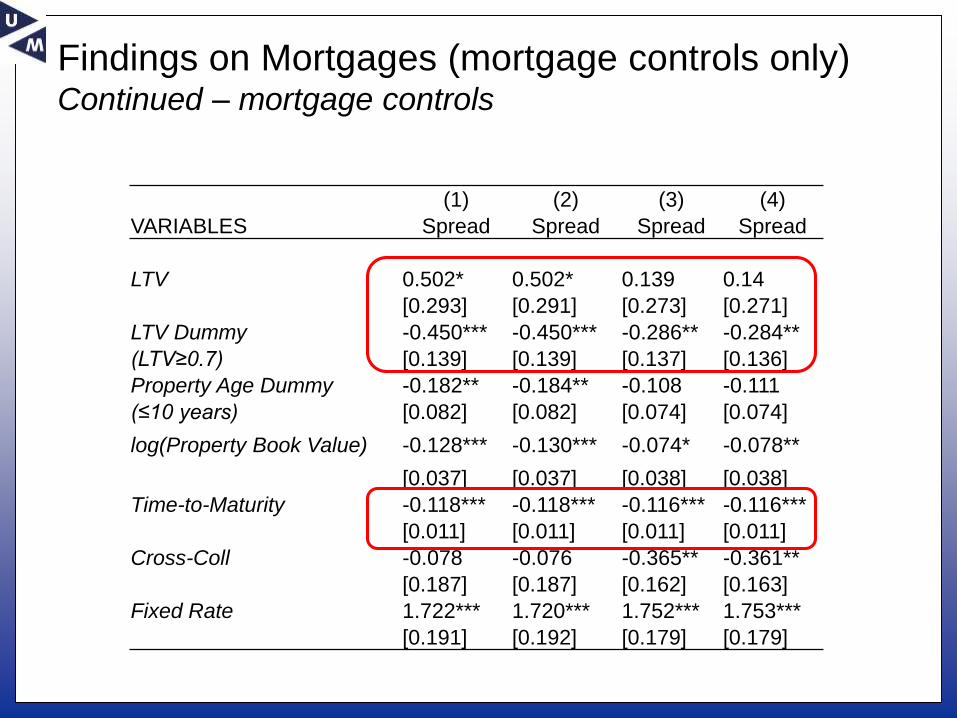
Findings on Mortgages (mortgage controls only)Continued – mortgage controls
(1) (2) (3) (4)
VARIABLES Spread Spread Spread Spread
LTV 0.502* 0.502* 0.139 0.14
[0.293] [0.291] [0.273] [0.271]
LTV Dummy -0.450*** -0.450*** -0.286** -0.284**
(LTV≥0.7) [0.139] [0.139] [0.137] [0.136]
Property Age Dummy -0.182** -0.184** -0.108 -0.111
(≤10 years) [0.082] [0.082] [0.074] [0.074]
log(Property Book Value) -0.128*** -0.130*** -0.074* -0.078**
[0.037] [0.037] [0.038] [0.038]
Time-to-Maturity -0.118*** -0.118*** -0.116*** -0.116***
[0.011] [0.011] [0.011] [0.011]
Cross-Coll -0.078 -0.076 -0.365** -0.361**
[0.187] [0.187] [0.162] [0.163]
Fixed Rate 1.722*** 1.720*** 1.752*** 1.753***
[0.191] [0.192] [0.179] [0.179]
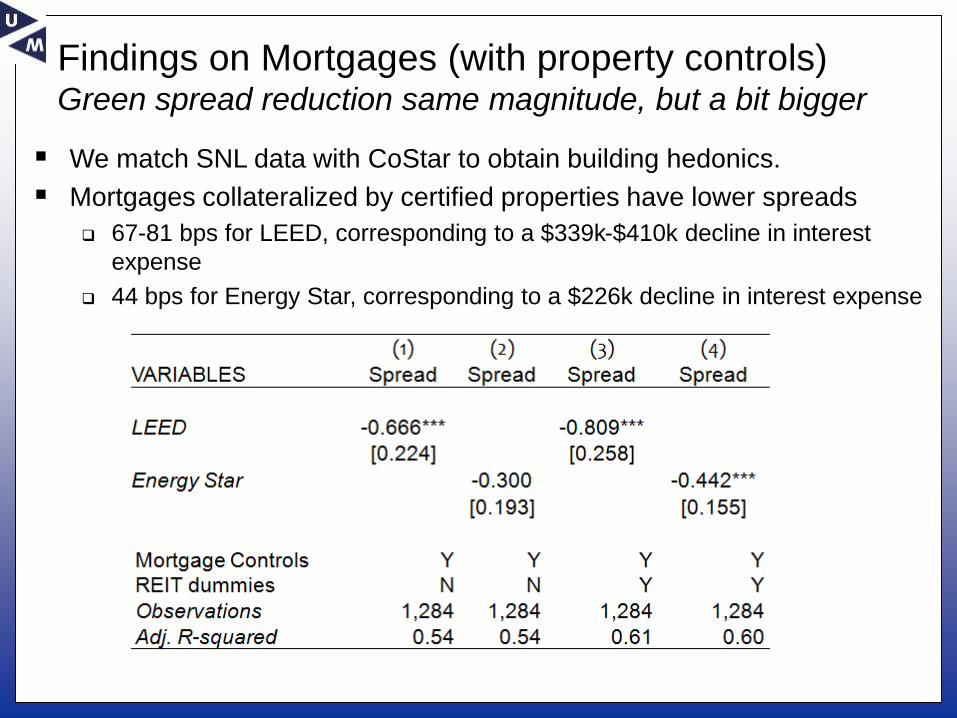
Findings on Mortgages (with property controls)Green spread reduction same magnitude, but a bit bigger
We match SNL data with CoStar to obtain building hedonics.
Mortgages collateralized by certified properties have lower spreads
67-81 bps for LEED, corresponding to a $339k-$410k decline in interest
expense
44 bps for Energy Star, corresponding to a $226k decline in interest expense
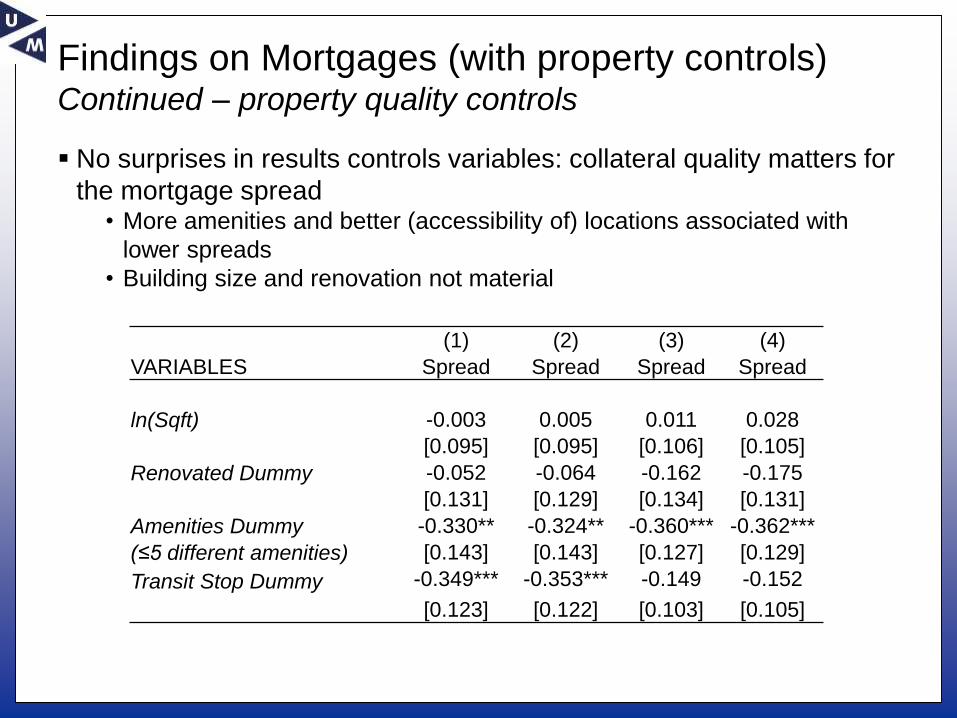
Findings on Mortgages (with property controls) Continued – property quality controls
No surprises in results controls variables: collateral quality matters for
the mortgage spread• More amenities and better (accessibility of) locations associated with
lower spreads
• Building size and renovation not material
(1) (2) (3) (4)
VARIABLES Spread Spread Spread Spread
ln(Sqft) -0.003 0.005 0.011 0.028
[0.095] [0.095] [0.106] [0.105]
Renovated Dummy -0.052 -0.064 -0.162 -0.175
[0.131] [0.129] [0.134] [0.131]
Amenities Dummy -0.330** -0.324** -0.360*** -0.362***
(≤5 different amenities) [0.143] [0.143] [0.127] [0.129]
Transit Stop Dummy -0.349*** -0.353*** -0.149 -0.152
[0.123] [0.122] [0.103] [0.105]

Findings on Office Mortgages (with property controls)Spread reduction effect is robust
The regression now includes a Class A quality dummy
Mortgages collateralized by certified offices have lower spreads
59-78 bps for LEED, corresponding to a $298k-$395k decline in the interest
expense
38 bps for Energy Star, corresponding to a $196k decline in interest expense
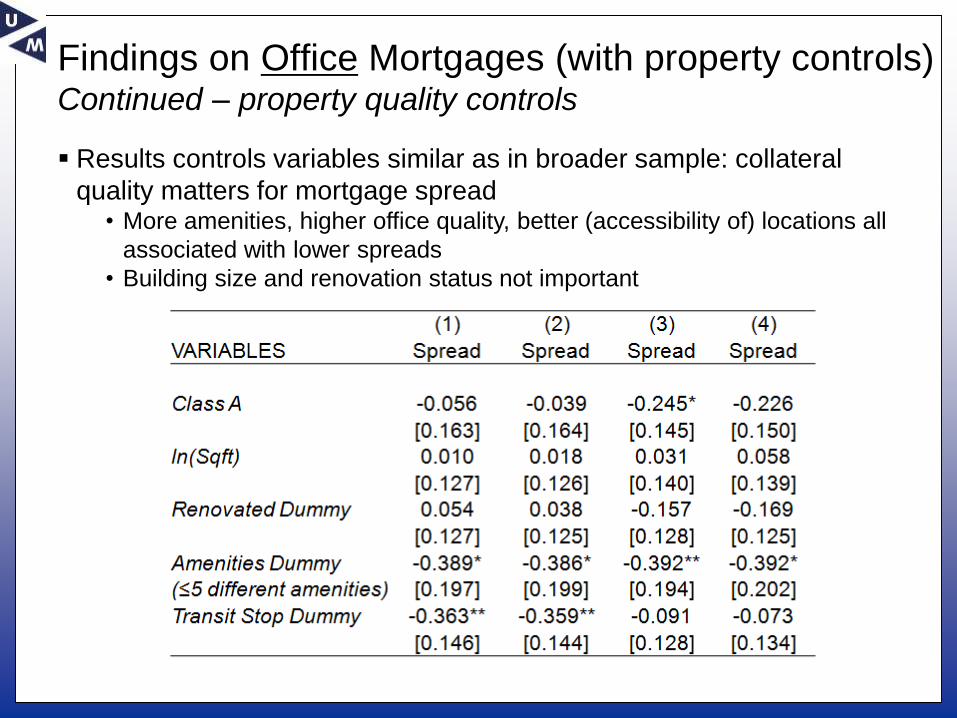
Findings on Office Mortgages (with property controls) Continued – property quality controls
Results controls variables similar as in broader sample: collateral
quality matters for mortgage spread• More amenities, higher office quality, better (accessibility of) locations all
associated with lower spreads
• Building size and renovation status not important
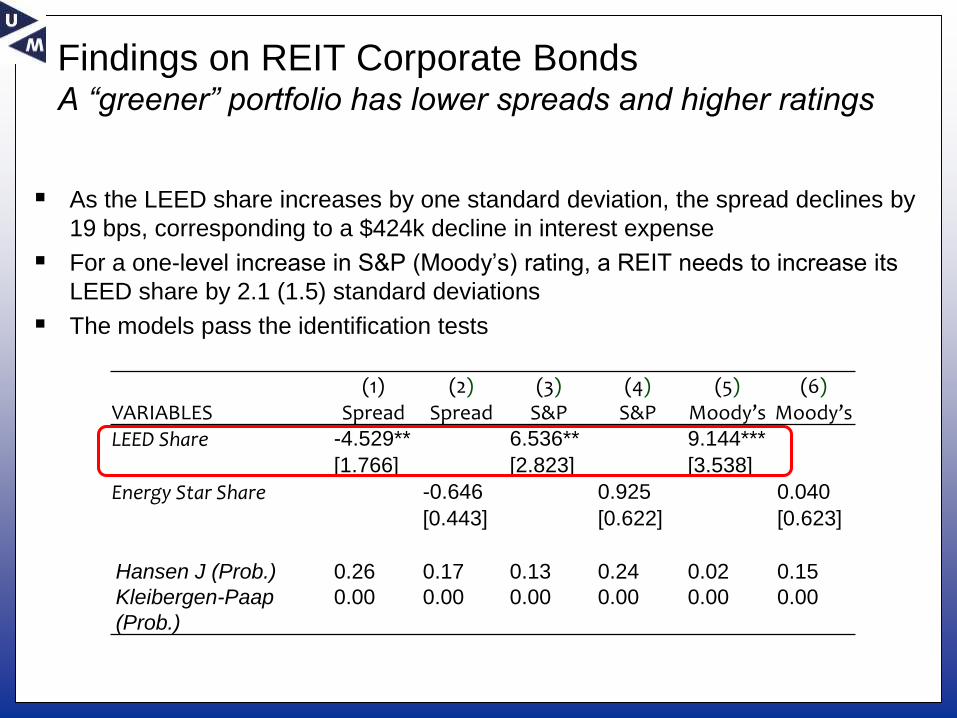
Findings on REIT Corporate BondsA “greener” portfolio has lower spreads and higher ratings
As the LEED share increases by one standard deviation, the spread declines by
19 bps, corresponding to a $424k decline in interest expense
For a one-level increase in S&P (Moody’s) rating, a REIT needs to increase its
LEED share by 2.1 (1.5) standard deviations
The models pass the identification tests
(1) (2) (3) (4) (5) (6)
VARIABLES Spread Spread S&P S&P Moody’s Moody’s
LEED Share -4.529** 6.536** 9.144***
[1.766] [2.823] [3.538]
Energy Star Share -0.646 0.925 0.040
[0.443] [0.622] [0.623]
Hansen J (Prob.) 0.26 0.17 0.13 0.24 0.02 0.15
Kleibergen-Paap
(Prob.)
0.00 0.00 0.00 0.00 0.00 0.00

Findings on REIT Corporate BondsContinued – firm and bond controls
(1) (2) (3) (4) (5) (6)
VARIABLES Spread Spread S&P S&P Moody’s Moody’s
log(Debt Value) -0.032 -0.008 0.113** 0.064* 0.094** 0.081**
[0.071] [0.065] [0.046] [0.034] [0.048] [0.041]
Time-to-Maturity -0.130*** -0.136*** -0.001 0.002 -0.002 -0.006
[0.034] [0.036] [0.009] [0.008] [0.011] [0.010]
Callable 0.586** 0.567** 0.087 -0.137 0.328 0.081
[0.243] [0.239] [0.219] [0.179] [0.245] [0.189]
log(Firm Size) -0.174* -0.264*** 0.832*** 0.848*** 0.706*** 0.757***
(lagged) [0.097] [0.072] [0.161] [0.150] [0.147] [0.158]
Interest Coverage -0.358*** -0.306*** -0.272*** -0.207*** -0.219*** -0.166
(lagged) [0.057] [0.054] [0.059] [0.070] [0.066] [0.122]
Interest Coverage 0.016*** 0.010*** 0.031** 0.024* 0.011 0.010
(squared/lagged) [0.003] [0.003] [0.014] [0.014] [0.017] [0.024]
Firm Q -0.316 -0.467* 1.980*** 2.030*** 1.426*** 1.469***
(lagged) [0.271] [0.278] [0.464] [0.458] [0.308] [0.320]
Cash Stock 0.577 3.198 4.599 2.130 -1.145 -1.827
(lagged) [3.072] [3.003] [3.149] [2.803] [3.030] [3.145]
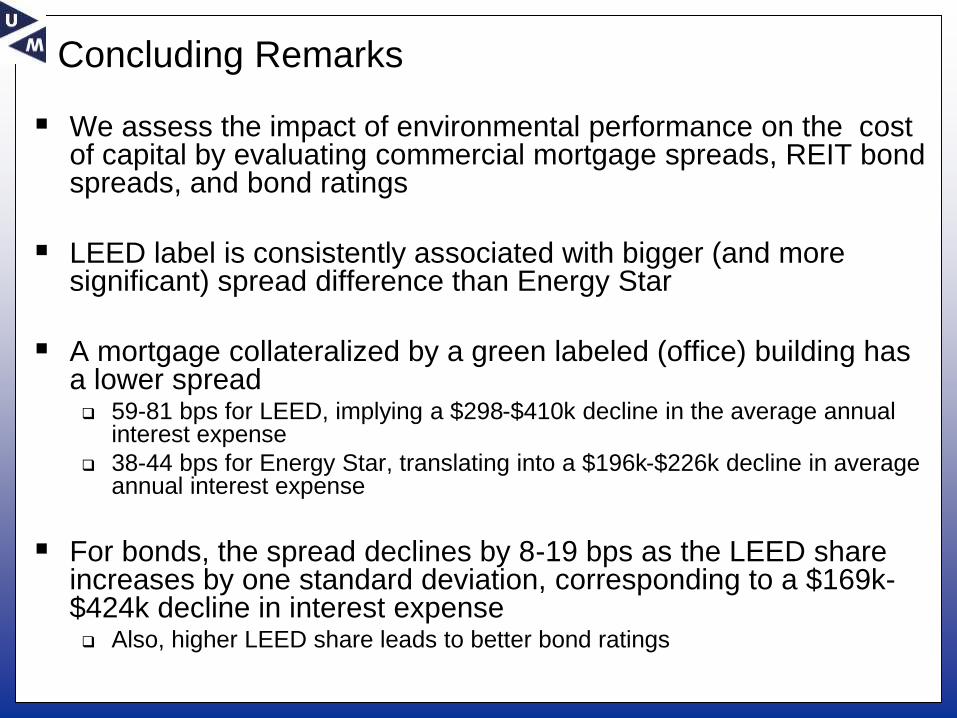
Concluding Remarks
We assess the impact of environmental performance on the cost of capital by evaluating commercial mortgage spreads, REIT bond spreads, and bond ratings
LEED label is consistently associated with bigger (and more significant) spread difference than Energy Star
A mortgage collateralized by a green labeled (office) building has a lower spread 59-81 bps for LEED, implying a $298-$410k decline in the average annual
interest expense
38-44 bps for Energy Star, translating into a $196k-$226k decline in average annual interest expense
For bonds, the spread declines by 8-19 bps as the LEED share increases by one standard deviation, corresponding to a $169k-$424k decline in interest expense Also, higher LEED share leads to better bond ratings
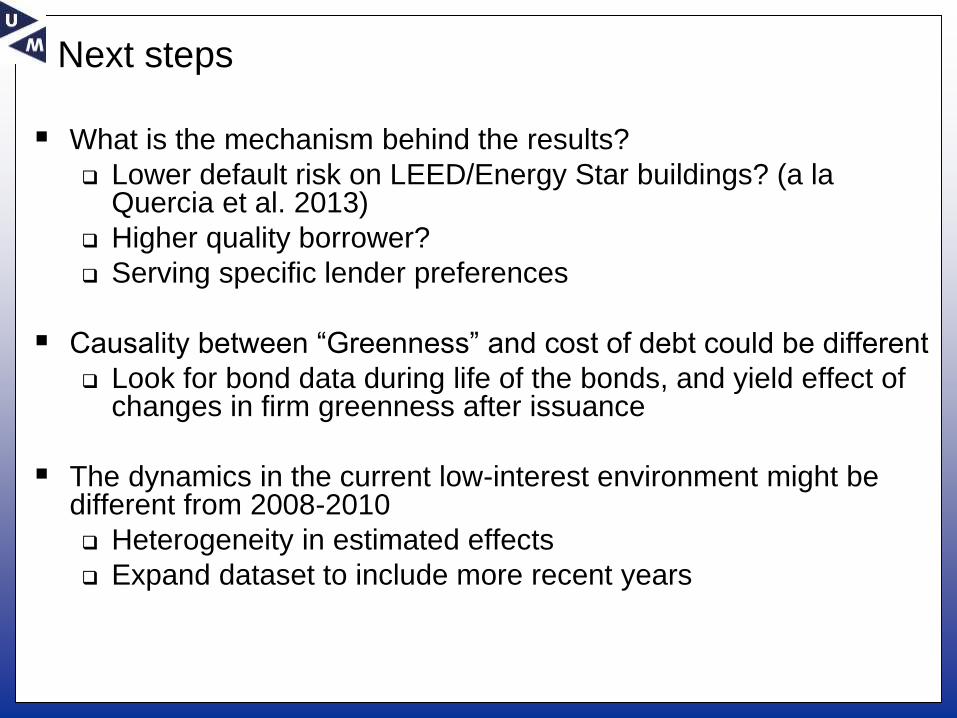
Next steps
What is the mechanism behind the results?
Lower default risk on LEED/Energy Star buildings? (a la Quercia et al. 2013)
Higher quality borrower?
Serving specific lender preferences
Causality between “Greenness” and cost of debt could be different
Look for bond data during life of the bonds, and yield effect of changes in firm greenness after issuance
The dynamics in the current low-interest environment might be different from 2008-2010
Heterogeneity in estimated effects
Expand dataset to include more recent years