environmental and socio-economic analysis of naphtha ......of naphtha reforming was dominant in ghg...
TRANSCRIPT

sustainability
Article
Environmental and Socio-Economic Analysis ofNaphtha Reforming Hydrogen Energy UsingInput-Output Tables: A Case Study from Japan
Shunichi Hienuki
Center for Creation of Symbiosis Society with Risk (CCSSR), Yokohama National University, 79-5 Tokiwadai,Hodogaya, Yokohama 240-8501, Japan; [email protected]; Tel.: +81-45-339-4459
Received: 31 May 2017; Accepted: 1 August 2017; Published: 4 August 2017
Abstract: Comprehensive risk assessment across multiple fields is required to assess the potentialutility of hydrogen energy technology. In this research, we analyzed environmental andsocio-economic effects during the entire life cycle of a hydrogen energy system using input-outputtables. The target system included hydrogen production by naphtha reforming, transportation tohydrogen stations, and FCV (Fuel Cell Vehicle) refilling. The results indicated that 31%, 44%, and 9%of the production, employment, and greenhouse gas (GHG) emission effects, respectively, duringthe manufacturing and construction stages were temporary. During the continuous operation andmaintenance stages, these values were found to be 69%, 56%, and 91%, respectively. The effectof naphtha reforming was dominant in GHG emissions and the effect of electrical power inputon the entire system was significant. Production and employment had notable effects in both thedirect and indirect sectors, including manufacturing (pumps, compressors, and chemical machinery)and services (equipment maintenance and trade). This study used data to introduce a life cycleperspective to environmental and socio-economic analysis of hydrogen energy systems and theresults will contribute to their comprehensive risk assessment in the future.
Keywords: hydrogen energy system; socio-economic effect; environmental effect; input-output table;life cycle inventory analysis
1. Introduction
We currently face significant environmental and energy problems. In particular, economic activityand greenhouse gas (GHG) production are strongly correlated [1]. Current GHG emissions are expectedto increase by one-third before 2040, based on current projections of economic development andpopulation growth in the Middle East, India, China, Africa, and Southeast Asia [2]. Hydrogenenergy technology is expected to address this problem. In the latest Basic Energy Plan, the Japanesegovernment expressed the need for comprehensive analysis of hydrogen energy technology fromthe perspectives of environmental safety, convenience, and economy throughout the entire supplychain, including production, transportation, and utilization of hydrogen [3]. In addition, the Japanesegovernment intends to employ hydrogen energy in transport, athletes’ villages, and venues during theTokyo Olympic and Paralympic Games in 2020 [4]. Fuel cell vehicles (FCVs) have been available onthe Japanese market since 2015. The Tokyo Metropolitan Government is aiming to build 35 hydrogenfueling stations by 2020 [5].
The triple bottom line viewpoint says that energy technology is an important element ofa functioning society [6]. International Organization for Standardization/ International ElectrotechnicalCommission (ISO/ICE) Guide 73 [7] defines risk as the “effect of uncertainty on objectives”,and effect as “deviation from the expected-positive and/or negative”. In his social risk analysis forenergy systems and social infrastructure, Branscomb [8] indicated 13 features—including agriculture,
Sustainability 2017, 9, 1376; doi:10.3390/su9081376 www.mdpi.com/journal/sustainability

Sustainability 2017, 9, 1376 2 of 16
food, water, public health, emergency services, government, defense industrial base, information andtelecommunications energy, transportation (people and products), banking and finance, the chemicalindustry, and postal and shipping—that are important for the functioning of a city, with reference toUnited States Department of Homeland Security [9]. Shi et al. [10] assessed social risks associated withthe process of urban development using observations, expert meetings, interviews, and discussionforums. Furthermore, in energy technology analysis, McLellan et al. [11] studied the social risks ofthe main power generation technologies when impacted by natural disasters from points of view ofhumanity, society, economics, manufacturing, and nature. In addition, Japanese decision-making andsocial acceptance emphasizes a balance of multiple values, including stable economic foundation,safety, security, reliable social systems, and sustainable and good relationships among differentgroups. [12,13]; therefore, it is important to identify the variety of risks generated by new energytechnologies and systems in order to promote their popularity within society and consider risk balanceamong various fields.
To date, Japanese hydrogen energy technology has been analyzed in several areas. In the safetyfield, Sakamoto et al. [14] analyzed the safety distance between pieces of equipment in a hydrogenfueling station; Nakayama et al. [15] analyzed accident scenarios that could occur in hydrogen stations;and Okada et al. [16] analyzed the safety of organic chemical hydride. Ono and Tsunemi [17] suggestedthat providing precise risk information contributes to better acceptance. In the economic field,cost analyses of the manufacturing, construction, and operation phases have been conducted [18–24].Additionally, environmental analyses have focused on CO2 emissions in the supply chain duringhydrogen production [25–29].
However, many of these studies were not conducted from a consistent, holistic point of view asoperators and technicians in their respective areas developed them independently. Studies of futureenergy technology from an inclusive viewpoint that spans all areas and incorporates the values of usersare very limited. Furthermore, studies that adopt a life cycle perspective across multiple industriesare lacking.
Input-output analysis is useful as a method for life cycle analyses. The effectiveness ofinput-output analysis and scenario analysis for energy technology has been demonstrated, especiallyfor renewable energy technology [30–36]. Currently, Lee et al. [37] and Chun et al. [38] are developinganalyses for hydrogen energy systems to harness attention for future development.
This study aimed to highlight the environmental and socio-economic effects caused by thehydrogen energy system during its life cycle in Japan, using input-output tables. This basic analysisintroduces the assessment of life cycle effects of hydrogen energy systems and will assist in futurecomprehensive risk (In reference to the ISO/ICE Guide 73 [7], risk is defined as the “effect of uncertaintyon objectives.” In addition, similarly, the effect is defined as “a deviation from the expected—positiveand/or negative.”) analysis of hydrogen energy technology.
2. Materials and Methods
2.1. Input-Output Analysis
Input-output analysis can comprehensively estimate direct and indirect effects caused by finaldemand. Balance of the input-output table is shown in Equation (1). Direct and indirect production Xwas estimated using Equation (2). Using the diagonal matrix of employment l, and GHG emissions g,direct and indirect employment L and GHG emissions G were estimated using Equations (3) and (4),respectively:
AX + f = X, (1)
X = (I − A)−1 f, (2)
L = l·X, (3)
G = g·X, (4)
Sustainability 2017, 9, 1376 3 of 16
where A is the input coefficient matrix, I is the unit matrix, and f is the final demand columnvector calculated using the detailed cost. The Ministry of Internal Affairs and Communications 2011edition includes the latest version of the input-output table [39]. However, the Japanese economicsand energy systems were strongly affected by the Great East Japan Earthquake in 2011, and noinformation is available to estimate GHG emissions. Therefore, we used the input-output table of 2005(520 × 407 sectors) [40], employment table [40], and 3EID (Embodied Energy and Emission IntensityData for Japan) [41] for our calculations. We assumed that all production activities occurred in Japanbecause we focused on highlighting the direct and indirect effects of each sector in the hydrogenenergy system.
2.2. Assumptions of the Hydrogen Energy System
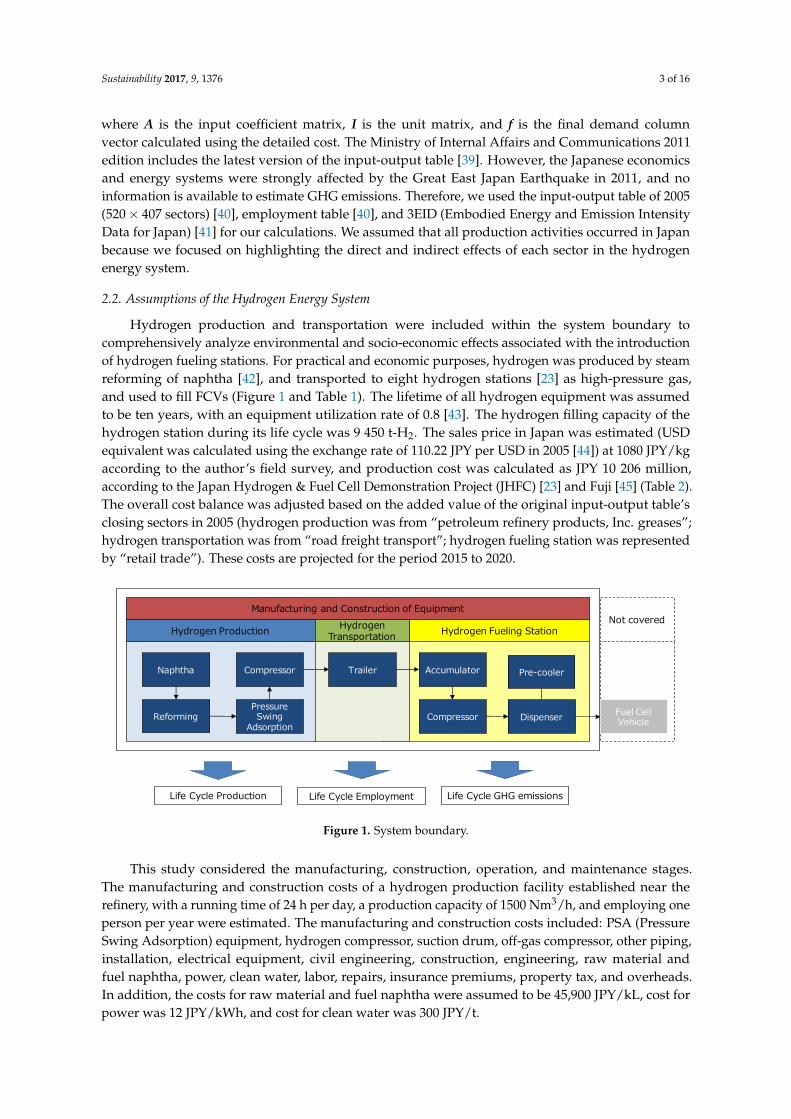
Hydrogen production and transportation were included within the system boundary tocomprehensively analyze environmental and socio-economic effects associated with the introductionof hydrogen fueling stations. For practical and economic purposes, hydrogen was produced by steamreforming of naphtha [42], and transported to eight hydrogen stations [23] as high-pressure gas,and used to fill FCVs (Figure 1 and Table 1). The lifetime of all hydrogen equipment was assumedto be ten years, with an equipment utilization rate of 0.8 [43]. The hydrogen filling capacity of thehydrogen station during its life cycle was 9 450 t-H2. The sales price in Japan was estimated (USDequivalent was calculated using the exchange rate of 110.22 JPY per USD in 2005 [44]) at 1080 JPY/kgaccording to the author’s field survey, and production cost was calculated as JPY 10 206 million,according to the Japan Hydrogen & Fuel Cell Demonstration Project (JHFC) [23] and Fuji [45] (Table 2).The overall cost balance was adjusted based on the added value of the original input-output table’sclosing sectors in 2005 (hydrogen production was from “petroleum refinery products, Inc. greases”;hydrogen transportation was from “road freight transport”; hydrogen fueling station was representedby “retail trade”). These costs are projected for the period 2015 to 2020.
Sustainability 2017, 9, 1376 3 of 16
where is the input coefficient matrix, is the unit matrix, and is the final demand column vector calculated using the detailed cost. The Ministry of Internal Affairs and Communications 2011 edition includes the latest version of the input-output table [39]. However, the Japanese economics and energy systems were strongly affected by the Great East Japan Earthquake in 2011, and no information is available to estimate GHG emissions. Therefore, we used the input-output table of 2005 (520 × 407 sectors) [40], employment table [40], and 3EID (Embodied Energy and Emission Intensity Data for Japan) [41] for our calculations. We assumed that all production activities occurred in Japan because we focused on highlighting the direct and indirect effects of each sector in the hydrogen energy system.
2.2. Assumptions of the Hydrogen Energy System
Hydrogen production and transportation were included within the system boundary to comprehensively analyze environmental and socio-economic effects associated with the introduction of hydrogen fueling stations. For practical and economic purposes, hydrogen was produced by steam reforming of naphtha [42], and transported to eight hydrogen stations [23] as high-pressure gas, and used to fill FCVs (Figure 1 and Table 1). The lifetime of all hydrogen equipment was assumed to be ten years, with an equipment utilization rate of 0.8 [43]. The hydrogen filling capacity of the hydrogen station during its life cycle was 9 450 t-H2. The sales price in Japan was estimated (USD equivalent was calculated using the exchange rate of 110.22 JPY per USD in 2005 [44]) at 1080 JPY/kg according to the author’s field survey, and production cost was calculated as JPY 10 206 million, according to the Japan Hydrogen & Fuel Cell Demonstration Project (JHFC) [23] and Fuji [45] (Table 2). The overall cost balance was adjusted based on the added value of the original input-output table’s closing sectors in 2005 (hydrogen production was from “petroleum refinery products, Inc. greases”; hydrogen transportation was from “road freight transport”; hydrogen fueling station was represented by “retail trade”). These costs are projected for the period 2015 to 2020.
Figure 1. System boundary.
This study considered the manufacturing, construction, operation, and maintenance stages. The manufacturing and construction costs of a hydrogen production facility established near the refinery, with a running time of 24 h per day, a production capacity of 1500 Nm3/h, and employing one person per year were estimated. The manufacturing and construction costs included: PSA (Pressure Swing Adsorption) equipment, hydrogen compressor, suction drum, off-gas compressor, other piping, installation, electrical equipment, civil engineering, construction, engineering, raw material and fuel naphtha, power, clean water, labor, repairs, insurance premiums, property tax, and overheads. In addition, the costs for raw material and fuel naphtha were assumed to be 45,900 JPY/kL, cost for power was 12 JPY/kWh, and cost for clean water was 300 JPY/t.
Transportation routes included path from the production location to the eight hydrogen fueling stations. Transport distance was assumed to be 100 km per round trip, and eight round trips per day
Hydrogen Production
Pressure Swing
Adsorption
Compressor
Hydrogen Fueling Station
Trailer Accumulator
Compressor DispenserReforming
Naphtha Pre-cooler
Hydrogen Transportation
Life Cycle Production Life Cycle Employment Life Cycle GHG emissions
Manufacturing and Construction of EquipmentNot covered
Fuel Cell Vehicle
Figure 1. System boundary.
This study considered the manufacturing, construction, operation, and maintenance stages.The manufacturing and construction costs of a hydrogen production facility established near therefinery, with a running time of 24 h per day, a production capacity of 1500 Nm3/h, and employing oneperson per year were estimated. The manufacturing and construction costs included: PSA (PressureSwing Adsorption) equipment, hydrogen compressor, suction drum, off-gas compressor, other piping,installation, electrical equipment, civil engineering, construction, engineering, raw material andfuel naphtha, power, clean water, labor, repairs, insurance premiums, property tax, and overheads.In addition, the costs for raw material and fuel naphtha were assumed to be 45,900 JPY/kL, cost forpower was 12 JPY/kWh, and cost for clean water was 300 JPY/t.

Sustainability 2017, 9, 1376 4 of 16
Transportation routes included path from the production location to the eight hydrogen fuelingstations. Transport distance was assumed to be 100 km per round trip, and eight round trips per daywere undertaken for each station. Eight trailers and two tractors were used for transport. Each trailerconsisted of 68 pieces of the CFRP (Carbon Fiber-Reinforced Plastics) container (45 MPa). Trailers wereallocated as follows: eight trailers in detention, two trailers in transportation, and two trailers in filling.However, we assumed that only four tractors were produced within the life cycle, as the lifetime ofeach tractor is five years. In addition, we assumed that 2 km/L of light oil was required for transport,at a unit price of 120 JPY/L, and four laborers are used per year.
Hydrogen stations were assumed to be built at eight off-site locations, producing 300 Nm3/h,and operating 15 h every day. Manufacturing and construction costs included costs for the pressureaccumulator (high pressure), compressor (filling), hydrogen dispenser, pre-cooler equipment, hydrogenvalve, hydrogen sensors, civil engineering, construction, and engineering. In the operation andmaintenance stages, costs of 2.98 kWh/kg-H2 power requirement for equipment control, lightingpower, and pre-cooler starting power/maintaining power/H2 distribution were considered, in additionto regular maintenance costs.
The details of final demand (f) created from the above-mentioned prerequisite and the costinformation are described in Appendix A.
Table 1. Preconditions of the hydrogen energy system.
Activity Amount/Rate Unit Reference
HydrogenProduction
Supply capacity 1500 Nm3/h [23]Business hours 24 hUtilization rate 0.8 - [43]Lifetime 10 years
[23]Employment 1 person-years
HydrogenTransportation
Trailer
Number for detainment 8 unit
[23]
Number for transportation 2 unitNumber for filling 2 unitLifetime 10 years
TractorNumber 2 carsLifetime 5 years
Diesel oil consumption 50 l/time/carTransport frequency 4 time/carRunning number 2 car/dayTransport distance (round trip) 100 km/time
Utilization rate 0.8 - *Employment 4 person-years [23]
HydrogenFueling Station
Type Off-site[23]
Supply capacity 300 Nm3/hBusiness hours 15 h/day *
Number 8 places[23]Lifetime 10 years
Utilization rate 0.8 - *Employment (8 stations total) 16 person-years [23]
* Estimated by the authors.

Sustainability 2017, 9, 1376 5 of 16
Table 2. Assumed cost data during 10 years.
Activity Life Cycle Stage Goods and Services Cost [Million-JPY] References
Hydrogen Production
Manufacturing & Construction
PSA (Pressure Swing Adsorption) 70
[23]
Hydrogen compressor 101Suction drum 4Off-gas compressor 11Piping, installation, instrumentation, electrical equipment 113Civil engineering and construction 30Engineering 51
Operation & Maintenance
Naphtha (raw material) 1616Naphtha (fuel) 54Power 361Clean water 22Personnel expenses 70Repair costs 114Insurance fee 23Property tax 53Overhead 38
Value added except for depreciation cost 200 [23,39]
Total 2932 -
Hydrogen Transportation
Manufacturing & ConstructionHydrogen trailer (45 MPa) 336
[23]
Undercarriage 96Tractor 44
Operation & Maintenance
Maintenance 190Insurance fee 29Property tax 67Overhead 48Fuel cost 140Personnel expenses 280
Value added for depreciation cost 200 [23,39]
Total 1597 -

Sustainability 2017, 9, 1376 6 of 16
Table 2. Cont.
Activity Life Cycle Stage Goods and Services Cost [Million-JPY] References
Hydrogen Fueling Stations
Manufacturing & Construction
Accumulator (high and low pressure) 210
[45]
Compressor (filling) 720Hydrogen dispenser 400Pre-cooler equipment 240Hydrogen valve 63Hydrogen sensor 26Engineering 411Civil engineering and construction 549
Operation & Maintenance
Maintenance 324
Power 476 [23]Personnel expenses 1600 [45]Value added for depreciation cost 200 [23,39]
Total 5677 -

Sustainability 2017, 9, 1376 7 of 16
2.3. Established New Sectors
Table 3 showed six new sectors in this study. Three new sectors related to hydrogen energy wereestablished in the original input coefficient matrix to reflect the technical characteristics of hydrogen.These included hydrogen production, hydrogen transport, and the hydrogen fueling station. Inputcoefficients (A), employment coefficient (l), and GHG emissions coefficient (g) of the three sectors wereestimated. GHG emissions caused by naphtha reforming and light oil combustion were quoted as 2.24(As information on clear GHG emissions caused by naphtha reforming is not available, the value ofnaphtha combustion was substituted) and 2.58 t/kL of CO2, respectively [46]. Additionally, production(X) during the manufacturing and construction stages was estimated by setting the final demand vector(f) in as much detail as possible, as the appropriate sectors appeared in the original input-output table.
Table 3. Methods of establishment of new sectors.
Sector InputCoefficients-Column-
OutputCoefficients-Row-
EmploymentCoefficients
GHG EmissionsCoefficient
Hydrogen Production Publicationinformation
[23,43,45]Zero vector
Publication information[23,43,45]
Publicationinformation [23,46]Hydrogen Transportation
Hydrogen Fueling Station
Nuclear Power GenerationBasic table of originalinput-output table in
2005 [40]
Disaggregation ofgrid mix in 2005 or
any year [47]
Employment table oforiginal IO in 2005 [40]
Number of employees ofeach type of power
generation in 2005 [47]
3EID (EmbodiedEnergy and
Emission IntensityData for Japan) [41]
Thermal Power Generation
Hydro and GeothermalPower Generation
The details of three new sectors related to hydrogen energy system (A) created from theabove-mentioned prerequisite and the cost information are described in Appendix B.
A relatively large amount of electric power is input to the hydrogen energy system from theabove cost information (Table 2). The grid mix of Japan has changed greatly since the Great East JapanEarthquake of 2011. In 2015, nuclear power generation was 1%, thermal power was 89%, and otherswere 10%, while, in 2005, nuclear power was 31%, thermal power was 61%, and others were 9%.The differences in the grid mix between 2005 and 2015 might have a significant effect on the results [47];therefore, the structures input into the grid mix of a given year are reflected in the input-output table.
Three new sectors related to power generation were established in the original input coefficientmatrix to reflect the 2005 grid mix. The power generation sectors in the original basic input outputtable consisted of one row (total power generation) and three columns (“nuclear power generation”,“thermal power generation”, and “hydro and geothermal power generation”). Therefore, all sectorsof the input coefficient (A) were disaggregated to three sectors by the grid mix ratio in 2005 (Table 3).Employment coefficients were estimated using the original employment matrix [40] and number ofemployees of each type of power generation in 2005 [47]. The GHG emissions coefficient was estimatedby 3EID [41] and assumed that everything would discharge in thermal power generation.
3. Results and Discussion
3.1. Life Cycle Effects
The input-output analysis estimated the effect of production, employment, and GHG emissionsper ton of the hydrogen energy system at JPY 2.64 million, 0.09 person per year, and 13.9 t-CO2 eq.,respectively (Figure 2). The ratios of the effects of production and employment in the manufacturingand construction stages were calculated as 31% and 44%, respectively, and are relatively highercompared to the operation and maintenance stages. Thus, about 30–40% of the productionand employment effects associated with manufacturing and construction stages were temporary.However, 91% of the GHG emission effects were associated with operation and maintenance stages,which included 78% production, 3% transportation, and 10% hydrogen fueling stations.

Sustainability 2017, 9, 1376 8 of 16
Sustainability 2017, 9, 1376 8 of 16
compared to the operation and maintenance stages. Thus, about 30–40% of the production and employment effects associated with manufacturing and construction stages were temporary. However, 91% of the GHG emission effects were associated with operation and maintenance stages, which included 78% production, 3% transportation, and 10% hydrogen fueling stations.
Figure 2. Life cycle embodied intensity.
3.2. Sectoral Effects
Sectoral effects of the hydrogen energy system are illustrated in Figure 3. The direct effect of hydrogen refill stations, hydrogen production, and hydrogen transportation ranked the highest. Indirect effect was attributed to various industries including energy production of naphtha (petroleum refinery products, including greases) and its material (coal mining, crude petroleum, and natural gas) in the operation and maintenance stages; engineering services (other business services), electricity, commercial (wholesale trade) during the entire life cycle; and manufacturing of pumps, compressors, and chemical machinery in the manufacturing and construction stages.
The effect of employment was the same as production, with the greatest effect from the hydrogen station. However, the effects of engineering services (other business services), commercial (wholesale trade and retail trade) and civil engineering and construction were greater than the direct effect of hydrogen production and hydrogen transportation. In addition, temporary effects of manufacturing were recorded owing to pumps, compressors, and chemical machinery. For example, this study assumed that there were two employers at a hydrogen station, based on published reports [18,45]. However, our field survey revealed that two to five employees were always working. Furthermore, operation and maintenance of the hydrogen fueling station is often carried out by the same enterprise that maintains the gas station, indicating that a direct increase effect of employment owing to the hydrogen system is unlikely. However, different qualifications are required for hydrogen fueling stations and gas stations operation as specific laws concerning dangerous goods and high-pressure gas safety are applied. Therefore, it is desirable to interpret these numerical values in light of social and business conditions. The indirect effect of GHG emissions accounted for about 55% of the total during hydrogen production and 25% during electricity consumption. The former is due to naphtha reforming and could possibly be reduced by CO2 recovery and industrial use. The latter is attributed to the power required for the naphtha reforming refinery, hydrogen station compressor, and precooling equipment, which can be reduced by selection improved power generation technology. However, despite similar fuel combustion for thermal power, the effects for the hydrogen transportation sector are relatively small, and account for about 2% of the entire life cycle. This can be attributed to the large difference in consumption. While the amount of light fuel needed for transport is 0.4 kL/day, the amount of naphtha is 12.5 kL/day during hydrogen production.
44%
20%
9%
27%
0.09[person-years/t-H2]
31%
30%
10%
29%
2.64[million-yen/t-H2]
9%
78%
3%10%
13.9[t-CO2 eq./t-H2]
※This analysis is based on 2005 Japanese IO tables, 2005 Grid Mix and assumed costs for 2020.
Hydrogen Refilling Station – Operation & Maintenance
Hydrogen Transportation – Operation & Maintenance
Hydrogen Production – Operation & Maintenance
All Manufacturing & Construction
Figure 2. Life cycle embodied intensity.
3.2. Sectoral Effects
Sectoral effects of the hydrogen energy system are illustrated in Figure 3. The direct effectof hydrogen refill stations, hydrogen production, and hydrogen transportation ranked the highest.Indirect effect was attributed to various industries including energy production of naphtha (petroleumrefinery products, including greases) and its material (coal mining, crude petroleum, and natural gas)in the operation and maintenance stages; engineering services (other business services), electricity,commercial (wholesale trade) during the entire life cycle; and manufacturing of pumps, compressors,and chemical machinery in the manufacturing and construction stages.
The effect of employment was the same as production, with the greatest effect from the hydrogenstation. However, the effects of engineering services (other business services), commercial (wholesaletrade and retail trade) and civil engineering and construction were greater than the direct effect ofhydrogen production and hydrogen transportation. In addition, temporary effects of manufacturingwere recorded owing to pumps, compressors, and chemical machinery. For example, this studyassumed that there were two employers at a hydrogen station, based on published reports [18,45].However, our field survey revealed that two to five employees were always working. Furthermore,operation and maintenance of the hydrogen fueling station is often carried out by the same enterprisethat maintains the gas station, indicating that a direct increase effect of employment owing to thehydrogen system is unlikely. However, different qualifications are required for hydrogen fuelingstations and gas stations operation as specific laws concerning dangerous goods and high-pressuregas safety are applied. Therefore, it is desirable to interpret these numerical values in light of socialand business conditions. The indirect effect of GHG emissions accounted for about 55% of the totalduring hydrogen production and 25% during electricity consumption. The former is due to naphthareforming and could possibly be reduced by CO2 recovery and industrial use. The latter is attributedto the power required for the naphtha reforming refinery, hydrogen station compressor, and precoolingequipment, which can be reduced by selection improved power generation technology. However,despite similar fuel combustion for thermal power, the effects for the hydrogen transportation sectorare relatively small, and account for about 2% of the entire life cycle. This can be attributed to thelarge difference in consumption. While the amount of light fuel needed for transport is 0.4 kL/day,the amount of naphtha is 12.5 kL/day during hydrogen production.

Sustainability 2017, 9, 1376 9 of 16Sustainability 2017, 9, 1376 9 of 16
0.00 0.10 0.20 0.30 0.40 0.50 0.60 0.70
Hydrogen fueling stations
Hydrogen production
Hydrogen transportation
Petroleum refinery products (inc. greases)
Other business services
Wholesale trade
Coal mining, crude petroleum, and natural gas
Pumps and compressors
Chemical machinery
Thermal power generation
Other civil engineering and construction
Financial services
Repair of machine
Nuclear power generation
Goods rental and leasing (except car rental)
[million JPY/t-H2]
All Manufacturing &Construction
Hydrogen Production-Operation & Maintenance
Hydrogen Transportation-Operation & Maintenance
Hydrogen Fuelling Stations-Operation & Maintenance
(a) Production
0.000 0.005 0.010 0.015 0.020
Hydrogen fueling stations
Other business services
Wholesale trade
Retail trade
Other civil engineering and construction
Hydrogen transportation
Pumps and compressors
Coal mining, crude petroleum, and natural gas
Chemical machinery
Worker dispatching services
Road freight transport
Financial services
Repair of machine
Hydrogen production
Research and development (intra-enterprise)
[person years/t-H2]
All Manufacturing &Construction
Hydrogen Production-Operation & Maintenance
Hydrogen Transportation-Operation & Maintenance
Hydrogen Fuelling Stations-Operation & Maintenance
(b) Employment
Figure 3. Cont.

Sustainability 2017, 9, 1376 10 of 16Sustainability 2017, 9, 1376 10 of 16
Figure 3. Hydrogen production—sectoral effects.
Environmental and socio-economic effects due to fuel consumption by high-pressure hydrogen transport (tractor and lorries) are small throughout the life cycle, and it is unlikely that this result will change significantly in the near future. However, in the liquefied hydrogen and organic hydride methods, although the amount of hydrogen that can be transported increases, the trade-off between the total energy input and transportation mode needs to be studied. As these two methods have not currently been introduced in Japan, it is necessary to assess the economic effect, employment effect, and GHG emissions, along with safety and acceptability.
3.3. Sensitivity Analysis Using Grid Mix Scenarios
When hydrogen is used in society, significant power is needed for compressing and cooling over the life cycle. In the transportation of high pressure hydrogen, the effect of this electric power also applies to hydrogen production as by-product of hydrogen and water electrolysis hydrogen. Japan's power supply composition in 2005 was influenced by thermal power generation, which contributed nearly 60%, while nuclear power contributed 30%. As the ratio of thermal power generation in 2015 rose to 90%, current production, employment, and GHG emissions from this sector may now be even larger [47]. Therefore, sensitivity analysis was performed assuming three grid mixes (Table 4). The first (base) scenario was 31%, 60%, and 9% for nuclear, thermal, and hydrogen and geothermal, respectively. For the second scenario, the values were 16%, 74%, 9%, and, for the third scenario, the values were 1%, 89%, 10%, respectively. The first and third grid mix were assumed to be 2005 and 2015. The second was the average of the two.
For grid mixes of scenarios 2 and 3, GHG emissions per ton of the hydrogen energy system were found to be 14.6 and 15.3 t-CO2 eq. (Table 4). The grid mix of 2015 would discharge about 10% more GHG emissions than that of 2005. In scenarios 2 and 3, GHG emissions for the thermal power generation sector increased by +24% and +48%, respectively. In particular, the amounts of electric power used for hydrogen production and for the hydrogen fueling station would be significant,
0.0 1.0 2.0 3.0
Hydrogen production
Thermal power generation
Coal mining, crude petroleum, and natural gas
Private power generation
Petroleum refinery products (inc. greases)
Pig iron
Hydrogen transportation
Cement
Refrigerators and air conditioning apparatus
Self-transport by private cars (passengers)
Self-transport by private cars (freight)
Road freight transport
Coastal and inland water transport
Cast and forged materials (iron)
Coal products
[t-CO2 eq./t-H2]
All Manufacturing &Construction
Hydrogen Production-Operation & Maintenance
Hydrogen Transportation-Operation & Maintenance
Hydrogen Fuelling Stations-Operation & Maintenance
8.6
(c) GHG emissions
Figure 3. Hydrogen production—sectoral effects.
Environmental and socio-economic effects due to fuel consumption by high-pressure hydrogentransport (tractor and lorries) are small throughout the life cycle, and it is unlikely that this resultwill change significantly in the near future. However, in the liquefied hydrogen and organic hydridemethods, although the amount of hydrogen that can be transported increases, the trade-off betweenthe total energy input and transportation mode needs to be studied. As these two methods have notcurrently been introduced in Japan, it is necessary to assess the economic effect, employment effect,and GHG emissions, along with safety and acceptability.
3.3. Sensitivity Analysis Using Grid Mix Scenarios
When hydrogen is used in society, significant power is needed for compressing and cooling overthe life cycle. In the transportation of high pressure hydrogen, the effect of this electric power alsoapplies to hydrogen production as by-product of hydrogen and water electrolysis hydrogen. Japan'spower supply composition in 2005 was influenced by thermal power generation, which contributednearly 60%, while nuclear power contributed 30%. As the ratio of thermal power generation in 2015rose to 90%, current production, employment, and GHG emissions from this sector may now be evenlarger [47]. Therefore, sensitivity analysis was performed assuming three grid mixes (Table 4). The first(base) scenario was 31%, 60%, and 9% for nuclear, thermal, and hydrogen and geothermal, respectively.For the second scenario, the values were 16%, 74%, 9%, and, for the third scenario, the values were 1%,89%, 10%, respectively. The first and third grid mix were assumed to be 2005 and 2015. The secondwas the average of the two.
For grid mixes of scenarios 2 and 3, GHG emissions per ton of the hydrogen energy systemwere found to be 14.6 and 15.3 t-CO2 eq. (Table 4). The grid mix of 2015 would discharge about10% more GHG emissions than that of 2005. In scenarios 2 and 3, GHG emissions for the thermalpower generation sector increased by +24% and +48%, respectively. In particular, the amounts ofelectric power used for hydrogen production and for the hydrogen fueling station would be significant,

Sustainability 2017, 9, 1376 11 of 16
regardless of the method of hydrogen production. On the other hand, production and employmenthad no major change in total in spite of the differences in the grid mixes.
Figure 4 shows the results of sensitivity analysis for each scenario. The stages of hydrogenproduction and hydrogen fueling station account for 90% of the total increase, reflecting the differencesin grid mix between 2005 and 2015. It should be noted that the stage of hydrogen production included8.6 t-CO2 eq. from naphtha reforming. Therefore, at the hydrogen production stage, the remaining2.2, 2.5, 2.8 t-CO2 eq. influenced the increased in thermal power generation. At the hydrogen fuelingstation stage, there is a possibility of a ~50% increase in GHG emissions due to the change in gridmixes. This is most influenced by stage-by-stage analysis among the four life cycle stages. Finally,the remaining ~10% of the total increase reflect the manufacturing and construction stage, which isaffected relatively less than the previous two stages.
Table 4. Preconditions and results of sensitivity analysis.
Grid Mix Production[Million-Yen/t-H2]
Employment[Person-Years/t-H2]
GHG Emissions[t-CO2 eq./t-H2]
2005(Scenario 1)
Nuclear 31% 2.64(Base)
0.09(Base)
13.9(Base)Thermal 60%
Hydro & Geothermal 9%
Mean of 2000and 2015
(Scenario 2)
Nuclear 16% 2.65(+0.4%)
0.09(+0.4%)
14.6(+4.9%)Thermal 74%
Hydro & Geothermal 9%
2015(Scenario 3)
Nuclear 1% 2.67(+0.8%)
0.09(+0.8%)
15.3(+9.9%)Thermal 89%
Hydro & Geothermal 10%
Sustainability 2017, 9, 1376 11 of 16
regardless of the method of hydrogen production. On the other hand, production and employment had no major change in total in spite of the differences in the grid mixes.
Figure 4 shows the results of sensitivity analysis for each scenario. The stages of hydrogen production and hydrogen fueling station account for 90% of the total increase, reflecting the differences in grid mix between 2005 and 2015. It should be noted that the stage of hydrogen production included 8.6 t-CO2 eq. from naphtha reforming. Therefore, at the hydrogen production stage, the remaining 2.2, 2.5, 2.8 t-CO2 eq. influenced the increased in thermal power generation. At the hydrogen fueling station stage, there is a possibility of a ~50% increase in GHG emissions due to the change in grid mixes. This is most influenced by stage-by-stage analysis among the four life cycle stages. Finally, the remaining ~10% of the total increase reflect the manufacturing and construction stage, which is affected relatively less than the previous two stages.
Table 4. Preconditions and results of sensitivity analysis.
Grid Mix Production[Million-Yen/t-H2]
Employment [Person-Years/t-H2]
GHG Emissions[t-CO2 eq./t-H2]
2005 (Scenario 1)
Nuclear 31% 2.64
(Base) 0.09
(Base) 13.9
(Base) Thermal 60%
Hydro & Geothermal 9% Mean of 2000
and 2015 (Scenario 2)
Nuclear 16% 2.65
(+0.4%) 0.09
(+0.4%) 14.6
(+4.9%) Thermal 74%
Hydro & Geothermal 9%
2015 (Scenario 3)
Nuclear 1% 2.67
(+0.8%) 0.09
(+0.8%) 15.3
(+9.9%) Thermal 89%
Hydro & Geothermal 10%
Figure 4. Sensitivity analysis of GHG emissions in each life cycle stage.
4. Conclusions
In this study, we analyzed the environmental and socio-economic effects of the hydrogen energy system during its life cycle from hydrogen production by naphtha reforming to refilling fuel cell cars. Currently, field-specific assessments highlight valuable information, but do not holistically assess effects of hydrogen energy systems. However, input-output analysis conducted in this study enables assessment of a range of effects in an objective manner using economic indicators, and contributes to the identification of potential risks in related sectors. The following were clarified.
Many of the socio-economic analyses of hydrogen energy systems are limited to direct cost calculations, which focus on manufacturing and construction stages. Our study reveals that the effect of production, employment, and GHG emissions during the operation and maintenance stages was also significant. Thus, this study highlights the contributions of different indicators
1.2 1.3 1.3
10.8 11.1 11.4
0.5 0.5 0.5 1.4 1.8 2.1
0.0
2.0
4.0
6.0
8.0
10.0
12.0
14.0
16.0
18.0
Scenario 1 (Thermal 60%) Scenario 2 (Thermal 74%) Scenario 3 (Thermal 89%)
[t-C
O2eq
./t-H
2]
Hydrogen Fuelling Stations-Operation & Maintenance
Hydrogen Transportation-Operation & Maintenance
Hydrogen Production-Operation & Maintenance
All Manufacturing &Construction
Figure 4. Sensitivity analysis of GHG emissions in each life cycle stage.
4. Conclusions
In this study, we analyzed the environmental and socio-economic effects of the hydrogen energysystem during its life cycle from hydrogen production by naphtha reforming to refilling fuel cell cars.Currently, field-specific assessments highlight valuable information, but do not holistically assesseffects of hydrogen energy systems. However, input-output analysis conducted in this study enablesassessment of a range of effects in an objective manner using economic indicators, and contributes tothe identification of potential risks in related sectors. The following were clarified.
• Many of the socio-economic analyses of hydrogen energy systems are limited to direct costcalculations, which focus on manufacturing and construction stages. Our study reveals that theeffect of production, employment, and GHG emissions during the operation and maintenancestages was also significant. Thus, this study highlights the contributions of different indicators
Sustainability 2017, 9, 1376 12 of 16
change during the life cycle, confirming that a life cycle perspective using multiple indices is veryimportant for hydrogen energy system analysis.
• The socio-economic effect due to the introduction of the hydrogen energy system is influenced bydirect effects of hydrogen production, hydrogen transportation, and hydrogen station, along withindirect effects of raw materials, electrical power, equipment maintenance, and commerce.Specifically, indirect effects of the service sector such as equipment maintenance and commerceamong others are highlighted by the input-output table.
• Most of the GHG emissions were discharged during hydrogen production indicating thatlow-carbon hydrogen production options such as renewable energy can significantly reduceemissions. Additionally, the amount of electricity required for compressor and pre-cooling devicesis also significant, and similar active use of low-carbon power generation systems includingrenewable energy can contribute to a more decarbonized society. The results of the sensitivityanalysis also indicate that life cycle of GHG emissions are influenced by changes in the grid mix.However, since low-carbon power generation technology generally tends to be expensive, it isnecessary to analyze the trade-off between the expected-positive (GHG emission reduction) andthe expected-negative (its cost, stable supply and security, etc.).
This research undertakes the first steps in life-cycle based environmental and socio-economiceffect analysis using collected information, and contributes to comprehensive risk assessment ofhydrogen energy systems in the future. We propose to develop the following in the future:
• In this study, data regarding hydrogen production using naphtha reforming and high-pressuredtransportation were employed. However, there are several types of production, includingby-product hydrogen and water electrolysis using renewable energy among others. In addition,different types of hydrogen transport are employed for liquefied and organic hydride systems.Future research should address multiple production and transportation methods.
• The input-output table employed in this study assumed the setup to include three sectors:hydrogen production, hydrogen transportation, and hydrogen station. However, future studiesshould address other factors while accounting for the demand and supply of hydrogen energy.
• All hydrogen energy systems discussed in this research are expressed in terms of 2020 pricesas hydrogen energy systems are currently in the initial stage of introduction. Therefore, it isnecessary to investigate additional changes in the future, such as price changes and subsidies.
Acknowledgments: This work was supported by the Council for Science, Technology and Innovation (CSTI)through its cross-ministerial Strategic Innovation Promotion Program (SIP), “Energy Carrier” (funding agency:Japan Science and Technology Agency (JST).
Conflicts of Interest: The author declares no conflict of interest.
Appendix A
Table A1. Details of final demand.
Life Cycle Stage Sector Final Demand[Million-JPY]
Manufacturing &Construction
HydrogenProduction
Other electrical devices and parts 99Pumps and compressors 146Other business services 50Wholesale trade 50Other civil engineering and construction 30Other Sectors 4Total 380

Sustainability 2017, 9, 1376 13 of 16
Table A1. Cont.
Life Cycle Stage Sector Final Demand[Million-JPY]
HydrogenTransportation
Chemical machinery 281Trucks, buses, and other cars 89Wholesale trade 83Retail trade 16Road freight transport 5Other Sectors 1Total 476
HydrogenFueling Station
Pumps and compressors 729Other civil engineering and construction 549Other business services 406Chemical machinery 335Wholesale trade 297Other Sectors 305Total 2619
Operation &Maintenance
Hydrogen Production (Established New Sector) * 2932 *Hydrogen Transportation (Established New Sector) * 1597 *Hydrogen Fueling Station (Established New Sector) * 5677 *
* Final demand of established new sector included depreciation.
Appendix B
Table A2. Input ratio of new sectors.
Life Cycle Stage Sector Ratio
Operation &Maintenance
HydrogenProduction
Petroleum refinery products (Inc. greases) 42.0%Thermal power generation 10.9%Wholesale trade 8.9%Other business services 5.1%Other industrial sectors 9.1%Total added value * 24.0% *Total 100.0%
HydrogenTransportation
Machine repair 11.9%Petroleum refinery products (Inc. greases) 6.5%Other business services 2.9%Non-life insurance 1.8%Other industrial sectors 2.3%Total added value * 74.5% *Total 100.0%
Hydrogen FuelingStation
Thermal power generation 7.4%Other business services 5.6%Hydro and geothermal power generation 0.9%Nuclear power generation 0.1%Other industrial sectors 0.1%Total added value * 85.9% *Total 100.0%
* “Total added value” was not included coefficient matrix (A).

Sustainability 2017, 9, 1376 14 of 16
References
1. Intergovernmental Panel on Climate Change (IPCC). Climate Change 2013, The Physical Science Basis. 2013.Available online: http://www.ipcc.ch/report/ar5/wg1/ (accessed on 2 August 2017).
2. International Energy Agency (IEA). World Energy Outlook 2015, Executive Summary. 2015. Available online:http://www.worldenergyoutlook.org/weo2015/ (accessed on 13 February 2016).
3. Ministry of Economy, Trade and Industry (METI). Strategic Energy Plan; Fiscal 2014. April 2014. Availableonline: http://www.enecho.meti.go.jp/en/category/others/basic_plan/pdf/4th_strategic_energy_plan.pdf (accessed on 2 August 2017).
4. Cabinet Office, Government of Japan (CAO). Energy Innovation 2020; Hydrogen Energy System. 2014.Available online: http://www8.cao.go.jp/cstp/tyousakai/olyparatf/sassi/siryo5.pdf (accessed on 2 August2017). (In Japanese)
5. Elkington, J. Towards the Sustainable Corporation: Win-Win-Win Business Strategies for SustainableDevelopment. Calif. Manag. Rev. 1994, 36, 90–100. [CrossRef]
6. Tokyo Metropolitan Government Bureau of Environment (Tokyo Metropolitan). Tokyo Strategy MeetingSummarized toward the Realization of a Hydrogen Society; Fiscal 2015. 2014. Available online: https://www.kankyo.metro.tokyo.jp/energy/tochi_energy_suishin/attachement/26torimatome.pdf (accessedon 7 January 2016). (In Japanese)
7. International Organization for Standardization (ISO). ISO Guide 73:2009: Risk Management—Vocabulary.2009. Available online: https://www.iso.org/obp/ui/#iso:std:44651:en (accessed on 2 August 2017).
8. Branscomb, L.M. Sustainable cities: Safety and security. Technol. Soc. 2006, 28, 225–234. [CrossRef]9. US Office of Homeland Security. The National Strategy for Homeland Security. 16 July 2002. Available online:
https://www.dhs.gov/sites/default/files/publications/nat-strat-hls-2002.pdf (accessed on 2 August 2017).10. Shi, Q.; Liu, Y.; Zuo, J.; Pan, N.; Ma, G. On the management of social risks of hydraulic infrastructure projects
in China: A case study. Int. J. Proj. Manag. 2015, 33, 483–496. [CrossRef]11. McLellan, B.; Zhang, Q.; Farzaneh, H.; Utama, N.A.; Ishihara, K.N. Resilience, sustainability and risk
management: A focus on energy. Challenges 2012, 3, 153–182. [CrossRef]12. Kinehara, Y.; Noguchi, K.; Inoue, R.; Takahashi, H.; Shibuya, Y.; Nagano, M. New Treatise on How to Enrich
Our Country. 2008. Available online: http://www.mri.co.jp/NEWS/magazine/journal/47/__icsFiles/afieldfile/2008/10/21/jm06111504.pdf (accessed on 2 August 2017). (In Japanese with English Summary).
13. Noguchi, K. Seeking the Form of a New Country (1); Looking to the Questionnaire Survey “New Treatiseon How to Enrich Our Country”; What Is the Richness of Japanese People Think. 2011. Available online:http://diamond.jp/articles/-/13390 (accessed on 2 August 2017). (In Japanese)
14. Sakamoto, J.; Nakayama, J.; Nakarai, T.; Kasai, N.; Shibutani, T.; Miyake, A. Effect of gasoline pool fire onliquid hydrogen storage tank in hybrid hydrogen–gasoline fueling station. Int. J. Hydrogen Energy 2016, 41,2096–2104. [CrossRef]
15. Nakayama, J.; Sakamoto, J.; Kasai, N.; Shibutani, T.; Miyake, A. Preliminary hazard identification forqualitative risk assessment on a hybrid gasoline-hydrogen fueling station with an on-site hydrogenproduction system using organic chemical hydride. Int. J. Hydrogen Energy 2016, 41, 7518–7525. [CrossRef]
16. Okada, Y. Safety of hydrogen storage and transportation system by organic chemical hydride method.J. Hydrogen Energy Syst. Soc. Jpn. 2010, 35, 19–24, (In Japanese with English Abstract).
17. Ono, K.; Tsunemi, K. Identification of public acceptance factors with risk perception scales on hydrogenfueling stations in Japan. Int. J. Hydrogen Energy 2017, 42, 10697–10707. [CrossRef]
18. Itoh, T. Hydrogen Supply Case Studies and Economic Evaluation. 2003. Available online: http://www.pecj.or.jp/japanese/report/reserch/report-pdf/H15_2003/03cho3-3.pdf (accessed on 2 August 2017). (In Japanese)
19. Kanoh, T. Current Status of Producing Hydrogen as By-Product and Technology for Utilization. Best Value,20 Theme 7. 2008. Available online: http://www.vmi.co.jp/info/bestvalue/pdf/bv20/bv20_07.pdf(accessed on 10 March 2016). (In Japanese)
20. Nakamura, T.; Iwabuchi, H.; Murata, K.; Sakata, K. Supply Cost and Technology Issues of Hydrogen for FuelCell Vehicles. J. Hydrogen Energy Syst. Soc. Jpn. 2008, 33, 27–34, (In Japanese with English abstract).
21. Kokubun, Y. Cost and energy efficiency in transportation of high pressure hydrogen. J. Hydrogen Energy Syst.Soc. Jpn. 2009, 34, 24–30, (In Japanese with English abstract).

Sustainability 2017, 9, 1376 15 of 16
22. Matsuo, Y.; Hirai, H.; Uno, J.; Nagatomi, Y. Hydrogen Energy as Automotive Fuel. 2010. Available online:https://eneken.ieej.or.jp/data/3098.pdf (accessed on 2 August 2017). (In Japanese with English Abstract).
23. Japan Hydrogen & Fuel Cell Demonstration Project (JHFC). Fuel Cell System Empirical Research Report(Phase 2 JHFC Project); Fiscal 2011. 2011. Available online: http://www.jari.or.jp/Portals/0/jhfc/data/report/pdf/tuuki_phase2_01.pdf (accessed on 2 August 2017). (In Japanese)
24. Yamashita, Y.; Yoshino, Y.; Yoshimura, K.; Shindo, K.; Harada, E. Feasibility study on the hydrogen energysupply chain for low carbon society. J. Jpn. Soc. Energy Resour. 2014, 35, 11–19. (In Japanese withEnglish Abstract)
25. Hondo, H.; Moriizumi, Y.; Usui, T. Life Cycle Environmental Analysis of Hydrogen Storage TechnologyUsing Organic Hydride: Energy Requirement and CO2 Emission. J. Jpn. Inst. Energy 2008, 87, 753–762.(In Japanese with English Abstract)
26. Usui, T.; Hondo, H. Life Cycle CO2 Emission Analysis of Hydrogen Storage and Battery for Wind PowerGeneration. J. Jpn. Inst. Energy 2010, 89, 551–561. (In Japanese with English Abstract) [CrossRef]
27. Japan Automobile Research Institute (JARI). Overall Efficiency and Analysis of GHG Emissions. 2011.Available online: http://www.jari.or.jp/Portals/0/jhfc/data/report/2010/pdf/result.pdf (accessed on2 August 2017). (In Japanese)
28. Toyota Motor Corporation. The MIRAI LCA Report for Communication. 2015. Available online:https://www.toyota.co.jp/jpn/sustainability/environment/low_carbon/lca_and_eco_actions/pdf/life_cycle_assessment_report.pdf (accessed on 2 August 2017). (In Japanese)
29. Mizuho Information & Research Institute, Inc. Evaluation Report on Greenhouse Gas Emissions ofHydrogen Considering Life Cycle (Overview Version). 2016. Available online: https://www.mizuho-ir.co.jp/publication/report/2016/pdf/wttghg1612.pdf (accessed on 2 August 2017). (In Japanese)
30. Lambert, R.J.; Silva, P.P. The challenges of determining the employment effects of renewable energy.Renew. Sustain. Energy Rev. 2012, 16, 4667–4674. [CrossRef]
31. Lehr, U.; Nitsch, J.; Kratzat, M.; Lutz, C.; Edler, D. Renewable energy and employment in Germany.Energy Policy 2008, 36, 108–117. [CrossRef]
32. Markaki, M.; Belegri-Roboli, A.; Michaelides, P.; Mirasgedis, S.; Lalas, D.P. The impact of clean energyinvestments on the Greek economy: An input–output analysis (2010–2020). Energy Policy 2013, 57, 263–275.[CrossRef]
33. Matsumoto, N.; Hondo, H. Analysis on Employment Effects of the Introduction of Renewable EnergyTechnologies Using an Extended Input-output Table. J. Jpn. Inst. Energy 2011, 90, 258–267. (In Japanese withEnglish Abstract) [CrossRef]
34. Hienuki, S.; Kudoh, Y.; Hondo, H. Life cycle employment effect of geothermal power generation using anextended input–output model: The case of Japan. J. Clean. Prod. 2015, 93, 203–212. [CrossRef]
35. Hienuki, S.; Kudoh, Y.; Hondo, H. Establishing a Framework for Evaluating Environmental andSocio-Economic Impacts by Power Generation Technology Using an Input–output Table—A Case Study ofJapanese Future Electricity Grid Mix. Sustainability 2015, 7, 15794–15811. [CrossRef]
36. Moriizumi, Y.; Hondo, H.; Nakano, S. Development and Application of Renewable Energy-FocusedInput-Output Table. J. Jpn. Inst. Energy 2015, 94, 1397–1413, (In Japanese with English Abstract). [CrossRef]
37. Lee, D.H.; Lee, D.J.; Chiu, L.H. Biohydrogen development in United States and in China: An input–outputmodel study. Int. J. Hydrogen Energy 2011, 36, 14238–14244. [CrossRef]
38. Chun, D.; Woo, C.; Seo, H.; Chung, Y.; Hong, S.; Kim, J. The role of hydrogen energy development in theKorean economy: An input-output analysis. Int. J. Hydrogen Energy 2014, 39, 7627–7633. [CrossRef]
39. Ministry of Internal Affairs and Communications (MIAC). Input-Output Tables. 2015. Available online:http://www.e-stat.go.jp/SG1/estat/ListE.do?bid=000001060671&cycode=0 (accessed on 1 March 2016).
40. Ministry of Internal Affairs and Communications (MIAC). Input-Output Tables. 2009. Available online:http://www.soumu.go.jp/english/dgpp_ss/data/io/io05.htm (accessed on 1 March 2016).
41. Center for Global Environmental Research, National Institute for Environmental Studies (CGER). EmbodiedEnergy and Emission Intensity Data for Japan Using Input–Output Tables (3EID): For 2005 IO Table.2013. Available online: http://www.cger.nies.go.jp/publications/report/d031/index.html (accessed on4 May 2014).

Sustainability 2017, 9, 1376 16 of 16
42. Ministry of Economy, Trade and Industry (METI). For Hydrogen and Fuel Cell; Fiscal 2013. 2013. Availableonline: http://www.enecho.meti.go.jp/committee/council/basic_policy_subcommittee/008/pdf/008_008.pdf (accessed on 2 August 2017). (In Japanese)
43. JX Nippon Oil & Energy Corporation (JX). Changes in Crude Oil Processing Capacity/Throughput/CapacityUtilization. 2014. Available online: http://www.noe.jx-group.co.jp/binran/data/pdf/40.pdf (accessed on20 February 2016). (In Japanese)
44. World Bank. Official Exchange Rate (LCU per US$, Period Average). Available online: http://data.worldbank.org/indicator/PA.NUS.FCRF?page=1 (accessed on 20 February 2016).
45. Fuji Keizai Co., Ltd. (Fuji). Future Prospects of Hydrogen Fuel-Related Markets (Fiscal 2017 Edition). 2017.Available online: https://www.fuji-keizai.co.jp/report/index/141609842.html (accessed on 2 August 2017).(In Japanese)
46. Ministry of the Environment (MoE). Calculation Methods and Emission Coefficients List in Accounting andReporting System. 2015. Available online: http://ghg-santeikohyo.env.go.jp/files/calc/itiran.pdf (accessedon 19 January 2015). (In Japanese)
47. The Federation of Electric Power Companies of Japan. Power Statistics Information. 2017. Available online:http://www.fepc.or.jp/library/data/tokei/index.html (accessed on 19 June 2017). (In Japanese)
© 2017 by the author. Licensee MDPI, Basel, Switzerland. This article is an open accessarticle distributed under the terms and conditions of the Creative Commons Attribution(CC BY) license (http://creativecommons.org/licenses/by/4.0/).