entry time, pre-entry experience and firms? exit in the ... · at the initial stages of the...
TRANSCRIPT

Paper to be presented at the DRUID 2012
on
June 19 to June 21
at
CBS, Copenhagen, Denmark,
Entry time, pre-entry experience and firms? exit in the Digital Audio
Players industryNicoletta Corrocher
Bocconi UniversityKITeS - Department of Management & Technology
Roberto FontanaUniversity of Pavia
Roberto Camerani
SPRU - Sussex University
AbstractThis paper investigates the evolution of the digital audio players (DAP) industry as shaped by firms? entry and exit. Weanalyse entry and exit from market segments by looking at the introduction of new products and by focusing in particularon pre-entry experience, and entry timing as determinants. In doing so, we distinguish two main categories ofcompanies: diversifying entrants and de-novo entrants on the basis of their previous activity in related industries or lackthereof respectively. Our preliminary results suggest that the hazard of exit from a market segment negatively dependsupon the entry timing and is higher for de-novo entrants than for incumbents or diversifiers. Also, de-novo entrants that

entry late have a lower hazard of exit. Late entry can be detrimental though as firms not entering before the marketleader, experience a higher hazard of exit than those entering before. In other words, while we do not find evidence of afirst mover advantage in the market and that delayed entry can help firms to make up for their lack of pre-entryexperience, firms should avoid entering ?too late? (i.e. after the leader) if they want to continue to compete in themarket.
Jelcodes:O33,-

Entry time, pre-entry experience and firms’ exit in the Digital Audio Players industry

1. Introduction This paper investigates the evolution of the digital audio players (DAP) industry as shaped by firms’ entry and exit. We analyse entry and exit from market segments by looking at the introduction of new products and by focusing in particular on pre-entry experience, and entry timing as determinants. In doing so, we distinguish two main categories of companies: diversifying entrants and de-novo entrants on the basis of their previous activity in related industries or lack thereof respectively. Our theoretical framework relies on the extensive literature on the relationship between time of entry, pre-entry experience and technological complexity (Gort and Klepper, 1982; Carroll et al., 1996; Bayus and Agarwal, 2007) along the evolution of the product life cycle (Utterback, 1994). Our preliminary results suggest that the hazard of exit from a market segment negatively depends upon the entry timing and is higher for de-novo entrants than for incumbents or diversifiers. Also, de-novo entrants that entry late have a lower hazard of exit. Late entry can be detrimental though as firms not entering before the market leader, experience a higher hazard of exit than those entering before. In other words, while we do not find evidence of a first mover advantage in the market and that delayed entry can help firms to make up for their lack of pre-entry experience, firms should avoid entering ‘too late’ (i.e. after the leader) if they want to continue to compete in the market. The paper is structured as follows. Section 2 reviews the existing literature on the relationship between time of entry, pre-entry experience and firm survival in the context of technologically dynamic sector. Section 3 discusses the main stages of evolution of the DAP industry. Section 4 presents our data and introduces the variables. Section 5 presents the estimation strategy. Section 6 presents the results of the empirical analysis. Section 7 concludes. 2. Literature review The literature has largely investigated the relationship between time of entry, pre-entry experience and firm survival (Gort and Klepper, 1982; Carroll et al., 1996; Bayus and Agarwal, 2007) along the evolution of the product life cycle (Utterback, 1994). Entry time has been recognised as an important determinant of survival in an industry. Scholars have often underlined that early entrants have a competitive advantage over late comers. The seminal paper by Lieberman and Montgomery (1998) discusses the first mover advantage as depending upon three main features, i.e. leadership in technology, consumers’ switching costs, and pre-emption of scarce assets such as factors of production, geographical locations, space of product characteristics, investments in plants and equipment. However, the relationship between survival and time of entry appears to be non linear (Agarwal and Gort, 1996), as very early entrants exhibit survival rates that are similar to very late entrants. In this respect, Klepper (1996) shows that early entrants dominate their sectors, while late comers compete in product niches. In other words, the stage of the product life cycle affects the impact of entry time on the survival rates. The main motivation for this non-linear relationship lies in the heterogeneity of entrants, which plays a fundamental role in explaining not only their survival but also their performance. Very often in new industries (small) start-up – de-novo entrants – and (large) incumbents diversifying their business coexist (Methe et al., 1996; Min et al., 2006). Heterogeneity is mostly related to pre-

entry experience. Companies that are already in the market might find it easy to succeed in a neighbouring sector, because they can exploit their resources and technological, organizational and market-related capabilities and develop complementary assets in order to compete in new market (Teece, 1986; Helfat and Lieberman, 2002). At the same time, organizational inertia, lack of flexibility and fear of cannibalizing their existing products might prevent incumbents to develop innovations and enter a new sector (Hannan and Freeman, 1984; Christensen, 1997). This means that start ups might be the most important source of innovation. However, while there is conflicting evidence on the impact of pre-entry experience on innovation, the literature agrees that incumbents tend to have an advantage over start-ups in terms of survival, but mostly in the early stages of the industry life cycle (Klepper, 1997 and 2002; Min et al., 2006). This is due to the incumbents’ ability to face market uncertainty using their experience. With limited industry-specific knowledge and infant demand, diversifying entrants can leverage upon their reputation and endowment of resources (Bayus and Agarwal, 2007). Related to this, since incumbent firms generally tend to be large firms, many scholars have also found a positive relationship between firm size and the probability of surviving (Hannan and Freeman, 1984; Carrol and Hannan, 2000; Chandy and Tellis, 2000). The role of pre-entry experience has been also recognized by Lieberman and Montgomery themselves in a subsequent contribution (Lieberman and Montgomery, 1998), which links the literature on first-mover advantage to the resource-based view of the firms. Surveying the existing literature, they argue that early entrants may lose their initial advantage, because late comers might be endowed with better resources and capabilities and that entry time is endogenous to the firm-specific assets and to industry-specific context. Besides firm-specific characteristics, the sectoral environment has also an important role in determining firm entry and survival. In particular, industry characteristics in terms of technological regime (Malerba and Orsenigo, 1997) and stage of the life cycle have an important impact on the evaluation of the relationship between entry time, pre-entry experience and firm survival. The knowledge base of an industry evolves over time, so that an entrepreneurial regime, which is favourable to innovative entry and un-favourable to innovative activity by incumbents, is followed by a routinized regime, which favours incumbents’ innovative leadership as opposed to new innovators (Nelson and Winter, 1982). Firm density is also an important factor characterizing different sectors and possibly affecting survival rates. At the initial stages of the industry life cycle, an increase in the number of firms reduces the mortality rates because of legitimacy; as time goes by however competition becomes more intense and exit rates increase (Carroll and Hannan, 2000). This means that there is a U-shaped relationship between the number of competitors and the probability of surviving within a sector. The product life cycle theory has discussed at length the evolution of innovative strategies along different stages (Tushman and Anderson, 1986; Utterback, 1994; Klepper, 1997; Agarwal and Bayus, 2002). In the initial phases, when uncertainty is high and the demand has not yet converged towards the adoption of a specific technology, firms compete on the basis of product innovation, generating an increasing degree of variety in the market. As soon as a dominant design emerges in the market, firms develop incremental changes within the standard until the technology matures (Tushman and Anderson, 1990; David and Greenstein, 1990; Tushman and Murman, 1998).
However, as the market matures, firms have the incentives to introduce product variety to gain market power either by offering products that are not provided by competitors, or by increasing the product range and exploiting the market segmentation in a strategic way (Corrocher and Guerzoni, 2011). What is interesting from our point of view is that an industry might reach a stage where incumbents might not be able to address new market needs and, thus, small specialized producers might emerge (Klepper, 1996; Klepper and Thomson, 2006). In technologically dynamic industries successive generations of improved and more complex products are frequently introduced in the market. Firm competitive advantage crucially depends on the embracement of more advanced technologies, but the technological and market legacy of incumbents might prevent them to adopt them (Christensen, 1997; Carroll and Swaminathan, 2000). Within the above described framework of analysis, this paper investigates the relationship between firm survival, time of entry and pre-entry experience along different product niches that have successively emerged over time in the digital audio player sector. Next section will describe the main features of the industry, focusing in particular on the emergence of different products and technologies and on the characteristics of the industrial dynamics. In doing so, it will distinguish among three main types of companies – incumbents, diversifiers, and de-novo entrants – and discuss their competitive strategies in this technologically dynamic industry. 3. The evolution of the DAP industry 3.1. Defining the product DAPs emerged in the market with the introduction technologies of digital audio compression (audio codecs) during the 1990s. Digital audio allowed treating audio tracks as simple data files; audio compression contributed to make them more manageable, more easily storable and transmittable through the Internet. This allowed the creation of portable devices (DAPs) able to store and reproduce these kinds of audio files. The first digital audio compression algorithm gaining popularity, which also gave the name to the whole category of portable players, is MP3. The main consequence of the introduction of the MP3 was that it became rapidly a de facto standard for home audio encoding (Holmes, 2006: 203). Although CD players able to read and reproduce MP3 files (MP3-CD) could be de facto considered portable players of digital audio, a DAP (or MP3 player ) is a portable device able to store and play compressed digital audio files, in which there is also a separation between audio file and the physical storage medium containing it. In fact, the term digital audio player is most commonly used to describe portable players that use non-removable erasable digital media, such as CDs and MDs (Holmes, 2006: 75). DAPs can be classified into several categories: flash players, hard drive (HD) players and Microdrive players, depending on the storage medium they use. Usually, flash players are small and lightweight devices, but a with limited storage space, while HD players are generally bigger and heavier, but with a much higher storage capacity. The last group of DAPs use a Microdrive, which is still a hard drive. However, since it is very compact sized, it has been used to produce DAPs more similar in size to flash based players. Microdrive players only achieved a limited use, since flash memories quickly overcame Microdrive’s capacity, making them economically obsolete for DAPs. In general, although some very miniaturized MP3 players do not have any display,
DAPs are often equipped with a screen (at the beginning monochromatic, then with colours). The DAPs display allows browsing the music library stored in the internal memory, and selecting the songs to play. Usually, MP3 players are able to read the metadata contained in the MP3 files tags, showing artist name, song title and other information during playback. In addition, to the main function of music listening, some models of DAPs have been equipped with additional features such as FM radio player or voice recorder. After this, many more functions have been added, such as photo display, video playback, games, alarm/calendar, etc. DAPs are generally low consumption devices, since they do not necessitate mechanical parts to be operated, in contrast, for instance, with a CD player, which has to spin a CD in order to play it. This means that DAPs generally have a longer battery life. The main difference among DAPs regarding the battery is whether the player is equipped with a rechargeable battery or not. Some players used one or two AA or AAA non-rechargeable battery, which had to be substituted each time. Other players used built-in rechargeable batteries (usually lithium polymers or lithium ions batteries). Some other players allowed disposable batteries or rechargeable batteries (in general AA or AAA rechargeable batteries) to be used in the same device. Over time, the number of players with non-rechargeable battery gradually decrease, eventually having all the DAPs launched equipped with rechargeable battery. 3.2. The DAPs industry and the major competitors The history of DAPs begins during the end of the 1990s (see Figure 1) when some companies started to patent inventions regarding MP3 players or announcing the launch of new products.
[Insert Figure 1 about here] The first MP3 player available was the MPMan created by the South Korean company SaeHan in 1998, and the Rio PMP300 launched by Diamond Multimedia a few months later (Knopper, 2009: 166). Both players were equipped with a 32 MB flash memory therefore providing a very limited space for storing MP3 files (not more than 10/12 songs). A potential solution to this lack of storage space was to use a hard drive as memory for DAPs. In 1998, Compaq used a 2.5” laptop hard disk to create the first hard drive based DAP , the Personal Jukebox (PJB-100) manufactured under license by HanGo Electronics. This player had a 4.8GB hard drive, making it possible to store more than 1000 songs. In 2000, Creative launched the Nomad Jukebox, equipped with a 6 GB hard drive. These hard drive based DAPs coped with the issue of limited storage space of the first flash players; however, they had the disadvantage of being heavy and quite slow in loading the MP3 files (Knopper, 2009: 167). In October 2001, Apple entered the MP3 players market, launching its first iPod. With this product, Apple attempted to provide a response to the problems that early DAPs were suffering from. Apple’s iPod was certainly a highly innovative and groundbreaking product (Kahney, 2005: 39). It was small, compact, with an appealing design, and easy to use. However, at the beginning, Apple’s market was still limited, since it was quite highly priced (US$ 399), and not compatible with Windows based PCs (Knopper, 2009: 171). In fact, the first version of iTunes was only MAC compatible. Moreover, in that period, FireWire connection was mostly used to transfer video
streams recorded with portable camcorders, and it was not equipped in many Windows based PCs.
After the first iPod, Apple released several improved versions of its DAP. Since the very beginning, the user interface evolved into a touch sensitive scroll wheel. Then, the iPod become compatible with Windows operating system, first in 2002 through the software Musicmatch, and then in 2003 thanks to the launch of iTunes 4.1 for Windows. In addition, the release of the USB 2.0 standard made FireWire unnecessary. For this reason, Apple started selling iPods equipped with both cables, with USB 2.0 eventually substituting FireWire connection. Since 2001, iPod sales increased steadily, as reported by Figure 2.
[Insert Figure 2 about here] More or less the sales triplicated every year: 125,000 units in 2001, 470,000 in 2002, and 1,451,000 in 2003. A major increase in sales occurred in 2004, when Apple launched its first iPod with colour screen and photo display capability, with up to 60GB memory, and also started differentiating the production. In fact, in that year, Apple launched the first iPod Mini, based on a Hitachi’s 4GB Microdrive. This kind of memory is a miniature hard drive, which combines a sufficient high storage capacity with a very small size, allowing to produce an iPod even more portable than the classic iPod, but with more storage capacity than flash based players sold by competitors. The combined sales of iPod Classic and iPod mini overcame 8 million units in 2004, making the iPod the undisputed market leader in the DAP sector. However, Apple innovative activity did not rest. In 2005, a new iPod with video capabilities and memory up to 160GB was launched, together with two new different iPods based on flash memory. The first model was the iPod Shuffle, a highly miniaturized player without screen and with the shape of a USB memory stick. This player was the most simple and portable device sold by Apple. The other product was the iPod Nano, replacing the Mini with a very slim size, colour screen and up to 4 GB storage space. Both iPod Shuffle and iPod Nano experienced great success, allowing Apple to sell almost 32 million iPods in 2005. After 2005, Apple periodically launched new versions of iPod Nano, Classic and Shuffle, with new colours, redesigned aesthetics, new features, and more storage space. Finally, in 2007 Apple launched another line of DAPs, the iPod Touch, a player with a multi-touch screen that served also as user interface, with also another set of features, such as Wi-Fi connection, Internet browsing and games. Certainly, one of the factors that contributed to iPod’s success was its seamless integration with iTunes software. Also iTunes evolved with the iPod, making it possible to load videos, share music within local networks, rip and burn CDs, etc. Moreover, since April 2003, iTunes become a digital media online store, selling legal music in digital format, and later also video content, such as movies and TV series episodes. Figure 0.2 shows a slight decline in sales in 2009 and 2010. This may depend on two causes. First of all, in 2007 Apple launched its famous smartphone, the iPhone, which sales are not reported in the figure. This phone is also a DAP, meaning that it probably attracted some previous or potential iPod customers. Second, another possible cause can be related

with the fact that even considering replacements, the diffusion process of iPods was already reaching its final phase, since most of its potential adopters already purchased it. 3.2.1. Industry competition Besides Apple, many companies entered into the DAP business, but few companies seriously attempted to erode Apple’s supremacy. We can distinguish two types of players in the market: diversifying entrants and de novo entrants. The first group of players is represented by companies such as Sony and Philips. These companies shaped the portable music player markets for decades; however, they failed to transfer their leadership to the emerging DAPs industry. They reacted to iPod success, launching new products, which were not distant from Apple in terms of price, characteristics, features, etc. However, they never met Apple’s sales. At the end of the 1990s, when the MP3 codec was invented and the DAPs began to emerge, the innovative activity of these companies was mostly directed to the development of new storage media, such as Minidisc, DCC and DAT. However, one of the major innovations brought by audio compression was to free music from any specific storage medium. In other words, now songs could be stored in every kind of memory, such as a hard drive, a Microdrive, or a flash memory. The incumbents were still concentrating on an old conception of music players, in which music almost coincided with the storage medium (Knopper, 2009). Audio compression allowed by MP3 and other audio codecs broke this idiosyncrasy and apparently incumbents have not been able to react to this change. Moreover, Sony had for many years a sort of disregard for MP3, aiming at diffusing its proprietary codec (ATRAC1, ATRAC3, and ATRAC3plus). For this reason, some first Sony’s DAPs were not MP3 compatible. This meant that the whole users’ collections of MP3 files had to be converted in ATRAC3 before they could be loaded into the player. It is true that other competitors had a preferred audio coding, starting from Apple that sold songs in AAC. However, the majority of DAPs were still compatible with the MP3 format. Finally, Sony, being both a DAP producer and a music label (Sony Music Entertainment) always had an internal conflict regarding digital music. In fact, Sony was selling MP3 players, which could also contain audio files exchanged through the Internet, but at the same time was part of RIAA (Recording Industry Association of America), strongly opposing to file sharing (Knopper, 2009: 174). The second type of competitors is represented by a group of heterogeneous firms. This is the case, for instance, of Creative and Microsoft. Both companies could build upon some proprietary assets that, in principle, could have represented a strategic advantage with respect to Apple. Creative Technology is a company based in Singapore established in 1981 and it is one of the World’s market leaders in the production of sound cards for computers, sound systems and speakers. It also entered in the sector quite early, offering one of the first HD based player (Nomad), followed by the Muvo and Zen series. However, Creative never managed to transfer the knowledge acquired with the production of sound and audio components to the market of portable devices, becoming a follower of Apple. Microsoft entered into the market more recently, trying to challenge Apple’s leadership by offering a system-type of product very similar to iPod/iTunes. Microsoft Zune was launched in 2006, and was followed by a series of improved models with higher storage capacity and more functions. Zune worked with Zune software, an application similar to iTunes, which also started selling audio and video contents through the Zune Marketplace. One of
Microsoft’s advantages was its very large customer base already using Microsoft operating systems. Moreover, even if Microsoft did not have any direct experience in portable audio players, they had some kind of expertise with digital audio. In fact, Microsoft had a proprietary audio codec, WMA (Windows Media Audio) that was mostly used for online streaming applications. Moreover, most of its customers already used a Microsoft’s software to manage and listen to music (Windows Media Player). In any case, despite these potential advantages and besides a considerable economic and advertising effort, Microsoft Zune never threatened Apple leadership. Also belonging to this group are Diamond multimedia and Archos. Diamond Multimedia is a company specialized in video cards for computers and other peripherals. Diamond has been also a very early entrant into the DAP sector, selling one of the first DAP in the United States, the Rio PMP300, the first one encountering a certain success (Knopper, 2009: 166). This player also received the attention of RIAA that sued Diamond Multimedia claiming that the player violated music copyrights, and in particular, the Audio Home Recording Act (ibid). Archos is a French company established in 1988, initially producing different kinds of computer peripherals during the 1990s. Archos was also an early entrant into the DAP market, soon emerging as one of the most innovative and venturesome company in the sector. In fact, Archos has been a pioneer for many incremental innovations of DAPs . For instance, Archos Multimedia Jukebox, launched in September 2002, had a colour display and the capability of showing pictures and video two years before the launch of iPod Photo and three years before the iPod Video. Moreover, Archos PMA400, launched in January 2005, was equipped with a touch screen, Wi-Fi connection and the possibility to record video, more than two years before the launch of the iPod Touch. Apple was neither the first player entering in the market, nor the first one introducing some of the major innovations (hard drive, colour screen, touch screen interface, etc.). Moreover, Apple could not count on specific knowledge on audio players, since it did not have direct experience in the sector. In addition, Apple’s iPods were not necessarily superior to competitors’ products, at least from a pure technical point of view. However, none of the above mentioned players managed to weaken Apple leadership in the sector. Some of the major strengths of Apple were its attention to usability, to product design (both architectural design and aesthetical) and to the demand side. In particular, Apple has been able to recognize and in some cases to anticipate users needs, and continuously innovate in order to fulfil them (Kahney, 2005). Another aspect that deserves particular attention is iPod’s seamless integration with iTunes. In fact, Apple did not just sell a DAP, but a bundle of product and services, materializing in a piece of hardware, but usable only thanks to a software (iTunes), which expanded iPod capabilities, by offering an additional series of services to users. 4. Data and variable definitions The data used for this paper come from a comprehensive dataset of all the DAPs commercialized between 1999 and 2009. For each product commercialized in this time period we have collected information on date of product entry, price, technological characteristics and manufacturer. The final data set includes 586 products commercialised by 10 manufacturers active in 7 product segments for a total of 165 firm-segment-year observations. In the remaining of the section we present some preliminary statistics on the pattern of firm entry and exit at the market segment level.
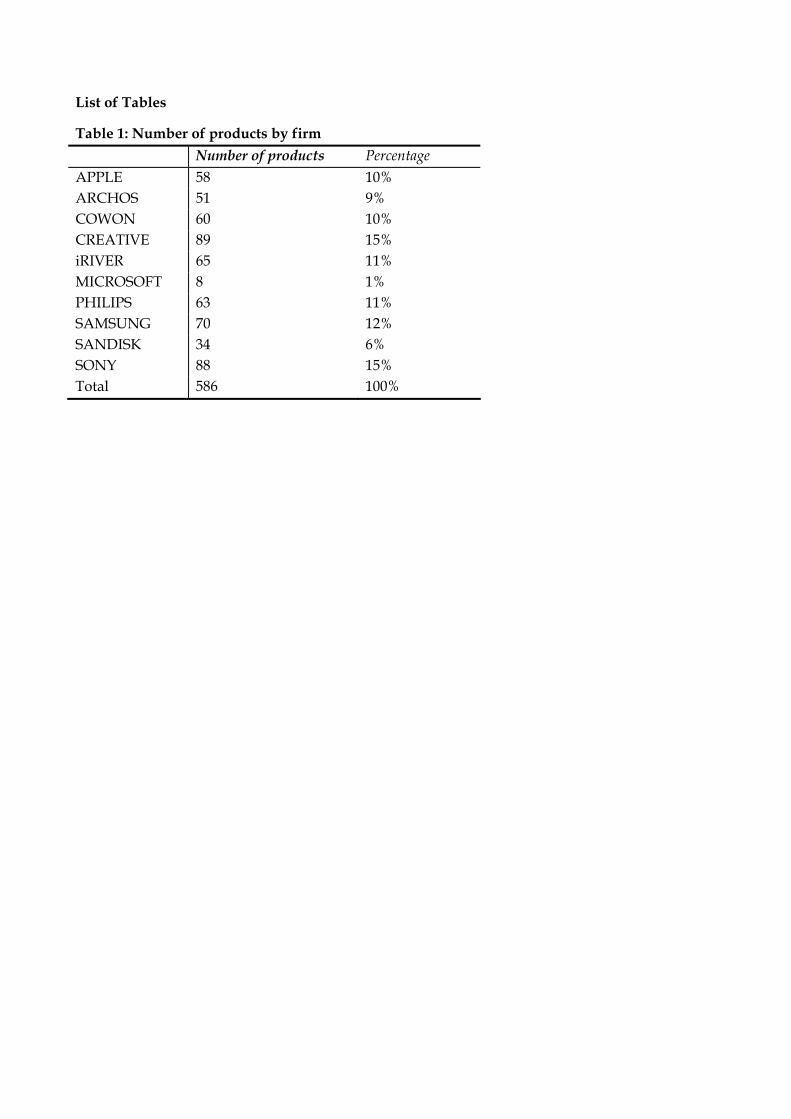
Table 1 reports the number of products by firm. It is interesting to observe that even if Apple is the market leader, the distribution of new products is quite even across firms.
[Insert Table 1 about here]
As mentioned before, it is possible to distinguish two categories of firms diversifying entrants and de-novo entrants. Table 2 reports the number of products introduction broken down by firm category.
[Insert Table 2 about here]
The technological evolution of DAPs discussed in the previous section has led us to identify seven market segments that are defined according to two characteristics: a) storage medium (HD, Microdrive, Flash) b) screen (no screen, black and white, colour, touch) Table 3 reports the number of products by segment. Figure 3 shows instead the pattern of product introduction by year in each segment.
[Insert Table 3 and Figure 3 about here] Finally, Table 4 reports, for each segment, the year of first product launch, year of entry for the first mover and year of entry of market leader (i.e. Apple). As it can be seen, despite being the leader, Apple has almost never been the first mover, leaving the space for others to be incumbents.
[Insert Table 4 about here] 4.1. Firm exit Our dependent variable is the timing of exit from a DAP product segment. We measure exit in terms of a firm ceasing to introduce new products in a specific DAP product segment. A firm ceases to commercialise products in segment i in year t if the number of new products commercialised for that segment is zero for at least two consecutive years after year t.1 According to this definition, 50.3% of our observations can be considered as exits before 2009. 4.2. Entry timing Entry timing is an important determinant of firm survival. Segments identifying products of different generations which evolve and develop at different speed. We thus expect firm hazard of exit to change depending on the timing of entry into a specific segment. The level of detail of our data allows us to account for entry timing difference across generations of DAPs. Entry time in segment i is defined as the year in which a firm enters segment i less the year we register the launch of the earliest product in segment i in our database.
1 We allow a firm not to commercialise any product for one period at most. This happens only in three cases for the firms in our sample.
4.3. Pre-entry experience To identify firms with pre-entry experience we have looked at the activity of firms in our sample prior to their entry into the DAP market. Around one third of the firms were active in a related market: the portable CD player. These firms possess both the technical expertise (i.e. knowledge about the technology) and the market experience (i.e. knowledge about the customers) to compete in the industry. We define these firms diversifying entrants. Examples include Sony, Philips and Samsung. The rest of the firms in our market either did not have any prior experience in a related market or were young start-ups. We define these firms (70% of our sample) De novo entrants. De novo is a dummy equal to one if the firm has not been previously active in the portable CD player market and zero otherwise. 4.4. Product innovation strategies The aim of our analysis in this case is to understand whether and how entry by Apple influences the timing of exit from a DAP product segment. We carry out this analysis in two ways. We first account in the regression for whether entry in specific DAP segment has occurred before or after entry by Apple. Entry before Applei is a dummy equal to one if the firm has entered segment i before Apple, and zero otherwise. Entry after Applei is a dummy equal to one if the firm has entered segment i after Apple, and zero otherwise. We interact these variables with our indicator of pre-entry experience to understand whether the impact of entry by Apple on the hazard of exit changes across de-novo and diversifiers. Entry before Applei x De Novo, Entry before Applei x Diversifier, Entry after Applei x Diversifier, is a set of mutually exclusive variables indicating whether the specific category of entrant entered segment i before or after Apple (the baseline category being De-novo firms entering after Apple). Second, we test whether the effect of competition from Apple on the hazard of exit changes depending on: the time of Apple’s entry into a specific segment; firms’ entry time and on the time elapsed between Apple’s entry and firms’ entry time. To perform this analysis we use the following variables. Apple entryit is equal to one for each year t after Apple entered DAP segment i and zero otherwise. We then distinguish firms in our sample into three cohorts of entrants. Cohorti 3, contains the firms that entered segment i after the entry of Apple. Cohorti 2, contains the firms that in the same year in which Apple entered. Cohorti 1 contains all the firms that entered earlier than Apple. Finally Time from Apple entryi is defined as the difference between the year Apple entered segment i and firms entry time in segment i. 4.5. Controls As controls we include a series of variables accounting for tenure in the segment, segment structure, and the characteristics of the specific product market segment. Firm age in segment i captures tenure as measured by the time elapsed since entry occurred in a specific segment i. Previous studies (REF HERE) have highlighted a non linear relationship between industry tenure and the hazard of exit. Firm age in segment i sq captures this non linearity. To control for the structure of the segment, we use two variables based on product density. On the one hand, the presence of many products in a segment increases the hazard of exit by crowding the product space, and increasing competition (REF HERE). On the other hand, an initial increase in the number of products commercialised in a specific segment also signals product viability, contributes to a reduction in uncertainty and should translates into a general decline in hazard rates (REF HERE). Density of segment i at t-1 measures the number of products available in segment

i in the year prior to firm’s entry. Density of segment i at t-1 sq captures the non linearity of the effect. Finally, we account for product specific characteristics. Each product segment identifies a specific generation of DAPs with specific characteristics catering for specific customer bases. Firms may be active in several segments thus leading to the possibility of increasing competition from close or distant substitutes (Greenstein and Wade, 1998 other REF HERE). Moreover, the speed of product life cycle is likely to differ across different DAPs generation. As a result, products may become obsolete at different rate therefore conditioning the hazard of exit from that specific segment (Berndt and Griliches, 1993; Stavins, 1995). A list of segment dummies is included in each regression to capture the impact of segment specific characteristics on the hazard of exit. 5. Estimation methodology Given that information on entry and exit from each market segment is available on a yearly basis we employ discrete time duration models to estimates the hazard of exit from a specific market segment i. We assume there are firms j = 1, …, N entering market segment i at time t = 0. The hazard of exit for firm j in segment i at time t can be assumed to take the following form:
jiijit Xt 0 (1)
Where ti0 is the baseline hazard function for segment i and Xji is a series of firm and segment
based characteristics summarizing observed differences across firms, and market segment couples. It can be shown (Jenkins, 1995) that the discrete time formulation of the hazard of exit from segment i for firm j in time interval t is given by a complementary log-logistic function:
tXXh jijijit expexp1 (2).
To test the remaining hypotheses we employ instead a semi-parametric estimation approach. More precisely, following Klepper and Simon (2005) who carried out a similar analysis in a different context, we estimate the following Cox proportional hazard function:
jii
itiji
itijiit
itijitijit
jitjijit
XentryApplefromTime
entryAppleCohortentryApplefromTime
entryAppleCohortentryApplefromTimeentryApple
entryAppleCohortentryAppleCohortentryApple
agehXh
___
_3___
_2____
_3_2_
exp6
54
321
(3)
Where Xji includes the same covariates used in the discrete time estimation. 6. Estimation results Table 5 reports results of our clog-log estimations where the explanatory variables are introduced in sequence.
[Insert Table 5 about here]
In Model 1 we consider the effect on the hazard of exit of our control variables together with entry time. The coefficient of entry time is negative and significant suggesting that the later firms enter a

specific segment i the lower is their hazard of exit. This result is robust to the inclusion of subsequent variables in Model 2 and in line with the expectations and the evidence discussed in Section 2. Additionally, both our coefficients for the density controls are significant with the linear effect positive and significantly higher than the quadratic effect suggesting that the DAPs industry has been characterised by the presence of strong competition at the segment level. Also these findings are consistent with evidence from previous studies (QUOTE HERE). Our estimates reveal the presence of negative but non linear age dependence as indicated by the negative and positive coefficients of age and age squared respectively. This implies that the hazard of exit is initially high (i.e. liability of newness at the segment level), tends to decrease only to increase again at later stages. All in all these results suggest that, competition at the segment level may be very hard especially at early stages when uncertainty about customers’ preferences for a specific design is high. Within this context delaying entry may be seen as a good strategy to fend off competition. In Model 2 we add the dummy for pre-entry experience. The coefficient of De novo is highly significant and positive indicating that de novo entrants have a higher hazard rate than diversifying firms which is consistent with prior findings from the literature (QUOTE HERE). The marginal effect is also quite high as de novo firms experience a hazard of exit which is 74% higher than diversifying entrants. To test whether the initial disadvantage of de novo firms can be overcome, we interact in Model 3 pre-entry experience with entry time. The coefficient of De novo x Entry time in segment i is negative and significant suggesting that among firms entering at later stages of the product life cycle de-novo entrants experience a lower hazard rate than diversifying entrants. Interestingly the coefficient of De novo is still highly positive and significant. Altogether these results suggest that De novo entrants have an initial disadvantage with respect to diversifying entrants. However, the disadvantage decreases the later they entry into a specific segment of the DAPs industry. The previous results suggest the presence, for the firms in our sample, of a sort of a ‘late mover advantage’ as firms entering late experience a relatively lower hazard rate. This advantage is also beneficial for de novo entrants as it allows them to close the relative gap in experience with respect to diversifying entrants. These benefits notwithstanding, late entry can also be risky as it may expose new firms to strong competition particularly when they entry after the industry leader. We check for this possibility in a series of regressions summarised in Table 6.
[Insert Table 6 about here] In Model 1 the coefficient of the dummy Entry before Applei is negative and significant, albeit weakly, indicating that firms entering before the industry leader experience a lower hazard of exit than firms entering after the industry leader. In Model 2 the coefficient of the variable Entry before Applei X Diversifier is negative and significant indicating that diversifiers entering before the industry leader experience lower hazard rates than de novo firms entering after the leader. The coefficient for the variable Entry before Applei X De novo instead is also negative but not significant. We take these results as an indication that the impact of entry after the industry leader on the hazard of exit is moderated by firm pre-entry experience. In the remainder of the paper we employ semi-parametric Cox regressions. Results are presented in Table 7.

[Insert Table 7 about here]
In Model 1 we estimate individual hazard rates for several categories of entrants by breaking the sample in three cohorts as defined in Section 4.4. Coefficients for Cohorti 1 and Cohorti 2 are both negative but insignificant. In Model 2 we allow the hazard of each entry cohort to change at the entry of Apple into the segment. Coefficient 1 is negative confirming that firms entering before the industry leader experience a lower hazard of exit. However, the coefficient is not significant. Coefficients 2 and 3 are instead positive and significant indicating that those firms not entering before the industry leader experience a higher hazard rate. It is interesting to note that 3 is higher than 2 and that the linear combinations (1 + 2) and (1 + 3) are both greater than zero and significant indicating that the magnitude of the impact of is ordered by order of entry. In particular, the hazard of exit of firms entering after the industry leader (Cohorti 3) is higher than the hazard of exit of firms entering in the same year of the industry leader (Cohorti 2). In Model 3 we allow the hazard of each entry cohort to change at different rates depending on the time elapsed since Apple’s entry into the segment. In this case the estimates of 4 and 5 are positive though never significant. Also the linear combinations (4 + 5) and (4 + 6) are all positive suggesting the hazard of each cohort increased as time elapsed, although they are never significant. Altogether these results indicate that for the firms not entering before the industry leader, hazard rates do not change as time elapses. In other words, hazard rates do not converge, as it would happen if the effect of the leader entry would fade away with time. Results do not change when we estimate the full Model 4. Again, the hazard of exit of firms entering after the industry leader (Cohorti 3) is higher than the hazard of exit of firms entering in the same year of the industry leader (Cohorti 2) and this difference lasts over time. 7. Overview and conclusions This paper has investigated the role of pre-entry experience and entry timing in the pattern of entry and exit of firms in the market for DAP. In doing so, it compared de-novo entrants with diversifiers, with the aim of providing some hints on new firms’ performances in a highly dynamic sector, characterized by a rapid evolution of the technology and by the emergence of subsequent product niches over time.
The data come from a comprehensive dataset of all the DAPs commercialized between 1999 and 2009. For each product commercialized in this time period we have collected information on date of product entry, price, technological characteristics and manufacturer. The final data set includes 586 products commercialised by 10 manufacturers active in 7 product segments for a total of 165 firm-segment-year observations
Our results show that the hazard of exit is initially high (i.e. liability of newness at the segment level), tends to decrease only to increase again at later stages. This suggests that competition at the segment level may be very hard especially at early stages when uncertainty about customers’ preferences for a specific design is high. Within this context delaying entry may be seen as a good strategy to fend off competition. When controlling for pre-entry experience, our results suggest that, among firms entering at later stages of the product life cycle, de-novo entrants have a lower hazard rate than diversifying entrants. Therefore, although de-novo entrants have an initial disadvantage with respect to diversifying entrants, the disadvantage decreases the later they entry into a specific segment of the DAPs industry. These benefits notwithstanding, late entry can also

be risky as it may expose new firms to strong competition particularly when they entry after the industry leader. Indeed our findings show that firms entering before the industry leader experience a lower hazard of exit than firms entering after the industry leader. However, this effect is particularly strong for de-novo entrants, indicating that the impact of entry after the industry leader on the hazard of exit is moderated by firm pre-entry experience.

Reference list
Agarwal, R., B. L. Bayus. 2002. The market evolution and take-off of new product innovations. Management Science 48(5) 1024–1041.
Agarwal, R., D.Gort. 1996. The Evolution of Markets and Entry, Exit and Survival of Firms. The review of economics and statistics 78(3), 489-498.
Bayus, B.L., Agarwal, R. 2007. The role of pre-entry experience, entry timing, and product technology strategies in explaining firm survival. Management Science 53(12), 1887-1902.
Berndt, E.R., Z.Griliches 1993. Price Indexes for Microcomputers: An Exploratory Study. In M. E. Manser, M. F. Foss, and A. H. Young (eds.), Price Measurements and Their Uses, NBER Studies in Income and Wealth 57 (Chicago:University of Chicago Press,1993), 63-93.
Carroll, G., M. Hannan. 2000. The Demography of Corporations and Industries. Princeton University Press, Princeton, NJ.
Carroll, G., L. Bigelow, M. Seidel, L. Tsai.1996. The fates of de novo and de alio producers in the American automobile industry: 1885–1981. Strategic Management Journal 17 117–137.
Carroll, G. R., A. Swaminathan. 2000. Why the Microbrewery Movement? Organizational Dynamics of Resource Partitioning in the American Brewing Industry after Prohibition. American Journal of Sociology 106, 715-762.
Chandy, R., G. Tellis. 1998. Organizing for radical product innovation: The overlooked role of willingness to cannibalize. Journal of Marketing Research 35(November) 474–487.
Christensen, C. 1997. The Innovator’s Dilemma: When New Technologies Cause Great Firms to Fail. Harvard Business School Press, Boston, MA.
Corrocher, N., M. Guerzoni. 2011. The pursuit of variety: A note on the excludability between new products and strategic differentiation. Mimeo.
David, P., S. Greenstein. 1990. The economics of compatibility and standards: An introduction to recent research. Economics of Innovation and New Technology 1, 3-41.
Gort, M., S. Klepper. 1982. Time paths in the diffusion of product innovations. Economic Journal 92(3), 630–653.
Greenstein, S.M., J.B. Wade. 1998. The product life cycle in the commercial mainframe computer market, 1968-1982. RAND Journal of Economics 29(4), 772-789.
Hannan, M., J. Freeman. 1984. Structural inertia and organizational change. American Sociology Review 49 149–164.
Helfat, C., M. Lieberman. 2002. The birth of capabilities: Market entry and the importance of pre-history. Industrial and Corporate Change 11(4) 725–760.
Holmes, T. (ed.) 2006. The Routledge Guide to Music Technology. New York, NY: Routledge.
Jenkins, S. 2005. Survival analysis. http://www.iser.essex.ac.uk/files/teaching/stephenj/ec968/pdfs/ec968lnotesv6.pdf
Kahney, L. 2005. The cult of iPod. No Starch Press, San Francisco.

Klepper, S. 1996. Entry, exit, growth, and innovation over the product life cycle. American Economic Review 86(3) 562–583.
Klepper, S. 1997. Industry Life Cycles. Industrial and Corporate Change 6 (1), 145-181.
Klepper, S. 2002. Firm survival and the evolution of oligopoly. Rand Journal of Economics 33(1) 37–61.
Klepper, S., P. Thompson. 2006. Submarkets and the Evolution of Market Structure. Rand Journal of Economics 37(4), 861-886.
Klepper, S. K.L. Simons. 2005. Industry shakeouts and technological change. International Journal of Industrial Organization 23(1-2), 23-43.
Knopper, S. 2009. Appetite for Self-Destruction: The Spectacular Crash of the Record Industry in the Digital Age. Free Press, London.
Lieberman, M., D. Montgomery. 1998. First-mover (dis)advantages: Retrospective and link with the resource-based view. Strategic Management Journal 19(12) 1111–1125.
Malerba, F., L. Orsenigo. 1997.Technological Regimes and Sectoral Patterns of Innovative Activity. Industrial and Corporate Change 6(1), 83-117.
Methe, D., A. Swaminathan and W. Mitchell. 1996. The Underemphasized Role of Established Firms as sources of Major Innovations. Industrial and Corporate Change 3(4), 1181-1203.
Min, S., M. Kalwani, and W. Robinson. 2006. Market Pioneer and Early Follower Survival Risks: A Contingency Analysis of Really New Versus Incrementally New Product-Markets. Journal of Marketing 70 (January), 15-33.
Nelson. R.R., S. Winter (1982). An Evolutionary Theory of Economic Change. Harvard University Press, Boston, MA.
Stavins, J. 1995. Model Entry and Exit in a Differentiated-Product Industry: The Personal Computer Market. The Review of Economics and Statistics 77(4), 571-584.
Teece, D. 1986. Profiting from technological innovation: Implications for integration, collaboration, licensing, and public policy. Research Policy 15(6) 285–305.
Tushman, M., P. Anderson. 1986. Technological discontinuities and organizational environments. Administrative Science Quarterly 31(3), 439–465.
Tushman, M., P. Murmann. 1998. Dominant Designs, Innovation Types and Organizational Outcomes. Research in Organizational Behavior 20, 231-266.
Utterback, J. 1994. Mastering the Dynamics of Innovation. Harvard Business School Press, Boston, MA.
List of Tables
Table 1: Number of products by firm
Number of products Percentage APPLE 58 10% ARCHOS 51 9% COWON 60 10% CREATIVE 89 15% iRIVER 65 11% MICROSOFT 8 1% PHILIPS 63 11% SAMSUNG 70 12% SANDISK 34 6% SONY 88 15% Total 586 100%

Table 2: Number of product introductions by firm category Number of products Percentage Diversifying entrants 375 64% De Novo entrants 211 36% Total 586 100%
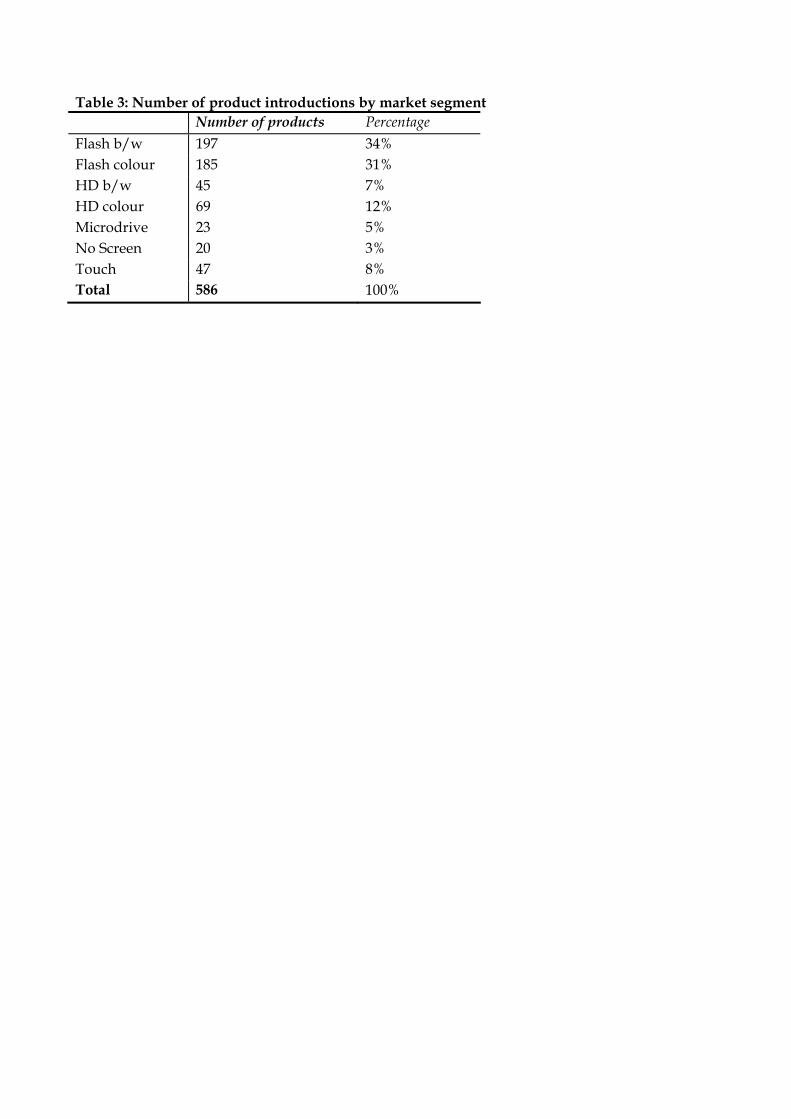
Table 3: Number of product introductions by market segment Number of products Percentage Flash b/w 197 34% Flash colour 185 31% HD b/w 45 7% HD colour 69 12% Microdrive 23 5% No Screen 20 3% Touch 47 8% Total 586 100%

Table 4: First movers (and Apple’s entry) by market segment SEGMENT FIRST MOVER FIRST YEAR APPLE’S ENTRY Flash b/w CREATIVE 1999 No HD b/w ARCHOS 2000 2001 HD colour ARCHOS 2002 2004 No Screen CREATIVE 2002 2005 Flash colour IRIVER 2004 2005 Microdrive APPLE 2004 2004 Touch ARCHOS 2005 2007
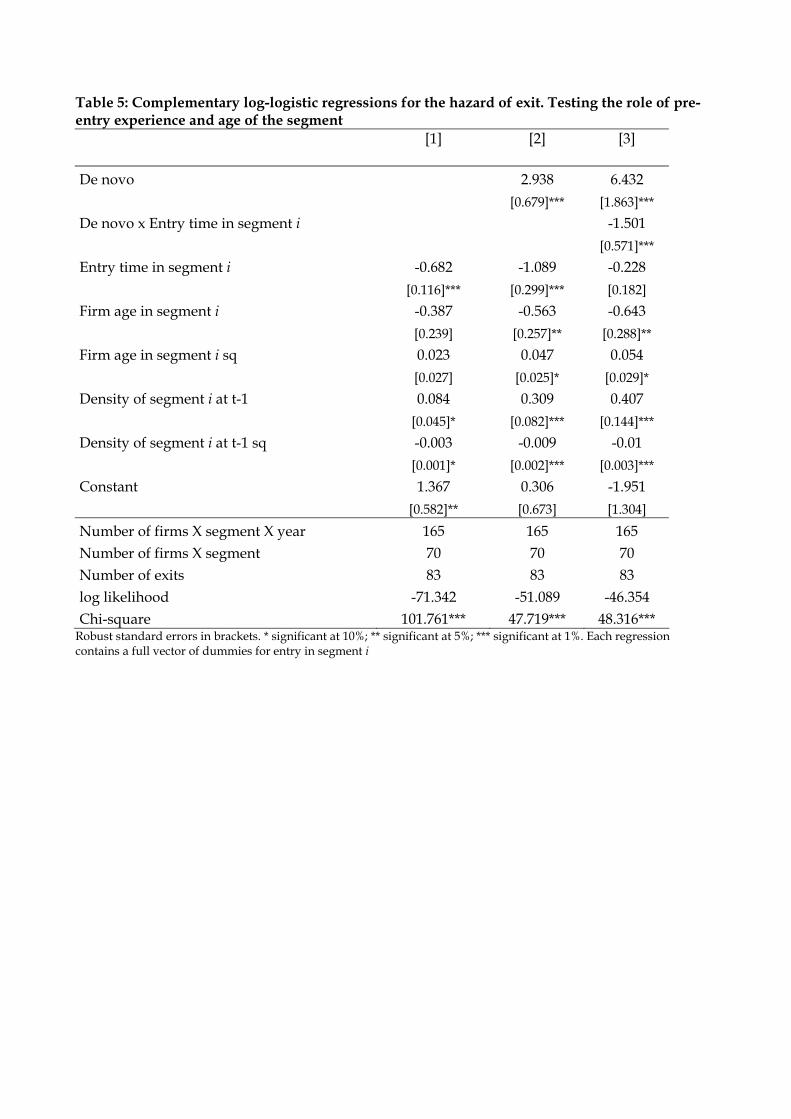
Table 5: Complementary log-logistic regressions for the hazard of exit. Testing the role of pre-entry experience and age of the segment
[1]
[2]
[3]
De novo 2.938 6.432
[0.679]*** [1.863]***
De novo x Entry time in segment i -1.501
[0.571]***
Entry time in segment i -0.682 -1.089 -0.228
[0.116]*** [0.299]*** [0.182]
Firm age in segment i -0.387 -0.563 -0.643
[0.239] [0.257]** [0.288]**
Firm age in segment i sq 0.023 0.047 0.054
[0.027] [0.025]* [0.029]*
Density of segment i at t-1 0.084 0.309 0.407
[0.045]* [0.082]*** [0.144]***
Density of segment i at t-1 sq -0.003 -0.009 -0.01
[0.001]* [0.002]*** [0.003]***
Constant 1.367 0.306 -1.951
[0.582]** [0.673] [1.304]
Number of firms X segment X year 165 165 165 Number of firms X segment 70 70 70 Number of exits 83 83 83 log likelihood -71.342 -51.089 -46.354 Chi-square 101.761*** 47.719*** 48.316***
Robust standard errors in brackets. * significant at 10%; ** significant at 5%; *** significant at 1%. Each regression contains a full vector of dummies for entry in segment i
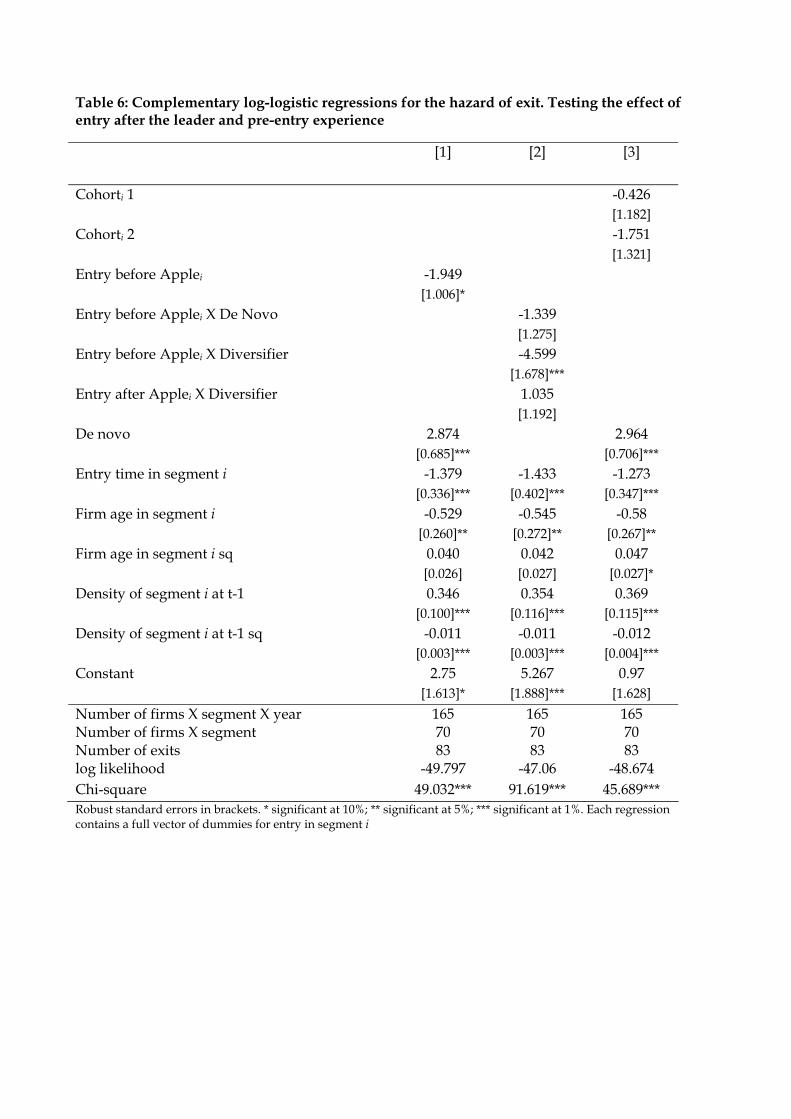
Table 6: Complementary log-logistic regressions for the hazard of exit. Testing the effect of entry after the leader and pre-entry experience
[1]
[2]
[3]
Cohorti 1 -0.426 [1.182]
Cohorti 2 -1.751 [1.321]
Entry before Applei -1.949 [1.006]*
Entry before Applei X De Novo -1.339 [1.275]
Entry before Applei X Diversifier -4.599 [1.678]***
Entry after Applei X Diversifier 1.035 [1.192]
De novo 2.874 2.964 [0.685]*** [0.706]***
Entry time in segment i -1.379 -1.433 -1.273 [0.336]*** [0.402]*** [0.347]***
Firm age in segment i -0.529 -0.545 -0.58 [0.260]** [0.272]** [0.267]**
Firm age in segment i sq 0.040 0.042 0.047 [0.026] [0.027] [0.027]*
Density of segment i at t-1 0.346 0.354 0.369 [0.100]*** [0.116]*** [0.115]***
Density of segment i at t-1 sq -0.011 -0.011 -0.012 [0.003]*** [0.003]*** [0.004]***
Constant 2.75 5.267 0.97 [1.613]* [1.888]*** [1.628]
Number of firms X segment X year 165 165 165 Number of firms X segment 70 70 70 Number of exits 83 83 83 log likelihood -49.797 -47.06 -48.674 Chi-square 49.032*** 91.619*** 45.689*** Robust standard errors in brackets. * significant at 10%; ** significant at 5%; *** significant at 1%. Each regression contains a full vector of dummies for entry in segment i
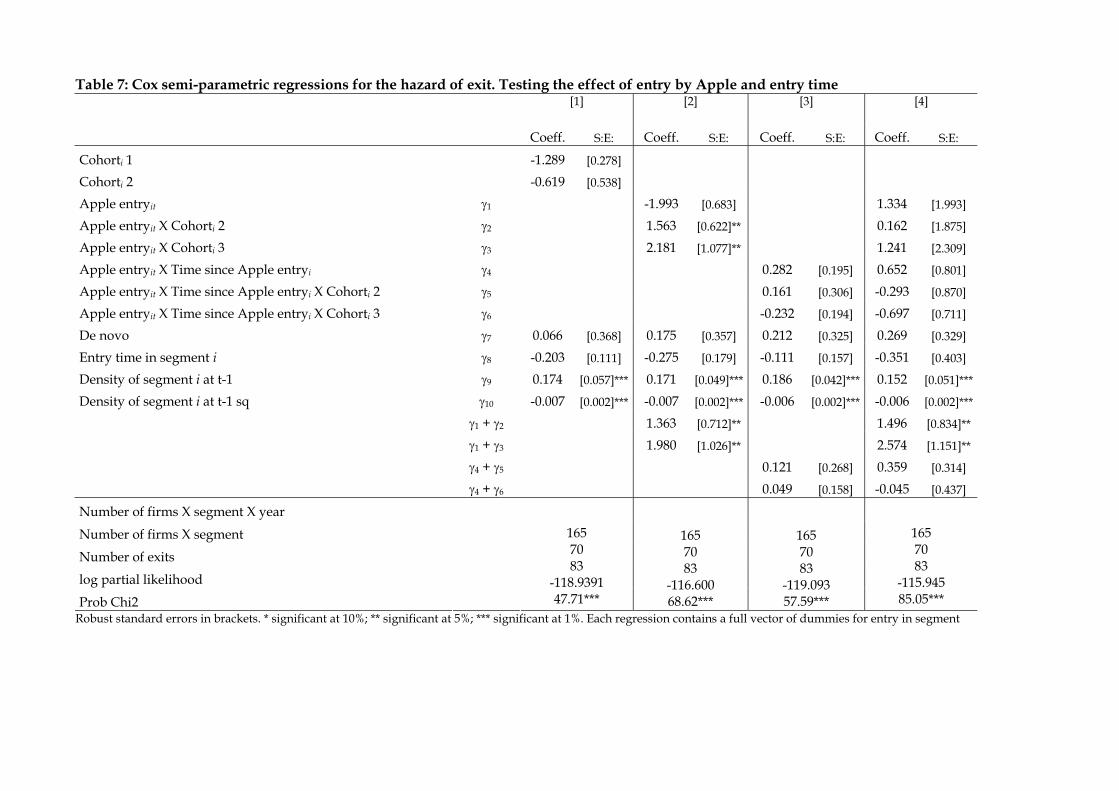
Table 7: Cox semi-parametric regressions for the hazard of exit. Testing the effect of entry by Apple and entry time
[1]
[2]
[3]
[4]
Coeff. S:E: Coeff. S:E: Coeff. S:E: Coeff. S:E:
Cohorti 1 -1.289 [0.278]
Cohorti 2 -0.619 [0.538]
Apple entryit 1 -1.993 [0.683] 1.334 [1.993]
Apple entryit X Cohorti 2 2 1.563 [0.622]** 0.162 [1.875]
Apple entryit X Cohorti 3 3 2.181 [1.077]** 1.241 [2.309]
Apple entryit X Time since Apple entryi 4 0.282 [0.195] 0.652 [0.801]
Apple entryit X Time since Apple entryi X Cohorti 2 5 0.161 [0.306] -0.293 [0.870]
Apple entryit X Time since Apple entryi X Cohorti 3 6 -0.232 [0.194] -0.697 [0.711]
De novo 7 0.066 [0.368] 0.175 [0.357] 0.212 [0.325] 0.269 [0.329]
Entry time in segment i 8 -0.203 [0.111] -0.275 [0.179] -0.111 [0.157] -0.351 [0.403]
Density of segment i at t-1 9 0.174 [0.057]*** 0.171 [0.049]*** 0.186 [0.042]*** 0.152 [0.051]***
Density of segment i at t-1 sq 10 -0.007 [0.002]*** -0.007 [0.002]*** -0.006 [0.002]*** -0.006 [0.002]***
1 + 2 1.363 [0.712]** 1.496 [0.834]**
1 + 3 1.980 [1.026]** 2.574 [1.151]**
4 + 5 0.121 [0.268] 0.359 [0.314]
4 + 6 0.049 [0.158] -0.045 [0.437]
Number of firms X segment X year
Number of firms X segment
Number of exits
log partial likelihood
Prob Chi2
165 70 83
-118.9391 47.71***
165 70 83
-116.600 68.62***
165 70 83
-119.093 57.59***
165 70 83
-115.945 85.05***
Robust standard errors in brackets. * significant at 10%; ** significant at 5%; *** significant at 1%. Each regression contains a full vector of dummies for entry in segment
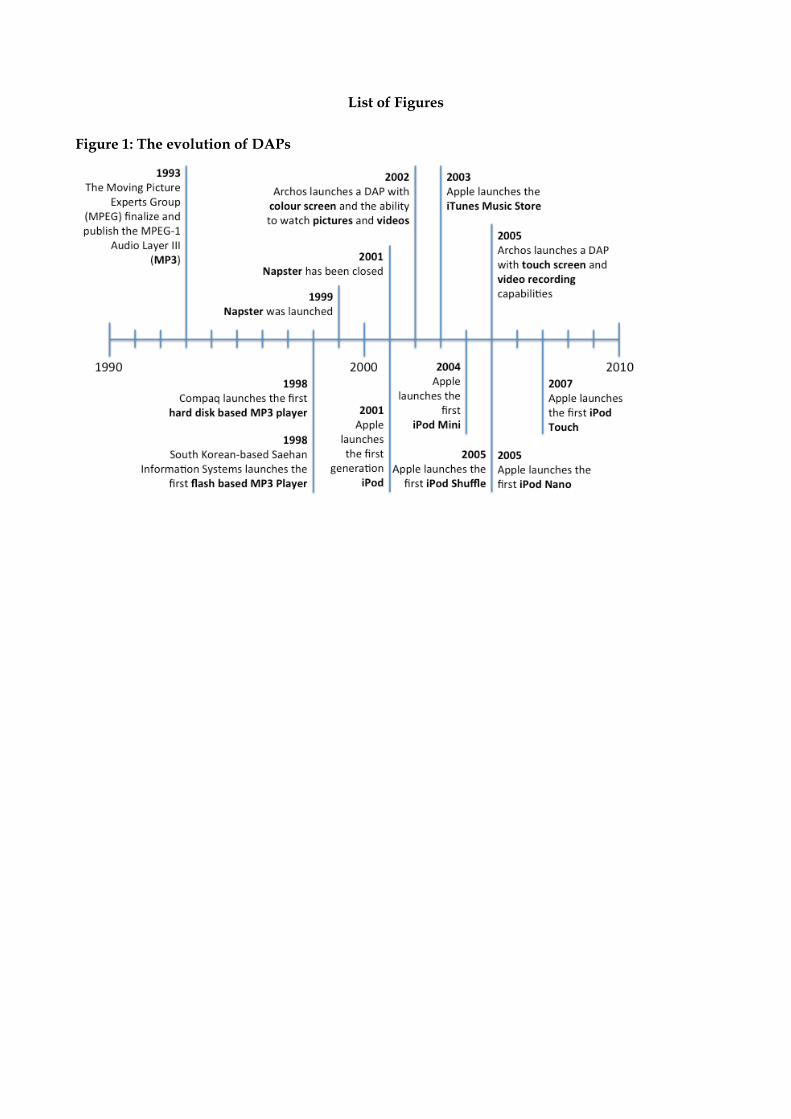
List of Figures
Figure 1: The evolution of DAPs
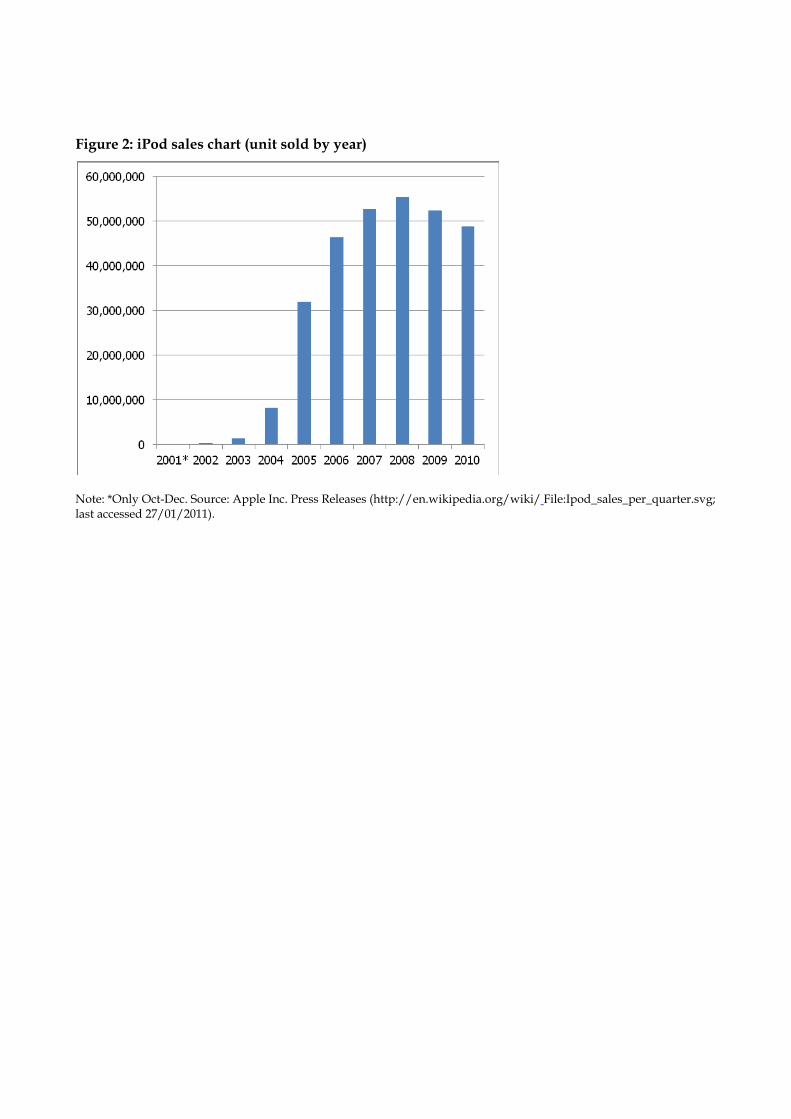
Figure 2: iPod sales chart (unit sold by year)
Note: *Only Oct-Dec. Source: Apple Inc. Press Releases (http://en.wikipedia.org/wiki/ File:Ipod_sales_per_quarter.svg; last accessed 27/01/2011).
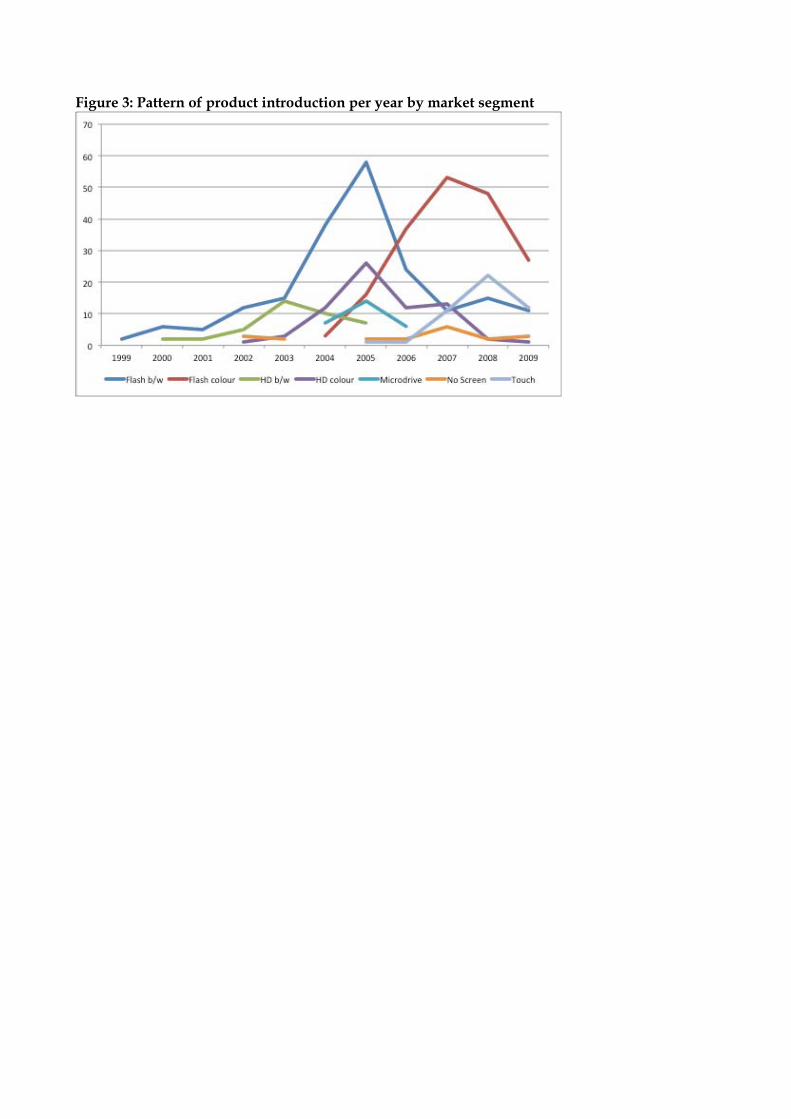
Figure 3: Pattern of product introduction per year by market segment