entertainment industry analysis · web viewporter’s six forces of competition are: (1) threat of...
TRANSCRIPT
Entertainment Industry Analysis
Prepared by Team 10:Nicole Abercrombie
Rachel AustinJessica EliaJessica ReedJenni Torres
GM 105 – Strategic Management
Dr. Lindle Hatton
California State University Sacramento
May 13, 2011

ENTERTAINMENT INDUSTRY ANALYSIS
TABLE OF CONTENTS
Introduction-------------------------------------------------------------------------------------------------------------- 4
Dominant Economic Indicator----------------------------------------------------------------------------------------61. Market Size:------------------------------------------------------------------------------------------------------6
2. Scope of Competitive Rivalry:--------------------------------------------------------------------------------53. Market Growth Rate:-------------------------------------------------------------------------------------------7
4. Numbers of Companies in the Industry:--------------------------------------------------------------------75. Customers:--------------------------------------------------------------------------------------------------------9
6. Degree of Vertical Integration:------------------------------------------------------------------------------107. Ease of entry/exit:----------------------------------------------------------------------------------------------10
8. Technology/Innovation:---------------------------------------------------------------------------------------109. Product Characteristics:--------------------------------------------------------------------------------------11
10. Scale Economies:----------------------------------------------------------------------------------------------1111. Experience Cure Effects-------------------------------------------------------------------------------------12 12. Capacity Utilization-------------------------------------------------------------------------------------------1113. Industry Profitability:----------------------------------------------------------------------------------------13
Six Forces of Competition--------------------------------------------------------------------------------------------131. Threat of New Entrants----------------------------------------------------------------------------------------13
2. Bargaining Power of Suppliers-------------------------------------------------------------------------------143. Bargaining Power of Buyers----------------------------------------------------------------------------------14
4. Threat of Substitute Products/Services---------------------------------------------------------------------155. Intensity of Rivalry among Competitors------------------------------------------------------------------15
6. Relative Power of Other Stakeholders----------------------------------------------------------------------16Competitive Position of Major Entertainment Companies------------------------------------------------------17
Competitor Analysis--------------------------------------------------------------------------------------------------- 19News Corp. --------------------------------------------------------------------------------------------------------- 19
Time Warner--------------------------------------------------------------------------------------------------------20Viacom Inc.----------------------------------------------------------------------------------------------------------21
CBS------------------------------------------------------------------------------------------------------------------- 21Key Success Factors---------------------------------------------------------------------------------------------------22
Industry Prospects and Overall Attractiveness--------------------------------------------------------------------25Factors Making the Industry Unattractive------------------------------------------------------------------------27
Profit Outlook------------------------------------------------------------------------------------------------------28Conclusion-------------------------------------------------------------------------------------------------------------- 30
References:--------------------------------------------------------------------------------------------------------------31
PAGE 2 OF 30
ENTERTAINMENT INDUSTRY ANALYSIS
INTRODUCTION
The following report is an analysis of the diversified entertainment industry. The
entertainment industry is a constantly evolving group of corporations with limited competitive
pressures. Revenue trends in certain core segments, including broadcast television, media
networks and radio, tend to vary with consumers' and advertisers' preferences towards new forms
of media (Value Line, 2010). As long as people have had discretionary time and money, the
entertainment industry has thrived, and as personal incomes grew, so did the industry. Although
the entertainment industry has proven to be quite resilient even in times of tough economic
conditions, the most recent economic downturn has had a noticeable negative impact. Even with
many large mergers and acquisitions throughout 2009 and 2010, including the Disney’s
acquisition of Pixar and Marvel, and the planned merger of Comcast and NBC Universal, current
stocks are dropping across the industry at an average decrease of 1.18 % (i.e., Disney’s stock
dropped 5.1%). According to Price Water House Coopers (PWC), this trend will not continue
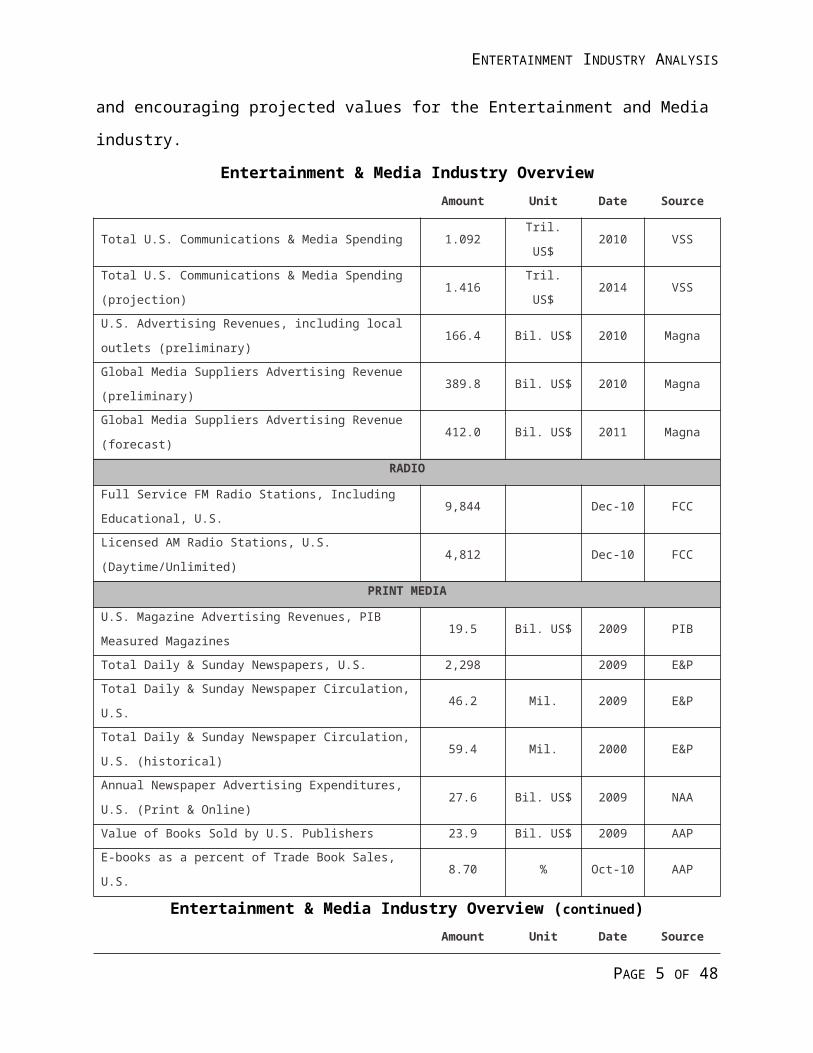
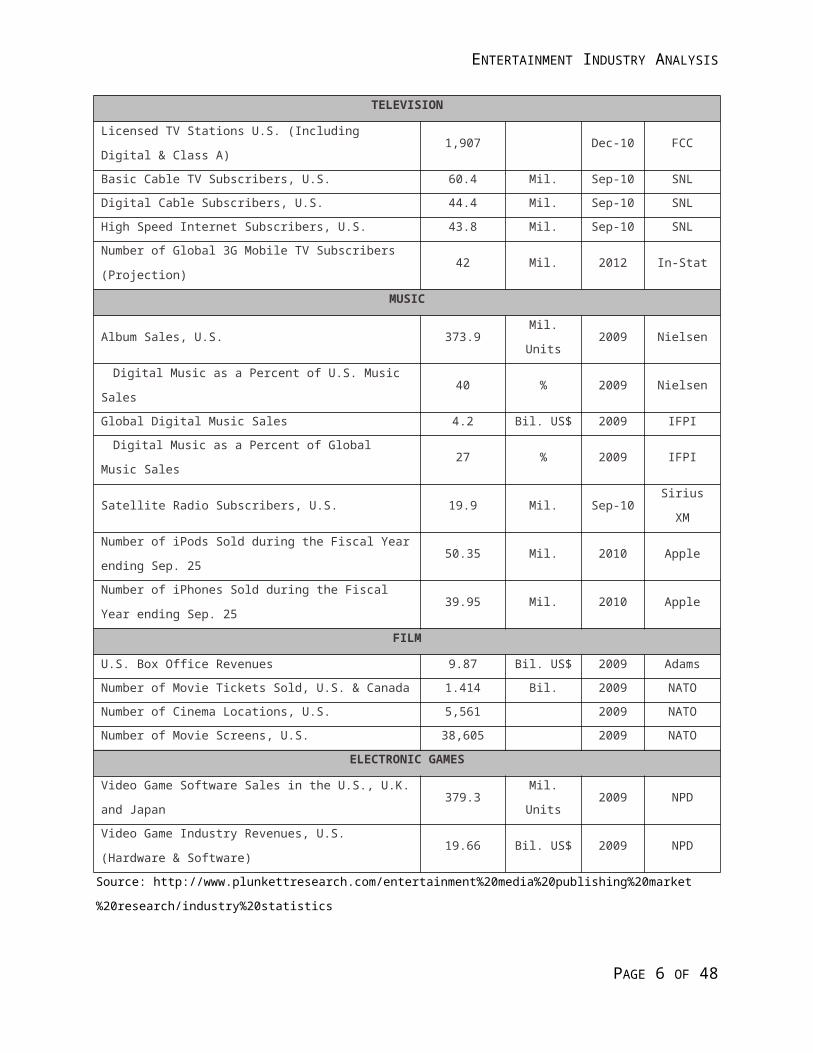
and growth in projected to be positive over the next five years (approximately 5%). Below is a
forward looking chart listing both current values and encouraging projected values for the
Entertainment and Media industry.
Entertainment & Media Industry Overview Amount Unit Date Source
Total U.S. Communications & Media Spending 1.092 Tril. US$ 2010 VSS
Total U.S. Communications & Media Spending (projection) 1.416 Tril. US$ 2014 VSS
U.S. Advertising Revenues, including local outlets (preliminary) 166.4 Bil. US$ 2010 Magna
Global Media Suppliers Advertising Revenue (preliminary) 389.8 Bil. US$ 2010 Magna
Global Media Suppliers Advertising Revenue (forecast) 412.0 Bil. US$ 2011 Magna
RADIO
Full Service FM Radio Stations, Including Educational, U.S. 9,844 Dec-10 FCC
Licensed AM Radio Stations, U.S. (Daytime/Unlimited) 4,812 Dec-10 FCC
PRINT MEDIA
U.S. Magazine Advertising Revenues, PIB Measured Magazines 19.5 Bil. US$ 2009 PIB
Total Daily & Sunday Newspapers, U.S. 2,298 2009 E&P
Total Daily & Sunday Newspaper Circulation, U.S. 46.2 Mil. 2009 E&P
Total Daily & Sunday Newspaper Circulation, U.S. (historical) 59.4 Mil. 2000 E&P
Annual Newspaper Advertising Expenditures, U.S. (Print &
Online)27.6 Bil. US$ 2009 NAA
PAGE 3 OF 30
ENTERTAINMENT INDUSTRY ANALYSIS
Value of Books Sold by U.S. Publishers 23.9 Bil. US$ 2009 AAP
E-books as a percent of Trade Book Sales, U.S. 8.70 % Oct-10 AAP
Entertainment & Media Industry Overview (continued) Amount Unit Date Source
TELEVISION
Licensed TV Stations U.S. (Including Digital & Class A) 1,907 Dec-10 FCC
Basic Cable TV Subscribers, U.S. 60.4 Mil. Sep-10 SNL
Digital Cable Subscribers, U.S. 44.4 Mil. Sep-10 SNL
High Speed Internet Subscribers, U.S. 43.8 Mil. Sep-10 SNL
Number of Global 3G Mobile TV Subscribers (Projection) 42 Mil. 2012 In-Stat
MUSIC
Album Sales, U.S. 373.9 Mil. Units 2009 Nielsen
Digital Music as a Percent of U.S. Music Sales 40 % 2009 Nielsen
Global Digital Music Sales 4.2 Bil. US$ 2009 IFPI
Digital Music as a Percent of Global Music Sales 27 % 2009 IFPI
Satellite Radio Subscribers, U.S. 19.9 Mil. Sep-10 Sirius XM
Number of iPods Sold during the Fiscal Year ending Sep. 25 50.35 Mil. 2010 Apple
Number of iPhones Sold during the Fiscal Year ending Sep. 25 39.95 Mil. 2010 Apple
FILM
U.S. Box Office Revenues 9.87 Bil. US$ 2009 Adams
Number of Movie Tickets Sold, U.S. & Canada 1.414 Bil. 2009 NATO
Number of Cinema Locations, U.S. 5,561 2009 NATO
Number of Movie Screens, U.S. 38,605 2009 NATO
ELECTRONIC GAMES
Video Game Software Sales in the U.S., U.K. and Japan 379.3 Mil. Units 2009 NPD
Video Game Industry Revenues, U.S. (Hardware & Software) 19.66 Bil. US$ 2009 NPD
Source: http://www.plunkettresearch.com/entertainment%20media%20publishing%20market%20research/industry%20statistics
The economic downturn continues to take an increasing toll on the entertainment industry
resulting in a declining Gross Domestic Product (GDP) that has thus reduced the amount of
discretionary consumer spending, and company advertising compounding the variables in this
dynamic industry. This major state of transformation is the light at the end of the tunnel and is
seen as the result of economic distressed consumers looking for low-cost entertainment and
companies looking for new, innovative ways to fulfill those consumer needs. The desire for
increased value has caused the consumer to turn to digital media and the industry to focus on the
PAGE 4 OF 30
ENTERTAINMENT INDUSTRY ANALYSIS
digital media value chain. As mentioned by PWC, “The Entertainment Industry that entered this
recession will not be the same industry to come out of it” (PWC, 2010).
This report includes discussion of the Dominant Economic Characteristics; Six Forces of
Competition; Competitive Position of Major Companies and Competitor Analysis; Key Success
Factors; Industry Prospects and Overall Attractiveness; and final conclusions and discussion of
the overall entertainment industry.
DOMINANT ECONOMIC CHARACTERISTICS
Market Size
The entertainment industry is broad and constantly evolving as technological advances
and market demands shift. The industry includes both producers and distributors of
entertainment formats and has been expanding into new areas outside of the traditional segments
of radio, print media, television, music, and film. Market demands are shown to be shifting away
from some traditional segments into new frontiers of media networks and online entertainment
capabilities including online streaming of television and films to online gaming platforms.
In 2010, the industry market capitalization was approximately $210 million, per Yahoo
Finance. The top eight leaders in market capitalization are: Walt Disney Company ($78.8 B),
News Corporation ($46 B), News Corp. B Voting ($43.3 B), Time Warner Inc. ($38.3 B), UTV
Software ($27.1 B), Entertainment ($23.9 B), Vivendi.MI ($23.7 B), Vivendi.PA ($23.4 B), with
the closest follower being Pinewood Shepperton ($9.3 B).
In 2010 the entertainment industry started to see market improvements including,
“significant growth in emerging markets and stronger results at movie box offices in the U.S.
(since 2009). Meanwhile, consumer spending in many categories...improv(ed) in late 2010. In
America, consumers are excited about many new entertainment technologies, including
Microsoft’s Kinect game player add-on, the entertainment aspects of tablet computers such as the
iPad, subscriptions to movie downloads, and ebooks in general, including the rapidly growing
use of platforms such as Amazon’s Kindle ebook reader. Internet-based entertainment (and
advertising) continues to soar on a global basis” (Plunkett Research).
Scope of Competitive Rivalry
PAGE 5 OF 30
ENTERTAINMENT INDUSTRY ANALYSIS
The industry leaders in the entertainment sector are broadly diversified into many
segments of the industry and face less overall threat to their market position from new entrants.
These leaders are considered media conglomerates, operating in a diverse range of markets
spanning movies, music, internet, and television. This can diffuse dependency and limit the short
term economic pressure in any particular area. However, emerging technologies are changing the
competitive environment and causing the competition to intensify. Apple Inc. and Microsoft are
now competitors in the mobile entertainment sector and online gaming markets. Leaders in the
industry such as Disney, are holding on to their market dominance by excelling as ‘analyzers’ in
their strategic characteristics by staying diversified in more stable sectors of the entertainment
industry and focusing on innovation into the emerging media sectors.
Competition between print media and online resources is increasing. Per Plunkett
Research, newspapers are finding it increasingly difficult to compete against internet news and
advertising rivals and book sales are facing a decline due to the emergence of ebooks in 2010.
Main factors of competitive rivalry:
Alternative delivery methods (in all sectors): Consumer demands are changing
rapidly towards the ease of access of mobile and online entertainment platforms.
New technology improvements: For example, the electronic book readers such as
Amazon’s Kindle and Apple Inc’s iPad as well as 3D technology.
Cost of entertainment venues: The cost of concerts and movie tickets are a key
concern to consumers in the current economic condition where many are facing
reductions in incomes and discretionary spending. Lower prices compete as a larger
factor than quality or star appeal in this climate.
Market Growth Rate
The U.S. entertainment market has posted fluctuating rates of growth over recent years.
The market fell into decline in 2009; however marginal recovery was seen in 2010, followed by
an estimated flat and marginal growth towards 2014. However, growth is expected to increase
more rapidly in the emerging sectors and decline in the traditional sectors of the industry such as
declines in print media and traditional television viewing.
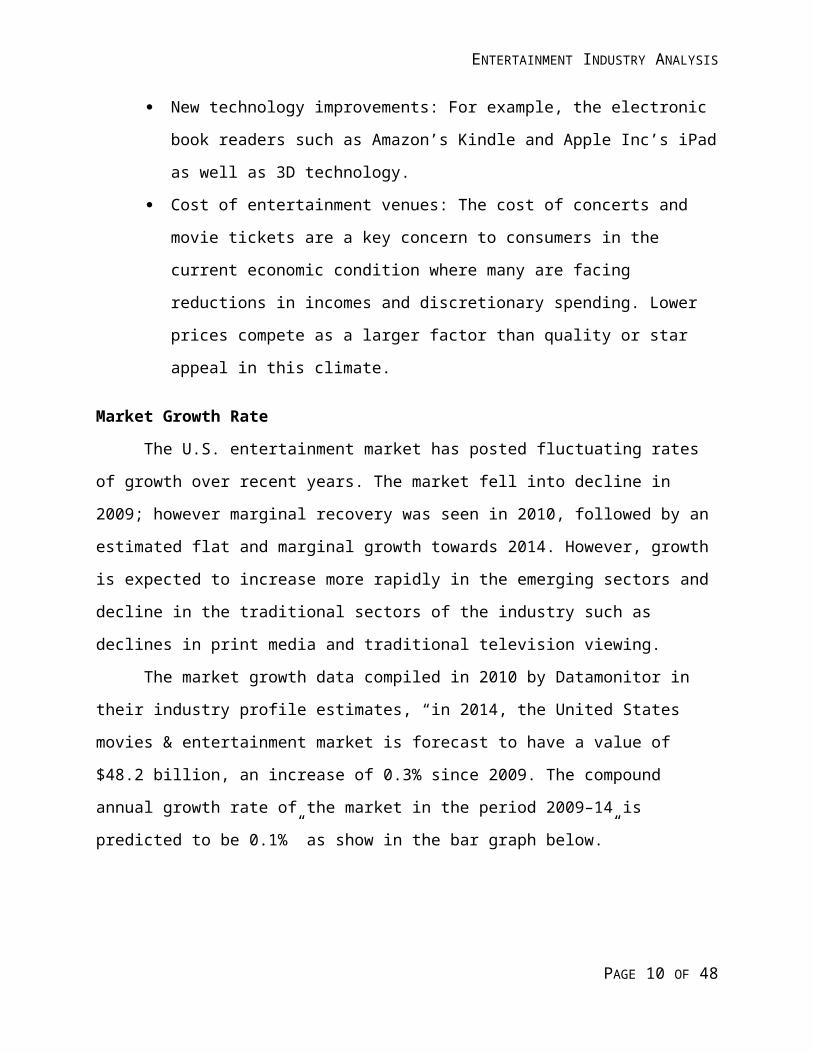
The market growth data compiled in 2010 by Datamonitor in their industry profile
estimates, “in 2014, the United States movies & entertainment market is forecast to have a value
PAGE 6 OF 30
ENTERTAINMENT INDUSTRY ANALYSIS
of $48.2 billion, an increase of 0.3% since 2009. The compound annual growth rate of the market
in the period 2009–14 is predicted to be 0.1%” as show in the bar graph below.”
The figure below (United States movies & entertainment market value forecast),
illustrates the projected growth in the movie and entertainment market over five years from 2009
through 2014 and shows steady, yet moderate growth.
Number of Companies in the Industry
There are over 200 companies in the entertainment industry and the top seven companies
control the majority of the market. The top seven companies ranked by revenues by Fortune 500
are:
1. Walt Disney
2. News Corp.
3. Time Warner
4. CBS
5. Viacom
6. CC Media Holdings
7. Live Nation Entertainment
PAGE 7 OF 30
ENTERTAINMENT INDUSTRY ANALYSIS
Walt Disney is the number one ranked company in the industry with revenue growth of
10% in 2010. Recent mergers with Pixar and Marvel further excelled Disney’s market position
and scope. Mergers and acquisitions such as this have led to the dominance of conglomerate
based companies this industry.
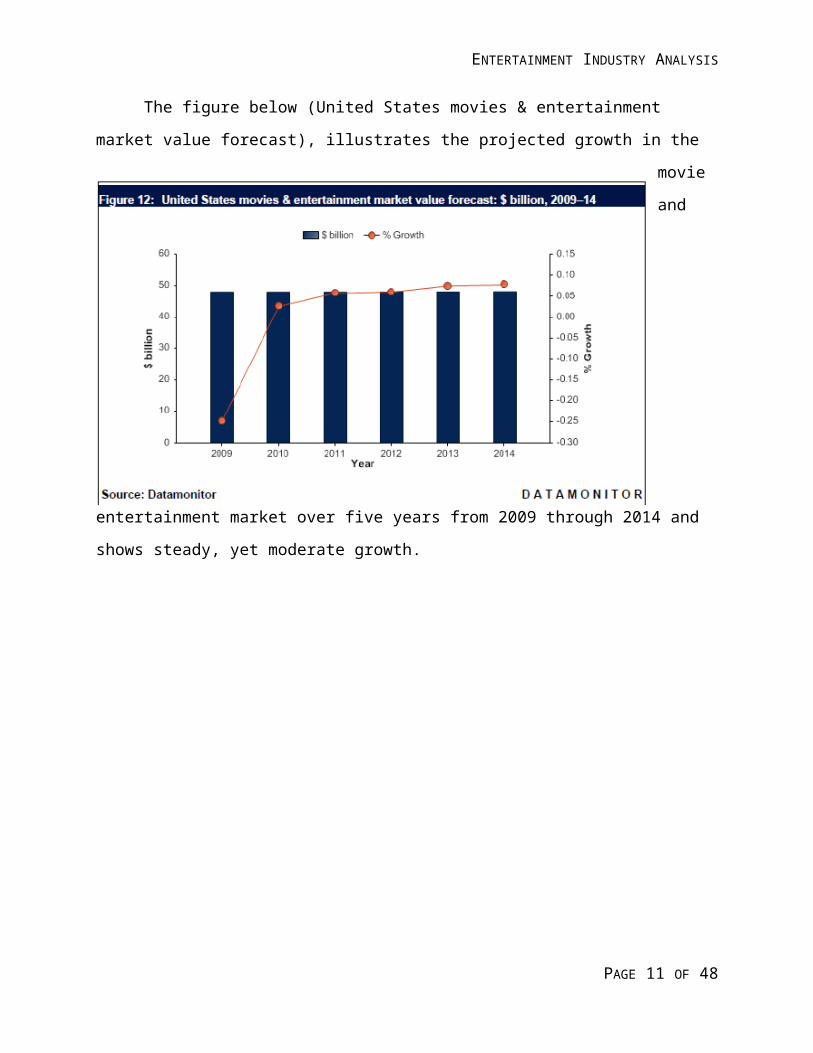
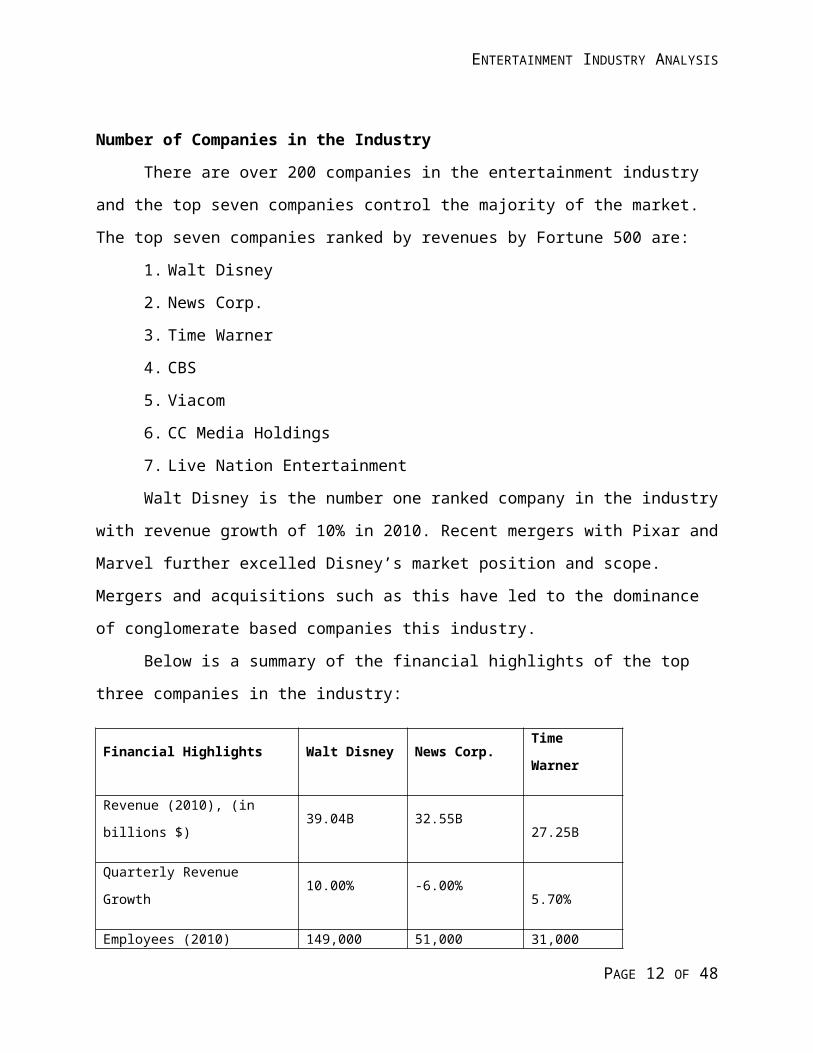
Below is a summary of the financial highlights of the top three companies in the industry:
Financial Highlights Walt Disney News Corp. Time Warner
Revenue (2010), (in billions $) 39.04B 32.55B 27.25B
Quarterly Revenue Growth 10.00% -6.00% 5.70%
Employees (2010) 149,000 51,000 31,000
Earnings Per Share ($) 2.27 1.12 2.22
Customers
Despite the downturn in the economy in the last few years, many consumers continued to
show interest in the evolving entertainment industry. There are millions of customers for each
section of the entertainment industry from movie, home video, television, media networks,
gaming, etc.
In digital media segment the number of broadband internet connections in the US has
reached roughly 100 million homes and business, in addition to another 75 million mobile
internet subscribers by the end of 2010 (Plunkett Research). More internet-enabled television
sets are being produced which is creating a shift in customers from the traditional cable network
viewing to the online streaming networks. This ease of access to programming previously limited
to traditional viewing and the lowered cost of this emerging access chain is creating challenges
to the business plans of many entertainment companies. The times have changed where
customers have more control over their programming and entertainment options and are no
longer ‘captive’ audiences who plan their schedules around their favorite shows.
In the last few years, the customers demand for control over their media - how and what
they watch, read and listen - has dramatically increased. The greatest growth in this demand is
noted in the younger demographic. Media and mobile access to movies, gaming, books and
PAGE 8 OF 30
ENTERTAINMENT INDUSTRY ANALYSIS
television programming is increasingly sought after. Growth in consumer control is projected to
continue increase in the industry into the future.
Customers in the global economy are also increasing rapidly due to the emergence of
middle classes in developing nations and the spread of internet access and cell phone use
worldwide. Companies such as Disney and Time Warner are reacting proactively to this change
in customer base and have incorporated strategic plans for expansion into the emerging global
marketplace.
Degree of Vertical Integration
A company is vertically integrated when it owns and controls every area of its enterprise:
manufacturing, wholesaling and retailing. In the film and television industries, vertical
integration requires ownership of production, distribution and exhibition facilities. This strategy
emerged very early in the American film industry, and the Hollywood studio system became a
model for integrated media ownership. This strategy has declined since the 1990’s in the
broadcasting/programming sectors due emerging delivery channels.
The leader in the entertainment industry, Disney, has increased their vertical integration
throughout the years with their acquisitions of emerging production companies in multiple
entertainment sectors. It has been argued that the entertainment industry is controlled by a few
key corporations that serve as functional monopolies with high degrees of vertical integration.
Ease of entry/exit
The ease of entry/exit is low in the entertainment industry as a whole, but with the
emerging technology segments the likelihood of new entrants is moderate. Currently, successful
new entrants in the video distribution sector are also large corporations such as Google Inc. and
Apple Inc.
As mentioned previously, the top market leaders are conglomerate corporations
encompassing a broad range of entertainment sectors including media networks, and filmmaking
which create a strong barrier to entry in those sectors. However, consumer interest in
independent films, for example, continues where fixed costs of film production are lower and the
threat of entry from large corporations in that sector is reduced only by the nature of the
independent film environment.
PAGE 9 OF 30
ENTERTAINMENT INDUSTRY ANALYSIS
Technology/Innovation
Technology and innovation are key players in the industry and are the driving force of
competition. Market leaders are diversifying from traditional entertainment sectors into the
emerging technological advanced areas such as 3D films, online media platforms, and mobile
access to programming. The driving force of more customer control is shaping the innovations in
the entertainment industry.
Top new technologies and innovations for the entertainment industry:
3D filmmaking and programming.
Online video and programming distribution.
Digital and ebook innovations and distributions.
Multipurpose cell phones with video and TV programming capabilities.
Product Characteristics
The entertainment industry is composed of multiple segments, with varying services and
products. In the past, the entertainment industry was centralized in movies, filmmaking and print
media sectors. Today’s innovations and technological advances have broadly opened the doors to
new entertainment mediums and distributions.
Along with technology, consumers are another driving force in the development of
entertainment products and services characteristics. The recent economic downturn has reduced
discretionary incomes and affected consumer spending on entertainment products and services.
For example, the past few years has resulted in a dramatic change in the production of DVD’s,
CD’s and their distribution channels. Consumers are increasingly utilizing “on-demand” viewing
of movies and online streaming of songs through avenues such as iTunes which also boast lower
costs to the consumer. Through these newer distribution channels, consumers have altered the
characteristics of the traditional movie experience to include “on-the-go” viewing and one time
viewing purchases through online and cable networks.
Due to the unique position of the entertainment industry including what some segments
of the market consider “luxury” items, the need for strategic flexibility in entertainment
companies in all the products and services they offer is paramount.
Scale Economies
PAGE 10 OF 30
ENTERTAINMENT INDUSTRY ANALYSIS
Economies of scale refer to the increase in efficiency of production as the number of
goods being produced increases. (Investopedia) Economies of scale are necessary to produce the
big-budget epic films that are the building blocks of a profitable movie franchise. Disney’s
purchase of Marvel in 2009 expanded their economy of scale in the movie and animation sector
of the entertainment industry. The result of years of achieving these types of mergers and
acquisitions by industry leaders such as Disney and Time Warner, further support the ‘bigger is
better’ economy of scale scenario in the broader more diversified entertainment industry.
Smaller companies within this industry, such as Netflix, have effectively handled the size
verses efficiency scope by altering the services they offer to online distributions with less
overhead costs.
Experience Curve Effects
Industry market leaders such as Disney and News Corp. have been in the business of
diversified entertainment products and services for over 80 years. Their experience with
consumer desires, needs and loyalties to their brand names has helped the corporations survive
through the fluctuations in the economy over the years. There are far more entertainment
companies now then in the 1920’s when both Disney and News Corp were founded, but these
companies continue to benefit from the upward curve of experience and reputation within the
industry.
In a different sector of entertainment, a newcomer to the industry, Netflix, has shown
rapid growth in learning and market domination in the video distribution sector. Since Netflix is
the longest running company to offer videos by mail, they are the leader in the video distribution
segment. They are not listed as one of the top profitable companies within the industry to their
centralized and focused position in the industry; they have played a major role in the change in
market demands for at home movie viewing. Critical to their success is the company’s
anticipation of the changing desires of consumers away from Blockbuster-type rental stores to
the ease of mail-order and now online streaming of videos at even lower costs to consumers.
Capacity Utilization
Capacity utilization and constraints are linked. Many areas of the entertainment industry
including filmmaking, media networks and theme parks require large amounts of capital to
maintain and improve.
PAGE 11 OF 30
ENTERTAINMENT INDUSTRY ANALYSIS
In the entertainment industry the diversity of services and products as well as the avenues
of delivery increase the dependency on the profit mix. With the rapid advancements in
technology, the capacity for new avenues of entertainment have not been reached and the limits
are yet unknown.
Industry Profitability
The entertainment industry is in a rapidly evolving market with external pressures of
technology, consumer demand and innovation. A few hundred companies existing in the industry
contribute to the industry total revenue of roughly $295 million. The profitability of the
individual companies rests on their diversification, innovation, and ability to produce affordable
products and services to consumers. The profitability of the companies also relies on their
individual capacity for marketing, and competitive intelligence.
The global market with increasing middle class incomes is also increasing demand
internationally for many entertainment sectors. This coupled with brand loyalty and innovation
leaves the industry in a positive position looking forward. Based in Yahoo Finance’s evaluation
quarterly revenue growth is expected to be 9.40% for the industry.
SIX FORCES OF COMPETITION
Based on the assumption that a corporation is most concerned with the intensity of
competition within its industry, Michael Porter’s approach to industry analysis can be used to
determine profit potential measured in terms of long-run return on invested capital (Wheelen,
158). Porter’s six forces of competition are: (1) Threat of New Entrants, (2) Bargaining Power of
Suppliers, (3) Bargaining Power of Buyers, (4) Threat of Substitute Products or Services, (5)
Intensity of Rivalry Among Competitors, and (6) Relative Power of Other Stakeholders.
Threat of New Entrants
The threat of new entrants into any industry depends on the strength of the barriers to
entry, and the resulting response of existing competitors. The threat of new entrants to the
entertainment industry is relatively low. This industry is seen to have established companies and
conglomerates with significant presence in media networks and filmmaking, thus creating a
significant barrier to entry.
PAGE 12 OF 30
ENTERTAINMENT INDUSTRY ANALYSIS
The threat of new entrants is so low, in fact, that industry insiders are concerned that new,
independent producers are prevented from having their voices heard and getting their new,
innovative products into the market. The evolution of internet distribution channels is making
this less of a concern with its accessibility and immense distribution opportunities.
The high, ongoing financial outlay needed for movie production, or television series
production is also extremely high. For example, production costs for Disney’s Pirates of the
Caribbean movie hit nearly $300 million. High sunk costs and capital requirements are also
heavy entry barriers.
Bargaining Power of Suppliers
The bargaining power of suppliers varies by supplier type in the entertainment industry.
The value chain of many of the companies is primarily handled in-house, but more companies
are outsourcing to cut costs in order to keep, or attain, a competitive advantage. This strategy
especially lowers the bargaining power of American suppliers since suppliers overseas will
provide the same services for a fraction of the cost, with varying degrees of quality. The industry
has also seen an increase in the number of suppliers as a result of increased outsourcing, which
also results in lower bargaining power of supplies as competition at their level increases.
Popular actors as “suppliers” of their specific talent or star power, help pull moviegoers
into the theatres, theme parks, and increase product sales through endorsements. In fact, in the
first quarter of 2011 many leading companies in the entertainment industry reported poor results
which were partially due to the weak economy and reduced spending, however the major cause
of poor revenue was attributed to industry specific problems such as weak superstar appeal.
As a result of this new decrease in draw, individual companies have attempted to secure high-
profile stars through multi-year or multi-movie contracts, and as a result reduce their future
bargaining power.
Bargaining Power of Buyers
PAGE 13 OF 30
ENTERTAINMENT INDUSTRY ANALYSIS
In the entertainment industry, the bargaining power of buyers (consumers) is high. This
bargaining power is due in part to the economy in that if low cost alternatives are available, more
families are likely to choose them. The availability of substitutes makes the bargaining power of
consumers, as the ultimate purchaser of entertainment goods and services, increase. Consumers
have a very wide selection of programming to choose from and ease of access through increased
online programming and sources of entertainment. Increased globalization also adds to the
bargaining power of the consumer.
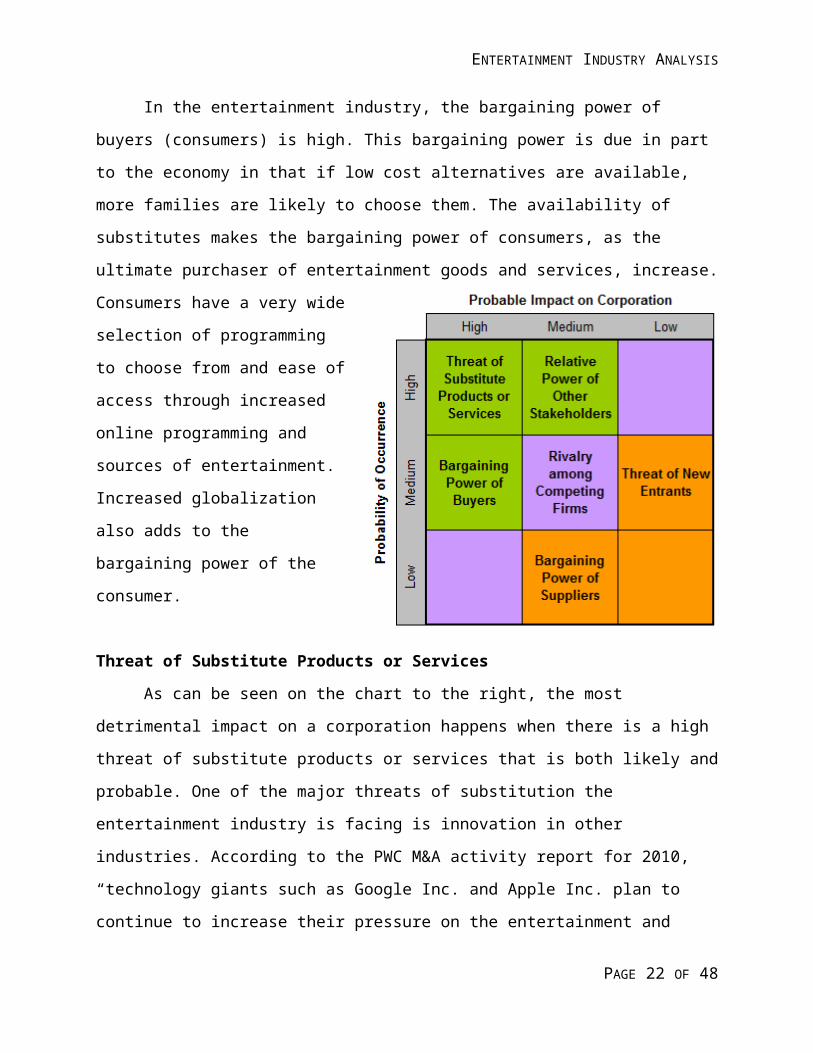
Threat of Substitute Products or
Services
As can be seen on the chart to
the right, the most detrimental impact
on a corporation happens when there is
a high threat of substitute products or
services that is both likely and probable.
One of the major threats of substitution
the entertainment industry is facing is
innovation in other industries.
According to the PWC M&A activity
report for 2010, “technology giants such
as Google Inc. and Apple Inc. plan to continue to increase their pressure on the entertainment
and media industry by driving convergence”(PWC, 2010). Both Apple and Google have become
pioneers and market leaders in video distribution.
The music industry is also making moves toward online media expansion and increasing
services offered to customers. Essentially what these companies are doing is creating one-stop-
shops for the consumer who no longer has to visit multiple sites for their entertainment and
media needs. Netflix and Redbox (music and video store industry corporations) have also
become alternatives to the expensive ticket prices for box office hits resulting in some revenue
loss for the entertainment industry. The entertainment industry has countered this threat with the
availability of 3D capable screens that moviegoers are willing to pay premium prices to enjoy.
PAGE 14 OF 30
ENTERTAINMENT INDUSTRY ANALYSIS
Intensity of Rivalry Among Competitors
All sectors of the entertainment
industry face daunting challenges from
alternative delivery methods, which has
increased the competition among
entertainment delivery platforms.
Telecommunications companies such as
AT&T and Verizon are now delivering
television programming to the home via
ultra high-speed Internet connections
battling cable and satellite TV firms for
market share (Plunkett Research, 2010).
Tough economic times often results in a
dog-eat-dog business environment but the opposite can also seen in the entertainment industry.
A strategy being implemented across the industry is one of collaboration in order to gain a larger
market share and competitive advantage against other industry leaders and collaborators. The
goal of industry leaders is to be the leading pioneer in digital entertainment and create entry
barriers for new entrants once growth becomes more obvious.
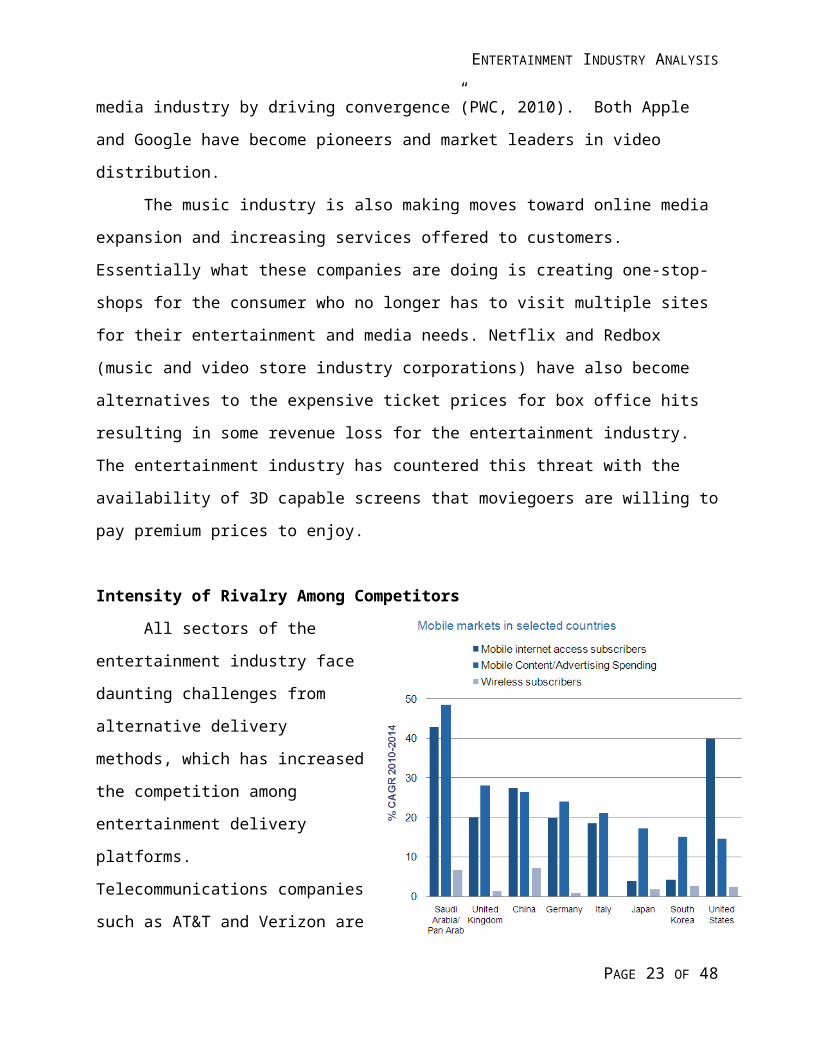
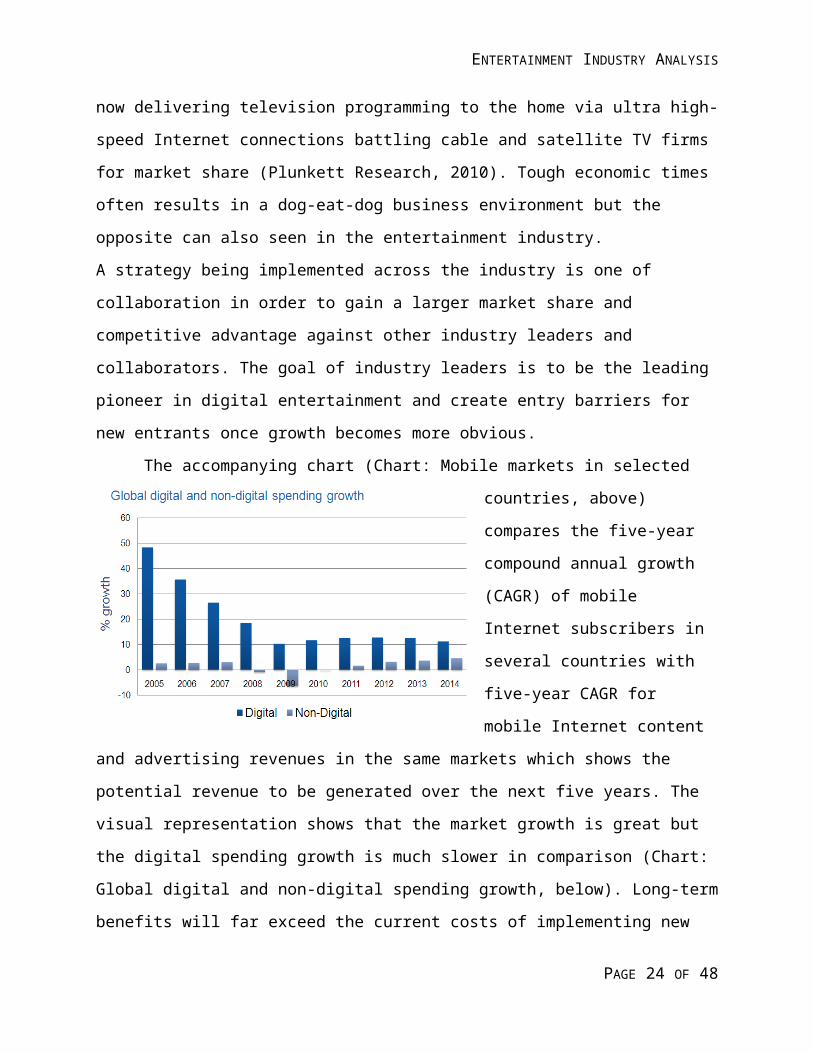
The accompanying chart (Chart: Mobile markets in selected countries, above) compares
the five-year compound annual
growth (CAGR) of mobile Internet
subscribers in several countries with
five-year CAGR for mobile Internet
content and advertising revenues in
the same markets which shows the
potential revenue to be generated
over the next five years. The visual
representation shows that the market
growth is great but the digital spending growth is much slower in comparison (Chart: Global
digital and non-digital spending growth, below). Long-term benefits will far exceed the current
costs of implementing new strategies that develop the mobile/digital value chain which will
PAGE 15 OF 30
ENTERTAINMENT INDUSTRY ANALYSIS
ultimately result in large profits. Collaboration will reduce the cost of innovations and increase
market share of collaborating companies while encouraging other collaborations resulting in
fewer high quality products and services. The new digital value chain has become a focus of
many companies and the “anytime anywhere” mobile experience of consumers is the driver. In
2010 and already in 2011, many companies are introducing new mobile devices that make the
digital environment a new and exciting media experience with future growth potential.
Relative Power of Other Stakeholders
Other stakeholder groups from the industry’s task environment include unions,
governments, special interest groups, local communities, shareholders, and creditors. As the
largest and most inclusive force in the task environment, the power other stakeholders have over
the industry is a high priority. Unions can have a detrimental effect if members do not feel that
they are being treated fairly or they are not receiving the compensation they feel they deserve.
Governments set and regulate laws that must be followed and abided by or companies will face
legal repercussions. The Federal Commerce Commission (FCC) and the Department of Justice
(DOJ) monitor content, as well as anti-trust and concentration violations. The FCC has the power
to fine or eliminate programs that violate content restrictions. This was determined to be the case
with the Howard Stern Show resulting in fines in the amount of $2.5 million. Special interest
groups such as environmentalists motivate the industry to remain socially responsible and make
environmental sustainability a primary concern on the corporate agenda. Shareholders invest
their money in the future profitability of individual companies, if performance is in doubt,
interest in the company can be sold resulting in lower stock price. Creditors are also interested in
the future profitability of the industry which will determine the likelihood of the company being
approved for funds to support investments.
COMPETITIVE POSITION OF MAJOR ENTERTAINMENT COMPANIES
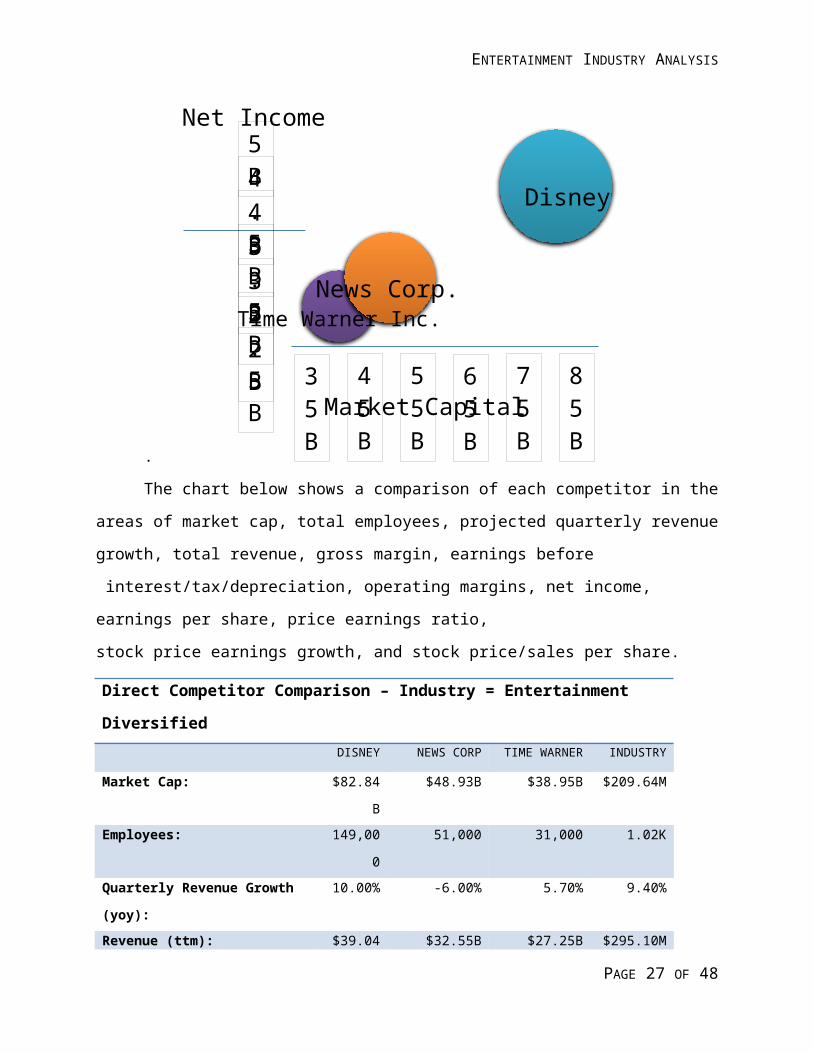
The chart below represents the overall the financial position of the three leading
companies in the entertainment industry: Disney, News Corp., and Time Warner, Inc.. The
vertical axis represents the total amount of Net Income earned by each entertainment company,
the horizontal axis represents the market capital each company has worldwide, and the circles
PAGE 16 OF 30
ENTERTAINMENT INDUSTRY ANALYSIS
represent the total assets possessed by each entertainment company (figures shown in billions of
dollars)
.
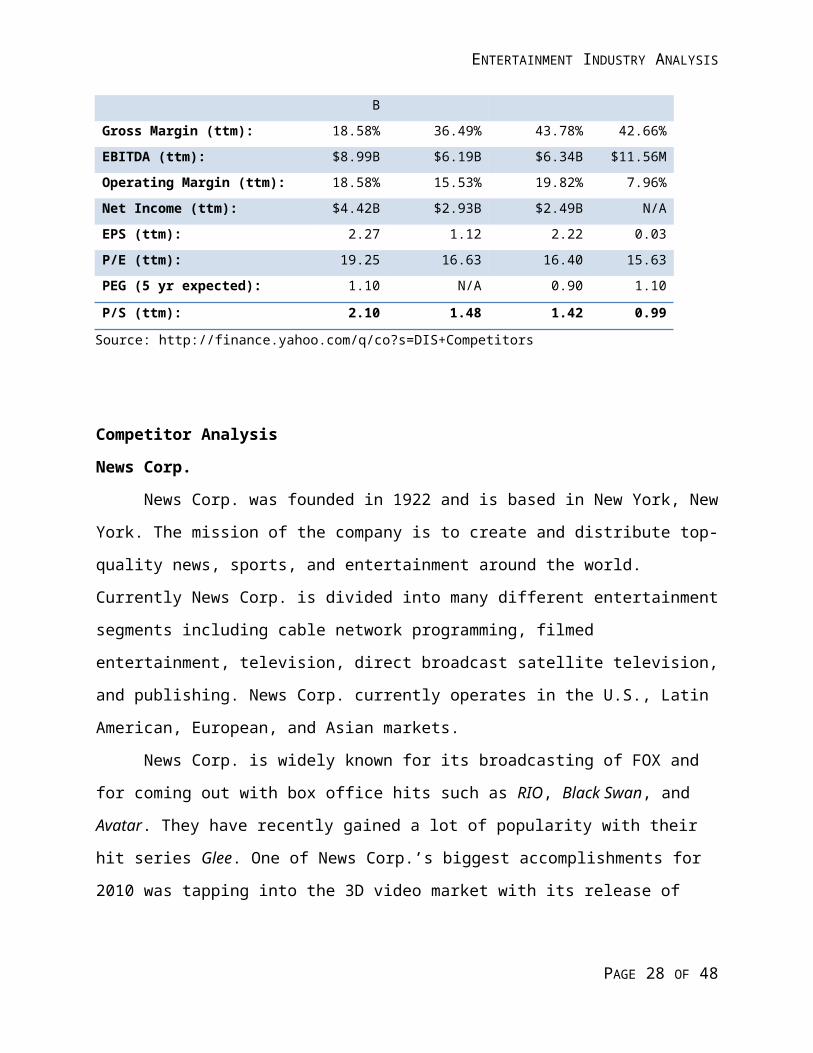
The chart below shows a comparison of each competitor in the areas of market cap, total
employees, projected quarterly revenue growth, total revenue, gross margin, earnings before
interest/tax/depreciation, operating margins, net income, earnings per share, price earnings ratio,
stock price earnings growth, and stock price/sales per share.
Direct Competitor Comparison – Industry = Entertainment DiversifiedDISNEY NEWS CORP TIME WARNER INDUSTRY
Market Cap: $82.84B $48.93B $38.95B $209.64M
Employees: 149,000 51,000 31,000 1.02K
Quarterly Revenue Growth (yoy): 10.00% -6.00% 5.70% 9.40%
Revenue (ttm): $39.04B $32.55B $27.25B $295.10M
Gross Margin (ttm): 18.58% 36.49% 43.78% 42.66%
EBITDA (ttm): $8.99B $6.19B $6.34B $11.56M
Operating Margin (ttm): 18.58% 15.53% 19.82% 7.96%
Net Income (ttm): $4.42B $2.93B $2.49B N/A
EPS (ttm): 2.27 1.12 2.22 0.03
P/E (ttm): 19.25 16.63 16.40 15.63
PEG (5 yr expected): 1.10 N/A 0.90 1.10
PAGE 17 OF 30
Net Income
2B
2.5B
3B
3.5B
4B
4.5B
5B
Market Capital35B
45B
55B
65B
75B
85B
Disney
News Corp.Time Warner Inc.
ENTERTAINMENT INDUSTRY ANALYSIS
P/S (ttm): 2.10 1.48 1.42 0.99
Source: http://finance.yahoo.com/q/co?s=DIS+Competitors
Competitor Analysis
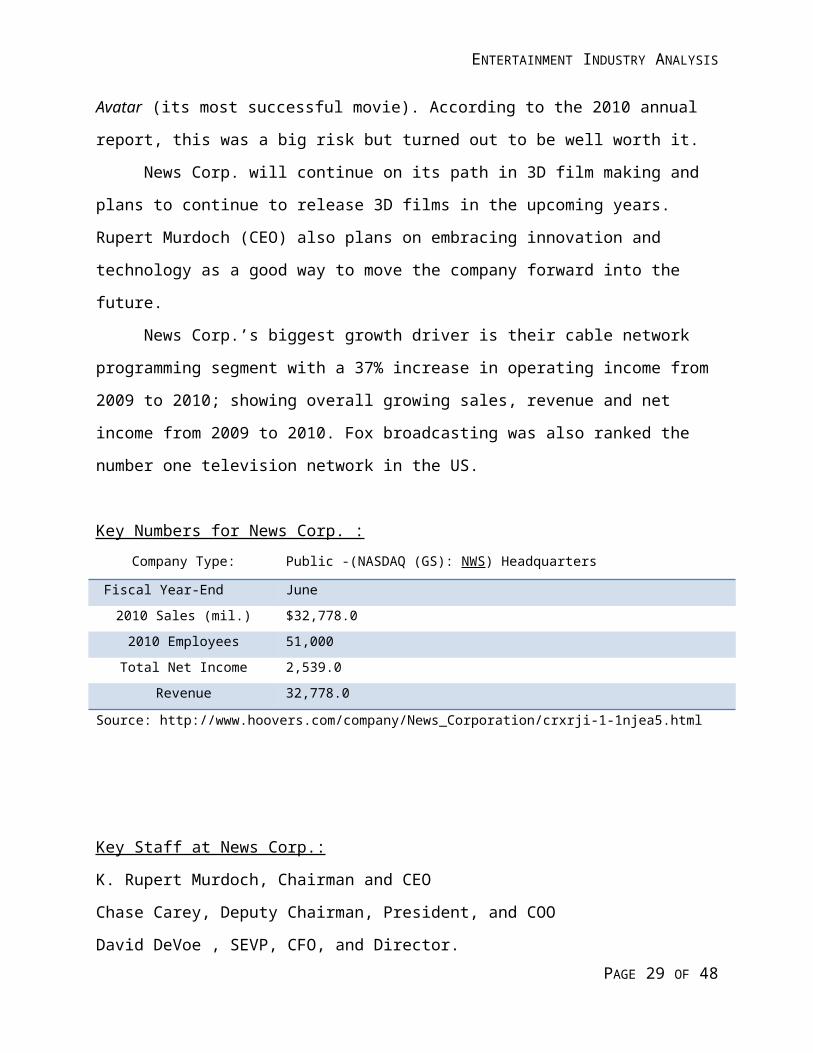
News Corp.
News Corp. was founded in 1922 and is based in New York, New York. The mission of
the company is to create and distribute top-quality news, sports, and entertainment around the
world. Currently News Corp. is divided into many different entertainment segments including
cable network programming, filmed entertainment, television, direct broadcast satellite
television, and publishing. News Corp. currently operates in the U.S., Latin American, European,
and Asian markets.
News Corp. is widely known for its broadcasting of FOX and for coming out with box
office hits such as RIO, Black Swan, and Avatar. They have recently gained a lot of popularity
with their hit series Glee. One of News Corp.’s biggest accomplishments for 2010 was tapping
into the 3D video market with its release of Avatar (its most successful movie). According to the
2010 annual report, this was a big risk but turned out to be well worth it.
News Corp. will continue on its path in 3D film making and plans to continue to release
3D films in the upcoming years. Rupert Murdoch (CEO) also plans on embracing innovation and
technology as a good way to move the company forward into the future.
News Corp.’s biggest growth driver is their cable network programming segment with a
37% increase in operating income from 2009 to 2010; showing overall growing sales, revenue
and net income from 2009 to 2010. Fox broadcasting was also ranked the number one television
network in the US.
Key Numbers for News Corp. :Company Type: Public -(NASDAQ (GS): NWS) Headquarters
Fiscal Year-End June
2010 Sales (mil.) $32,778.0
2010 Employees 51,000
Total Net Income 2,539.0
PAGE 18 OF 30
ENTERTAINMENT INDUSTRY ANALYSIS
Revenue 32,778.0
Source: http://www.hoovers.com/company/News_Corporation/crxrji-1-1njea5.html
Key Staff at News Corp.:
K. Rupert Murdoch, Chairman and CEO
Chase Carey, Deputy Chairman, President, and COO
David DeVoe , SEVP, CFO, and Director.
Time Warner
Time Warner was founded in 1985 and is headquartered in New York, New York. They
are the third largest media conglomerate behind Disney and News Corp. They operate in three
main segments; television, film, and publishing. Time Warner is best known for its cable
network programs CNN, TBS, and TNT. They also feature pay TV channels like HBO and
Cinemax. In the film sector Time Warner produces films through Warner Bros. Pictures and
Newline Cinema. In the past year some of Time Warner's most successful films include Harry
Potter The Deathly Hollows and Inception (winner of 4 academy awards).
Time Warner is a global leader in media and its mission is to create, package, and deliver
high quality content worldwide through multiple distribution outlets. According to the 2010
annual report, Time Warner is currently following a multi-year plan to become the premier
global content company and to improve returns. 2010 saw benefit of this plan when they posted a
17% growth in operating income (the highest growth in years) ; showing slight increases in sales,
revenue and net income from 2009 to 2010. This multi-year plan includes sticking to four key
strategic objectives
A major focus for Time Warner is the increased ease of access to their content for
consumers. They have recently launched TVE (TV Everywhere) so that consumers can have
access to content via mobile devices at no additional cost. Time Warner also puts the expansion
into international markets at the top of their priorities list. They plan to accomplish this by
continuing to expand globally through the acquisition of international television networks.
PAGE 19 OF 30
ENTERTAINMENT INDUSTRY ANALYSIS
Key Numbers for Time Warner Inc.Company Type Public -(NYSE: TWX) Headquarters
Fiscal Year-End December
2010 Sales (mil.) $26,888.0
2010 Employees 31,000
Total Net Income 2,578.0
Total Revenue 26,888.0
Source: http://www.hoovers.com/company/Time_Warner_Inc/rfthrxi-1-1njea5.html
Key Staff at Time Warner Inc.
Jeffrey Bewkes, Chairman and CEO
Joerg Ziegler, Managing Director, Executive Search, Entertainment & Networks, Time Warner
Inc.
John Martin, EVP and CFO.
Other Entertainment Companies
Viacom Inc.
Viacom Inc is also an entertainment company that is less well known as a household
name, but easily is recognizable when there is the mention of MTV, VH1, Nickleodeon, CMT,
and Comedy Central. Viacom Inc. is headquartered in New York, New York and operates in two
segments: media networks and filmed entertainment. They produce filmed entertainment under
Paramount Pictures. As far as numbers go, Viacom Inc. seems to lag behind the competitors
(Disney, News Corp., and Time Warner). In 2010 they had revenues of $13.6 billion and net
income of $1.6 billion.
CBS
PAGE 20 OF 30
ENTERTAINMENT INDUSTRY ANALYSIS
CBS is another entertainment company who is also headquartered in New York, New
York. CBS is different from other entertainment companies in that they do not operate in the
filmed entertainment sector. CBS focuses on television, radio, online content, and publishing
sectors of the entertainment industry. CBS shows positive revenues despite the fact that they do
not make any profit off the filmed entertainment sector like the leaders of the industry report.
Due to this factor, CBS is not in direct competition with Disney, News. Corp, Time Warner, and
Viacom Inc., even though they are considered to operate in the same industry.
KEY SUCCESS FACTORS In order for a company to accomplish its mission and flourish, it is essential that it excels
in certain areas specific to its industry so as to stand out among its competitors. In the
entertainment industry competition is fierce; conglomerates dominate the trade and they prosper
in almost every business segment they enter into. From filmmaking to operating amusement
parks and from television networks to publishing, entertainment companies have an opportunity
to serve multitudes of markets. In order to outshine its competitors, a company in the
entertainment industry must strive to succeed at any or all of the following key success factors.
Vision
For a company to succeed in any industry, it must have a clear vision of where it sees
itself or where it would like to be in the future. Vision provides direction for a company’s
mission and acts as a foundation for building a strategy for how to achieve that mission. It is also
therefore important that a company employ a management team and a board of directors that can
effectively dictate the vision to the rest of the company and direct the firm toward achieving its
goals. If a company is too concerned with where it currently stands and neglects to look forward,
its vision is so near-sighted and narrowly focused that it will fail to recognize when it is headed
in a direction that is not aligned with its mission.
Demographic Appeal
Demographics include age, gender, race, religion, education level, income, location, and
others. If a company appeals to a demographic, it means that the company offers something that
customers are attracted to. The pretense of satisfaction is immediate because customers are
PAGE 21 OF 30
ENTERTAINMENT INDUSTRY ANALYSIS
already attracted to the idea and even the idea is enticing; genuine satisfaction is almost
imminent. The wider the demographic appeal, the wider the probable satisfied customer base.
Customer satisfaction is a necessity in the entertainment industry because satisfied customers
keep coming back for more. Furthermore, considering the fact that conglomerates dominate the
entertainment industry, if a company succeeds in entertaining customers, the odds are in their
favor that those customers will also be attracted to their other products in other business
segments.
Breadth of Product Line/ Product Selection
The more diversified a company in the entertainment industry is, the more opportunity
the company has to reach and attract more customers. If a customer is satisfied with a product/
service in one business segment, the company has an opportunity to provide for that customer’s
needs in its other business segments by drawing on its previous success. Therefore, companies
have further incentive to provide great products/ services because the success of one is reflected
upon others under the same company name.
A broad product line also allows the corporation to be more diverse and creative.
Employees are not constrained by the boundaries of the business segment they work in; their
innovative ideas can be transposed across the company. For example, the Disney film Song of
the South was the inspiration for the Disneyland ride, Splash Mountain.
Well Recognized and Cherished Brand Name
As consumers become accustomed to the quality of products and services churned out by
a company, they come to expect the same caliber from products and services from all the
company’s business segments. A strong reputation is essential for an entertainment company’s
success. For example, Disney is known for its high-quality family entertainment. Time Warner
strives to provide premium content through an extensive range of availability. News Corp. is
recognized for its top-quality entertainment around the world. If a company consistently gives
customers exactly what they expect, its reputation will precede it.
High Utilization of Fixed Assets
PAGE 22 OF 30
ENTERTAINMENT INDUSTRY ANALYSIS
Fixed assets are those assets owned by a company that are not easily converted into cash
and are generally purchased with the intention of being held for an extended period of time,
usually more than one year. Most companies in the entertainment industry have a significant
amount of money wrapped up in their fixed assets including buildings, land, studios, equipment,
contracts with stars, and attractions. To make sure fixed assets are being efficiently utilized to
their greatest potential, companies can compare the ratio between sales and fixed assets. If the
sales-to-fixed-assets ratio increases over time, this indicates the company is efficiently utilizing
its investments in fixed assets. A lower sales-to-fixed-assets ratio indicates the company is
utilizing its assets inefficiently or its fixed assets are becoming obsolete.
Technological Know-How
In this day and age, improvements in technology are advancing rapidly and companies
must strive to be leaders in innovation and creativity in order to stay ahead of the competition.
Companies in the entertainment industry have to invest more money into research and
development to come out with innovative new processes, like 3Dimensional filmmaking. Further
efforts are seen in the prevention of music and movie piracy, such as; encryption methods to
prevent DVD copying; and improvements of media internet capabilities, like the shift in gaming
platforms from home gaming consoles to the online and mobile gaming experience. The key to
innovative success is to increase opportunities to collaborate and attain secure deals with
inventors of new technology before less ambitious companies.
Foreign Market Expansion
From foreign television broadcasting and international home entertainment to overseas
amusement parks, the American entertainment industry is extending its empire around the globe.
The global frontier is rich with expansion opportunities for companies in the entertainment
industry. Along with expanding business enterprises, companies must also be aware of the
exchange rates, tax laws, and regulations that come with operating in foreign countries.
Employing management and board members with experience in international dealings would
create an opportunity for success in the global business market.
Safety
PAGE 23 OF 30
ENTERTAINMENT INDUSTRY ANALYSIS
Amusement parks provide an extensive safety and regulatory challenge for a couple of
the largest leaders in the entertainment industry, most notably Disney. NBCUniversal owns the
Universal Studios theme parks, and at one point, Time Warner owned the Six Flags franchise. To
stay on top of regulations surrounding consumer safety, companies in the entertainment industry
need to incorporate safety measures into every aspect of attraction-design. Best practices should
be adopted from related industries and new safety technologies should be developed in order for
a company to comply with safety regulations and internal standards. The key to success when it
comes to safety is consistent monitoring of the controls and operations of attractions. Consumer
safety should be considered as utmost importance for entertainment companies involved in the
amusement park business segment of the industry.
INDUSTRY PROSPECTS AND OVERALL ATTRACTIVENESS
Factors Making the Industry Attractive
Media Networks
As of May 11, 2011, Standard & Poor's (S&P) reported U.S. broadcasters, ad agencies,
Internet companies, and outdoor companies showed signs of a healthy recovery in the
marketplace. The report also noted the revenue expansion, “varied from moderate to robust”,
according to a S&P’s Ratings Services, which is a good sign as revenues consistently declined
from previous years. One sector of the entertainment and media industry that is doing extremely
well is the Internet.
The Internet has continued to maintain its growth according to the previous S&P report,
with mobile and online services geared to cater to consumer wants and needs. In fact David
Goldman of CNN Money claims that online TV is a billion dollar business. “Online TV brought
in $1.6 billion last year, up 34% from 2009, according to a data analysis by IHS. The largest
contributor to that growth was a 65% rise in Internet TV advertising, which reached $719 million
in 2010,” (Goldman, 2011). The article notes that before this current online invasion the “Big
Media” was reluctant to air their programming content online because they thought it would
jeopardize their lucrative deals with cable providers. However, Dan Cryan, the head broadband
media analyst at IHS explained, "Even in this conflicted market, revenue was up, thanks to the
proactive attitude of a handful of players, including Hulu and the CW Television Network, which
PAGE 24 OF 30
ENTERTAINMENT INDUSTRY ANALYSIS
have managed to expand revenue even as consumption growth has leveled out," (Goldman,
2011).
The article also found that Hulu earned more than $200 million in ad revenue in 2010,
doubling what the organization made in 2009. “Though online TV views on Hulu rose just 10%,
the company generated more revenue per stream thanks to greater advertiser interest in the
Internet television market. Hulu displays 47 ads per viewer per month,” and even though that
seems like a large number consumers are willing to sit through advertisements in order to watch
their favorite television programs during times that are the most convenient for them.
Hulu is co-owned by The Walt Disney Company, News Corporation, and NBC
Universal. The article notes that the success of Hulu is also stirring rumors that the company may
soon allow public offerings. The second most lucrative online TV site is the CW. The network is
partially owned by Time Warner. The IHS noted, “That website grew by 50% last year, but its
revenue soared a whopping 300% to $16.5 million. That's because it sold 23 ads per show, on
average.” The strongly competitive market has also allowed TV Networks to look for
alternatives in case the online viewing of television later collapses. Apple is the organization to
which skeptical Networks turn to as the organization currently offering customized downloading
services through iTunes that allow consumers to pay a onetime fee without ever seeing any
commercials on their download.
With Networks battling for viewership wars consumers have the increased opportunity to
be selective and pick and choose which programming best suits them. Many consumers may feel
as though the extra commercials are fine while others will gravitate to ad-free digital content.
Both sides of the industry will profit as will consumers who want to watch “their regularly
scheduled programming,” whenever they like.
Studio Entertainment
While big budget films are the most widely viewed, the niche film audience is still strong
and many studios in the industry are catering to that specific target market. Sony Pictures
Classics co-president Tom Bernard found, “Everyone wants to say indie distribution is totally
screwed, but it has never been healthier. More theaters are playing independent films made
specifically for a specialty audience than ever before," (Filling Up). Bernard’s division releases
about 20 films per year and theatre giants such as the Regal Entertainment Group and Cinemark
PAGE 25 OF 30

ENTERTAINMENT INDUSTRY ANALYSIS
dedicate screens just for independent and niche films. The popularity of these movies not only
attracts more consumers but also contributes to profits for independent film studios.
Factors Making the Industry Unattractive
Music and Live Concerts
Due to the current economic situation, consumers are forced to forgo additional
entertainment programs. Live concerts are shaping up to be one of the activities consumers can
do without. The Wall Street Journal (WSJ) found that revenues for musical concert tours fell
substantially during 2010 and global sales for the top 50 highest-grossing tours declined by 12%
from 2009. In order to try and attract consumers some acts lowered their ticket prices to increase
attendance. While consumers are saving money by not going to see their favorite new artist or
band the established acts like Jon Bon Jovi and Paul McCartney are among the most popular
performers around. The WSJ notes the industry relies heavily on older, more established acts.
Casino Resorts
CNN Money in conjunction with Fortune 500 released a list titled, “20 biggest money
losers,” and the MGM Resorts International was ranked seventh. In 2010 the organization lost
$1.4 billion. “This casino operator's big business is Las Vegas, which has seen an unprecedented
drop in spending - especially around gambling - in the last few years. Consumers aren't the only
ones who have tightened their purse strings; businesses have cut travel budgets, leading to a drop
in convention activity.” MGM also lost money after a joint venture with Dubai World to create
City Center resort and casino didn’t increase in market value. The organization misjudged the
market and the potential of fewer consumers before realizing that adding another casino in Las
Vegas was not an urgent priority to implement. Caesars Entertainment, ranked sixteenth, was
also hit hard by the economy. Their 2010 losses totaled $831.1 million.
Studio Entertainment
PAGE 26 OF 30
ENTERTAINMENT INDUSTRY ANALYSIS
While the entertainment industry allows for many creative and innovating processes
studio entertainment appears to suffer from oversaturation. The success of Avatar and Alice in
Wonderland, revamped the 3D movie industry. Soon after that initial breakthrough dozens of
films were released in 3D and many had the rendering of 3D effects added after production
which caused the special effects to appear in a much lower quality compared to the more
expensive and timely high definition 3D production process. As ticket prices started to increase
movie goers have begun to realize that going to see a movie on the weekend is no longer a cheap
activity to do with the whole family and consumer demand has decreased slightly.
Another problem in the studio entertainment sector is the low sales of DVDs and Blu-ray
discs. The magazine USA Today blamed the low sales on the “lackluster lineup of theatrical
releases. DVD and Blu-ray disc movie sales totaled nearly $2.1 billion in the first three months
of 2011, nearly 20% below the year-ago quarter,” says Digital Entertainment Group, the industry
trade organization that includes the Hollywood studios. Even though Blu-ray releases increased
by 10% the money lost could not recoup from the decline in sales of DVDs. The article
determined the overall sales drop for movie discs was due to the poor box-office performance of
the new movie releases “hitting retail in the first quarter - 25% below movies released in first
quarter 2010 according to executive director Amy Jo Smith.” Also now due to the integration of
technology in our everyday lives instead or buying a DVD or Blu-ray, or renting a movie from
Blockbuster, consumers can stream newly released movies onto their televisions or computers
just by signing up for Netflix.
Profit Outlook
Based on financial reports complied by Fortune 500 the entertainment industry appears to
be holding on to marginal profits in 2010. The chart below ranks the top seven entertainment
industry giants by earned revenues and profits. Walt Disney is performing the best both in
revenues and profits but compared to Live Nation which primarily focuses on music, Disney has
many differing segments of their organization (i.e., media, studio, parks and resorts) to draw
revenues from. At the time of this report, News Corp., CC Media Holdings or Live Nation had
not released their profit results. The results released by Viacom show shareholders and potential
investors the organizations profits are decreasing from last year.
PAGE 27 OF 30
ENTERTAINMENT INDUSTRY ANALYSIS
Fortune 500: 2011: Industry: Entertainment Revenues Profits
Rank Company Fortune 500
rank
$
millions
% change from
2009
$
millions
% change from
2009
1 Walt Disney 65 38,063.0 5.3 3,963.0 19.8
2 News Corp. 83 32,778.0 7.7 2,539.0 N.A.
3 Time Warner 95 26,888.0 -6.8 2,578.0 4.5
4 CBS 174 14,059.8 8.0 724.2 219.7
5 Viacom 180 13,497.0 -0.9 1,548.0 -3.9
6 CC Media Holdings 391 5,865.7 5.7 -479.1 N.A.
7 Live Nation
Entertainment
444 5,063.7 19.7 -228.4 N.A.
The second chart below from Fortune 500 shows the top seven entertainment leaders
ranked by earnings per share, total return to investors and number of employees instead of profits
and revenue.
2011: Industry:
Entertainment
Earnings Per Share Total Return to Investors Employees
Ran
k
Company 2000-2010 Annual
growth (%)
2000-2010
Annual rate (%)
2010
(%)
Number % change
from 2009
1 Walt Disney 13.5 3.8 17.6 149,000 3.5
2 News Corp. N.A. N.A. 7.4 51,000 -7.3
3 Time Warner 4.6 -9.6 13.4 32,000 3.2
4 CBS N.A. -7.9 37.5 25,380 -0.8
5 Viacom N.A. N.A. 34.9 10,900 -2.7
6 CC Media Holdings N.A. -14.5 190.3 20,283 5.1
7 Live Nation
Entertainment
N.A. N.A. 34.2 6,500 51.2
Issue date: May 23, 2011
PAGE 28 OF 30
ENTERTAINMENT INDUSTRY ANALYSIS
The current economic crisis has affected companies around the world and in many
industries. In light of this, declines in employee numbers across these organizations are
understandable. Even though the increase in employees since 2009 was low for Walt Disney
Company and Time Warner both organizations show growth in the industry and in turn,
increased employee numbers. The initial review of Live Nation Entertainment’s high percentage
change in the number of employees was alarming, however, one possible reasoning of the
increase of employees could be the result of rehires if the organization laid off too many
employees the previous year in response to organizational budget cuts.
CONCLUSIONS
In recent years, the entertainment industry has faced vast changes in technology and
consumer market demands with the increase in multi-format cellphones, internet and broadband
capabilities for programming, marketing, and movie viewing. Industry leaders must adapt and
stay flexible in these changing economic times. It is the consumer who is demanding more
control of their entertainment choices now and companies need to continue to respond quickly or
face the threat of substitution from competition. Analysts predict that the entertainment industry
will see improvements in profits and growth faster than some other industries despite the tighter
purse strings of many consumers.
PAGE 29 OF 30
ENTERTAINMENT INDUSTRY ANALYSIS
BIBLIOGRAPHY
"20 biggest money losers." CNN Money. Fortune 500, 05 May 2011. Web. 9 May 2011. <http://money.cnn.com/galleries/2011/fortune/1104/gallery.fortune500_money_losers.fortune/7.html>.
"20 biggest money losers." CNN Money. Fortune 500, 05 May 2011. Web. 9 May 2011. <http://money.cnn.com/galleries/2011/fortune/1104/gallery.fortune500_money_losers.fortune/16.html>.
"About Us." Time Warner, Inc. Time Warner, Inc., 31 Jan. 2011. Web. 10 May 2011.<http://www.timewarner.com/our-company/about-us/>.
Cowan, Chris. "Six Flags/Premier Parks Corporate." Theme Park Timelines. 2005. Web. 10 May 2011. <http://timelines.home.insightbb.com/sfcorp_years.htm>.
"Films Follow Poor Box Office with Home Video Declines." USA Today, (2011)
Goldman, David. "Surprise! Online TV is billion-dollar biz." CNN Money. N.p., 13 Apr 2011. Web. 9 May 2011.
"Industries: Entertainment." CNN Money. Fortune 500, 2011. Web. 9 May 2011. <http://money.cnn.com/2011/04/13/technology/online_TV_revenue/index.htm>.
"Key Success Factors of Walt Disney." MBA Lectures. MBA-Lectures, 11 Nov. 2010. Web. 10 May 2011. <http://mba-lectures.com/management/strategic-management/1078/key-success-factors-of-walt-disney.html>.
Nayab, N. "Determining Sales to Fixed Assets Ratios." Bright Hub. Ed. Jean Scheid. Bright Hub Inc., 7 July 2010. Web. 10 May 2011. <http://www.brighthub.com/ office/finance/articles/76749.aspx>.
NBCUniversal. NBCUniversal Media, LLC. Web. 10 May 2011. <http://www.nbcuni.com/>.
News Corporation. News Corporation. Web. 10 May 2011. <http://www.newscorp.com/>.
"Outlook for US Media and Entertainment Industry Worsens." Research Recap. N.p., 2008. Web. 9 May 2011. <http://www.researchrecap.com/index.php/2008/10/16/outlook-for-us-media-and-entertainment-industry-worsens/>.
“Report on Safety." Walt Disney Parks & Resorts. The Walt Disney Company, Jan. 2008. Web. 10 May 2011. <http://a.dolimg.com/safety/Safety_Report.pdf>.
"S&P Credit Research." Premium Business Information Source. N.p., 11 May 2011. Web. 12 May 2011. <http://www.alacrastore.com/research/s-and-p-credit-research-Some_U_S_Media_And_Entertainment_Companies_Exhibit_Signs_Of_A_Healthy_Recovery_S_P_Report-865973>.
Siegel, Tatiana. "Filling up the niche." Entertainment Industry & the Economy. Variety, 01 Nov 2010. Web. 9 May 2011. <http://www.variety.com/article/VR1118026277>.
Smith, Ethan. "New Blow to Music as Concerts Fizzle." Wall Street Journal - Eastern Edition, 256.153 (2010): B1-B2.
PAGE 30 OF 30