entegris 2017 analyst meeting storyboard- rev 6 10
TRANSCRIPT

MARCH 20, 2017
2017 Analyst Meeting
Certain information contained in this presentation may constitute forward-looking statements within the meaning ofthe Private Securities Litigation Reform Act of 1995. These forward-looking statements involve substantial risks anduncertainties that could cause actual results to differ materially from the results expressed in, or implied by, theseforward-looking statements. Statements that include such words as “anticipate,” “believe,” “estimate,” “expect,”“forecast,” “may,” “will,” “should” or the negative thereof and similar expressions as they relate to Entegris or ourmanagement are intended to identify such forward-looking statements. These statements are not guarantees of futureperformance and involve risks, uncertainties and assumptions that are difficult to predict. These risks include, but arenot limited to, fluctuations in the market price of Entegris’ stock, Entegris’ future operating results, other acquisitionand investment opportunities available to Entegris, general business and market conditions and other factors.Additional information concerning these and other risk factors may be found in previous financial press releases issuedby Entegris and Entegris’ periodic public filings with the Securities and Exchange Commission, including discussionsappearing under the headings “Risks Relating to our Business and Industry,” “Risks Related to Our Indebtedness,”“Manufacturing Risks,” “International Risks” and “Risks Related to Owning Our Common Stock” in Item 1A of ourAnnual Report on Form 10–K for the fiscal year ended December 31, 2016, filed with the Securities and ExchangeCommission on February 17, 2017, as well as other matters and important factors disclosed previously and from timeto time in the filings of Entegris with the U.S. Securities and Exchange Commission. Except as required under thefederal securities laws and the rules and regulations of the Securities and Exchange Commission, we undertake noobligation to update publicly any forward-looking statements contained herein.
SAFE HARBOR
2 | 2017 Analyst Meeting

AGENDA
Topic Speaker
01 A World Class Specialty Materials Company Bertrand Loy, President and CEO
02Why Materials and Purity Matter Morethan Ever Before
Tim Hendry, Retired VP, Technology and ManufacturingGroup, Director of Fab Materials at Intel
03 Delivering Growth From Our Unique Platform Todd Edlund, EVP and Chief Operating Officer
Break
04Microcontamination Control; Ensuring Air,Gas and Liquid Purity
Clint Haris, SVP and General Manager
05Advanced Materials Handling; Guaranteeing PurityThroughout the Process
Bill Shaner, SVP and General Manager
06 Specialty Chemicals and Engineered Materials Stuart Tison, SVP and General Manager
07 Growing Cash Flow and Earnings Greg Graves, EVP and Chief Financial Officer
08 Q&A
3 | 2017 Analyst Meeting

2017 ANALYST MEETING
A World ClassSpecialty Materials Company
Bertrand LoyPresident and CEO
| 2017 Analyst Meeting4

5
WHAT YOU SHOULD TAKE AWAY FROM TODAY’S MEETING
◦ Entegris is executing well with a path for continued top-line growth and bottom-line expansion
◦ The semiconductor industry is in a multi-year growth cycle
◦ Materials and materials purity/handling is a key enabler of this growth
◦ Entegris is well-positioned to benefit as a leading supplier of materials, filtration and advancedmaterials handling solutions
◦ We have an excellent platform on which to expand through strategic M&A
| 2017 Analyst Meeting

ENTEGRIS: CREATING COMPELLING LONG-TERM VALUE FOR SHAREHOLDERS
6 | 2017 Analyst Meeting
Mission CriticalSupplier
Stable, Recurring Revenue,Strong Cash Flow and
Earnings Leverage
Above-MarketGrowth
ElectronicMaterials

Market ENTG
Relative Growth
F/X Impact
3.9%
8.7%
1 2
$0.55 $0.58
$0.69
$0.85$0.94
2012 2013 2014 2015 2016
EPS2
0.0
0.5
1.0
1.5
2.0
2.5
Feb. 2014 Dec. 2014 Dec. 2015 Dec. 2016
Net LeverageNet Debt/Adj. EBITDA
17%
18%
19%
20%
21%
22%
23%
$0
$50
$100
$150
$200
$250
$300
2012 2013 2014 2015 2016
EBITDA and EBITDA Margin2
7
1 Market index defined as 80% Millions of Sq. Inches of Silicon produced (MSI) and 20% Wafer Fab Equipment (WFE); Data source is Gartner (WFE) and SEMI (MSI)2 Non-GAAP
| 2017 Analyst Meeting
$716 $693
$962
$1,081
$1,175
2012 2013 2014 2015 2016
Revenue As Reported$ in Millions
2016 was a yearof many records
Entegris vs. Market Blend 2016

8
STRONG EXECUTION AND FOCUSED INVESTMENTS DRIVING PERFORMANCE
Strategic Investments
The “Entegris Way”
TechnologyGlobal
PresenceOperationalExcellence
| 2017 Analyst Meeting
Customer Engagement Model
Customer sharesinformation
Customerenters relationship
Customerprovides feedback
Relationshipgrows stronger
Relevant,trusted,
technologypartner
Applicationand processknowledge
We developrelevant finalsolution
We listen
We respondquickly withprototypes

9
Source: IBM
NEW DIGITAL WORLD TAKING SHAPE
| 2017 Analyst Meeting
Connected Devices Fast Wireless Network Cloud AI/Machine Learning
IOT 5G5G
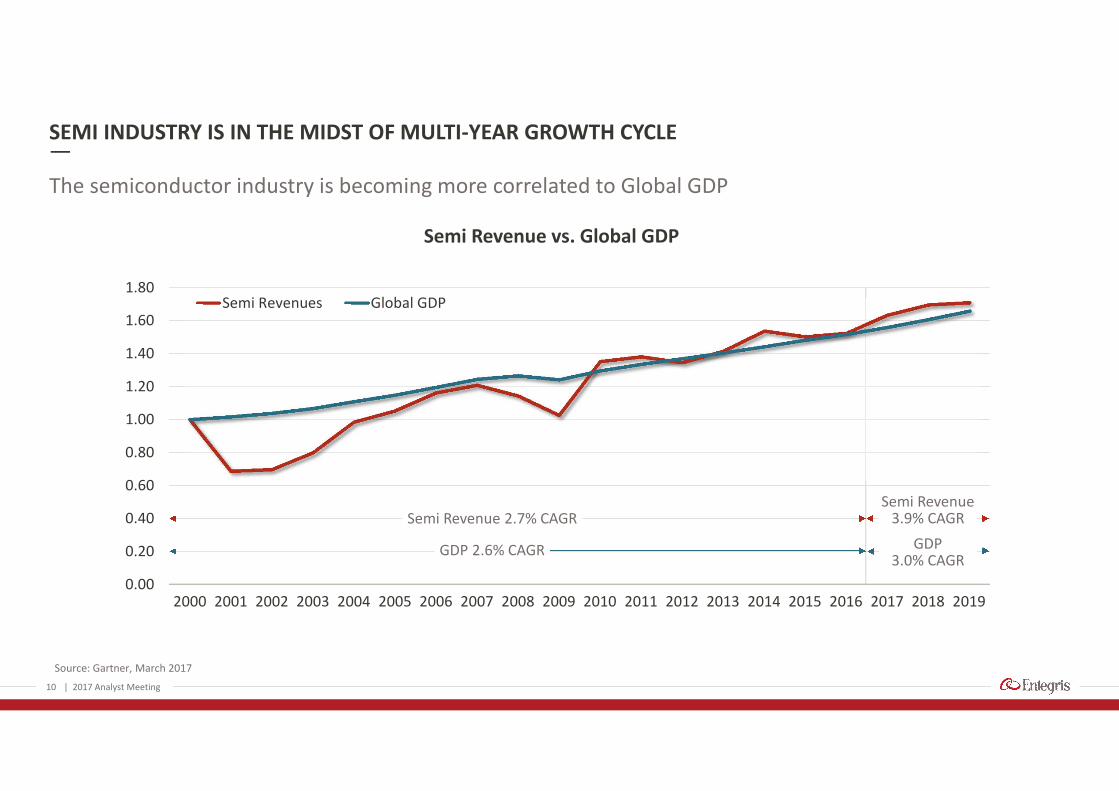
SEMI INDUSTRY IS IN THE MIDST OF MULTI-YEAR GROWTH CYCLE
The semiconductor industry is becoming more correlated to Global GDP
0.00
0.20
0.40
0.60
0.80
1.00
1.20
1.40
1.60
1.80
2000 2001 2002 2003 2004 2005 2006 2007 2008 2009 2010 2011 2012 2013 2014 2015 2016 2017 2018 2019
Semi Revenue vs. Global GDP
Semi Revenues Global GDP
10 | 2017 Analyst Meeting
Semi Revenue 2.7% CAGRSemi Revenue
3.9% CAGR
GDP 2.6% CAGR GDP3.0% CAGR
Source: Gartner, March 2017

11
Source: Wafer Start data – Linx Consulting, February 2017; Semi Manufacturing Process Steps – KLA-Tencor; WFE data – Gartner, February 2017
ELECTRONIC MATERIALS ARE A MORE IMPORTANT PART OF THE INDUSTRY’S FOODCHAIN
| 2017 Analyst Meeting
GlobalGDP
WorldwideElectronicSystems
Production
SemiMarket Semi
CapitalInvestment
SemiMaterials
0
2,000
4,000
6,000
8,000
10,000
12,000
14,000
2015 2016 2017 2018 2019
Wafer Starts Continueto Increase
0
200
400
600
800
1,000
1,200
1,400
28 nm 14 nm 10 nm 7 nm 5 nm
More Semi ManufacturingProcess Steps
$15
$20
$25
$30
$35
$40
$45
2015 2016 2017 2018 2019
$B
illio
ns
Stable Wafer Fab EquipmentInvestment
Driving Demand
MSI
Pro
cess
Step
s

12
New materials and higher purity are becoming essential to the semi industry
NEW MATERIALS WILL DRIVE DEVICE PERFORMANCE
◦ For most of its history, the semi industry hassuccessfully used “shrink” to keep on Moore’s Law
◦ Continued innovation of device performance requiresthe use of more new materials
◦ Achieving targeted manufacturing yields for newtechnology nodes is even more critical to the leading-edge fabs, but more difficult due process complexityand materials challenges
◦ Purity and contamination control are increasinglyimportant levers to achieving yields
◦ Entegris is focused on materials and materialsinnovation that are increasingly critical to enablingthe industry’s roadmap
| 2017 Analyst Meeting
13
1 Source: Entegris estimates2 Source: SEMI
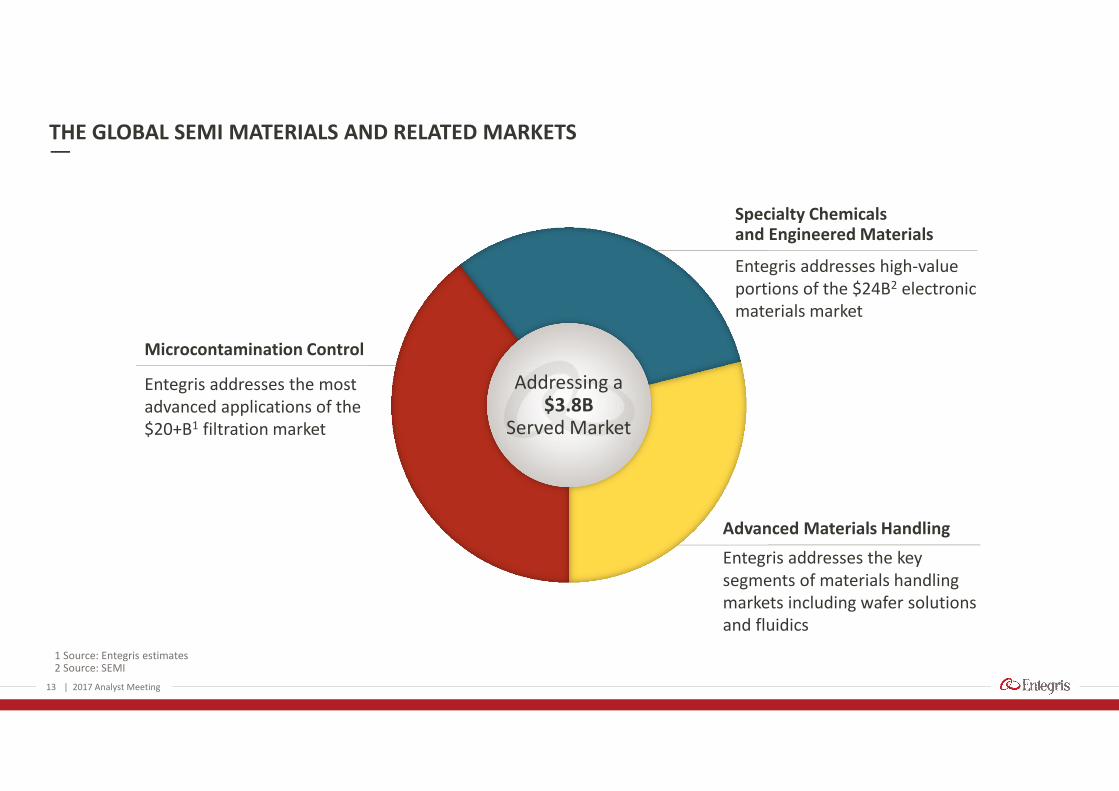
THE GLOBAL SEMI MATERIALS AND RELATED MARKETS
| 2017 Analyst Meeting
Entegris addresses the mostadvanced applications of the$20+B1 filtration market
Entegris addresses the keysegments of materials handlingmarkets including wafer solutionsand fluidics
Advanced Materials Handling
Microcontamination Control
Addressing a$3.8B
Served Market
Entegris addresses high-valueportions of the $24B2 electronicmaterials market
Specialty Chemicalsand Engineered Materials
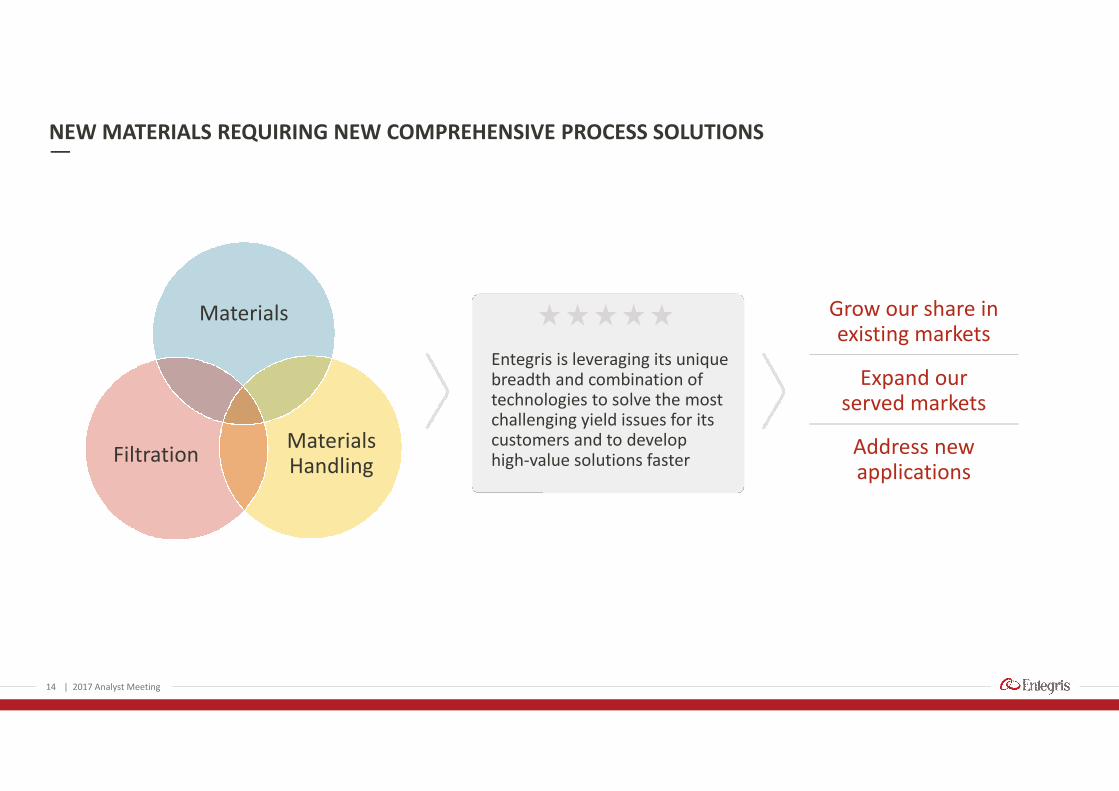
NEW MATERIALS REQUIRING NEW COMPREHENSIVE PROCESS SOLUTIONS
Materials
MaterialsHandlingFiltration
15 | 2017 Analyst Meeting14
Entegris is leveraging its uniquebreadth and combination oftechnologies to solve the mostchallenging yield issues for itscustomers and to develophigh-value solutions faster
Grow our share inexisting markets
Expand ourserved markets
Address newapplications

PATH TO CONTINUE TO OUTPACE MARKETS OVER NEXT THREE TO FIVE YEARS
15
Entegris is leveraging its technology breadth, global infrastructure and operationalexpertise to drive growth
3 to 5 year CAGR
4% to 6% expectedannual growth
1-2%GROWTH from
Entegris initiatives
GROWTH from semiend-market trends
GDP drivenGROWTH
~1%
~2% - ~3%
Mid-term Building Blocks for Growth
| 2017 Analyst Meeting

16
1 Non-GAAP EPS
EPS GROWTH FORMULA1
Our goal is to grow profits at 2x the rate of organic growth with a path to significantly increase EPS throughstrategic capital allocation that leverages the Entegris platform
| 2017 Analyst Meeting
2016
$0.94 EPS
2019
EPS in excessof $1.40
M&A
4
Operationalexecution and
efficiency
2
Sales growth
1Deleveraging
3
2017 ANALYST MEETING
Why Materials and PurityMatter More than Ever Before
Tim Hendry
Retired Vice PresidentTechnology and Manufacturing Group,Director of Fab Materials at Intel
| 2017 Analyst Meeting17

18
INCREASED IMPORTANCE OF SPECIALTY MATERIALS – DEVICE PERFORMANCE
| 2017 Analyst Meeting
Integration of new material types is playing anincreasing role in achieving device performance gains
Scaling
Materials
Design
Materials are having a greater Impact on semiconductor performanceSource: Entegris estimates
?
65 45 28 20 14 10 7
Node in nm
Rel
ativ
eIm
pac
to
nD
evic
ePe
rfo
rman
ce
Device Performance DriversDevice performance and energy efficiency support
emerging mobile markets and expanding data centers
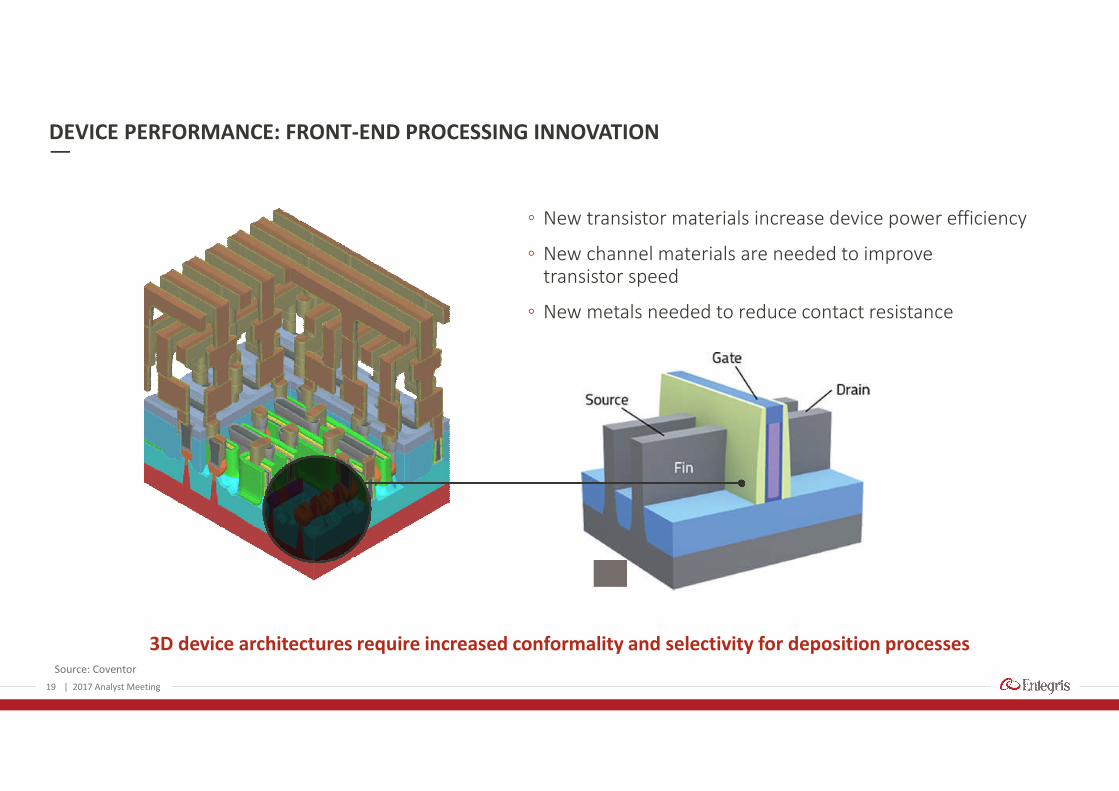
3D device architectures require increased conformality and selectivity for deposition processes
DEVICE PERFORMANCE: FRONT-END PROCESSING INNOVATION
Source: Coventor
19
◦ New transistor materials increase device power efficiency
◦ New channel materials are needed to improvetransistor speed
◦ New metals needed to reduce contact resistance
| 2017 Analyst Meeting

Cu
WVia
LinerBarrier
TMB
DEVICE PERFORMANCE: BACK-END PROCESSING INNOVATION
Shrinking dimensions and increasing layers make wiring delays the limiter of device performance
20
◦ New dielectrics and metals required to reduce wiringsignal delays
◦ Structural integrity of low-k materials is key challenge
◦ New metals required beyond Copper (liners, barriersand electroplated films) needed to accommodate smallerline dimensions
| 2017 Analyst Meeting
Source: Coventor
Other Key Metals:
◦ Tantalum
◦ Manganese
◦ Ruthenium
Co
WVia
1 nm TaNa=87°
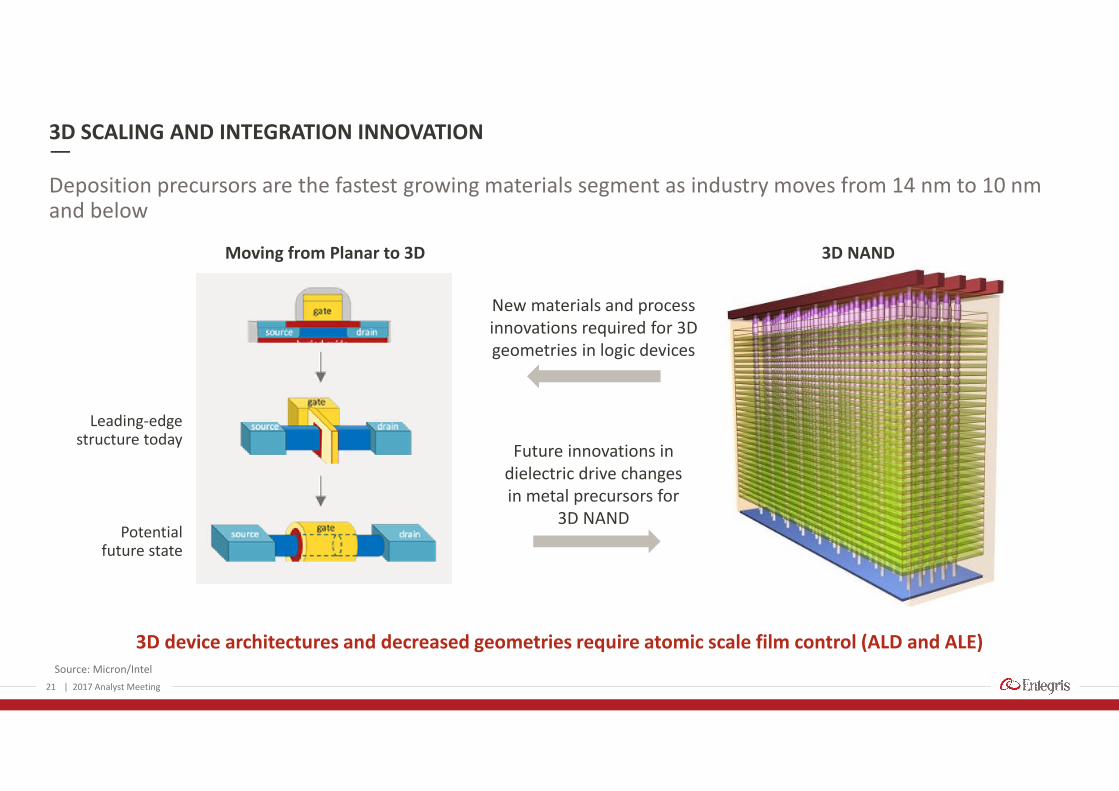
Source: Micron/Intel
21
3D device architectures and decreased geometries require atomic scale film control (ALD and ALE)
3D SCALING AND INTEGRATION INNOVATION
Deposition precursors are the fastest growing materials segment as industry moves from 14 nm to 10 nmand below
| 2017 Analyst Meeting
Future innovations indielectric drive changesin metal precursors for
3D NAND
Leading-edgestructure today
Potentialfuture state
New materials and processinnovations required for 3Dgeometries in logic devices
Moving from Planar to 3D 3D NAND
22
Source: Left chart – KLA-Tencor; right chart – ASML
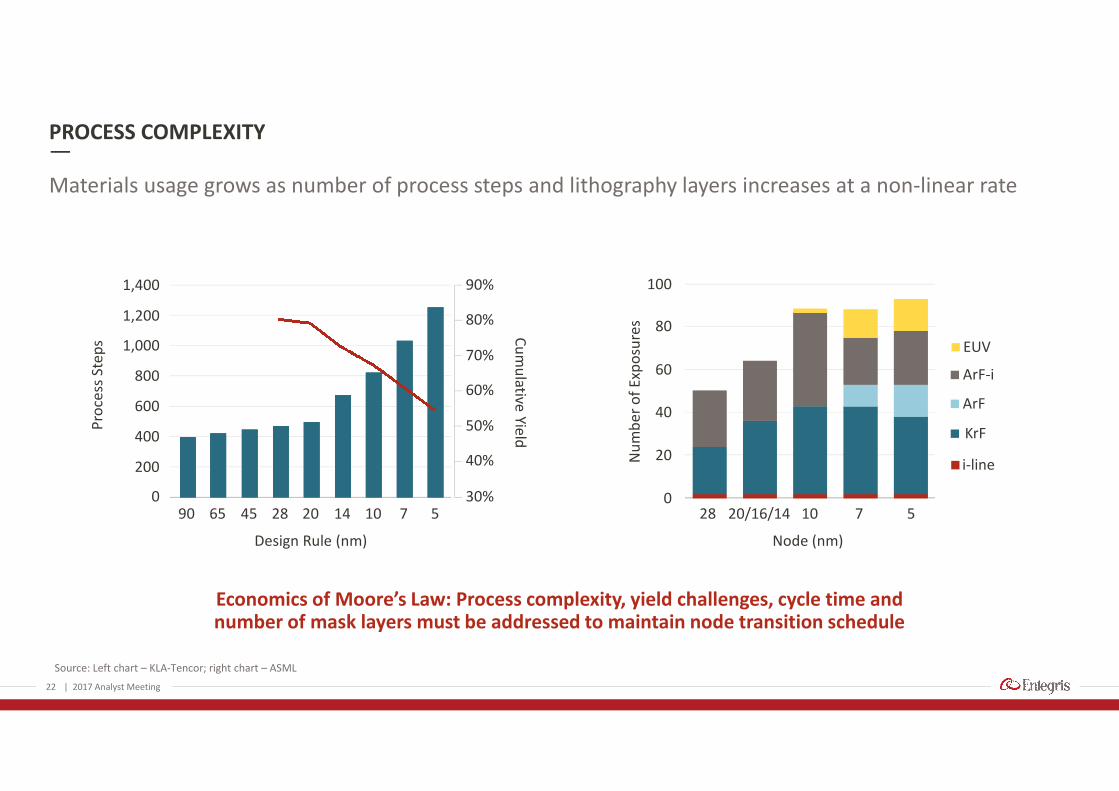
Economics of Moore’s Law: Process complexity, yield challenges, cycle time andnumber of mask layers must be addressed to maintain node transition schedule
PROCESS COMPLEXITY
Materials usage grows as number of process steps and lithography layers increases at a non-linear rate
| 2017 Analyst Meeting
0
20
40
60
80
100
EUV
ArF-i
ArF
KrF
i-lineNu
mb
er
of
Exp
osu
res
20/16/1428 10 7 5
Node (nm)
90 65 45 28 20
Design Rule (nm)
14 10 7 530%
40%
50%
60%
70%
80%
90%
Cu
mu
lativeYie
ld
Pro
cess
Ste
ps
0
200
400
600
800
1,000
1,200
1,400

23
INCREASED MATERIAL PURITY REQUIREMENTS
Purity in key process areas in the fab are measured in parts per quadrillion (PPQ)
| 2017 Analyst Meeting
0
10
20
30
40
50
60
70
80
22 nm 20 nm 16 nm 14 nm 10 nm 7 nm 5 nm
M1
½P
itch
Technology Node
Metal Wiring Pitch
20 nm 7 nm
Killer Defect
24
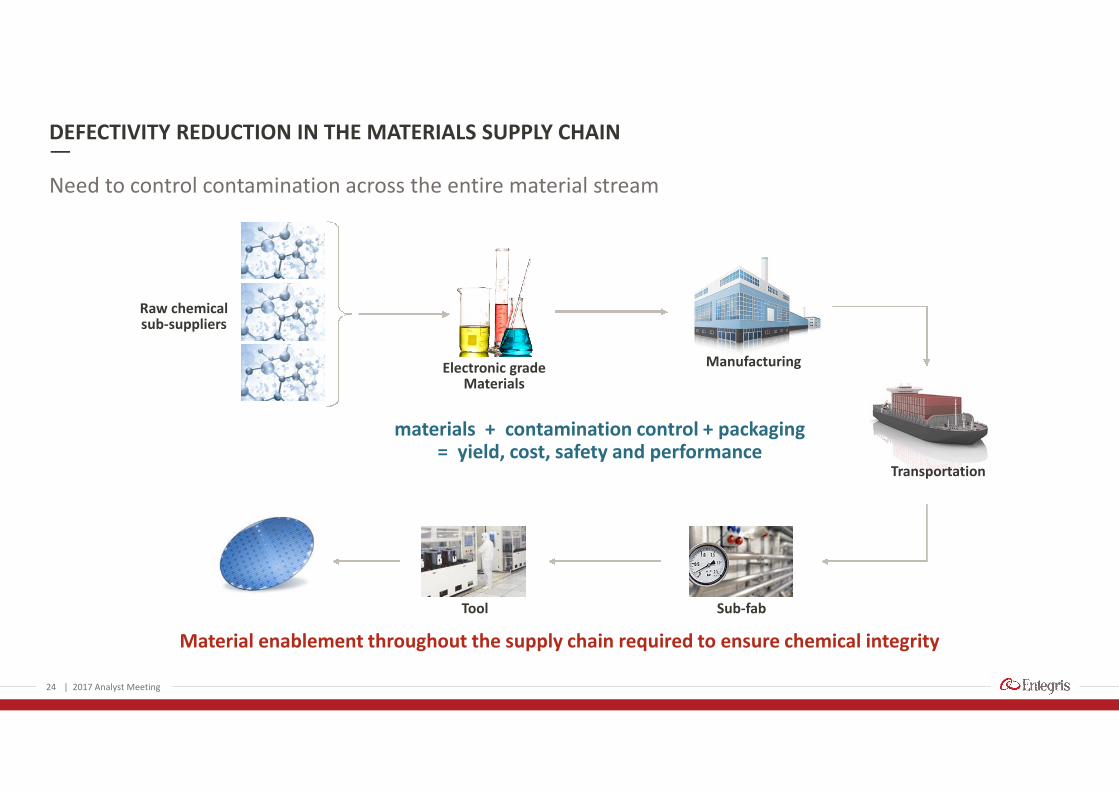
Material enablement throughout the supply chain required to ensure chemical integrity
DEFECTIVITY REDUCTION IN THE MATERIALS SUPPLY CHAIN
Need to control contamination across the entire material stream
| 2017 Analyst Meeting
Manufacturing
Sub-fabTool
materials + contamination control + packaging= yield, cost, safety and performance
Transportation
Electronic gradeMaterials
Raw chemicalsub-suppliers

SUPPLY CHAIN CONSIDERATIONS FOR MATERIALS SELECTIONS
25
Suppliers must make upfront investment and build capability to play in this industry
Fewer players with breadth of needed capabilities
| 2017 Analyst Meeting
◦ Comprehensive set of engineering capabilities to bringinnovative solutions to market
◦ Speed of execution to introduce new material iterationsgiven the long process cycle times for new nodes
◦ Analytical capabilities to quickly solve problems that occurduring product ramp
◦ Manufacturing capacity and agility to respond to changingrequirements
◦ Supply chain expertise and relationship with sub-suppliers

SUMMARY
◦ Materials will continue to play an increasing role inachieving device performance gains as newtransistor architectures are introduced
◦ Process complexity will continue to be a headwindfor the transition to new process nodes
◦ Materials and equipment suppliers that developsolutions which reduce complexity withoutsacrificing performance will gain market share
◦ A holistic systems approach integrated into theentire supply chain is needed to meet futuredefectivity requirements
26
Broadly capable materials suppliers are best positioned to support the global supply chainin the semiconductor industry
| 2017 Analyst Meeting

2017 ANALYST MEETING
Delivering GrowthFrom Our Unique Platform
Todd EdlundExecutive Vice President and COO
| 2017 Analyst Meeting27

ENTEGRIS HAS THE BROADEST PORTFOLIO OF SOLUTIONS TO THE INDUSTRY’S CHALLENGES
Advanced Materials Handling(AMH)
MicrocontaminationControl (MC)
◦ Liquid Filters and Purifiers
◦Gas Filters/Diffusers/Purifiers
◦ Airborne MolecularContamination ControlProducts
Specialty Chemicals andEngineered Materials (SCEM)
◦ SDS and VAC Based Gases (SG)
◦ Post Etch/CMP Cleans
◦ Plating and CMP Components
◦ Advanced Deposition Products
◦Graphite Products
◦ Specialty Coatings
◦Microenvironments
◦ Fluid Handling
◦ Sensing & Control
◦ Liquid Packaging
28 | 2017 Analyst Meeting
The most broadly capable materials solutions provider to our industries

HIGHLY SYNERGISTIC DIVISIONS
29 | 2017 Analyst Meeting
SCEM
AMHMC
ENTGPURE
Matched filter/chemicalsolutions from earlieststages of development
Advanced materials enablingadvanced process integrations
Chemical packaging andsensing solutions matchedto emerging chemistries
“Last Line of Defense”for defect reduction
and yield improvement
Contamination control solutionsfor fab environments;
End-to-end fluidics solutions
Strategic access for new fabpartnerships that cross processes –global wafer handling leader
Technology and roadmap partnering across divisions makes us faster

ENTEGRIS TOUCHES EVERY PART OF THE SEMICONDUCTOR ECOSYSTEM
Entegris is a uniquely capable solutions partner
Reticle andMask Making
SCEM
MC
AMH
Semi MaterialsManufacturers Fab Infrastructure Process Tools
Device andFinished Wafer
◦ ShippingContainers
◦ ChemicalPackaging
◦ Filters
◦ Purifiers
◦ Specialty Chemicals
◦ Specialty Gas andDelivery Solutions
◦ Cu Plating Solutions
◦ CMP PadConditioners
WaferGrowers
ElectronicChemicalsMfrs.
◦ Fluid Handling
◦ Sensing &Control
◦ ChemicalContainers
◦ Filters/Purifiers
◦ Gas PurificationSystems
◦ DepositionPrecursors andDelivery Solutions
◦ E-Chucks
◦ Graphite/SiC andCoatings Solutions
IncomingWafers
Gases/Chemicals
Sub Fab andDistribution
◦ Wafer andReticle Carriers
◦ FluidicsSolutions
◦ Fluid Dispenseand Control
◦ Filters/Purifiers
◦ Gas PurificationSystems
◦ AMC Control
AMHSystems
Cleanroom
Litho
Implant
Deposition
Etch
Wet Cleans
CMP
◦ Finished WaferHandling
◦ DeviceHandling andShipping
FinishedWaferShipping
Thin Wafers
Semi DevicesandAssemblies
| 2017 Analyst Meeting30

COMPETITIVE ADVANTAGE: INDUSTRY FOCUSED ON A LARGE SCALE
Applications knowledge spanning fab processes makes us an attractive partner
SelectedCompetitors
Liquid/gasFiltration
AdvancedCleans
DepositionMaterials
SpecialtyGases
FabEnvironment
SpecialtyMaterials
WaferHandling
FluidHandling
| 2017 Analyst Meeting31

COMPELLING AND DIVERSIFIED BUSINESS MODEL
Diversified Customer Base2016 Revenue
Unique Customer Segmentation2016 Revenue
Fabs
OEMs
Semi Materials
Non-Semi
Recurring Revenue Model2016 Revenue
Recurring Revenue
Investment-drivenRevenue
Top 10 Customers
All Others
32 | 2017 Analyst Meeting
AMH$384.3
SCEM$428.3
MC$362.7
MC
◦ Above market growth after recent investments
◦ Strong differentiation driving margins
SCEM
◦ Stable business with good market share; key emerging growth vectors
◦ Focused investments on rapid growth areas
AMH
◦ Stable markets, more industry investment-driven than other two divisions
◦ Cash flow focused, and leading entry to fab projects
2016 Revenue by Division$ in millions
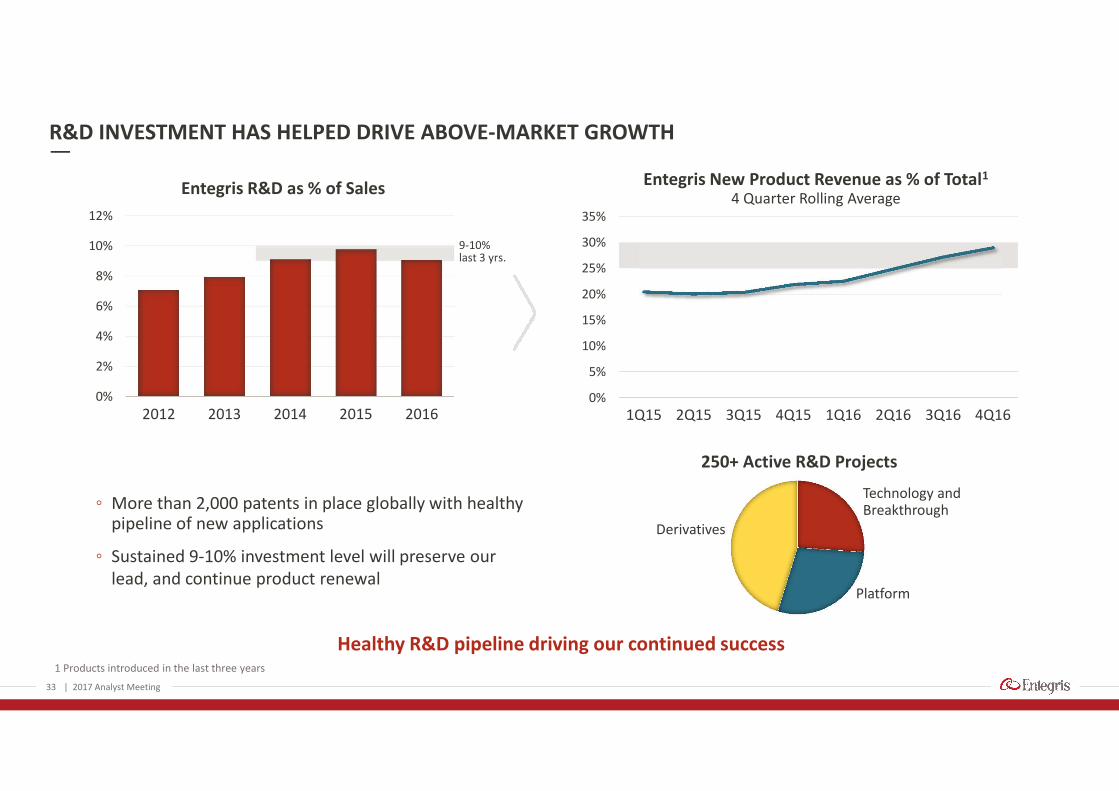
R&D INVESTMENT HAS HELPED DRIVE ABOVE-MARKET GROWTH
0%
2%
4%
6%
8%
10%
12%
2012 2013 2014 2015 2016
Entegris R&D as % of Sales
0%
5%
10%
15%
20%
25%
30%
35%
1Q15 2Q15 3Q15 4Q15 1Q16 2Q16 3Q16 4Q16
Entegris New Product Revenue as % of Total1
4 Quarter Rolling Average
33 | 2017 Analyst Meeting
250+ Active R&D Projects
Derivatives
Technology andBreakthrough
Platform
◦ More than 2,000 patents in place globally with healthypipeline of new applications
◦ Sustained 9-10% investment level will preserve ourlead, and continue product renewal
Healthy R&D pipeline driving our continued success1 Products introduced in the last three years
9-10%last 3 yrs.
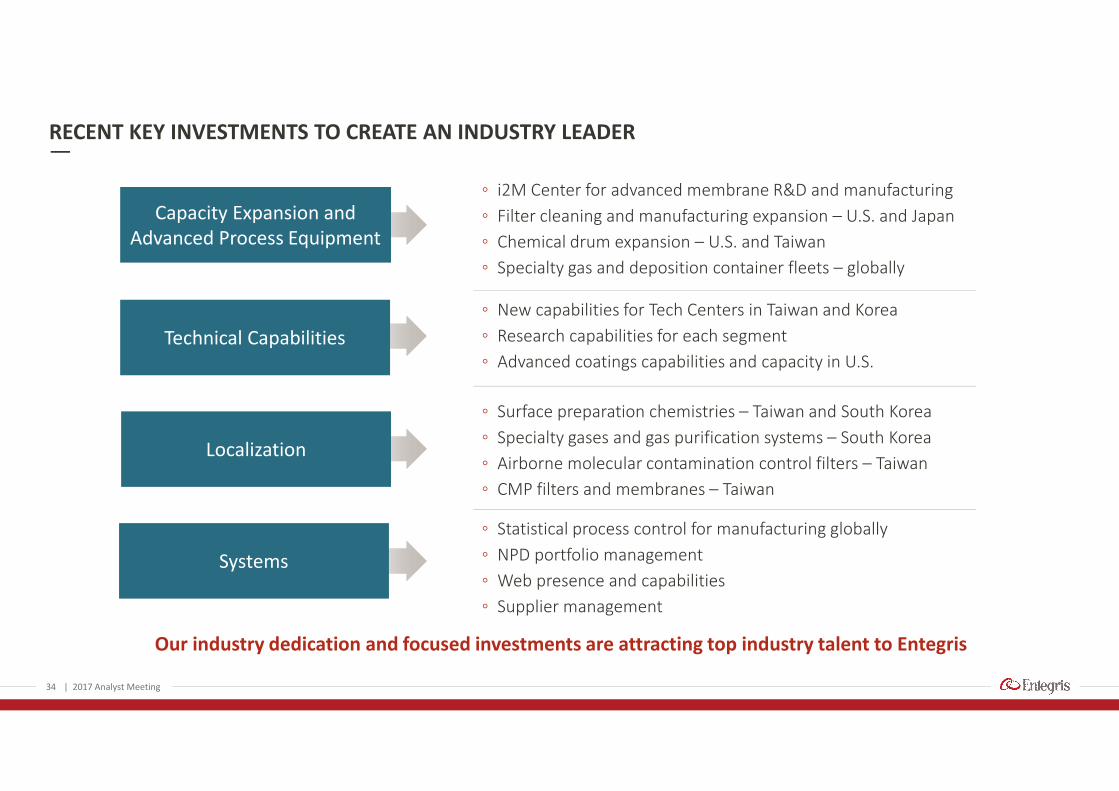
RECENT KEY INVESTMENTS TO CREATE AN INDUSTRY LEADER
34
Our industry dedication and focused investments are attracting top industry talent to Entegris
| 2017 Analyst Meeting
Capacity Expansion andAdvanced Process Equipment
Technical Capabilities
Localization
Systems
◦ i2M Center for advanced membrane R&D and manufacturing
◦ Filter cleaning and manufacturing expansion – U.S. and Japan
◦ Chemical drum expansion – U.S. and Taiwan
◦ Specialty gas and deposition container fleets – globally
◦ New capabilities for Tech Centers in Taiwan and Korea
◦ Research capabilities for each segment
◦ Advanced coatings capabilities and capacity in U.S.
◦ Surface preparation chemistries – Taiwan and South Korea
◦ Specialty gases and gas purification systems – South Korea
◦ Airborne molecular contamination control filters – Taiwan
◦ CMP filters and membranes – Taiwan
◦ Statistical process control for manufacturing globally
◦ NPD portfolio management
◦ Web presence and capabilities
◦ Supplier management
3
4
5
6
2010 2011 2012 2013 2014 2015 2016
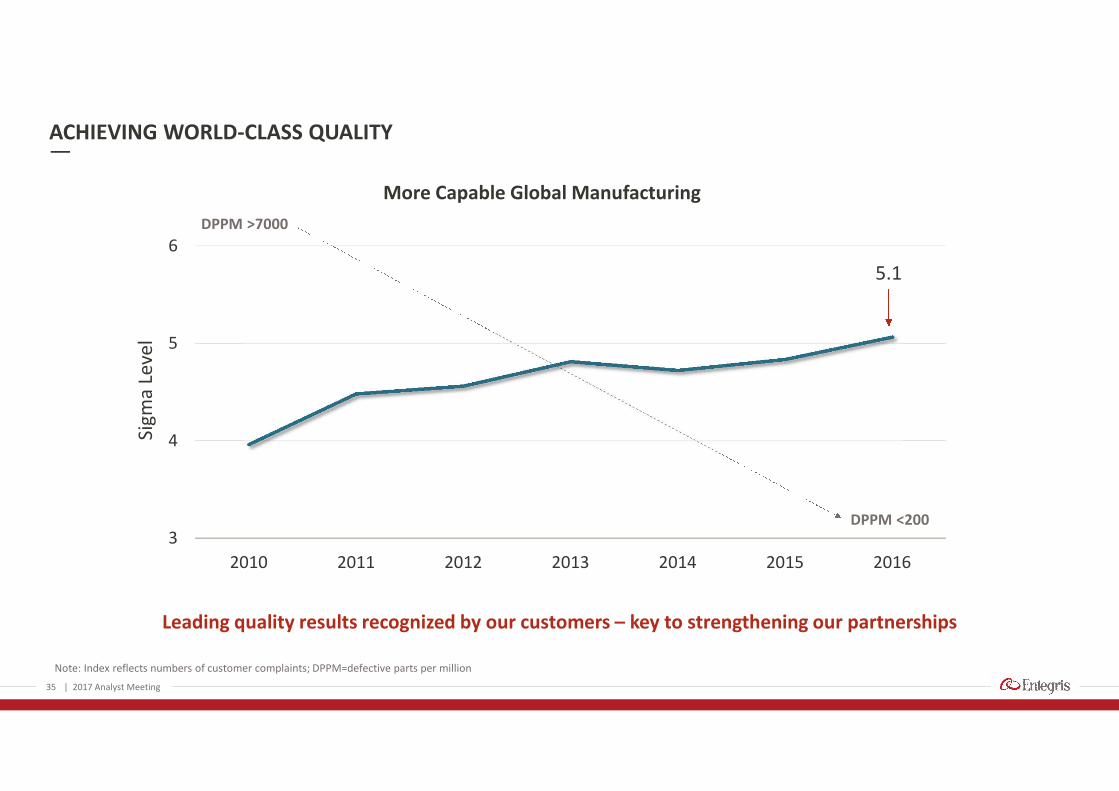
More Capable Global Manufacturing
ACHIEVING WORLD-CLASS QUALITY
35
Leading quality results recognized by our customers – key to strengthening our partnerships
| 2017 Analyst Meeting
Note: Index reflects numbers of customer complaints; DPPM=defective parts per million
5.1
DPPM >7000
DPPM <200
Sigm
aLe
vel

DRIVING ABOVE-MARKET GROWTH
36
Key initiatives shared at July 2016 Analyst Meeting are progressing well and are expanding our servedmarkets and market share
On track for our original expectations for $70 million of incremental revenue by 2018,and continued growth beyond
| 2017 Analyst Meeting
Top 5 RepresentativeOpportunities Market Share Next Application SAM Expansion
Bulk photochemical filtration
Boron mixtures for implant
Solid precursors for deposition
Specialized coatings for keyapplications
CMP pad conditioners

37
GROWTH OPPORTUNITIES – WHAT IS DRIVING THE FUTURE OF OUR SEGMENTS?
| 2017 Analyst Meeting
MC SCEM AMH
Continued node shrink Tighter filtration, newmaterial solutions, AMCfocus
New cleans solutions andmaterials integrations,higher purity gases
Advanced wafer solutions,cleaner fluid handlingproducts, EUV solutions
3D NAND and Memory More process steps =more filtration needs
New deposition materialssolutions, new cleanssolutions, chamber coatings
Queue time extension, lithofluid handling purity, EUVsolutions
Increasing needs for purityin the supply chain
Liquid and gas purifiers forchemical suppliers andfab-matched solutions
Pure chemicals and solidsdelivered to wafer
Cleaner containers forchemicals, wafers and reticles
IoT and China Growing filter needs in themarket, AMC focus
Growth in demand for gases,deposition materials andcleans chemistries
Legacy node wafer handlingdemand, as well as advancednode fabs
The most talked about industry trends are good news for Entegris
Driver

38
Unit driven, diversified business platform, outperforming a growing industry
KEY TAKEAWAYS
◦ Combination of three divisions makes us a unique partner to our customers
◦ Specialized solutions and speed of development and ramp are increasingly important
◦ Entegris has integrated the right capabilities and has made the right investment choicesto deliver results
| 2017 Analyst Meeting
39
10 MINUTE BREAK
| 2017 Analyst Meeting

2017 ANALYST MEETING
Microcontamination Control;Ensuring Air, Gas and Liquid Purity
Clint HarisSenior Vice President and General Manager
| 2017 Analyst Meeting40

41
MICROCONTAMINATION CONTROL
| 2017 Analyst Meeting
Unit Driven79%
InvestmentDriven
21%
Unit Driven vs.Investment Driven
◦ Applications expertise
◦ Close alignment to customers’ roadmaps
◦ Proprietary technologies and value proposition
EnvironmentGasesLiquids
ValueProposition:

42
Source: Entegris estimates
FILTRATION
Focusing on the most advanced parts of a $20+ billion dollar market
| 2017 Analyst Meeting
EntegrisSAM$1.5B
Unaddressedmarket$20B+
PrimaryMarkets
SemiSemi
ElectronicsElectronics
Life Sciences
Industrial
Food & Beverage
Water
MICROCONTAMINATION CONTROL
43
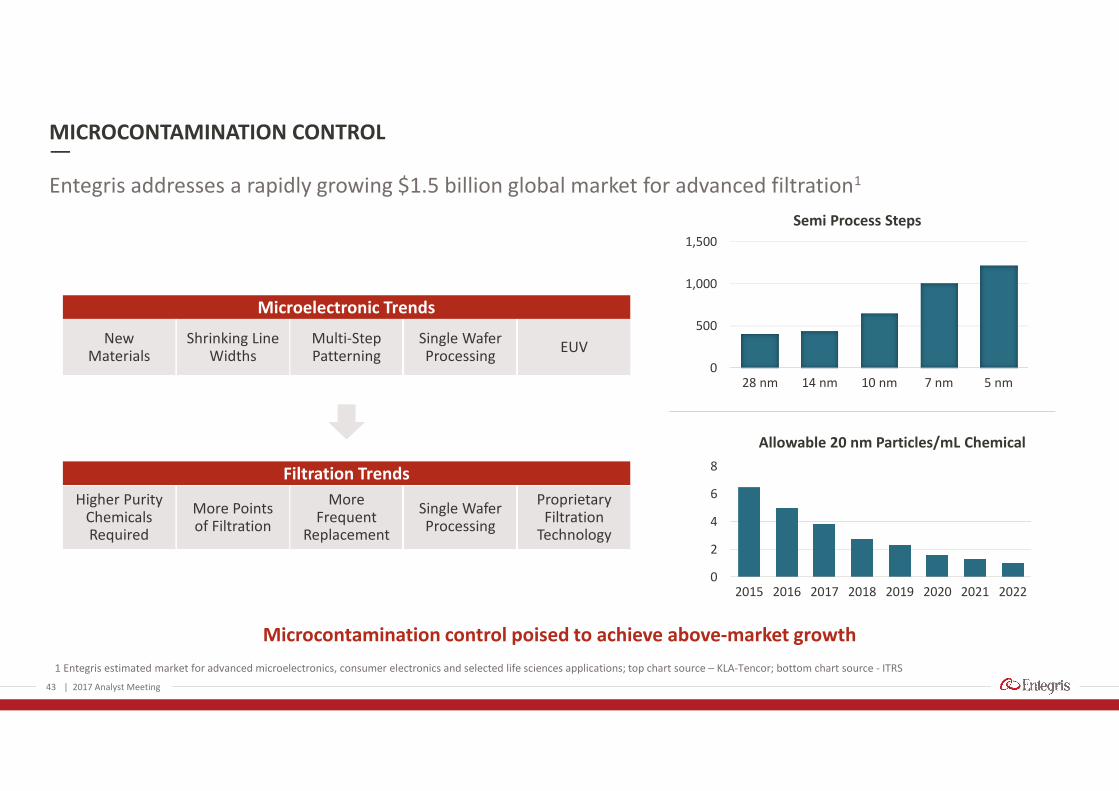
1 Entegris estimated market for advanced microelectronics, consumer electronics and selected life sciences applications; top chart source – KLA-Tencor; bottom chart source - ITRS
Microcontamination control poised to achieve above-market growth
Entegris addresses a rapidly growing $1.5 billion global market for advanced filtration1
| 2017 Analyst Meeting
0
2
4
6
8
2015 2016 2017 2018 2019 2020 2021 2022
Allowable 20 nm Particles/mL Chemical
0
500
1,000
1,500
28 nm 14 nm 10 nm 7 nm 5 nm
Semi Process Steps
NewMaterials
Shrinking LineWidths
Multi-StepPatterning
Single WaferProcessing
EUV
Microelectronic Trends
Higher PurityChemicalsRequired
More Pointsof Filtration
MoreFrequent
Replacement
Single WaferProcessing
ProprietaryFiltration
Technology
Filtration Trends
LIQUID FILTRATION
44
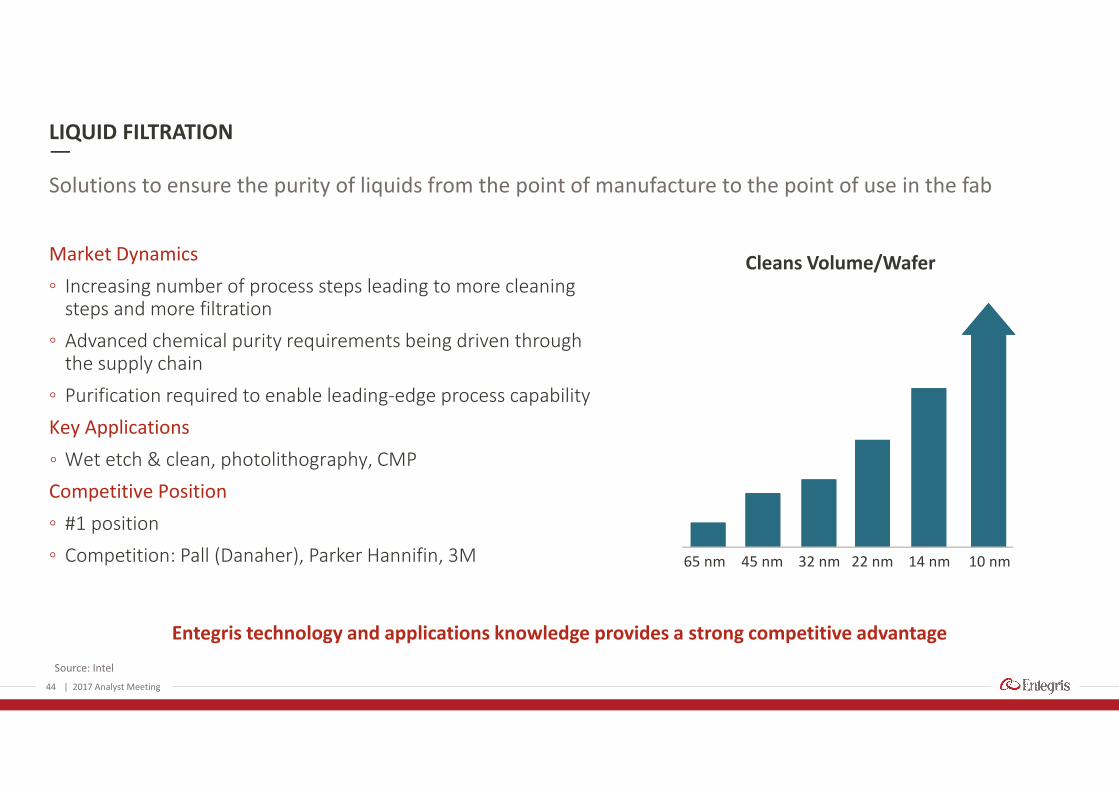
Source: Intel
Entegris technology and applications knowledge provides a strong competitive advantage
Solutions to ensure the purity of liquids from the point of manufacture to the point of use in the fab
| 2017 Analyst Meeting
Market Dynamics
◦ Increasing number of process steps leading to more cleaningsteps and more filtration
◦ Advanced chemical purity requirements being driven throughthe supply chain
◦ Purification required to enable leading-edge process capability
Key Applications
◦ Wet etch & clean, photolithography, CMP
Competitive Position
◦ #1 position
◦ Competition: Pall (Danaher), Parker Hannifin, 3M
Cleans Volume/Wafer
65 nm 45 nm 32 nm 22 nm 14 nm 10 nm
GAS FILTRATION
45
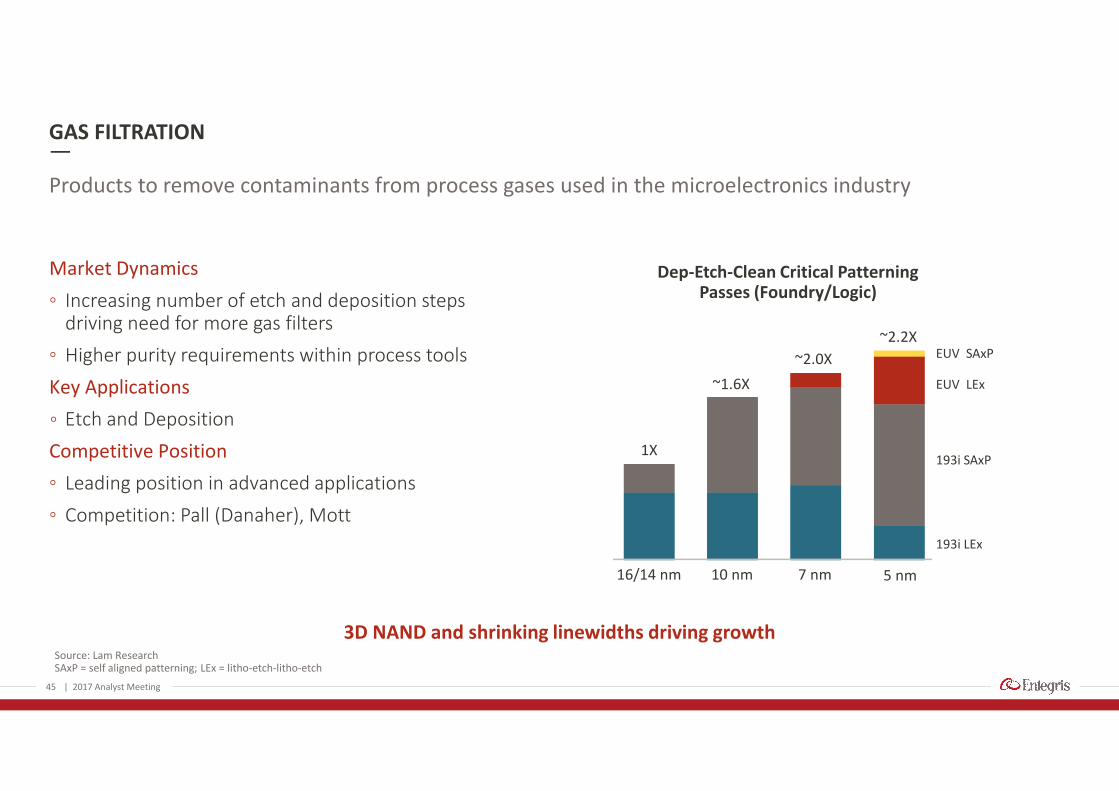
Source: Lam ResearchSAxP = self aligned patterning; LEx = litho-etch-litho-etch
3D NAND and shrinking linewidths driving growth
Products to remove contaminants from process gases used in the microelectronics industry
| 2017 Analyst Meeting
1X
16/14 nm
~1.6X
10 nm
EUV SAxP
EUV LEx
193i SAxP
193i LEx
~2.0X
7 nm
~2.2X
5 nm
Dep-Etch-Clean Critical PatterningPasses (Foundry/Logic)
Market Dynamics
◦ Increasing number of etch and deposition stepsdriving need for more gas filters
◦ Higher purity requirements within process tools
Key Applications
◦ Etch and Deposition
Competitive Position
◦ Leading position in advanced applications
◦ Competition: Pall (Danaher), Mott
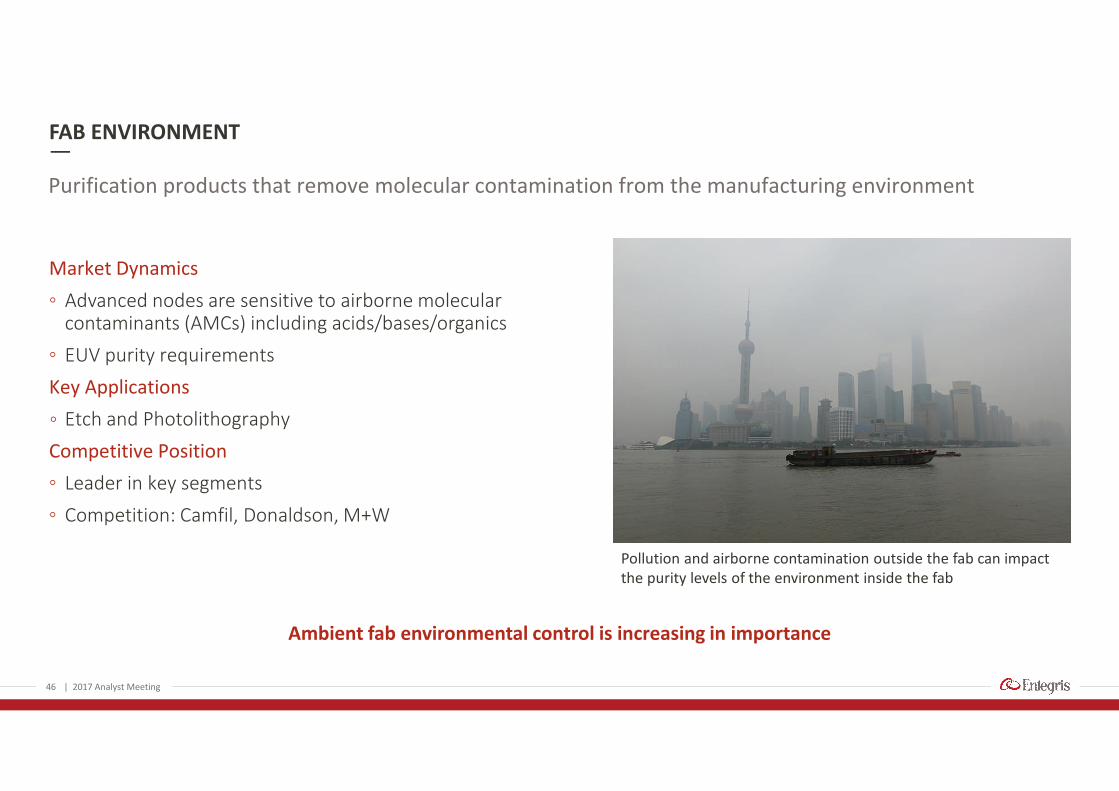
FAB ENVIRONMENT
46
Purification products that remove molecular contamination from the manufacturing environment
Market Dynamics
◦ Advanced nodes are sensitive to airborne molecularcontaminants (AMCs) including acids/bases/organics
◦ EUV purity requirements
Key Applications
◦ Etch and Photolithography
Competitive Position
◦ Leader in key segments
◦ Competition: Camfil, Donaldson, M+W
| 2017 Analyst Meeting
Pollution and airborne contamination outside the fab can impactthe purity levels of the environment inside the fab
Ambient fab environmental control is increasing in importance

MICROCONTAMINATION CONTROL – ADDRESSING PURITY THROUGH THE SUPPLY CHAIN
47
Source: Linx Consulting, September 2016
Entegris has the technology to control contamination across the fluidics stream – from production to consumption
Increased photochemical consumption and higher purity through the supply chain drivingdemand for photochemical filtration
| 2017 Analyst Meeting
$2,000
$2,200
$2,400
$2,600
$2,800
$3,000
$3,200
$3,400
2015 2016 2017 2018 2019
Semi Photo Materials$ in millions
Materials
MaterialsHandling
Filtration
Transport
SubfabFab Tool
Point–of-use
Chemicalmanufacturer
$10,000/Gal

MICROCONTAMINATION CONTROL – ADDRESSING THE PURITY CHALLENGES OF SHRINK
48
Innovative techniques are required to remove contaminants while retaining similarlysized desirable molecules
Materials
MaterialsHandling
Filtration
| 2017 Analyst Meeting
As required purity levels continue to advance, the needfor selective removal of unwanted molecules becomesmore challenging90 nm 45 nm 2X nm 10 nm
Filt
rati
on
Qu
alit
y
Base Membrane
Surface Modification
Purification
Configuration
Product Value
Filtration Technology is Increasingin Complexity and Value
A deep understanding of process chemicals is required to design purification solutions

49
1 2014 Pro-forma includes full year ATMI2 Non-GAAP Adjusted measure3 Market index defined as 79% Millions of Sq. Inches of Silicon produced (MSI) and 21% Wafer Fab Equipment (WFE); Data source is Gartner (WFE) and SEMI (MSI)
MC – STRONG GROWTH AND PROFITABILITY
| 2017 Analyst Meeting
2015 2016 3-Year Outlook
Sales Growth1 (2%) 15%200 – 400 bps
above Market3 growth
AdjustedOperating Margin2 26% 31% 33% – 35%
Key Margin Drivers
◦ Sales growth from margin accretive new products
◦ Supply chain and operational efficiencies
◦ Improved factory utilization
10%
15%
20%
25%
30%
35%
$0
$50
$100
$150
$200
$250
$300
$350
$400
FY15 FY16
Microcontamination ControlSegment
Sales Adj. Op. margin

2017 ANALYST MEETING
Advanced Materials Handling;Guaranteeing Purity Throughoutthe Process
Bill ShanerSenior Vice President and General Manager
| 2017 Analyst Meeting50

FluidicsContainersWafer Solutions
51
ADVANCED MATERIALS HANDLING – THE TIP OF THE SPEAR
| 2017 Analyst Meeting
Unit Driven45%
InvestmentDriven
55%
Unit Driven vs.Investment Driven
◦ Broad knowledge of the semiconductor supply chain andcontamination challenges
◦ Expertise in precision molding of high-purity polymer materials
◦ Proprietary Technologies and leverage with MC and SCEM
ValueProposition:
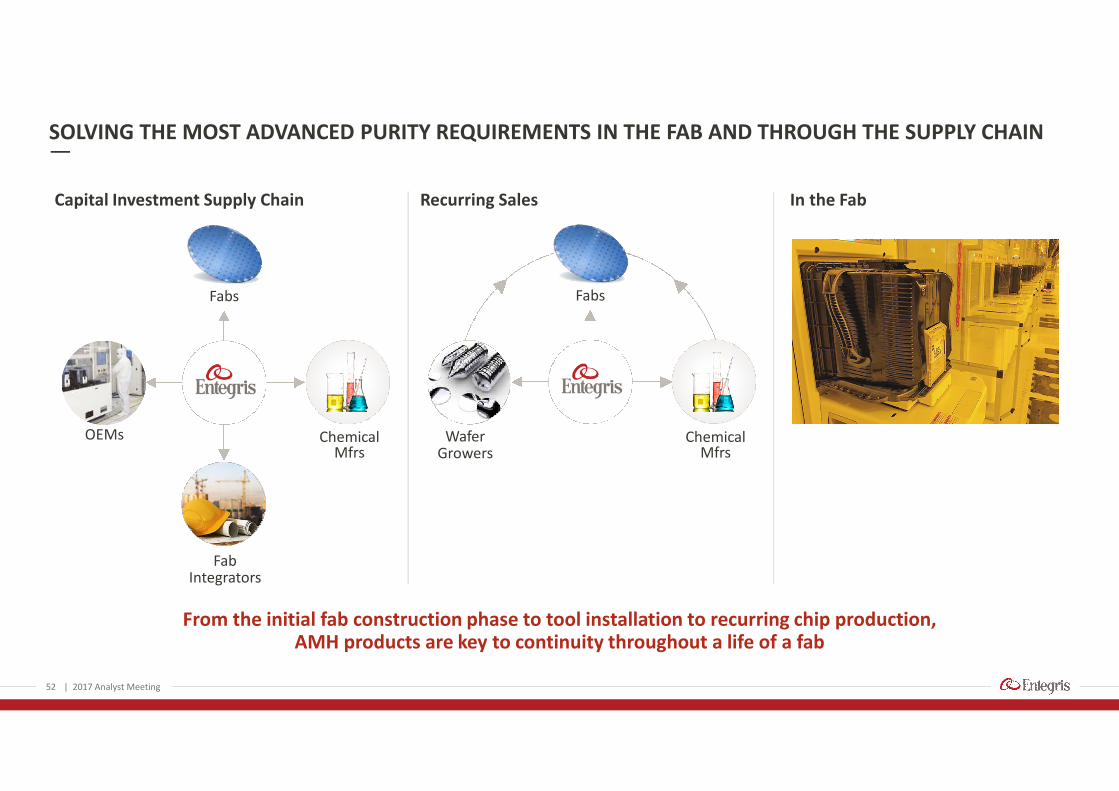
52
From the initial fab construction phase to tool installation to recurring chip production,AMH products are key to continuity throughout a life of a fab
SOLVING THE MOST ADVANCED PURITY REQUIREMENTS IN THE FAB AND THROUGH THE SUPPLY CHAIN
| 2017 Analyst Meeting
Capital Investment Supply Chain Recurring Sales In the Fab
OEMs ChemicalMfrs
Fabs
FabIntegrators
WaferGrowers
Fabs
ChemicalMfrs

53
COMPETING MARKET FORCES
Requirements driven byneed to increase efficiencies
and lower costs Advanced requirements forcritical materials handling
◦ 1X Process Node
◦ 3D NAND
◦ EUV lithography
◦ Precision dispense andconcentration control
◦ Less technical differentiation
◦ Supplier and customerconsolidation
◦ Regionalization ofsupply chains
| 2017 Analyst Meeting
Entegris is uniquely positioned to serve the entire range of the market – from the most advanced to the trailing edge
WaferSolutions
Containers
Fluidics
54
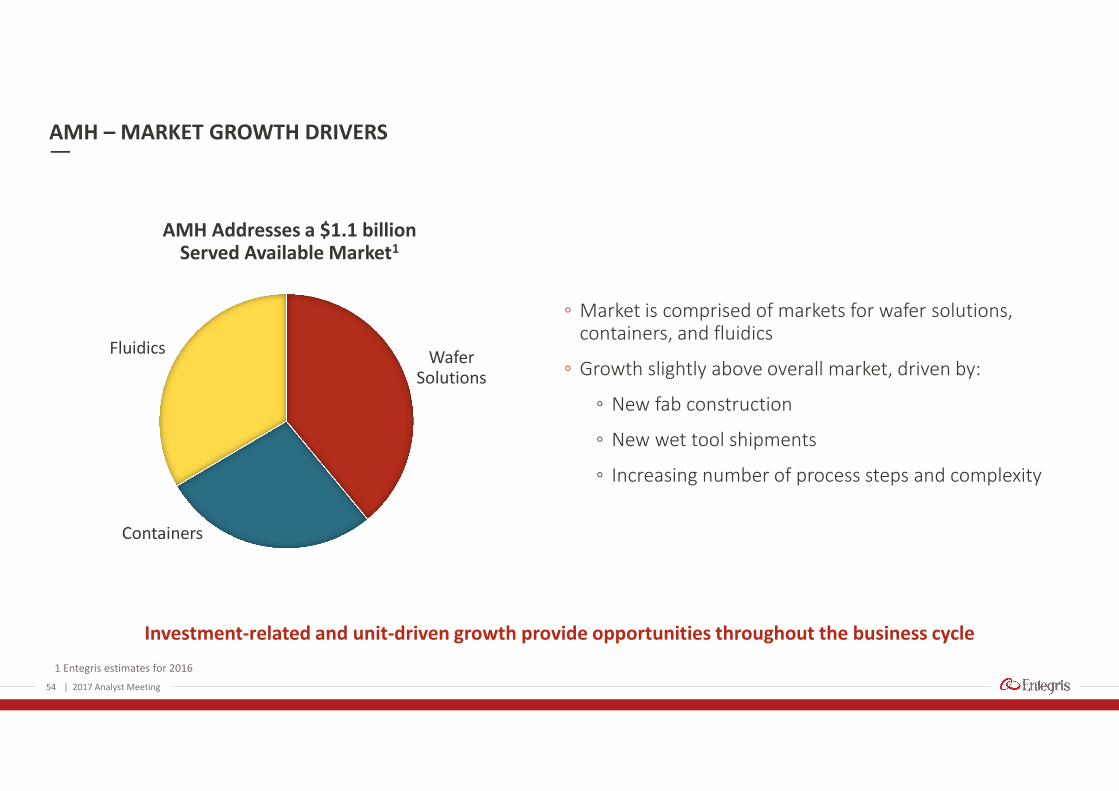
Investment-related and unit-driven growth provide opportunities throughout the business cycle
AMH – MARKET GROWTH DRIVERS
◦ Market is comprised of markets for wafer solutions,containers, and fluidics
◦ Growth slightly above overall market, driven by:
◦ New fab construction
◦ New wet tool shipments
◦ Increasing number of process steps and complexity
| 2017 Analyst Meeting
1 Entegris estimates for 2016
AMH Addresses a $1.1 billionServed Available Market1
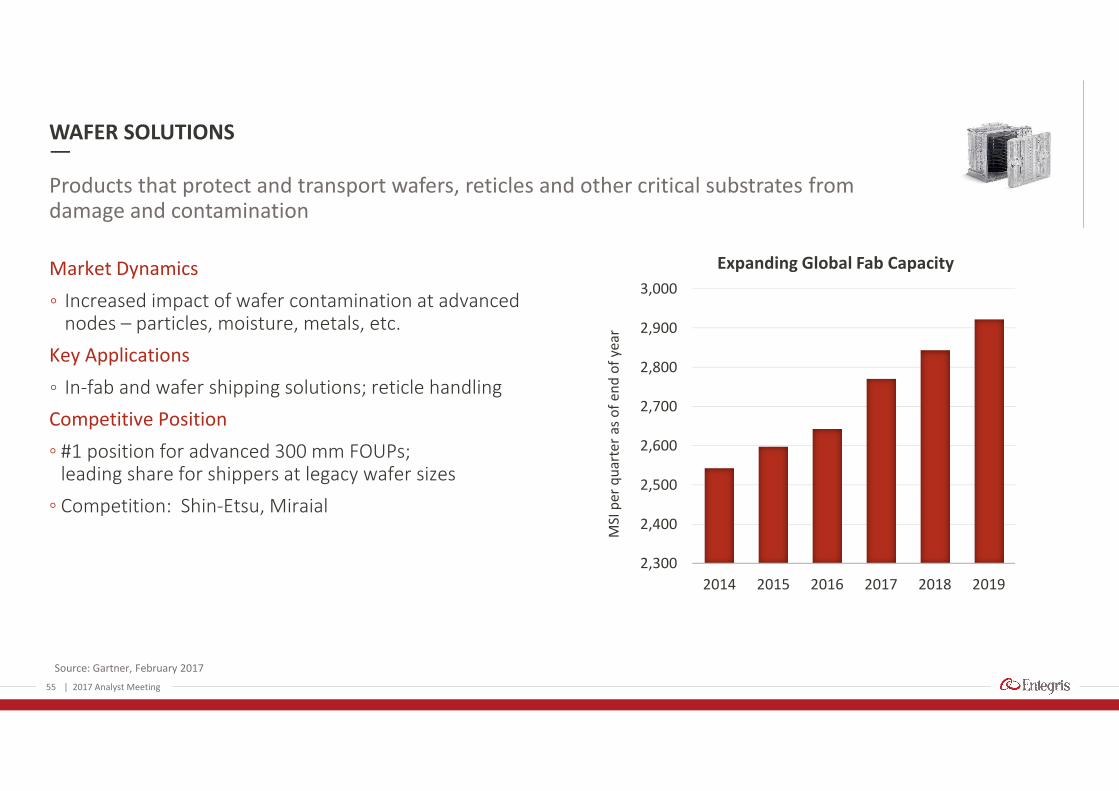
WAFER SOLUTIONS
55
Source: Gartner, February 2017
Products that protect and transport wafers, reticles and other critical substrates fromdamage and contamination
| 2017 Analyst Meeting
Market Dynamics
◦ Increased impact of wafer contamination at advancednodes – particles, moisture, metals, etc.
Key Applications
◦ In-fab and wafer shipping solutions; reticle handling
Competitive Position
◦ #1 position for advanced 300 mm FOUPs;leading share for shippers at legacy wafer sizes
◦ Competition: Shin-Etsu, Miraial
2,300
2,400
2,500
2,600
2,700
2,800
2,900
3,000
2014 2015 2016 2017 2018 2019
MSI
per
qu
arte
ras
of
end
of
year
Expanding Global Fab Capacity
0
100,000
200,000
300,000
400,000
500,000
600,000
700,000
800,000
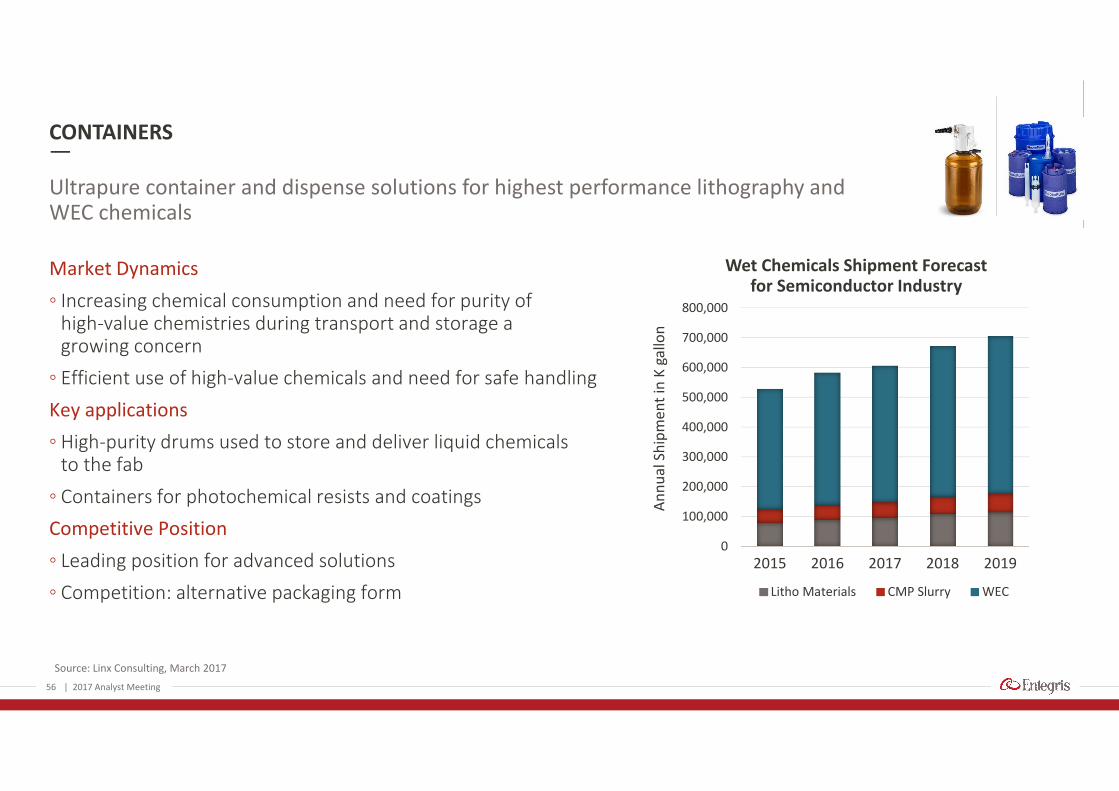
2015 2016 2017 2018 2019
An
nu
alSh
ipm
en
tin
Kga
llon
Wet Chemicals Shipment Forecastfor Semiconductor Industry
Litho Materials CMP Slurry WEC
CONTAINERS
56
Source: Linx Consulting, March 2017
Ultrapure container and dispense solutions for highest performance lithography andWEC chemicals
| 2017 Analyst Meeting
Market Dynamics
◦ Increasing chemical consumption and need for purity ofhigh-value chemistries during transport and storage agrowing concern
◦ Efficient use of high-value chemicals and need for safe handling
Key applications
◦ High-purity drums used to store and deliver liquid chemicalsto the fab
◦ Containers for photochemical resists and coatings
Competitive Position
◦ Leading position for advanced solutions
◦ Competition: alternative packaging form

FLUIDICS
57
Ultrapure fluid handling, measurement and control solutions
Market Dynamics
◦ Increasing requirements for process control,flow capacity and purity
◦ Increasing number of “wet” tools due to multi-patterning
◦ Fewer but larger fab facility projects
Key Applications
◦ Valves, fittings, tubing, flow controllers, sensors usedin the fab infrastructure or OEM tool
Competitive Position
◦ Fragmented, Entegris leads at high-end
◦ Competition: Parker Hannifin, Saint Gobain
| 2017 Analyst Meeting
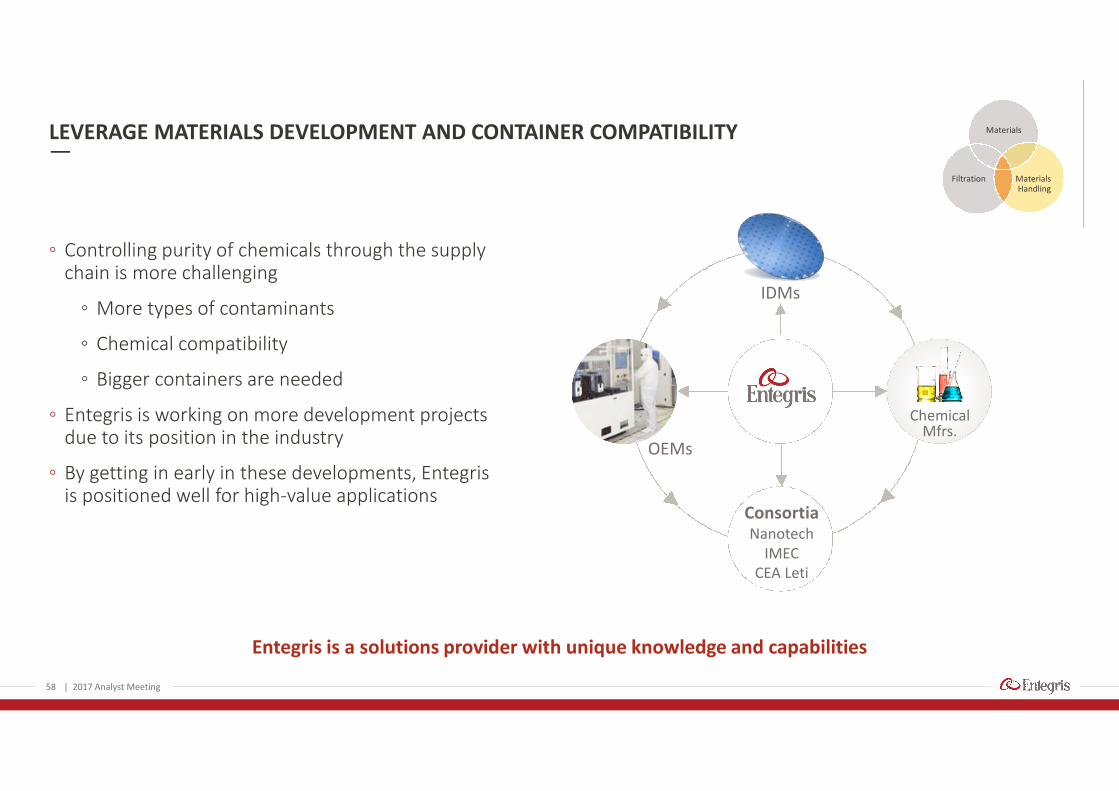
LEVERAGE MATERIALS DEVELOPMENT AND CONTAINER COMPATIBILITY
◦ Controlling purity of chemicals through the supplychain is more challenging
◦ More types of contaminants
◦ Chemical compatibility
◦ Bigger containers are needed
◦ Entegris is working on more development projectsdue to its position in the industry
◦ By getting in early in these developments, Entegrisis positioned well for high-value applications
58
Entegris is a solutions provider with unique knowledge and capabilities
| 2017 Analyst Meeting
Materials
MaterialsHandling
Filtration
ChemicalMfrs.
ConsortiaNanotech
IMECCEA Leti
IDMs
OEMs

LEVERAGING EXPERTISE INTO NEW MARKETS
◦ High-grade, gamma-stable fluoropolymers
◦ New single layer technology, and no binders,agents or adhesives
◦ Durable in frozen applications
◦ Universal material compatibility
To address the rapidly growing niches of $3 billion biopharma market for single-usetechnology, Entegris is leveraging its expertise in high-purity polymers
Entegris’ film provides an increased level of security and protection compared to traditional single-use bags
59
Entegris’ recently launched Aramus™new single-use bag for biologicsprocessing offers significantimprovements in purity
| 2017 Analyst Meeting
Materials
Filtration MaterialsHandling
60
1 2014 Pro-forma includes full year ATMI2 Non-GAAP Adjusted measure3 Market index defined as 45% Millions of Sq. Inches of Silicon produced (MSI) and 55% Wafer Fab Equipment (WFE); Data source is Gartner (WFE) and SEMI (MSI)
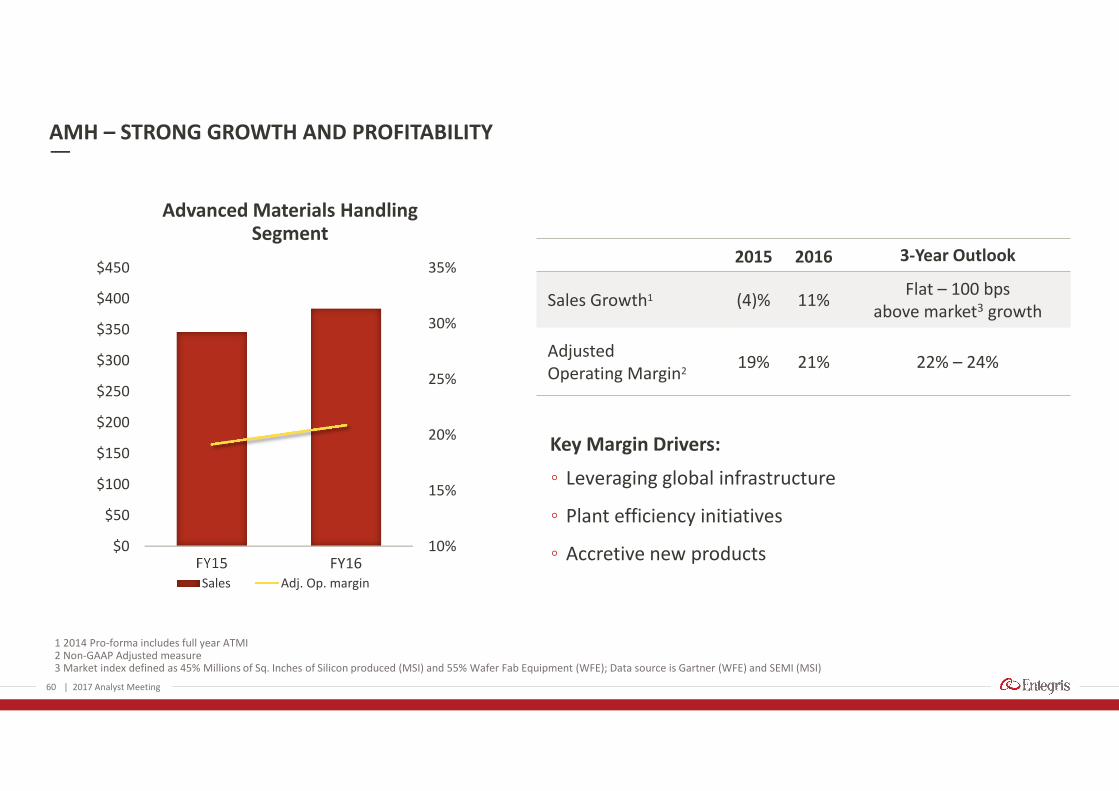
AMH – STRONG GROWTH AND PROFITABILITY
| 2017 Analyst Meeting
2015 2016 3-Year Outlook
Sales Growth1 (4)% 11%Flat – 100 bps
above market3 growth
AdjustedOperating Margin2
19% 21% 22% – 24%
Key Margin Drivers:
◦ Leveraging global infrastructure
◦ Plant efficiency initiatives
◦ Accretive new products10%
15%
20%
25%
30%
35%
$0
$50
$100
$150
$200
$250
$300
$350
$400
$450
FY15 FY16
Advanced Materials HandlingSegment
Sales Adj. Op. margin

2017 ANALYST MEETING
Specialty Chemicals andEngineered Materials
Stuart TisonSenior Vice President and General Manager
| 2017 Analyst Meeting61
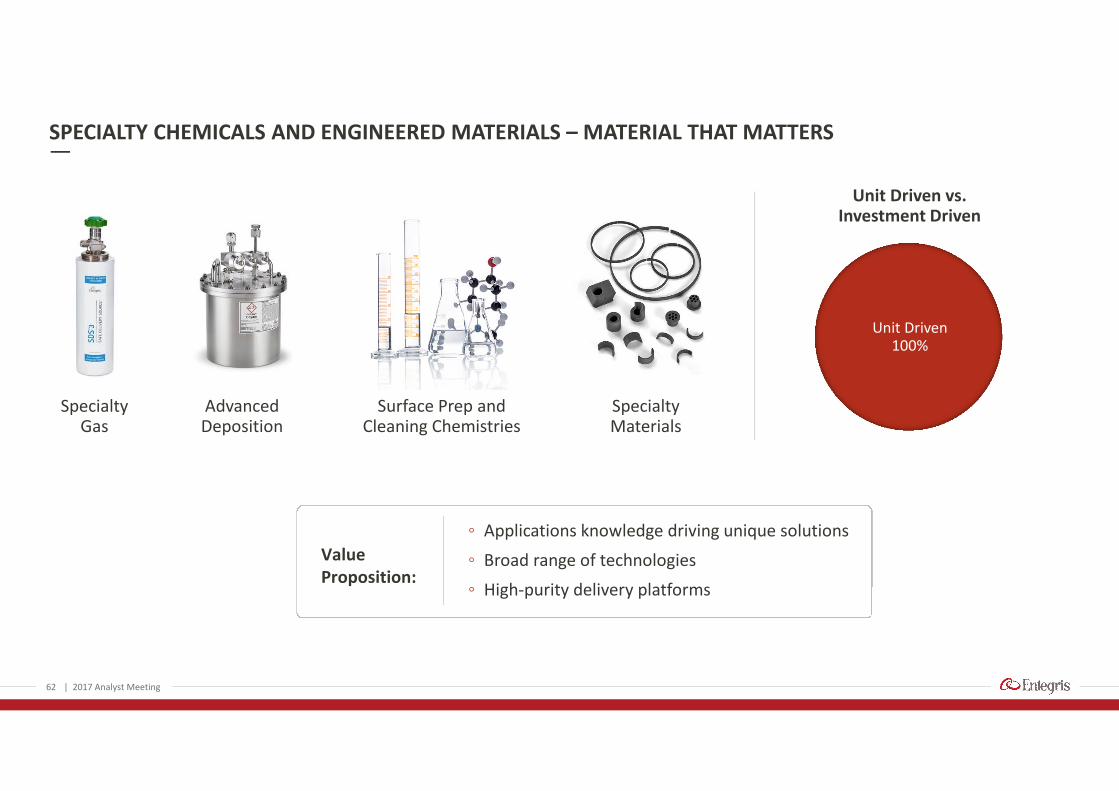
SpecialtyGas
AdvancedDeposition
Surface Prep andCleaning Chemistries
SpecialtyMaterials
62
SPECIALTY CHEMICALS AND ENGINEERED MATERIALS – MATERIAL THAT MATTERS
| 2017 Analyst Meeting
Unit Driven100%
Unit Driven vs.Investment Driven
◦ Applications knowledge driving unique solutions
◦ Broad range of technologies
◦ High-purity delivery platforms
ValueProposition:
beakers

63
SCEM supplies critical materials for expanding applications
SPECIALTY CHEMICALS AND ENGINEERED MATERIALS – MATERIAL THAT MATTERS
◦ Large materials market
◦ Advanced materials market growing faster thanindustry average
◦ Deposition
◦ Dopants
◦ Formulated cleans
◦ Wet etch formulation
◦ Advanced coatings
| 2017 Analyst Meeting
Cross Section of a Logicsemiconductor chip
Conductor(copper, tungsten)
TungstenContact Plug(tungsten, cobalt)
Pre-MetalDielectrics(arsine, phosphine)
Passivation(silicon compounds)
Intermetal/InterlayerDielectric(post etch cleans,silicon compounds)
Gate/JunctionRegion(hafnium, titanium,tantalum)
Entegris Provides Critical MaterialsThroughout the Entire Device

64
Critical materials are outpacing industry growth
SPECIALTY CHEMICALS AND ENGINEERED MATERIALS – MATERIAL THAT MATTERS
◦ Advanced material market is driven by:
◦ Node shrink
◦ 3D structures
◦ Memory growth
◦ Market leading position
◦ Integrated solutions
◦ Chemistries
◦ Delivery
◦ Purity
◦ Safety
| 2017 Analyst Meeting
1 Entegris estimates for 2016; Specialty Gas market refers to semiconductor implant applications
SCEM Addresses a $1.2 billionServed Available Market1
SpecialtyGas
AdvancedDeposition
Surface Prepand CleaningChemistries
SpecialtyMaterials
SPECIALTY GAS
65
Source: Linx Consulting, December 2016
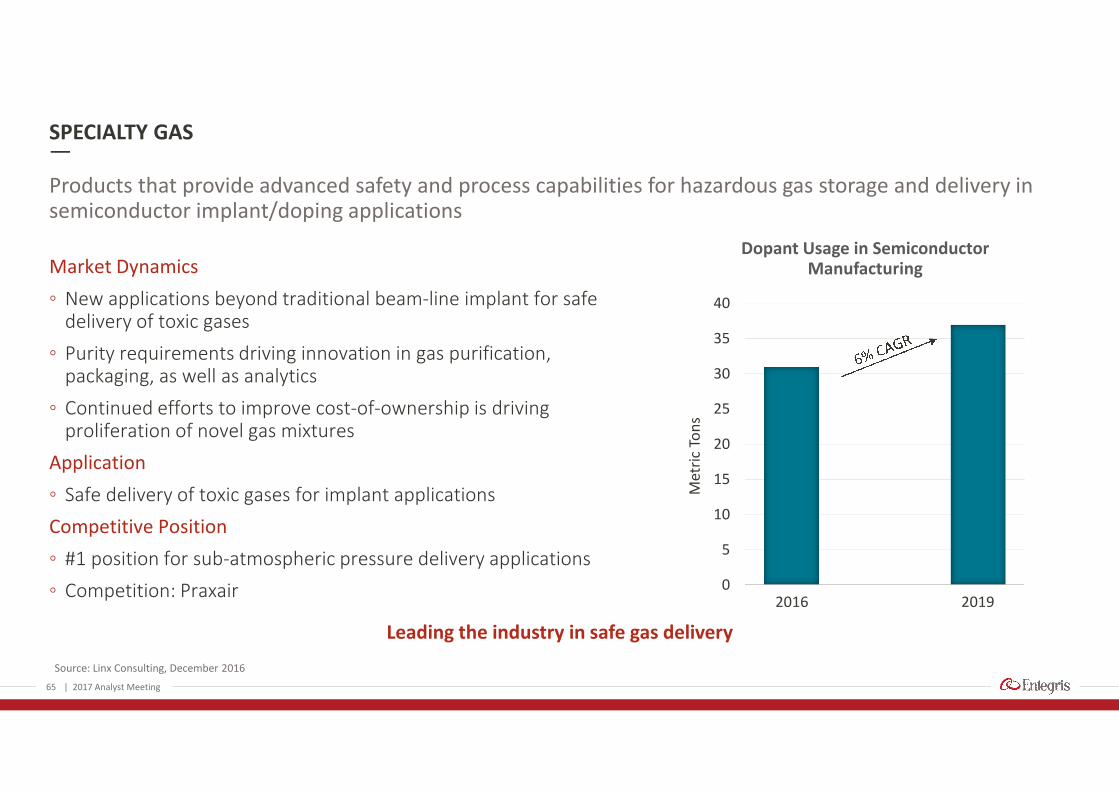
Leading the industry in safe gas delivery
Products that provide advanced safety and process capabilities for hazardous gas storage and delivery insemiconductor implant/doping applications
| 2017 Analyst Meeting
Market Dynamics
◦ New applications beyond traditional beam-line implant for safedelivery of toxic gases
◦ Purity requirements driving innovation in gas purification,packaging, as well as analytics
◦ Continued efforts to improve cost-of-ownership is drivingproliferation of novel gas mixtures
Application
◦ Safe delivery of toxic gases for implant applications
Competitive Position
◦ #1 position for sub-atmospheric pressure delivery applications
◦ Competition: Praxair
Dopant Usage in SemiconductorManufacturing
0
5
10
15
20
25
30
35
40
2016 2019
Met
ric
Ton
s

ADVANCED DEPOSITION MATERIALS
66
Source: Linx Consulting, December 2016
Leading position in fast growing solid precursors
Provides advanced liquid, gaseous and solid precursors and delivery systems used to form key elementsof a semiconductor device
| 2017 Analyst Meeting
Market Dynamics
◦ Increased use of new materials such a AlCl3 and Cobaltin memory and logic fabrication; driving advancedperformance
Applications
◦ New solid precursors for logic and memory metallization
◦ Increased use of novel materials for 3D structure integration
Competitive Position
◦ #1 position for solid material delivery; #2 for advanceddeposition precursors
◦ Competition: Versum, Praxair, Air Liquide $-
$500
$1,000
$1,500
$2,000
$2,500
$3,000
2014 2015 2016 2017 2018 2019 2020
Deposition Materials($ in millions)

SURFACE PREP AND CLEANING CHEMISTRIES
67
Provide advanced materials to prepare and integrate the surface of semiconductor wafers
Market Dynamics
◦ Use of 3D structures and materials driving theincreased need for formulated cleans in place ofcommodity chemistries
◦ Need for contamination removal while protectingagainst corrosion and structure damage
Application
◦ Post-CMP and post-etch cleans
Competitive Position
◦ #1 position for formulated clean chemistries
◦ Competition: Dow/DuPont, BASF
| 2017 Analyst Meeting
0
200,000
400,000
600,000
800,000
1,000,000
1,200,000
2014 2015 2016 2017 2018 2019
Total Industry-WideSemi Cleaning Steps
Formulated PCMP
Source: Linx Consulting, December 2016
Increasing critical cleans steps and contamination challenges aredriving need for advanced formulated cleaning chemistries
SPECIALTY MATERIALS
68
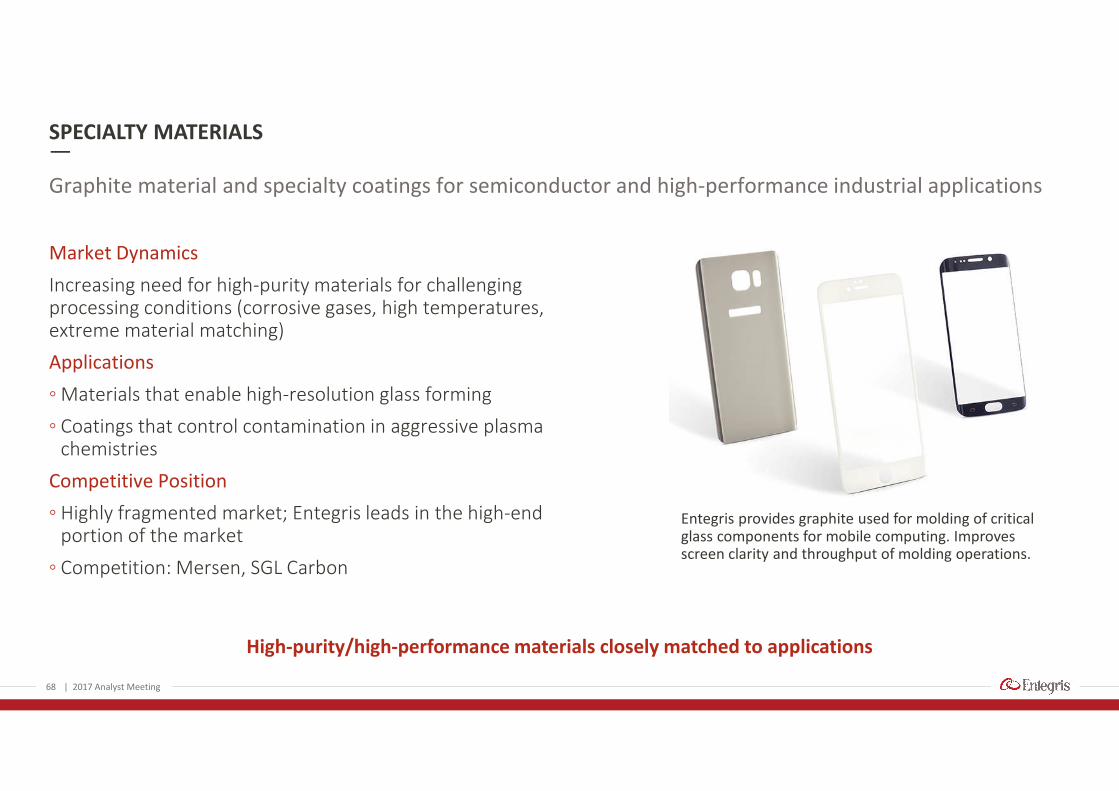
Graphite material and specialty coatings for semiconductor and high-performance industrial applications
Market Dynamics
Increasing need for high-purity materials for challengingprocessing conditions (corrosive gases, high temperatures,extreme material matching)
Applications
◦ Materials that enable high-resolution glass forming
◦ Coatings that control contamination in aggressive plasmachemistries
Competitive Position
◦ Highly fragmented market; Entegris leads in the high-endportion of the market
◦ Competition: Mersen, SGL Carbon
| 2017 Analyst Meeting
High-purity/high-performance materials closely matched to applications
Entegris provides graphite used for molding of criticalglass components for mobile computing. Improvesscreen clarity and throughput of molding operations.

KEY TRENDS AND DRIVERS #1: 3D NAND AND STRUCTURES
◦ Memory stacking leads to more process steps per squareinch of wafer surface
◦ Advanced deposition materials (titanium, cobalt, tungsten,aluminum) are required
◦ New advanced formulated chemistries are needed toremove contamination while preventing structural damage
◦ Advanced chamber coatings reduce particulates and metalcontaminants
69
Source: Diagram – Lam Research
SCEM’s materials help enable 3D NAND growth
| 2017 Analyst Meeting
Entegris provides critical materials used forassembling of the 3D NAND structure
MaterialsHandling
Materials
Filtration
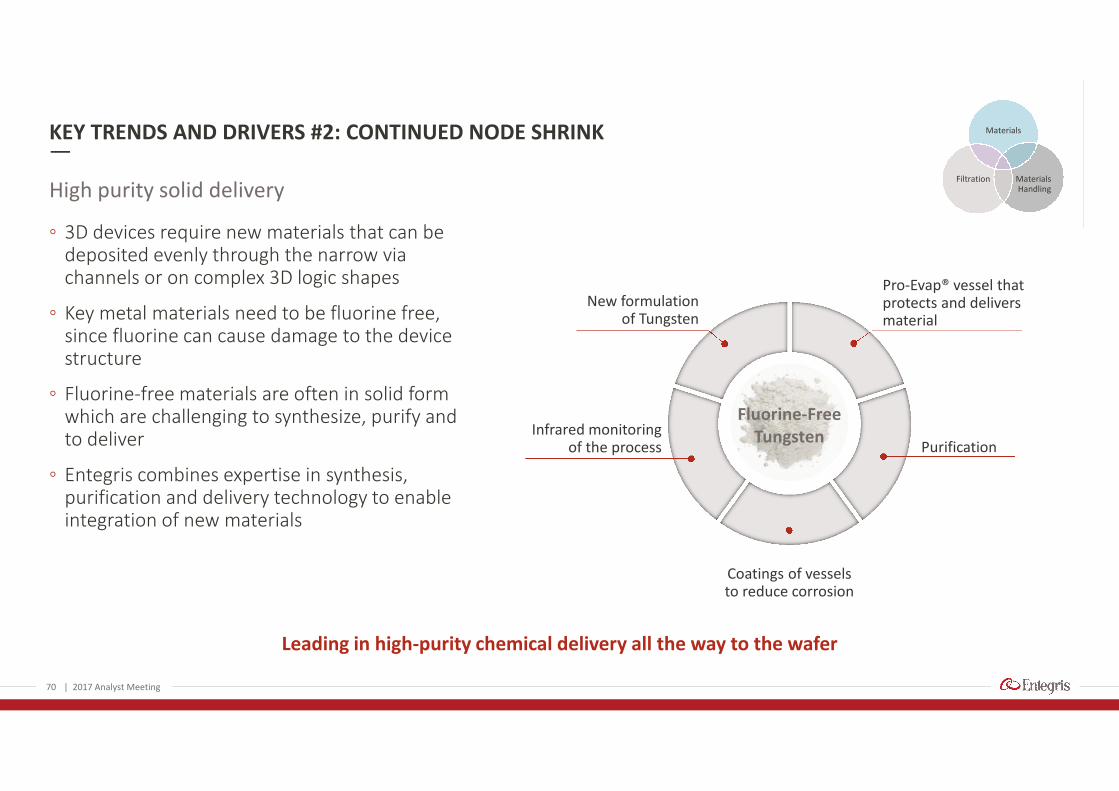
KEY TRENDS AND DRIVERS #2: CONTINUED NODE SHRINK
◦ 3D devices require new materials that can bedeposited evenly through the narrow viachannels or on complex 3D logic shapes
◦ Key metal materials need to be fluorine free,since fluorine can cause damage to the devicestructure
◦ Fluorine-free materials are often in solid formwhich are challenging to synthesize, purify andto deliver
◦ Entegris combines expertise in synthesis,purification and delivery technology to enableintegration of new materials
70
High purity solid delivery
| 2017 Analyst Meeting
Purification
Coatings of vesselsto reduce corrosion
Infrared monitoringof the process
New formulationof Tungsten
Pro-Evap® vessel thatprotects and deliversmaterial
Fluorine-FreeTungsten
Leading in high-purity chemical delivery all the way to the wafer
MaterialsHandling
Materials
Filtration

71
1 2014 Pro-forma includes full year ATMI2 Non-GAAP Adjusted measure3 Market index defined as 100% Millions of Sq. Inches of Silicon produced (MSI); Source – SEMI
SPECIALTY CHEMICALS AND ENGINEERED MATERIALS – MATERIAL THAT MATTERS
| 2017 Analyst Meeting
2015 2016 3-Year Outlook
Sales Growth1 7% 2%200 – 300 bps
above market3 growth
AdjustedOperating Margin2
24% 23% 25% – 27%
Key Margin Drivers:
◦ Sales and margin growth from new products
◦ Supply chain and operational efficiencies
◦ Improved factory utilization10%
15%
20%
25%
30%
35%
$0
$50
$100
$150
$200
$250
$300
$350
$400
$450
FY15 FY16
Specialty Chemicals andEngineered Materials Segment
Sales Adj. Op. margin
2017 ANALYST MEETING
Growing Cash Flow and Earnings
Greg GravesExecutive Vice President and CFO
| 2017 Analyst Meeting72

73 | 2017 Analyst Meeting
GOING FORWARD – CREATING VALUE FOR STAKEHOLDERS
Financial Objectives◦ Growth in excess of market (100-200 bps)◦ EBITDA margin expansion◦ Free cash flow◦ EPS growth (2x top line)
Investment Priorities
◦ R&D
◦ Internal capabilities
◦ Strategic acquisitions
Target Model
◦ Financial discipline
◦ Achieve target model

74 | 2017 Analyst Meeting
WELL POSITIONED TO CONTINUE TO PERFORM: DIVISION PORTFOLIO
High growth driven byincreasing contamination
control requirements
High investment to sustainsuperior growth and margins
High-profit growth engine
Mature market; gains atadvanced nodes, maintain share
in 200 mm and below
Limited investment beyondadvanced FOUPs and normal
equipment replacements
Cash generation
Advanced materials marketgrowing faster than overall
market
Targeted investment to drivegrowth in deposition materials,engineered materials, and next
generation gases
Focus growth in specificproduct lines
Growth Profile
Portfolio Position
Investment
Liquid and gas filtration, environmentProducts Wafer solutions, fluidics, containers Specialty gas, advanced deposition,surface prep and cleaning chemistries,
specialty materials
Sales Growth 200 – 400 bpsabove market growth
Flat – 100 bpsabove market growth
200 – 300 bpsabove market growth
MC AMH SCEM
Unit-Driven/Investment Split 79% / 21% 45% / 55% 100% / 0%

STRONG RELATIVE REVENUE GROWTH
75
1 Market index defined as 80% Millions of Sq. Inches of Silicon produced (MSI) and 20% Wafer Fab Equipment (WFE); Data source is Gartner (WFE) and SEMI (MSI)2 2014 Entegris Revenue Pro-forma including full year ATMI3 Fiscal year ended September
| 2017 Analyst Meeting
3.1%
0.7%
1.4%
4.5%
Market Company A Company B Entegris
3.9% 3.9%
-3.9%
Market Company A Company B Entegris
8.7%
F/X Impact
2016 vs. 2015 2014-2016 CAGR
1 23 3 3 3

PROFIT GROWTH PATH
76 | 2017 Analyst Meeting
2016 Non-GAAPAs Reported
Year ThreeIllustrative Model
Revenue $1,175 $1,360
Operating Income(EBITDA)
$208 $272 - $286
Operating margin 17.7% 20% - 21%
Interest expense ($38) ($33)
Operating EPS1 $0.94 $1.25 - $1.32
EBITDA margin2 22.4% 25% - 26%
Illustrative model – modest growth and operating leverage lead to $1.25+ per share by 2019
1 EPS assumes no other income/expense, no debt reduction, no share buybacks, no M&A, 25% combined tax rate and 143 million shares outstanding2 EBITDA margin assumes $65 million of depreciation expense
Assumptions
◦ Semi growth in excess of GDP: 1% ◦ Entegris growth in excess of market: 1%◦ GDP growth: 3%
5% top-line growth
3%+ margin improvement
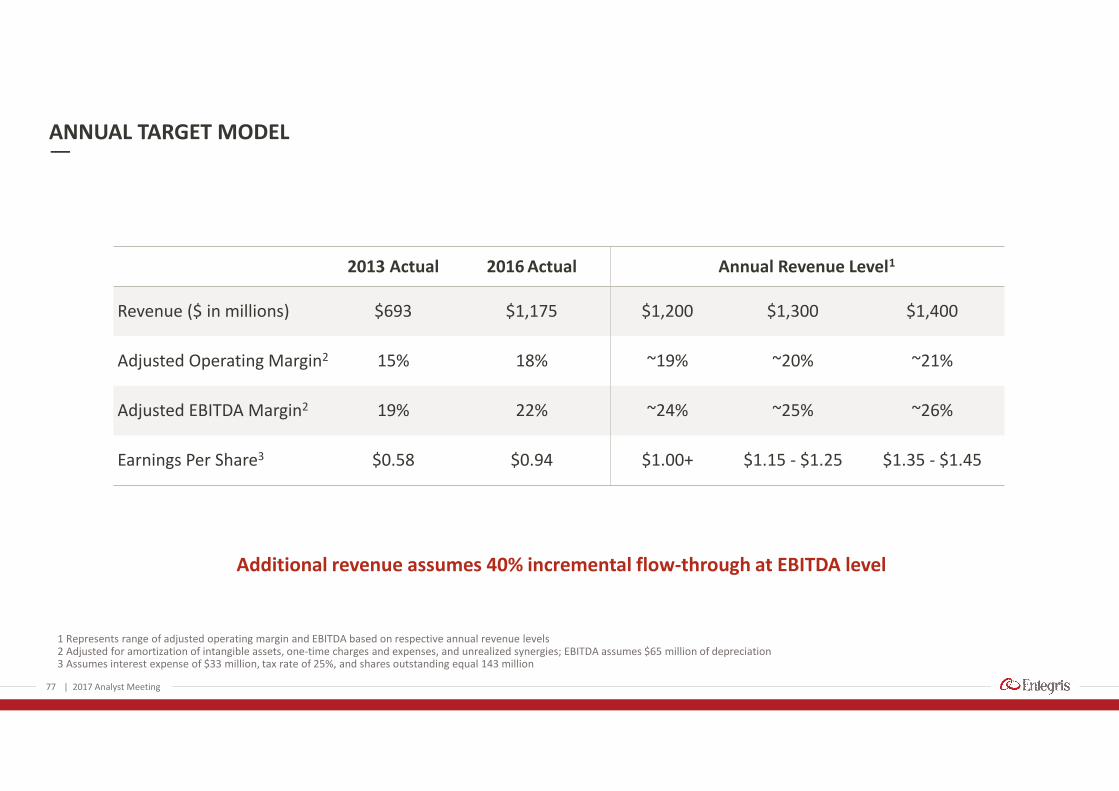
ANNUAL TARGET MODEL
77 | 2017 Analyst Meeting
1 Represents range of adjusted operating margin and EBITDA based on respective annual revenue levels2 Adjusted for amortization of intangible assets, one-time charges and expenses, and unrealized synergies; EBITDA assumes $65 million of depreciation3 Assumes interest expense of $33 million, tax rate of 25%, and shares outstanding equal 143 million
2013 Actual 2016 Actual Annual Revenue Level1
Revenue ($ in millions) $693 $1,175 $1,200 $1,300 $1,400
Adjusted Operating Margin2 15% 18% ~19% ~20% ~21%
Adjusted EBITDA Margin2 19% 22% ~24% ~25% ~26%
Earnings Per Share3 $0.58 $0.94 $1.00+ $1.15 - $1.25 $1.35 - $1.45
Additional revenue assumes 40% incremental flow-through at EBITDA level

$141 $132
$208
$232
$264
19.7%
19.1%
21.6% 21.5%22.4%
0
0.05
0.1
0.15
0.2
25
75
125
175
225
275
325
2012 2013 2014 2015 2016
Adjusted EBITDA1
$ in millions
PROJECTED CASH FROM OPERATIONS AND FREE CASH FLOW
78
By 2019, three-year cumulative cash from operations is estimated to reach almost $700 million
| 2017 Analyst Meeting
1 EBITDA adjusted for transaction and integration expenses
0
200
400
600
800
2017P 2018P 2019P
Cumulative Cash Flow From Operations$ in millions
Adjusted EBITDA EBITDA Margin
Operating Cash Flow
Capex Free Cash Flow

INVESTING FOR THE FUTURE
79
2017 Capital Plan: $80 – $90 million
| 2017 Analyst Meeting
Growth-related investments include:
◦ New filtration membrane manufacturing capability
◦ Advanced deposition materials capability
◦ Production equipment for advanced coatings
$72$65
2015 2016 2017P 2018P 2019P
Capital Investments$ in millions
$80-90 $80-90
$70-80

SOUND BALANCE SHEET WITH GROWING CASH BALANCE
80 | 2017 Analyst Meeting
February 2014 ratio is estimate at time of announcement of transaction, which closed on April 30, 2014
0.0
0.5
1.0
1.5
2.0
Feb. 2014 Dec. 2014 Dec. 2015 Dec. 2016
Net Leverage◦ As of 4Q16, $406 million of cash on balance sheet
◦ $140 million in the U.S.
◦ Long-term debt is comprised of:
◦ $360M of HY 6% notes
◦ $234M of term debt at LIBOR plus 225 bps
◦ Repaid $226 million of debt since June 2014;additional $100M of repayment expected in next12 months
◦ “Shape and Form” of debt provides maximumflexibility in all environments
◦ Repriced term loan March 2017
81
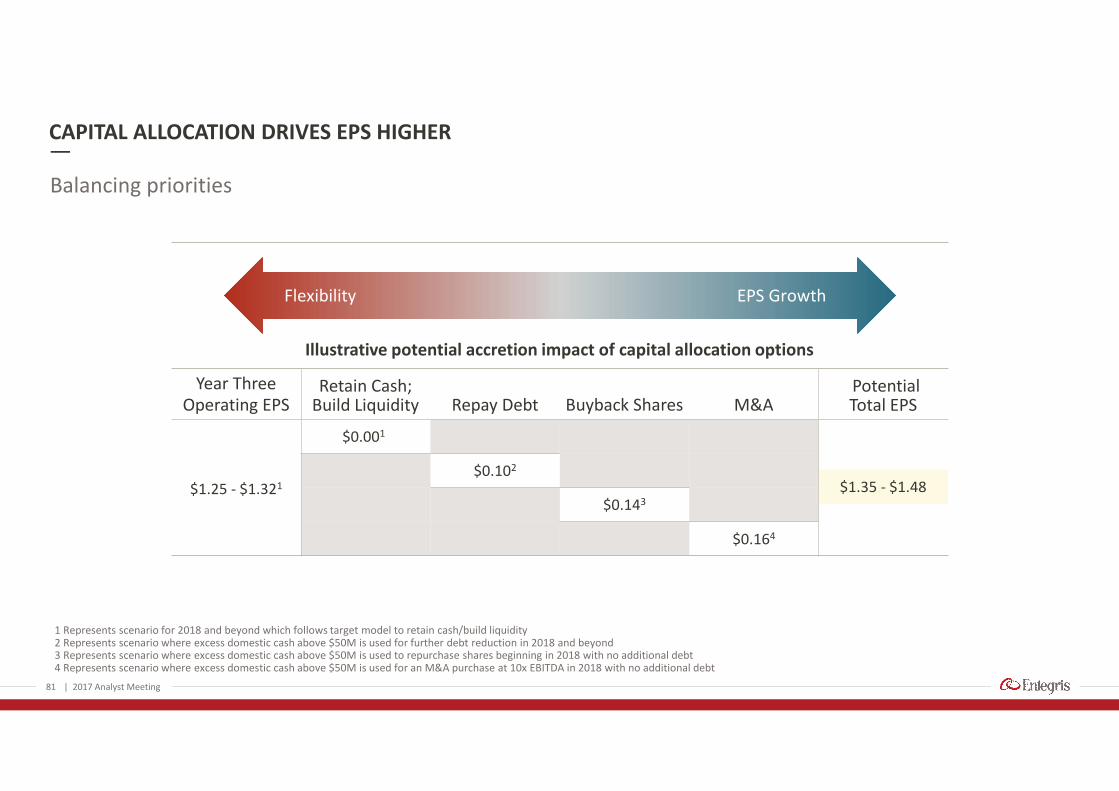
1 Represents scenario for 2018 and beyond which follows target model to retain cash/build liquidity2 Represents scenario where excess domestic cash above $50M is used for further debt reduction in 2018 and beyond3 Represents scenario where excess domestic cash above $50M is used to repurchase shares beginning in 2018 with no additional debt4 Represents scenario where excess domestic cash above $50M is used for an M&A purchase at 10x EBITDA in 2018 with no additional debt
CAPITAL ALLOCATION DRIVES EPS HIGHER
Balancing priorities
| 2017 Analyst Meeting
Flexibility EPS Growth
Illustrative potential accretion impact of capital allocation options
Year ThreeOperating EPS
Retain Cash;Build Liquidity Repay Debt Buyback Shares M&A
PotentialTotal EPS
$1.25 - $1.321
$0.001
$1.35 - $1.48$0.102
$0.143
$0.164
82
WHAT YOU SHOULD TAKE AWAY FROM TODAY’S MEETING
◦ Entegris is executing well with a path for continued top-line growth and bottom-line expansion
◦ The semiconductor industry is in a multi-year growth cycle
◦ Materials and materials purity/handling is a key enabler of this growth
◦ Entegris is well-positioned to benefit as a leading supplier of materials, filtration and advancedmaterials handling solutions
◦ We have an excellent platform on which to expand through strategic M&A
| 2017 Analyst Meeting
83
Q&A
| 2017 Analyst Meeting

Entegris®, the Entegris Rings Design™ and Pure Advantage™ are trademarks of Entegris, Inc. ©2017 Entegris, Inc. All rights reserved.
84 | 2017 Analyst Meeting

85
APPENDIX
| 2017 Analyst Meeting

86
GAAP SEGMENT TREND DATA
Q115 Q215 Q315 Q415 Q116 Q216 Q316 Q416
Sales
AMH 87,529$ 90,847$ 86,483$ 81,567$ 88,298$ 99,686$ 97,460$ 98,840$
SCEM 99,897 110,569 105,285 103,127 101,107 111,782 104,494 110,945
MC 75,947 79,293 78,485 82,092 77,619 91,584 94,738 98,717
Total Sales 263,373$ 280,709$ 270,253$ 266,786$ 267,024$ 303,052$ 296,692$ 308,502$
Segment Profit
AMH 19,679$ 20,860$ 15,786$ 10,094$ 18,911$ 22,519$ 15,378$ 16,644$
SCEM 22,010 30,826 23,316 24,218 22,416 28,914 18,811 25,919
MC 19,874 20,605 21,926 20,671 18,140 28,566 31,617 31,719
Total Segment Profit 61,563$ 72,291$ 61,028$ 54,983$ 59,467$ 79,999$ 65,806$ 74,282$
| 2017 Analyst Meeting

NON-GAAP SEGMENT TREND DATA
87 | 2017 Analyst Meeting
1 Adjusted segment profit for AMH for Q316 excludes charges for impairment of equipment and severance related to organizational realignment of $5,826 and $969, respectively.2 Adjusted segment profit for SCEM for Q316 excludes charges for severance related to organizational realignment of $699.3 Adjusted segment profit for MC for Q316 excludes charges for severance related to organizational realignment of $737.
Q115 Q215 Q315 Q415 Q116 Q216 Q316 Q416
Sales
AMH 87,529$ 90,847$ 86,483$ 81,567$ 88,298$ 99,686$ 97,460$ 98,840$
SCEM 99,897 110,569 105,285 103,127 101,107 111,782 104,494 110,945
MC 75,947 79,293 78,485 82,092 77,619 91,584 94,738 98,717
Total Sales 263,373$ 280,709$ 270,253$ 266,786$ 267,024$ 303,052$ 296,692$ 308,502$
Adjusted Segment Profit
AMH1
19,679$ 20,860$ 15,786$ 10,094$ 18,911$ 22,519$ 22,173$ 16,644$
SCEM2
22,010 30,826 23,316 24,218 22,416 28,914 19,510 25,919
MC3
19,874 20,605 21,926 20,671 18,140 28,566 32,354 31,719
Total Adj. Segment Profit 61,563$ 72,291$ 61,028$ 54,983$ 59,467$ 79,999$ 74,037$ 74,282$
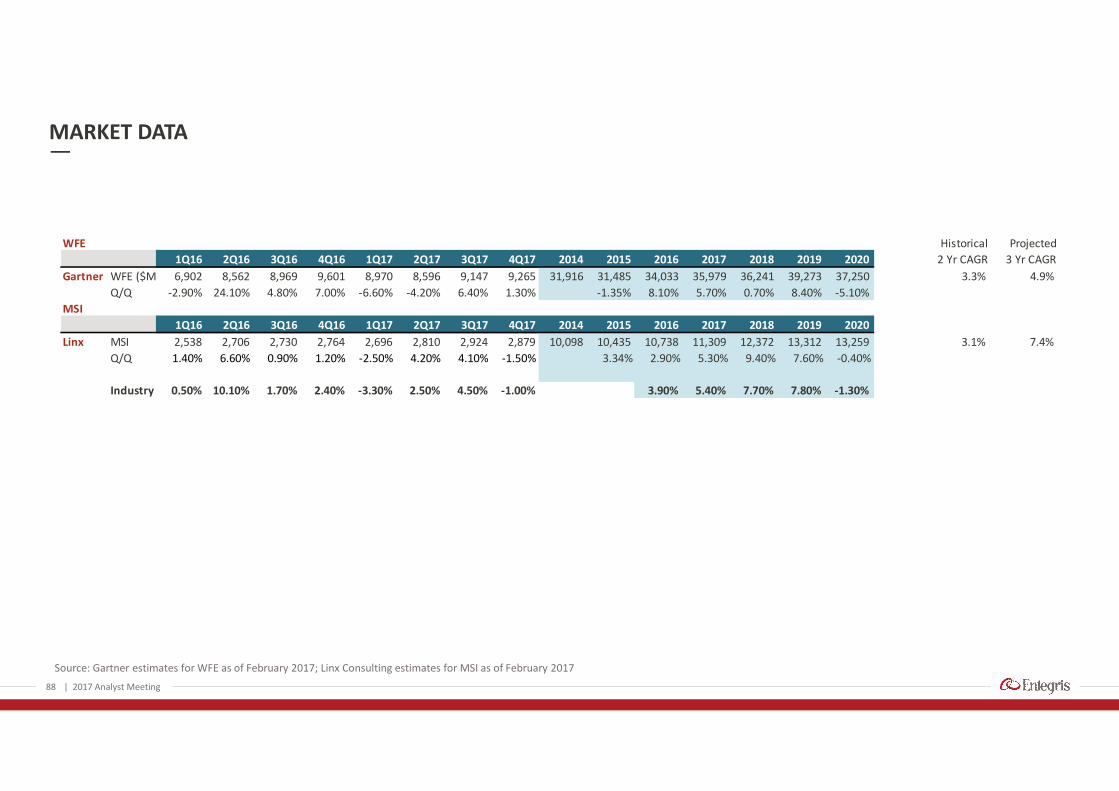
MARKET DATA
88 | 2017 Analyst Meeting
Source: Gartner estimates for WFE as of February 2017; Linx Consulting estimates for MSI as of February 2017
WFE Historical Projected
1Q16 2Q16 3Q16 4Q16 1Q17 2Q17 3Q17 4Q17 2014 2015 2016 2017 2018 2019 2020 2 Yr CAGR 3 Yr CAGR
Gartner WFE ($M) 6,902 8,562 8,969 9,601 8,970 8,596 9,147 9,265 31,916 31,485 34,033 35,979 36,241 39,273 37,250 3.3% 4.9%
Q/Q -2.90% 24.10% 4.80% 7.00% -6.60% -4.20% 6.40% 1.30% -1.35% 8.10% 5.70% 0.70% 8.40% -5.10%
MSI
1Q16 2Q16 3Q16 4Q16 1Q17 2Q17 3Q17 4Q17 2014 2015 2016 2017 2018 2019 2020
Linx MSI 2,538 2,706 2,730 2,764 2,696 2,810 2,924 2,879 10,098 10,435 10,738 11,309 12,372 13,312 13,259 3.1% 7.4%
Q/Q 1.40% 6.60% 0.90% 1.20% -2.50% 4.20% 4.10% -1.50% 3.34% 2.90% 5.30% 9.40% 7.60% -0.40%
Industry Mix0.50% 10.10% 1.70% 2.40% -3.30% 2.50% 4.50% -1.00% 3.90% 5.40% 7.70% 7.80% -1.30%