enrollment snapshot of radiography, radiation therapy and
TRANSCRIPT

Enrollment Snapshot of Radiography, Radiation Therapy and Nuclear Medicine
Technology Programs ─ 2012
A Nationwide Survey of Program Directors Conducted by the American Society of Radiologic Technologists
January 2013
©2012 ASRT. All rights reserved.
Reproduction in any form is forbidden without written permission from publisher.

2
©2012 ASRT. All rights reserved. Enrollment Snapshot Survey 2012
Table of Contents Executive Summary ............................................................................................................................................. 3
Demographics ...................................................................................................................................................... 6
Indicate your program type. ................................................................................................................................................................................................ 6
What is your primary place of employment? ................................................................................................................................................................. 6
What percent of the classes in your curriculum can be taken online? ................................................................................................................... 7
What is the terminal degree earned by your graduates? ........................................................................................................................................... 7
If yours is a certificate program with an articulation agreement, when do your graduates receive their associate degree? .............. 8
In what country is your program located? ...................................................................................................................................................................... 8
In what region is your program located? ........................................................................................................................................................................ 9
2012 Enrollment Analysis ........................................................................................................................................ 10
How many students entered your program? ...............................................................................................................................................................10
Is your program currently at full enrollment? ..............................................................................................................................................................11
If you are not at full enrollment, how many additional students could be accommodated by your program? .....................................12
How many qualified students did you turn away this fall? ......................................................................................................................................12
Attrition rate ...........................................................................................................................................................................................................................12
Do you plan any changes related to enrollment?.......................................................................................................................................................13
How viable is your program over the next few years? ..............................................................................................................................................14
If your program is closing, how many more years will it continue to operate, including this academic year? .......................................14
2012 USA and Canada Enrollment Comparison ................................................................................................ 15
Radiography .....................................................................................................................................................................................................................15
Radiation Therapy ...........................................................................................................................................................................................................15
Nuclear Medicine Technology ....................................................................................................................................................................................15
Longitudinal Enrollment Trends 2001-2012 ..................................................................................................... 16
Radiography ...........................................................................................................................................................................................................................16
Radiation Therapy .................................................................................................................................................................................................................17
Nuclear Medicine Technology ..........................................................................................................................................................................................18
Number of ARRT-Recognized Programs ........................................................................................................................................................................19
Job Placement of Graduates .............................................................................................................................. 20
Radiography ...........................................................................................................................................................................................................................20
Radiation Therapy .................................................................................................................................................................................................................20
Nuclear Medicine Technology ..........................................................................................................................................................................................20
For those students who haven’t been able to find employment after graduation, what do you believe is the primary reason? ....21
Imaging Technology .......................................................................................................................................... 22
Which of the following imaging technologies are used at your clinical sites? ..................................................................................................22
Clinical sites that use Film-Screen only ....................................................................................................................................................................22
Which of the following technologies are used in your on-campus lab? .............................................................................................................23
On-campus labs that use Film-Screen only .............................................................................................................................................................23
Appendix A. Survey Instruments and Invitation Letter (Please contact the ASRT for a copy.) Appendix B. Verbatim responses (Please contact the ASRT for a copy.)

3
©2012 ASRT. All rights reserved. Enrollment Snapshot Survey 2012
Executive Summary
In October 2012, an invitation to complete an online questionnaire was sent via e-mail to each of the 1,007 radiography, radiation therapy, and nuclear medicine technology programs listed by the American Registry of Radiologic Technologists (ARRT).1 At the close of the survey on October 31, 2011, a total of 606 responses had been received, yielding an overall response rate of 60.2%.
Return Population
Percent Sampled
Margin of Error at the 95% Level
R 471 750 62.8% ±2.8%
T 59 122 48.4% ±9.2%
NMT 76 134 56.7%
±7.4%
Overall 606 1,006 60.2% ±2.5%
This report summarizes findings regarding radiologic sciences enrollment based on the responses from program directors. Longitudinal Enrollment Trends 2001-2012 This is the 13th in a series of annual reports from the ASRT on class enrollments in educational programs for radiographers, radiation therapists, and nuclear medicine technologists. The current report includes a section that summarizes the last 13 years of enrollment trends. See Pages 14-17 for a review of those findings. Demographic Analysis
• Respondents to the survey were more likely to
work at a community college than any other
type of institution; 40.3% of respondents work
at 2-year institutions, almost double the
amount who work at medical centers (26.4%)
or 4-year institutions (22.6%). Relatively few
respondents work in other settings: 5.8% work
at technical colleges, 4.5% work at for-profit
schools, and 0.5% work at another type of
institution.
• A sizable majority (77.7%) of the respondents
are in radiography programs, 12.5% of the
respondents are in nuclear medicine programs
1 American Registry of Radiologic Technologists. ARRT-recognized
educational programs. www.arrt.org/index.html?content=http://www.arrt.org/nd/listOfSchools.ndm/listSchools&iframe=yes. Accessed September 2012.
and the remaining 9.7% are in radiation
therapy programs.
• The overwhelming majority of the
respondents’ programs are located in the
United States (96.4%). Of the remaining
programs, 3.5% are located in Canada and
0.2% in Australia.
• Among the respondents whose programs are
located in the United States, the South Atlantic
region accounts for 20.9% of programs, while
the East North Central region accounts for
19.2%. Only 6.1% of the respondents’
programs are located in the Pacific region and
only 5.1% are in New England.
2012 Enrollment Trends
• Radiography programs had a mean number of
20.9 students enter their program in 2012,
down by 1.0 students from 2011. This
produces an estimate of 15,675 students
across all ARRT-recognized programs, down
from 16,454 in 2011.
• Radiation therapy programs had a mean
number of 11.5 students enter their program
in 2012, up by 1.7 students from a mean of 9.8
students entering each program in 2011. This
produced an estimate of 1,403 students
entering ARRT-recognized programs in 2012,
up from 1,204 in 2011.
• Nuclear medicine technology programs had a
mean of 10.5 students enroll in their program
in 2012, up by 1.7 students from 2011. This
produced an estimate of 1,407 students
enrolling in ARRT-recognized programs in
2012, up from 1,175 in 2011.
2012 Student Capacity
• Among radiography programs, 55.1% are at
full enrollment; 46.6% of radiation therapy
programs are at capacity. 27.0% of nuclear
medicine programs are at capacity.
• Among those programs that are not at full
enrollment, the mean number of additional
students who could be accommodated is 8.3
for radiography, 6.6 for radiation therapy and
8.7 for nuclear medicine.

4
©2012 ASRT. All rights reserved. Enrollment Snapshot Survey 2012
o This produces an estimate of 2,795
additional students for all radiography
programs, 430 additional students for
all radiation therapy programs and 851
additional students for all nuclear
medicine programs.
• The mean number of qualified students turned
away by radiography programs was 39.5. On
average, radiation therapy programs turned
away 14.7 qualified students while nuclear
medicine programs turned away an average of
6.4 qualified students.
o These numbers produce an estimate of
16,323 qualified students turned away
by radiography programs, 836
qualified students turned away by
radiation therapy programs and 232
qualified students turned down by
nuclear medicine programs.
Near-Term Changes Overall, more program directors plan to increase their enrollment than to decrease it. In the aggregate, 8.0% of program directors plan to increase enrollment,
while 5.9% plan a decrease.
• In radiography, 5.2% of program directors plan to increase enrollment while 5.8% plan to decrease their enrollment.
• In radiation therapy, 19.0% plan to increase enrollment while 5.2% plan a decrease.
• In nuclear medicine technology, 17.6% plan to increase enrollment while 6.8% plan a decrease.
Most programs (97.0%) say they are viable over the next few years, while 3.0% say that they are either likely to close or will definitely be closing.
• In radiography, 97.4% of programs said they would either definitely continue to operate or would most likely continue to operate, while 2.6% said they are either likely to close or would definitely be closing.
• Among radiation therapy programs, 98.3% expect to remain in operation while 1.7% expect to close.
• Among nuclear medicine programs, 93.3% of programs expect to continue operating, while 6.6% expect to close.
• Among the programs expecting to stay in operation, 79.7% of radiography programs,
72.4% of radiation therapy programs and 64.0% of nuclear medicine programs were certain that they would continue to operate over the next several years.
Job Placement of Graduates
• In radiography, 84.8% of graduates from the
class of 2011 were able to find employment in
their field within 6 months of graduation;
86.1% of 2011 graduates from radiation
therapy programs found employment; 57.2%
of 2011 graduates in nuclear medicine found
employment.
• These placement rates represent a 4.8%
increase from 2010 for radiography, a 4.1%
increase from 2010 for radiation therapy, and a
0.3% decline from 2010 for nuclear medicine.
• When asked why they thought those students
who were unable to find employment were
having difficulty, the majority of respondents
cited economic considerations: 34.3% said that
there were too many graduates in relation to
openings, 19.3% believed that facilities cutting
back on positions had an adverse effect, 14.9%
said that managers were not filling openings,
and 12.5% believed that sluggishness in the
labor market is due to the current workforce
delaying their retirement.
Academics and Curriculum
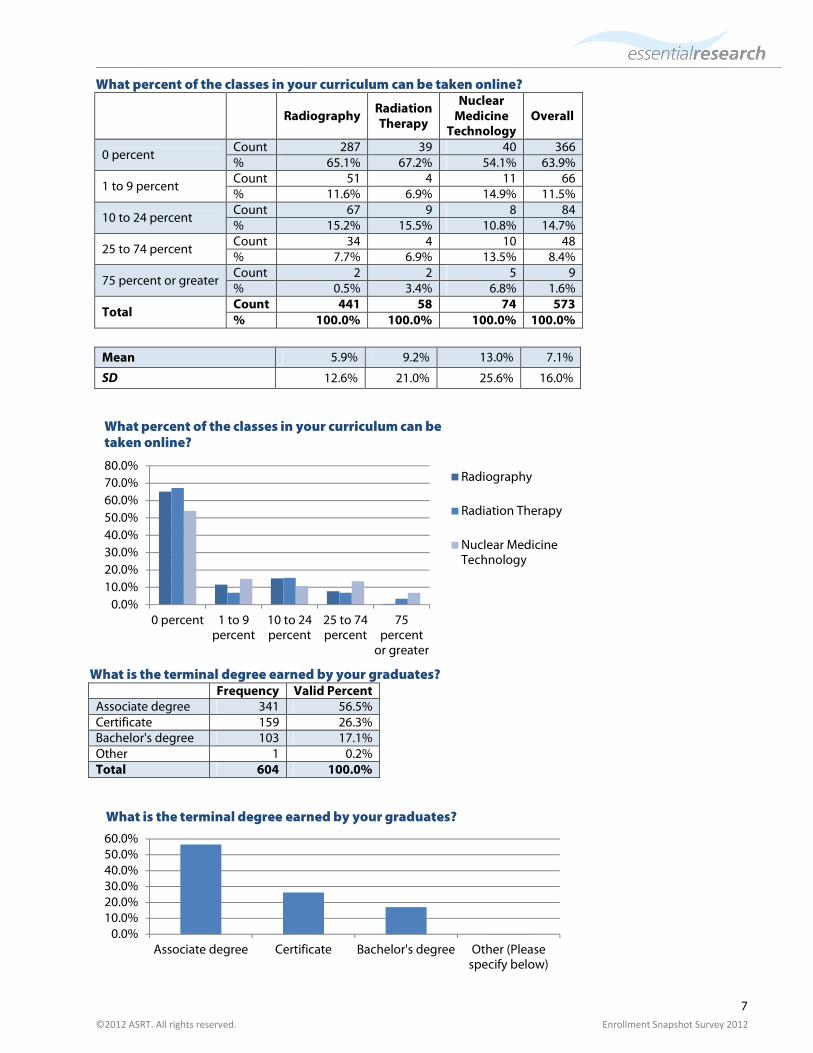
• For the majority (56.5%) of programs
responding to the survey, the terminal degree
earned by graduates is an associate degree; of
the remaining programs, 26.3% grant a
certificate and 17.1% grant a bachelor’s
degree.
• When asked which imaging technologies were
used at clinical sites, 93.0% said they use DR
(cassetteless) technology, 86.2% use CR
(cassette-based) technology and 23.6% use
film/screen.
• When asked which imaging technologies were
used in their on-campus lab, 60.3% said they
use CR (cassette-based), 36.7% use film/screen,
30.5% do not have an on-campus lab and
21.6% use DR (cassetteless) technology.
• The majority of programs across all disciplines
do not offer coursework online, with 63.9% of
5
©2012 ASRT. All rights reserved. Enrollment Snapshot Survey 2012
all programs offering no online
coursework;10.0% of programs offer at least
25% of their content online.
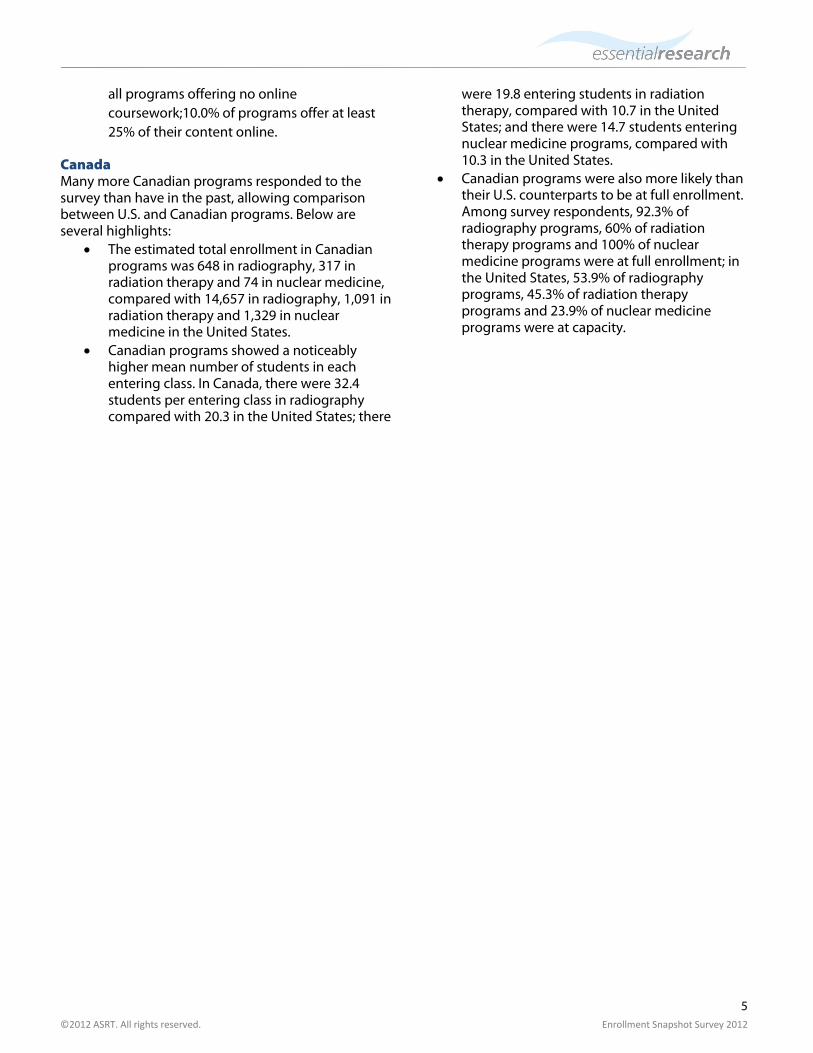
Canada Many more Canadian programs responded to the survey than have in the past, allowing comparison between U.S. and Canadian programs. Below are several highlights:
• The estimated total enrollment in Canadian programs was 648 in radiography, 317 in radiation therapy and 74 in nuclear medicine, compared with 14,657 in radiography, 1,091 in radiation therapy and 1,329 in nuclear medicine in the United States.
• Canadian programs showed a noticeably higher mean number of students in each entering class. In Canada, there were 32.4 students per entering class in radiography compared with 20.3 in the United States; there
were 19.8 entering students in radiation therapy, compared with 10.7 in the United States; and there were 14.7 students entering nuclear medicine programs, compared with 10.3 in the United States.
• Canadian programs were also more likely than their U.S. counterparts to be at full enrollment. Among survey respondents, 92.3% of radiography programs, 60% of radiation therapy programs and 100% of nuclear medicine programs were at full enrollment; in the United States, 53.9% of radiography programs, 45.3% of radiation therapy programs and 23.9% of nuclear medicine programs were at capacity.

6
©2012 ASRT. All rights reserved. Enrollment Snapshot Survey 2012
Demographics Indicate your program type.
Frequency Valid
Percent Population Distribution
Sample Return as a Percent of Population
Radiography 471 77.7% 750 62.8%
Radiation Therapy 59 9.7% 122 48.4%
Nuclear Medicine Technology
76 12.5% 134 56.7%
Total 606 100.0% 1005 60.3%
What is your primary place of employment?
Frequency Valid Percent
Community college or two-year institution 244 40.3%
Medical center 160 26.4%
University or four-year institution 137 22.6%
Technical College 35 5.8%
For-profit school 27 4.5%
Other 3 0.5%
Total 606 100.0%
0.0%
5.0%
10.0%
15.0%
20.0%
25.0%
30.0%
35.0%
40.0%
45.0%
Communitycollege ortwo-yearinstitution
Medicalcenter
Universityor four-yearinstitution
TechnicalCollege
For-profitschool
Other(Pleasespecifybelow)
What is your primary place of employment?
0.0%
10.0%
20.0%
30.0%
40.0%
50.0%
60.0%
70.0%
80.0%
90.0%
Radiography Radiation Therapy Nuclear MedicineTechnology
Indicate your program type.
7
©2012 ASRT. All rights reserved. Enrollment Snapshot Survey 2012
What percent of the classes in your curriculum can be taken online?
Radiography Radiation Therapy
Nuclear Medicine
Technology Overall
0 percent Count 287 39 40 366
% 65.1% 67.2% 54.1% 63.9%
1 to 9 percent Count 51 4 11 66
% 11.6% 6.9% 14.9% 11.5%
10 to 24 percent Count 67 9 8 84
% 15.2% 15.5% 10.8% 14.7%
25 to 74 percent Count 34 4 10 48
% 7.7% 6.9% 13.5% 8.4%
75 percent or greater Count 2 2 5 9
% 0.5% 3.4% 6.8% 1.6%
Total Count 441 58 74 573
% 100.0% 100.0% 100.0% 100.0%
Mean 5.9% 9.2% 13.0% 7.1%
SD 12.6% 21.0% 25.6% 16.0%
What is the terminal degree earned by your graduates? Frequency Valid Percent
Associate degree 341 56.5%
Certificate 159 26.3%
Bachelor's degree 103 17.1%
Other 1 0.2%
Total 604 100.0%
0.0%
10.0%
20.0%
30.0%
40.0%
50.0%
60.0%
70.0%
80.0%
0 percent 1 to 9percent
10 to 24percent
25 to 74percent
75percentor greater
What percent of the classes in your curriculum can be taken online?
Radiography
Radiation Therapy
Nuclear MedicineTechnology
0.0%
10.0%
20.0%
30.0%
40.0%
50.0%
60.0%
Associate degree Certificate Bachelor's degree Other (Pleasespecify below)
What is the terminal degree earned by your graduates?

8
©2012 ASRT. All rights reserved. Enrollment Snapshot Survey 2012
If yours is a certificate program with an articulation agreement, when do your graduates receive their associate degree? Frequency Valid Percent
After completion of the certificate program
99 55.6%
Associate degree is a requirement for admission into the program*
31 17.4%
After completion of program students receive a bachelor's*
20 11.2%
After successful completion of ARRT registry exam
18 10.1%
No articulation agreement* 6 3.4%
Other (Please specify below) 4 2.2%
Total 178 100.0
*Coded from verbatim responses
In what country is your program located?
Frequency Valid Percent
United States 585 96.4%
Canada 21 3.5%
Australia 1 0.2%
Total 607 100.0%
0.0%
10.0%
20.0%
30.0%
40.0%
50.0%
60.0%
70.0%
80.0%
90.0%
100.0%
United States Canada Australia
In what country is your program located?
0.0%
10.0%
20.0%
30.0%
40.0%
50.0%
60.0%
Aftercompletion ofthe certificateprogram
Associatedegree is a
requirement foradmission intothe program
Aftercompletion ofprogram
students receivea bachelor's
After successfulcompletion ofARRT registry
exam
No articulationagreement
Other (Pleasespecify below)
If yours is a certificate program with an articulation agreement, when do your graduates receive their associate degree?

9
©2012 ASRT. All rights reserved. Enrollment Snapshot Survey 2012
In what region is your program located?
Frequency Valid Percent
South Atlantic (DE, MD, DC, VA, WV, NC, SC, GA, FL, PR)
120 20.9%
East North Central (WI, MI, IL, IN, OH)
110 19.2%
Mid-Atlantic (NY, PA, NJ)
77 13.4%
West South Central (OK, TX, AR, LA)
68 11.9%
West North Central (ND, SD, NE, KS, MN, IA, MO)
61 10.6%
East South Central (KY, TN, MS, AL)
37 6.5%
Mountain (ID, MT, WY, NV, UT, CO, AZ, NM)
36 6.3%
Pacific (AK, WA, OR, CA, HI)
35 6.1%
New England (ME, NH, VT, MA, RI, CT)
29 5.1%
Total* 573 100.0% *Total does not include programs outside of the United States.
0.0%
5.0%
10.0%
15.0%
20.0%
25.0%
If you chose the United States in the question above, please indicate in which region your program is located:

10
©2012 ASRT. All rights reserved. Enrollment Snapshot Survey 2012
2012 Enrollment Analysis How many students entered your program?
Radiography Radiation Therapy
Nuclear Medicine Technology
Overall
Mean N SD Mean N SD Mean N SD Mean N SD
Technical College 24.2 30 23.1 37.5 2 38.9 22.0 2 8.5 24.9 34 22.9
Community college or two-year institution
23.4 205 11.3 10.6 18 5.0 12.4 19 7.2 21.6 242 11.5
University or four-year institution 25.9 84 17.0 13.2 15 9.6 12.1 32 10.3 21.1 131 16.2
Medical center 12.0 120 6.4 6.9 18 5.5 4.6 19 2.5 10.5 157 6.5
For-profit school 22.8 21 17.6 18.0 3 14.0 12.0 1 . 21.8 25 16.7
Other 8.0 2 11.3 11.0 1 . . . . 9.0 3 8.2
Total 20.9 462 14.0 11.5 57 10.4 10.5 73 8.7 18.7 592 13.7
0.0
5.0
10.0
15.0
20.0
25.0
30.0
35.0
40.0
TechnicalCollege
Communitycollege or two-year institution
University orfour-yearinstitution
Medical center For-profitschool
Other
Me
an
How many students entered your program?
Radiography
Radiation Therapy
Nuclear Medicine Technology

11
©2012 ASRT. All rights reserved. Enrollment Snapshot Survey 2012
Is your program currently at full enrollment?
Radiography Radiation Therapy
Nuclear Medicine Technology
Overall
Yes Count 255 27 20 302
% 55.1% 46.6% 27.0% 50.8%
No Count 208 31 54 293
% 44.9% 53.4% 73.0% 49.2%
Total Count 463 58 74 595
% 100% 100% 100% 100%
0.0%
10.0%
20.0%
30.0%
40.0%
50.0%
60.0%
70.0%
80.0%
At Full Enrollment Not at Full Enrollment
Is your program currently at full enrollment?
Radiography
Radiation Therapy
Nuclear MedicineTechnology

12
©2012 ASRT. All rights reserved. Enrollment Snapshot Survey 2012
Radiography Radiation Therapy Nuclear Medicine Technology Overall
N Mean SD N Mean SD N Mean SD N Mean SD
If you are not at full enrollment, how many additional students could be accommodated by your program?
200 8.3 8.7 30 6.9 6.6 54 8.7 12.6 284 8.2 9.4
How many qualified students did you turn away this fall?
411 39.5 73.6 55 14.4 14.7 68 6.4 17.1 534 32.7 66.2
Attrition rate 422 29.1% 27.9% 53 18.9% 26.3% 68 18.4% 28.1% 543 26.8% 28.1%
0
2
4
6
8
10
Radiography Radiation Therapy Nuclear MedicineTechnology
Mean
How many additional students could be accommodated by your program?
0
10
20
30
40
50
Radiography Radiation Therapy Nuclear MedicineTechnology
Mean
How many qualified students did you turn away this fall?
0.0%
10.0%
20.0%
30.0%
40.0%
Radiography RadiationTherapy
NuclearMedicineTechnology
Mean P
erc
ent
Attrition rate

13
©2012 ASRT. All rights reserved. Enrollment Snapshot Survey 2012
Do you plan any changes related to enrollment?
Radiography Radiation Therapy
Nuclear Medicine
Technology Overall
Plan to increase Count 24 11 13 48
% 5.2% 19.0% 17.6% 8.0%
Plan to decrease Count 27 3 5 35
% 5.8% 5.2% 6.8% 5.9%
Plan to remain the same Count 414 44 56 514
% 89.0% 75.9% 75.7% 86.1%
Total Count 465 58 74 597
% 100% 100% 100% 100%
0.0%
10.0%
20.0%
30.0%
40.0%
50.0%
60.0%
70.0%
80.0%
90.0%
100.0%
Plan to increase Plan to decrease Plan to remainthe same
Do you plan any changes related to enrollment?
Radiography
Radiation Therapy
Nuclear Medicine Technology

14
©2012 ASRT. All rights reserved. Enrollment Snapshot Survey 2012
How viable is your program over the next few years?
Radiography Radiation Therapy
Nuclear Medicine Technology
Overall
Will definitely continue to operate
Count 372 42 48 462
% 79.7% 72.4% 64.0% 77.0%
Most likely will continue to operate
Count 83 15 22 120
% 17.8% 25.9% 29.3% 20.0%
Most likely will be closing Count 4 1 4 9
% 0.9% 1.7% 5.3% 1.5%
Definitely will be closing Count 8 0 1 9
% 1.7% 0.0% 1.3% 1.5%
Total Count 467 58 75 600
% 100% 100% 100% 100%
If your program is closing, how many more years will it continue to operate, including this academic year? Program Type N Mean SD
Radiography 11 1.45 .820
Radiation Therapy 2 2.50 .707
Nuclear Medicine Technology
3 1.67 1.155
Total 16 1.63 .885
0.0%
10.0%
20.0%
30.0%
40.0%
50.0%
60.0%
70.0%
80.0%
90.0%
Willdefinitelycontinue tooperate
Most likelywill continueto operate
Most likelywill beclosing
Definitelywill beclosing
How viable is your program over the next few years?
Radiography
Radiation Therapy
Nuclear Medicine Technology

15
©2012 ASRT. All rights reserved. Enrollment Snapshot Survey 2012
2012 USA and Canada Enrollment Comparison
Radiography
ARRT recognized programs
Number of programs responding to survey with enrollment data
Percent of programs responding to survey with enrollment data
Mean number of students entering classroom
Estimated total students enrolled for all programs
Mean attrition Rate
Percent of programs not at full capacity
Mean additional students per program for those not at full capacity
Estimated total additional students for programs not at full capacity
Mean qualified students per program turned away
Estimated total qualified students turned away
Percent of New Graduates finding employment within 6 months of graduation
USA 722 547 75.8% 20.3 14,657 29.6% 46.1% 8 2,663 35.3 13,737 84.3%
Canada 20 13 65.0% 32.4 648 13.6% 7.7% 60 92 194.45 3,590 85.8%
Radiation Therapy
ARRT recognized programs
Number of programs responding to survey with enrollment data
Percent of programs responding to survey with enrollment data
Mean number of students entering classroom
Estimated total students enrolled for all programs
Mean attrition Rate
Percent of programs not at full capacity
Mean additional students per program for those not at full capacity
Estimated total additional students for programs not at full capacity
Mean qualified students per program turned away
Estimated total qualified students turned away
Percent of New Graduates finding employment within 6 months of graduation
USA 102 54 52.9% 10.7 1,091 18.4% 54.70% 7.3 407 14.6 675 85.9%
Canada 16 5 31.3% 19.8 317 25.0% 40.0% 2.5 16 11.8 113 99.5%
Nuclear Medicine Technology
ARRT recognized programs
Number of programs responding to survey with enrollment data
Percent of programs responding to survey with enrollment data
Mean number of students entering classroom
Estimated total students enrolled for all programs
Mean attrition Rate
Percent of programs not at full capacity
Mean additional students per program for those not at full capacity
Estimated total additional students for programs not at full capacity
Mean qualified students per program turned away
Estimated total qualified students turned away
Percent of New Graduates finding employment within 6 months of graduation
USA 129 73 56.6% 10.3 1,329 18.5% 76.10% 8.7 854 3.9 120 57.2%
Canada 5 3 60.0% 14.7 74 16.0% 0.0% 0 0 42.4 212 74.0%

16
©2012 ASRT. All rights reserved. Enrollment Snapshot Survey 2012
Longitudinal Enrollment Trends 2001-2012 Radiography
Year
ARRT recognized programs
Number of programs responding to survey with enrollment data
Percent of programs responding to survey with enrollment data
Mean number of students entering classroom
Estimated total students enrolled for all programs
Mean attrition Rate
Percent of programs not at full capacity
Mean additional students per program for those not at full capacity
Estimated total additional students for programs not at full capacity
Mean qualified students per program turned away
Estimated total qualified students turned away
2001 590 445 75.4% 21.2 12,529 21.6% 50.2% . . . .
2002 631 426 67.5% 23.4 14,734 23.6% 30.9% 8.7 1,688 31.6 13,766
2003 639 456 71.4% 23.4 14,965 21.6% 21.2% 5.8 741 46.8 23,550
2004 684 470 68.7% 22.9 15,683 20.5% 21.7% 7.5 1,106 55.1 29,531
2005 715 468 65.5% 22.8 16,475 18.1% 20.9% 7.4 1,104 50.9 27,131
2006 723 533 73.7% 24.0 17,323 18.4% 22.6% 7.0 1,142 59.2 33,148
2007 729 495 67.9% 22.8 16,612 17.8% 30.2% 7.1 1,558 56.8 28,556
2008 742 520 70.1% 23.0 17,050 21.1% 33.3% 8.4 2,073 50.4 24,914
2009 746 448 60.1% 22.5 16,759 20.8% 40.0% 3.7 1,088 43.4 19,386
2010 751 487 64.8% 21.2 15,948 23.3% 43.7% 7.6 2,490 39.1 16,528
2011 751 433 57.7% 21.9 16,454 25.8% 46.2% 7.6 2,637 37.1 14,978
2012 750 471 62.8% 20.9 15,675 29.1% 44.9% 8.3 2,795 39.5 16,323
12,529
14,734 14,965 15,683
16,475 17,323
16,612 17,050 16,759 15,948 16,454
15,675
-
2,000
4,000
6,000
8,000
10,000
12,000
14,000
16,000
18,000
20,000
2001 2002 2003 2004 2005 2006 2007 2008 2009 2010 2011 2012
Estimated total entering class enrollment for all radiography programs

17
©2012 ASRT. All rights reserved. Enrollment Snapshot Survey 2012
Radiation Therapy
Year
ARRT recognized programs
Number of programs responding to survey with enrollment data
Percent of programs responding to survey with enrollment data
Mean number of students entering classroom
Estimated total students enrolled for all programs
Mean attrition Rate
Percent of programs not at full capacity
Mean additional students per program for those not at full capacity
Estimated total additional students for programs not at full capacity
Mean qualified students per program turned away
Estimated total qualified students turned away
2001 86 52 60.5% 10.0 860 18.1% 44.4% . . . .
2002 95 57 59.9% 14.0 1,326 11.1% 48.0% 5.7 261 9.1 449
2003 101 58 57.4% 12.6 1,274 18.0% 44.6% 4.4 200 13.6 758
2004 105 58 55.2% 14.4 1,513 11.9% 30.5% 12.5 400 13.4 974
2005 113 64 56.6% 12.5 1,382 16.8% 32.1% 3.4 124 24.5 1,880
2006 118 80 67.8% 11.0 1,295 16.6% 49.3% 6.4 373 21.6 1,291
2007 122 66 54.1% 12.9 1,577 15.2% 51.5% 6.3 395 13.3 931
2008 125 62 49.6% 10.5 1,314 14.4% 58.6% 4.5 330 33.0 1,708
2009 122 60 49.2% 12.5 1,505 10.9% 55.5% 3.7 243 15.8 869
2010 122 70 57.4% 12.0 1,462 18.3% 49.3% 7.9 475 18.0 1,112
2011 123 54 44.1% 9.8 1,204 21.9% 51.9% 6.1 388 14.3 846
2012 122 59 48.4% 11.5 1,403 18.9% 53.4% 6.6 430 14.7 836
860
1,326 1,274
1,513 1,382
1,295
1,577
1,314
1,505 1,462
1,204
1,403
-
200
400
600
800
1,000
1,200
1,400
1,600
1,800
2001 2002 2003 2004 2005 2006 2007 2008 2009 2010 2011 2012
Estimated total entering class enrollment for all radiation therapy programs

18
©2012 ASRT. All rights reserved. Enrollment Snapshot Survey 2012
Nuclear Medicine Technology
Year
ARRT recognized programs
Number of programs responding to survey with enrollment data
Percent of programs responding to survey with enrollment data
Mean number of students entering classroom
Estimated total students enrolled for all programs
Mean attrition Rate
Percent of programs not at full capacity
Mean additional students per program for those not at full capacity
Estimated total additional students for programs not at full capacity
Mean qualified students per program turned away
Estimated total qualified students turned away
2001 101 63 62.4% 12.4 1,252 11.8% 53.2% . . . .
2002 104 58 55.8% 14.0 1,454 8.0% 35.7% 6.7 251 19.7 1,381
2003 111 66 59.5% 14.5 1,612 7.1% 33.3% 2.7 180 32.1 2,375
2004 117 68 58.1% 14.0 1,633 9.8% 20.9% 3.6 88 24.4 2,258
2005 122 63 51.6% 13.7 1,698 8.6% 30.6% 5.1 191 32.9 2,786
2006 131 94 71.8% 15.5 2,033 10.2% 31.8% 5.7 238 30.2 2,697
2007 132 73 55.3% 13.5 1,781 8.3% 39.7% 6.3 331 24.2 1,916
2008 136 81 59.5% 12.2 1,660 12.3% 58.4% 10.0 794 18.2 1,032
2009 136 65 47.5% 10.8 1,482 7.0% 63.0% 4.3 416 9.3 473
2010 136 64 47.1% 11.3 1,534 12.9% 78.8% 7.0 748 12.9 372
2011 134 61 45.7% 8.8 1,175 11.3% 82.5% 7.2 796 8.0 187
2012 134 76 56.7% 10.5 1,407 18.4% 73.0% 8.7 851 6.4 232
1,252 1,454
1,612 1,633 1,698
2,033
1,781 1,660
1,482 1,534
1,175
1,407
-
500
1,000
1,500
2,000
2,500
2001 2002 2003 2004 2005 2006 2007 2008 2009 2010 2011 2012
Estimated total entering class enrollment for all nuclear medicine technology programs

19
©2012 ASRT. All rights reserved. Enrollment Snapshot Survey 2012
Number of ARRT-Recognized Programs
70
80
90
100
110
120
130
2001 2002 2003 2004 2005 2006 2007 2008 2009 2010 2011 2012
Radiation Therapy
90
95
100
105
110
115
120
125
130
135
140
2001 2002 2003 2004 2005 2006 2007 2008 2009 2010 2011 2012
Nuclear Medicine Technology
500
550
600
650
700
750
800
2001 2002 2003 2004 2005 2006 2007 2008 2009 2010 2011 2012
Radiography

20
©2012 ASRT. All rights reserved. Enrollment Snapshot Survey 2012
Job Placement of Graduates What is the job placement percent rate of students finding employment in their discipline within six months of graduation from your program?
New England (ME, NH, VT, MA, RI, CT)
Mid-Atlantic (NY, PA, NJ)
East North Central (WI, MI, IL, IN, OH)
West North Central (ND, SD, NE, KS, MN, IA, MO)
South Atlantic (DE, MD, DC, VA, WV, NC, SC, GA, FL, PR)
East South Central (KY, TN, MS, AL)
West South Central (OK, TX, AR, LA)
Mountain (ID, MT, WY, NV, UT, CO, AZ, NM)
Pacific (AK, WA, OR, CA, HI)
Overall
Radiography
2008 91.6% 89.7% 89.0% 90.2% 88.9% 88.6% 86.5% 89.8% 91.9% 89.3%
2009 86.2% 80.3% 81.1% 84.1% 82.7% 86.3% 84.5% 79.1% 77.8% 82.2%
2010 82.1% 76.2% 80.8% 82.3% 80.1% 88.5% 85.6% 78.9% 74.2% 80.8%
2011 89.1% 83.5% 86.0% 89.7% 81.2% 89.3% 89.9% 80.1% 73.9% 84.8%
Radiation Therapy
2008 82.0% 85.4% 82.6% 98.4% 70.5% 64.2% 80.1% . 96.4% 81.1%
2009 84.2% 83.2% 70.4% 85.3% 70.5% 63.3% 79.8% . 92.0% 77.4%
2010 74.1% 78.5% 87.7% 79.0% 78.7% 78.3% 89.7% . 93.3% 81.9%
2011 91.7% 82.6% 88.3% 89.7% 84.1% 82.5% 90.8% 70.0% 100.0% 86.1%
Nuclear Medicine Technology
2008 83.8% 79.4% 76.7% 86.0% 80.0% 91.2% 90.1% 87.3% 83.9% 83.2%
2009 63.8% 61.6% 63.6% 69.6% 72.4% 87.4% 77.0% 81.7% 76.7% 70.6%
2010 51.7% 50.5% 48.5% 49.5% 58.4% 72.5% 72.6% . 73.1% 57.5%
2011 38.0% 34.8% 49.9% 76.9% 52.4% 56.8% 78.3% 89.5% 86.0% 57.2%
0.0%
10.0%
20.0%
30.0%
40.0%
50.0%
60.0%
70.0%
80.0%
90.0%
100.0%
2008 2009 2010 2011
Mean P
erc
ent
Overall placement rates for graduates
Radiography
Radiation Therapy
Nuclear Medicine Technology

21
©2012 ASRT. All rights reserved. Enrollment Snapshot Survey 2012
For those students who haven’t been able to find employment after graduation, what do you believe is the primary reason? Frequency Valid Percent
Too many graduates in relation to the number of open positions
179 34.3%
Facilities cutting back positions 101 19.3%
Management not filling open positions 78 14.9%
Current workforce is delaying retirement 65 12.5%
An equal combination of at least two of the responses listed in this question.*
23 4.4%
Graduates are continuing with their education* 18 3.4%
Graduates unwilling to relocate* 8 1.5%
Hospital closings 3 0.6%
Other (Please specify below) 47 9.0%
Total 522 100.0%
*Coded from verbatim responses
0.0%
5.0%
10.0%
15.0%
20.0%
25.0%
30.0%
35.0%
40.0%
Too many graduates in
relati...the number of
open positions
Facilities cutting back
positions
Management not filling
open positions
Current workforce is
delaying retirement
An equal combination of
at least two of the
responses listed in this
question.
Graduates are continuing
with their education
Graduates unwilling to
relocate
Hospital closings
Other (Please specify
below)
For those students who haven’t been able to find employment after graduation, what do you believe is the primary reason?

22
©2012 ASRT. All rights reserved. Enrollment Snapshot Survey 2012
Imaging Technology
Which of the following imaging technologies are used at your clinical sites?
Column1 Column2 Radiography Radiation Therapy
Nuclear Medicine Technology Overall
DR (cassetteless) Count 440 49 43 532
% 94.2% 94.2% 81.1% 93.0%
CR (cassette-based) Count 460 19 14 493
% 98.5% 36.5% 26.4% 86.2%
Film-Screen Count 103 16 16 135
% 22.1% 30.8% 30.2% 23.6%
Clinical sites that use Film-Screen only Frequency Valid Percent
CR or DR 563 98.1%
Film-Screen Only
11 1.9%
Total 574 100.0%
0.0%
20.0%
40.0%
60.0%
80.0%
100.0%
DR(cassetteless)
CR (cassette-based)
Film-Screen
Which of the following imaging technologies are used at your clinical sites?
Radiography
Radiation Therapy
Nuclear MedicineTechnology
0.0%
20.0%
40.0%
60.0%
80.0%
100.0%
CR or DR Film-Screen Only
Clinical sites that use Film-Screen only

23
©2012 ASRT. All rights reserved. Enrollment Snapshot Survey 2012
Which of the following technologies are used in your on-campus lab?
Column1 Column2 Radiography
Radiation Therapy
Nuclear Medicine Technology Overall
DR (cassetteless) Count 106 4 15 125
% 22.8% 7.1% 25.4% 21.6%
CR (cassette-based) Count 337 10 3 350
% 72.5% 17.9% 5.1% 60.3%
Film-Screen Count 200 3 10 213
% 43.0% 5.4% 16.9% 36.7%
We do not have an on-campus lab.
Count 96 42 39 177
% 20.6% 75.0% 66.1% 30.5%
On-campus labs that use Film-Screen only
Frequency Valid
Percent
CR or DR 374 64.3%
Film-Screen only 31 5.3%
We do not have an on-campus lab. 177 30.4%
Total 582 100.0%
0.0%10.0%20.0%30.0%40.0%50.0%60.0%70.0%80.0%
DR (cassetteless)
CR (cassette-
based)
Film-Screen
We do not have
an on-campus
lab.
Which of the following technologies are used in your on-campus lab?
Radiography
Radiation Therapy
Nuclear MedicineTechnology
0.0%
20.0%
40.0%
60.0%
80.0%
CR or DR Film-Screen only We do not have anon-campus lab.
On-campus labs that use Film-Screen only