enhancing veterans' access to stem education and careers · enhancing veterans’ access to...
TRANSCRIPT

1 | P a g e

Enhancing Veterans’ Access to STEM Education and Careers:
A Labor Market Analysis of Veterans in the STEM Workforce
By
Institute for Veterans and Military Families (IVMF)
Syracuse University
About the Report: This report is published by the Institute for Veterans and Military Families, under contract with Council for Adult and Experiential Learning (CAEL). Principal authors of this technical report is are Rosalinda V. Maury, M.S., Brice Stone, Ph.D., and Nicholas Armstrong, Ph.D. Any views expressed in this paper are of the authors only. Suggested Citation: Maury, R.; Stone, B.; Armstrong, N. (2018, December). Enhancing Veterans’ Access to STEM Education and Careers: A Labor Market Analysis of Veterans in the STEM Workforce. Syracuse, NY: Institute for Veterans and Military Families, Syracuse University
3 | P a g e
Table of Contents Executive Summary ......................................................................................................................... 4
Overview ......................................................................................................................................... 7
STEM Definition .............................................................................................................................. 7
Methodology ................................................................................................................................... 8
Veteran STEM Occupations .......................................................................................................... 10
Veteran STEM Clusters .................................................................................................................. 18
Veteran STEM All Metro Areas ..................................................................................................... 20
Veteran STEM Regions .................................................................................................................. 68
Veteran STEM States ..................................................................................................................... 81
Veteran STEM by Education Attainment ...................................................................................... 93
Veteran STEM across States and within States .......................................................................... 100
Veteran STEM by State across Metropolitan Area ..................................................................... 105
Veteran STEM – Employment Characteristics ............................................................................ 120
Veteran STEM – Employment Characteristics by States ............................................................ 150
Military Installation – Army and Air Force Only ......................................................................... 160

4 | P a g e
Executive Summary Overall Key Results
The nation’s future and economic competitiveness hinge, more than ever, on our ability to develop, grow, and sustain a workforce proficient in science, technology, engineering and math (STEM). In the last decade alone, jobs requiring some level of STEM expertise have grown 34 percent—to include jobs that do not require a bachelor’s degree.1 At the same time, veterans and transitioning service members represent a valuable, skilled talent pool from which to help meet this critical need. To this broader purpose, the Institute for Veterans and Military Families (IVMF) recently provided research support to the Council for Adult and Experiential Learning (CAEL), in collaboration with the Helmsley Charitable Trust, in an effort to inform the development of local and regional STEM ecosystems of educators and employers aimed increasing veterans’ access to STEM careers. Specifically, the project intended to better equip local postsecondary institutions and employers with the collaborative tools and information needed to successfully align education, training, and employer needs in STEM, alongside efforts to recruit and retain veterans into local employment opportunities. This research technical report presents key highlights on recent veteran participation in the STEM workforce drawing upon an analysis of the American Community Survey (2012-2016), led by the U.S. Census Bureau. From this data, the research team examined veteran participation across 49 distinct STEM occupations, which are grouped into the following five occupational clusters: Engineering, Information Technology and Computer Science, Life and Physical Sciences, Mathematics, and Supervisor/ Management of STEM occupations. Among other analyses, the research team identified year-over-year trends in veteran participation, geographic distribution, and comparisons to non-veterans across all STEM occupations. Major findings include: Overall Participation in STEM: The majority of those in the labor force are not in STEM
occupations (6% compared to 94%). Veterans, however, represent a larger proportion in STEM occupations compared to nonveterans (8% compared to 6%).
Veteran Participation in STEM fields: Veterans are 1.47 times more likely to be in a STEM occupation compared to nonveterans.
Veteran Trends in STEM fields: Veterans entered into STEM occupations at an increasing annual rate of 0.232 percentage points between 2012 and 2016.
1 National Science Board. (2018). “Our Nation’s Future Competitiveness Relies on Building a STEM-capable U.S. Workforce.” Washington, DC: National Science Foundation. Retrieved from https://www.nsf.gov/nsb/sei/companion-brief/NSB-2018-7.pdf

5 | P a g e
Top STEM Clusters for Veterans: The top two STEM occupation clusters for veterans were the information technology and computer science cluster (43%), followed by the engineering STEM cluster (38%).
STEM Occupations with Growing Veteran Participation: Of the 49 STEM occupations, nearly half (19) exhibited a positive trend of increased veteran participation from 2012 to 2016. Information Security Analysts occupation exhibits the highest odds ratio; veterans are 2.64 times more likely to be in the Information Security Analysts occupation compared to nonveterans. The Information Security Analysts has a positive yearly increase of 0.17 percentage points a year.
Top STEM Region: The South Atlantic region (District of Columbia, Delaware, West Virginia, South Carolina, Maryland, Virginia, Georgia, North Carolina, and Florida) exhibited the largest concentration of veterans in the STEM workforce.
Top STEM States: California accounts for the most veterans in the STEM workforce from 2012 to 2014 (10%), followed by Texas (9%), Virginia (8%), Florida (7%), Maryland (4%), North Carolina (4%), Georgia (3%), Washington (3%), Colorado (3%), and Pennsylvania (3%).
Top STEM Metropolitan Areas: The Washington-Arlington-Alexandria, DC-VA-MD metropolitan area accounts for the most veterans in the STEM workforce (9%) from 2012-2016. The top metropolitan areas where:
o Washington-Arlington-Alexandria, DC-VA-MD (9%) o Dallas-Fort Worth-Arlington, TX (4%) o Los Angeles-Long Beach-Anaheim, CA (3) o New York-Newark-Jersey City, NY-NJ-PA (3%) o Atlanta-Sandy Springs-Roswell, GA (3%) o Vineland-Bridgeton, NJ (2%) o Phoenix-Mesa-Scottsdale, AZ (2%) o Baltimore-Columbia-Towson, MD (2%) o San Diego-Carlsbad, CA (2%) o Seattle-Tacoma-Bellevue, WA (2%)
Veteran Earnings in STEM Careers: On average, veterans in STEM occupations earn
slightly over 8 percent more than their nonveteran peers ($93,833 compared to $86,676, respectively). Veterans in STEM occupations also tend to out-earn, at even higher rates, both their veteran and non-veteran counterparts in non-STEM fields.
Veteran Unemployment in STEM fields: Veterans in STEM fields tend to experience lower overall unemployment than those in other occupations, although unemployment was slightly higher for veterans in stem compared to nonveterans in STEM.

6 | P a g e
Top States for STEM Earnings Growth: Thirty-six (36) of the 51 states (including District of Columbia) exhibited positive trends in the average total annual personal income for veteran STEM workers (in nominal dollars) from 2012 to 2016. The states with the highest positive growth were North Dakota, Connecticut, Wisconsin, Maine, West Virginia, Rhode Island, Nevada, Oklahoma, Tennessee, and South Carolina.
These results provide insight into how veterans are doing in the U.S. STEM workforce. They also reveal opportunities for the development of high-potential STEM education and career pipelines for veterans and transitioning service members. Of course, the overall success of this STEM pipeline would be dependent upon the capacity for local networks to identify high growth STEM occupations that connect to military transferrable skills as well as the degree of collaboration between postsecondary institutions and employers in leveraging these skills in diverse career pathways.

7 | P a g e
Overview This report outlines a scope of work under which the Institute for Veterans and Military Families (IVMF) at Syracuse University provided research support and subject matter expertise to the Council for Adult and Experiential Learning (CAEL), in collaboration with the Helmsley Charitable Trust, for an initiative to encourage veterans to enter into Science, Technology, Engineering, and Mathematics (STEM) fields by fostering STEM ecosystems that recognize veterans’ abilities and support them as they pursue STEM education and career opportunities.
The IVMF gathered available public federal data to inform the development of high-potential STEM education and career pipelines for veterans and transitioning service members. In summary, federal data was analyzed on veteran STEM occupations. Trends were identified on veterans employed in STEM occupations, i.e., in which STEM occupations are veterans currently employed? In what locations are they concentrated? Are there any clear patterns of veterans making career changes into our out of STEM careers? How does this compare against non-veterans?
STEM Definition The acronym STEM refers to science, technology, engineering and math. However, there is no standard definition for what constitutes a STEM job. Science, technology, engineering and math positions consistently make the lists of STEM occupations, but there is less consensus concerning whether to include other positions such as educators, managers, technicians, healthcare professionals or social scientists. In this report, STEM jobs include professional and technical support occupations in the fields of computer science and mathematics, engineering, and life and physica7l sciences. Three management occupations are also included because of their clear ties to STEM. Because of data limitations, education jobs are not included. Further, social scientists were not included.
The STEM list contains around 53 occupation codes, and, in 2010, there were 7.6 million workers in these jobs, or 5.5 percent of the workforce (U.S. Department of Commerce, 2011). By 2014, the percent of STEM workers in the workforce had declined slightly to 5.28 percent, while veteran STEM workers comprised 7.57 percent of the veteran workforce. To better put these jobs into context, STEM occupations are divided into four categories: computer and math, engineering and surveying, physical and life sciences, and STEM managerial occupations. Across all levels of educational attainment, the largest group of STEM jobs in 2014 is within the computer and math fields, which account for 43.50 percent of all STEM employment (43.57 percent for non-veterans). Veterans in the computer and math fields exhibited 42.92 percent of the veteran occupied STEM jobs. Second are engineering and surveying occupations with about one-third of all non-veteran STEM employment, while 13.17 percent are in the physical and life sciences, and 9.06 percent in STEM management jobs. In comparison, veterans working in engineering and surveying occupations comprise forty-one percent of all STEM employment (41.01 percent), while 7.52 percent are in the physical and life sciences, and 8.55 percent are in STEM management jobs.

8 | P a g e
For the purposes of this report a total of 53 original STEM occupations were included for analysis encompassing five clusters of occupations. The following is a breakdown by cluster:
• Life and Physical Sciences (Traditional STEM) – 15 occupations • Engineering (Traditional STEM) - 20 occupations • Information Technology and Computer (Traditional STEM) - 13 occupations • Mathematics (Traditional STEM) - 2 occupations • Supervisor/Management of STEM occupations (Traditional STEM) - 3 occupations
Methodology
The analysis discussion presented below uses the Public Use Microdata Sample (PUMS) which contains a sample of actual responses to the 2012 to 2016 American Community Survey (ACS). The PUMS dataset includes variables for nearly every question on the survey, as well as many new variables that were derived after the fact from multiple survey responses (such as poverty status). Each record in the file represents a single person, or--in the household-level dataset--a single housing unit. In the person-level file, individuals are organized into households, making possible the study of people within the contexts of their families and other household members. PUMS files for an individual year, such as 2014, contain data on approximately one percent of the United States population.
For the purpose of this paper, veteran has been defined as all respondents that responded to the ACS question labeled “vetstatd” as “veteran.” The analysis excludes all respondents who identified themselves as “currently on active duty” or “training for reserve duty,” using the valid responses to the “vetstatd” variable. In addition, all active duty military family members were also excluded from the analysis. Thus, non-veterans are defined as all respondents that identified themselves as “n/a” or “no military service,” again using the valid responses of the “vetstatd” variable. Thus, non-veterans are respondents which have no direct or indirect relation with active duty military service.
The 2012 to 2016 PUMS ACS contains 15,681,927 individual response records. The 2012 to 2016 PUMS ACS contains 1,102,216 veteran records. The table below presents the distribution of the veterans by last period served (819 veterans could not be placed in a period). The largest percentage of veterans is from the Vietnam era. Over 40 percent of the veterans are attributable to service years of 1975 to the present with over 32 percent of the veterans attributable to the Vietnam era. These veteran records and their non-veteran counterparts (11,262,693 records of nonveterans, aged 18 years and over) will form the basis for the analyses presented below.

9 | P a g e
Table 1. Distribution of Veterans by Last Time Period Served, 2012 to 2016
Last Period Served
Number of Observations
Percent Of
Total
Cumulative Percent
Average Age
Post 9/11 133,985 12.17 12.17 37.69 1990 to 2001 125,657 11.41 23.57 48.39 1975 to 1990 186,586 16.94 40.51 57.00 During Vietnam Era 358,936 32.59 73.10 67.04 1955 to 1964 128,240 11.64 84.75 75.87 During Korean Conflict Era 97,519 8.85 93.60 82.16 1947 to 1950 9,686 0.88 94.48 85.50 During World War II Era 60,788 5.52 100.00 89.43 Total 1,101,397 100.00 63.40
When considering basic demographics of the veterans by last time period served, the percent of females in the military has significantly increased from the Vietnam era to the present, from 2.88 percent to over 16 percent, a nearly six-fold increase. When considering ethnicity of the veterans by last time period, the percent of African Americans have held relatively steady since the 1975 to 1980 time period, 14 to 15 percent, and Hispanics have exhibited an increase since the Vietnam era, more than doubling their percentage. There are other ethnic groups beyond the three in Table 2 that are veterans, but their percentages are much smaller.
Table 2. Demographic Distribution (Percent) of Veterans by Last Time Period Served, 2014
Last Period Served Male Female African
American Hispanic Caucasian Post 9/11 83.15 16.85 14.51 10.56 79.88 1990 to 2001 85.77 14.23 15.13 7.47 80.47 1975 to 1990 88.74 11.26 14.65 5.43 81.83 During Vietnam Era 97.12 2.88 8.50 4.16 88.82 1955 to 1964 97.01 2.99 5.24 3.05 92.79 During Korean Conflict Era 97.27 2.73 5.23 3.16 92.91 1947 to 1950 96.38 3.62 5.36 3.36 92.22 During World War II Era 95.07 4.93 4.05 2.47 94.32 Total 92.59 7.41 10.09 5.21 86.75

10 | P a g e
Veteran STEM Occupations The STEM occupations include 8.10 percent of the veteran workforce over the 2012 to 2016 time period compared to 5.51 percent of the non-veteran workforce. These percentages result in an odds ratio of 1.4701 (the ratio of the percentage of the veteran workforce in the STEM occupations compared to percentage of the non-veteran workforce in the STEM occupations), i.e., veterans are 1.4701 times more likely than non-veterans to be in the STEM workforce. For veterans, the occupation which exhibits the largest percentage of the veteran workforce is Software Developers and Programmers occupation (occupational code 15-1130) at 9.37 percent, followed by Engineering Technicians, Except Drafters occupation (occupational code 17-3020) at 9.17 percent and Computer Support Specialists occupation (occupational code 15-1150) at 8.07 percent. In comparison, the occupation which exhibits the largest percentage of the non-veteran workforce is Software Developers and Programmers occupation (occupational code 15-1130) at 13.04 percent, followed by the Computer Support Specialists occupation (occupational code 15-1150) at 6.82 percent and the Computer and Information Systems Managers occupation (occupational code 11-3021) at 6.75 percent.
Of the 49 STEM occupations provided in the Table 3, 22 exhibit an odds ratio (percentage of veteran workforce in the occupation compared to percentage of non-veteran workforce in the occupation) of over one (1), i.e., veterans are more likely to be in the particular occupation than non-veterans. For example, veterans are 2.6462 times more likely than non-veterans to be in the Information Security Analysts occupation (occupational code 15-1122). Conversely, veterans are 0.4000 times less likely than non-veterans to be in the Natural Sciences Managers occupation (occupational code 11-9121). It should be noted that for the Information Security Analysts occupation, veterans and non-veterans exhibit low percentages of the workforce in the occupation, 1.72 percent and 0.65 percent, respectively. A similar phenomenon is displayed by the Natural Sciences Managers occupation, 0.10 percent for veterans and 0.25 percent for non-veterans. The Information Security Analysts occupation (occupational code 15-1122) exhibits the highest odds ratio, 2.6462, and the Actuaries occupation (15-2011) exhibits the lowest odds ratio, 0.1818.
Table 3. Proportion (Percent) of the Veteran, Non-Veteran, and Total Workforce by STEM Occupation for the 2012 to 2016 Time Period
STEM OCCSOC - Definitions STEM
OCCSOC
Proportion of Workforce in Occupation (2012 to 2016) Odds Ratio
(Veteran/Non-veteran)
Non- Veterans Veterans Total
All STEM Occupations 5.51 8.10 5.67 1.4701 11-3021 Computer and Information Systems Managers 113021 6.75 6.60 6.73 0.9778 11-9041 Architectural and Engineering Managers 119041 1.84 2.01 1.85 1.0924 11-9121 Natural Sciences Managers 119121 0.25 0.10 0.24 0.4000 15-1111 Computer and Information Research Scientists 151111 0.20 0.17 0.19 0.8500

11 | P a g e
STEM OCCSOC - Definitions STEM
OCCSOC
Proportion of Workforce in Occupation (2012 to 2016) Odds Ratio
(Veteran/Non-veteran)
Non- Veterans Veterans Total
15-1121 Computer Systems Analysts 151121 5.91 5.20 5.85 0.8799 15-1122 Information Security Analysts 151122 0.65 1.72 0.74 2.6462 15-1131 Computer Programmers 151131 5.31 3.77 5.17 0.7100 15-1134 Web Developers 151134 2.28 0.96 2.16 0.4211 15-1130 Software Developers and Programmers 15113X 13.04 9.37 12.71 0.7186 15-1141 Database Administrators 151141 1.38 1.16 1.36 0.8406 15-1142 Network and Computer Systems Administrators 151142 2.41 3.99 2.55 1.6556 15-1143 Computer Network Architects 151143 1.08 1.98 1.16 1.8333 15-1150 Computer Support Specialists 151150 6.82 8.07 6.93 1.1833 15-1199 Computer Occupations, All Other 151199 5.59 6.93 5.71 1.2397 15-2011 Actuaries 152011 0.33 0.06 0.31 0.1818 15-2031 Operations Research Analysts 152031 1.52 2.70 1.63 1.7763 17-1010 Architects, Except Naval 171010 2.31 1.23 2.21 0.5325 17-1020 Surveyors, Cartographers, and Photogrammetrists 171020 0.45 0.50 0.45 1.1111 17-2011 Aerospace Engineers 172011 1.47 2.10 1.53 1.4286 17-2041 Chemical Engineers 172041 0.71 0.55 0.70 0.7746 17-2051 Civil Engineers 172051 3.78 3.76 3.78 0.9947 17-2061 Computer Hardware Engineers 172061 0.62 0.57 0.61 0.9194 17-2070 Electrical and Electronics Engineers 172070 2.37 3.01 2.43 1.2700 17-2081 Environmental Engineers 172081 0.37 0.32 0.36 0.8649 17-2000 Engineers 1720XX 0.19 0.20 0.19 1.0526 17-2110 Industrial Engineers, Including Health and Safety 172110 2.26 2.36 2.27 1.0442 17-2121 Marine Engineers and Naval Architects 172121 0.15 0.29 0.16 1.9333 17-2131 Materials Engineers 172131 0.42 0.49 0.42 1.1667 17-2141 Mechanical Engineers 172141 2.80 2.76 2.80 0.9857 17-2000 Engineers 1721XX 0.44 0.38 0.44 0.8636 17-2000 Engineers 1721YY 6.09 7.12 6.18 1.1691 17-3010 Drafters 173010 1.99 2.02 1.99 1.0151 17-3020 Engineering Technicians, Except Drafters 173020 4.37 9.17 4.80 2.0984 17-3031 Surveying and Mapping Technicians 173031 0.80 1.00 0.82 1.2500 19-1010 Agricultural and Food Scientists 191010 0.35 0.18 0.34 0.5143 19-1020 Biological Scientists 191020 0.98 0.40 0.93 0.4082 19-1030 Conservation Scientists and Foresters 191030 0.32 0.31 0.32 0.9688 19-1000 Life Scientists 1910XX 1.73 0.49 1.62 0.2832 19-2010 Astronomers and Physicists 192010 0.13 0.16 0.14 1.2308 19-2021 Atmospheric and Space Scientists 192021 0.12 0.24 0.13 2.0000

12 | P a g e
STEM OCCSOC - Definitions STEM
OCCSOC
Proportion of Workforce in Occupation (2012 to 2016) Odds Ratio
(Veteran/Non-veteran)
Non- Veterans Veterans Total
19-2030 Chemists and Materials Scientists 192030 1.02 0.43 0.97 0.4216 19-2040 Environmental Scientists and Geoscientists 192040 0.96 0.70 0.94 0.7292 19-2099 Physical Scientists, All Other 192099 2.76 0.88 2.60 0.3188 19-4011 Agricultural and Food Science Technicians 194011 0.46 0.30 0.44 0.6522 19-4021 Biological Technicians 194021 0.28 0.16 0.27 0.5714 19-4031 Chemical Technicians 194031 0.82 0.78 0.82 0.9512 19-4000 Life, Physical, and Social Science Technicians 1940XX 0.23 0.33 0.24 1.4348 19-4000 Life, Physical, and Social Science Technicians 1940YY 2.48 1.54 2.40 0.6210 41-9031 Sales Engineers 419031 0.40 0.48 0.40 1.2000
Table 4 presents the percentage of the veteran workforce (in the labor force and 18 years of age and over) for each year that is in each of the 49 STEM occupations for the 2012 to 2016 time period (e.g., the percentages for each year sum to 100 percent). The first row of percentages presented in the table represents the proportion of the veteran workforce that is in the STEM workforce for each year. These annual percentages result in an overall trend for the 2012 to 2016 time period of 0.2320, i.e., the percentage of the veteran workforce in STEM occupations increased 0.232 percentage points per year over the 2012 to 2016 time period.
The STEM occupation exhibiting the largest percentage of the veteran workforce for the single year over the 2012 to 2016 time period is Engineering Technicians, Except Drafters (occupational code 17-3020) at 10.47 percent for 2013. The last column of the table provides a trend for the five year time period for each occupation. Of the 49 occupations, 19 exhibit a positive trend value for the 2012 to 2016 time period. The largest positive trend value is exhibited by Computer Occupations, All Other (occupational code 15-1199) with a 0.8490 percentage point increase per year for the 2012 to 2016 time period, followed by Computer Support Specialists occupation (occupational code 15-1150) at 0.1930 and Software Developers and Programmers occupation (occupational code 15-1130) at 0.1830 (see figure below). The largest negative trend for an occupation for the 2012 to 2016 time period is exhibited by the Engineering Technicians, Except Drafters occupation (occupation code 17-3020) at -0.3530, preceded by Computer Programmers occupation (occupational code 15-1131) at -0.2610 and Computer Systems Analysts occupation (occupational code 15-1121) at -0.2110 (see figure below).
There are ten occupations that exhibit a trend value less than 0.01 which is relatively flat: Natural Sciences Managers (occupational code 11-9121) at -0.0060; Computer and Information Research Scientists (occupational code 15-1111) at -0.0090; Operations Research Analysts (occupational code 15-2031) at 0.0000; Surveyors, Cartographers, and Photogrammetrists (occupational code 17-1020) at 0.0080; Engineers (occupational code 17-2000) at 0.0090; Mechanical Engineers (occupational code 17-2141) at 0.0030; Atmospheric and Space Scientists (occupational code 19-2021) at -0.0010; Agricultural and Food Science Technicians (occupational code 19-4011) at -

13 | P a g e
0.0040; Biological Technicians (occupational code 19-4021 ) at -0.0030; and Life, Physical, and Social Science Technicians (occupational code 19-4000) at 0.0020.
Table 4. Proportion (Percent) of the Veteran Workforce by STEM Occupation over the 2012 to 2016 Time Period
OCCSOC - Definitions OCCSOC
Years - Proportion of Veteran Workforce in STEM Occupation (2012 to 2016)
Trend 2012 2013 2014 2015 2016 Total
STEM Occupations Veteran 7.60 8.03 8.10 8.27 8.64 8.10 0.2320 11-3021 Computer and Information Systems Managers 113021 6.54 6.27 6.55 6.59 7.05 6.60 0.1340 11-9041 Architectural and Engineering Managers 119041 2.19 2.01 1.87 2.18 1.79 2.01 -0.0630 11-9121 Natural Sciences Managers 119121 0.11 0.08 0.16 0.08 0.08 0.10 -0.0060 15-1111 Computer and Information Research Scientists 151111 0.17 0.20 0.18 0.13 0.16 0.17 -0.0090 15-1121 Computer Systems Analysts 151121 5.49 5.45 5.19 5.38 4.47 5.20 -0.2110 15-1122 Information Security Analysts 151122 1.52 1.49 1.59 1.82 2.21 1.72 0.1710 15-1131 Computer Programmers 151131 4.34 3.96 3.84 3.35 3.34 3.77 -0.2610 15-1134 Web Developers 151134 0.91 1.26 0.96 0.84 0.81 0.96 -0.0620 15-1130 Software Developers and Programmers 15113X 9.23 9.05 8.95 9.92 9.71 9.37 0.1830 15-1141 Database Administrators 151141 1.33 1.20 1.18 1.10 0.99 1.16 -0.0780 15-1142 Network and Computer Systems Administrators 151142 4.01 4.15 3.89 3.73 4.16 3.99 -0.0120 15-1143 Computer Network Architects 151143 1.88 1.80 1.93 2.16 2.13 1.98 0.0860 15-1150 Computer Support Specialists 151150 7.87 8.01 7.62 8.02 8.83 8.07 0.1930 15-1199 Computer Occupations, All Other 151199 5.03 5.81 7.87 7.86 8.25 6.93 0.8490 15-2011 Actuaries 152011 0.06 0.04 0.01 0.04 0.14 0.06 0.0160 15-2031 Operations Research Analysts 152031 2.69 2.73 2.56 2.91 2.60 2.70 0.0000 17-1010 Architects, Except Naval 171010 1.46 1.20 1.22 1.05 1.19 1.23 -0.0690 17-1020 Surveyors, Cartographers, and Photogrammetrists 171020 0.41 0.59 0.53 0.45 0.52 0.50 0.0080 17-2011 Aerospace Engineers 172011 2.48 2.23 1.92 1.85 1.99 2.10 -0.1360 17-2041 Chemical Engineers 172041 0.71 0.47 0.57 0.52 0.48 0.55 -0.0410 17-2051 Civil Engineers 172051 3.93 3.52 4.00 3.68 3.68 3.76 -0.0340 17-2061 Computer Hardware Engineers 172061 0.57 0.66 0.50 0.65 0.46 0.57 -0.0230 17-2070 Electrical and Electronics Engineers 172070 2.89 2.84 3.39 2.88 3.05 3.01 0.0360 17-2081 Environmental Engineers 172081 0.34 0.33 0.32 0.31 0.30 0.32 -0.0100 17-2000 Engineers 1720XX 0.22 0.15 0.14 0.24 0.22 0.20 0.0090 17-2110 Industrial Engineers, Including Health and Safety 172110 2.16 2.31 2.42 2.47 2.46 2.36 0.0760 17-2121 Marine Engineers and Naval Architects 172121 0.33 0.31 0.37 0.28 0.17 0.29 -0.0350 17-2131 Materials Engineers 172131 0.59 0.48 0.43 0.53 0.42 0.49 -0.0290

14 | P a g e
OCCSOC - Definitions OCCSOC
Years - Proportion of Veteran Workforce in STEM Occupation (2012 to 2016)
Trend 2012 2013 2014 2015 2016 Total
17-2141 Mechanical Engineers 172141 2.80 2.69 2.77 2.74 2.79 2.76 0.0030 17-2000 Engineers 1721XX 0.47 0.42 0.30 0.32 0.37 0.38 -0.0300 17-2000 Engineers 1721YY 7.25 7.41 7.02 7.36 6.54 7.12 -0.1470 17-3010 Drafters 173010 1.94 1.86 2.01 2.18 2.15 2.02 0.0740 17-3020 Engineering Technicians, Except Drafters 173020 9.24 10.47 9.08 8.58 8.42 9.17 -0.3530 17-3031 Surveying and Mapping Technicians 173031 1.18 0.96 1.01 0.86 0.99 1.00 -0.0480 19-1010 Agricultural and Food Scientists 191010 0.27 0.23 0.13 0.16 0.12 0.18 -0.0370 19-1020 Biological Scientists 191020 0.49 0.39 0.46 0.33 0.34 0.40 -0.0360 19-1030 Conservation Scientists and Foresters 191030 0.42 0.34 0.26 0.25 0.27 0.31 -0.0390 19-1000 Life Scientists 1910XX 0.45 0.43 0.51 0.60 0.47 0.49 0.0210 19-2010 Astronomers and Physicists 192010 0.15 0.15 0.16 0.11 0.22 0.16 0.0100 19-2021 Atmospheric and Space Scientists 192021 0.26 0.20 0.28 0.23 0.24 0.24 -0.0010 19-2030 Chemists and Materials Scientists 192030 0.52 0.46 0.42 0.42 0.31 0.43 -0.0460 19-2040 Environmental Scientists and Geoscientists 192040 0.76 0.76 0.64 0.62 0.68 0.70 -0.0300 19-2099 Physical Scientists, All Other 192099 0.82 1.08 1.03 0.72 0.77 0.88 -0.0460 19-4011 Agricultural and Food Science Technicians 194011 0.26 0.33 0.34 0.29 0.26 0.30 -0.0040 19-4021 Biological Technicians 194021 0.18 0.14 0.16 0.19 0.14 0.16 -0.0030 19-4031 Chemical Technicians 194031 0.88 0.76 0.80 0.69 0.73 0.78 -0.0370 19-4000 Life, Physical, and Social Science Technicians 1940XX 0.23 0.41 0.39 0.31 0.29 0.33 0.0020 19-4000 Life, Physical, and Social Science Technicians 1940YY 1.30 1.36 1.66 1.66 1.74 1.54 0.1180 41-9031 Sales Engineers 419031 0.64 0.52 0.38 0.40 0.47 0.48 -0.0460

15 | P a g e
Figure 1. Percent of the Veteran Workforce by Six STEM Occupations over the 2012 to 2016 Time Period
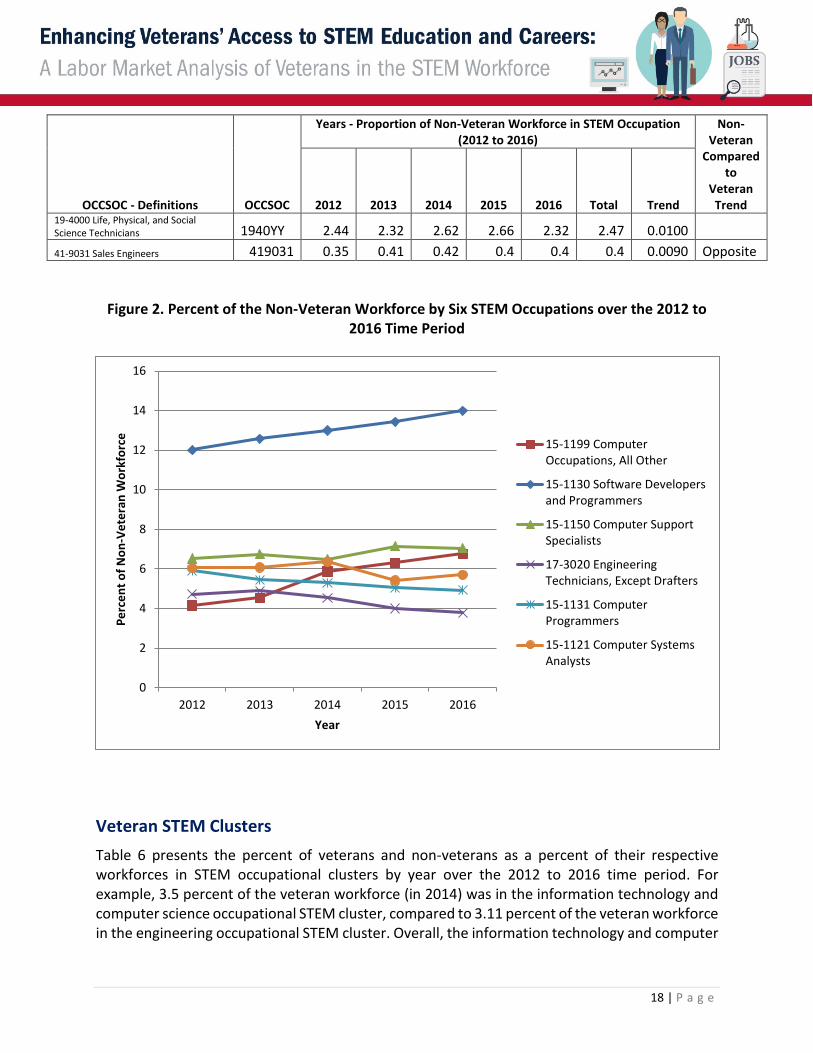
Table 5 presents the percentage of the non-veteran workforce (in the labor force and 18 years of age and over) for each year that is in each of the 49 STEM occupations (e.g., the percentages for each year sum to 100 percent). The first row of percentages presented in the table represents the proportion of the non-veteran workforce that is in the STEM workforce for each year. These annual percentages result in an overall trend for the 2012 to 2016 time period of 0.1830, i.e., the percentage of the non-veteran workforce in STEM occupations grew 0.183 percentage points per year over the 2012 to 2016 time period.
The STEM occupation exhibiting the largest percentage of the non-veteran workforce for a single year over the 2012 to 2016 time period is Software Developers and Programmers (occupational code 15-1130) at 14 percent for 2016. The last column of the table provides a trend for the five year time period for each occupation. Of the 49 occupations, 20 exhibit a positive trend value for the 2012 to 2016 time period. The largest positive trend value is exhibited by Computer Occupations, All Other (occupational code 15-1199) with a 0.7 percentage point increase per year for the 2012 to 2016 time period, followed by Software Developers and Programmers occupation (occupational code 15-113X) at 0.483 and Computer Support Specialists occupation (occupational code 15-1150) at 0.145 (see figure below). The largest negative trend for an occupation for the 2012 to 2016 time period is exhibited by the Engineering Technicians, Except Drafters occupation (occupation code 17-3020) at -0.2780, preceded by Computer Programmers
0
2
4
6
8
10
12
2012 2013 2014 2015 2016
Perc
ent o
f Vet
eran
Wor
kfor
ce
15-1130 Software Developersand Programmers
17-3020 EngineeringTechnicians, Except Drafters
15-1150 Computer SupportSpecialists
17-2000 Engineers
15-1150 Computer SupportSpecialists
11-3021 Computer andInformation Systems Managers

16 | P a g e
occupation (occupational code 15-1131) at -0.2400 and Computer Systems Analysts occupation (occupational code 15-1121) at -0.1360 (see figure below).
There are 14 occupations that exhibit a trend value less than 0.01 which is relatively flat: Natural Sciences Managers (occupational code 11-9121) at 0.0010; Actuaries (occupational code 15-2011) at 0.0010; Civil Engineers (occupational code 17-2051) at 0.0050; Industrial Engineers, Including Health and Safety (occupational code 17-2110) at -0.0030; Marine Engineers and Naval Architects (occupational code 17-2121) at -0.0010; Materials Engineers (occupational code 17-2131) at 0.0060; Engineers (occupational code 17-2000) at 0.0000; Life Scientists (occupational code 19-1000) at -0.0080; Astronomers and Physicists (occupational code 19-2010) at -0.0090; Atmospheric and Space Scientists (occupational code 19-2021) at -0.0020; Agricultural and Food Science Technicians (occupational code 19-4011) at 0.0050; Biological Technicians (occupational code 19-4021) at 0.0020; Life, Physical, and Social Science Technicians (occupational code 19-4000) at -0.0090; and Sales Engineers (occupational code 41-9031) at 0.0090.
Table 5. Proportion (Percent) of the Non-Veteran Workforce by STEM Occupation over the 2012 to 2016 Time Period
OCCSOC - Definitions OCCSOC
Years - Proportion of Non-Veteran Workforce in STEM Occupation (2012 to 2016)
Non-Veteran
Compared to
Veteran Trend 2012 2013 2014 2015 2016 Total Trend
STEM Occupations
Non-Veterans 5.15 5.48 5.57 5.73 5.94 5.58 0.1830
11-3021 Computer and Information Systems Managers 113021 6.69 6.64 6.68 6.81 6.92 6.75 0.0630 11-9041 Architectural and Engineering Managers 119041 1.89 1.81 1.86 1.81 1.82 1.84 -0.0140 11-9121 Natural Sciences Managers 119121 0.25 0.27 0.21 0.26 0.26 0.25 0.0010 Opposite 15-1111 Computer and Information Research Scientists 151111 0.15 0.17 0.18 0.23 0.24 0.2 0.0240 Opposite 15-1121 Computer Systems Analysts 151121 6.05 6.08 6.36 5.42 5.7 5.91 -0.1360 15-1122 Information Security Analysts 151122 0.6 0.6 0.61 0.66 0.76 0.65 0.0380 15-1131 Computer Programmers 151131 5.92 5.45 5.29 5.05 4.92 5.31 -0.2400 15-1134 Web Developers 151134 2.37 2.32 2.28 2.24 2.2 2.28 -0.0420 15-1130 Software Developers and Programmers 15113X 12.01 12.58 13 13.43 14 13.05 0.4830 15-1141 Database Administrators 151141 1.37 1.46 1.42 1.39 1.28 1.38 -0.0250 15-1142 Network and Computer Systems Administrators 151142 2.52 2.58 2.47 2.31 2.22 2.41 -0.0870 15-1143 Computer Network Architects 151143 1.09 1.1 1.12 1.1 1 1.08 -0.0180 Opposite 15-1150 Computer Support Specialists 151150 6.53 6.74 6.5 7.15 7.05 6.81 0.1450 15-1199 Computer Occupations, All Other 151199 4.16 4.53 5.88 6.31 6.77 5.58 0.7000 15-2011 Actuaries 152011 0.31 0.35 0.37 0.32 0.33 0.33 0.0010 15-2031 Operations Research Analysts 152031 1.59 1.6 1.52 1.51 1.4 1.52 -0.0470 Opposite

17 | P a g e
OCCSOC - Definitions OCCSOC
Years - Proportion of Non-Veteran Workforce in STEM Occupation (2012 to 2016)
Non-Veteran
Compared to
Veteran Trend 2012 2013 2014 2015 2016 Total Trend
17-1010 Architects, Except Naval 171010 2.34 2.45 2.29 2.23 2.26 2.31 -0.0380 17-1020 Surveyors, Cartographers, and Photogrammetrists 171020 0.5 0.47 0.48 0.39 0.39 0.45 -0.0300 Opposite 17-2011 Aerospace Engineers 172011 1.71 1.56 1.41 1.34 1.36 1.47 -0.0920 17-2041 Chemical Engineers 172041 0.7 0.71 0.66 0.77 0.73 0.71 0.0120 Opposite 17-2051 Civil Engineers 172051 3.9 3.78 3.55 3.73 3.95 3.78 0.0050 Opposite 17-2061 Computer Hardware Engineers 172061 0.72 0.65 0.61 0.57 0.55 0.62 -0.0420 17-2070 Electrical and Electronics Engineers 172070 2.69 2.38 2.31 2.3 2.24 2.37 -0.0980 Opposite 17-2081 Environmental Engineers 172081 0.43 0.36 0.34 0.35 0.36 0.37 -0.0150 17-2000 Engineers 1720XX 0.23 0.21 0.18 0.16 0.18 0.19 -0.0150 Opposite 17-2110 Industrial Engineers, Including Health and Safety 172110 2.23 2.37 2.17 2.3 2.25 2.26 -0.0030 Opposite 17-2121 Marine Engineers and Naval Architects 172121 0.16 0.14 0.16 0.13 0.16 0.15 -0.0010 17-2131 Materials Engineers 172131 0.41 0.39 0.4 0.47 0.4 0.42 0.0060 Opposite 17-2141 Mechanical Engineers 172141 2.71 2.77 2.77 2.78 2.96 2.8 0.0510 17-2000 Engineers 1721XX 0.44 0.41 0.48 0.49 0.4 0.44 0.0000 Opposite 17-2000 Engineers 1721YY 5.92 6.13 6.18 6.22 6.01 6.09 0.0270 Opposite 17-3010 Drafters 173010 2.27 2.01 1.93 1.88 1.89 1.99 -0.0890 Opposite 17-3020 Engineering Technicians, Except Drafters 173020 4.73 4.89 4.54 4.01 3.78 4.37 -0.2780 17-3031 Surveying and Mapping Technicians 173031 0.89 0.85 0.83 0.74 0.7 0.8 -0.0490 19-1010 Agricultural and Food Scientists 191010 0.44 0.42 0.3 0.31 0.3 0.35 -0.0390 19-1020 Biological Scientists 191020 1.06 1.02 0.91 0.95 0.97 0.98 -0.0250 19-1030 Conservation Scientists and Foresters 191030 0.42 0.35 0.28 0.28 0.3 0.32 -0.0310 19-1000 Life Scientists 1910XX 1.7 1.78 1.74 1.8 1.65 1.73 -0.0080 Opposite 19-2010 Astronomers and Physicists 192010 0.16 0.14 0.13 0.11 0.13 0.13 -0.0090 Opposite 19-2021 Atmospheric and Space Scientists 192021 0.13 0.13 0.12 0.11 0.13 0.12 -0.0020 19-2030 Chemists and Materials Scientists 192030 1.09 1.08 1 0.98 0.98 1.02 -0.0320 19-2040 Environmental Scientists and Geoscientists 192040 1.03 1.05 0.92 0.89 0.93 0.96 -0.0360 19-2099 Physical Scientists, All Other 192099 2.77 2.77 2.64 2.79 2.85 2.77 0.0180 Opposite 19-4011 Agricultural and Food Science Technicians 194011 0.46 0.41 0.5 0.48 0.45 0.46 0.0050 Opposite 19-4021 Biological Technicians 194021 0.29 0.25 0.3 0.31 0.27 0.28 0.0020 Opposite 19-4031 Chemical Technicians 194031 0.95 0.78 0.84 0.83 0.71 0.82 -0.0430 19-4000 Life, Physical, and Social Science Technicians 1940XX 0.24 0.25 0.22 0.24 0.2 0.23 -0.0090 Opposite
18 | P a g e
OCCSOC - Definitions OCCSOC
Years - Proportion of Non-Veteran Workforce in STEM Occupation (2012 to 2016)
Non-Veteran
Compared to
Veteran Trend 2012 2013 2014 2015 2016 Total Trend
19-4000 Life, Physical, and Social Science Technicians 1940YY 2.44 2.32 2.62 2.66 2.32 2.47 0.0100 41-9031 Sales Engineers 419031 0.35 0.41 0.42 0.4 0.4 0.4 0.0090 Opposite
Figure 2. Percent of the Non-Veteran Workforce by Six STEM Occupations over the 2012 to 2016 Time Period
0
2
4
6
8
10
12
14
16
2012 2013 2014 2015 2016
Perc
ent o
f Non
-Vet
eran
Wor
kfor
ce
Year
15-1199 ComputerOccupations, All Other
15-1130 Software Developersand Programmers
15-1150 Computer SupportSpecialists
17-3020 EngineeringTechnicians, Except Drafters
15-1131 ComputerProgrammers
15-1121 Computer SystemsAnalysts
Veteran STEM Clusters Table 6 presents the percent of veterans and non-veterans as a percent of their respective workforces in STEM occupational clusters by year over the 2012 to 2016 time period. For example, 3.5 percent of the veteran workforce (in 2014) was in the information technology and computer science occupational STEM cluster, compared to 3.11 percent of the veteran workforce in the engineering occupational STEM cluster. Overall, the information technology and computer

19 | P a g e
science occupational STEM cluster exhibited the highest percentage of the veteran workforce across all STEM occupational clusters (3.51 percent for the 2012 to 2016 time period), followed by the engineering occupational STEM cluster (3.11 percent for the 2012 to 2016 time period) and the supervisor/management occupational STEM cluster (0.71 percent for the 2012 to 2016 time period). This was nearly true for the non-veteran workforce though the percentages are quite different and the third highest STEM cluster is different: 2.49 percent for the information technology and computer science occupational STEM cluster, 1.78 percent for the engineering occupational STEM cluster, and 0.71 percent for the life and physical sciences occupational STEM cluster.
When the analysis is restricted to STEM veteran and non-veteran workforces, the percentages are much larger with the information technology and computer science occupational STEM cluster for non-veterans reflecting the largest percentage, 44.65 percent, followed by the information technology and computer science occupational STEM cluster for veterans, 43.33 percent. The correlation between distributions of veterans and non-veterans is quite high, 0.9754 overall.
Table 6. Proportion (Percent) of the Veteran and Non-Veteran Workforce by STEM Occupational Cluster (5) over the 2012 to 2016 Time Period
Major Occupation Years - Proportion of Workforce in Major STEM Occupational
Clusters (2012 to 2016) Veterans 2012 2013 2014 2015 2016 Total Trend
Non-STEM 92.40 91.97 91.90 91.73 91.36 91.89 -0.2320 Information Technology and Computer Science 3.17 3.40 3.50 3.66 3.90 3.51 0.1720 Mathematics 0.21 0.22 0.21 0.24 0.24 0.22 0.0080 Engineering 3.01 3.17 3.11 3.09 3.17 3.11 0.0240 Life and Physical Sciences 0.53 0.57 0.59 0.54 0.57 0.56 0.0050 Supervisor/Management 0.67 0.67 0.69 0.73 0.77 0.71 0.0260
Non-Veterans 2012 2013 2014 2015 2016 Total Trend
Non-STEM 94.85 94.52 94.43 94.27 94.06 94.42 -0.1830 Information Technology and Computer Science 2.20 2.39 2.51 2.60 2.74 2.49 0.1290 Mathematics 0.10 0.11 0.11 0.11 0.10 0.10 0.0000 Engineering 1.72 1.81 1.77 1.79 1.84 1.78 0.0220 Life and Physical Sciences 0.68 0.70 0.70 0.73 0.72 0.71 0.0110 Supervisor/Management 0.45 0.48 0.49 0.51 0.53 0.49 0.0190
Veterans 2012 2013 2014 2015 2016 Total Trend Information Technology and Computer Science 41.78 42.39 43.22 44.31 45.07 43.33 0.8500

20 | P a g e
Mathematics 2.75 2.76 2.58 2.95 2.75 2.76 0.0190 Engineering 39.63 39.42 38.39 37.33 36.67 38.31 -0.8010 Life and Physical Sciences 7.01 7.07 7.24 6.57 6.59 6.90 -0.1340 Supervisor/Management 8.84 8.36 8.57 8.84 8.92 8.71 0.0640
Non-Veterans 2012 2013 2014 2015 2016 Total Trend Information Technology and Computer Science 42.77 43.63 45.10 45.30 46.13 44.65 0.8390 Mathematics 1.90 1.94 1.89 1.84 1.73 1.86 -0.0440 Engineering 33.32 32.96 31.71 31.25 30.97 31.99 -0.6410 Life and Physical Sciences 13.17 12.75 12.55 12.74 12.18 12.66 -0.1990 Supervisor/Management 8.83 8.72 8.75 8.87 9.00 8.84 0.0490
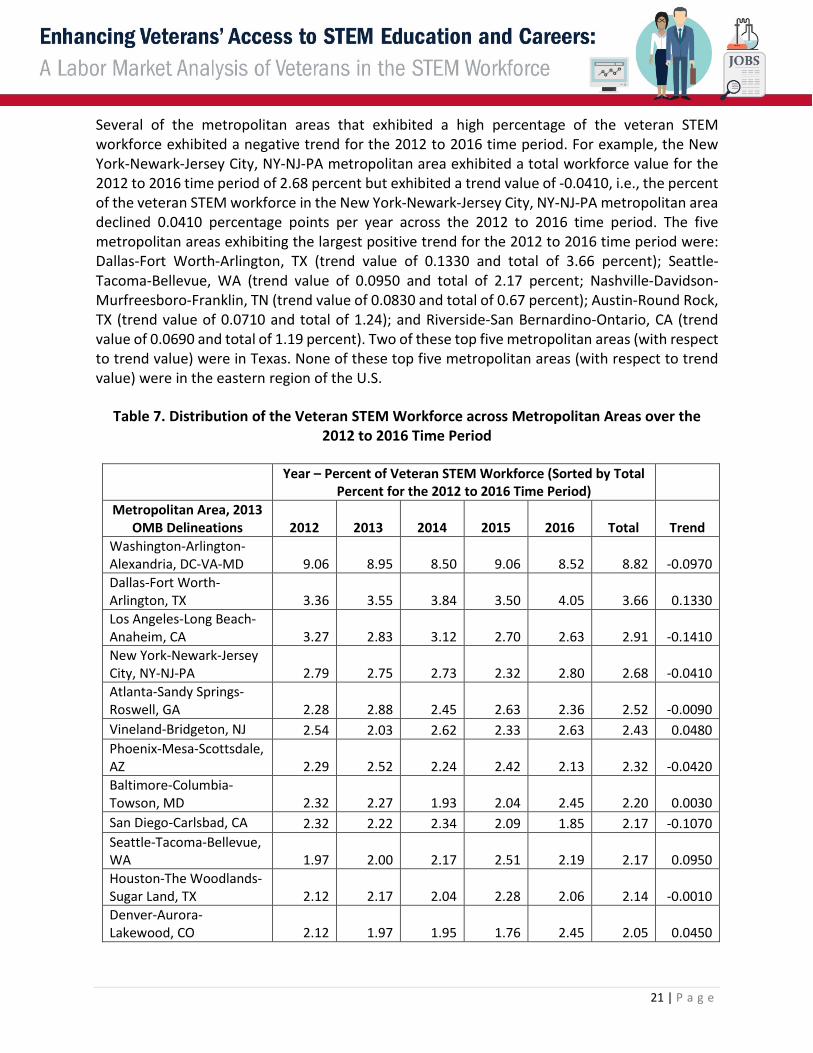
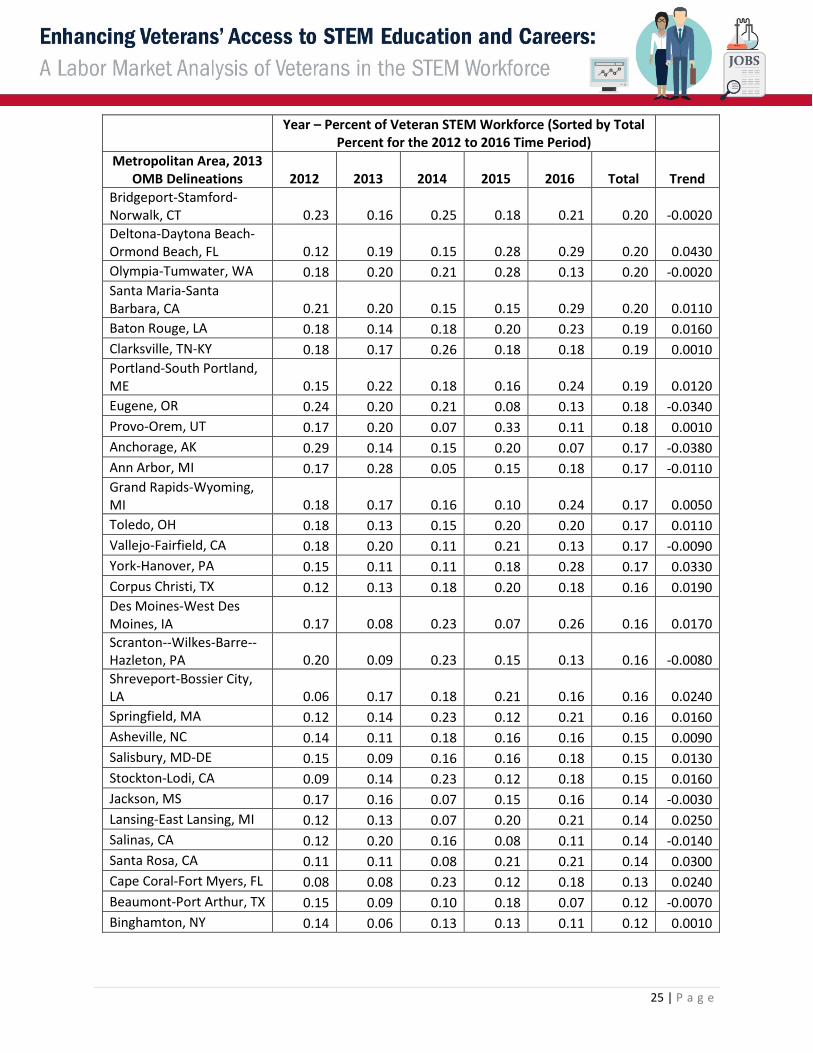
Veteran STEM All Metro Areas Table 7 presents the veteran STEM workforce as exists over the 2012 to 2016 time period by metropolitan area (2013 OMB delineations). Each yearly column and the Total column sum to 100 percent and the rows are sorted by the Total column, largest percentage to smallest percentage. Thus, the Washington-Arlington-Alexandria, DC-VA-MD metropolitan area exhibits the largest total percentage of the veteran STEM workforce (8.82 percent) over the U.S., while Laredo, TX exhibits the smallest percentage of the veteran STEM workforce (0.00959 percent) over the U.S metropolitan areas. The Washington-Arlington-Alexandria, DC-VA-MD metropolitan area is followed by the Dallas-Fort Worth-Arlington, TX metropolitan area (3.66 percent), and the Los Angeles-Long Beach-Anaheim, CA metropolitan area (2.91 percent).
Of the 260 metropolitan areas presented in the table, 234 metropolitan areas exhibit less than one (1) percent of the veteran STEM workforce, and 207 metropolitan areas exhibit less than 0.5 percent of the veteran STEM workforce. All of these percentages exclude 19.28 percent of the U.S. veteran STEM workforce who are located in unidentifiable (non-metropolitan) areas across the U.S. A similar pattern exists for the non-veteran STEM workforce; 236 metropolitan areas exhibit less than one (1) percent of the non-veteran STEM workforce and 217 metropolitan areas exhibit less than 0.5 percent of the non-veteran STEM workforce.
A trend value is calculated for each of the metropolitan areas. For example, the Washington-Arlington-Alexandria, DC-VA-MD metropolitan area exhibited a negative trend over the 2012 to 2016 time period of -0.097, i.e., the percent of the U.S. veteran STEM workforce in the Washington-Arlington-Alexandria, DC-VA-MD metropolitan area decreased (declined) 0.097 percentage points per year over the 2012 to 2016 time period. Of the 260 metropolitan areas presented in the table, 128 of the metropolitan areas (nearly 50 percent) exhibited positive growth for percent of the veteran STEM workforce over the 2012 to 2016 time period.
21 | P a g e
Several of the metropolitan areas that exhibited a high percentage of the veteran STEM workforce exhibited a negative trend for the 2012 to 2016 time period. For example, the New York-Newark-Jersey City, NY-NJ-PA metropolitan area exhibited a total workforce value for the 2012 to 2016 time period of 2.68 percent but exhibited a trend value of -0.0410, i.e., the percent of the veteran STEM workforce in the New York-Newark-Jersey City, NY-NJ-PA metropolitan area declined 0.0410 percentage points per year across the 2012 to 2016 time period. The five metropolitan areas exhibiting the largest positive trend for the 2012 to 2016 time period were: Dallas-Fort Worth-Arlington, TX (trend value of 0.1330 and total of 3.66 percent); Seattle-Tacoma-Bellevue, WA (trend value of 0.0950 and total of 2.17 percent; Nashville-Davidson-Murfreesboro-Franklin, TN (trend value of 0.0830 and total of 0.67 percent); Austin-Round Rock, TX (trend value of 0.0710 and total of 1.24); and Riverside-San Bernardino-Ontario, CA (trend value of 0.0690 and total of 1.19 percent). Two of these top five metropolitan areas (with respect to trend value) were in Texas. None of these top five metropolitan areas (with respect to trend value) were in the eastern region of the U.S.
Table 7. Distribution of the Veteran STEM Workforce across Metropolitan Areas over the 2012 to 2016 Time Period
Year – Percent of Veteran STEM Workforce (Sorted by Total
Percent for the 2012 to 2016 Time Period) Metropolitan Area, 2013
OMB Delineations 2012 2013 2014 2015 2016 Total Trend Washington-Arlington-Alexandria, DC-VA-MD 9.06 8.95 8.50 9.06 8.52 8.82 -0.0970 Dallas-Fort Worth-Arlington, TX 3.36 3.55 3.84 3.50 4.05 3.66 0.1330 Los Angeles-Long Beach-Anaheim, CA 3.27 2.83 3.12 2.70 2.63 2.91 -0.1410 New York-Newark-Jersey City, NY-NJ-PA 2.79 2.75 2.73 2.32 2.80 2.68 -0.0410 Atlanta-Sandy Springs-Roswell, GA 2.28 2.88 2.45 2.63 2.36 2.52 -0.0090 Vineland-Bridgeton, NJ 2.54 2.03 2.62 2.33 2.63 2.43 0.0480 Phoenix-Mesa-Scottsdale, AZ 2.29 2.52 2.24 2.42 2.13 2.32 -0.0420 Baltimore-Columbia-Towson, MD 2.32 2.27 1.93 2.04 2.45 2.20 0.0030 San Diego-Carlsbad, CA 2.32 2.22 2.34 2.09 1.85 2.17 -0.1070 Seattle-Tacoma-Bellevue, WA 1.97 2.00 2.17 2.51 2.19 2.17 0.0950 Houston-The Woodlands-Sugar Land, TX 2.12 2.17 2.04 2.28 2.06 2.14 -0.0010 Denver-Aurora-Lakewood, CO 2.12 1.97 1.95 1.76 2.45 2.05 0.0450

22 | P a g e
Year – Percent of Veteran STEM Workforce (Sorted by Total
Percent for the 2012 to 2016 Time Period) Metropolitan Area, 2013
OMB Delineations 2012 2013 2014 2015 2016 Total Trend Chicago-Naperville-Elgin, IL-IN-WI 2.02 1.94 1.81 1.84 1.84 1.89 -0.0460 Philadelphia-Camden-Wilmington, PA-NJ-D 1.80 2.00 1.95 2.04 1.53 1.86 -0.0500 Tampa-St. Petersburg-Clearwater, FL 1.77 1.60 1.86 1.69 1.76 1.74 0.0070 San Antonio-New Braunfels, TX 1.56 1.64 1.81 1.86 1.79 1.73 0.0680 Boston-Cambridge-Newton, MA-NH 1.62 1.86 1.77 1.66 1.56 1.69 -0.0320 Portland-Vancouver-Hillsboro, OR-WA 1.51 1.11 1.29 1.22 1.58 1.34 0.0250 San Francisco-Oakland-Hayward, CA 1.34 1.39 1.18 1.41 1.24 1.31 -0.0180 Austin-Round Rock, TX 1.15 1.19 1.18 1.18 1.51 1.24 0.0710 St. Louis, MO-IL 1.22 1.49 1.23 1.04 1.24 1.24 -0.0410 Miami-Fort Lauderdale-West Palm Beach, FL 1.18 1.22 1.24 1.08 1.30 1.20 0.0100 Riverside-San Bernardino-Ontario, CA 1.13 1.14 1.03 1.23 1.43 1.19 0.0690 Detroit-Warren-Dearborn, MI 1.39 1.03 1.24 1.00 0.93 1.12 -0.0950 Colorado Springs, CO 1.10 1.09 1.19 1.04 1.14 1.11 0.0030 Minneapolis-St. Paul-Bloomington, MN-WI 0.98 1.14 1.00 1.07 1.06 1.05 0.0090 Sacramento--Roseville--Arden-Arcade, CA 0.89 0.91 0.98 1.20 0.98 0.99 0.0470 Charlotte-Concord-Gastonia, NC-SC 0.93 0.77 1.05 1.27 0.91 0.98 0.0460 Kansas City, MO-KS 1.13 0.78 0.90 0.97 0.86 0.93 -0.0350 Jacksonville, FL 0.87 0.78 1.08 0.95 0.93 0.92 0.0290 Raleigh, NC 0.84 0.94 0.74 0.92 0.91 0.87 0.0120 Orlando-Kissimmee-Sanford, FL 0.72 0.74 0.77 0.95 0.94 0.82 0.0650 Pittsburgh, PA 0.84 0.86 0.93 0.66 0.75 0.81 -0.0380 Las Vegas-Henderson-Paradise, NV 0.55 0.78 0.92 0.85 0.83 0.78 0.0630 San Jose-Sunnyvale-Santa Clara, CA 0.90 0.89 0.69 0.71 0.57 0.75 -0.0840 Urban Honolulu, HI 0.63 0.78 0.70 0.79 0.63 0.71 0.0010 Columbus, OH 0.61 0.83 0.69 0.62 0.72 0.69 0.0010

23 | P a g e
Year – Percent of Veteran STEM Workforce (Sorted by Total
Percent for the 2012 to 2016 Time Period) Metropolitan Area, 2013
OMB Delineations 2012 2013 2014 2015 2016 Total Trend Nashville-Davidson--Murfreesboro--Frank 0.57 0.48 0.64 0.95 0.75 0.67 0.0830 Cincinnati, OH-KY-IN 0.67 0.56 0.65 0.64 0.76 0.66 0.0260 Cleveland-Elyria, OH 0.72 0.64 0.72 0.54 0.55 0.64 -0.0440 Omaha-Council Bluffs, NE-IA 0.69 0.58 0.72 0.59 0.62 0.64 -0.0130 Palm Bay-Melbourne-Titusville, FL 0.47 0.66 0.62 0.77 0.68 0.64 0.0530 Providence-Warwick, RI-MA 0.69 0.88 0.57 0.43 0.63 0.64 -0.0570 Richmond, VA 0.70 0.52 0.67 0.81 0.44 0.63 -0.0230 Tucson, AZ 0.66 0.59 0.64 0.66 0.49 0.61 -0.0270 Oklahoma City, OK 0.46 0.67 0.59 0.74 0.57 0.60 0.0290 Dayton, OH 0.57 0.48 0.69 0.59 0.62 0.59 0.0210 Huntsville, AL 0.50 0.81 0.41 0.46 0.63 0.57 -0.0090 Charleston-North Charleston, SC 0.47 0.58 0.46 0.49 0.73 0.55 0.0430 Indianapolis-Carmel-Anderson, IN 0.63 0.66 0.34 0.49 0.57 0.54 -0.0290 Louisville/Jefferson County, KY-IN 0.55 0.53 0.38 0.44 0.63 0.51 0.0070 Albuquerque, NM 0.44 0.53 0.56 0.49 0.47 0.50 0.0020 Hartford-West Hartford-East Hartford, CT 0.58 0.45 0.57 0.48 0.44 0.50 -0.0250 Worcester, MA-CT 0.41 0.44 0.52 0.38 0.49 0.45 0.0100 Greenville-Anderson-Mauldin, SC 0.50 0.30 0.46 0.53 0.39 0.43 0.0010 Memphis, TN-MS-AR 0.32 0.36 0.49 0.46 0.52 0.43 0.0500 Oxnard-Thousand Oaks-Ventura, CA 0.38 0.38 0.60 0.35 0.42 0.43 0.0050 Rochester, NY 0.52 0.38 0.42 0.36 0.41 0.42 -0.0240 Columbia, SC 0.47 0.33 0.28 0.49 0.46 0.41 0.0140 New Orleans-Metairie, LA 0.43 0.27 0.42 0.39 0.52 0.41 0.0300 Knoxville, TN 0.21 0.45 0.42 0.41 0.49 0.40 0.0520 Bremerton-Silverdale, WA 0.27 0.45 0.33 0.44 0.47 0.39 0.0390 Salt Lake City, UT 0.32 0.39 0.38 0.30 0.46 0.37 0.0190 Augusta-Richmond County, GA-SC 0.50 0.31 0.34 0.35 0.31 0.36 -0.0340 Pensacola-Ferry Pass-Brent, FL 0.23 0.48 0.41 0.26 0.37 0.35 0.0060

24 | P a g e
Year – Percent of Veteran STEM Workforce (Sorted by Total
Percent for the 2012 to 2016 Time Period) Metropolitan Area, 2013
OMB Delineations 2012 2013 2014 2015 2016 Total Trend Albany-Schenectady-Troy, NY 0.23 0.34 0.51 0.31 0.33 0.34 0.0170 Birmingham-Hoover, AL 0.43 0.34 0.28 0.26 0.37 0.34 -0.0200 Boise City, ID 0.26 0.33 0.31 0.38 0.34 0.32 0.0210 Milwaukee-Waukesha-West Allis, WI 0.34 0.25 0.34 0.38 0.29 0.32 0.0030 Norwich-New London, CT 0.21 0.42 0.26 0.33 0.36 0.32 0.0210 Manchester-Nashua, NH 0.31 0.23 0.29 0.33 0.41 0.31 0.0300 Ogden-Clearfield, UT 0.29 0.25 0.42 0.28 0.31 0.31 0.0070 Buffalo-Cheektowaga-Niagara Falls, NY 0.37 0.31 0.33 0.21 0.28 0.30 -0.0280 Harrisburg-Carlisle, PA 0.26 0.30 0.25 0.26 0.39 0.29 0.0220 Montgomery, Al 0.34 0.30 0.25 0.33 0.26 0.29 -0.0130 Syracuse, NY 0.20 0.38 0.29 0.21 0.33 0.28 0.0090 El Paso, TX 0.32 0.34 0.18 0.23 0.24 0.27 -0.0270 Greensboro-High Point, NC 0.38 0.30 0.23 0.26 0.16 0.27 -0.0480 Spokane-Spokane Valley, WA 0.26 0.28 0.36 0.30 0.16 0.27 -0.0180 Wichita, KS 0.29 0.25 0.29 0.26 0.18 0.26 -0.0210 Bakersfield, CA 0.34 0.34 0.20 0.13 0.21 0.25 -0.0470 North Port-Sarasota-Bradenton, FL 0.24 0.16 0.34 0.23 0.28 0.25 0.0150 Winston-Salem, NC 0.26 0.33 0.29 0.12 0.23 0.25 -0.0270 Akron, OH 0.27 0.25 0.13 0.26 0.26 0.24 -0.0010 Chattanooga, TN-GA 0.29 0.22 0.21 0.23 0.26 0.24 -0.0050 Allentown-Bethlehem-Easton, PA-NJ 0.18 0.30 0.25 0.18 0.26 0.23 0.0040 Fayetteville, NC 0.26 0.20 0.25 0.25 0.21 0.23 -0.0050 Fort Collins, CO 0.14 0.30 0.18 0.31 0.23 0.23 0.0190 Lakeland-Winter Haven, FL 0.23 0.19 0.23 0.25 0.24 0.23 0.0080 Reno, NV 0.23 0.22 0.23 0.16 0.33 0.23 0.0140 New Haven-Milford, CT 0.26 0.23 0.20 0.26 0.15 0.22 -0.0190 Fresno, CA 0.17 0.20 0.28 0.16 0.26 0.21 0.0140 Gulfport-Biloxi-Pascagoula, MS 0.20 0.17 0.25 0.21 0.21 0.21 0.0060 Little Rock-North Little Rock-Conway, AR 0.15 0.13 0.25 0.30 0.26 0.21 0.0390
25 | P a g e
Year – Percent of Veteran STEM Workforce (Sorted by Total
Percent for the 2012 to 2016 Time Period) Metropolitan Area, 2013
OMB Delineations 2012 2013 2014 2015 2016 Total Trend Bridgeport-Stamford-Norwalk, CT 0.23 0.16 0.25 0.18 0.21 0.20 -0.0020 Deltona-Daytona Beach-Ormond Beach, FL 0.12 0.19 0.15 0.28 0.29 0.20 0.0430 Olympia-Tumwater, WA 0.18 0.20 0.21 0.28 0.13 0.20 -0.0020 Santa Maria-Santa Barbara, CA 0.21 0.20 0.15 0.15 0.29 0.20 0.0110 Baton Rouge, LA 0.18 0.14 0.18 0.20 0.23 0.19 0.0160 Clarksville, TN-KY 0.18 0.17 0.26 0.18 0.18 0.19 0.0010 Portland-South Portland, ME 0.15 0.22 0.18 0.16 0.24 0.19 0.0120 Eugene, OR 0.24 0.20 0.21 0.08 0.13 0.18 -0.0340 Provo-Orem, UT 0.17 0.20 0.07 0.33 0.11 0.18 0.0010 Anchorage, AK 0.29 0.14 0.15 0.20 0.07 0.17 -0.0380 Ann Arbor, MI 0.17 0.28 0.05 0.15 0.18 0.17 -0.0110 Grand Rapids-Wyoming, MI 0.18 0.17 0.16 0.10 0.24 0.17 0.0050 Toledo, OH 0.18 0.13 0.15 0.20 0.20 0.17 0.0110 Vallejo-Fairfield, CA 0.18 0.20 0.11 0.21 0.13 0.17 -0.0090 York-Hanover, PA 0.15 0.11 0.11 0.18 0.28 0.17 0.0330 Corpus Christi, TX 0.12 0.13 0.18 0.20 0.18 0.16 0.0190 Des Moines-West Des Moines, IA 0.17 0.08 0.23 0.07 0.26 0.16 0.0170 Scranton--Wilkes-Barre--Hazleton, PA 0.20 0.09 0.23 0.15 0.13 0.16 -0.0080 Shreveport-Bossier City, LA 0.06 0.17 0.18 0.21 0.16 0.16 0.0240 Springfield, MA 0.12 0.14 0.23 0.12 0.21 0.16 0.0160 Asheville, NC 0.14 0.11 0.18 0.16 0.16 0.15 0.0090 Salisbury, MD-DE 0.15 0.09 0.16 0.16 0.18 0.15 0.0130 Stockton-Lodi, CA 0.09 0.14 0.23 0.12 0.18 0.15 0.0160 Jackson, MS 0.17 0.16 0.07 0.15 0.16 0.14 -0.0030 Lansing-East Lansing, MI 0.12 0.13 0.07 0.20 0.21 0.14 0.0250 Salinas, CA 0.12 0.20 0.16 0.08 0.11 0.14 -0.0140 Santa Rosa, CA 0.11 0.11 0.08 0.21 0.21 0.14 0.0300 Cape Coral-Fort Myers, FL 0.08 0.08 0.23 0.12 0.18 0.13 0.0240 Beaumont-Port Arthur, TX 0.15 0.09 0.10 0.18 0.07 0.12 -0.0070 Binghamton, NY 0.14 0.06 0.13 0.13 0.11 0.12 0.0010

26 | P a g e
Year – Percent of Veteran STEM Workforce (Sorted by Total
Percent for the 2012 to 2016 Time Period) Metropolitan Area, 2013
OMB Delineations 2012 2013 2014 2015 2016 Total Trend Fayetteville-Springdale-Rogers, AR-MO 0.14 0.16 0.08 0.12 0.10 0.12 -0.0120 Lincoln, NE 0.09 0.14 0.18 0.08 0.10 0.12 -0.0040 Mobile, AL 0.12 0.09 0.15 0.13 0.11 0.12 0.0020 Myrtle Beach-Conway-North Myrtle Beach, SC 0.15 0.14 0.07 0.13 0.10 0.12 -0.0110 Port St. Lucie, FL 0.12 0.17 0.15 0.08 0.10 0.12 -0.0130 San Luis Obispo-Paso Robles-Arroyo Grande, CA 0.14 0.14 0.10 0.12 0.08 0.12 -0.0140 Canton-Massillon, OH 0.05 0.14 0.13 0.13 0.08 0.11 0.0050 Erie, PA 0.14 0.16 0.07 0.12 0.05 0.11 -0.0220 Gainesville, FL 0.15 0.16 0.07 0.08 0.10 0.11 -0.0180 Lynchburg, VA 0.14 0.09 0.11 0.12 0.10 0.11 -0.0050 Reading, PA 0.09 0.13 0.21 0.07 0.03 0.11 -0.0180 Youngstown-Warren-Boardman, OH-PA 0.05 0.22 0.11 0.05 0.11 0.11 -0.0050 Amarillo, TX 0.09 0.14 0.16 0.07 0.05 0.10 -0.0150 Fort Wayne, IN 0.09 0.13 0.08 0.10 0.11 0.10 0.0010 Kalamazoo-Portage, MI 0.14 0.08 0.10 0.12 0.05 0.10 -0.0140 Lafayette, LA 0.11 0.14 0.15 0.03 0.05 0.10 -0.0230 Lancaster, PA 0.08 0.09 0.10 0.10 0.15 0.10 0.0150 Modesto, CA 0.12 0.06 0.18 0.08 0.07 0.10 -0.0080 Santa Fe, NM 0.12 0.11 0.11 0.12 0.05 0.10 -0.0130 Springfield, IL 0.08 0.08 0.15 0.10 0.10 0.10 0.0060 Trenton, NJ 0.09 0.11 0.16 0.07 0.08 0.10 -0.0060 Yuba City, CA 0.09 0.11 0.05 0.13 0.10 0.10 0.0040 Yuma, AZ 0.09 0.09 0.05 0.10 0.15 0.10 0.0130 Bloomington, IL 0.06 0.14 0.08 0.10 0.07 0.09 -0.0020 Rockford, IL 0.11 0.13 0.07 0.08 0.08 0.09 -0.0110 Santa Cruz-Watsonville, CA 0.18 0.09 0.10 0.02 0.05 0.09 -0.0330 Utica-Rome, NY 0.12 0.09 0.07 0.10 0.07 0.09 -0.0090 Dover, DE 0.11 0.08 0.07 0.10 0.07 0.08 -0.0060 Hickory-Lenoir-Morganton, NC 0.08 0.11 0.08 0.10 0.05 0.08 -0.0070 Las Cruces, NM 0.06 0.14 0.07 0.13 . 0.08 0.0140 Ocala, FL 0.09 0.09 0.07 0.08 0.05 0.08 -0.0090 Roanoke, VA 0.09 0.08 0.10 0.05 0.08 0.08 -0.0050

27 | P a g e
Year – Percent of Veteran STEM Workforce (Sorted by Total
Percent for the 2012 to 2016 Time Period) Metropolitan Area, 2013
OMB Delineations 2012 2013 2014 2015 2016 Total Trend Springfield, OH 0.06 0.06 0.11 0.12 0.03 0.08 0.0000 Topeka, KS 0.05 0.05 0.10 0.13 0.07 0.08 0.0120 Waco, TX 0.08 0.08 0.08 0.08 0.07 0.08 -0.0020 Wilmington, NC 0.06 0.11 0.11 0.03 0.08 0.08 -0.0040 Barnstable Town, MA 0.09 0.09 0.07 0.02 0.08 0.07 -0.0090 Blacksburg-Christiansburg-Radford, VA 0.02 0.06 0.10 0.07 0.11 0.07 0.0190 Burlington, NC 0.08 0.06 0.07 0.10 0.05 0.07 -0.0020 Champaign-Urbana, IL 0.08 0.09 0.05 0.03 0.10 0.07 -0.0020 Charleston, WV 0.05 0.11 0.07 0.08 0.03 0.07 -0.0070 College Station-Bryan, TX 0.08 0.08 0.07 0.08 0.03 0.07 -0.0100 Daphne-Fairhope-Foley, AL 0.09 0.05 0.07 0.12 0.03 0.07 -0.0050 Florence, SC 0.12 0.05 0.10 0.05 0.03 0.07 -0.0180 Jefferson City, MO 0.05 0.02 0.05 0.16 0.10 0.07 0.0240 Lubbock, TX 0.09 0.03 0.03 0.12 0.10 0.07 0.0110 Naples-Immokalee-Marco Island, FL 0.06 0.06 0.05 0.10 0.07 0.07 0.0060 Spartanburg, SC 0.12 0.03 0.05 0.07 0.08 0.07 -0.0040 Springfield, MO 0.09 0.05 0.08 0.03 0.08 0.07 -0.0040 Bloomington, IN 0.06 0.03 0.03 0.08 0.11 0.06 0.0150 Burlington-South Burlington, VT 0.05 0.11 . 0.08 0.07 0.06 0.0010 Decatur, AL 0.06 0.05 0.08 0.08 0.05 0.06 0.0010 Flagstaff, AZ 0.03 0.06 0.08 0.10 0.02 0.06 0.0020 Glens Falls, NY 0.08 0.11 0.05 0.03 0.02 0.06 -0.0200 Goldsboro, NC 0.08 0.08 0.08 0.05 0.03 0.06 -0.0130 Hilton Head Island-Bluffton-Beaufort, SC 0.02 0.06 0.05 0.07 0.11 0.06 0.0190 Joplin, MO 0.06 0.06 0.08 0.07 0.05 0.06 -0.0010 Medford, OR 0.03 0.09 0.07 0.07 0.05 0.06 0.0020 Niles-Benton Harbor, MI 0.06 0.08 0.05 0.08 0.03 0.06 -0.0060 Ocean City, NJ 0.14 0.02 0.05 0.05 0.03 0.06 -0.0190 Pittsfield, MA 0.05 0.06 0.07 0.10 0.05 0.06 0.0040 Wichita Falls, TX 0.06 0.03 0.07 0.07 0.08 0.06 0.0080 Atlantic City-Hammonton, NJ 0.11 0.02 0.02 0.03 0.08 0.05 -0.0050

28 | P a g e
Year – Percent of Veteran STEM Workforce (Sorted by Total
Percent for the 2012 to 2016 Time Period) Metropolitan Area, 2013
OMB Delineations 2012 2013 2014 2015 2016 Total Trend Bangor, ME 0.06 0.13 0.02 0.03 0.02 0.05 -0.0180 Brownsville-Harlingen, TX 0.05 0.05 0.05 0.07 0.05 0.05 0.0020 Decatur, IL 0.09 0.03 0.07 0.05 0.03 0.05 -0.0100 Gainesville, GA 0.06 0.02 0.03 0.13 0.02 0.05 0.0030 Jackson, MI 0.03 0.06 0.05 0.05 0.07 0.05 0.0070 Janesville-Beloit, WI 0.06 0.06 0.03 0.07 0.05 0.05 -0.0010 Lebanon, PA 0.06 0.05 0.03 0.03 0.08 0.05 0.0020 Napa, CA 0.06 0.06 . 0.05 0.07 0.05 0.0010 Odessa, TX 0.08 0.06 . 0.12 0.02 0.05 -0.0060 Saginaw, MI 0.09 0.06 0.05 . 0.05 0.05 -0.0089 Sebastian-Vero Beach, FL 0.02 0.03 0.03 0.07 0.10 0.05 0.0200 Sheboygan, WI 0.11 0.03 0.02 0.07 0.05 0.05 -0.0080 St. Joseph, MO-KS 0.06 0.02 0.03 0.05 0.08 0.05 0.0070 State College, PA 0.05 0.02 0.05 0.08 0.07 0.05 0.0100 Tuscaloosa, AL 0.05 0.03 0.03 0.08 0.07 0.05 0.0090 Visalia-Porterville, CA 0.02 0.06 0.03 0.12 0.03 0.05 0.0080 Wenatchee, WA 0.08 0.03 0.07 0.07 0.03 0.05 -0.0060 Anniston-Oxford-Jacksonville, AL 0.03 0.02 0.03 0.07 0.08 0.04 0.0150 Bellingham, WA 0.06 0.06 0.05 . 0.05 0.04 -0.0029 Bend-Redmond, OR 0.03 0.03 0.03 0.07 0.03 0.04 0.0040 Chico, CA 0.06 0.03 0.02 0.03 0.03 0.04 -0.0060 Columbia, MO 0.03 0.06 0.05 0.03 0.05 0.04 0.0010 Greenville, NC 0.03 0.08 0.05 0.02 . 0.04 -0.0060 Hammond, LA 0.02 0.03 0.03 0.12 0.03 0.04 0.0110 Homosassa Springs, FL 0.05 0.06 0.02 0.03 0.03 0.04 -0.0070 Ithaca, NY 0.05 0.05 0.03 0.03 0.02 0.04 -0.0080 Johnstown, PA 0.05 0.05 0.03 0.08 0.02 0.04 -0.0030 Mcallen-Edinburg-Mission, TX 0.05 0.05 0.03 0.05 0.03 0.04 -0.0040 Merced, CA 0.08 0.05 0.03 0.00 0.03 0.04 -0.0150 Midland, TX 0.03 0.06 0.05 0.03 0.02 0.04 -0.0050 Monroe, MI . 0.05 0.03 0.03 0.07 0.04 0.0060 Morgantown, WV 0.05 0.06 0.03 0.02 0.05 0.04 -0.0040 Muskegon, MI 0.02 . 0.05 0.03 0.10 0.04 0.0160 Oshkosh-Neenah, WI 0.03 0.03 0.03 0.05 0.07 0.04 0.0100 Parkersburg-Vienna, WV 0.03 0.05 0.02 0.05 0.05 0.04 0.0040

29 | P a g e
Year – Percent of Veteran STEM Workforce (Sorted by Total
Percent for the 2012 to 2016 Time Period) Metropolitan Area, 2013
OMB Delineations 2012 2013 2014 2015 2016 Total Trend Prescott, AZ 0.02 0.05 0.05 0.05 0.03 0.04 0.0020 Pueblo, CO 0.06 0.03 0.07 0.02 0.02 0.04 -0.0090 Punta Gorda, FL 0.03 0.05 0.05 0.03 0.07 0.04 0.0060 Racine, WI 0.06 0.06 0.03 0.03 0.02 0.04 -0.0110 Redding, CA 0.05 0.02 0.08 0.02 0.05 0.04 0.0000 Rocky Mount, NC 0.06 0.03 0.05 0.03 0.03 0.04 -0.0060 San Angelo, TX 0.05 0.05 0.03 0.07 0.02 0.04 -0.0040 Tyler, TX 0.03 0.08 0.05 0.03 0.02 0.04 -0.0070 Wausau, WI 0.08 0.03 0.05 . 0.03 0.04 -0.0094 Auburn-Opelika, AL 0.06 0.03 . 0.05 0.02 0.03 -0.0060 Bismarck, ND 0.05 0.03 0.07 . 0.02 0.03 -0.0054 Coeur D'alene, ID 0.03 0.03 0.02 0.02 0.03 0.03 -0.0010 East Stroudsburg, PA 0.03 0.06 0.05 . 0.02 0.03 -0.0046 Elkhart-Goshen, IN 0.02 0.06 0.02 0.03 0.02 0.03 -0.0030 Grand Junction, CO 0.08 . 0.05 0.03 . 0.03 -0.0164 Harrisonburg, VA 0.05 0.05 0.02 0.03 0.02 0.03 -0.0080 Houma-Thibodaux, LA 0.02 0.02 0.02 0.07 0.03 0.03 0.0070 Jackson, TN 0.05 . 0.02 0.03 0.03 0.03 -0.0049 La Crosse-Onalaska, WI-MN 0.03 0.02 0.02 0.05 0.05 0.03 0.0070 Lafayette-West Lafayette, IN 0.02 0.02 0.05 0.07 0.02 0.03 0.0050 Lake Havasu City-Kingman, AZ 0.05 0.02 0.02 0.05 0.02 0.03 -0.0030 Lawrence, KS 0.06 . 0.05 . 0.02 0.03 -0.0100 Lewiston-Auburn, ME 0.03 0.02 0.07 0.02 0.03 0.03 0.0000 Michigan City-La Porte, IN 0.02 . 0.02 0.08 0.02 0.03 0.0051 Monroe, LA 0.02 0.03 0.03 0.02 0.07 0.03 0.0090 Owensboro, KY 0.05 0.03 0.02 0.02 0.02 0.03 -0.0070 St. George, UT 0.02 0.03 0.05 0.03 0.03 0.03 0.0020 Yakima, WA 0.03 0.03 0.05 0.03 0.02 0.03 -0.0020 Eau Claire, WI 0.03 0.02 0.03 0.02 0.02 0.02 -0.0020 Gadsden, AL . . 0.07 0.02 . 0.02 -0.0500 Kankakee, IL 0.02 . . 0.07 . 0.02 0.0167 Lima, OH . 0.05 . 0.03 0.02 0.02 -0.0100 Madera, CA 0.05 0.02 . 0.03 . 0.02 -0.0050 Mansfield, OH 0.02 0.02 0.02 0.03 0.03 0.02 0.0030 Muncie, IN 0.05 . 0.05 0.02 . 0.02 -0.0086

30 | P a g e
Year – Percent of Veteran STEM Workforce (Sorted by Total
Percent for the 2012 to 2016 Time Period) Metropolitan Area, 2013
OMB Delineations 2012 2013 2014 2015 2016 Total Trend El Centro, CA 0.02 0.02 . . 0.02 0.01 0.0000 Iowa City, IA . 0.03 0.02 . . 0.01 -0.0100 Laredo, TX 0.03 0.02 . . . 0.01 -0.0100
Table 8. Distribution of the Non-Veteran STEM Workforce across Metropolitan Areas over the 2012 to 2016 Time Period
Year – Percent of Non-Veteran STEM Workforce (Sorted by
Total Percent for the 2012 to 2016 Time Period) Metropolitan Area, 2013
OMB Delineations 2012 2013 2014 2015 2016 Total Trend New York-Newark-Jersey City, NY-NJ-PA 7.43 7.49 7.46 7.43 7.41 7.44 -0.0100 Washington-Arlington-Alexandria, DC-VA-MD 5.45 5.01 5.17 4.98 4.91 5.10 -0.1110 Los Angeles-Long Beach-Anaheim, CA 5.03 4.90 4.80 4.83 4.88 4.88 -0.0370 San Francisco-Oakland-Hayward, CA 3.72 3.71 3.78 3.92 4.12 3.86 0.1010 Chicago-Naperville-Elgin, IL-IN-WI 3.65 3.59 3.71 3.64 3.59 3.63 -0.0070 Boston-Cambridge-Newton, MA-NH 3.37 3.54 3.54 3.54 3.60 3.52 0.0460 Dallas-Fort Worth-Arlington, TX 3.19 3.36 3.27 3.35 3.32 3.30 0.0250 San Jose-Sunnyvale-Santa Clara, CA 2.72 2.75 2.80 2.77 2.88 2.79 0.0340 Seattle-Tacoma-Bellevue, WA 2.70 2.59 2.51 2.69 2.69 2.64 0.0080 Houston-The Woodlands-Sugar Land, TX 2.47 2.64 2.66 2.64 2.62 2.61 0.0300 Philadelphia-Camden-Wilmington, PA-NJ-D 2.65 2.50 2.53 2.45 2.53 2.53 -0.0290 Atlanta-Sandy Springs-Roswell, GA 2.27 2.36 2.42 2.49 2.44 2.40 0.0470 Denver-Aurora-Lakewood, CO 1.81 1.83 1.76 1.89 1.89 1.84 0.0220 Detroit-Warren-Dearborn, MI 1.74 1.67 1.69 1.76 1.83 1.74 0.0270

31 | P a g e
Year – Percent of Non-Veteran STEM Workforce (Sorted by
Total Percent for the 2012 to 2016 Time Period) Metropolitan Area, 2013
OMB Delineations 2012 2013 2014 2015 2016 Total Trend Phoenix-Mesa-Scottsdale, AZ 1.74 1.83 1.68 1.65 1.69 1.72 -0.0280 Baltimore-Columbia-Towson, MD 1.79 1.60 1.61 1.62 1.63 1.65 -0.0300 San Diego-Carlsbad, CA 1.60 1.58 1.60 1.54 1.62 1.59 0.0000 Miami-Fort Lauderdale-West Palm Beach, FL 1.44 1.47 1.46 1.50 1.42 1.46 -0.0010 Minneapolis-St. Paul-Bloomington, MN-WI 1.39 1.40 1.43 1.35 1.48 1.41 0.0130 Austin-Round Rock, TX 1.25 1.34 1.32 1.45 1.38 1.35 0.0370 Portland-Vancouver-Hillsboro, OR-WA 1.30 1.28 1.31 1.31 1.40 1.32 0.0230 Sacramento--Roseville--Arden-Arcade, CA 1.14 1.04 1.09 1.18 1.02 1.09 -0.0100 St. Louis, MO-IL 1.08 1.05 1.03 1.13 1.04 1.06 0.0000 Tampa-St. Petersburg-Clearwater, FL 1.06 1.10 1.07 1.10 0.98 1.06 -0.0160 Pittsburgh, PA 0.99 0.98 1.00 0.95 0.98 0.98 -0.0050 Charlotte-Concord-Gastonia, NC-SC 0.88 0.99 0.97 0.97 0.97 0.96 0.0160 Raleigh, NC 0.95 0.98 0.97 0.97 0.90 0.95 -0.0110 Cincinnati, OH-KY-IN 0.79 0.89 0.86 0.86 0.87 0.86 0.0130 Kansas City, MO-KS 0.78 0.79 0.85 0.80 0.85 0.82 0.0150 Riverside-San Bernardino-Ontario, CA 0.77 0.82 0.88 0.82 0.81 0.82 0.0080 Cleveland-Elyria, OH 0.78 0.81 0.84 0.77 0.82 0.81 0.0040 Columbus, OH 0.77 0.84 0.81 0.79 0.84 0.81 0.0090 Orlando-Kissimmee-Sanford, FL 0.66 0.67 0.72 0.66 0.77 0.70 0.0210 Hartford-West Hartford-East Hartford, CT 0.72 0.68 0.67 0.68 0.64 0.68 -0.0160 Indianapolis-Carmel-Anderson, IN 0.67 0.69 0.70 0.61 0.64 0.66 -0.0140 Nashville-Davidson--Murfreesboro--Frank 0.59 0.65 0.64 0.66 0.67 0.64 0.0170 Providence-Warwick, RI-MA 0.60 0.61 0.57 0.59 0.59 0.59 -0.0040 San Antonio-New Braunfels, TX 0.51 0.57 0.58 0.65 0.59 0.58 0.0240 Salt Lake City, UT 0.56 0.54 0.51 0.53 0.59 0.55 0.0050

32 | P a g e
Year – Percent of Non-Veteran STEM Workforce (Sorted by
Total Percent for the 2012 to 2016 Time Period) Metropolitan Area, 2013
OMB Delineations 2012 2013 2014 2015 2016 Total Trend Vineland-Bridgeton, NJ 0.54 0.58 0.54 0.52 0.53 0.54 -0.0080 Worcester, MA-CT 0.55 0.57 0.54 0.53 0.52 0.54 -0.0100 Rochester, NY 0.59 0.57 0.52 0.49 0.50 0.53 -0.0260 Richmond, VA 0.47 0.49 0.56 0.53 0.49 0.51 0.0080 Albany-Schenectady-Troy, NY 0.49 0.46 0.43 0.47 0.46 0.46 -0.0050 Louisville/Jefferson County, KY-IN 0.41 0.47 0.49 0.42 0.47 0.45 0.0070 Milwaukee-Waukesha-West Allis, WI 0.47 0.45 0.46 0.45 0.42 0.45 -0.0100 New Orleans-Metairie, LA 0.43 0.44 0.44 0.46 0.45 0.44 0.0060 Bridgeport-Stamford-Norwalk, CT 0.49 0.43 0.42 0.41 0.43 0.43 -0.0140 Tucson, AZ 0.42 0.39 0.39 0.33 0.37 0.38 -0.0160 Jacksonville, FL 0.37 0.32 0.41 0.37 0.36 0.37 0.0030 Las Vegas-Henderson-Paradise, NV 0.31 0.38 0.34 0.37 0.42 0.37 0.0210 Oxnard-Thousand Oaks-Ventura, CA 0.41 0.35 0.41 0.33 0.35 0.37 -0.0140 New Haven-Milford, CT 0.36 0.36 0.34 0.33 0.35 0.35 -0.0050 Buffalo-Cheektowaga-Niagara Falls, NY 0.39 0.35 0.35 0.30 0.31 0.34 -0.0210 Provo-Orem, UT 0.33 0.34 0.33 0.33 0.37 0.34 0.0070 Greenville-Anderson-Mauldin, SC 0.33 0.34 0.33 0.30 0.32 0.32 -0.0060 Knoxville, TN 0.33 0.30 0.32 0.32 0.34 0.32 0.0040 Omaha-Council Bluffs, NE-IA 0.30 0.29 0.32 0.34 0.33 0.32 0.0110 Albuquerque, NM 0.33 0.31 0.32 0.29 0.30 0.31 -0.0080 Birmingham-Hoover, AL 0.31 0.32 0.28 0.30 0.32 0.31 0.0000 Memphis, TN-MS-AR 0.34 0.32 0.26 0.33 0.29 0.31 -0.0090 Urban Honolulu, HI 0.34 0.30 0.32 0.29 0.32 0.31 -0.0050 Dayton, OH 0.28 0.30 0.33 0.30 0.30 0.30 0.0040 Oklahoma City, OK 0.31 0.31 0.26 0.28 0.30 0.29 -0.0050 Allentown-Bethlehem-Easton, PA-NJ 0.31 0.28 0.27 0.26 0.27 0.28 -0.0100 Huntsville, AL 0.30 0.29 0.29 0.26 0.26 0.28 -0.0110 Ann Arbor, MI 0.26 0.28 0.26 0.23 0.29 0.27 0.0010

33 | P a g e
Year – Percent of Non-Veteran STEM Workforce (Sorted by
Total Percent for the 2012 to 2016 Time Period) Metropolitan Area, 2013
OMB Delineations 2012 2013 2014 2015 2016 Total Trend Grand Rapids-Wyoming, MI 0.27 0.26 0.28 0.27 0.25 0.27 -0.0030 Syracuse, NY 0.30 0.28 0.23 0.26 0.28 0.27 -0.0060 Colorado Springs, CO 0.27 0.25 0.28 0.25 0.24 0.26 -0.0060 Akron, OH 0.26 0.25 0.23 0.27 0.24 0.25 -0.0020 Charleston-North Charleston, SC 0.23 0.22 0.27 0.25 0.25 0.25 0.0070 Columbia, SC 0.22 0.26 0.29 0.24 0.25 0.25 0.0040 Palm Bay-Melbourne-Titusville, FL 0.27 0.25 0.25 0.24 0.24 0.25 -0.0070 Baton Rouge, LA 0.25 0.22 0.24 0.25 0.20 0.23 -0.0070 Des Moines-West Des Moines, IA 0.21 0.19 0.23 0.22 0.23 0.22 0.0070 Fort Collins, CO 0.21 0.24 0.18 0.23 0.23 0.22 0.0030 Manchester-Nashua, NH 0.24 0.21 0.21 0.24 0.20 0.22 -0.0050 Trenton, NJ 0.22 0.26 0.21 0.20 0.22 0.22 -0.0060 Boise City, ID 0.19 0.20 0.22 0.21 0.22 0.21 0.0070 Greensboro-High Point, NC 0.22 0.21 0.22 0.22 0.20 0.21 -0.0030 Lansing-East Lansing, MI 0.20 0.21 0.22 0.22 0.21 0.21 0.0030 Harrisburg-Carlisle, PA 0.19 0.24 0.18 0.23 0.18 0.20 -0.0030 Ogden-Clearfield, UT 0.16 0.23 0.22 0.21 0.19 0.20 0.0040 Santa Rosa, CA 0.18 0.17 0.20 0.21 0.17 0.19 0.0020 Springfield, MA 0.21 0.21 0.20 0.16 0.18 0.19 -0.0110 Wichita, KS 0.18 0.18 0.18 0.21 0.19 0.19 0.0050 Winston-Salem, NC 0.17 0.20 0.17 0.21 0.19 0.19 0.0050 Little Rock-North Little Rock-Conway, AR 0.19 0.15 0.24 0.16 0.15 0.18 -0.0070 Santa Maria-Santa Barbara, CA 0.20 0.19 0.17 0.18 0.15 0.18 -0.0110 Toledo, OH 0.17 0.17 0.18 0.20 0.17 0.18 0.0030 Norwich-New London, CT 0.19 0.19 0.15 0.14 0.17 0.17 -0.0090 Chattanooga, TN-GA 0.15 0.15 0.17 0.17 0.16 0.16 0.0040 Fayetteville-Springdale-Rogers, AR-MO 0.15 0.17 0.17 0.16 0.15 0.16 -0.0010 North Port-Sarasota-Bradenton, FL 0.15 0.13 0.17 0.17 0.17 0.16 0.0080 Augusta-Richmond County, GA-SC 0.17 0.14 0.14 0.16 0.14 0.15 -0.0040

34 | P a g e
Year – Percent of Non-Veteran STEM Workforce (Sorted by
Total Percent for the 2012 to 2016 Time Period) Metropolitan Area, 2013
OMB Delineations 2012 2013 2014 2015 2016 Total Trend Fresno, CA 0.16 0.17 0.13 0.14 0.14 0.15 -0.0070 Portland-South Portland, ME 0.16 0.13 0.16 0.15 0.18 0.15 0.0060 Reno, NV 0.16 0.16 0.14 0.14 0.13 0.15 -0.0080 Spokane-Spokane Valley, WA 0.16 0.18 0.13 0.16 0.14 0.15 -0.0060 Jackson, MS 0.14 0.15 0.15 0.13 0.13 0.14 -0.0040 Santa Cruz-Watsonville, CA 0.16 0.15 0.12 0.14 0.14 0.14 -0.0050 Bakersfield, CA 0.13 0.12 0.14 0.14 0.13 0.13 0.0020 Champaign-Urbana, IL 0.14 0.12 0.12 0.13 0.12 0.13 -0.0030 El Paso, TX 0.12 0.14 0.12 0.12 0.14 0.13 0.0020 Fort Wayne, IN 0.11 0.14 0.13 0.13 0.11 0.13 -0.0010 Gainesville, FL 0.12 0.14 0.13 0.13 0.11 0.13 -0.0030 Stockton-Lodi, CA 0.14 0.14 0.11 0.13 0.13 0.13 -0.0030 Vallejo-Fairfield, CA 0.11 0.13 0.14 0.14 0.13 0.13 0.0050 York-Hanover, PA 0.14 0.13 0.15 0.12 0.14 0.13 -0.0010 Asheville, NC 0.11 0.12 0.10 0.13 0.12 0.12 0.0030 Binghamton, NY 0.13 0.13 0.13 0.12 0.09 0.12 -0.0090 Bloomington, IL 0.11 0.13 0.13 0.12 0.09 0.12 -0.0050 Deltona-Daytona Beach-Ormond Beach, FL 0.10 0.10 0.14 0.13 0.13 0.12 0.0090 Kalamazoo-Portage, MI 0.13 0.12 0.13 0.11 0.11 0.12 -0.0050 Lakeland-Winter Haven, FL 0.10 0.12 0.13 0.12 0.13 0.12 0.0060 Reading, PA 0.13 0.13 0.10 0.14 0.10 0.12 -0.0050 Scranton--Wilkes-Barre--Hazleton, PA 0.13 0.12 0.13 0.11 0.12 0.12 -0.0030 Youngstown-Warren-Boardman, OH-PA 0.13 0.11 0.12 0.11 0.11 0.12 -0.0040 Bremerton-Silverdale, WA 0.13 0.13 0.10 0.11 0.11 0.11 -0.0060 Cape Coral-Fort Myers, FL 0.09 0.11 0.11 0.10 0.15 0.11 0.0110 Eugene, OR 0.12 0.12 0.09 0.12 0.12 0.11 0.0000 Lafayette, LA 0.11 0.10 0.12 0.11 0.12 0.11 0.0030 Lancaster, PA 0.10 0.12 0.10 0.11 0.11 0.11 0.0010 Lincoln, NE 0.10 0.12 0.10 0.09 0.11 0.11 -0.0010 Salinas, CA 0.12 0.09 0.11 0.11 0.09 0.11 -0.0040 Anchorage, AK 0.11 0.09 0.10 0.09 0.09 0.10 -0.0040

35 | P a g e
Year – Percent of Non-Veteran STEM Workforce (Sorted by
Total Percent for the 2012 to 2016 Time Period) Metropolitan Area, 2013
OMB Delineations 2012 2013 2014 2015 2016 Total Trend Burlington-South Burlington, VT 0.10 0.10 0.09 0.10 0.09 0.10 -0.0020 Canton-Massillon, OH 0.09 0.10 0.10 0.12 0.09 0.10 0.0020 Olympia-Tumwater, WA 0.09 0.10 0.11 0.09 0.11 0.10 0.0030 Pensacola-Ferry Pass-Brent, FL 0.10 0.10 0.11 0.11 0.10 0.10 0.0010 Beaumont-Port Arthur, TX 0.10 0.08 0.09 0.09 0.08 0.09 -0.0030 College Station-Bryan, TX 0.07 0.09 0.07 0.12 0.09 0.09 0.0070 Corpus Christi, TX 0.08 0.08 0.10 0.09 0.10 0.09 0.0050 Lafayette-West Lafayette, IN 0.09 0.08 0.09 0.08 0.09 0.09 0.0000 Montgomery, Al 0.08 0.10 0.09 0.09 0.07 0.09 -0.0030 Roanoke, VA 0.10 0.10 0.09 0.09 0.07 0.09 -0.0070 Rockford, IL 0.08 0.09 0.11 0.10 0.08 0.09 0.0010 San Luis Obispo-Paso Robles-Arroyo Grande, CA 0.09 0.09 0.07 0.10 0.10 0.09 0.0030 Santa Fe, NM 0.09 0.12 0.09 0.07 0.09 0.09 -0.0050 Mobile, AL 0.07 0.09 0.08 0.09 0.07 0.08 0.0000 Modesto, CA 0.08 0.10 0.09 0.08 0.08 0.08 -0.0020 Salisbury, MD-DE 0.09 0.07 0.08 0.07 0.07 0.08 -0.0040 Springfield, IL 0.07 0.10 0.08 0.09 0.07 0.08 -0.0010 Springfield, MO 0.09 0.08 0.07 0.09 0.08 0.08 -0.0010 State College, PA 0.08 0.08 0.08 0.08 0.07 0.08 -0.0020 Utica-Rome, NY 0.08 0.08 0.08 0.08 0.07 0.08 -0.0020 Amarillo, TX 0.06 0.09 0.06 0.08 0.06 0.07 -0.0010 Barnstable Town, MA 0.08 0.06 0.08 0.05 0.07 0.07 -0.0030 Blacksburg-Christiansburg-Radford, VA 0.06 0.08 0.08 0.08 0.06 0.07 0.0000 Columbia, MO 0.08 0.06 0.06 0.07 0.06 0.07 -0.0030 Erie, PA 0.09 0.07 0.07 0.07 0.05 0.07 -0.0080 Hickory-Lenoir-Morganton, NC 0.08 0.06 0.06 0.09 0.06 0.07 -0.0010 Ithaca, NY 0.06 0.08 0.05 0.08 0.07 0.07 0.0020 Lubbock, TX 0.07 0.06 0.06 0.08 0.06 0.07 0.0000 Lynchburg, VA 0.08 0.06 0.09 0.08 0.07 0.07 0.0000 Myrtle Beach-Conway-North Myrtle Beach, SC 0.07 0.05 0.08 0.07 0.07 0.07 0.0020 Port St. Lucie, FL 0.07 0.07 0.06 0.07 0.06 0.07 -0.0020

36 | P a g e
Year – Percent of Non-Veteran STEM Workforce (Sorted by
Total Percent for the 2012 to 2016 Time Period) Metropolitan Area, 2013
OMB Delineations 2012 2013 2014 2015 2016 Total Trend Shreveport-Bossier City, LA 0.07 0.08 0.08 0.06 0.07 0.07 -0.0020 Spartanburg, SC 0.06 0.08 0.08 0.07 0.07 0.07 0.0010 Topeka, KS 0.06 0.05 0.08 0.06 0.09 0.07 0.0070 Wilmington, NC 0.09 0.06 0.07 0.08 0.05 0.07 -0.0060 Atlantic City-Hammonton, NJ 0.07 0.06 0.06 0.06 0.07 0.06 0.0000 Bellingham, WA 0.06 0.05 0.07 0.05 0.06 0.06 0.0000 Burlington, NC 0.07 0.04 0.05 0.06 0.07 0.06 0.0020 Chico, CA 0.06 0.06 0.08 0.05 0.06 0.06 -0.0010 Gulfport-Biloxi-Pascagoula, MS 0.06 0.06 0.06 0.06 0.05 0.06 -0.0020 Mcallen-Edinburg-Mission, TX 0.05 0.05 0.06 0.07 0.07 0.06 0.0060 Niles-Benton Harbor, MI 0.06 0.06 0.05 0.07 0.06 0.06 0.0010 Pittsfield, MA 0.06 0.06 0.08 0.06 0.05 0.06 -0.0020 Bloomington, IN 0.05 0.04 0.07 0.05 0.05 0.05 0.0010 Charleston, WV 0.06 0.06 0.05 0.05 0.04 0.05 -0.0050 Flagstaff, AZ 0.04 0.05 0.06 0.05 0.05 0.05 0.0020 Iowa City, IA 0.05 0.06 0.06 0.05 0.04 0.05 -0.0030 Jefferson City, MO 0.06 0.04 0.04 0.05 0.04 0.05 -0.0030 Midland, TX 0.06 0.04 0.06 0.05 0.04 0.05 -0.0030 Morgantown, WV 0.04 0.06 0.06 0.05 0.06 0.05 0.0030 Napa, CA 0.04 0.06 0.04 0.03 0.05 0.05 -0.0010 Oshkosh-Neenah, WI 0.06 0.05 0.06 0.03 0.05 0.05 -0.0040 Saginaw, MI 0.05 0.06 0.05 0.05 0.03 0.05 -0.0050 Waco, TX 0.05 0.05 0.05 0.06 0.06 0.05 0.0030 Wausau, WI 0.05 0.03 0.04 0.06 0.05 0.05 0.0030 Auburn-Opelika, AL 0.04 0.04 0.03 0.04 0.05 0.04 0.0020 Bangor, ME 0.06 0.03 0.04 0.05 0.03 0.04 -0.0040 Clarksville, TN-KY 0.04 0.04 0.02 0.04 0.04 0.04 0.0000 Decatur, AL 0.04 0.05 0.05 0.04 0.04 0.04 -0.0010 Decatur, IL 0.05 0.04 0.03 0.03 0.05 0.04 -0.0010 Eau Claire, WI 0.03 0.03 0.04 0.04 0.03 0.04 0.0010 Fayetteville, NC 0.04 0.04 0.04 0.05 0.04 0.04 0.0010 Florence, SC 0.03 0.05 0.05 0.03 0.03 0.04 -0.0020 Gainesville, GA 0.04 0.05 0.05 0.05 0.04 0.04 0.0000 Glens Falls, NY 0.04 0.04 0.04 0.04 0.05 0.04 0.0020

37 | P a g e
Year – Percent of Non-Veteran STEM Workforce (Sorted by
Total Percent for the 2012 to 2016 Time Period) Metropolitan Area, 2013
OMB Delineations 2012 2013 2014 2015 2016 Total Trend Greenville, NC 0.04 0.05 0.05 0.03 0.02 0.04 -0.0060 Harrisonburg, VA 0.03 0.03 0.04 0.05 0.04 0.04 0.0040 Houma-Thibodaux, LA 0.04 0.04 0.03 0.04 0.03 0.04 -0.0020 Jackson, MI 0.05 0.03 0.04 0.04 0.04 0.04 -0.0010 Johnstown, PA 0.04 0.05 0.05 0.03 0.05 0.04 0.0000 Las Cruces, NM 0.04 0.04 0.03 0.03 0.03 0.04 -0.0030 Medford, OR 0.02 0.04 0.04 0.04 0.05 0.04 0.0060 Monroe, MI 0.04 0.03 0.03 0.04 0.04 0.04 0.0010 Muskegon, MI 0.04 0.06 0.05 0.04 0.03 0.04 -0.0040 Naples-Immokalee-Marco Island, FL 0.04 0.02 0.05 0.04 0.05 0.04 0.0040 Racine, WI 0.04 0.05 0.05 0.04 0.04 0.04 -0.0010 Redding, CA 0.04 0.05 0.04 0.04 0.05 0.04 0.0010 Sheboygan, WI 0.04 0.05 0.04 0.03 0.05 0.04 0.0000 Springfield, OH 0.04 0.02 0.05 0.04 0.05 0.04 0.0040 Tuscaloosa, AL 0.02 0.04 0.04 0.04 0.06 0.04 0.0080 Tyler, TX 0.04 0.04 0.05 0.04 0.05 0.04 0.0020 Visalia-Porterville, CA 0.05 0.05 0.04 0.05 0.04 0.04 -0.0020 Bend-Redmond, OR 0.03 0.04 0.03 0.03 0.04 0.03 0.0010 Bismarck, ND 0.03 0.03 0.03 0.03 0.03 0.03 0.0000 Brownsville-Harlingen, TX 0.02 0.04 0.04 0.03 0.03 0.03 0.0010 Daphne-Fairhope-Foley, AL 0.03 0.04 0.03 0.03 0.03 0.03 -0.0010 Dover, DE 0.03 0.03 0.05 0.03 0.03 0.03 0.0000 Elkhart-Goshen, IN 0.03 0.03 0.04 0.03 0.04 0.03 0.0020 Grand Junction, CO 0.02 0.03 0.03 0.02 0.03 0.03 0.0010 Hilton Head Island-Bluffton-Beaufort, SC 0.02 0.03 0.04 0.02 0.02 0.03 -0.0010 Janesville-Beloit, WI 0.04 0.04 0.03 0.03 0.03 0.03 -0.0030 Joplin, MO 0.03 0.03 0.03 0.04 0.02 0.03 -0.0010 La Crosse-Onalaska, WI-MN 0.03 0.03 0.04 0.03 0.02 0.03 -0.0020 Lawrence, KS 0.02 0.05 0.04 0.03 0.02 0.03 -0.0020 Lebanon, PA 0.03 0.02 0.03 0.03 0.03 0.03 0.0010 Merced, CA 0.05 0.02 0.02 0.02 0.03 0.03 -0.0040 Monroe, LA 0.03 0.02 0.03 0.04 0.02 0.03 0.0000 Ocala, FL 0.03 0.03 0.02 0.04 0.02 0.03 -0.0010 Ocean City, NJ 0.04 0.02 0.03 0.03 0.03 0.03 -0.0010

38 | P a g e
Year – Percent of Non-Veteran STEM Workforce (Sorted by
Total Percent for the 2012 to 2016 Time Period) Metropolitan Area, 2013
OMB Delineations 2012 2013 2014 2015 2016 Total Trend Parkersburg-Vienna, WV 0.03 0.03 0.03 0.03 0.02 0.03 -0.0020 Prescott, AZ 0.03 0.03 0.03 0.03 0.03 0.03 0.0000 Pueblo, CO 0.02 0.03 0.03 0.04 0.04 0.03 0.0050 Rocky Mount, NC 0.03 0.02 0.02 0.03 0.03 0.03 0.0010 St. Joseph, MO-KS 0.03 0.03 0.02 0.04 0.02 0.03 -0.0010 Wichita Falls, TX 0.03 0.03 0.03 0.03 0.04 0.03 0.0020 Yakima, WA 0.04 0.02 0.02 0.03 0.04 0.03 0.0010 Yuba City, CA 0.03 0.04 0.03 0.04 0.02 0.03 -0.0020 Yuma, AZ 0.03 0.03 0.03 0.02 0.02 0.03 -0.0030 Anniston-Oxford-Jacksonville, AL 0.02 0.01 0.01 0.02 0.02 0.02 0.0010 Coeur D'alene, ID 0.03 0.02 0.02 0.03 0.02 0.02 -0.0010 East Stroudsburg, PA 0.02 0.02 0.03 0.02 0.02 0.02 0.0000 El Centro, CA 0.01 0.03 0.01 0.01 0.02 0.02 0.0000 Hammond, LA 0.03 0.01 0.01 0.01 0.02 0.02 -0.0020 Jackson, TN 0.02 0.02 0.02 0.02 0.01 0.02 -0.0020 Kankakee, IL 0.02 0.02 0.02 0.02 0.02 0.02 0.0000 Lake Havasu City-Kingman, AZ 0.02 0.02 0.02 0.02 0.02 0.02 0.0000 Laredo, TX 0.02 0.02 0.01 0.02 0.03 0.02 0.0020 Lewiston-Auburn, ME 0.02 0.02 0.03 0.01 0.03 0.02 0.0010 Lima, OH 0.02 0.02 0.02 0.03 0.02 0.02 0.0010 Mansfield, OH 0.02 0.02 0.03 0.01 0.02 0.02 -0.0010 Michigan City-La Porte, IN 0.02 0.03 0.01 0.02 0.02 0.02 -0.0010 Muncie, IN 0.01 0.02 0.02 0.02 0.02 0.02 0.0020 Odessa, TX 0.01 0.03 0.01 0.02 0.02 0.02 0.0010 Owensboro, KY 0.01 0.02 0.01 0.03 0.02 0.02 0.0030 Punta Gorda, FL 0.03 0.02 0.01 0.01 0.03 0.02 -0.0010 San Angelo, TX 0.01 0.02 0.03 0.01 0.03 0.02 0.0030 Sebastian-Vero Beach, FL 0.03 0.03 0.02 0.02 0.02 0.02 -0.0030 St. George, UT 0.03 0.02 0.01 0.02 0.02 0.02 -0.0020 Wenatchee, WA 0.02 0.02 0.02 0.02 0.01 0.02 -0.0020 Gadsden, AL 0.01 0.02 0.01 0.01 0.01 0.01 -0.0010 Goldsboro, NC 0.01 0.01 0.03 0.01 0.01 0.01 0.0000 Homosassa Springs, FL 0.01 . 0.01 0.01 0.01 0.01 0.0000 Madera, CA 0.02 0.01 0.01 0.01 0.02 0.01 0.0000

39 | P a g e
Table 9. Distribution of the Veteran STEM Workforce across Metropolitan Areas over the 2012 to 2016 Time Period (Sorted by Trend Value)
Year – Percent of Veteran STEM Workforce (Sorted by Trend for the 2012 to 2016 Time Period)
Metropolitan Area, 2013 OMB Delineations Total Trend Dallas-Fort Worth-Arlington, TX 3.66 0.1330 Seattle-Tacoma-Bellevue, WA 2.17 0.0950 Nashville-Davidson--Murfreesboro--Frank 0.67 0.0830 Austin-Round Rock, TX 1.24 0.0710 Riverside-San Bernardino-Ontario, CA 1.19 0.0690 San Antonio-New Braunfels, TX 1.73 0.0680 Orlando-Kissimmee-Sanford, FL 0.82 0.0650 Las Vegas-Henderson-Paradise, NV 0.78 0.0630 Palm Bay-Melbourne-Titusville, FL 0.64 0.0530 Knoxville, TN 0.40 0.0520 Memphis, TN-MS-AR 0.43 0.0500 Vineland-Bridgeton, NJ 2.43 0.0480 Sacramento--Roseville--Arden-Arcade, CA 0.99 0.0470 Charlotte-Concord-Gastonia, NC-SC 0.98 0.0460 Denver-Aurora-Lakewood, CO 2.05 0.0450 Charleston-North Charleston, SC 0.55 0.0430 Deltona-Daytona Beach-Ormond Beach, FL 0.20 0.0430 Little Rock-North Little Rock-Conway, AR 0.21 0.0390 Bremerton-Silverdale, WA 0.39 0.0390 York-Hanover, PA 0.17 0.0330 New Orleans-Metairie, LA 0.41 0.0300 Santa Rosa, CA 0.14 0.0300 Manchester-Nashua, NH 0.31 0.0300 Jacksonville, FL 0.92 0.0290 Oklahoma City, OK 0.60 0.0290 Cincinnati, OH-KY-IN 0.66 0.0260 Portland-Vancouver-Hillsboro, OR-WA 1.34 0.0250 Lansing-East Lansing, MI 0.14 0.0250 Shreveport-Bossier City, LA 0.16 0.0240 Jefferson City, MO 0.07 0.0240 Cape Coral-Fort Myers, FL 0.13 0.0240 Harrisburg-Carlisle, PA 0.29 0.0220 Dayton, OH 0.59 0.0210 Boise City, ID 0.32 0.0210 Norwich-New London, CT 0.32 0.0210

40 | P a g e
Year – Percent of Veteran STEM Workforce (Sorted by Trend for the 2012 to 2016 Time Period)
Metropolitan Area, 2013 OMB Delineations Total Trend Sebastian-Vero Beach, FL 0.05 0.0200 Salt Lake City, UT 0.37 0.0190 Fort Collins, CO 0.23 0.0190 Corpus Christi, TX 0.16 0.0190 Blacksburg-Christiansburg-Radford, VA 0.07 0.0190 Hilton Head Island-Bluffton-Beaufort, SC 0.06 0.0190 Albany-Schenectady-Troy, NY 0.34 0.0170 Des Moines-West Des Moines, IA 0.16 0.0170 Kankakee, IL 0.02 0.0167 Baton Rouge, LA 0.19 0.0160 Muskegon, MI 0.04 0.0160 Springfield, MA 0.16 0.0160 Stockton-Lodi, CA 0.15 0.0160 North Port-Sarasota-Bradenton, FL 0.25 0.0150 Bloomington, IN 0.06 0.0150 Anniston-Oxford-Jacksonville, AL 0.04 0.0150 Lancaster, PA 0.10 0.0150 Columbia, SC 0.41 0.0140 Reno, NV 0.23 0.0140 Las Cruces, NM 0.08 0.0140 Fresno, CA 0.21 0.0140 Salisbury, MD-DE 0.15 0.0130 Yuma, AZ 0.10 0.0130 Raleigh, NC 0.87 0.0120 Topeka, KS 0.08 0.0120 Portland-South Portland, ME 0.19 0.0120 Toledo, OH 0.17 0.0110 Lubbock, TX 0.07 0.0110 Hammond, LA 0.04 0.0110 Santa Maria-Santa Barbara, CA 0.20 0.0110 Miami-Fort Lauderdale-West Palm Beach, FL 1.20 0.0100 Worcester, MA-CT 0.45 0.0100 Oshkosh-Neenah, WI 0.04 0.0100 State College, PA 0.05 0.0100 Minneapolis-St. Paul-Bloomington, MN-WI 1.05 0.0090 Tuscaloosa, AL 0.05 0.0090 Monroe, LA 0.03 0.0090 Syracuse, NY 0.28 0.0090

41 | P a g e
Year – Percent of Veteran STEM Workforce (Sorted by Trend for the 2012 to 2016 Time Period)
Metropolitan Area, 2013 OMB Delineations Total Trend Asheville, NC 0.15 0.0090 Wichita Falls, TX 0.06 0.0080 Visalia-Porterville, CA 0.05 0.0080 Lakeland-Winter Haven, FL 0.23 0.0080 Ogden-Clearfield, UT 0.31 0.0070 Jackson, MI 0.05 0.0070 St. Joseph, MO-KS 0.05 0.0070 Houma-Thibodaux, LA 0.03 0.0070 La Crosse-Onalaska, WI-MN 0.03 0.0070 Louisville/Jefferson County, KY-IN 0.51 0.0070 Tampa-St. Petersburg-Clearwater, FL 1.74 0.0070 Naples-Immokalee-Marco Island, FL 0.07 0.0060 Springfield, IL 0.10 0.0060 Monroe, MI 0.04 0.0060 Punta Gorda, FL 0.04 0.0060 Pensacola-Ferry Pass-Brent, FL 0.35 0.0060 Gulfport-Biloxi-Pascagoula, MS 0.21 0.0060 Michigan City-La Porte, IN 0.03 0.0051 Grand Rapids-Wyoming, MI 0.17 0.0050 Canton-Massillon, OH 0.11 0.0050 Lafayette-West Lafayette, IN 0.03 0.0050 Oxnard-Thousand Oaks-Ventura, CA 0.43 0.0050 Allentown-Bethlehem-Easton, PA-NJ 0.23 0.0040 Yuba City, CA 0.10 0.0040 Pittsfield, MA 0.06 0.0040 Bend-Redmond, OR 0.04 0.0040 Parkersburg-Vienna, WV 0.04 0.0040 Baltimore-Columbia-Towson, MD 2.20 0.0030 Gainesville, GA 0.05 0.0030 Mansfield, OH 0.02 0.0030 Milwaukee-Waukesha-West Allis, WI 0.32 0.0030 Colorado Springs, CO 1.11 0.0030 Mobile, AL 0.12 0.0020 Flagstaff, AZ 0.06 0.0020 Medford, OR 0.06 0.0020 Brownsville-Harlingen, TX 0.05 0.0020 Lebanon, PA 0.05 0.0020 Prescott, AZ 0.04 0.0020

42 | P a g e
Year – Percent of Veteran STEM Workforce (Sorted by Trend for the 2012 to 2016 Time Period)
Metropolitan Area, 2013 OMB Delineations Total Trend St. George, UT 0.03 0.0020 Albuquerque, NM 0.50 0.0020 Greenville-Anderson-Mauldin, SC 0.43 0.0010 Napa, CA 0.05 0.0010 Urban Honolulu, HI 0.71 0.0010 Columbus, OH 0.69 0.0010 Fort Wayne, IN 0.10 0.0010 Burlington-South Burlington, VT 0.06 0.0010 Decatur, AL 0.06 0.0010 Columbia, MO 0.04 0.0010 Clarksville, TN-KY 0.19 0.0010 Provo-Orem, UT 0.18 0.0010 Binghamton, NY 0.12 0.0010 Springfield, OH 0.08 0.0000 Redding, CA 0.04 0.0000 Lewiston-Auburn, ME 0.03 0.0000 El Centro, CA 0.01 0.0000 Joplin, MO 0.06 -0.0010 Janesville-Beloit, WI 0.05 -0.0010 Coeur D'alene, ID 0.03 -0.0010 Akron, OH 0.24 -0.0010 Houston-The Woodlands-Sugar Land, TX 2.14 -0.0010 Olympia-Tumwater, WA 0.20 -0.0020 Bloomington, IL 0.09 -0.0020 Waco, TX 0.08 -0.0020 Burlington, NC 0.07 -0.0020 Champaign-Urbana, IL 0.07 -0.0020 Yakima, WA 0.03 -0.0020 Eau Claire, WI 0.02 -0.0020 Bridgeport-Stamford-Norwalk, CT 0.20 -0.0020 Bellingham, WA 0.04 -0.0029 Elkhart-Goshen, IN 0.03 -0.0030 Lake Havasu City-Kingman, AZ 0.03 -0.0030 Johnstown, PA 0.04 -0.0030 Jackson, MS 0.14 -0.0030 Spartanburg, SC 0.07 -0.0040 Lincoln, NE 0.12 -0.0040 Wilmington, NC 0.08 -0.0040
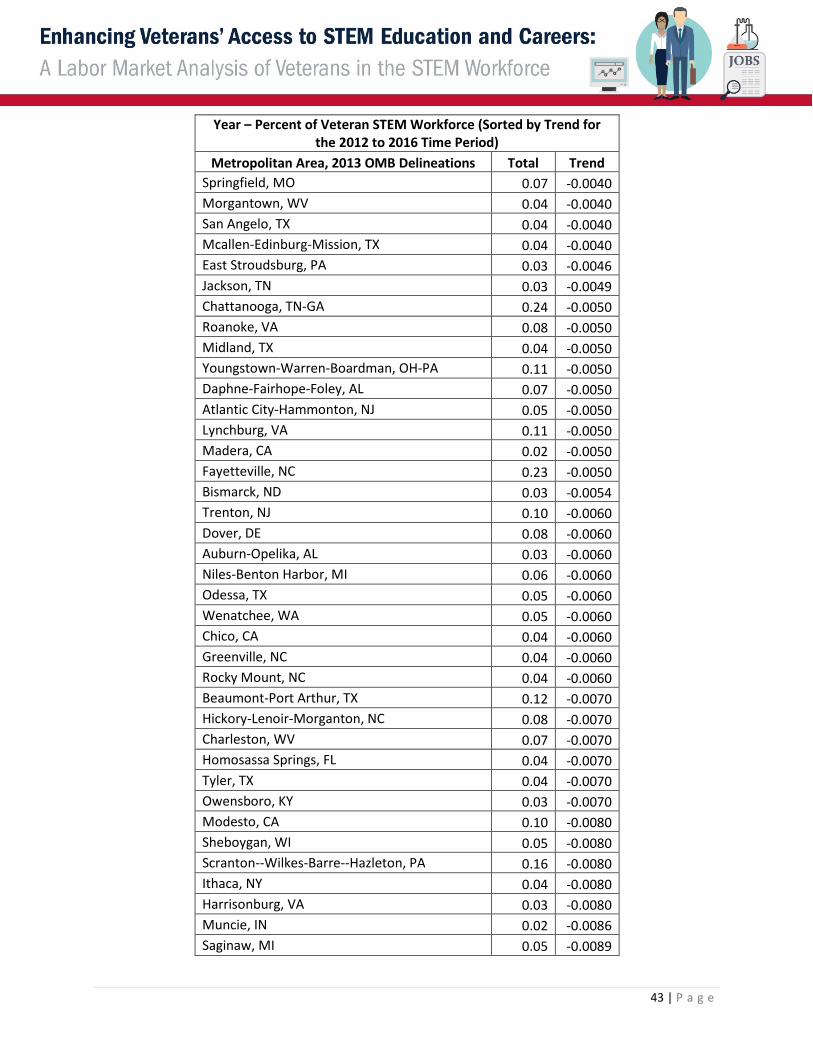
43 | P a g e
Year – Percent of Veteran STEM Workforce (Sorted by Trend for the 2012 to 2016 Time Period)
Metropolitan Area, 2013 OMB Delineations Total Trend Springfield, MO 0.07 -0.0040 Morgantown, WV 0.04 -0.0040 San Angelo, TX 0.04 -0.0040 Mcallen-Edinburg-Mission, TX 0.04 -0.0040 East Stroudsburg, PA 0.03 -0.0046 Jackson, TN 0.03 -0.0049 Chattanooga, TN-GA 0.24 -0.0050 Roanoke, VA 0.08 -0.0050 Midland, TX 0.04 -0.0050 Youngstown-Warren-Boardman, OH-PA 0.11 -0.0050 Daphne-Fairhope-Foley, AL 0.07 -0.0050 Atlantic City-Hammonton, NJ 0.05 -0.0050 Lynchburg, VA 0.11 -0.0050 Madera, CA 0.02 -0.0050 Fayetteville, NC 0.23 -0.0050 Bismarck, ND 0.03 -0.0054 Trenton, NJ 0.10 -0.0060 Dover, DE 0.08 -0.0060 Auburn-Opelika, AL 0.03 -0.0060 Niles-Benton Harbor, MI 0.06 -0.0060 Odessa, TX 0.05 -0.0060 Wenatchee, WA 0.05 -0.0060 Chico, CA 0.04 -0.0060 Greenville, NC 0.04 -0.0060 Rocky Mount, NC 0.04 -0.0060 Beaumont-Port Arthur, TX 0.12 -0.0070 Hickory-Lenoir-Morganton, NC 0.08 -0.0070 Charleston, WV 0.07 -0.0070 Homosassa Springs, FL 0.04 -0.0070 Tyler, TX 0.04 -0.0070 Owensboro, KY 0.03 -0.0070 Modesto, CA 0.10 -0.0080 Sheboygan, WI 0.05 -0.0080 Scranton--Wilkes-Barre--Hazleton, PA 0.16 -0.0080 Ithaca, NY 0.04 -0.0080 Harrisonburg, VA 0.03 -0.0080 Muncie, IN 0.02 -0.0086 Saginaw, MI 0.05 -0.0089

44 | P a g e
Year – Percent of Veteran STEM Workforce (Sorted by Trend for the 2012 to 2016 Time Period)
Metropolitan Area, 2013 OMB Delineations Total Trend Atlanta-Sandy Springs-Roswell, GA 2.52 -0.0090 Utica-Rome, NY 0.09 -0.0090 Ocala, FL 0.08 -0.0090 Barnstable Town, MA 0.07 -0.0090 Vallejo-Fairfield, CA 0.17 -0.0090 Pueblo, CO 0.04 -0.0090 Huntsville, AL 0.57 -0.0090 Wausau, WI 0.04 -0.0094 Decatur, IL 0.05 -0.0100 Lawrence, KS 0.03 -0.0100 Iowa City, IA 0.01 -0.0100 Laredo, TX 0.01 -0.0100 College Station-Bryan, TX 0.07 -0.0100 Lima, OH 0.02 -0.0100 Myrtle Beach-Conway-North Myrtle Beach, SC 0.12 -0.0110 Rockford, IL 0.09 -0.0110 Racine, WI 0.04 -0.0110 Ann Arbor, MI 0.17 -0.0110 Fayetteville-Springdale-Rogers, AR-MO 0.12 -0.0120 Omaha-Council Bluffs, NE-IA 0.64 -0.0130 Montgomery, Al 0.29 -0.0130 Port St. Lucie, FL 0.12 -0.0130 Santa Fe, NM 0.10 -0.0130 Goldsboro, NC 0.06 -0.0130 Salinas, CA 0.14 -0.0140 Kalamazoo-Portage, MI 0.10 -0.0140 San Luis Obispo-Paso Robles-Arroyo Grande, CA 0.12 -0.0140 Amarillo, TX 0.10 -0.0150 Merced, CA 0.04 -0.0150 Grand Junction, CO 0.03 -0.0164 Gainesville, FL 0.11 -0.0180 Reading, PA 0.11 -0.0180 Florence, SC 0.07 -0.0180 Bangor, ME 0.05 -0.0180 Spokane-Spokane Valley, WA 0.27 -0.0180 San Francisco-Oakland-Hayward, CA 1.31 -0.0180 New Haven-Milford, CT 0.22 -0.0190

45 | P a g e
Year – Percent of Veteran STEM Workforce (Sorted by Trend for the 2012 to 2016 Time Period)
Metropolitan Area, 2013 OMB Delineations Total Trend Ocean City, NJ 0.06 -0.0190 Birmingham-Hoover, AL 0.34 -0.0200 Glens Falls, NY 0.06 -0.0200 Wichita, KS 0.26 -0.0210 Erie, PA 0.11 -0.0220 Richmond, VA 0.63 -0.0230 Lafayette, LA 0.10 -0.0230 Rochester, NY 0.42 -0.0240 Hartford-West Hartford-East Hartford, CT 0.50 -0.0250 Tucson, AZ 0.61 -0.0270 El Paso, TX 0.27 -0.0270 Winston-Salem, NC 0.25 -0.0270 Buffalo-Cheektowaga-Niagara Falls, NY 0.30 -0.0280 Indianapolis-Carmel-Anderson, IN 0.54 -0.0290 Boston-Cambridge-Newton, MA-NH 1.69 -0.0320 Santa Cruz-Watsonville, CA 0.09 -0.0330 Eugene, OR 0.18 -0.0340 Augusta-Richmond County, GA-SC 0.36 -0.0340 Kansas City, MO-KS 0.93 -0.0350 Pittsburgh, PA 0.81 -0.0380 Anchorage, AK 0.17 -0.0380 St. Louis, MO-IL 1.24 -0.0410 New York-Newark-Jersey City, NY-NJ-PA 2.68 -0.0410 Phoenix-Mesa-Scottsdale, AZ 2.32 -0.0420 Cleveland-Elyria, OH 0.64 -0.0440 Chicago-Naperville-Elgin, IL-IN-WI 1.89 -0.0460 Bakersfield, CA 0.25 -0.0470 Greensboro-High Point, NC 0.27 -0.0480 Philadelphia-Camden-Wilmington, PA-NJ-D 1.86 -0.0500 Gadsden, AL 0.02 -0.0500 Providence-Warwick, RI-MA 0.64 -0.0570 San Jose-Sunnyvale-Santa Clara, CA 0.75 -0.0840 Detroit-Warren-Dearborn, MI 1.12 -0.0950 Washington-Arlington-Alexandria, DC-VA-MD 8.82 -0.0970 San Diego-Carlsbad, CA 2.17 -0.1070 Los Angeles-Long Beach-Anaheim, CA 2.91 -0.1410

46 | P a g e
Table 10 presents the veteran and non-veteran STEM workforce distributions of the five STEM clusters over the 2012 to 2016 time period. In addition, for each cluster a trend value of the 2012 to 2016 time period is calculated, e.g., veterans in the Information Technology and Computer Science STEM cluster exhibited a positive trend (growth) of 0.8500 percentage points per year over the 2012 to 2016 time period. STEM clusters for veterans declined as a percentage of the STEM workforce for two of the five clusters: Engineering and Life and Physical Sciences. Non-veterans exhibited declines in three of the five STEM clusters over the 2012 to 2016 time period: Engineering, Life and Physical Sciences, and Mathematics.
An odds ratio was also calculated for veterans compared to non-veterans for each time period and each cluster. Two of the five clusters exhibited more than likely odds ratios for the 2012 to 2016 time period: Mathematics (1.4839) and Engineering (1.1976). For example, the Mathematics STEM cluster exhibited an overall (Total) odds ratio of 1.4839, indicating that veterans were 1.4839 times more likely to be in the Mathematics STEM cluster than non-veterans for the 2012 to 2016 time period.
Table 10. Distribution of the Five STEM Clusters for Veteran and Non-Veteran Workforces across the 2012 to 2016 Time Period
STEM Clusters - Veterans 2012 2013 2014 2015 2016 Total Trend Information Technology and Computer Science 41.78 42.39 43.22 44.31 45.07 43.33 0.8500 Mathematics 2.75 2.76 2.58 2.95 2.75 2.76 0.0190 Engineering 39.63 39.42 38.39 37.33 36.67 38.31 -0.8010 Life and Physical Sciences 7.01 7.07 7.24 6.57 6.59 6.90 -0.1340 Supervisor/Management 8.84 8.36 8.57 8.84 8.92 8.71 0.0640
STEM Clusters – Non-Veterans 2012 2013 2014 2015 2016 Total Trend Information Technology and Computer Science 42.77 43.63 45.10 45.30 46.13 44.65 0.8390 Mathematics 1.90 1.94 1.89 1.84 1.73 1.86 -0.0440 Engineering 33.32 32.96 31.71 31.25 30.97 31.99 -0.6410 Life and Physical Sciences 13.17 12.75 12.55 12.74 12.18 12.66 -0.1990 Supervisor/Management 8.83 8.72 8.75 8.87 9.00 8.84 0.0490
STEM Clusters – Odds Ratio (Veteran/Non-Veteran) 2012 2013 2014 2015 2016 Total Information Technology and Computer Science 0.9769 0.9716 0.9583 0.9781 0.9770 0.9704 Mathematics 1.4474 1.4227 1.3651 1.6033 1.5896 1.4839 Engineering 1.1894 1.1960 1.2107 1.1946 1.1840 1.1976 Life and Physical Sciences 0.5323 0.5545 0.5769 0.5157 0.5411 0.5450
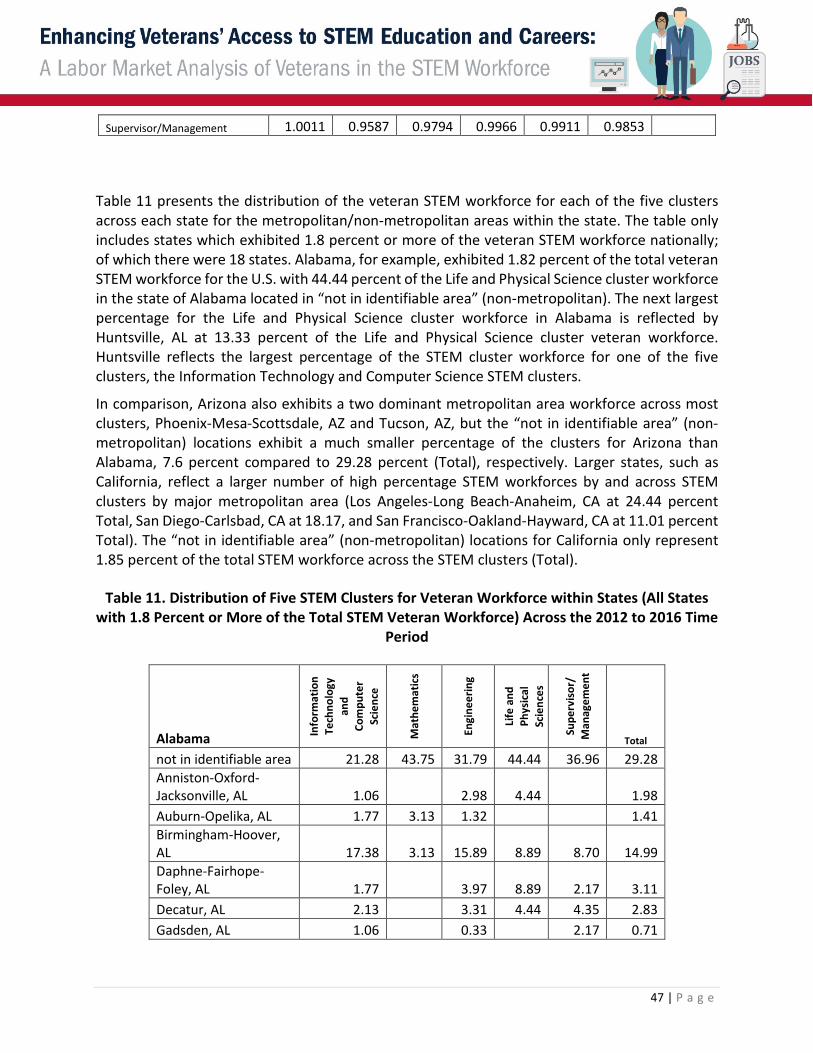
47 | P a g e
Supervisor/Management 1.0011 0.9587 0.9794 0.9966 0.9911 0.9853
Table 11 presents the distribution of the veteran STEM workforce for each of the five clusters across each state for the metropolitan/non-metropolitan areas within the state. The table only includes states which exhibited 1.8 percent or more of the veteran STEM workforce nationally; of which there were 18 states. Alabama, for example, exhibited 1.82 percent of the total veteran STEM workforce for the U.S. with 44.44 percent of the Life and Physical Science cluster workforce in the state of Alabama located in “not in identifiable area” (non-metropolitan). The next largest percentage for the Life and Physical Science cluster workforce in Alabama is reflected by Huntsville, AL at 13.33 percent of the Life and Physical Science cluster veteran workforce. Huntsville reflects the largest percentage of the STEM cluster workforce for one of the five clusters, the Information Technology and Computer Science STEM clusters.
In comparison, Arizona also exhibits a two dominant metropolitan area workforce across most clusters, Phoenix-Mesa-Scottsdale, AZ and Tucson, AZ, but the “not in identifiable area” (non-metropolitan) locations exhibit a much smaller percentage of the clusters for Arizona than Alabama, 7.6 percent compared to 29.28 percent (Total), respectively. Larger states, such as California, reflect a larger number of high percentage STEM workforces by and across STEM clusters by major metropolitan area (Los Angeles-Long Beach-Anaheim, CA at 24.44 percent Total, San Diego-Carlsbad, CA at 18.17, and San Francisco-Oakland-Hayward, CA at 11.01 percent Total). The “not in identifiable area” (non-metropolitan) locations for California only represent 1.85 percent of the total STEM workforce across the STEM clusters (Total).
Table 11. Distribution of Five STEM Clusters for Veteran Workforce within States (All States with 1.8 Percent or More of the Total STEM Veteran Workforce) Across the 2012 to 2016 Time
Period
Alabama Info
rmat
ion
Tech
nolo
gy
and
Com
pute
r Sc
ienc
e
Mat
hem
atic
s
Engi
neer
ing
Life
and
Ph
ysic
al
Scie
nces
Supe
rvis
or/
Man
agem
ent
Total
not in identifiable area 21.28 43.75 31.79 44.44 36.96 29.28 Anniston-Oxford-Jacksonville, AL 1.06 2.98 4.44 1.98 Auburn-Opelika, AL 1.77 3.13 1.32 1.41 Birmingham-Hoover, AL 17.38 3.13 15.89 8.89 8.70 14.99 Daphne-Fairhope-Foley, AL 1.77 3.97 8.89 2.17 3.11 Decatur, AL 2.13 3.31 4.44 4.35 2.83 Gadsden, AL 1.06 0.33 2.17 0.71

48 | P a g e
Huntsville, AL 26.95 43.75 23.84 13.33 19.57 25.04 Mobile, AL 4.26 7.28 4.44 4.35 5.37 Montgomery, AL 19.86 6.25 6.95 6.67 21.74 13.01 Tuscaloosa, AL 2.48 2.32 4.44 2.26 Total 100.00 100.00 100.00 100.00 100.00 100.00 Percent of Total Veteran STEM Workforce 1.68 2.99 2.03 1.68 1.36 1.82
Arizona
Info
rmat
ion
Tech
nolo
gy a
nd
Com
pute
r Sc
ienc
e
Mat
hem
atic
s
Engi
neer
ing
Life
and
Ph
ysic
al
Scie
nces
Supe
rvis
or/
Man
agem
ent
Total
not in identifiable area 9.43 14.29 5.73 4.00 7.55 7.60 Flagstaff, AZ 1.05 7.14 1.91 6.00 0.94 1.69 Lake Havasu City-Kingman, AZ 0.84 0.72 2.00 0.94 0.84 Phoenix-Mesa-Scottsdale, AZ 68.34 42.86 68.97 52.00 74.53 68.11 Prescott, AZ 1.05 1.43 0.94 1.13 Tucson, AZ 17.40 28.57 17.90 26.00 14.15 17.82 Yuma, AZ 1.89 7.14 3.34 10.00 0.94 2.81 Total 100.00 100.00 100.00 100.00 100.00 100.00 Percent of Total Veteran STEM Workforce 2.84 1.31 2.82 1.87 3.14 2.75
California
Info
rmat
ion
Tech
nolo
gy
and
Com
pute
r Sc
ienc
e
Mat
hem
atic
s
Engi
neer
ing
Life
and
Ph
ysic
al
Scie
nces
Supe
rvis
or/
Man
agem
ent
Total
not in identifiable area 1.28 1.70 6.84 1.60 1.85 Bakersfield, CA 1.41 5.33 2.33 3.42 1.92 2.06 Chico, CA 0.34 0.19 0.38 0.64 0.29 El Centro, CA 0.13 0.38 0.08 Fresno, CA 1.88 4.00 1.82 1.14 1.28 1.80 Hanford-Corcoran, CA 0.54 0.19 0.38 0.64 0.38 Los Angeles-Long Beach-Anaheim, CA 22.01 17.33 27.59 17.49 27.48 24.44 Madera, CA 0.20 0.13 0.38 0.16 Merced, CA 0.20 0.25 1.14 0.64 0.32 Modesto, CA 0.94 1.33 0.82 0.38 0.96 0.86 Napa, CA 0.47 0.31 0.76 0.32 0.40

49 | P a g e
Oxnard-Thousand Oaks-Ventura, CA 2.48 2.67 5.15 2.66 1.60 3.56 Redding, CA 0.13 0.57 0.76 0.35 Riverside-San Bernardino-Ontario, CA 11.01 5.33 9.43 7.22 11.50 9.99 Sacramento--Roseville--Arden-Arcade, CA 10.40 21.33 5.66 9.51 7.35 8.28 Salinas, CA 1.21 1.33 1.01 1.52 1.28 1.15 San Diego-Carlsbad, CA 19.46 21.33 18.16 14.83 14.06 18.17 San Francisco-Oakland-Hayward, CA 11.34 4.00 9.55 17.11 13.42 11.01 San Jose-Sunnyvale-Santa Clara, CA 6.64 2.67 6.47 3.42 7.35 6.32 San Luis Obispo -Paso Robles-Arroyo Grande, CA 0.81 0.94 1.90 1.28 0.96 Santa Cruz-Watsonville, CA 0.94 0.63 0.76 0.64 0.75 Santa Maria-Santa Barbara, CA 1.61 5.33 1.70 1.14 1.60 1.69 Santa Rosa, CA 0.87 1.51 1.90 0.96 1.21 Stockton-Lodi, CA 1.21 1.33 1.38 0.76 1.28 1.26 Vallejo-Fairfield, CA 1.48 2.67 1.26 1.52 1.60 1.42 Visalia-Porterville, CA 0.13 0.75 0.76 0.43 Yuba City, CA 1.01 4.00 0.38 1.52 0.64 0.80 Total 100.00 100.00 100.00 100.00 100.00 100.00 Percent of Total Veteran STEM Workforce 8.87 7.02 10.71 9.83 9.27 9.63
Colorado
Info
rmat
ion
Tech
nolo
gy
and
Com
pute
r Sc
ienc
e
Mat
hem
atic
s
Engi
neer
ing
Life
and
Ph
ysic
al
Scie
nces
Supe
rvis
or/
Man
agem
ent
Total
not in identifiable area 11.47 4.17 16.19 23.81 15.09 13.83 Colorado Springs, CO 30.70 45.83 24.52 15.87 24.53 27.66 Denver-Aurora-Lakewood, CO 52.25 41.67 49.76 44.44 54.72 51.03 Fort Collins, CO 4.34 8.33 7.38 9.52 4.72 5.72 Grand Junction, CO 0.47 0.48 6.35 0.94 0.79 Pueblo, CO 0.78 1.67 0.95

50 | P a g e
Total 100.00 100.00 100.00 100.00 100.00 100.00 Percent of Total Veteran STEM Workforce 3.84 2.25 2.83 2.36 3.14 3.25
Florida Info
rmat
ion
Tech
nolo
gy
and
Com
pute
r Sc
ienc
e
Mat
hem
atic
s
Engi
neer
ing
Life
and
Ph
ysic
al
Scie
nces
Supe
rvis
or/
Man
agem
ent
Total
not in identifiable area 13.69 22.39 13.87 14.08 8.85 13.64 Cape Coral-Fort Myers, FL 1.96 0.94 4.93 1.56 1.66 Deltona-Daytona Beach-Ormond Beach, FL 1.87 1.49 3.13 3.52 3.13 2.52 Gainesville, FL 1.19 1.49 1.25 4.23 1.04 1.38 Homosassa Springs, FL 0.34 1.49 0.42 0.70 1.04 0.47 Jacksonville, FL 12.33 4.48 10.95 9.86 10.94 11.36 Lakeland-Winter Haven, FL 2.04 2.99 3.75 4.93 1.04 2.80 Miami-Fort Lauderdale-West Palm Beach, FL 14.46 16.42 14.81 17.61 15.10 14.87 Naples-Immokalee-Marco Island, FL 1.19 1.49 0.31 0.70 1.04 0.83 North Port-Sarasota-Bradenton, FL 2.98 3.55 2.11 3.13 3.08 Ocala, FL 0.85 1.49 1.15 1.04 0.95 Orlando-Kissimmee-Sanford, FL 10.54 4.48 9.80 9.15 11.98 10.13 Palm Bay-Melbourne-Titusville, FL 4.51 4.48 12.51 8.45 6.25 7.89 Pensacola-Ferry Pass-Brent, FL 4.76 8.96 3.44 4.23 4.69 4.34 Port St. Lucie, FL 0.94 2.19 2.11 2.08 1.54 Punta Gorda, FL 0.60 0.63 0.70 0.55 Sebastian-Vero Beach, FL 0.77 0.52 0.52 0.59 Tampa-St. Petersburg-Clearwater, FL 25.00 28.36 16.79 12.68 26.56 21.41 Total 100.00 100.00 100.00 100.00 100.00 100.00 Percent of Total Veteran STEM Workforce 7.00 6.27 6.46 5.31 5.69 6.54

51 | P a g e
Georgia
Info
rmat
ion
Tech
nolo
gy
and
Com
pute
r Sc
ienc
e
Mat
hem
atic
s
Engi
neer
ing
Life
and
Ph
ysic
al
Scie
nces
Supe
rvis
or/
Man
agem
ent
Total
not in identifiable area 28.20 33.33 38.17 50.00 28.24 33.38 Atlanta-Sandy Springs-Roswell, GA 63.44 46.67 53.94 45.65 64.89 58.59 Augusta-Richmond County, GA-SC 5.90 16.67 4.98 5.34 5.35 Chattanooga, TN-GA 1.15 3.33 1.45 3.26 1.53 1.49 Gainesville, GA 1.31 1.45 1.09 1.19 Total 100.00 100.00 100.00 100.00 100.00 100.00 Percent of Total Veteran STEM Workforce 3.63 2.81 3.25 3.44 3.88 3.47
Illinois Info
rmat
ion
Tech
nolo
gy
and
Com
pute
r Sc
ienc
e
Mat
hem
atic
s
Engi
neer
ing
Life
and
Ph
ysic
al
Scie
nces
Supe
rvis
or/
Man
agem
ent
Total
not in identifiable area 19.88 16.67 31.28 31.88 19.80 24.70 Bloomington, IL 3.65 4.17 1.54 2.97 2.60 Champaign-Urbana, IL 1.83 2.31 3.96 2.04 Chicago-Naperville-Elgin, IL 51.93 41.67 48.21 42.03 56.44 50.14 Decatur, IL 1.01 2.82 1.45 1.58 Kankakee, IL 1.03 1.45 0.46 Rockford, IL 2.03 3.59 2.90 2.97 2.69 St. Louis, MO-IL 15.82 33.33 7.69 15.94 11.88 12.91 Springfield, IL 3.85 4.17 1.54 4.35 1.98 2.88 Total 100.00 100.00 100.00 100.00 100.00 100.00 Percent of Total Veteran STEM Workforce 2.94 2.25 2.63 2.58 2.99 2.78
Maryland
Info
rmat
ion
Tech
nolo
gy
and
Com
pute
r Sc
ienc
e
Mat
hem
atic
s
Engi
neer
ing
Life
and
Ph
ysic
al
Scie
nces
Supe
rvis
or/
Man
agem
ent
Total
not in identifiable area 9.12 10.53 19.76 9.65 11.56 12.13 Baltimore-Columbia-Towson, MD 43.74 48.25 42.44 35.96 31.29 42.07

52 | P a g e
Philadelphia-Camden-Wilmington, PA-NJ-MD 1.29 2.20 3.51 0.68 1.52 Salisbury, MD-DE 0.82 0.88 1.71 2.63 1.10 Washington-Arlington-Alexandria, DC-VA-MD 45.03 40.35 33.90 48.25 56.46 43.17 Total 100.00 100.00 100.00 100.00 100.00 100.00 Percent of Total Veteran STEM Workforce 5.09 10.66 2.76 4.26 4.36 4.23
Massachusetts
Info
rmat
ion
Tech
nolo
gy
and
Com
pute
r Sc
ienc
e
Mat
hem
atic
s
Engi
neer
ing
Life
and
Ph
ysic
al
Scie
nces
Supe
rvis
or/
Man
agem
ent
Total
not in identifiable area 2.04 3.11 6.00 1.43 2.67 Barnstable Town, MA 3.40 2.42 4.00 4.29 3.09 Boston-Cambridge-Newton, MA-NH 60.20 62.50 52.25 62.00 67.14 57.81 Pittsfield, MA 2.04 3.81 2.00 2.86 2.81 Providence-Warwick, RI_MA 9.18 12.50 9.69 10.00 8.86 Springfield, MA 5.78 9.69 6.00 4.29 7.17 Worcester, MA-CT 17.35 25.00 19.03 20.00 10.00 17.58 Total 100.00 100.00 100.00 100.00 100.00 100.00 Percent of Total Veteran STEM Workforce 1.75 0.75 1.95 1.87 2.07 1.83
Michigan
Info
rmat
ion
Tech
nolo
gy
and
Com
pute
r Sc
ienc
e
Mat
hem
atic
s
Engi
neer
ing
Life
and
Ph
ysic
al
Scie
nces
Supe
rvis
or/
Man
agem
ent
Total
not in identifiable area 26.44 28.57 33.33 37.74 28.57 30.82 Ann Arbor, MI 7.12 21.43 3.60 9.43 10.00 5.94 Detroit-Warren-Dearborn, MI 41.69 21.43 41.44 24.53 40.00 40.07 Grand Rapids-Wyoming, MI 7.12 7.14 6.08 1.89 5.71 6.16 Jackson, MI 1.36 2.48 1.89 1.83 Kalamazoo-Portage, MI 3.05 4.05 3.77 1.43 3.42

53 | P a g e
Lansing-East Lansing, MI 7.46 14.29 2.70 5.66 8.57 5.14 Monroe, MI 0.34 7.14 1.58 1.89 1.43 1.26 Muskegon, MI 1.69 0.90 5.66 1.37 Niles-Benton Harbor, MI 2.71 1.80 5.66 2.17 Saginaw, MI 1.02 2.03 1.89 4.29 1.83 Total 100.00 100.00 100.00 100.00 100.00 100.00 Percent of Total Veteran STEM Workforce 1.76 1.31 2.99 1.98 2.07 2.26
New York Info
rmat
ion
Tech
nolo
gy
and
Com
pute
r Sc
ienc
e
Mat
hem
atic
s
Engi
neer
ing
Life
and
Ph
ysic
al
Scie
nces
Supe
rvis
or/
Man
agem
ent
Total
not in identifiable area 16.59 9.52 21.79 25.30 16.16 19.32 Albany-Schenectady-Troy, NY 8.52 19.05 10.51 3.61 7.07 9.11 Binghamton, NY 2.84 3.50 3.61 2.02 3.06 Buffalo-Cheektowaga-Niagara Falls, NY 5.68 14.29 9.34 10.84 8.08 8.00 Glens Falls, NY 0.87 2.53 1.20 1.53 Ithaca, NY 0.66 4.76 0.58 2.41 2.02 0.94 New York-Newark-Jersey City, NY-NJ-PA 41.92 38.10 33.07 30.12 40.40 37.02 Rochester, NY 11.14 14.29 10.12 14.46 13.13 11.15 Syracuse, NY 8.95 6.42 8.43 7.07 7.49 Utica-Rome, NY 2.84 2.14 4.04 2.38 Total 100.00 100.00 100.00 100.00 100.00 100.00 Percent of Total Veteran STEM Workforce 2.73 1.96 3.46 3.1 2.93 3.03
North Carolina
Info
rmat
ion
Tech
nolo
gy a
nd
Com
pute
r Sc
ienc
e
Mat
hem
atic
s
Engi
neer
ing
Life
and
Ph
ysic
al
Scie
nces
Supe
rvis
or/
Man
agem
ent
Total
not in identifiable area 32.70 40.00 25.88 40.21 25.97 30.35 Asheville, NC 2.71 4.61 1.03 5.19 3.45 Burlington, NC 1.75 3.33 1.32 1.03 1.95 1.61 Charlotte-Concord-Gastonia, NC 17.86 3.33 22.81 12.37 22.08 19.28 Fayetteville, NC 6.22 20.00 4.39 3.09 3.25 5.35

54 | P a g e
Goldsboro, NC 0.96 1.32 3.09 3.25 1.47 Greensboro-High Point, NC 5.58 3.33 7.02 6.19 6.49 6.16 Greenville, NC 0.64 0.66 1.03 1.95 0.81 Hickory-Lenoir-Morganton, NC 1.12 3.29 1.03 1.95 1.91 Myrtle Beach-Conway-North Myrtle Beach, NC 0.64 6.67 1.54 2.60 1.25 Raleigh, NC 22.01 16.67 17.54 18.56 20.13 19.94 Rocky Mount, NC 0.48 1.75 2.06 0.95 Wilmington, NC 1.28 3.33 1.54 7.22 1.30 1.83 Winston-Salem, NC 6.06 3.33 6.36 3.09 3.90 5.65 Total 100.00 100.00 100.00 100.00 100.00 100.00 Percent of Total Veteran STEM Workforce 3.73 2.81 3.07 3.63 4.56 3.52
Ohio Info
rmat
ion
Tech
nolo
gy
and
Com
pute
r Sc
ienc
e
Mat
hem
atic
s
Engi
neer
ing
Life
and
Ph
ysic
al
Scie
nces
Supe
rvis
or/
Man
agem
ent
Total
not in identifiable area 16.02 22.98 22.62 16.00 19.08 Akron, OH 6.95 6.05 2.38 6.00 6.09 Canton-Massillon, OH 2.32 3.23 2.38 3.00 2.71 Cincinnati, OH-KY-IN 14.48 5.56 13.51 13.10 10.00 13.49 Cleveland-Elyria, OH 16.41 11.11 17.94 10.71 14.00 16.37 Columbus, OH 21.24 16.67 12.10 23.81 24.00 17.85 Dayton, OH 15.06 50.00 12.90 16.67 19.00 15.13 Lima, OH 0.58 0.60 0.49 Mansfield, OH 0.19 1.01 1.19 0.58 Springfield, OH 1.16 16.67 2.22 1.19 3.00 1.97 Toledo, OH 3.86 5.24 3.57 4.00 4.36 Youngstown-Warren-Boardman, OH-PA 1.74 2.22 2.38 1.00 1.89 Total 100.00 100.00 100.00 100.00 100.00 100.00 Percent of Total Veteran STEM Workforce 3.08 1.68 3.34 3.14 2.96 3.14
Pennsylvania
Info
rmat
ion
Tech
nolo
gy
and
Com
pute
r Sc
ienc
e
Mat
hem
atic
s
Engi
neer
ing
Life
and
Ph
ysic
al
Scie
nces
Supe
rvis
or/
Man
agem
ent
Total

55 | P a g e
not in identifiable area 18.78 13.33 23.12 24.49 20.00 21.21 Allentown-Bethlehem-Easton, PA-NJ 3.59 5.56 4.08 2.11 4.35 East Stroudsburg, PA 0.42 1.25 1.05 0.81 Erie, PA 1.90 6.67 3.05 3.06 3.16 2.66 Harrisburg-Carlisle, PA 10.97 6.67 5.02 4.08 6.32 7.34 Johnstown, PA 0.84 6.67 1.25 2.04 1.13 Lancaster, PA 3.16 13.33 2.33 2.04 2.58 Lebanon, PA 1.27 1.43 2.04 1.29 Philadelphia-Camden-Wilmington, PA-NJ-DE 26.58 33.33 21.51 24.49 38.95 25.16 Pittsburgh, PA 19.20 6.67 22.04 23.47 15.79 20.40 Reading, PA 2.95 2.69 2.04 2.11 2.66 Scranton--Wilkes-Barre-Hazleton, PA 3.59 6.67 4.30 3.06 5.26 4.03 State College, PA 1.48 1.25 1.02 1.05 1.29 York-Hanover, PA 4.22 6.67 4.30 3.06 4.21 4.19 Youngstown-Warren-Boardman, OH-PA 1.05 0.90 1.02 0.89 Total 100.00 100.00 100.00 100.00 100.00 100.00 Percent of Total Veteran STEM Workforce 2.82 1.40 3.76 3.66 2.81 3.20
Tennessee Info
rmat
ion
Tech
nolo
gy
and
Com
pute
r Sc
ienc
e
Mat
hem
atic
s
Engi
neer
ing
Life
and
Ph
ysic
al
Scie
nces
Supe
rvis
or/
Man
agem
ent
Total
not in identifiable area 22.76 31.31 22.22 18.92 25.37 Chattanooga, TN-GA 5.77 16.67 10.10 5.56 4.05 7.48 Clarksville, TN-KY 8.65 16.67 3.03 9.26 4.05 6.14 Jackson, TN 0.32 1.68 1.85 1.35 1.07 Knoxville, TN 14.42 17.17 29.63 16.22 16.56 Memphis, TN-MS-AR 19.55 33.33 9.43 14.81 17.57 15.22 Nashville-Davidson-Murfreesboro--Frank 28.53 33.33 27.27 16.67 37.84 28.17 Total 100.00 100.00 100.00 100.00 100.00 100.00 Percent of Total Veteran STEM Workforce 1.86 1.12 2.00 2.02 2.19 1.93

56 | P a g e
Texas
Info
rmat
ion
Tech
nolo
gy
and
Com
pute
r Sc
ienc
e
Mat
hem
atic
s
Engi
neer
ing
Life
and
Ph
ysic
al
Scie
nces
Supe
rvis
or/
Man
agem
ent
Total
not in identifiable area 11.15 13.33 15.13 15.94 10.88 13.05 Amarillo, TX 0.46 1.43 1.20 0.60 0.89 Austin-Round Rock, TX 13.49 13.33 9.03 5.98 9.06 10.82 Beaumont-Port Arthur, TX 0.59 1.29 2.39 1.21 1.03 Brownsville-Harlingen, TX 0.33 0.43 0.40 1.21 0.45 College Station-Bryan, TX 0.85 0.43 0.80 0.59 Corpus Christi, TX 0.78 1.33 1.72 4.38 0.60 1.39 Dallas-Fort Worth-Arlington, TX 35.27 22.67 30.11 16.73 37.46 31.90 El Paso, TX 2.02 5.33 2.72 1.99 1.51 2.31 Houston-The Woodlands-Sugar Land, TX 12.78 5.33 23.73 30.68 18.43 18.66 Laredo, TX 0.07 0.40 0.30 0.08 Lubbock, TX 0.91 0.43 0.40 0.60 0.64 McAllen-Edinburg-Mission, TX 0.33 1.33 0.43 0.40 0.36 Midland, TX 0.13 0.50 0.80 0.30 0.33 Odessa, TX 0.13 1.33 0.79 1.20 0.47 San Angelo, TX 0.46 0.14 0.80 0.60 0.36 San Antonio-New Braunfels, TX 19.17 34.67 9.75 13.15 15.71 15.09 Tyler, TX 0.26 1.33 0.43 0.40 0.30 0.36 Waco, TX 0.39 0.86 1.20 0.91 0.67 Wichita Falls, TX 0.46 0.65 0.80 0.30 0.53 Total 100.00 100.00 100.00 100.00 100.00 100.00 Percent of Total Veteran STEM Workforce 9.13 7.02 9.39 9.38 9.81 9.25
Virginia Info
rmat
ion
Tech
nolo
gy
and
Com
pute
r Sc
ienc
e
Mat
hem
atic
s
Engi
neer
ing
Life
and
Ph
ysic
al
Scie
nces
Supe
rvis
or/
Man
agem
ent
Total
not in identifiable area 6.18 4.73 8.45 11.20 5.36 6.74

57 | P a g e
Blacksburg-Christiansburg-Radford, VA 0.60 0.73 4.00 0.30 0.68 Harrisonburg, VA 0.24 0.49 0.80 0.30 0.31 Lynchburg, VA 0.96 0.73 1.84 0.80 0.30 1.09 Richmond, VA 5.70 2.91 7.59 9.60 5.65 6.09 Roanoke, VA 0.42 1.47 3.20 0.60 0.78 Virginia Beach-Norfolk-Newport News, VA 21.37 18.55 31.09 25.60 19.94 23.61 Washington-Arlington-Alexandria, VA 64.53 73.09 48.35 44.80 67.56 60.70 Total 100.00 100.00 100.00 100.00 100.00 100.00 Percent of Total Veteran STEM Workforce 9.92 25.72 5.50 4.67 9.96 8.30
Washington
Info
rmat
ion
Tech
nolo
gy
and
Com
pute
r Sc
ienc
e
Mat
hem
atic
s
Engi
neer
ing
Life
and
Ph
ysic
al
Scie
nces
Supe
rvis
or/
Man
agem
ent
Total
not in identifiable area 12.55 23.81 16.67 36.59 18.10 16.57 Bellingham, WA 0.80 1.10 2.44 1.72 1.10 Bremerton-Silverdale, WA 7.77 9.52 12.09 7.32 8.62 9.71 Olympia-Tumwater, WA 5.98 4.76 4.03 4.88 5.17 4.97 Portland-Vancouver-Hillsboro, WA 4.78 4.76 6.04 3.66 5.17 5.29 Seattle-Tacoma-Bellevue, WA 59.76 52.38 51.47 26.83 55.17 53.51 Spokane-Spokane Valley, WA 7.57 5.49 13.41 5.17 6.71 Wenatchee, WA 0.40 2.20 3.66 1.34 Yakima, WA 0.40 4.76 0.92 1.22 0.86 0.79 Total 100.00 100.00 100.00 100.00 100.00 100.00 Percent of Total Veteran STEM Workforce 2.99 1.96 3.68 3.07 3.44 3.27
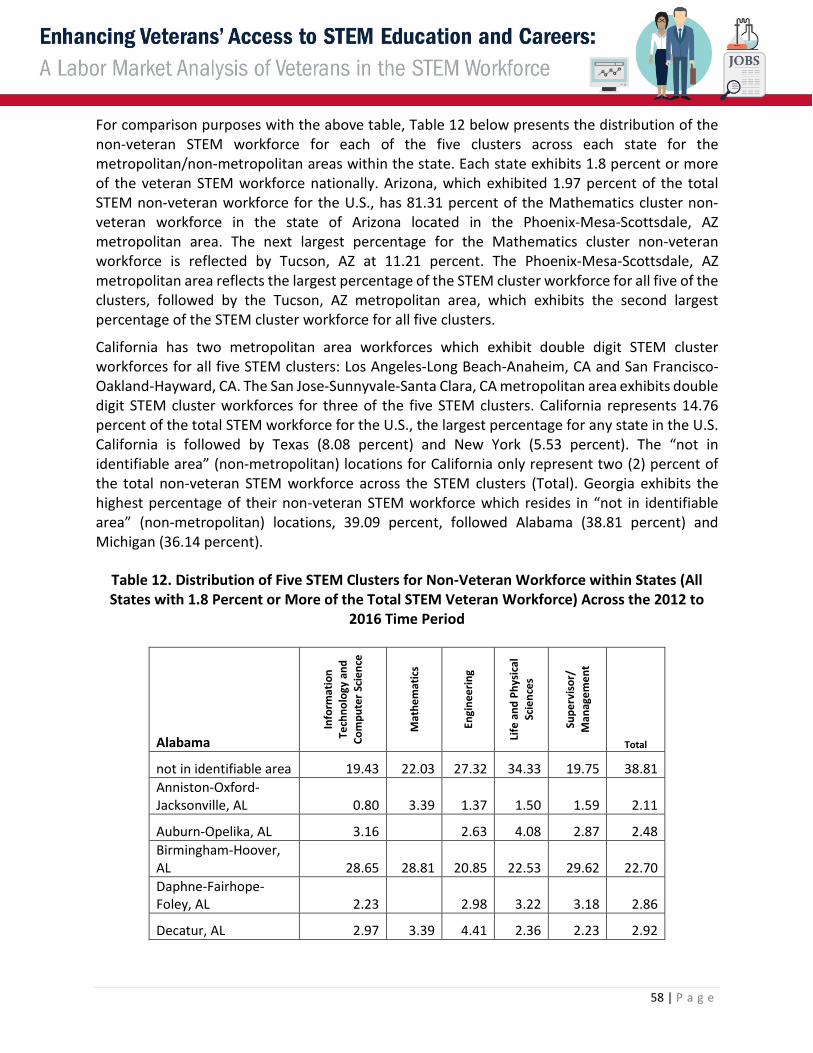
58 | P a g e
For comparison purposes with the above table, Table 12 below presents the distribution of the non-veteran STEM workforce for each of the five clusters across each state for the metropolitan/non-metropolitan areas within the state. Each state exhibits 1.8 percent or more of the veteran STEM workforce nationally. Arizona, which exhibited 1.97 percent of the total STEM non-veteran workforce for the U.S., has 81.31 percent of the Mathematics cluster non-veteran workforce in the state of Arizona located in the Phoenix-Mesa-Scottsdale, AZ metropolitan area. The next largest percentage for the Mathematics cluster non-veteran workforce is reflected by Tucson, AZ at 11.21 percent. The Phoenix-Mesa-Scottsdale, AZ metropolitan area reflects the largest percentage of the STEM cluster workforce for all five of the clusters, followed by the Tucson, AZ metropolitan area, which exhibits the second largest percentage of the STEM cluster workforce for all five clusters.
California has two metropolitan area workforces which exhibit double digit STEM cluster workforces for all five STEM clusters: Los Angeles-Long Beach-Anaheim, CA and San Francisco-Oakland-Hayward, CA. The San Jose-Sunnyvale-Santa Clara, CA metropolitan area exhibits double digit STEM cluster workforces for three of the five STEM clusters. California represents 14.76 percent of the total STEM workforce for the U.S., the largest percentage for any state in the U.S. California is followed by Texas (8.08 percent) and New York (5.53 percent). The “not in identifiable area” (non-metropolitan) locations for California only represent two (2) percent of the total non-veteran STEM workforce across the STEM clusters (Total). Georgia exhibits the highest percentage of their non-veteran STEM workforce which resides in “not in identifiable area” (non-metropolitan) locations, 39.09 percent, followed Alabama (38.81 percent) and Michigan (36.14 percent).
Table 12. Distribution of Five STEM Clusters for Non-Veteran Workforce within States (All States with 1.8 Percent or More of the Total STEM Veteran Workforce) Across the 2012 to
2016 Time Period
Alabama
Info
rmat
ion
Tech
nolo
gy a
nd
Com
pute
r Sci
ence
Mat
hem
atic
s
Engi
neer
ing
Life
and
Phy
sica
l Sc
ienc
es
Supe
rvis
or/
Man
agem
ent
Total
not in identifiable area 19.43 22.03 27.32 34.33 19.75 38.81
Anniston-Oxford-Jacksonville, AL 0.80 3.39 1.37 1.50 1.59 2.11
Auburn-Opelika, AL 3.16 2.63 4.08 2.87 2.48
Birmingham-Hoover, AL 28.65 28.81 20.85 22.53 29.62 22.70
Daphne-Fairhope-Foley, AL 2.23 2.98 3.22 3.18 2.86
Decatur, AL 2.97 3.39 4.41 2.36 2.23 2.92

59 | P a g e
Gadsden, AL 0.80 1.69 1.26 1.29 0.96 1.97
Huntsville, AL 23.70 23.73 24.91 9.66 21.02 7.63
Mobile, AL 6.00 6.78 6.76 7.30 7.32 7.39
Montgomery, AL 8.97 8.47 4.41 8.58 7.64 6.88
Tuscaloosa, AL 3.28 1.69 3.09 5.15 3.82 4.26
Total 100.00 100.00 100.00 100.00 100.00 100.00
Percent of Total Non-Veteran STEM Workforce 0.92 0.81 1.38 0.93 0.90 1.07
Arizona
Info
rmat
ion
Tech
nolo
gy a
nd
Com
pute
r Sc
ienc
e
Mat
hem
atic
s
Engi
neer
ing
Life
and
Ph
ysic
al
Scie
nces
Supe
rvis
or/
Man
agem
ent
Total
not in identifiable area 2.39 3.74 3.60 8.88 3.02 7.54 Flagstaff, AZ 1.40 1.87 2.34 6.70 1.10 2.87 Lake Havasu City-Kingman, AZ 0.65 0.93 0.89 1.16 0.96 2.45 Phoenix-Mesa-Scottsdale, AZ 79.75 81.31 72.40 52.11 78.60 66.97 Prescott, AZ 1.32 1.49 1.75 0.82 2.34 Tucson, AZ 13.76 11.21 17.76 27.80 14.40 15.11 Yuma, AZ 0.73 0.93 1.52 1.60 1.10 2.72 Total 100.00 100.00 100.00 100.00 100.00 100.00 Percent of Total Non-Veteran STEM Workforce 2.02 1.46 2.13 1.38 2.09 1.97
California
Info
rmat
ion
Tech
nolo
gy
and
Com
pute
r Sc
ienc
e
Mat
hem
atic
s
Engi
neer
ing
Life
and
Ph
ysic
al
Scie
nces
Supe
rvis
or/
Man
agem
ent
Total
not in identifiable area 0.78 1.12 1.12 2.55 0.95 2.00 Bakersfield, CA 0.52 0.92 1.03 0.96 0.76 1.63 Chico, CA 0.40 0.30 0.52 0.31 0.54 El Centro, CA 0.06 0.41 0.12 0.14 0.10 0.32 Fresno, CA 0.84 1.33 0.79 1.28 0.56 2.16 Hanford-Corcoran, CA 0.07 0.10 0.11 0.16 0.04 0.30 Los Angeles-Long Beach-Anaheim, CA 27.23 25.05 31.90 23.35 28.66 37.02 Madera, CA 0.07 0.07 0.18 0.06 0.26

60 | P a g e
Merced, CA 0.13 0.14 0.38 0.08 0.54 Modesto, CA 0.45 0.31 0.48 0.75 0.43 1.17 Napa, CA 0.20 0.20 0.30 0.37 0.37 0.48 Oxnard-Thousand Oaks-Ventura, CA 1.82 2.45 2.39 2.51 2.39 2.29 Redding, CA 0.20 0.10 0.31 0.42 0.19 0.45 Riverside-San Bernardino-Ontario, CA 4.32 6.34 5.63 4.16 4.34 9.71 Sacramento--Roseville--Arden-Arcade, CA 5.99 25.87 5.73 7.05 5.55 5.57 Salinas, CA 0.58 1.02 0.57 0.83 0.51 1.24 San Diego-Carlsbad, CA 8.17 7.26 9.83 13.15 7.39 7.85 San Francisco-Oakland-Hayward, CA 24.98 16.46 16.92 26.06 25.30 13.05 San Jose-Sunnyvale-Santa Clara, CA 18.41 5.83 16.17 8.54 17.12 5.52 San Luis Obispo -Paso Robles-Arroyo Grande, CA 0.42 0.51 0.67 0.52 0.53 0.63 Santa Cruz-Watsonville, CA 0.83 0.20 0.79 0.90 0.95 0.70 Santa Maria-Santa Barbara, CA 0.89 0.61 1.13 1.48 0.97 1.11 Santa Rosa, CA 0.88 1.02 1.35 1.26 0.97 1.34 Stockton-Lodi, CA 0.72 0.41 0.94 0.68 0.45 1.62 Vallejo-Fairfield, CA 0.68 1.12 0.73 1.03 0.80 1.06 Visalia-Porterville, CA 0.19 0.41 0.27 0.55 0.12 1.02 Yuba City, CA 0.16 0.92 0.21 0.21 0.10 0.41 Total 100.00 100.00 100.00 100.00 100.00 100.00 Percent of Total Non-Veteran STEM Workforce 15.05 13.36 14.89 14.20 13.94 14.76
Colorado
Info
rmat
ion
Tech
nolo
gy
and
Com
pute
r Sc
ienc
e
Mat
hem
atic
s
Engi
neer
ing
Life
and
Ph
ysic
al
Scie
nces
Supe
rvis
or/
Man
agem
ent
Total
not in identifiable area 15.77 12.38 18.74 28.80 18.20 25.55 Colorado Springs, CO 10.53 4.76 8.12 4.36 8.73 10.55 Denver-Aurora-Lakewood, CO 66.08 77.14 62.42 51.71 64.46 53.55

61 | P a g e
Fort Collins, CO 5.84 4.76 8.28 12.82 7.36 5.96 Grand Junction, CO 0.88 0.84 1.45 0.62 1.80 Pueblo, CO 0.90 0.95 1.59 0.85 0.62 2.59 Total 100.00 100.00 100.00 100.00 100.00 100.00 Percent of Total Non-Veteran STEM Workforce 2.65 1.43 2.44 2.34 2.30 2.49
Florida Info
rmat
ion
Tech
nolo
gy
and
Com
pute
r Sc
ienc
e
Mat
hem
atic
s
Engi
neer
ing
Life
and
Ph
ysic
al
Scie
nces
Supe
rvis
or/
Man
agem
ent
Total
not in identifiable area 7.43 15.26 7.80 13.61 7.03 9.06 Cape Coral-Fort Myers, FL 2.21 1.62 2.18 2.35 1.82 3.28 Deltona-Daytona Beach-Ormond Beach, FL 2.26 1.62 2.78 1.72 1.95 2.83 Gainesville, FL 1.75 1.62 1.75 8.56 1.63 1.39 Homosassa Springs, FL 0.17 0.16 0.57 0.13 0.46 Jacksonville, FL 7.18 9.42 6.69 5.40 9.11 6.41 Lakeland-Winter Haven, FL 2.27 1.62 2.38 2.24 2.99 3.25 Miami-Fort Lauderdale-West Palm Beach, FL 27.86 24.68 29.79 24.99 27.46 31.91 Naples-Immokalee-Marco Island, FL 0.76 0.65 0.89 0.57 0.78 1.50 North Port-Sarasota-Bradenton, FL 2.99 3.90 2.84 4.60 2.60 3.56 Ocala, FL 0.52 0.32 0.55 0.52 0.52 1.12 Orlando-Kissimmee-Sanford, FL 14.36 11.69 13.20 9.71 13.66 10.80 Palm Bay-Melbourne-Titusville, FL 3.83 1.62 7.58 2.64 3.25 2.48 Pensacola-Ferry Pass-Brent, FL 2.00 1.62 1.93 2.58 1.69 2.19 Port St. Lucie, FL 0.87 1.95 1.60 1.95 1.43 1.66 Punta Gorda, FL 0.38 0.32 0.45 0.29 0.26 0.62 Sebastian-Vero Beach, FL 0.34 0.65 0.47 1.15 0.33 0.54 Tampa-St. Petersburg-Clearwater, FL 22.86 21.43 16.93 16.54 23.36 16.95 Total 100.00 100.00 100.00 100.00 100.00 100.00

62 | P a g e
Percent of Total Non-Veteran STEM Workforce 4.81 4.21 4.36 3.49 4.41 4.45
Georgia
Info
rmat
ion
Tech
nolo
gy
and
Com
pute
r Sc
ienc
e
Mat
hem
atic
s
Engi
neer
ing
Life
and
Ph
ysic
al
Scie
nces
Supe
rvis
or/
Man
agem
ent
Total
not in identifiable area 16.60 19.05 28.18 31.32 16.82 39.09 Atlanta-Sandy Springs-Roswell, GA 78.72 77.06 64.66 63.67 79.35 54.33 Augusta-Richmond County, GA-SC 2.20 3.03 4.10 2.94 1.96 2.81 Chattanooga, TN-GA 1.18 0.43 1.43 0.79 0.56 1.72 Gainesville, GA 1.30 0.43 1.62 1.27 1.31 2.04 Total 100.00 100.00 100.00 100.00 100.00 100.00 Percent of Total Non-Veteran STEM Workforce 3.07 3.16 2.49 2.52 3.07 2.82
Illinois Info
rmat
ion
Tech
nolo
gy
and
Com
pute
r Sc
ienc
e
Mat
hem
atic
s
Engi
neer
ing
Life
and
Ph
ysic
al
Scie
nces
Supe
rvis
or/
Man
agem
ent
Total
not in identifiable area 11.15 7.69 21.68 17.88 10.86 24.93 Bloomington, IL 3.30 7.08 1.11 1.26 2.71 1.59 Champaign-Urbana, IL 2.20 2.15 1.61 8.01 1.42 1.62 Chicago-Naperville-Elgin, IL 75.68 73.85 65.19 63.96 78.22 61.12 Decatur, IL 0.63 0.92 1.11 1.54 0.19 0.94 Kankakee, IL 0.30 0.31 0.50 0.55 0.37 0.95 Rockford, IL 1.29 0.62 3.37 1.32 1.36 2.31 St. Louis, MO-IL 3.74 3.38 3.71 3.62 3.70 4.88 Springfield, IL 1.70 4.00 1.71 1.87 1.17 1.67 Total 100.00 100.00 100.00 100.00 100.00 100.00 Percent of Total Non-Veteran STEM Workforce 4.35 4.44 3.93 3.65 4.65 4.16
Maryland
Info
rmat
ion
Tech
nolo
gy
and
Com
pute
r Sc
ienc
e
Mat
hem
atic
s
Engi
neer
ing
Life
and
Ph
ysic
al
Scie
nces
Supe
rvis
or/
Man
agem
ent
Total
not in identifiable area 5.82 4.13 10.14 4.62 7.18 10.46

63 | P a g e
Baltimore-Columbia-Towson, MD 43.77 45.60 47.57 36.87 43.19 43.85 Philadelphia-Camden-Wilmington, PA-NJ-MD 0.75 0.72 1.56 1.43 0.47 1.46 Salisbury, MD-DE 0.66 0.18 1.49 0.95 0.76 2.74 Washington-Arlington-Alexandria, DC-VA-MD 49.00 49.37 39.25 56.12 48.39 41.48 Total 100.00 100.00 100.00 100.00 100.00 100.00 Percent of Total Non-Veteran STEM Workforce 3.46 7.61 2.34 4.20 3.03 3.24
Massachusetts
Info
rmat
ion
Tech
nolo
gy
and
Com
pute
r Sc
ienc
e
Mat
hem
atic
s
Engi
neer
ing
Life
and
Ph
ysic
al
Scie
nces
Supe
rvis
or/
Man
agem
ent
Total
not in identifiable area 1.60 0.43 1.84 1.77 1.31 3.27 Barnstable Town, MA 1.18 1.71 1.59 2.24 2.05 3.31 Boston-Cambridge-Newton, MA-NH 76.37 77.78 69.08 80.53 72.80 63.69 Pittsfield, MA 1.15 0.43 1.66 1.66 1.48 2.62 Providence-Warwick, RI-MA 4.43 5.56 6.01 2.57 4.77 7.65 Springfield, MA 4.54 5.13 5.56 2.28 5.09 7.80 Worcester, MA-CT 10.74 8.97 14.25 8.94 12.49 11.67 Total 100.00 100.00 100.00 100.00 100.00 100.00 Percent of Total Non-Veteran STEM Workforce 3.66 3.20 3.19 5.53 3.49 3.73
Michigan
Info
rmat
ion
Tech
nolo
gy
and
Com
pute
r Sc
ienc
e
Mat
hem
atic
s
Engi
neer
ing
Life
and
Ph
ysic
al
Scie
nces
Supe
rvis
or/
Man
agem
ent
Total
not in identifiable area 18.21 17.28 21.66 29.79 18.40 36.14 Ann Arbor, MI 8.06 3.14 5.09 17.45 6.65 3.61 Detroit-Warren-Dearborn, MI 49.21 37.70 52.38 25.02 53.82 36.10 Grand Rapids-Wyoming, MI 8.88 6.28 6.98 5.45 6.75 7.50 Jackson, MI 1.01 1.05 1.20 0.77 1.76 1.38 Kalamazoo-Portage, MI 3.30 3.14 2.93 6.55 2.05 3.74

64 | P a g e
Lansing-East Lansing, MI 7.33 25.65 3.18 10.81 5.48 5.00 Monroe, MI 0.68 2.62 1.24 0.94 0.68 1.36 Muskegon, MI 0.80 1.05 1.55 1.36 1.27 1.54 Niles-Benton Harbor, MI 1.20 1.05 2.18 1.19 1.86 1.76 Saginaw, MI 1.32 1.05 1.60 0.68 1.27 1.87 Total 100.00 100.00 100.00 100.00 100.00 100.00 Percent of Total Non-Veteran STEM Workforce 2.41 2.61 4.36 2.35 2.93 3.08
New York Info
rmat
ion
Tech
nolo
gy
and
Com
pute
r Sc
ienc
e
Mat
hem
atic
s
Engi
neer
ing
Life
and
Ph
ysic
al
Scie
nces
Supe
rvis
or/
Man
agem
ent
Total
not in identifiable area 6.76 5.75 12.84 11.74 7.61 13.25 Albany-Schenectady-Troy, NY 5.91 7.00 8.82 8.40 6.35 4.36 Binghamton, NY 1.74 1.75 2.41 1.06 1.51 1.30 Buffalo-Cheektowaga-Niagara Falls, NY 5.10 4.25 6.09 4.67 3.78 5.48 Glens Falls, NY 0.53 0.25 0.86 0.87 0.40 0.82 Ithaca, NY 0.75 0.59 3.57 0.86 0.54 New York-Newark-Jersey City, NY-NJ-PA 66.65 71.75 51.66 56.42 68.45 62.29 Rochester, NY 7.71 6.50 9.96 7.33 7.16 6.25 Syracuse, NY 3.59 2.00 5.45 4.71 3.23 4.13 Utica-Rome, NY 1.26 0.75 1.32 1.22 0.66 1.59 Total 100.00 100.00 100.00 100.00 100.00 100.00 Percent of Total Non-Veteran STEM Workforce 5.89 5.46 5.09 5.27 5.69 5.53
North Carolina
Info
rmat
ion
Tech
nolo
gy a
nd
Com
pute
r Sc
ienc
e
Mat
hem
atic
s
Engi
neer
ing
Life
and
Ph
ysic
al
Scie
nces
Supe
rvis
or/
Man
agem
ent
Total
not in identifiable area 18.09 16.36 22.52 37.10 19.78 30.30 Asheville, NC 2.90 1.82 4.67 3.24 2.69 4.63 Burlington, NC 1.57 0.61 1.77 1.97 1.52 1.91 Charlotte-Concord-Gastonia, NC 28.19 30.30 23.22 12.01 27.61 22.03 Fayetteville, NC 1.35 2.42 1.53 0.83 0.84 3.29

65 | P a g e
Goldsboro, NC 0.39 0.58 0.32 1.00 Greensboro-High Point, NC 5.91 6.67 7.09 4.89 7.24 7.87 Greenville, NC 0.77 1.21 1.16 2.10 1.09 1.47 Hickory-Lenoir-Morganton, NC 1.76 1.21 3.27 1.65 1.43 3.78 Myrtle Beach-Conway-North Myrtle Beach, NC 0.69 0.61 1.19 0.70 0.84 1.08 Raleigh, NC 30.83 27.88 23.31 26.75 29.21 12.35 Rocky Mount, NC 0.56 0.61 0.98 0.83 0.76 1.36 Wilmington, NC 1.44 3.03 3.15 2.41 1.60 2.49 Winston-Salem, NC 5.54 7.27 5.56 5.21 5.39 6.44 Total 100.00 100.00 100.00 100.00 100.00 100.00 Percent of Total Non-Veteran STEM Workforce 3.03 2.25 2.59 3.15 3.41 2.93
Ohio Info
rmat
ion
Tech
nolo
gy
and
Com
pute
r Sc
ienc
e
Mat
hem
atic
s
Engi
neer
ing
Life
and
Ph
ysic
al
Scie
nces
Supe
rvis
or/
Man
agem
ent
Total
not in identifiable area 11.17 6.11 19.36 15.56 12.33 25.35 Akron, OH 6.60 8.33 6.05 5.70 7.50 5.70 Canton-Massillon, OH 2.62 2.22 3.20 1.60 1.98 3.38 Cincinnati, OH-KY-IN 17.47 12.22 17.57 22.09 19.66 13.05 Cleveland-Elyria, OH 21.41 26.11 19.45 20.29 21.98 18.72 Columbus, OH 24.75 30.00 15.34 21.13 22.59 15.07 Dayton, OH 8.10 8.33 8.41 6.34 5.78 6.27 Lima, OH 0.49 1.11 0.72 0.45 0.17 0.98 Mansfield, OH 0.38 0.67 0.45 0.60 0.87 Springfield, OH 0.98 1.11 1.07 0.77 0.78 1.27 Toledo, OH 3.94 3.89 5.69 3.39 4.40 5.74 Youngstown-Warren-Boardman, OH-PA 2.10 0.56 2.47 2.24 2.24 3.60 Total 100.00 100.00 100.00 100.00 100.00 100.00 Percent of Total Non-Veteran STEM Workforce 3.14 2.46 3.76 3.13 3.33 3.34
Pennsylvania
Info
rmat
ion
Tech
nolo
gy
and
Com
pute
r Sc
ienc
e
Mat
hem
atic
s
Engi
neer
ing
Life
and
Ph
ysic
al
Scie
nces
Supe
rvis
or/
Man
agem
ent
Total

66 | P a g e
not in identifiable area 12.54 10.38 20.69 14.53 12.77 25.45 Allentown-Bethlehem-Easton, PA-NJ 4.83 3.11 5.70 3.87 5.45 4.67 East Stroudsburg, PA 0.54 0.35 0.38 0.58 0.45 0.71 Erie, PA 1.20 2.42 2.26 1.03 1.64 2.08 Harrisburg-Carlisle, PA 5.95 8.30 3.65 3.24 3.06 4.26 Johnstown, PA 0.95 1.04 1.27 0.67 0.45 1.63 Lancaster, PA 2.28 0.69 2.99 2.25 2.24 3.28 Lebanon, PA 0.67 0.54 0.63 0.75 0.95 Philadelphia-Camden-Wilmington, PA-NJ-DE 38.12 44.29 28.02 43.45 40.55 25.95 Pittsburgh, PA 22.39 21.11 22.51 20.06 23.15 18.40 Reading, PA 2.68 1.04 2.99 2.07 2.76 3.11 Scranton--Wilkes-Barre-Hazleton, PA 2.90 3.11 2.94 1.71 2.17 4.08 State College, PA 1.57 0.35 1.57 3.15 1.19 1.19 York-Hanover, PA 2.87 3.46 3.61 2.20 2.84 3.04 Youngstown-Warren-Boardman, OH-PA 0.52 0.35 0.88 0.54 0.52 1.20 Total 100.00 100.00 100.00 100.00 100.00 100.00 Percent of Total Non-Veteran STEM Workforce 3.59 3.95 3.80 4.45 3.84 3.79
Tennessee
Info
rmat
ion
Tech
nolo
gy
and
Com
pute
r Sc
ienc
e
Mat
hem
atic
s
Engi
neer
ing
Life
and
Ph
ysic
al
Scie
nces
Supe
rvis
or/
Man
agem
ent
Total not in identifiable area 13.34 11.11 28.10 22.20 13.85 29.73 Chattanooga, TN-GA 6.51 9.52 8.40 4.58 8.27 5.41 Clarksville, TN-KY 1.11 1.59 1.63 1.09 0.58 2.52 Jackson, TN 0.74 1.68 1.33 0.77 1.83 Knoxville, TN 15.84 11.11 19.90 25.69 16.54 14.26 Memphis, TN-MS-AR 18.87 22.22 10.52 16.89 14.23 15.27 Nashville-Davidson-Murfreesboro—Franklin, TN 43.59 44.44 29.78 28.23 45.77 30.97 Total 100.00 100.00 100.00 100.00 100.00 100.00 Percent of Total Veteran STEM Workforce 1.39 0.86 1.60 1.66 1.49 1.49

67 | P a g e
Texas
Info
rmat
ion
Tech
nolo
gy
and
Com
pute
r Sc
ienc
e
Mat
hem
atic
s
Engi
neer
ing
Life
and
Ph
ysic
al
Scie
nces
Supe
rvis
or/
Man
agem
ent
Total
not in identifiable area 5.74 3.77 9.42 11.88 5.69 18.76 Amarillo, TX 0.60 0.75 0.85 1.06 0.58 1.11 Austin-Round Rock, TX 17.10 18.59 11.76 10.24 15.34 8.14 Beaumont-Port Arthur, TX 0.44 0.25 1.58 1.39 0.61 1.41 Brownsville-Harlingen, TX 0.30 0.25 0.33 0.42 0.58 1.28 College Station-Bryan, TX 0.76 0.25 0.65 2.98 0.68 0.79 Corpus Christi, TX 0.58 0.25 1.36 1.50 0.58 1.80 Dallas-Fort Worth-Arlington, TX 42.58 36.18 29.79 18.12 39.15 27.61 El Paso, TX 1.41 1.51 1.29 1.50 1.15 2.73 Houston-The Woodlands-Sugar Land, TX 20.25 21.61 33.41 38.63 28.38 20.72 Laredo, TX 0.18 0.25 0.30 0.11 0.20 0.96 Lubbock, TX 0.66 0.75 0.58 1.56 0.41 1.18 McAllen-Edinburg-Mission, TX 0.60 0.25 0.64 0.78 0.64 1.98 Midland, TX 0.19 0.25 0.76 1.11 0.30 0.50 Odessa, TX 0.12 0.28 0.31 0.14 0.50 San Angelo, TX 0.24 0.19 0.28 0.14 0.43 San Antonio-New Braunfels, TX 6.98 13.32 5.21 6.71 4.54 7.77 Tyler, TX 0.39 0.25 0.59 0.61 0.30 0.76 Waco, TX 0.58 1.51 0.60 0.50 0.47 1.02 Wichita Falls, TX 0.30 0.42 0.31 0.14 0.56 Total 100.00 100.00 100.00 100.00 100.00 100.00 Percent of Total Non-Veteran STEM Workforce 7.88 5.44 8.77 7.20 8.47 8.08
Virginia Info
rmat
ion
Tech
nolo
gy
and
Com
pute
r Sc
ienc
e
Mat
hem
atic
s
Engi
neer
ing
Life
and
Ph
ysic
al
Scie
nces
Supe
rvis
or/
Man
agem
ent
Total
not in identifiable area 6.37 4.37 10.69 15.40 6.33 17.56

68 | P a g e
Blacksburg-Christiansburg-Radford, VA 1.16 2.15 4.05 1.07 1.88 Harrisonburg, VA 0.64 0.14 0.99 1.62 0.87 1.89 Lynchburg, VA 1.06 0.82 2.89 2.65 1.47 2.83 Richmond, VA 11.16 9.70 10.71 14.74 11.86 15.02 Roanoke, VA 1.74 0.68 2.84 2.28 1.87 3.64 Virginia Beach-Norfolk-Newport News, VA 9.38 5.60 19.36 12.90 10.93 18.60 Washington-Arlington-Alexandria, VA 68.48 78.69 50.37 46.35 65.62 38.58 Total 100.00 100.00 100.00 100.00 100.00 100.00 Percent of Total Non-Veteran STEM Workforce 4.50 10.00 2.88 2.72 4.31 3.84
Washington
Info
rmat
ion
Tech
nolo
gy
and
Com
pute
r Sc
ienc
e
Mat
hem
atic
s
Engi
neer
ing
Life
and
Ph
ysic
al
Scie
nces
Supe
rvis
or/
Man
agem
ent
Total
not in identifiable area 6.82 7.06 12.48 25.73 9.40 18.73 Bellingham, WA 1.28 1.76 1.93 2.35 1.00 2.62 Bremerton-Silverdale, WA 2.23 4.12 4.69 3.20 1.64 3.74 Olympia-Tumwater, WA 2.57 7.06 1.96 4.26 2.28 3.14 Portland-Vancouver-Hillsboro, WA 4.21 4.71 6.50 3.55 4.93 6.48 Seattle-Tacoma-Bellevue, WA 78.42 72.94 66.80 50.46 77.01 52.91 Spokane-Spokane Valley, WA 3.75 2.35 4.26 6.33 3.01 7.90 Wenatchee, WA 0.29 0.44 1.78 0.18 1.43 Yakima, WA 0.44 0.93 2.35 0.55 3.05 Total 100.00 100.00 100.00 100.00 100.00 100.00 Percent of Total Non-Veteran STEM Workforce 3.36 2.32 3.07 2.82 3.14 3.16
Veteran STEM Regions

69 | P a g e
Table 13 presents the percent of each occupational cluster STEM workforce by veterans and non-veterans over the nine Census regions for the 2012 to 2016 time period, i.e., 4.18 percent of the veteran STEM workforce for the information technology and computer science occupational cluster resides in the New England region of the U.S. (all columns sum to 100 percent). The largest percentage of the veteran STEM workforce for the information technology and computer science occupational cluster resides in the South Atlantic region of the U.S. (32.13 percent). It should be noted that the largest percentage of the veteran STEM workforce for the each of the five occupational clusters resides in the South Atlantic region of the U.S. (see table below for states within the South Atlantic region). This is not true for non-veterans in the STEM occupational workforce where the South Atlantic region competes with the Pacific region for the largest percentage of non-veteran workforce members.
States by Nine Census Regions
Region States
New England Vermont, Rhode Island, Maine, New Hampshire, Connecticut, Massachusetts
Middle Atlantic New Jersey, Pennsylvania, New York
East North Central Wisconsin, Indiana, Michigan, Ohio, Illinois
West North Central North Dakota, South Dakota, Nebraska, Kansas, Iowa, Minnesota, Missouri
South Atlantic District Of Columbia, Delaware, West Virginia, South Carolina, Maryland, Virginia, Georgia, North Carolina, Florida
East South Central Mississippi, Kentucky, Alabama, Tennessee
West South Central Arkansas, Oklahoma, Louisiana, Texas
Mountain Wyoming, Montana, Idaho, New Mexico, Nevada, Utah, Colorado, Arizona
Pacific Alaska, Hawaii, Oregon, Washington, California
Table 13. Distribution of the Veteran and Non-Veteran STEM Workforce by Occupational Cluster (5) across Census Regions (9) for the 2012 to 2016 Time Period
Region - Veterans
Info
rmat
ion
Tech
nolo
gy a
nd
Com
pute
r Sc
ienc
e
Mat
hem
atic
s
Engi
neer
ing
Life
and
Phy
sica
l Sc
ienc
es
Supe
rvis
or/
Man
agem
ent
Total New England Region 4.18 2.53 5.18 4.41 5.16 4.62 Middle Atlantic Region 7.28 4.40 8.85 8.97 7.94 7.98 East North Central Region 10.34 6.27 12.21 10.62 10.34 10.96

70 | P a g e
Region - Veterans
Info
rmat
ion
Tech
nolo
gy a
nd
Com
pute
r Sc
ienc
e
Mat
hem
atic
s
Engi
neer
ing
Life
and
Phy
sica
l Sc
ienc
es
Supe
rvis
or/
Man
agem
ent
Total West North Central Region 5.79 4.68 5.10 6.80 4.50 5.45 South Atlantic Region 32.13 51.45 23.78 24.97 30.96 28.87 East South Central Region 4.95 4.96 5.78 5.68 5.36 5.36 West South Central Region 11.28 7.95 12.47 13.12 11.76 11.81 Mountain Region 10.07 5.89 9.41 9.53 8.86 9.56 Pacific Region 14.00 11.88 17.21 15.89 15.11 15.40 Total 100.00 100.00 100.00 100.00 100.00 100.00
Region - Non-Veterans
Info
rmat
ion
Tech
nolo
gy a
nd
Com
pute
r Sc
ienc
e
Mat
hem
atic
s
Engi
neer
ing
Life
and
Phy
sica
l Sc
ienc
es
Supe
rvis
or/
Man
agem
ent
Total New England Region 6.46 6.53 6.28 8.35 6.94 6.68 Middle Atlantic Region 13.87 13.41 11.71 13.16 14.66 13.15 East North Central Region 12.68 11.76 15.98 12.73 13.82 13.83 West North Central Region 5.56 4.63 5.58 6.31 5.42 5.64 South Atlantic Region 20.83 31.66 16.86 18.86 20.14 19.45 East South Central Region 3.53 2.95 4.52 3.96 3.64 3.90 West South Central Region 9.58 6.87 11.35 9.76 10.08 10.16 Mountain Region 7.33 4.71 7.62 7.62 6.43 7.33 Pacific Region 20.17 17.47 20.09 19.26 18.86 19.86 Total 100.00 100.00 100.00 100.00 100.00 100.00
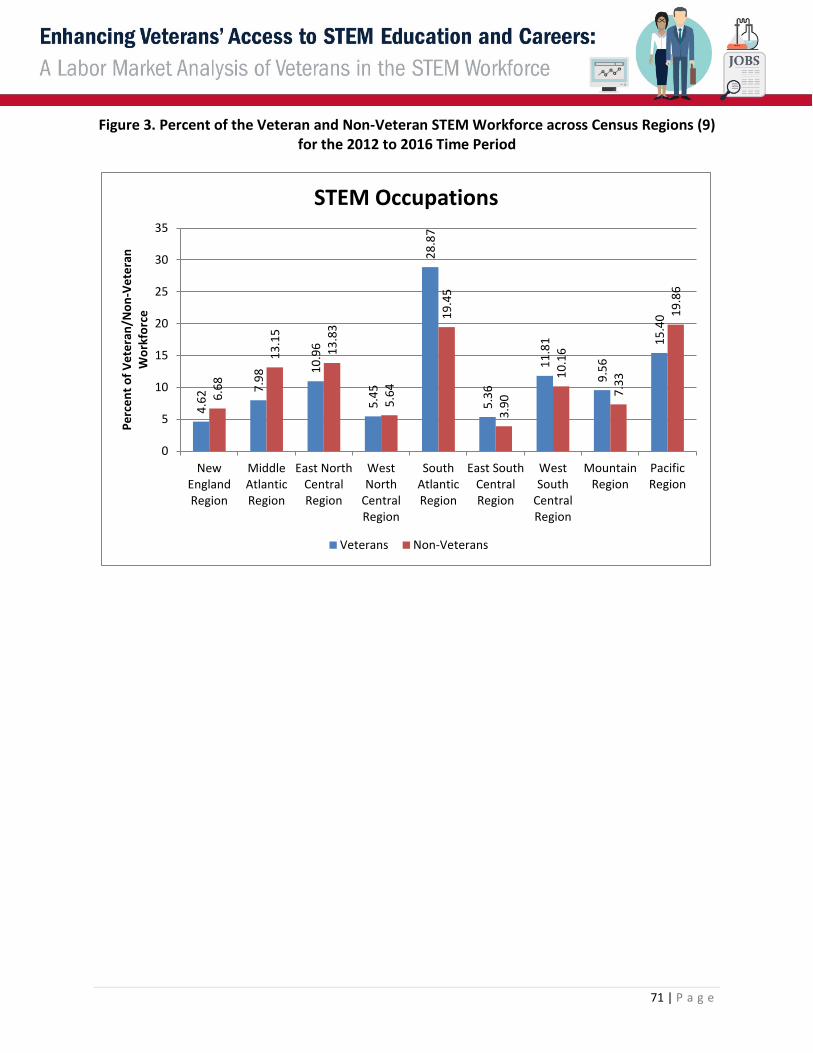
71 | P a g e
Figure 3. Percent of the Veteran and Non-Veteran STEM Workforce across Census Regions (9) for the 2012 to 2016 Time Period
4.62
7.98
10.9
6
5.45
28.8
7
5.36
11.8
1
9.56
15.4
0
6.68
13.1
5
13.8
3
5.64
19.4
5
3.90
10.1
6
7.33
19.8
6
0
5
10
15
20
25
30
35
NewEnglandRegion
MiddleAtlanticRegion
East NorthCentralRegion
WestNorth
CentralRegion
SouthAtlanticRegion
East SouthCentralRegion
WestSouth
CentralRegion
MountainRegion
PacificRegion
Perc
ent o
f Vet
eran
/Non
-Vet
eran
W
orkf
orce
STEM Occupations
Veterans Non-Veterans

72 | P a g e
Figure 4. Percent of the Veteran and Non-Veteran STEM Workforce in the Information Technology and Computer Science Occupational STEM Cluster across Census Regions (9) for
the 2012 to 2016 Time Period
4.18
7.28
10.3
4
5.79
32.1
3
4.95
11.2
8
10.0
7 14.0
0
6.46
13.8
7
12.6
8
5.56
20.8
3
3.53
9.58
7.33
20.1
7
0
5
10
15
20
25
30
35
NewEnglandRegion
MiddleAtlanticRegion
East NorthCentralRegion
WestNorth
CentralRegion
SouthAtlanticRegion
East SouthCentralRegion
WestSouth
CentralRegion
MountainRegion
PacificRegion
Perc
ent o
f Vet
eran
/Non
-Vet
eran
Wor
kfor
ce
Information Technology and Computer Science STEM Cluster
Veterans Non-Veterans

73 | P a g e
Figure 5. Percent of the Veteran and Non-Veteran STEM Workforce in the Mathematics Occupational STEM Cluster across Census Regions (9) for the 2012 to 2016 Time Period
2.53 4.
40 6.27
4.68
51.4
5
4.96 7.
95
5.89
11.8
8
6.53
13.4
1
11.7
6
4.63
31.6
6
2.95 6.
87
4.71
17.4
7
0
10
20
30
40
50
60
NewEnglandRegion
MiddleAtlanticRegion
East NorthCentralRegion
WestNorth
CentralRegion
SouthAtlanticRegion
East SouthCentralRegion
WestSouth
CentralRegion
MountainRegion
PacificRegion
Perc
ent o
f Vet
eran
/Non
-Vet
eran
Wor
kfor
ce
Mathematics STEM Cluster
Veterans Non-Veterans

74 | P a g e
Figure 6. Percent of the Veteran and Non-Veteran STEM Workforce in the Engineering Occupational STEM Cluster across Census Regions (9) for the 2012 to 2016 Time Period
5.18
8.85
12.2
1
5.10
23.7
8
5.78
12.4
7
9.41
17.2
1
6.28
11.7
1
15.9
8
5.58
16.8
6
4.52
11.3
5
7.62
20.0
9
0
5
10
15
20
25
NewEnglandRegion
MiddleAtlanticRegion
East NorthCentralRegion
WestNorth
CentralRegion
SouthAtlanticRegion
East SouthCentralRegion
WestSouth
CentralRegion
MountainRegion
PacificRegionPe
rcen
t of V
eter
an/N
on-V
eter
an W
orkf
orce
Engineering STEM Cluster
Veterans Non-Veterans

75 | P a g e
Figure 7. Percent of the Veteran and Non-Veteran STEM Workforce in the Life and Physical Sciences Occupational STEM Cluster across Census Regions (9) for the 2012 to 2016Time
Period
4.41
8.97 10
.62
6.80
24.9
7
5.68
13.1
2
9.53
15.8
9
8.35
13.1
6
12.7
3
6.31
18.8
6
3.96
9.76
7.62
19.2
6
0
5
10
15
20
25
30
NewEnglandRegion
MiddleAtlanticRegion
East NorthCentralRegion
WestNorth
CentralRegion
SouthAtlanticRegion
East SouthCentralRegion
WestSouth
CentralRegion
MountainRegion
PacificRegion
Perc
ent o
f Vet
eran
/Non
-Vet
eran
Wor
kfor
ce
Life and Physical Sciences STEM Cluster
Veterans Non-Veterans

76 | P a g e
Figure 8. Percent of the Veteran and Non-Veteran STEM Workforce in the Supervisor/Management Occupational STEM Cluster across Census Regions (9) for the 2012
to 2016 Time Period
Table 14 presents the percent of each occupational cluster workforce within a specific Census region by veterans and non-veterans for the 2012 to 2016 time period, i.e., 42.99 percent of the veteran STEM workforce in the New England region is in the engineering occupational cluster (all rows sum to 100 percent). The largest percentage of the veteran STEM workforce by region is in the information technology and computer science and engineering occupational clusters. This is also true for non-veteran STEM workforces by region.
5.16
7.94 10
.34
4.50
30.9
6
5.36
11.7
6
8.86
15.1
1
6.94
14.6
6
13.8
2
5.42
20.1
4
3.64
10.0
8
6.43
18.8
6
0
5
10
15
20
25
30
35
NewEnglandRegion
MiddleAtlanticRegion
East NorthCentralRegion
WestNorth
CentralRegion
SouthAtlanticRegion
East SouthCentralRegion
WestSouth
CentralRegion
MountainRegion
PacificRegion
Perc
ent o
f Vet
eran
/Non
-Vet
eran
Wor
kfor
ce
Supervisor/Management STEM Cluster
Veterans Non-Veterans

77 | P a g e
Table 14. Percent of the Veteran and Non-Veteran STEM Workforce by Occupational STEM Cluster (5) by Census Region (9) for the 2012 to 2016Time Period
Region - Veterans
Info
rmat
ion
Tech
nolo
gy a
nd
Com
pute
r Sc
ienc
e
Mat
hem
atic
s
Engi
neer
ing
Life
and
Ph
ysic
al
Scie
nces
Supe
rvis
or/
Man
agem
ent
Total
New England Region 39.20 1.51 42.99 6.59 9.72 100.00 Middle Atlantic Region 39.52 1.52 42.53 7.76 8.67 100.00 East North Central Region 40.86 1.58 42.67 6.68 8.21 100.00 West North Central Region 46.00 2.37 35.83 8.61 7.19 100.00 South Atlantic Region 48.22 4.91 31.56 5.97 9.34 100.00 East South Central Region 40.06 2.55 41.36 7.32 8.71 100.00 West South Central Region 41.36 1.86 40.45 7.67 8.67 100.00 Mountain Region 45.63 1.70 37.72 6.88 8.07 100.00 Pacific Region 39.39 2.13 42.82 7.12 8.54 100.00 Total 43.33 2.76 38.31 6.90 8.71 100.00
Region - Non-Veterans
Info
rmat
ion
Tech
nolo
gy a
nd
Com
pute
r Sc
ienc
e
Mat
hem
atic
s
Engi
neer
ing
Life
and
Phy
sica
l Sc
ienc
es
Supe
rvis
or/
Man
agem
ent
Total
New England Region 43.14 1.81 30.05 15.81 9.18 100.00 Middle Atlantic Region 47.09 1.89 28.49 12.67 9.86 100.00 East North Central Region 40.95 1.58 36.98 11.66 8.84 100.00 West North Central Region 44.09 1.53 31.70 14.18 8.51 100.00 South Atlantic Region 47.82 3.02 27.73 12.27 9.15 100.00 East South Central Region 40.40 1.40 37.09 12.85 8.26 100.00 West South Central Region 42.08 1.25 35.74 12.15 8.77 100.00 Mountain Region 44.64 1.19 33.26 13.16 7.75 100.00 Pacific Region 45.35 1.63 32.36 12.27 8.39 100.00 Total 44.65 1.86 31.99 12.66 8.84 100.00

78 | P a g e
Figure 9. Percent of the Veteran and Non-Veteran STEM Workforce by Occupational STEM Cluster across All Regions (9) for the 2012 to 2016 Time Period
43.3
3
2.76
38.3
1
6.90 8.
71
44.6
5
1.86
31.9
9
12.6
6
8.84
0
5
10
15
20
25
30
35
40
45
50
Information Technologyand Computer Science
Mathematics Engineering Life and PhysicalSciences
Supervisor/Management
Perc
ent o
f Vet
eran
/Non
-Vet
eran
Wor
kfor
ce
Occupational STEM Clusters Across Regions
Veterans Non-Veterans
Table 15 presents the percent of each workforce in an occupational cluster within a specific Census region by veterans and non-veterans for the 2012 to 2016 time period, i.e., 1.81 percent of the veteran U.S. STEM workforce is in the information technology and computer science occupational cluster in the New England region (all cells sum to 100 percent). The largest percentage of the veteran U.S. STEM workforce is in the information technology and computer science occupational cluster in the South Atlantic region, 13.92 percent. This is also true of the non-veteran U.S. STEM workforce (9.30 percent). The South Atlantic region is closely followed by the Pacific region (6.06 percent for veterans and 9.01 percent for non-veterans).
The table also presents the odds ratio of veterans compared to non-veterans by occupational STEM cluster and region. For example, veterans are 0.6285 times less likely to be in the information technology and computer science occupational STEM cluster than non-veterans in the New England region. Conversely, veterans are 2.8000 times more likely than non-veterans to be in the mathematics occupational STEM cluster in the East South Central region. The largest odds ratio is for the mathematics occupational STEM cluster in the East South Central region, while the smallest odds ratio is 0.2830 for the life and physical sciences occupational STEM cluster in the New England region.

79 | P a g e
Table 15. Percent of the Veteran and Non-Veteran by Occupational STEM Workforce by Occupational STEM Cluster (5) and Census Region (9) for the 2012 to 2016 Time Period
Region - Veterans In
form
atio
n Te
chno
logy
and
Co
mpu
ter
Scie
nce
Mat
hem
atic
s
Engi
neer
ing
Life
and
Ph
ysic
al
Scie
nces
Supe
rvis
or/
Man
agem
ent
Total New England Region 1.81 0.07 1.99 0.30 0.45 4.62 Middle Atlantic Region 3.15 0.12 3.39 0.62 0.69 7.98 East North Central Region 4.48 0.17 4.68 0.73 0.90 10.96 West North Central Region 2.51 0.13 1.95 0.47 0.39 5.45 South Atlantic Region 13.92 1.42 9.11 1.72 2.70 28.87 East South Central Region 2.15 0.14 2.22 0.39 0.47 5.36 West South Central Region 4.89 0.22 4.78 0.91 1.02 11.81 Mountain Region 4.36 0.16 3.61 0.66 0.77 9.56 Pacific Region 6.06 0.33 6.59 1.10 1.32 15.40 Total 43.33 2.76 38.31 6.90 8.71 100.00
Region - Non-Veterans
Info
rmat
ion
Tech
nolo
gy a
nd
Com
pute
r Sc
ienc
e
Mat
hem
atic
s
Engi
neer
ing
Life
and
Phy
sica
l Sc
ienc
es
Supe
rvis
or/
Man
agem
ent
Total New England Region 2.88 0.12 2.01 1.06 0.61 6.68 Middle Atlantic Region 6.19 0.25 3.75 1.67 1.30 13.15 East North Central Region 5.66 0.22 5.11 1.61 1.22 13.83 West North Central Region 2.48 0.09 1.79 0.80 0.48 5.64 South Atlantic Region 9.30 0.59 5.39 2.39 1.78 19.45 East South Central Region 1.58 0.05 1.45 0.50 0.32 3.90 West South Central Region 4.28 0.13 3.63 1.24 0.89 10.16 Mountain Region 3.27 0.09 2.44 0.96 0.57 7.33 Pacific Region 9.01 0.32 6.43 2.44 1.67 19.86

80 | P a g e
Total 44.65 1.86 31.99 12.66 8.84 100.00
Region – Odds Ratio of
Veterans/Non-Veterans
Info
rmat
ion
Tech
nolo
gy
and
Com
pute
r Sc
ienc
e
Mat
hem
atic
s
Engi
neer
ing
Life
and
Ph
ysic
al
Scie
nces
Supe
rvis
or/
Man
agem
ent
Total New England Region 0.6285 0.5833 0.9900 0.2830 0.7377 0.6916 Middle Atlantic Region 0.5089 0.4800 0.9040 0.3713 0.5308 0.6068 East North Central Region 0.7915 0.7727 0.9159 0.4534 0.7377 0.7925 West North Central Region 1.0121 1.4444 1.0894 0.5875 0.8125 0.9663 South Atlantic Region 1.4968 2.4068 1.6902 0.7197 1.5169 1.4843 East South Central Region 1.3608 2.8000 1.5310 0.7800 1.4688 1.3744 West South Central Region 1.1425 1.6923 1.3168 0.7339 1.1461 1.1624 Mountain Region 1.3333 1.7778 1.4795 0.6875 1.3509 1.3042 Pacific Region 0.6726 1.0313 1.0249 0.4508 0.7904 0.7754 Total 0.9704 1.4839 1.1976 0.5450 0.9853

81 | P a g e
Veteran STEM States Table 16 presents the percent of the veteran workforce in occupational clusters within a specific state for the 2012 to 2016 time period, i.e., 1.68 percent of the veteran U.S. STEM workforce is in the information technology and computer science occupational cluster in Alabama (all cells across states and occupational STEM clusters sum to 100 percent). The largest percentage of the veteran U.S. STEM workforce exhibited by a state is California (total of 9.63 percent), followed by Texas (total of 9.25 percent), Virginia (total of 8.30 percent), and Florida (total of 6.54 percent). The largest percentage of the veteran U.S. STEM workforce exhibited by a state and an occupational STEM cluster is Virginia for mathematics (25.72), California for engineering (10.71), Maryland for mathematics (10.66), Virginia for supervisor/management (9.96), Virginia for information technology and computer science (9.92), California for life and physical sciences (9.83), and Texas for supervisor/management (9.81).
Table 16. Percent of the Veteran STEM Workforce by Occupational STEM Cluster (5) and State (51 Including District of Columbia) for the 2012 to 2016 Time Period
State - Veterans
Info
rmat
ion
Tech
nolo
gy
and
Com
pute
r Sc
ienc
e
Mat
hem
atic
s
Engi
neer
ing
Life
and
Ph
ysic
al
Scie
nces
Su
perv
isor
/ M
anag
emen
t
Total Alabama 1.68 2.99 2.03 1.68 1.36 1.82 Alaska 0.17 0.37 0.24 0.52 0.27 0.24 Arizona 2.84 1.31 2.82 1.87 3.14 2.75 Arkansas 0.57 0.19 0.61 0.86 0.33 0.57 California 8.87 7.02 10.71 9.83 9.27 9.63 Colorado 3.84 2.25 2.83 2.36 3.14 3.25 Connecticut 0.88 0.56 1.35 0.97 1.51 1.11 Delaware 0.32 0.19 0.24 0.67 0.33 0.31 District of Columbia 0.28 1.12 0.18 0.22 0.21 0.25 Florida 7.00 6.27 6.46 5.31 5.69 6.54 Georgia 3.63 2.81 3.25 3.44 3.88 3.47 Hawaii 0.64 1.96 0.59 0.64 0.62 0.66 Idaho 0.42 0.19 0.61 1.16 0.44 0.54 Illinois 2.94 2.25 2.63 2.58 2.99 2.78 Indiana 1.22 0.65 1.79 1.42 1.39 1.45 Iowa 0.59 0.09 0.72 1.12 0.27 0.63 Kansas 0.85 1.40 0.78 0.75 0.59 0.81 Kentucky 0.93 0.75 1.04 0.97 1.04 0.98 Louisiana 0.74 0.47 1.25 1.38 0.86 0.99 Maine 0.29 0.28 0.42 0.64 0.30 0.36

82 | P a g e
State - Veterans
Info
rmat
ion
Tech
nolo
gy
and
Com
pute
r Sc
ienc
e
Mat
hem
atic
s
Engi
neer
ing
Life
and
Ph
ysic
al
Scie
nces
Su
perv
isor
/ M
anag
emen
t
Total Maryland 5.09 10.66 2.76 4.26 4.36 4.23 Massachusetts 1.75 0.75 1.95 1.87 2.07 1.83 Michigan 1.76 1.31 2.99 1.98 2.07 2.26 Minnesota 1.46 0.65 1.35 1.98 1.04 1.40 Mississippi 0.49 0.09 0.71 1.01 0.77 0.62 Missouri 1.73 1.59 1.43 1.53 1.69 1.59 Montana 0.24 0.19 0.29 0.30 0.24 0.26 Nebraska 0.88 0.84 0.46 0.90 0.65 0.70 Nevada 1.05 0.84 0.98 0.75 0.65 0.96 New Hampshire 0.76 0.37 0.91 0.45 0.77 0.78 New Jersey 1.73 1.03 1.64 2.21 2.19 1.75 New Mexico 0.55 0.56 0.99 1.72 0.59 0.80 New York 2.73 1.96 3.46 3.10 2.93 3.03 North Carolina 3.73 2.81 3.07 3.63 4.56 3.52 North Dakota 0.12 0.09 0.18 0.30 0.12 0.15 Ohio 3.08 1.68 3.34 3.14 2.96 3.14 Oklahoma 0.83 0.28 1.22 1.50 0.77 1.00 Oregon 1.32 0.56 1.99 1.83 1.51 1.61 Pennsylvania 2.82 1.40 3.76 3.66 2.81 3.20 Rhode Island 0.35 0.37 0.38 0.30 0.33 0.36 South Carolina 1.70 1.22 1.90 1.98 1.30 1.75 South Dakota 0.16 0.17 0.22 0.15 0.16 Tennessee 1.86 1.12 2.00 2.02 2.19 1.93 Texas 9.13 7.02 9.39 9.38 9.81 9.25 Utah 0.98 0.56 0.75 0.71 0.53 0.82 Vermont 0.15 0.19 0.19 0.19 0.18 0.17 Virginia 9.92 25.72 5.50 4.67 9.96 8.30 Washington 2.99 1.96 3.68 3.07 3.44 3.27 West Virginia 0.45 0.65 0.43 0.79 0.68 0.49 Wisconsin 1.34 0.37 1.46 1.50 0.92 1.33 Wyoming 0.14 0.15 0.67 0.12 0.18 Total 43.33 2.76 38.31 6.90 8.71 100.00
Table 17 presents the percent of the non-veteran workforce in an occupational cluster within a specific state for the 2012 to 2016 time period, i.e., 1.38 percent of the non-veteran U.S. STEM

83 | P a g e
workforce is in the engineering occupational cluster in Alabama (all cells across states and occupational STEM clusters sum to 100 percent). The largest percentage of the non-veteran U.S. STEM workforce exhibited by a state is California (total of 14.76 percent), followed by Texas (total of 8.08 percent) and New York (total of 5.53 percent). The largest percentage of the non-veteran U.S. STEM workforce exhibited by a state and an occupational STEM cluster is California for information technology and computer science (15.05 percent), followed by California for engineering (14.89 percent), and California for life and physical science (14.20 percent).
Table 17. Percent of the Non-Veteran STEM Workforce by Occupational STEM Cluster (5) and State (51 Including District of Columbia) for the 2012 to 2016 Time Period
State - Non-Veterans In
form
atio
n Te
chno
logy
an
d Co
mpu
ter
Mat
hem
atic
s
Engi
neer
ing
Life
and
Ph
ysic
al
Scie
nces
Supe
rvis
or/
Man
agem
ent
Total Alabama 0.92 0.81 1.38 0.93 0.90 1.07 Alaska 0.09 0.11 0.21 0.30 0.09 0.15 Arizona 2.02 1.46 2.13 1.38 2.09 1.97 Arkansas 0.51 0.25 0.47 0.58 0.36 0.49 California 15.05 13.36 14.89 14.20 13.94 14.76 Colorado 2.65 1.43 2.44 2.34 2.30 2.49 Connecticut 1.44 2.20 1.51 1.36 1.92 1.51 Delaware 0.31 0.26 0.27 0.54 0.34 0.33 District of Columbia 0.41 2.92 0.20 0.66 0.38 0.42 Florida 4.81 4.21 4.36 3.49 4.41 4.45 Georgia 3.07 3.16 2.49 2.52 3.07 2.82 Hawaii 0.29 0.53 0.39 0.37 0.26 0.34 Idaho 0.31 0.19 0.46 0.68 0.21 0.39 Illinois 4.35 4.44 3.93 3.65 4.65 4.16 Indiana 1.30 1.26 2.04 1.78 1.43 1.61 Iowa 0.72 0.60 0.78 0.96 0.68 0.76 Kansas 0.76 0.44 0.86 0.70 0.72 0.77 Kentucky 0.90 0.96 1.02 0.79 0.96 0.93 Louisiana 0.61 0.63 1.37 1.29 0.68 0.95 Maine 0.26 0.26 0.32 0.42 0.30 0.30 Maryland 3.46 7.61 2.34 4.20 3.03 3.24 Massachusetts 3.66 3.20 3.19 5.53 3.49 3.73 Michigan 2.41 2.61 4.36 2.35 2.93 3.08 Minnesota 1.77 1.35 1.79 1.85 1.86 1.79 Mississippi 0.32 0.33 0.51 0.58 0.29 0.41 Missouri 1.60 1.57 1.42 1.70 1.50 1.55

84 | P a g e
State - Non-Veterans In
form
atio
n Te
chno
logy
an
d Co
mpu
ter
Mat
hem
atic
s
Engi
neer
ing
Life
and
Ph
ysic
al
Scie
nces
Supe
rvis
or/
Man
agem
ent
Total Montana 0.16 0.11 0.24 0.53 0.11 0.23 Nebraska 0.45 0.53 0.39 0.58 0.46 0.45 Nevada 0.54 0.42 0.51 0.55 0.33 0.51 New Hampshire 0.59 0.40 0.69 0.42 0.69 0.61 New Jersey 4.39 4.00 2.82 3.44 5.13 3.83 New Mexico 0.38 0.25 0.64 0.96 0.31 0.53 New York 5.89 5.46 5.09 5.27 5.69 5.53 North Carolina 3.03 2.25 2.59 3.15 3.41 2.93 North Dakota 0.11 0.04 0.18 0.27 0.11 0.15 Ohio 3.14 2.46 3.76 3.13 3.33 3.34 Oklahoma 0.57 0.56 0.74 0.69 0.57 0.64 Oregon 1.38 1.15 1.53 1.57 1.41 1.45 Pennsylvania 3.59 3.95 3.80 4.45 3.84 3.79 Rhode Island 0.33 0.30 0.35 0.36 0.34 0.34 South Carolina 0.94 0.82 1.37 1.10 0.99 1.10 South Dakota 0.15 0.10 0.17 0.25 0.09 0.16 Tennessee 1.39 0.86 1.60 1.66 1.49 1.49 Texas 7.88 5.44 8.77 7.20 8.47 8.08 Utah 1.22 0.79 1.02 0.96 1.00 1.10 Vermont 0.18 0.18 0.23 0.25 0.21 0.21 Virginia 4.50 10.00 2.88 2.72 4.31 3.84 Washington 3.36 2.32 3.07 2.82 3.14 3.16 West Virginia 0.29 0.44 0.35 0.47 0.21 0.33 Wisconsin 1.48 1.00 1.89 1.82 1.48 1.64 Wyoming 0.06 0.05 0.18 0.23 0.07 0.12 Total 44.65 1.86 31.99 12.66 8.84 100.00
Table 18 presents the odds ratio of veterans compared to non-veterans by occupational STEM cluster and state for the 2012 to 2016 time period. For example, veterans are 1.8261 times more likely to be in the information technology and computer science occupational STEM cluster than non-veterans in Alabama. In comparison, veterans are 0.5894 times less likely to be in the information technology and computer science occupational STEM cluster than non-veterans in California. For the remaining analyses, percentages will only be considered if the veterans comprising the percentage are greater than 20 respondents.
If STEM occupations, in general, are considered, the state with the highest odds ratio is Virginia, i.e., veterans are 2.1615 times more likely to be in a STEM occupation in Virginia than non-

85 | P a g e
veterans. Virginia is followed by Hawaii at 1.9412 and Nevada at 1.8824. Conversely, the state with the lowest odds ratio is New Jersey, i.e., veterans are 0.4569 times less likely to be in a STEM occupation in New Jersey than non-veterans. New Jersey is preceded by Massachusetts at 0.4906 and New York at 0.5479.
When considering the five clusters across all states, two clusters exhibit more than likely odds ratios: mathematics (1.4839) and engineering (1.1976). Mathematics exhibits the largest likelihood ratio, 1.4839, i.e., veterans are 1.4839 times more likely than non-veterans to be in the mathematics STEM cluster. The lowest likelihood ratio is exhibited by life and physical sciences, 0.5450, i.e., veterans are 0.5450 times less likely to be in the life and physical sciences STEM cluster than non-veterans.
Wyoming exhibits the highest likelihood ratio for the information technology and computer science STEM cluster, 2.3333. Hawaii exhibits the highest likelihood ratio for the mathematics STEM cluster, 3.6981. Nevada exhibits the highest likelihood ratio for the engineering STEM cluster, 1.9216. Oklahoma exhibits the highest likelihood ratio for the life and physical sciences STEM cluster, 2.1739. West Virginia exhibits the highest likelihood ratio for the supervisor/management STEM cluster, 3.2381.
New Jersey exhibits the lowest likelihood ratio for the information technology and computer science STEM cluster, 0.3941. New York exhibits the lowest likelihood ratio for the mathematics STEM cluster (with more than 20 observations), 0.3590. New Jersey exhibits the lowest likelihood ratio for the engineering STEM cluster (with more than 20 observations), 0.5816. Massachusetts exhibits the lowest likelihood ratio for the life and physical sciences STEM cluster (with more than 20 observations), .3382. New Jersey exhibits the lowest likelihood ratio for the supervisor/management STEM cluster (with more than 20 observations), 0.4269.
Table 18. Odds Ratio (Veteran Compared to Non-Veteran) of STEM Workforce by Occupational STEM Cluster (5) and State (51 Including District of Columbia) for the 2012 to
2016 Time Period
State - Odds Ratio Veteran/Non-
Veteran
Info
rmat
ion
Tech
nolo
gy a
nd
Com
pute
r Sci
ence
Mat
hem
atic
s
Engi
neer
ing
Life
and
Phy
sica
l Sc
ienc
es
Supe
rvis
or/
Man
agem
ent
Total Alabama 1.8261 3.6914 1.4710 1.8065 1.5111 1.7009 Alaska 1.8889 3.3636* 1.1429 1.7333* 3.0000* 1.6000 Arizona 1.4059 0.8973 1.3239 1.3551 1.5024 1.3959 Arkansas 1.1176 0.7600* 1.2979 1.4828 0.9167* 1.1633 California 0.5894 0.5254 0.7193 0.6923 0.6650 0.6524 Colorado 1.4491 1.5734 1.1598 1.0085 1.3652 1.3052 Connecticut 0.6111 0.2545* 0.8940 0.7132 0.7865 0.7351

86 | P a g e
State - Odds Ratio Veteran/Non-
Veteran
Info
rmat
ion
Tech
nolo
gy a
nd
Com
pute
r Sci
ence
Mat
hem
atic
s
Engi
neer
ing
Life
and
Phy
sica
l Sc
ienc
es
Supe
rvis
or/
Man
agem
ent
Total Delaware 1.0323 0.7308* 0.8889 1.2407 0.9706* 0.9394 District of Columbia 0.6829 0.3836* 0.9000 0.3333* 0.5526* 0.5952 Florida 1.4553 1.4893 1.4817 1.5215 1.2902 1.4697 Georgia 1.1824 0.8892 1.3052 1.3651 1.2638 1.2305 Hawaii 2.2069 3.6981 1.5128 1.7297* 2.3846 1.9412 Idaho 1.3548 1.0000* 1.3261 1.7059 2.0952* 1.3846 Illinois 0.6759 0.5068 0.6692 0.7068 0.6430 0.6683 Indiana 0.9385 0.5159* 0.8775 0.7978 0.9720 0.9006 Iowa 0.8194 0.1500* 0.9231 1.1667 0.3971* 0.8289 Kansas 1.1184 3.1818* 0.9070 1.0714 0.8194 1.0519 Kentucky 1.0333 0.7813* 1.0196 1.2278 1.0833 1.0538 Louisiana 1.2131 0.7460* 0.9124 1.0698 1.2647 1.0421 Maine 1.1154 1.0769* 1.3125 1.5238* 1.0000* 1.2000 Maryland 1.4711 1.4008 1.1795 1.0143 1.4389 1.3056 Massachusetts 0.4781 0.2344* 0.6113 0.3382 0.5931 0.4906 Michigan 0.7303 0.5019* 0.6858 0.8426 0.7065 0.7338 Minnesota 0.8249 0.4815* 0.7542 1.0703 0.5591 0.7821 Mississippi 1.5313 0.2727* 1.3922 1.7414 2.6552 1.5122 Missouri 1.0813 1.0127* 1.0070 0.9000 1.1267 1.0258 Montana 1.5000 1.7273* 1.2083 0.5660* 2.1818* 1.1304 Nebraska 1.9556 1.5849* 1.1795 1.5517 1.4130 1.5556 Nevada 1.9444 2.0000* 1.9216 1.3636 1.9697 1.8824 New Hampshire 1.2881 0.9250* 1.3188 1.0714* 1.1159 1.2787 New Jersey 0.3941 0.2575* 0.5816 0.6424 0.4269 0.4569 New Mexico 1.4474 2.2400* 1.5469 1.7917 1.9032 1.5094 New York 0.4635 0.3590 0.6798 0.5882 0.5149 0.5479 North Carolina 1.2310 1.2489 1.1853 1.1524 1.3372 1.2014 North Dakota 1.0909 2.2500* 1.0000 1.1111* 1.0909* 1.0000 Ohio 0.9809 0.6829* 0.8883 1.0032 0.8889 0.9401 Oklahoma 1.4561 0.5000* 1.6486 2.1739 1.3509 1.5625 Oregon 0.9565 0.4870* 1.3007 1.1656 1.0709 1.1103 Pennsylvania 0.7855 0.3544* 0.9895 0.8225 0.7318 0.8443 Rhode Island 1.0606 1.2333* 1.0857 0.8333* 0.9706* 1.0588 South Carolina 1.8085 1.4878* 1.3869 1.8000 1.3131 1.5909
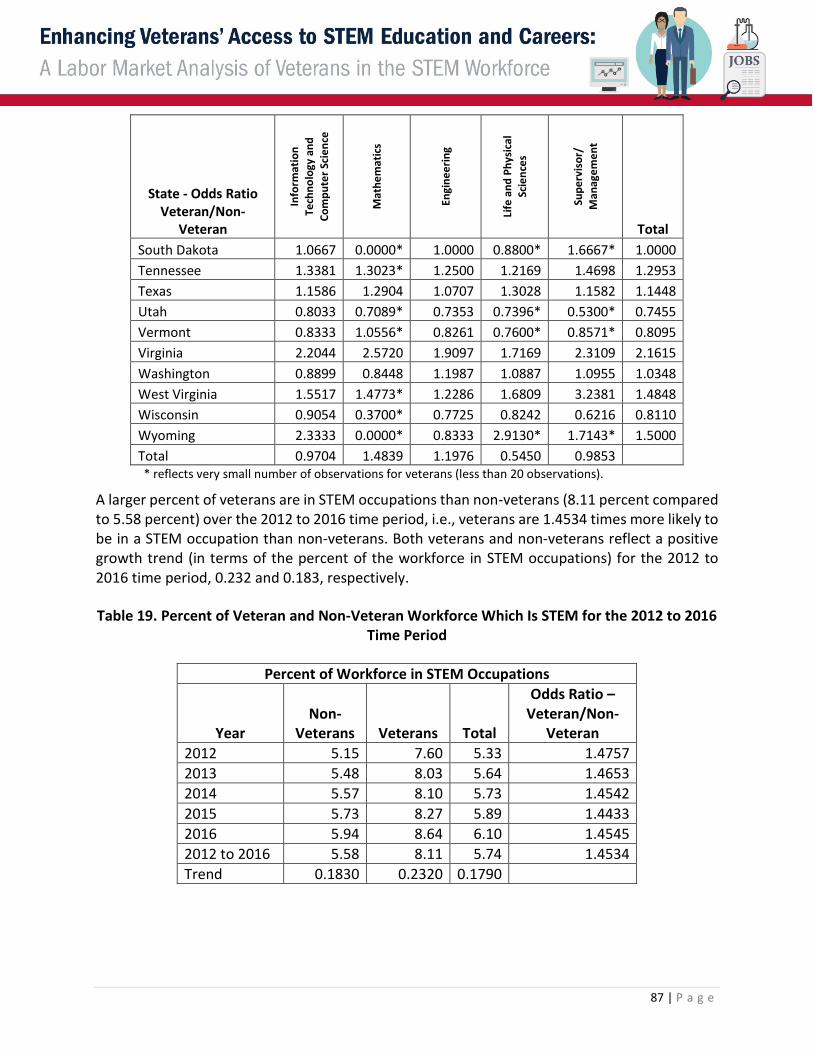
87 | P a g e
State - Odds Ratio Veteran/Non-
Veteran
Info
rmat
ion
Tech
nolo
gy a
nd
Com
pute
r Sci
ence
Mat
hem
atic
s
Engi
neer
ing
Life
and
Phy
sica
l Sc
ienc
es
Supe
rvis
or/
Man
agem
ent
Total South Dakota 1.0667 0.0000* 1.0000 0.8800* 1.6667* 1.0000 Tennessee 1.3381 1.3023* 1.2500 1.2169 1.4698 1.2953 Texas 1.1586 1.2904 1.0707 1.3028 1.1582 1.1448 Utah 0.8033 0.7089* 0.7353 0.7396* 0.5300* 0.7455 Vermont 0.8333 1.0556* 0.8261 0.7600* 0.8571* 0.8095 Virginia 2.2044 2.5720 1.9097 1.7169 2.3109 2.1615 Washington 0.8899 0.8448 1.1987 1.0887 1.0955 1.0348 West Virginia 1.5517 1.4773* 1.2286 1.6809 3.2381 1.4848 Wisconsin 0.9054 0.3700* 0.7725 0.8242 0.6216 0.8110 Wyoming 2.3333 0.0000* 0.8333 2.9130* 1.7143* 1.5000 Total 0.9704 1.4839 1.1976 0.5450 0.9853
* reflects very small number of observations for veterans (less than 20 observations).
A larger percent of veterans are in STEM occupations than non-veterans (8.11 percent compared to 5.58 percent) over the 2012 to 2016 time period, i.e., veterans are 1.4534 times more likely to be in a STEM occupation than non-veterans. Both veterans and non-veterans reflect a positive growth trend (in terms of the percent of the workforce in STEM occupations) for the 2012 to 2016 time period, 0.232 and 0.183, respectively.
Table 19. Percent of Veteran and Non-Veteran Workforce Which Is STEM for the 2012 to 2016 Time Period
Percent of Workforce in STEM Occupations
Year Non-
Veterans Veterans Total
Odds Ratio – Veteran/Non-
Veteran 2012 5.15 7.60 5.33 1.4757 2013 5.48 8.03 5.64 1.4653 2014 5.57 8.10 5.73 1.4542 2015 5.73 8.27 5.89 1.4433 2016 5.94 8.64 6.10 1.4545 2012 to 2016 5.58 8.11 5.74 1.4534 Trend 0.1830 0.2320 0.1790

88 | P a g e
Figure 10. Percent of the Veteran and Non-Veteran Workforce Which Is STEM over the 2012 to 2016 Time Period
7.608.03 8.10 8.27
8.64
5.15 5.48 5.57 5.73 5.94
0
1
2
3
4
5
6
7
8
9
10
2012 2013 2014 2015 2016
Perc
ent o
f Vet
eran
/Non
-Vet
eran
W
orkf
orce
Year
Veterans Non-Veterans
Table 20 presents the distribution of two workforces, (1) non-veteran and veteran and (2) veteran, by STEM, Non-STEM, and Total. In addition, the states are ranked for STEM, Non-STEM, and Total distributions. For example, the state of California ranks as the top percent of the workforce, regardless of STEM, Non-STEM, or Total, for non-veteran and veteran but ranks second for veteran, Non-STEM and Total (Texas ranks top percent for Non-STEM and Total for veterans). Texas exhibits a similar ranking across workforces by state as the second ranked state for non-veteran and veterans. The percentage distributions across states are highly correlated when comparing non-veteran and veteran to veteran (only): 0.9474 (Non-STEM), 0.8897 (STEM), and 0.9438 (Total).

89 | P a g e
Table 20. Percent of STEM, Non-STEM, and Total Workforce by State (51 Including District of Columbia) for Veteran and Total Workforce for the 2012 to 2016 Time Period
Total (Veterans and Non-Veterans) Veterans
Percent of Total U.S. Workforce by State
Rank of Total U.S. Workforce by
State
Percent of Veteran U.S. Workforce by
State
Rank of Veteran U.S. Workforce
by State
States
Non
-STE
M
STEM
Tota
l
Rank
for N
on-
STEM
Rank
for S
TEM
Rank
for T
otal
Non
-STE
M
STEM
Tota
l
Rank
for N
on-
STEM
Rank
for S
TEM
Rank
for T
otal
Alabama 1.39 1.13 1.38 24 26 24 1.75 1.82 1.76 23 18 22 Alaska 0.22 0.16 0.22 50 49 50 0.33 0.24 0.32 46 47 47 Arizona 1.94 2.04 1.95 20 17 19 2.25 2.75 2.29 14 14 15 Arkansas 0.86 0.50 0.84 34 36 34 1.01 0.57 0.98 32 39 33 California 11.82 14.30 11.96 1 1 1 8.27 9.63 8.38 2 1 2 Colorado 1.77 2.56 1.81 22 16 22 2.05 3.25 2.15 18 9 16 Connecticut 1.23 1.47 1.24 28 23 28 0.98 1.11 0.99 33 26 32 Delaware 0.28 0.33 0.29 46 44 45 0.34 0.31 0.34 45 44 44 District of Columbia 0.24 0.41 0.25 48 40 48 0.15 0.25 0.16 51 46 51 Florida 5.97 4.64 5.89 4 4 4 6.80 6.54 6.78 3 4 3 Georgia 3.02 2.87 3.01 10 15 10 3.63 3.47 3.62 8 7 9 Hawaii 0.48 0.36 0.48 39 41 40 0.58 0.66 0.59 39 36 38 Idaho 0.47 0.41 0.47 40 39 41 0.54 0.54 0.54 42 40 41 Illinois 4.22 4.03 4.21 5 6 5 3.41 2.78 3.36 10 13 10 Indiana 2.14 1.59 2.11 15 20 15 2.20 1.45 2.14 15 23 17 Iowa 1.08 0.75 1.06 30 31 30 1.14 0.63 1.10 29 37 29 Kansas 0.95 0.78 0.94 31 30 31 1.05 0.81 1.03 31 32 31 Kentucky 1.35 0.93 1.33 25 29 26 1.42 0.98 1.39 26 29 26 Louisiana 1.35 0.95 1.33 26 28 25 1.44 0.99 1.41 25 28 25 Maine 0.42 0.31 0.42 42 45 42 0.55 0.36 0.54 41 42 42 Maryland 1.97 3.33 2.05 18 10 16 2.18 4.23 2.35 16 5 13 Massachusetts 2.33 3.56 2.40 13 9 13 1.69 1.83 1.70 24 17 24 Michigan 3.03 3.00 3.03 9 13 9 2.80 2.26 2.75 12 15 12 Minnesota 1.88 1.75 1.88 21 18 21 1.79 1.40 1.76 22 24 23 Mississippi 0.85 0.43 0.83 35 38 35 0.90 0.62 0.88 34 38 34 Missouri 1.95 1.55 1.93 19 21 20 2.18 1.59 2.13 17 22 18 Montana 0.32 0.23 0.32 44 46 44 0.44 0.26 0.43 43 45 43 Nebraska 0.66 0.47 0.65 36 37 36 0.76 0.70 0.75 35 35 35

90 | P a g e
Total (Veterans and Non-Veterans) Veterans
Percent of Total U.S. Workforce by State
Rank of Total U.S. Workforce by
State
Percent of Veteran U.S. Workforce by
State
Rank of Veteran U.S. Workforce
by State
States
Non
-STE
M
STEM
Tota
l
Rank
for N
on-
STEM
Rank
for S
TEM
Rank
for T
otal
Non
-STE
M
STEM
Tota
l
Rank
for N
on-
STEM
Rank
for S
TEM
Rank
for T
otal
Nevada 0.89 0.55 0.87 32 34 33 1.10 0.96 1.09 30 30 30 New Hampshire 0.47 0.62 0.48 41 33 39 0.57 0.78 0.58 40 34 40 New Jersey 2.94 3.64 2.98 11 8 11 1.86 1.75 1.85 21 20 21 New Mexico 0.56 0.55 0.56 37 35 37 0.66 0.80 0.67 36 33 37 New York 6.45 5.31 6.38 3 3 3 4.12 3.03 4.03 6 12 6 North Carolina 3.07 2.98 3.07 8 14 8 3.63 3.52 3.62 9 6 8 North Dakota 0.26 0.15 0.26 47 50 47 0.32 0.15 0.31 47 51 48 Ohio 3.78 3.32 3.75 7 11 7 3.94 3.14 3.87 7 11 7 Oklahoma 1.12 0.67 1.09 29 32 29 1.33 1.00 1.31 28 27 28 Oregon 1.24 1.46 1.25 27 24 27 1.36 1.61 1.38 27 21 27 Pennsylvania 4.16 3.74 4.14 6 7 6 4.17 3.20 4.09 4 10 5 Rhode Island 0.37 0.34 0.37 43 43 43 0.32 0.36 0.32 48 43 46 South Carolina 1.48 1.16 1.46 23 25 23 1.95 1.75 1.93 19 19 19 South Dakota 0.29 0.16 0.29 45 48 46 0.36 0.16 0.34 44 50 45 Tennessee 2.02 1.53 1.99 16 22 17 2.33 1.93 2.30 13 16 14 Texas 7.97 8.19 7.98 2 2 2 8.56 9.25 8.62 1 2 1 Utah 0.87 1.07 0.89 33 27 32 0.65 0.82 0.67 37 31 36 Vermont 0.23 0.20 0.22 49 47 49 0.23 0.17 0.23 50 49 50 Virginia 2.70 4.24 2.79 12 5 12 4.17 8.30 4.51 5 3 4 Washington 2.22 3.17 2.27 14 12 14 2.90 3.27 2.93 11 8 11 West Virginia 0.52 0.34 0.51 38 42 38 0.60 0.49 0.59 38 41 39 Wisconsin 1.99 1.62 1.96 17 19 18 1.94 1.33 1.89 20 25 20 Wyoming 0.20 0.12 0.19 51 51 51 0.28 0.18 0.27 49 48 49
Figure 11 provides the top 15 states sorted and based upon their percentage of the veteran STEM workforce. The figure provides the percentage of the respective veteran workforces; Non-STEM, STEM and total. The state with the largest percentage of the STEM workforce is California at 9.63 percent of the veteran STEM workforce, followed closely by Texas at 9.25 percent. Virginia and Florida follow at 8.30 and 6.54, respectively, with the next state, Maryland at 4.23 percent.

91 | P a g e
Figure 11. Veteran, STEM and Non-STEM Workforce, Top 15 States Sorted by STEM
9.63
9.25
8.30
6.54
4.23
3.52
3.47
3.27
3.25
3.20
3.14
3.03
2.78
2.75
2.26
8.27
8.56
4.17
6.80
2.18
3.63
3.63
2.90
2.05
4.17
3.94
4.12
3.41
2.25
2.80
8.38
8.62
4.51
6.78
2.35
3.62
3.62
2.93
2.15
4.09
3.87
4.03
3.36
2.29
2.75
0 2 4 6 8 10 12
California
Texas
Virginia
Florida
Maryland
North Carolina
Georgia
Washington
Colorado
Pennsylvania
Ohio
New York
Illinois
Arizona
Michigan
Percent of Workforce
Veteran Total Veteran Non-STEM Veteran STEM

92 | P a g e
Figure 12. Veteran and Total, STEM and Non-STEM, Workforces, Top 26 States (Based on Veteran STEM)
0 2 4 6 8 10 12 14 16
California
Texas
Virginia
Florida
Maryland
North Carolina
Georgia
Washington
Colorado
Pennsylvania
Ohio
New York
Illinois
Arizona
Michigan
Tennessee
Massachusetts
Alabama
New Jersey
South Carolina
Oregon
Missouri
Indiana
Minnesota
Wisconsin
Connecticut
Percent of U.S. Workforce
Veteran Non-STEM Veteran STEM Total Non-STEM Total STEM

93 | P a g e
Veteran STEM by Education Attainment Table 21 presents the percent of non-veterans, veterans, and total in the STEM workforce for 2012 to 2016 time period that have educational attainment of a college degree or more and less than a college degree. The non-veteran STEM workforce exhibits higher levels of a college degree or more, i.e., non-veteran respondents display a percentage of 70.36 percent for the non-veteran STEM workforce that have a college degree or more compared to 51.58 percent of veterans. Though the percentage difference between non-veteran and veteran members of the STEM workforce with a college degree or more level of educational attainment over the 2012 to 2016 time period, non-veterans continue to display the higher percentage. This may be a reflection of the size of the enlisted component of the active duty workforce compared to the officer component, i.e., enlisted personnel are only required (strongly desired qualification) to have a high school degree or GED.
Table 21. Percent of Veteran, Non-Veteran, and Total STEM Workforces by Educational Attainment by Year for the 2012 to 2016 Time Period
STEM Workforce Year Veteran 2012 2013 2014 2015 2016 Total Trend Less Than a College Degree 47.94 49.71 49.60 47.31 47.53 48.42 -0.3220
College Degree or More 52.06 50.29 50.40 52.69 52.47 51.58 0.3220 Total 100.00 100.00 100.00 100.00 100.00 100.00
Year Non-Veteran 2012 2013 2014 2015 2016 Total Trend Less Than a College Degree 30.07 30.08 30.26 29.43 28.52 29.64 -0.3750
College Degree or More 69.93 69.92 69.74 70.57 71.48 70.36 0.3750 Total 100.00 100.00 100.00 100.00 100.00 100.00
Year Total 2012 2013 2014 2015 2016 Total Trend Less Than a College Degree 31.90 31.89 31.96 30.94 30.09 31.32 -0.4570 College Degree or More 68.10 68.11 68.04 69.06 69.91 68.68 0.4570 Total 100.00 100.00 100.00 100.00 100.00 100.00

94 | P a g e
Figure 13. Percent of Veteran and Non-Veteran STEM Workforces by Educational Attainment Over by Year for the 2012 to 2016 Time Period
52.06 50.29 50.40 52.69 52.47
69.93 69.92 69.74 70.57 71.48
0
10
20
30
40
50
60
70
80
2012 2013 2014 2015 2016
Perc
ent o
f STE
M W
orkf
orce
with
a
Colle
ge D
egre
e or
Mor
e
Year
Veteran
Non-Veteran
Table 22. Percent of Veteran and Non-Veteran STEM Occupational Cluster Workforce by Educational Attainment Over by Year for the 2012 to 2016 Time Period
Veterans Year - Percent of STEM Cluster with a College
Degree or More STEM Clusters 2012 2013 2014 2015 2016 Total Trend Information Technology and Computer Science 49.96 47.94 47.23 50.34 50.13 49.14 0.2740 Mathematics 72.77 70.97 72.96 74.32 76.19 73.43 1.0190 Engineering 49.41 47.09 47.91 50.23 48.41 48.60 0.1140 Life and Physical Sciences 58.60 59.28 60.07 60.00 63.29 60.19 1.0100 Supervisor/Management 62.31 62.80 62.58 62.16 65.69 63.11 0.6120
Non-Veterans Year - Percent of STEM Cluster with a College
Degree or More STEM Clusters 2012 2013 2014 2015 2016 Total Trend Information Technology and Computer Science 67.98 67.52 67.52 68.11 68.91 68.03 0.2450 Mathematics 76.77 77.65 76.46 76.95 80.46 77.67 0.6680 Engineering 67.81 68.21 67.66 68.93 69.78 68.5 0.4660 Life and Physical Sciences 76.12 76.68 77.71 77.96 79.88 77.71 0.8800 Supervisor/Management 76.62 76.74 75.81 77.02 77.38 76.74 0.1800
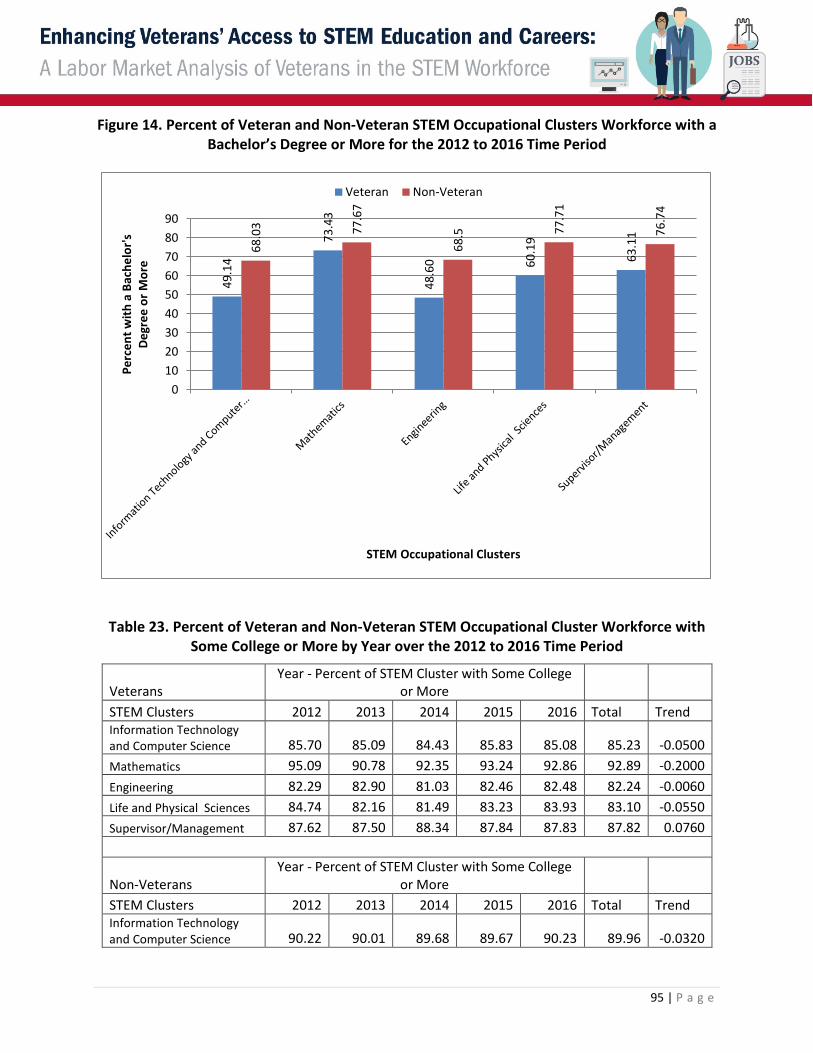
95 | P a g e
Figure 14. Percent of Veteran and Non-Veteran STEM Occupational Clusters Workforce with a Bachelor’s Degree or More for the 2012 to 2016 Time Period
49.1
4
73.4
3
48.6
0 60.1
9
63.1
1
68.0
3 77.6
7
68.5 77
.71
76.7
4
0102030405060708090
Perc
ent w
ith a
Bac
helo
r's
Degr
ee o
r Mor
e
STEM Occupational Clusters
Veteran Non-Veteran
Table 23. Percent of Veteran and Non-Veteran STEM Occupational Cluster Workforce with Some College or More by Year over the 2012 to 2016 Time Period
Veterans Year - Percent of STEM Cluster with Some College
or More STEM Clusters 2012 2013 2014 2015 2016 Total Trend Information Technology and Computer Science 85.70 85.09 84.43 85.83 85.08 85.23 -0.0500 Mathematics 95.09 90.78 92.35 93.24 92.86 92.89 -0.2000 Engineering 82.29 82.90 81.03 82.46 82.48 82.24 -0.0060 Life and Physical Sciences 84.74 82.16 81.49 83.23 83.93 83.10 -0.0550 Supervisor/Management 87.62 87.50 88.34 87.84 87.83 87.82 0.0760
Non-Veterans Year - Percent of STEM Cluster with Some College
or More STEM Clusters 2012 2013 2014 2015 2016 Total Trend Information Technology and Computer Science 90.22 90.01 89.68 89.67 90.23 89.96 -0.0320

96 | P a g e
Mathematics 90.41 91.25 90.41 89.98 93.19 91.05 0.4290 Engineering 88.82 88.24 87.96 89.08 88.92 88.60 0.1040 Life and Physical Sciences 89.85 90.16 89.83 90.04 90.91 90.17 0.2000 Supervisor/Management 93.52 92.36 92.86 92.43 93.16 92.86 -0.0650
Figure 15. Percent of Veteran and Non-Veteran STEM Occupational Cluster Workforce with Some College or More for the 2012 to 2016 Time Period
85.2
3
92.8
9
82.2
4
83.1
0
87.8
289.9
6
91.0
5
88.6
0 90.1
7 92.8
6
76788082848688909294
Perc
ent w
ith a
Bac
helo
r's
Degr
ee o
r Mor
e
STEM Occupational Clusters
Veteran Non-Veteran
The following two tables provide two distributions each of the STEM occupational clusters by educational attainment for the 2012 to 2016 time period: the first distribution contains the STEM workforce for each occupational cluster by educational attainment and the second distribution contains the STEM workforce for each educational attainment by occupational cluster. The first table is for veterans and the second table is for non-veterans. These two sets of tables (veterans and non-veterans) are highly correlated with each other, simple correlations of 0.8457 and 0.9693 for veterans compared to non-veteran distributions for each table. This would suggest that the distribution of veteran and non-veterans are distributed across STEM occupational clusters more from a market demand for skilled services than skill or experience advantages of

97 | P a g e
veterans compared to non-veterans, especially the distributions of STEM occupational clusters across educational attainment levels where the simple correlation is 0.9693.
Table 24. Percent of Veteran STEM Workforce by Occupational Cluster by Educational Attainment over the 2012 to 2016 Time Period
STEM Occupational Clusters - Veterans
Less Than HSG or GED
HSG or
GED
More than HSG or GED but Less
than a Bachelor's
Degree Bachelor's
Degree
More than a Bachelor's
Degree Total Information Technology and Computer Science 0.42 7.43 43.01 32.64 16.49 100.00 Mathematics 0.37 3.37 22.83 35.55 37.89 100.00 Engineering 0.60 10.03 40.77 31.85 16.75 100.00 Life and Physical Sciences 0.93 10.84 28.04 32.41 27.78 100.00 Supervisor/Management 0.47 6.28 30.13 35.35 27.76 100.00 Total 0.53 8.45 39.44 32.64 18.94 100.00
STEM Occupational Clusters - Veterans
Less Than HSG or GED
HSG or
GED
More than HSG or GED but Less
than a Bachelor's
Degree Bachelor's
Degree
More than a Bachelor's
Degree Total Information Technology and Computer Science 34.63 38.10 47.25 43.33 37.73 43.33 Mathematics 1.95 1.10 1.60 3.00 5.52 2.76 Engineering 43.41 45.48 39.60 37.39 33.87 38.31 Life and Physical Sciences 12.20 8.85 4.91 6.85 10.12 6.90 Supervisor/Management 7.80 6.47 6.65 9.43 12.76 8.71 Total 100.00 100.00 100.00 100.00 100.00 100.00

98 | P a g e
Table 25. Percent of Non-Veteran STEM Workforce by Occupational Cluster by Educational Attainment over the 2012 to 2016 Time Period
STEM Occupational Clusters - Non-Veterans
Less Than HSG or GED
HSG or
GED
More than HSG or GED but Less
than a Bachelor's
Degree Bachelor's
Degree
More than a Bachelor's
Degree Total Information Technology and Computer Science 0.68 5.52 25.77 45.71 22.32 100.00 Mathematics 0.51 4.90 16.92 45.62 32.04 100.00 Engineering 1.02 6.91 23.57 44.22 24.28 100.00 Life and Physical Sciences 1.19 6.29 14.81 34.23 43.48 100.00 Supervisor/Management 0.44 3.81 19.02 46.42 30.32 100.00 Total 0.83 5.90 22.92 43.84 26.51 100.00
STEM Occupational Clusters - Non-Veterans
Less Than HSG or GED
HSG or
GED
More than HSG or GED but Less
than a Bachelor's
Degree Bachelor's
Degree
More than a Bachelor's
Degree Total Information Technology and Computer Science 36.58 41.78 50.21 46.56 37.59 44.65 Mathematics 1.14 1.54 1.37 1.93 2.24 1.86 Engineering 39.37 37.48 32.91 32.27 29.30 31.99 Life and Physical Sciences 18.20 13.50 8.18 9.88 20.76 12.66 Supervisor/Management 4.73 5.70 7.33 9.36 10.11 8.84 Total 100.00 100.00 100.00 100.00 100.00 100.00
Table 26 provides the odds ratio for veterans compared to non-veterans for each of the two previous two tables of distributions for the 2012 to 2016 time period. When considering STEM workforce by STEM occupational cluster, educational attainment levels for HSG or GED (four of five) and More than HSG or GED but Less than a Bachelor's Degree (five of five) exhibit more than likely odds ratios for veterans compared to non-veterans, i.e., veterans with More than HSG or GED but Less than a Bachelor's Degree are more likely to be in one of the five occupational STEM clusters than their non-veteran counterparts (e.g., information technology and computer science odds ratio of 1.6690 for More than HSG or GED but Less than a Bachelor's Degree).
It should be noted that the More than HSG or GED but Less than a Bachelor's Degree should encompass two year associate degrees as well as trade schools and certification programs. This can be especially important for the information technology and computer science STEM cluster where individuals are able to become certified in the use and maintenance of various specialized

99 | P a g e
IT systems and programs. In addition, veterans with more than HSG or GED but less than a Bachelor's Degree are 1.7208 times more likely than non-veterans to be in one of the five STEM occupational clusters. Veterans with a HSG or GED are 1.4322 times more likely than non-veterans to be in one of the five STEM occupational clusters. These two odds ratios suggest the strong potential for job opportunities in the STEM occupations for veterans (who were possibly enlisted personnel while in military service and because of the type of STEM type training and job experience they received while in military service). In addition, the less than one value for the odds ratios for “bachelor’s degree” and “more than a bachelor’s degree” levels of educational attainment, regardless of STEM occupational cluster, may be reflective of the small proportion of veterans with bachelor’s degrees or more compared to non-veterans in the STEM workforce.
When considering STEM workforce by educational attainment, STEM occupational cluster levels for information technology and computer science (five of five) exhibits less than likely odds ratios for veterans compared to non-veterans, i.e., veterans in the information technology and computer science occupational STEM cluster are less likely to have attained one of the five educational attainment levels than their non-veteran counterparts (e.g., information technology and computer science odds ratio of 0.9410 for More than HSG or GED but Less than a Bachelor's Degree).
Table 26. Odds Ratio of Veteran Compared to Non-Veteran STEM Workforce by Occupational Cluster by Educational Attainment over the 2012 to 2016 Time Period
STEM Occupational Clusters – Veterans Compared to Non-
Veterans Less Than
HSG or GED
HSG or
GED
More than HSG or GED
but Less than a Bachelor's
Degree Bachelor's
Degree
More than a Bachelor's
Degree Information Technology and Computer Science 0.6176 1.3460 1.6690 0.7141 0.7388 Mathematics 0.7255 0.6878 1.3493 0.7793 1.1826 Engineering 0.5882 1.4515 1.7297 0.7203 0.6899 Life and Physical Sciences 0.7815 1.7234 1.8933 0.9468 0.6389 Supervisor/Management 1.0682 1.6483 1.5841 0.7615 0.9156 Total 0.6386 1.4322 1.7208 0.7445 0.7144
STEM Occupational Clusters - Veterans Compared to Non-
Veterans Less Than
HSG or GED
HSG or
GED
More than HSG or GED
but Less than a Bachelor's
Degree Bachelor's
Degree
More than a Bachelor's
Degree Total Information Technology and Computer Science 0.9467 0.9119 0.9410 0.9306 1.0037 0.9704 Mathematics 1.7105 0.7143 1.1679 1.5544 2.4643 1.4839

100 | P a g e
Engineering 1.1026 1.2134 1.2033 1.1587 1.1560 1.1976 Life and Physical Sciences 0.6703 0.6556 0.6002 0.6933 0.4875 0.5450 Supervisor/Management 1.6490 1.1351 0.9072 1.0075 1.2621 0.9853
Veteran STEM across States and within States Table 27 provides the percentage of the workforce for STEM and Non-STEM workforces across states and within states. For example, there is 1.13 percent of the total U.S. STEM workforce within the state of Alabama, while the STEM workforce comprises 4.72 percent of the total Alabama workforce. The state with the largest percentage of the STEM workforce across states is California (14.30 percent of the STEM workforce) followed by Texas (8.19 percent of the STEM workforce) and New York (5.31 percent of the STEM workforce). The state in which the STEM workforce comprises the largest percent of the state’s workforce is Maryland (9.31 percent of the state’s workforce) followed by District of Columbia (9.30 percent of the state’s workforce) and Virginia (8.72 percent of the state’s workforce). The simple correlation between the two STEM distributions is only 0.3620 indicating a significant difference between how well the STEM workforce ranks across states versus within states. For example, California possesses 14.30 percent of the country’s total STEM workforce, but the California STEM workforce only comprises 6.86 percent of the state’s total workforce. Maryland provides an even larger contrast with the STEM workforce comprising 9.31 percent of the state’s workforce but only 3.33 percent of the country’s STEM workforce.
Table 27. STEM Workforce by State and within State over the 2012 to 2016 Time Period
Workforce Across States Workforce Within States
State (FIPS Code) Non-STEM STEM Total
Non-STEM STEM Total
Alabama 1.39 1.13 1.38 95.28 4.72 100.00 Alaska 0.22 0.16 0.22 95.70 4.30 100.00 Arizona 1.94 2.04 1.95 93.98 6.02 100.00 Arkansas 0.86 0.50 0.84 96.60 3.40 100.00 California 11.82 14.30 11.96 93.14 6.86 100.00 Colorado 1.77 2.56 1.81 91.90 8.10 100.00 Connecticut 1.23 1.47 1.24 93.20 6.80 100.00 Delaware 0.28 0.33 0.29 93.47 6.53 100.00 District of Columbia 0.24 0.41 0.25 90.70 9.30 100.00 Florida 5.97 4.64 5.89 95.48 4.52 100.00 Georgia 3.02 2.87 3.01 94.52 5.48 100.00 Hawaii 0.48 0.36 0.48 95.61 4.39 100.00 Idaho 0.47 0.41 0.47 95.02 4.98 100.00 Illinois 4.22 4.03 4.21 94.50 5.50 100.00 Indiana 2.14 1.59 2.11 95.66 4.34 100.00

101 | P a g e
Workforce Across States Workforce Within States
State (FIPS Code) Non-STEM STEM Total
Non-STEM STEM Total
Iowa 1.08 0.75 1.06 95.92 4.08 100.00 Kansas 0.95 0.78 0.94 95.27 4.73 100.00 Kentucky 1.35 0.93 1.33 95.97 4.03 100.00 Louisiana 1.35 0.95 1.33 95.91 4.09 100.00 Maine 0.42 0.31 0.42 95.78 4.22 100.00 Maryland 1.97 3.33 2.05 90.69 9.31 100.00 Massachusetts 2.33 3.56 2.40 91.51 8.49 100.00 Michigan 3.03 3.00 3.03 94.31 5.69 100.00 Minnesota 1.88 1.75 1.88 94.64 5.36 100.00 Mississippi 0.85 0.43 0.83 97.00 3.00 100.00 Missouri 1.95 1.55 1.93 95.38 4.62 100.00 Montana 0.32 0.23 0.32 95.84 4.16 100.00 Nebraska 0.66 0.47 0.65 95.80 4.20 100.00 Nevada 0.89 0.55 0.87 96.36 3.64 100.00 New Hampshire 0.47 0.62 0.48 92.56 7.44 100.00 New Jersey 2.94 3.64 2.98 92.98 7.02 100.00 New Mexico 0.56 0.55 0.56 94.37 5.63 100.00 New York 6.45 5.31 6.38 95.23 4.77 100.00 North Carolina 3.07 2.98 3.07 94.43 5.57 100.00 North Dakota 0.26 0.15 0.26 96.57 3.43 100.00 Ohio 3.78 3.32 3.75 94.91 5.09 100.00 Oklahoma 1.12 0.67 1.09 96.46 3.54 100.00 Oregon 1.24 1.46 1.25 93.28 6.72 100.00 Pennsylvania 4.16 3.74 4.14 94.82 5.18 100.00 Rhode Island 0.37 0.34 0.37 94.67 5.33 100.00 South Carolina 1.48 1.16 1.46 95.44 4.56 100.00 South Dakota 0.29 0.16 0.29 96.78 3.22 100.00 Tennessee 2.02 1.53 1.99 95.60 4.40 100.00 Texas 7.97 8.19 7.98 94.12 5.88 100.00 Utah 0.87 1.07 0.89 93.06 6.94 100.00 Vermont 0.23 0.20 0.22 94.80 5.20 100.00 Virginia 2.70 4.24 2.79 91.28 8.72 100.00 Washington 2.22 3.17 2.27 91.99 8.01 100.00 West Virginia 0.52 0.34 0.51 96.12 3.88 100.00 Wisconsin 1.99 1.62 1.96 95.28 4.72 100.00 Wyoming 0.20 0.12 0.19 96.30 3.70 100.00 Total 100.00 100.00 100.00 94.26 5.74 100.00

102 | P a g e
Table 28 provides the percentage of the workforce for STEM and Non-STEM workforces by veterans and non-veterans across states for the 2012 to 2016 time period. For example, there is 1.82 percent of the total veteran U.S. STEM workforce within the state of Alabama. The state with the largest percentage of the veteran STEM workforce across states is California (9.63 percent of the U.S. veteran STEM workforce) followed by Texas (9.25 percent of the U.S. veteran STEM workforce) and Virginia (8.30 percent of the U.S. veteran STEM workforce). The state with the largest percentage of the veteran Non-STEM workforce across states is Texas (8.56 percent of the U.S. veteran Non-STEM workforce) followed by California (8.27 percent of the U.S. veteran Non-STEM workforce) and Florida (6.8 percent of the U.S. veteran Non-STEM workforce).
The state exhibiting the highest “Total” odds ratio (veteran/non-veteran) is Virginia (1.6828, i.e., veterans are 1.6828 times more likely to be in the Virginia workforce than non-veterans) followed by Alaska (1.5238) and Wyoming (1.4211). The state exhibiting the lowest “Total” odds ratio (veteran/non-veteran) is New Jersey (0.6066, i.e., veterans are 0.6066 times less likely to be in the New Jersey workforce than non-veterans) preceded by District of Columbia (0.6154) and New York (0.6162). It should be noted that though California exhibits one of the highest percentages of veterans in the U.S. veteran workforce over all states (8.38 percent) it is significantly smaller percentage than the percent of the U.S. non-veteran workforce that is in California (12.21 percent), a 45.7 percent difference. A similar analysis can be drawn for Texas, where 8.62 percent of the U.S. veteran workforce resides compared to 7.94 percent of the U.S. non-veteran workforce; the odds ratio for Texas (veteran/non-veteran) is 1.08566, nearly equally likely. Thus, more than likely or less than likely odds ratios for a particular state may not be a good indicator for job opportunities or the depth of the labor market opportunities, STEM or Non-STEM, while the percent of the veteran or non-veteran U.S. workforce in a particular state could be a good indicator for job opportunities or the depth of the labor market opportunities.
Table 28. Percent of STEM, Non-STEM, and Total Workforce by Veteran and Non-Veteran across States over the 2012 to 2016 Time Period
Percent of U.S. STEM, Non-STEM, and Total Workforce
by Veteran and Non-Veteran Across States
Veteran Non-Veteran Odds Ratio
(Veteran/Non-Veteran)
State Non-STEM STEM Total
Non-STEM STEM Total
Non-STEM STEM Total
Alabama 1.75 1.82 1.76 1.37 1.07 1.35 1.2774 1.7009 1.3037 Alaska 0.33 0.24 0.32 0.21 0.15 0.21 1.5714 1.6000 1.5238 Arizona 2.25 2.75 2.29 1.92 1.97 1.92 1.1719 1.3959 1.1927 Arkansas 1.01 0.57 0.98 0.85 0.49 0.83 1.1882 1.1633 1.1807 California 8.27 9.63 8.38 12.06 14.76 12.21 0.6857 0.6524 0.6863 Colorado 2.05 3.25 2.15 1.75 2.49 1.79 1.1714 1.3052 1.2011 Connecticut 0.98 1.11 0.99 1.24 1.51 1.26 0.7903 0.7351 0.7857

103 | P a g e
Percent of U.S. STEM, Non-STEM, and Total Workforce
by Veteran and Non-Veteran Across States
Veteran Non-Veteran Odds Ratio
(Veteran/Non-Veteran)
State Non-STEM STEM Total
Non-STEM STEM Total
Non-STEM STEM Total
Delaware 0.34 0.31 0.34 0.28 0.33 0.28 1.2143 0.9394 1.2143 District of Columbia 0.15 0.25 0.16 0.25 0.42 0.26 0.6000 0.5952 0.6154 Florida 6.80 6.54 6.78 5.91 4.45 5.83 1.1506 1.4697 1.1630 Georgia 3.63 3.47 3.62 2.98 2.82 2.97 1.2181 1.2305 1.2189 Hawaii 0.58 0.66 0.59 0.48 0.34 0.47 1.2083 1.9412 1.2553 Idaho 0.54 0.54 0.54 0.47 0.39 0.46 1.1489 1.3846 1.1739 Illinois 3.41 2.78 3.36 4.27 4.16 4.27 0.7986 0.6683 0.7869 Indiana 2.20 1.45 2.14 2.13 1.61 2.10 1.0329 0.9006 1.0190 Iowa 1.14 0.63 1.10 1.07 0.76 1.06 1.0654 0.8289 1.0377 Kansas 1.05 0.81 1.03 0.94 0.77 0.93 1.1170 1.0519 1.1075 Kentucky 1.42 0.98 1.39 1.35 0.93 1.33 1.0519 1.0538 1.0451 Louisiana 1.44 0.99 1.41 1.35 0.95 1.33 1.0667 1.0421 1.0602 Maine 0.55 0.36 0.54 0.41 0.30 0.41 1.3415 1.2000 1.3171 Maryland 2.18 4.23 2.35 1.96 3.24 2.03 1.1122 1.3056 1.1576 Massachusetts 1.69 1.83 1.70 2.38 3.73 2.45 0.7101 0.4906 0.6939 Michigan 2.80 2.26 2.75 3.04 3.08 3.05 0.9211 0.7338 0.9016 Minnesota 1.79 1.40 1.76 1.89 1.79 1.89 0.9471 0.7821 0.9312 Mississippi 0.90 0.62 0.88 0.85 0.41 0.82 1.0588 1.5122 1.0732 Missouri 2.18 1.59 2.13 1.94 1.55 1.91 1.1237 1.0258 1.1152 Montana 0.44 0.26 0.43 0.32 0.23 0.31 1.3750 1.1304 1.3871 Nebraska 0.76 0.70 0.75 0.65 0.45 0.64 1.1692 1.5556 1.1719 Nevada 1.10 0.96 1.09 0.87 0.51 0.85 1.2644 1.8824 1.2824 New Hampshire 0.57 0.78 0.58 0.46 0.61 0.47 1.2391 1.2787 1.2340 New Jersey 1.86 1.75 1.85 3.01 3.83 3.05 0.6179 0.4569 0.6066 New Mexico 0.66 0.80 0.67 0.55 0.53 0.55 1.2000 1.5094 1.2182 New York 4.12 3.03 4.03 6.60 5.53 6.54 0.6242 0.5479 0.6162 North Carolina 3.63 3.52 3.62 3.04 2.93 3.03 1.1941 1.2014 1.1947 North Dakota 0.32 0.15 0.31 0.26 0.15 0.25 1.2308 1.0000 1.2400 Ohio 3.94 3.14 3.87 3.76 3.34 3.74 1.0479 0.9401 1.0348 Oklahoma 1.33 1.00 1.31 1.11 0.64 1.08 1.1982 1.5625 1.2130 Oregon 1.36 1.61 1.38 1.23 1.45 1.24 1.1057 1.1103 1.1129 Pennsylvania 4.17 3.20 4.09 4.16 3.79 4.14 1.0024 0.8443 0.9879 Rhode Island 0.32 0.36 0.32 0.37 0.34 0.37 0.8649 1.0588 0.8649 South Carolina 1.95 1.75 1.93 1.45 1.10 1.43 1.3448 1.5909 1.3497 South Dakota 0.36 0.16 0.34 0.29 0.16 0.28 1.2414 1.0000 1.2143

104 | P a g e
Percent of U.S. STEM, Non-STEM, and Total Workforce
by Veteran and Non-Veteran Across States
Veteran Non-Veteran Odds Ratio
(Veteran/Non-Veteran)
State Non-STEM STEM Total
Non-STEM STEM Total
Non-STEM STEM Total
Tennessee 2.33 1.93 2.30 2.00 1.49 1.97 1.1650 1.2953 1.1675 Texas 8.56 9.25 8.62 7.93 8.08 7.94 1.0794 1.1448 1.0856 Utah 0.65 0.82 0.67 0.89 1.10 0.90 0.7303 0.7455 0.7444 Vermont 0.23 0.17 0.23 0.23 0.21 0.22 1.0000 0.8095 1.0455 Virginia 4.17 8.30 4.51 2.61 3.84 2.68 1.5977 2.1615 1.6828 Washington 2.90 3.27 2.93 2.17 3.16 2.23 1.3364 1.0348 1.3139 West Virginia 0.60 0.49 0.59 0.51 0.33 0.50 1.1765 1.4848 1.1800 Wisconsin 1.94 1.33 1.89 1.99 1.64 1.97 0.9749 0.8110 0.9594 Wyoming 0.28 0.18 0.27 0.19 0.12 0.19 1.4737 1.5000 1.4211

105 | P a g e
Veteran STEM by State across Metropolitan Area Table 29 provides the distribution of the STEM and Non-STEM workforces by state across metropolitan areas for the 2012 to 2016 time period. For example, 25.12 percent of the STEM workforce in Alabama is located in the areas of Alabama that are in non-metropolitan areas. The largest percentage of the STEM workforce in Alabama, which is located in a metropolitan area, is 23.39 percent in the Birmingham-Hoover metropolitan area. Using a previous table as a guide, California, who exhibits the largest STEM workforce within a state (14.3 percent of the California workforce is in STEM jobs), the table below indicates that the majority of the California STEM workforce resides in four Metropolitan areas: the Los Angeles-Long Beach metropolitan area (28.11 percent of the California’s STEM workforce), San Diego-Carlsbad metropolitan area (9.77 percent of the California’s STEM workforce), San Francisco-Oakland metropolitan area (21.71 percent of the California’s STEM workforce), and San Jose-Sunnyvale-Santa Clara, CA metropolitan area (15.57 percent of the California’s STEM workforce). Conversely, 25.12 percent of the STEM workforce in Alabama resides in a non-identifiable area (non-metropolitan), though 22.82 percent of the Alabama STEM workforce does reside in the Huntsville metropolitan area. Another good example of this non-metropolitan/metropolitan mix for STEM jobs is provided by Georgia, where 71.5 percent of the STEM workforce resides in the Atlanta-Sandy Springs-Roswell metropolitan area while 22.89 percent resides in the non-metropolitan areas of Georgia. No doubt, STEM workforces tend to reside more in large metropolitan areas, regardless of state. Thus the best opportunities for STEM jobs would be expected to be found in those metropolitan areas, regardless of state.
Table 29. Percent of STEM, Non-STEM, and Total Workforce within States by Metropolitan Area over the 2012 to 2016 Time Period
Metropolitan Area, 2013 OMB Delineations Distribution of STEM
Workforce within States
Alabama Non-STEM STEM Total
not in identifiable area 39.61 25.12 38.93 Anniston-Oxford-Jacksonville, Al 2.17 1.32 2.13 Auburn-Opelika, Al 2.44 2.75 2.46 Birmingham-Hoover, Al 22.25 23.39 22.31 Daphne-Fairhope-Foley, Al 2.90 2.75 2.90 Decatur, Al 2.87 3.36 2.89 Gadsden, Al 2.00 1.02 1.95 Huntsville, Al 7.09 22.82 7.83 Mobile, Al 7.44 6.40 7.39 Montgomery, Al 7.01 7.80 7.05 Tuscaloosa, Al 4.21 3.26 4.16 Total 100.00 100.00 100.00 Percent of Total U.S. Workforce 1.39 1.13 1.38

106 | P a g e
Alaska Non-STEM STEM Total
not in identifiable area 57.13 45.80 56.64 Anchorage, AK 42.87 54.20 43.36 Total 100.00 100.00 100.00 Percent of Total U.S. Workforce 0.22 0.16 0.22
Arizona Non-STEM STEM Total
not in identifiable area 7.87 3.96 7.64 Flagstaff, AZ 2.85 2.11 2.80 Lake Havasu City-Kingman, AZ 2.59 0.81 2.49 Phoenix-Mesa-Scottsdale, AZ 66.18 73.89 66.65 Prescott, AZ 2.45 1.32 2.38 Tucson, AZ 15.22 16.58 15.31 Yuma, AZ 2.83 1.32 2.74 Total 100.00 100.00 100.00 Percent of Total U.S. Workforce 1.94 2.04 1.95
Arkansas Non-STEM STEM Total
not in identifiable area 63.97 42.26 63.24 Fayetteville-Springdale-Rogers, AR-MO 14.96 26.65 15.36 Little Rock-North Little Rock-Conway, AR 21.06 31.09 21.41 Total 100.00 100.00 100.00 Percent of Total U.S. Workforce 0.86 0.50 0.84
California Non-STEM STEM Total
not in identifiable area 2.12 1.17 2.06 Bakersfield, CA 1.71 0.84 1.65 Chico, CA 0.57 0.36 0.55 El Centro, CA 0.34 0.10 0.32 Fresno, CA 2.26 0.92 2.17 Hanford-Corcoran, Ca 0.33 0.11 0.32 Los Angeles-Long Beach-Anaheim, CA 37.11 28.11 36.49 Madera, CA 0.27 0.09 0.26 Merced, CA 0.57 0.17 0.54 Modesto, CA 1.22 0.51 1.17 Napa, CA 0.50 0.28 0.48

107 | P a g e
Oxnard-Thousand Oaks-Ventura, CA 2.32 2.23 2.32 Redding, CA 0.48 0.27 0.46 Riverside-San Bernardino-Ontario, CA 10.19 5.07 9.84 Sacramento--Roseville--Arden-Arcade, CA 5.60 6.45 5.66 Salinas, CA 1.29 0.65 1.25 San Diego-Carlsbad, CA 8.02 9.77 8.14 San Francisco-Oakland-Hayward, CA 12.25 21.71 12.90 San Jose-Sunnyvale-Santa Clara, CA 4.68 15.57 5.43 San Luis Obispo -Paso Robles-Arroyo Grande, CA 0.64 0.55 0.64 Santa Cruz-Watsonville, CA 0.69 0.82 0.70 Santa Maria-Santa Barbara, CA 1.12 1.08 1.12 Santa Rosa, CA 1.37 1.09 1.35 Stockton-Lodi, CA 1.70 0.79 1.63 Vallejo-Fairfield, CA 1.14 0.80 1.12 Visalia-Porterville, CA 1.07 0.27 1.01 Yuba City, CA 0.44 0.23 0.43 Total 100.00 100.00 100.00 Percent of Total U.S. Workforce 11.82 14.30 11.96
Colorado Non-STEM STEM Total
not in identifiable area 25.96 17.9 25.31 Colorado Springs, CO 11.47 10.97 11.43 Denver-Aurora-Lakewood, CO 52.14 61.82 52.93 Fort Collins, CO 5.75 7.34 5.88 Grand Junction, CO 1.91 0.89 1.83 Pueblo, CO 2.77 1.07 2.63 Total 100.00 100.00 100.00 Percent of Total U.S. Workforce 1.77 2.56 1.81
Connecticut Non-STEM STEM Total
not in identifiable area 6.51 5.29 6.43 Bridgeport-Stamford-Norwalk, CT 26.15 23.95 26.00 Hartford-West Hartford-East Hartford, CT 33.77 38.35 34.08 New Haven-Milford, CT 21.81 19.51 21.66 Norwich-New London, CT 8.22 10.37 8.37 Worcester, Ma-CT 3.54 2.54 3.47 Total 100.00 100.00 100.00 Percent of Total U.S. Workforce 1.23 1.47 1.24

108 | P a g e
Delaware Non-STEM STEM Total
Dover, DE 17.60 10.17 17.11 Philadelphia-Camden-Wilmington, PA-NJ-DE 57.25 77.33 58.56 Salisbury, MD-DE 25.15 12.50 24.32 Total 100.00 100.00 100.00 Percent of Total U.S. Workforce 0.28 0.33 0.29
District of Columbia Non-STEM STEM Total
Washington-Arlington-Alexandria, DC-VA-MD 100.00 100.00 100.00 Total 100.00 100.00 100.00 Percent of Total U.S. Workforce 0.24 0.41 0.25
Florida Non-STEM STEM Total
not in identifiable area 9.39 8.94 9.37 Cape Coral-Fort Myers, FL 3.34 2.11 3.28 Deltona-Daytona Beach-Ormond Beach, FL 2.91 2.35 2.88 Gainesville, FL 1.35 2.28 1.39 Homosassa Springs, FL 0.48 0.23 0.47 Jacksonville, FL 6.69 7.60 6.73 Lakeland-Winter Haven, FL 3.30 2.41 3.26 Miami-Fort Lauderdale-West Palm Beach, FL 30.97 26.42 30.76 Naples-Immokalee-Marco Island, FL 1.51 0.79 1.48 North Port-Sarasota-Bradenton, FL 3.61 3.08 3.59 Ocala, FL 1.17 0.58 1.14 Orlando-Kissimmee-Sanford, FL 10.61 13.01 10.72 Palm Bay-Melbourne-Titusville, FL 2.48 5.19 2.60 Pensacola-Ferry Pass-Brent, FL 2.35 2.29 2.35 Port St. Lucie, FL 1.68 1.31 1.66 Punta Gorda, FL 0.65 0.40 0.64 Sebastian-Vero Beach, FL 0.54 0.48 0.54 Tampa-St. Petersburg-Clearwater, FL 16.96 20.52 17.12 Total 100.00 100.00 100.00 Percent of Total U.S. Workforce 5.97 4.64 5.89
Georgia Non-STEM STEM Total
not in identifiable area 40.51 22.89 39.54 Atlanta-Sandy Springs-Roswell, GA 52.72 71.50 53.75

109 | P a g e
Augusta-Richmond County, GA-SC 2.99 3.09 3.00 Chattanooga, TN-GA 1.73 1.17 1.70 Gainesville, GA 2.05 1.35 2.01 Total 100.00 100.00 100.00 Percent of Total U.S. Workforce 3.02 2.87 3.01
Hawaii Non-STEM STEM Total
not in identifiable area 28.02 19.00 27.62 Urban Honolulu, HI 71.98 81.00 72.38 Total 100.00 100.00 100.00 Percent of Total U.S. Workforce 0.48 0.36 0.48
Idaho Non-STEM STEM Total
in identifiable a 61.00 49.35 60.42 Boise City, ID 32.12 45.48 32.78 Coeur D'alene, ID 6.88 5.17 6.80 Total 100.00 100.00 100.00 Percent of Total U.S. Workforce 0.47 0.41 0.47
Illinois Non-STEM STEM Total
not in identifiable area 26.03 15.59 25.46 Bloomington, IL 1.56 2.44 1.61 Champaign-Urbana, IL 1.56 2.56 1.62 Chicago-Naperville-Elgin, IL 59.68 70.11 60.25 Decatur, IL 0.98 0.88 0.97 Kankakee, IL 1.00 0.40 0.96 Rockford, IL 2.36 1.96 2.34 St. Louis, MO-IL 5.13 4.28 5.08 Springfield, IL 1.71 1.79 1.71 Total 100.00 100.00 100.00 Percent of Total U.S. Workforce 4.22 4.03 4.21
Indiana Non-STEM STEM Total
not in identifiable area 45.53 36.73 45.15 Bloomington, IN 1.87 2.87 1.92 Chicago-Naperville-Elgin, IN 8.56 7.20 8.50 Elkhart-Goshen, IN 2.54 1.84 2.51

110 | P a g e
Fort Wayne, IN 5.67 6.63 5.71 Indianapolis-Carmel-Anderson, IN 25.68 34.78 26.07 Lafayette-West Lafayette, IN 2.54 4.34 2.62 Louisville/Jefferson County, IN 3.95 3.62 3.94 Michigan City-La Porte, IN 1.87 1.09 1.84 Muncie, IN 1.79 0.91 1.75 Total 100.00 100.00 100.00 Percent of Total U.S. Workforce 2.14 1.59 2.11
Iowa Non-STEM STEM Total
not in identifiable area 74.08 65.25 73.72 Des Moines-West Des Moines, IA 15.88 23.93 16.21 Iowa City, IA 3.13 5.46 3.22 Omaha-Council Bluffs, IA 6.91 5.37 6.85 Total 100.00 100.00 100.00 Percent of Total U.S. Workforce 1.08 0.75 1.06
Kansas Non-STEM STEM Total
not in identifiable area 47.68 24.89 46.60 Kansas City, MO-KS 24.83 42.69 25.68 Lawrence, KS 2.86 3.36 2.88 Topeka, KS 7.79 7.50 7.78 Wichita, KS 16.84 21.55 17.06 Total 100.00 100.00 100.00 Percent of Total U.S. Workforce 0.95 0.78 0.94
Kentucky Non-STEM STEM Total
not in identifiable area 58.58 47.64 58.14 Cincinnati, Oh-KY-In 10.24 13.29 10.36 Clarksville, TN-KY 2.56 1.61 2.52 Louisville/Jefferson County, KY 26.11 35.68 26.50 Owensboro, KY 2.51 1.78 2.48 Total 100.00 100.00 100.00 Percent of Total U.S. Workforce 1.35 0.93 1.33
Louisiana Non-STEM STEM Total
not in identifiable area 27.74 17.14 27.31

111 | P a g e
Baton Rouge, LA 14.75 20.47 14.99 Houma-Thibodaux, LA 4.46 3.21 4.41 Lafayette, LA 10.43 9.70 10.40 Monroe, LA 3.14 2.60 3.12 New Orleans-Metairie, LA 31.36 39.58 31.70 Shreveport-Bossier City, LA 8.11 7.29 8.08 Total 100.00 100.00 100.00 Percent of Total U.S. Workforce 1.35 0.95 1.33
Maine Non-STEM STEM Total
not in identifiable area 51.95 38.34 51.37 Bangor, ME 11.56 11.55 11.56 Lewiston-Auburn, ME 6.28 6.19 6.28 Portland-South Portland, ME 30.21 43.92 30.78 Total 100.00 100.00 100.00 Percent of Total U.S. Workforce 0.42 0.31 0.42
Maryland Non-STEM STEM Total
not in identifiable area 11.03 7.29 10.68 Baltimore-Columbia-Towson, MD 43.87 43.38 43.82 Philadelphia-Camden-Wilmington, PA-NJ-MD 1.52 1.08 1.48 Salisbury, MD-DE 2.91 0.91 2.73 Washington-Arlington-Alexandria, DC-VA-MD 40.67 47.34 41.29 Total 100.00 100.00 100.00 Percent of Total U.S. Workforce 1.97 3.33 2.05
Massachusetts Non-STEM STEM Total
not in identifiable area 3.45 1.70 3.30 Barnstable Town, MA 3.58 1.64 3.41 Boston-Cambridge-Newton, MA-NH 62.14 74.09 63.15 Pittsfield, MA 2.78 1.47 2.67 Providence-Warwick, RI_MA 8.01 4.76 7.73 Springfield, MA 8.22 4.58 7.91 Worcester, MA-CT 11.83 11.76 11.82 Total 100.00 100.00 100.00 Percent of Total U.S. Workforce 2.33 3.56 2.40

112 | P a g e
Michigan Non-STEM STEM Total
not in identifiable area 37.47 21.57 36.57 Ann Arbor, MI 3.32 7.33 3.55 Detroit-Warren-Dearborn, MI 35.05 47.94 35.78 Grand Rapids-Wyoming, MI 7.42 7.38 7.42 Jackson, MI 1.39 1.18 1.38 Kalamazoo-Portage, MI 3.78 3.34 3.76 Lansing-East Lansing, MI 4.91 5.87 4.97 Monroe, MI 1.39 1.01 1.37 Muskegon, MI 1.58 1.25 1.56 Niles-Benton Harbor, MI 1.78 1.73 1.78 Saginaw, MI 1.90 1.41 1.88 Total 100.00 100.00 100.00 Percent of Total U.S. Workforce 3.03 3.00 3.03
Minnesota Non-STEM STEM Total
not in identifiable area 57.36 35.57 56.19 Minneapolis-St. Paul-Bloomington, MN 42.64 64.43 43.81 Total 100.00 100.00 100.00 Percent of Total U.S. Workforce 1.88 1.75 1.88
Mississippi Non-STEM STEM Total
not in identifiable area 62.34 49.97 61.97 Gulfport-Biloxi-Pascagoula, MS 10.30 13.68 10.40 Jackson, MS 21.06 27.85 21.26 Memphis, TN-MS-AR 6.30 8.50 6.37 Total 100.00 100.00 100.00 Percent of Total U.S. Workforce 0.85 0.43 0.83
Missouri Non-STEM STEM Total
not in identifiable area 31.03 13.61 30.23 Columbia, MO 2.21 3.51 2.27 Jefferson City, MO 2.58 2.69 2.58 Joplin, MO 2.96 1.92 2.91 Kansas City, MO-KS 20.63 24.07 20.79 St. Joseph, MO-KS 2.31 1.65 2.28 St. Louis, MO-IL 32.38 48.18 33.11

113 | P a g e
Springfield, MO 5.90 4.36 5.83 Total 100.00 100.00 100.00 Percent of Total U.S. Workforce 1.95 1.55 1.93
Montana Non-STEM STEM Total
not in identifiable area 100.00 100.00 100.00 Total 100.00 100.00 100.00 Percent of Total U.S. Workforce 0.32 0.23 0.32
Nebraska Non-STEM STEM Total
not in identifiable area 53.95 27.31 52.83 Lincoln, NE 12.05 19.30 12.35 Omaha-Council Bluffs, NE-IA 34.00 53.40 34.82 Total 100.00 100.00 100.00 Percent of Total U.S. Workforce 0.66 0.47 0.65
Nevada Non-STEM STEM Total
not in identifiable area 11.50 14.08 11.59 Las Vegas-Henderson-Paradise, NV 72.31 62.11 71.94 Reno, NV 16.19 23.81 16.47 Total 100.00 100.00 100.00 Percent of Total U.S. Workforce 0.89 0.55 0.87
New Hampshire Non-STEM STEM Total
not in identifiable area 43.06 30.43 42.12 Boston-Cambridge-Newton, MA-NH 33.52 38.13 33.86 Manchester-Nashua, NH 23.42 31.44 24.02 Total 100.00 100.00 100.00 Percent of Total U.S. Workforce 0.47 0.62 0.48
New Jersey Non-STEM STEM Total
not in identifiable area 1.15 0.37 1.09 Allentown-Bethlehem-Easton, PA-NJ 1.62 1.30 1.59 Atlantic City-Hammonton, NJ 3.01 1.44 2.90 New York-Newark-Jersey-Jersey City, NY-NJ-PA 71.89 77.33 72.27 Ocean City, NJ 1.54 0.76 1.48 Philadelphia-Camden-Wilmington, PA-NJ-DE 17.27 13.83 17.03

114 | P a g e
Trenton, NJ 3.52 4.98 3.62 Total 100.00 100.00 100.00 Percent of Total U.S. Workforce 2.94 3.64 2.98
New Mexico Non-STEM STEM Total
Not In Identifiable Area 42.70 29.35 41.95 Albuquerque, NM 39.24 50.27 39.86 Las Cruces, NM 7.47 6.12 7.40 Santa Fe, NM 10.58 14.26 10.79 Total 100.00 100.00 100.00 Percent of Total U.S. Workforce 0.56 0.55 0.56
New York Non-STEM STEM Total
not in identifiable area 13.92 9.73 13.72 Albany-Schenectady-Troy, NY 4.31 7.23 4.45 Binghamton, NY 1.29 1.90 1.32 Buffalo-Cheektowaga-Niagara Falls, NY 5.57 5.35 5.56 Glens Falls, NY 0.86 0.70 0.85 Ithaca, NY 0.51 1.04 0.54 New York-Newark-Jersey City, NY-NJ-PA 61.41 60.02 61.35 Rochester, NY 6.24 8.40 6.35 Syracuse, NY 4.21 4.38 4.22 Utica-Rome, NY 1.67 1.27 1.65 Total 100.00 100.00 100.00 Percent of Total U.S. Workforce 6.45 5.31 6.38
North Carolina Non-STEM STEM Total
not in identifiable area 30.97 22.96 30.52 Asheville, NC 4.69 3.42 4.62 Burlington, NC 1.91 1.66 1.90 Charlotte-Concord-Gastonia, NC 21.62 23.99 21.76 Fayetteville, NC 3.75 1.72 3.64 Goldsboro, NC 1.08 0.50 1.05 Greensboro-High Point, NC 7.86 6.24 7.77 Greenville, NC 1.48 1.07 1.45 Hickory-Lenoir-Morganton, NC 3.84 2.11 3.74 Myrtle Beach-Conway-North Myrtle Beach, NC 1.13 0.89 1.12 Raleigh, NC 11.34 27.09 12.22

115 | P a g e
Rocky Mount, NC 1.38 0.76 1.35 Wilmington, NC 2.51 2.07 2.48 Winston-Salem, NC 6.44 5.52 6.39 Total 100.00 100.00 100.00 Percent of Total U.S. Workforce 3.07 2.98 3.07
North Dakota Non-STEM STEM Total
identifiable a 85.29 83.13 85.22 Bismarck, ND 14.71 16.87 14.78 Total 100.00 100.00 100.00 Percent of Total U.S. Workforce 0.26 0.15 0.26
Ohio Non-STEM STEM Total
not in identifiable area 26.02 15.05 25.47 Akron, OH 5.64 6.37 5.68 Canton-Massillon, OH 3.43 2.65 3.39 Cincinnati, OH-KY-IN 12.73 17.78 12.98 Cleveland-Elyria, OH 18.47 20.32 18.56 Columbus, OH 14.71 20.56 15.01 Dayton, OH 6.31 8.42 6.42 Lima, OH 1.01 0.54 0.98 Mansfield, OH 0.90 0.51 0.88 Springfield, OH 1.32 1.06 1.31 Toledo, OH 5.78 4.53 5.72 Youngstown-Warren-Boardman, OH-PA 3.68 2.21 3.60 Total 100.00 100.00 100.00 Percent of Total U.S. Workforce 3.78 3.32 3.75
Oklahoma Non-STEM STEM Total
not in identifiable area 71.18 59.72 70.78 Oklahoma City, OK 28.82 40.28 29.22 Total 100.00 100.00 100.00 Percent of Total U.S. Workforce 1.12 0.67 1.09
Oregon Non-STEM STEM Total
not in identifiable area 34.02 21.87 33.2 Bend-Redmond, OR 2.92 2.04 2.86

116 | P a g e
Eugene, OR 9.66 6.99 9.48 Medford, OR 4.37 2.51 4.24 Portland-Vancouver-Hillsboro, OR-WA 49.03 66.59 50.21 Total 100.00 100.00 100.00 Percent of Total U.S. Workforce 1.24 1.46 1.25
Pennsylvania Non-STEM STEM Total
not in identifiable area 26.31 15.87 25.77 Allentown-Bethlehem-Easton, PA-NJ 4.64 4.94 4.66 East Stroudsburg, PA 0.72 0.51 0.71 Erie, PA 2.13 1.66 2.11 Harrisburg-Carlisle, PA 4.29 4.81 4.31 Johnstown, PA 1.67 0.98 1.64 Lancaster, PA 3.30 2.48 3.26 Lebanon, PA 0.98 0.67 0.96 Philadelphia-Camden-Wilmington, PA-NJ-DE 24.99 35.18 25.52 Pittsburgh, PA 18.21 21.99 18.40 Reading, PA 3.11 2.66 3.09 Scranton--Wilkes-Barre-Hazleton, PA 4.16 2.78 4.09 State College, PA 1.15 1.71 1.18 York-Hanover, PA 3.09 3.11 3.09 Youngstown-Warren-Boardman, OH-PA 1.25 0.65 1.22 Total 100.00 100.00 100.00 Percent of Total U.S. Workforce 4.16 3.74 4.14
Rhode Island Non-STEM STEM Total
Providence-Warwick, RI 100.00 100.00 100.00 Total 100.00 100.00 100.00 Percent of Total U.S. Workforce 0.37 0.34 0.37
South Carolina Non-STEM STEM Total
not in identifiable area 15.71 8.82 15.40 Augusta-Richmond County, GA-SC 3.48 4.62 3.53 Charleston-North Charleston, CS 15.15 20.06 15.38 Charlotte-Concord-Gastonia, NC-SC 8.25 8.88 8.28 Columbia, SC 18.32 19.58 18.38 Florence, SC 4.26 2.95 4.20 Greenville-Anderson-Mauldin, SC 19.02 24.44 19.26
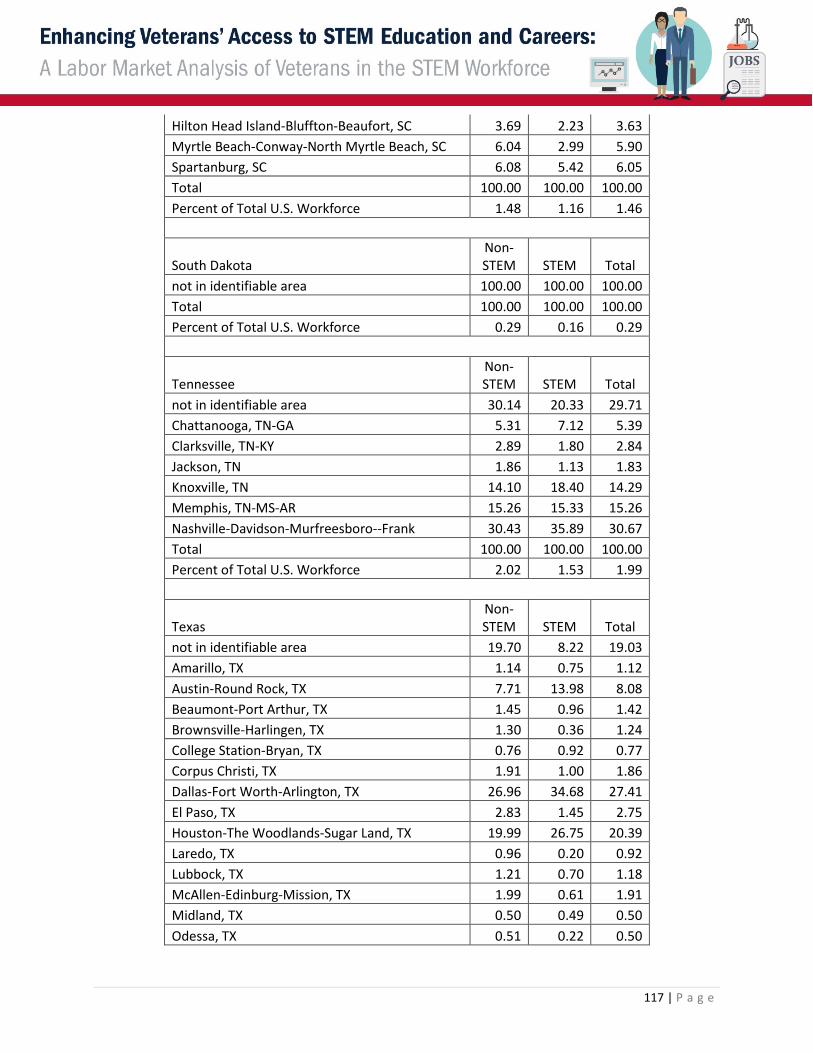
117 | P a g e
Hilton Head Island-Bluffton-Beaufort, SC 3.69 2.23 3.63 Myrtle Beach-Conway-North Myrtle Beach, SC 6.04 2.99 5.90 Spartanburg, SC 6.08 5.42 6.05 Total 100.00 100.00 100.00 Percent of Total U.S. Workforce 1.48 1.16 1.46
South Dakota Non-STEM STEM Total
not in identifiable area 100.00 100.00 100.00 Total 100.00 100.00 100.00 Percent of Total U.S. Workforce 0.29 0.16 0.29
Tennessee Non-STEM STEM Total
not in identifiable area 30.14 20.33 29.71 Chattanooga, TN-GA 5.31 7.12 5.39 Clarksville, TN-KY 2.89 1.80 2.84 Jackson, TN 1.86 1.13 1.83 Knoxville, TN 14.10 18.40 14.29 Memphis, TN-MS-AR 15.26 15.33 15.26 Nashville-Davidson-Murfreesboro--Frank 30.43 35.89 30.67 Total 100.00 100.00 100.00 Percent of Total U.S. Workforce 2.02 1.53 1.99
Texas Non-STEM STEM Total
not in identifiable area 19.70 8.22 19.03 Amarillo, TX 1.14 0.75 1.12 Austin-Round Rock, TX 7.71 13.98 8.08 Beaumont-Port Arthur, TX 1.45 0.96 1.42 Brownsville-Harlingen, TX 1.30 0.36 1.24 College Station-Bryan, TX 0.76 0.92 0.77 Corpus Christi, TX 1.91 1.00 1.86 Dallas-Fort Worth-Arlington, TX 26.96 34.68 27.41 El Paso, TX 2.83 1.45 2.75 Houston-The Woodlands-Sugar Land, TX 19.99 26.75 20.39 Laredo, TX 0.96 0.20 0.92 Lubbock, TX 1.21 0.70 1.18 McAllen-Edinburg-Mission, TX 1.99 0.61 1.91 Midland, TX 0.50 0.49 0.50 Odessa, TX 0.51 0.22 0.50
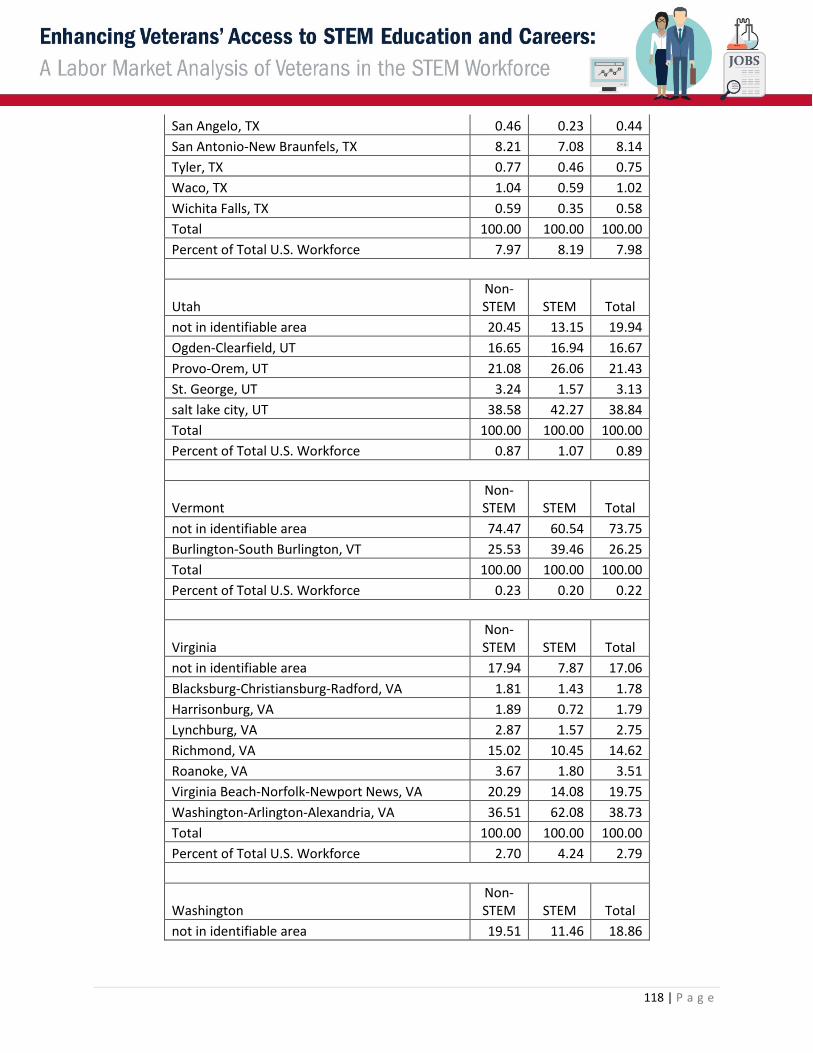
118 | P a g e
San Angelo, TX 0.46 0.23 0.44 San Antonio-New Braunfels, TX 8.21 7.08 8.14 Tyler, TX 0.77 0.46 0.75 Waco, TX 1.04 0.59 1.02 Wichita Falls, TX 0.59 0.35 0.58 Total 100.00 100.00 100.00 Percent of Total U.S. Workforce 7.97 8.19 7.98
Utah Non-STEM STEM Total
not in identifiable area 20.45 13.15 19.94 Ogden-Clearfield, UT 16.65 16.94 16.67 Provo-Orem, UT 21.08 26.06 21.43 St. George, UT 3.24 1.57 3.13 salt lake city, UT 38.58 42.27 38.84 Total 100.00 100.00 100.00 Percent of Total U.S. Workforce 0.87 1.07 0.89
Vermont Non-STEM STEM Total
not in identifiable area 74.47 60.54 73.75 Burlington-South Burlington, VT 25.53 39.46 26.25 Total 100.00 100.00 100.00 Percent of Total U.S. Workforce 0.23 0.20 0.22
Virginia Non-STEM STEM Total
not in identifiable area 17.94 7.87 17.06 Blacksburg-Christiansburg-Radford, VA 1.81 1.43 1.78 Harrisonburg, VA 1.89 0.72 1.79 Lynchburg, VA 2.87 1.57 2.75 Richmond, VA 15.02 10.45 14.62 Roanoke, VA 3.67 1.80 3.51 Virginia Beach-Norfolk-Newport News, VA 20.29 14.08 19.75 Washington-Arlington-Alexandria, VA 36.51 62.08 38.73 Total 100.00 100.00 100.00 Percent of Total U.S. Workforce 2.70 4.24 2.79
Washington Non-STEM STEM Total
not in identifiable area 19.51 11.46 18.86
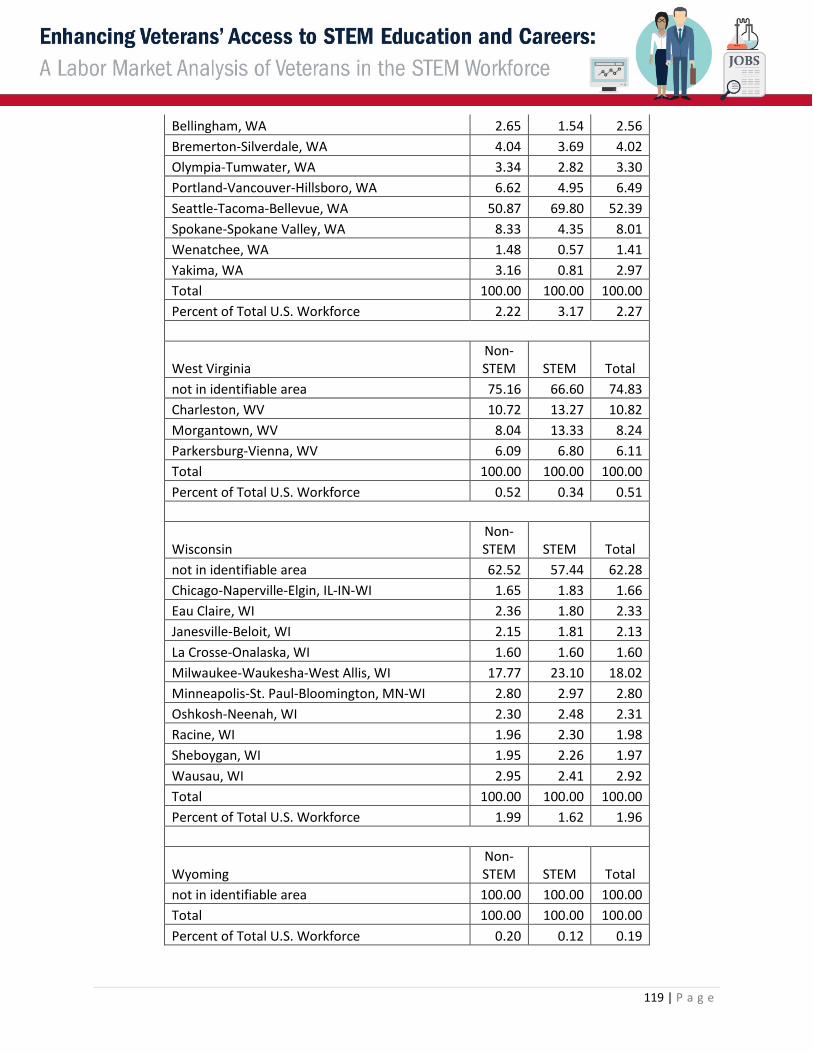
119 | P a g e
Bellingham, WA 2.65 1.54 2.56 Bremerton-Silverdale, WA 4.04 3.69 4.02 Olympia-Tumwater, WA 3.34 2.82 3.30 Portland-Vancouver-Hillsboro, WA 6.62 4.95 6.49 Seattle-Tacoma-Bellevue, WA 50.87 69.80 52.39 Spokane-Spokane Valley, WA 8.33 4.35 8.01 Wenatchee, WA 1.48 0.57 1.41 Yakima, WA 3.16 0.81 2.97 Total 100.00 100.00 100.00 Percent of Total U.S. Workforce 2.22 3.17 2.27
West Virginia Non-STEM STEM Total
not in identifiable area 75.16 66.60 74.83 Charleston, WV 10.72 13.27 10.82 Morgantown, WV 8.04 13.33 8.24 Parkersburg-Vienna, WV 6.09 6.80 6.11 Total 100.00 100.00 100.00 Percent of Total U.S. Workforce 0.52 0.34 0.51
Wisconsin Non-STEM STEM Total
not in identifiable area 62.52 57.44 62.28 Chicago-Naperville-Elgin, IL-IN-WI 1.65 1.83 1.66 Eau Claire, WI 2.36 1.80 2.33 Janesville-Beloit, WI 2.15 1.81 2.13 La Crosse-Onalaska, WI 1.60 1.60 1.60 Milwaukee-Waukesha-West Allis, WI 17.77 23.10 18.02 Minneapolis-St. Paul-Bloomington, MN-WI 2.80 2.97 2.80 Oshkosh-Neenah, WI 2.30 2.48 2.31 Racine, WI 1.96 2.30 1.98 Sheboygan, WI 1.95 2.26 1.97 Wausau, WI 2.95 2.41 2.92 Total 100.00 100.00 100.00 Percent of Total U.S. Workforce 1.99 1.62 1.96
Wyoming Non-STEM STEM Total
not in identifiable area 100.00 100.00 100.00 Total 100.00 100.00 100.00 Percent of Total U.S. Workforce 0.20 0.12 0.19

120 | P a g e
Veteran STEM – Employment Characteristics Table 30 presents the average total personal income for veterans and non-veterans for STEM and Non-STEM workforces by level of educational attainment. The largest difference in STEM and Non-STEM average personal incomes occurs for workers that are less than a high school graduate or GED certificate; a difference of 67.23 percent for veterans and 109.35 percent for non-veterans. These differences in average personal income remain notably large for veterans and non-veterans through educational attainment of some college or associate degree. The difference between average personal income for STEM and Non-STEM workers falls to 16.36 percent for veterans and 34.08 percent for non-veterans for workers with a bachelor’s degree. Veterans exhibit higher average personal income for STEM and Non-STEM workers regardless of their educational attainment.
Attaining a bachelor’s degree does result in a significant increase in average personal income, a 25.08 percent increase for STEM veterans and a 50.1 percent increase for Non-STEM veterans compared with a 39.73 percent increase for STEM non-veterans and a 71.38 percent increase for Non-STEM non-veterans. Similar percentage increases occur between bachelor’s degree respondents (veteran and non-veteran, STEM and Non-STEM) and more than a bachelor’s degree; a 32.53 percent increase for STEM veterans and a 56.36 percent increase for Non-STEM veterans compared with a 23.11 percent increase for STEM non-veterans and a 52.3 percent increase for Non-STEM non-veterans. The overall difference in average personal income between STEM and Non-STEM workers is much larger for non-veterans (76.23 percent) than veterans (39.58 percent), while the average age for veterans is significantly higher than non-veterans, 53.06 years versus 42.88 years.
Table 30. Average Annual Total Personal Income of Workers (in the Labor Force) in STEM Occupations STEM and Non-STEM Occupations and Educational Attainment, 2012 to 2016
Time Period Average Total Personal Income – 2012 to 2016 Time Period
Educational Attainment
Veteran Non-Veteran STEM Non-STEM % Diff STEM Non-STEM % Diff
Less Than HSG or GED $73,556 $43,986 67.23 $56,410 $26,945 109.35 HSG or GED $73,846 $48,591 51.97 $56,797 $34,078 66.67 Some College or Associate Degree $78,077 $55,918 39.63 $63,817 $38,807 64.45 Bachelor's Degree $97,662 $83,931 16.36 $89,172 $66,508 34.08 More Than a Bachelor's Degree $129,434 $131,235 (1.37) $109,781 $101,293 8.38

121 | P a g e
Total $93,833 $67,224 39.58 $86,676 $49,184 76.23 Mean Age 53.06 42.88
Table 31 presents the average total personal income for Veterans and Non-veterans for STEM and Non-STEM workforces by level of educational attainment for respondents aged 18 to 40 years of age for the 2012 to 2016 time period. The largest difference in STEM and Non-STEM average personal incomes occurs for non-veteran workers that are less than a high school graduate or a GED certificate; a difference of 123.96 percent. In comparison, veterans that are less than a high school graduate or a GED certificate exhibit a 65.74 percent difference. For veterans, the largest difference in STEM and Non-STEM average personal incomes occurs for workers with a HSG or GED, a difference of 55.05 percent. These differences in average personal income remain notably large for veterans and non-veterans through educational attainment of some college or associate degree, with the differences remaining double-digit. The difference between average personal income for STEM and Non-STEM workers falls to 5.14 percent for veterans and 15.26 percent for non-veteran workers with more than a bachelor’s degree. Veterans aged 18 to 40 years of age exhibit higher average personal income for STEM and Non-STEM workers regardless of their educational attainment, though the income magnitudes are very similar for STEM veteran and non-veteran workers.
Attaining a bachelor’s degree does result in a significant increase in average personal income, a 20.13 percent increase for STEM veterans and a 39.14 percent increase for Non-STEM veterans compared to a 54.26 percent increase for STEM non-veterans and an 84.05 percent increase for Non-STEM non-veterans. Similar percentage increases occur between bachelor’s degree respondents (veteran and non-veteran, STEM and Non-STEM) and more than a bachelor’s degree; a 25.70 percent increase for STEM veterans and a 51.4 percent increase for Non-STEM veterans compared to a 20.42 percent increase for STEM non-veterans and a 50.1 percent increase for Non-STEM non-veterans. The overall difference in average personal income between STEM and Non-STEM workers is much larger for non-veterans (92.73 percent) than veterans (48.95 percent).
Table 31. Average Annual Total Personal Income of Veteran and Non-Veteran Workers (in the Labor Force) in STEM and Non-STEM Occupations by Educational Attainment, 2012 to 2016
Time Period, Age 18 to 40 Years
Average Total Personal Income – 2012 to 2016 Time Period Educational Attainment
Veteran Non-Veteran STEM Non-STEM % Diff STEM Non-STEM % Diff
Less Than HSG or GED $53,235 $32,121 65.74 $46,058 $20,565 123.96 HSG or GED $57,489 $37,077 55.05 $42,760 $25,092 70.41

122 | P a g e
Average Total Personal Income – 2012 to 2016 Time Period Educational Attainment
Veteran Non-Veteran STEM Non-STEM % Diff STEM Non-STEM % Diff
Some College or Associate Degree $61,912 $42,214 46.66 $46,690 $27,239 71.41 Bachelor's Degree $74,376 $58,736 26.63 $72,025 $50,133 43.67 More Than a Bachelor's Degree $93,492 $88,925 5.14 $86,730 $75,250 15.26
Total $69,964 $46,971 48.95 $68,567 $35,577 92.73
Table 32 presents the average total personal income for veterans and non-veterans for STEM and Non-STEM workforces by level of educational attainment for respondents aged 41 years and older for the 2012 to 2016 time period. The largest difference in STEM and Non-STEM average personal incomes occurs for workers that are less than a high school graduate or a GED certificate; a difference of 71.64 percent for veterans and 105.38 percent for non-veterans. These differences in average personal income remain notably large for veterans and non-veterans through educational attainment of some college or associate degree, though the differences still remain double-digit through a bachelor’s degree. The difference between average personal income for STEM and Non-STEM workers falls to -0.76 percent for veterans and 10.25 percent for non-veterans for workers with more than a bachelor’s degree. Veterans aged 41 years of age and older exhibit higher average personal income for STEM and Non-STEM workers regardless of their educational attainment; exception, STEM workers with a bachelor’s degree.
Attaining a bachelor’s degree does result in a significant increase in average personal income, a 25.77 percent increase for STEM veterans and a 49.59 percent increase for Non-STEM veterans compared with a 38.84 percent increase for STEM non-veterans and a 61.28 percent increase for Non-STEM non-veterans. Similar percentage increases occur between bachelor’s degree respondents (veteran and non-veteran, STEM and Non-STEM) and more than a bachelor’s degree; a 30.17 percent increase for STEM veterans and a 52.05 percent increase for Non-STEM veterans compared with a 19.65 percent increase for STEM non-veterans and a 43.81 percent increase for Non-STEM non-veterans. The overall difference in average personal income between STEM and Non-STEM workers is larger for non-veterans (67.55 percent) than veterans (39.20 percent), though both are still sizable.
Table 32. Average Annual Total Personal Income of Veteran and Non-Veteran Workers (in the Labor Force) in STEM and Non-STEM Occupations by Educational Attainment, 2012 to 2016
Time Period, Age 41 Years or Older

123 | P a g e
Average Total Personal Income – 2012 to 2016 Time Period Educational Attainment
Veteran Non-Veteran STEM Non-STEM % Diff STEM Non-STEM % Diff
Less Than HSG or GED $77,403 $45,096 71.64 $65,320 $31,805 105.38 HSG or GED $78,670 $50,952 54.40 $66,472 $40,584 63.79 Some College or Associate Degree $82,913 $60,136 37.87 $76,669 $49,808 53.93 Bachelor's Degree $104,278 $89,960 15.92 $106,448 $80,331 32.51 More Than a Bachelor's Degree $135,735 $136,780 (0.76) $127,370 $115,524 10.25
Total $100,230 $72,006 39.20 $102,162 $60,974 67.55
Table 33 presents the average total personal income for Pre-9/11 and Post-9/11 veterans for STEM and Non-STEM workforces by level of educational attainment for respondents aged 18 to 70 years of age for the 2012 to 2016 time period. The largest difference in STEM and Non-STEM average personal incomes occurs for workers that are less than a high school graduate or a GED certificate; a difference of 68.76 percent for Pre-9/11 veterans and 110.08 percent for Post-9/11 veterans. These differences in average personal income remain notably large for Pre-9/11 and Post-9/11 veterans through educational attainment of some college or associate degree, though the differences still remain double-digit through a bachelor’s degree. The difference between average personal income for STEM and Non-STEM workers falls to -1.13 percent for Pre-9/11 veterans and 0.42 percent for Post-9/11 veterans for workers with more than a bachelor’s degree. Veterans aged 18 to 70 years of age in STEM occupations exhibit higher average personal income than veterans in Non-STEM occupations, regardless of their educational attainment (exception, Pre-9/11 veterans with more than a bachelor’s degree).
Attaining a bachelor’s degree does result in a significant increase in average personal income, a 25.65 percent increase for Pre-9/11 STEM veterans and a 48.39 percent increase for Pre-9/11 STEM veterans, compared to a 22.91 percent increase for Post-9/11 STEM veterans and a 48.84 percent increase for Post 9/11 Non-STEM veterans. Similar percentage increases occur between bachelor’s degree respondents (Pre-9/11 and Post-9/11 veterans, STEM and Non-STEM) and more than a bachelor’s degree; a 26.22 percent increase for Pre-9/11 STEM veterans and a 50.26 percent increase for Pre-9/11 Non-STEM veterans compared to a 49.52 percent increase for Post-9/11 STEM veterans and a 76.93 percent increase for Post-9/11 Non-STEM veterans. The overall difference in average annual personal income between STEM and Non-STEM workers is larger

124 | P a g e
for Post-9/11 veterans (42.42 percent) than Pre-9/11veterans (41.55 percent).
Table 33. Average Annual Total Personal Income of Pre 9/11 and Post 9/11 Veteran Workers (in the Labor Force, Age 18 to 70) in STEM and Non-STEM Occupations by Educational
Attainment, 2012 to 2016
Average Total Personal Income, 2012 to 2016 Pre-9/11 Veteran Post-9/11 Veteran
Educational Attainment STEM Non-STEM % Diff STEM Non-STEM % Diff Less Than HSG or GED $73,980 $43,836 68.76 $74,950 $35,677 110.08 HSG or GED $77,422 $49,964 54.96 $61,328 $38,878 57.74 Some College or Associate Degree $80,918 $58,213 39.00 $68,522 $47,620 43.89 Bachelor's Degree $101,672 $86,380 17.70 $84,223 $70,878 18.83 More Than a Bachelor's Degree $128,328 $129,791 (1.13) $125,930 $125,403 0.42 Total $95,438 $67,425 41.55 $85,761 $60,219 42.42
Mean Age (Years) 55.305 37.494

125 | P a g e
Figure 16. Average Annual Total Personal Income of Veteran and Non-Veteran Workers (in the Labor Force, Age 18 to 70) in STEM and Non-STEM Occupations by Educational
Attainment, 2014
$0
$20,000
$40,000
$60,000
$80,000
$100,000
$120,000
$140,000
Less Than HSG orGED
HSG or GED Some College orAssociate Degree
Bachelor's Degree More Than aBachelor's Degree
Aver
age
Annu
al T
otal
Per
sona
l Inc
ome
Educational Attainment
Pre-9/11, Veteran, STEM Pre-9/11, Veteran, Non-STEM
Post-9/11, Veteran, STEM Post-9/11, Veteran, Non-STEM
Table 34 provides the unemployment percent for veterans and non-veterans by STEM and Non-STEM employment for the 2012 to 2016 time period. Veteran and non-veteran, STEM and Non-STEM, workers exhibit declines in the unemployment percentage for the 2012 to 2016 time period as evidenced by the negative trend values for each worker group. The largest decline in unemployment percentages is exhibited by non-veteran, Non-STEM workers, a -0.9200 percentage point decline each year for the 2012 to 2016 time period followed closely by veteran, Non-STEM workers with -0.8830 percentage point decline each year. The unemployment percentages for all four worker groups are highly correlated with each other (any two-way combination of the worker groups exhibits between a 0.894 and a 0.996 simple correlation). The two STEM groups comparison exhibit a 0.894 simple correlation and the two Non-STEM groups comparison exhibit a 0.996 simple correlation, the latter veteran worker group representing the highest of the simple correlations.

126 | P a g e
Table 34. Unemployment Percentages for Veteran and Non-Veteran Workers (in the Labor Force, Age 18 to 70) in STEM and Non-STEM Occupations for the 2012 to 2016 Time Period
Unemployed Rates (Percent)
Veteran Non-Veteran
Year STEM Non-STEM STEM
Non-STEM
2012 5.15 8.15 3.66 8.94 2013 3.87 7.39 3.37 7.97 2014 4.00 5.98 2.92 6.85 2015 3.33 5.28 2.57 5.93 2016 2.62 4.79 2.54 5.36
Trend -0.5600 -0.8830 -0.3040 -0.9200
Figure 17. Unemployment Percentages for Veteran and Non-Veteran Workers (in the Labor Force, Age 18 to 70) in STEM and Non-STEM Occupations for the 2012 to 2016 Time Period
0123456789
10
2012 2013 2014 2015 2016
Perc
ent U
nem
ploy
men
t
Year
Veteran, STEM Veteran, Non-STEM
Non-Veteran, STEM Non-Veteran, Non-STEM
Table 35 provides the unemployment percent for Post-9/11 and Pre-9/11 veterans by STEM and Non-STEM employment for the 2012 to 2016 time period. All four combinations of veteran workers exhibit declines in the unemployment percentage for the 2012 to 2016 time period as evidenced by the negative trend values for each worker group. The largest decline in

127 | P a g e
unemployment percentages is exhibited by Post-9/11, Non-STEM veteran workers, a -0.9800 percentage point decline each year for the 2012 to 2016 time period, followed by Pre-9/11, Non-STEM veteran workers with -0.9130 percentage point decline each year. The unemployment percentages for all four veteran worker groups are mix of highly correlated and not so highly correlated with each other correlations. The lowest simple correlation is exhibited by the Post-9/11, STEM veteran workers compared to Pre-9/11, Non-STEM veteran workers, a 0.6681 simple correlation. Another low simple correlation is exhibited by the Pre-9/11, STEM and Post-9/11 STEM, comparison, which exhibits a 0.7484 simple correlation. The Pre-9/11 and Post-9/11, Non-STEM, comparison exhibits a simple correlation of 0.9804, which is the highest simple correlation.
Table 35. Unemployment Percentages for Pre-9/11 and Post-9/11 Veteran Workers (in the Labor Force, Age 18 to 70) in STEM and Non-STEM Occupations for the 2012 to 2016 Time
Period
Unemployed Rates (Percent)
Veteran Post-9/11 Veteran Pre-9/11
Year STEM Non-STEM STEM Non-STEM
2012 4.19 9.75 5.42 7.76 2013 3.53 8.77 3.97 6.99 2014 4.3 7.79 3.89 5.38 2015 3.2 6.45 3.39 4.84 2016 1.87 6.01 2.98 4.27
Trend -0.4970 -0.9800 -0.5460 -0.9130
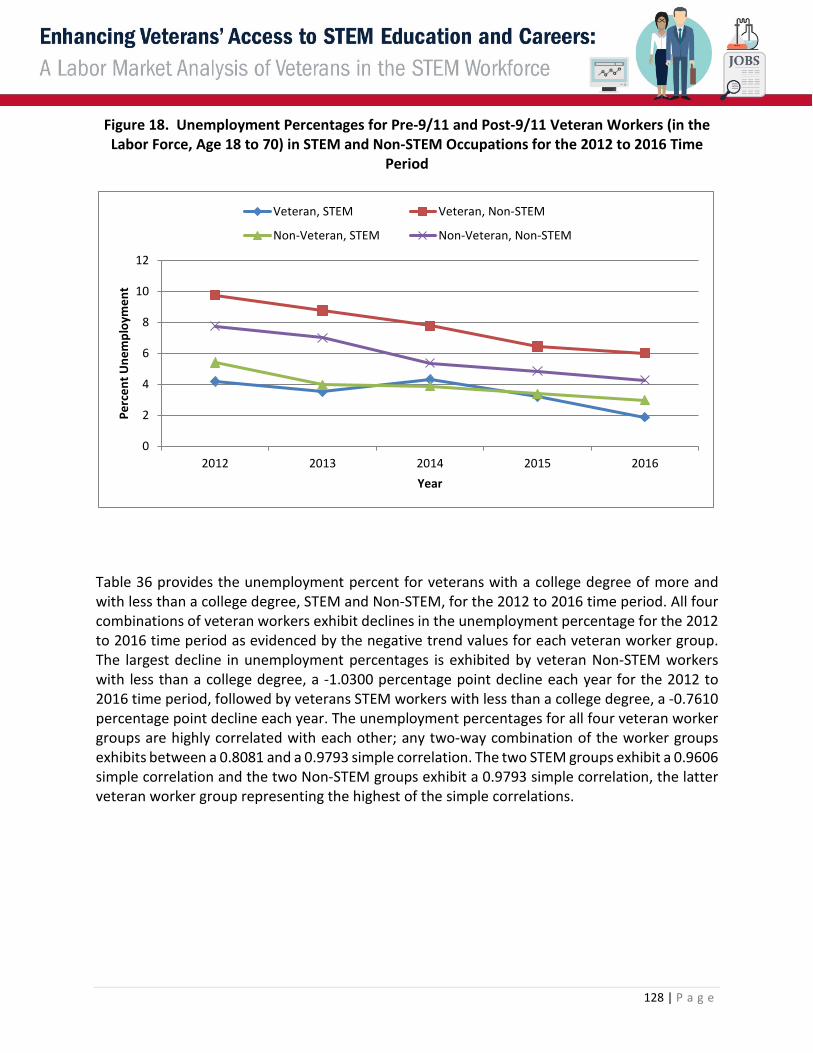
128 | P a g e
Figure 18. Unemployment Percentages for Pre-9/11 and Post-9/11 Veteran Workers (in the Labor Force, Age 18 to 70) in STEM and Non-STEM Occupations for the 2012 to 2016 Time
Period
0
2
4
6
8
10
12
2012 2013 2014 2015 2016
Perc
ent U
nem
ploy
men
t
Year
Veteran, STEM Veteran, Non-STEM
Non-Veteran, STEM Non-Veteran, Non-STEM
Table 36 provides the unemployment percent for veterans with a college degree of more and with less than a college degree, STEM and Non-STEM, for the 2012 to 2016 time period. All four combinations of veteran workers exhibit declines in the unemployment percentage for the 2012 to 2016 time period as evidenced by the negative trend values for each veteran worker group. The largest decline in unemployment percentages is exhibited by veteran Non-STEM workers with less than a college degree, a -1.0300 percentage point decline each year for the 2012 to 2016 time period, followed by veterans STEM workers with less than a college degree, a -0.7610 percentage point decline each year. The unemployment percentages for all four veteran worker groups are highly correlated with each other; any two-way combination of the worker groups exhibits between a 0.8081 and a 0.9793 simple correlation. The two STEM groups exhibit a 0.9606 simple correlation and the two Non-STEM groups exhibit a 0.9793 simple correlation, the latter veteran worker group representing the highest of the simple correlations.

129 | P a g e
Table 36. Unemployment Percentages for Veteran Workers (in the Labor Force, Age 18 to 70) in STEM and Non-STEM Occupations by Educational Attainment for the 2012 to 2016 Time
Period
Unemployed Rates (Percent)
Veteran – College Degree or More
Veteran – Less Than a College
Degree
Year STEM Non-STEM STEM Non-STEM
2012 4.11 5.21 6.25 9.21 2013 3.20 5.12 4.53 8.23 2014 3.58 4.39 4.41 6.58 2015 2.89 3.85 3.82 5.83 2016 2.44 3.61 2.80 5.26
Trend -0.3650 -0.4470 -0.7610 -1.0300
Figure 19. Unemployment Percentages for Veteran Workers (in the Labor Force, Age 18 to 70) in STEM and Non-STEM Occupations by Educational Attainment for the 2012 to 2016 Time
Period
0.001.002.003.004.005.006.007.008.009.00
10.00
2012 2013 2014 2015 2016
Perc
ent U
nem
ploy
men
t
Year
Veteran, College Degree or More, STEM
Veteran, College Degree or More, Non-STEM
Veteran, Less Than a College Degree, STEM
Veteran, Less Than a College Degree, Non-STEM
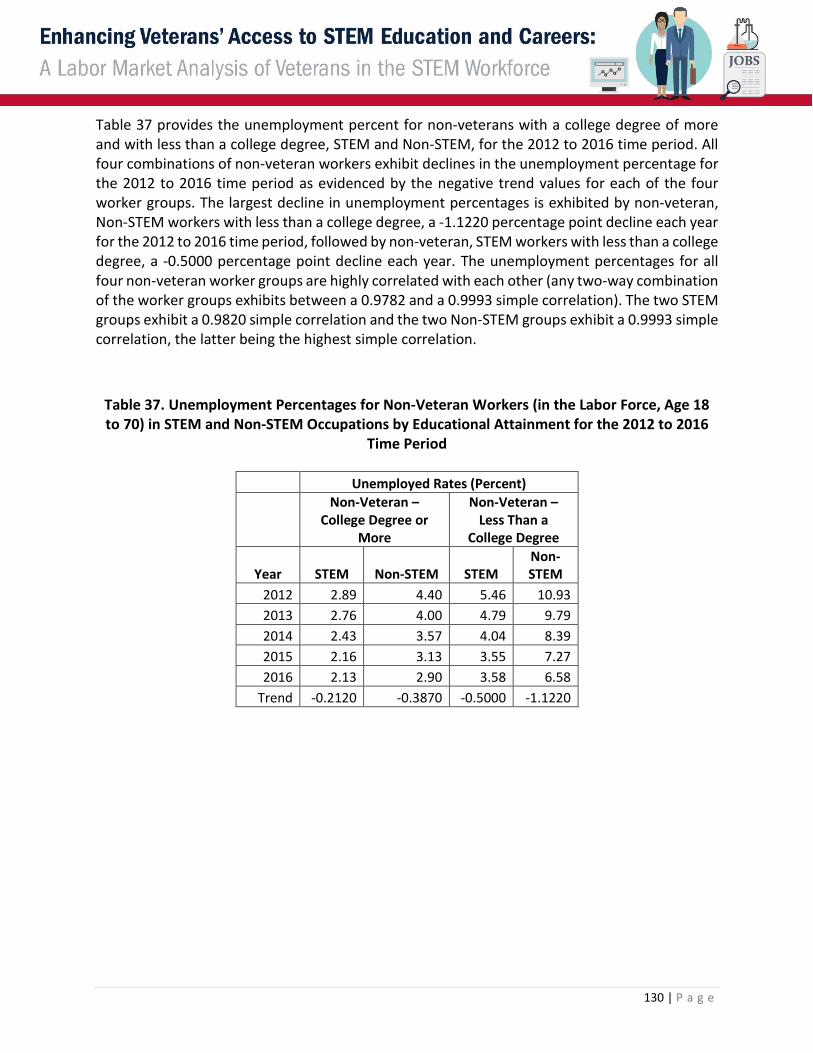
130 | P a g e
Table 37 provides the unemployment percent for non-veterans with a college degree of more and with less than a college degree, STEM and Non-STEM, for the 2012 to 2016 time period. All four combinations of non-veteran workers exhibit declines in the unemployment percentage for the 2012 to 2016 time period as evidenced by the negative trend values for each of the four worker groups. The largest decline in unemployment percentages is exhibited by non-veteran, Non-STEM workers with less than a college degree, a -1.1220 percentage point decline each year for the 2012 to 2016 time period, followed by non-veteran, STEM workers with less than a college degree, a -0.5000 percentage point decline each year. The unemployment percentages for all four non-veteran worker groups are highly correlated with each other (any two-way combination of the worker groups exhibits between a 0.9782 and a 0.9993 simple correlation). The two STEM groups exhibit a 0.9820 simple correlation and the two Non-STEM groups exhibit a 0.9993 simple correlation, the latter being the highest simple correlation.
Table 37. Unemployment Percentages for Non-Veteran Workers (in the Labor Force, Age 18 to 70) in STEM and Non-STEM Occupations by Educational Attainment for the 2012 to 2016
Time Period
Unemployed Rates (Percent)
Non-Veteran – College Degree or
More
Non-Veteran – Less Than a
College Degree
Year STEM Non-STEM STEM Non-STEM
2012 2.89 4.40 5.46 10.93 2013 2.76 4.00 4.79 9.79 2014 2.43 3.57 4.04 8.39 2015 2.16 3.13 3.55 7.27 2016 2.13 2.90 3.58 6.58
Trend -0.2120 -0.3870 -0.5000 -1.1220
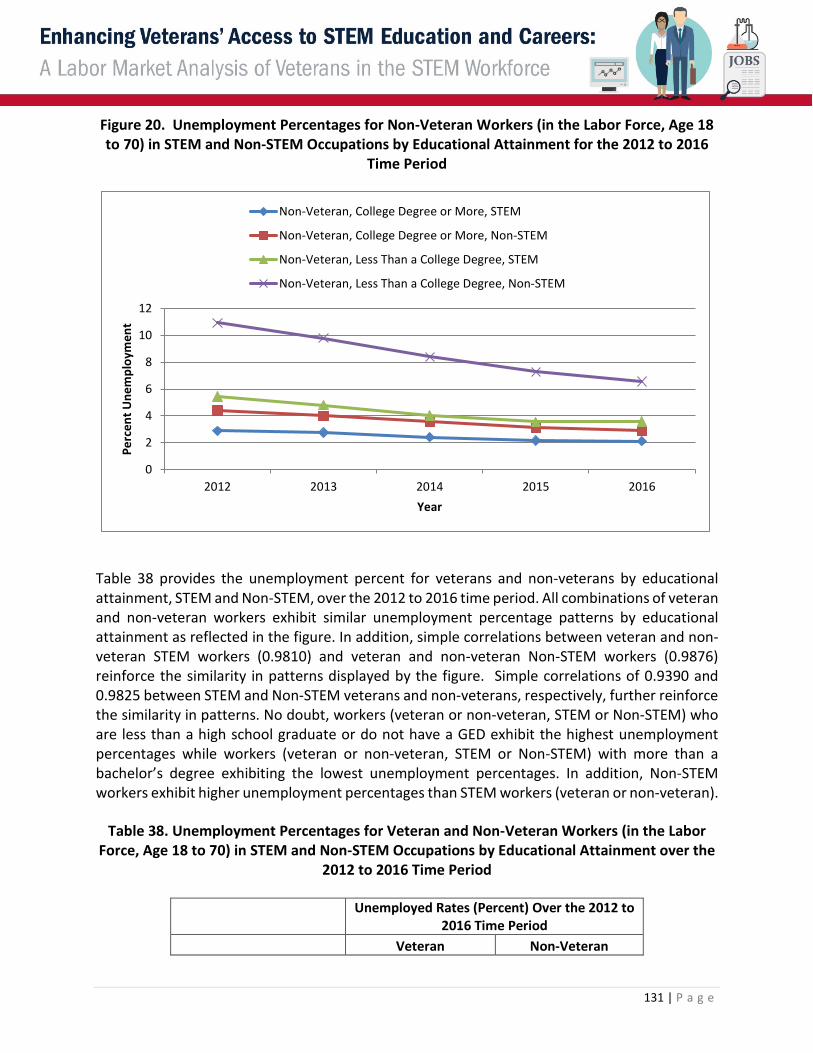
131 | P a g e
Figure 20. Unemployment Percentages for Non-Veteran Workers (in the Labor Force, Age 18 to 70) in STEM and Non-STEM Occupations by Educational Attainment for the 2012 to 2016
Time Period
0
2
4
6
8
10
12
2012 2013 2014 2015 2016
Perc
ent U
nem
ploy
men
t
Year
Non-Veteran, College Degree or More, STEM
Non-Veteran, College Degree or More, Non-STEM
Non-Veteran, Less Than a College Degree, STEM
Non-Veteran, Less Than a College Degree, Non-STEM
Table 38 provides the unemployment percent for veterans and non-veterans by educational attainment, STEM and Non-STEM, over the 2012 to 2016 time period. All combinations of veteran and non-veteran workers exhibit similar unemployment percentage patterns by educational attainment as reflected in the figure. In addition, simple correlations between veteran and non-veteran STEM workers (0.9810) and veteran and non-veteran Non-STEM workers (0.9876) reinforce the similarity in patterns displayed by the figure. Simple correlations of 0.9390 and 0.9825 between STEM and Non-STEM veterans and non-veterans, respectively, further reinforce the similarity in patterns. No doubt, workers (veteran or non-veteran, STEM or Non-STEM) who are less than a high school graduate or do not have a GED exhibit the highest unemployment percentages while workers (veteran or non-veteran, STEM or Non-STEM) with more than a bachelor’s degree exhibiting the lowest unemployment percentages. In addition, Non-STEM workers exhibit higher unemployment percentages than STEM workers (veteran or non-veteran).
Table 38. Unemployment Percentages for Veteran and Non-Veteran Workers (in the Labor Force, Age 18 to 70) in STEM and Non-STEM Occupations by Educational Attainment over the
2012 to 2016 Time Period
Unemployed Rates (Percent) Over the 2012 to
2016 Time Period
Veteran Non-Veteran

132 | P a g e
Educational Attainment STEM Non-STEM STEM Non-STEM Less Than a HSG or GED 8.02 10.03 8.67 13.36
HSG or GED 4.45 7.40 5.13 9.04 Some College but Less than a College Degree 4.34 6.77 3.88 6.94
College Degree 3.42 5.16 2.53 4.09 More Than a Bachelor’s
Degree 2.94 3.48 2.33 2.74
Figure 21. Unemployment Percentages for Veteran and Non-Veteran Workers (in the Labor Force, Age 18 to 70) in STEM and Non-STEM Occupations by Educational Attainment over the
2012 to 2016 Time Period
8.02
4.45
4.34
3.42
2.94
10.0
3
7.40
6.77
5.16
3.48
8.67
5.13
3.88
2.53
2.33
13.3
6
9.04
6.94
4.09
2.74
0
2
4
6
8
10
12
14
16
Less Than a HSG orGED
HSG or GED Some College butLess than a College
Degree
College Degree More Than a Bachelor’s Degree
Perc
ent U
nem
ploy
men
t
Educational Attainment
Veteran, STEM Veteran, Non-STEM Non-Veteran, STEM Non-Veteran, Non-STEM
Figures 22 and 23 provide the percentage composition of the veteran and non-veteran workforces by STEM and Non-STEM occupations. The most difference exhibited by the workforce distributions are for STEM compared to Non-STEM, veteran and non-veteran. Veteran STEM and Non-STEM workforces have a simple correlation of 0.6585, while Non-veteran STEM and Non-STEM workforces have a simple correlation of 0.1590, both indicating significant differences in the distribution of the workforces between STEM and Non-STEM workforces, regardless of veteran or non-veteran status. In comparison, when comparing STEM veteran to STEM non-veteran, the simple correlation is 0.9784. The comparison of non-STEM veteran to non-STEM non-veteran provides a high simple correlation is 0.7841, though lower than the STEM veteran to STEM non-veteran comparison.

133 | P a g e
Figure 22. Percentage of the Veteran and Non-Veteran, STEM and Non-STEM Occupation Workforces by Educational Attainment over the 2012 to 2016 Time Period
Table 39. Percentage of the Veteran and Non-Veteran, STEM and Non-STEM Occupation Workforces by Educational Attainment over the 2012 to 2016 Time Period
Percent of the Workforce Over the 2012 to
2016 Time Period
Veteran Non-Veteran Educational Attainment Non-STEM STEM Non-STEM STEM
Less Than a HSG or GED 3.02 0.50 9.10 0.82 HSG or GED 27.31 8.51 26.16 5.89
Some College but Less than a College Degree 42.20 40.00 32.80 22.95 College Degree 16.10 32.56 19.97 43.93
More Than a Bachelor’s Degree 11.36 18.43 11.96 26.41 Total 100.00 100.00 100.00 100.00
3.02
27.3
1
42.2
0
16.1
0
11.3
6
0.50
8.51
40.0
0
32.5
6
18.4
3
9.10
26.1
6 32.8
0
19.9
7
11.9
6
0.82 5.
89
22.9
5
43.9
3
26.4
1
05
101520253035404550
Less Than a HSG orGED
HSG or GED Some College butLess than a College
Degree
College Degree More Than a Bachelor’s Degree
Perc
ent o
f the
Wor
kfor
ce
Educational Attainment
Veteran, STEM Veteran, Non-STEM Non-Veteran, STEM Non-Veteran, Non-STEM

134 | P a g e
Figure 23. Percentage of the Veteran and Non-Veteran, STEM and Non-STEM Occupation Workforces by Educational Attainment over the 2012 to 2016 Time Period
3.02
0.50
9.10
0.82
27.3
1
8.51
26.1
6
5.89
42.2
0
40.0
0
32.8
0
22.9
5
16.1
0
32.5
6
19.9
7
43.9
3
05
101520253035404550
Veteran, Non-STEM Veteran, STEM Non-Veteran, Non-STEM
Non-Veteran, STEM
Perc
ent o
f the
Wor
kfor
ce
Educational Attainment
Less Than a HSG or GED HSG or GED
Some College but Less than a College Degree College Degree
More Than a Bachelor’s Degree
Table 40 presents the percent of females that comprise the STEM/Non-STEM, veteran/non-veteran workforces. Not surprising, non-veteran workforces (STEM or Non-STEM) exhibit the largest percentage of females in the workforce, though the trend is positive for veteran females (STEM and Non-STEM) over the 2012 to 2016 time period. It is also notable that over 54 percent or more of the veteran females occupy non-STEM occupations compared to STEM occupations, regardless of year; this difference is much higher for non-veterans, over 96 percent.
Table 40. Percentage of Females in the Veteran and Non-Veteran, STEM and Non-STEM Occupation Workforces over the 2012 to 2016 Time Period
Percent of Females in the Work Force
Veteran Non-Veteran
Year STEM Non-STEM Percent
Difference STEM Non-STEM Percent
Difference 2012 5.67 9.38 65.43 26.44 52.23 97.54 2013 5.41 10.11 86.88 26.26 51.90 97.64 2014 6.74 10.44 54.90 26.15 51.73 97.82 2015 6.65 10.65 60.15 26.30 51.59 96.16 2016 6.33 11.09 75.20 25.85 51.59 99.57
Trend 0.2560 0.3960 -0.7195 -0.1140 -0.1590 0.2586

135 | P a g e
Figure 24. Percentage of Females in the Veteran and Non-Veteran, STEM and Non-STEM Occupation Workforces over the 2012 to 2016Time Period
0
10
20
30
40
50
60
2012 2013 2014 2015 2016
Perc
ent o
f STE
M/N
on-S
TEM
Wor
kfor
ce
Year
Veteran, Female, STEM Veteran, Female, Non-STEM
Non-Veteran, Female, STEM Non-Veteran, Female, Non-STEM
Table 41 presents the average total personal income for male/female veterans by STEM/Non-STEM occupations. Male or female veterans in STEM occupations exhibit higher average total personal income than those in Non-STEM occupations, regardless of year. The trends in the average personal income are positive for all 4 cases. It should be noted that the trend values are relatively small across groups.
Table 41. Average Annual Total Personal Income of Veteran, Male and Female, Workers in STEM/non-STEM Occupations for the 2012 to 2016 Time Period
Veteran Male Female
Year STEM Non-STEM STEM
Non-STEM
2012 $93,477 $66,905 $75,593 $48,820 2013 $94,638 $68,257 $75,906 $49,483 2014 $92,778 $68,401 $76,458 $50,603

136 | P a g e
2015 $96,710 $70,859 $79,516 $51,493 2016 $96,892 $71,720 $81,821 $53,419
Trend $890 $1,223 $1,607 $1,121
Figure 25. Average Annual Total Personal Income of Veteran, Male and Female, Workers in STEM/non-STEM Occupations for the 2012 to 2016 Time Period
$0
$20,000
$40,000
$60,000
$80,000
$100,000
$120,000
2012 2013 2014 2015 2016
Aver
age
Tota
l Per
sona
l Inc
ome
Year
Veteran, Male. STEM Veteran, Male, Non-STEM
Veteran, Female, STEM Veteran, Female, Non-STEM
Table 42 presents the average total personal income for male/female non-veterans by STEM/Non-STEM occupations for the 2012 to 2016 time period. Male or female non-veterans in STEM occupations exhibit higher average total personal income than those in Non-STEM occupations, regardless of year. The trends in the average personal income are positive for all four (4) cases, with veteran males in STEM and Non-STEM occupations exhibiting the largest positive trends for the 2012 to 2016 time period. It should be noted that the trend values tend to be small across groups.
Table 42. Average Annual Total Personal Income of Non-Veteran, Male and Female, Workers in STEM/non-STEM Occupations for the 2012 to 2015 Time Period
Non-Veteran

137 | P a g e
Male Female
Year STEM Non-STEM STEM
Non-STEM
2012 $89,752 $56,951 $69,891 $38,443 2013 $90,697 $58,852 $70,218 $39,584 2014 $90,442 $58,840 $70,400 $39,966 2015 $93,658 $61,619 $72,372 $41,524 2016 $95,669 $62,482 $72,726 $42,468
Trend $1,480 $1,383 $782 $999
Figure 26. Average Annual Total Personal Income of Non-Veteran, Male and Female, Workers in STEM/Non-STEM Occupations for the 2012 to 2016 Time Period
$0
$20,000
$40,000
$60,000
$80,000
$100,000
$120,000
2012 2013 2014 2015 2016
Aver
age
Tota
l Per
sona
l Inc
ome
Year
Non-Vetrean, Male. STEM Non-Vetrean, Male, Non-STEM
Non-Vetrean, Female, STEM Non-Vetrean, Female, Non-STEM
Table 43 presents the distribution of STEM workers, veteran and non-veteran, by ethnicity over the 2012 to 2016 time period: Caucasian, African American, Hispanic, Asian, American Indian, Chinese or Japanese, and Other Ethnicity or Combination. Caucasians dominate both non-veteran and veteran STEM workforces, but the second largest ethnic group differs widely between veterans (African Americans at 8.11 percent) and non-veterans (Asians at 16.58 percent). The third largest ethnic group is Hispanic for veterans (at 4.55 percent) and African Americans for non-veterans (at 4.91 percent).

138 | P a g e
Table 43. Distribution of STEM, Non-Veteran, Veteran, and All Workers, by Ethnicity for the 2012 to 2016 Time Period
Percent of STEM Workforce
Ethnicity Non-
Veteran Veteran Total Caucasian 70.89 80.90 71.78 African American 4.91 8.11 5.20 Hispanic 4.79 4.55 4.77 Asian 16.58 3.27 15.39 American Indian 0.89 1.58 0.96 Chinese or Japanese 0.25 0.34 0.26 Other Ethnicity or Combination 1.69 1.24 1.65
Figure 27. Distribution of STEM, Non-Veteran and Veteran, Workers, by Ethnicity for the 2012 to 2016 Time Period
Table 44 presents the distribution of STEM workers, veteran and non-veteran, by ethnicity for workers with a college degree or more over the 2012 to 2016 time period: Caucasian, African
80.9
0
8.11
4.55
3.27
1.58
0.34 1.24
70.8
9
4.91
4.79
16.5
8
0.89
0.25 1.69
0
10
20
30
40
50
60
70
80
90
Caucasian AfricanAmerican
Hispanic Asian AmericanIndian
Chinese orJapanese
OtherEthnicity or
Combination
Perc
ent o
f STE
M W
orkf
orce
Ethnic Group
Veterans, STEM Non-Veterans, STEM

139 | P a g e
American, Hispanic, Asian, American Indian, Chinese or Japanese, and Other Ethnicity or Combination. Caucasians dominate both non-veteran and veteran STEM workforces, but the second largest ethnic group differs widely between veterans (African Americans at 7.41 percent) and non-veterans (Asians at 21.12 percent). Even the third largest ethnic group differs between veterans and non-veterans, Asian for veterans (at 4.13 percent) and African Americans for non-veterans (at 4.04 percent).
Table 44. Distribution of STEM, Non-Veteran, Veteran, and All, Workers by Ethnicity with a College Degree or More for the 2012 to 2016 Time Period
Percent of STEM Workforce
with College Degree or More
Ethnicity Non-
Veteran Veteran Total Caucasian 68.75 81.73 69.63 African American 4.04 7.41 4.27 Hispanic 3.96 4.11 3.97 Asian 21.12 4.13 19.98 American Indian 0.64 1.41 0.69 Chinese or Japanese 0.20 0.27 0.20 Other Ethnicity or Combination 1.28 0.95 1.26

140 | P a g e
Figure 28. Distribution of STEM, Non-Veteran and Veteran, Workers by Ethnicity with a College Degree or More for the 2012 to 2016 Time Period
81.7
3
7.41
4.11
4.13
1.41
0.27 0.95
68.7
5
4.04
3.96
21.1
2
0.64
0.20 1.28
0
10
20
30
40
50
60
70
80
90
Caucasian AfricanAmerican
Hispanic Asian AmericanIndian
Chinese orJapanese
OtherEthnicity or
Combination
Perc
ent o
f STE
M W
orkf
orce
Ethnic Group
Veterans, STEM Non-Veterans, STEM
Table 45 provides the average annual total personal income by ethnicity and STEM/Non-STEM occupations for veteran/non-veteran workers over the 2012 to 2016 time period. STEM workers, veteran or non-veteran, exhibit higher average total personal incomes than their Non-STEM counterparts. In addition, veterans, STEM and Non-STEM, tend to exhibit higher average total personal incomes than their non-veteran counterparts; exception, STEM, Asians (veterans compared to non-veterans.
Table 45. Average Annual Total Personal Income by Ethnicity and STEM/Non-STEM Occupations for Non-Veteran and Veteran Workers for the 2012 to 2016 Time Period
Average Annual Total Personal Income
STEM Non-STEM
Ethnicity Non-
Veteran Veteran Non-
Veteran Veteran Caucasian $87,886 $96,153 $54,958 $70,615 African American $67,815 $81,942 $35,065 $51,842 Hispanic $72,484 $83,703 $35,336 $59,282

141 | P a g e
Asian $94,358 $92,051 $55,554 $67,931 American Indian $66,770 $82,025 $35,439 $53,851 Chinese or Japanese $73,679 $91,777 $38,769 $60,135 Other Ethnicity or Combination $67,491 $77,342 $30,586 $51,274
Figure 29. Average Annual Total Personal Income by Ethnicity and STEM/Non-STEM Occupations for Non-Veteran and Veteran Workers for the 2012 to 2016 Time Period
$87,
886
$96,
153
$54,
958 $7
0,61
5
$67,
815
$81,
942
$35,
065 $5
1,84
2$72,
484
$83,
703
$35,
336 $5
9,28
2
$94,
358
$92,
051
$55,
554
$67,
931
$66,
770 $82,
025
$35,
439 $5
3,85
1$73,
679 $9
1,77
7
$38,
769 $6
0,13
5
$67,
491
$77,
342
$30,
586 $5
1,27
4
$0
$20,000
$40,000
$60,000
$80,000
$100,000
$120,000
Non-Veteran, STEM Veteran, STEM Non-Veteran, Non-STEM Veteran, Non-STEM
Aver
age
Annu
al T
otal
Pe
rson
al In
com
e
Caucasian African American Hispanic
Asian American Indian Chinese or Japanese
Other Ethnicity or Combination
Table 46 provides the average annual total personal income by ethnicity and STEM/Non-STEM occupations for veteran/non-veteran workers (over the 2012 to 2016 time period), who have a college degree or more. STEM workers, veteran or non-veteran, exhibit higher average total personal incomes than their Non-STEM counterparts. In addition, veterans, STEM and Non-STEM, exhibit higher average total personal incomes than their non-veteran counterparts.

142 | P a g e
Table 46. Average Annual Total Personal Income by Ethnicity and STEM/Non-STEM Occupations for Non-Veteran and Veteran Workers with a College Degree or More for the
2012 to 2016 Time Period
Average Annual Total Personal Income for Veterans and Non-Veterans with a College degree or More
STEM Non-STEM
Ethnicity Non-
Veteran Veteran Non-
Veteran Veteran Caucasian $98,708 $112,240 $83,487 $109,889 African American $78,523 $94,241 $58,436 $75,493 Hispanic $84,595 $98,292 $64,404 $87,079 Asian $98,548 $99,551 $79,572 $93,975 American Indian $80,102 $96,491 $59,749 $76,014 Chinese or Japanese $89,491 $109,249 $61,707 $87,427 Other Ethnicity or Combination $81,040 $85,453 $53,150 $72,968
Figure 30. Average Annual Total Personal Income by Ethnicity and STEM/Non-STEM Occupations for Non-Veteran and Veteran Workers with a College Degree or More for the
2012 to 2016 Time Period
$98,
708
$112
,240
$83,
487
$109
,889
$78,
523 $9
4,24
1
$58,
436 $7
5,49
3
$84,
595
$98,
292
$64,
404
$87,
079
$98,
548
$99,
551
$79,
572 $93,
975
$80,
102 $9
6,49
1
$59,
749 $7
6,01
4
$89,
491 $1
09,2
49
$61,
707
$87,
427
$81,
040
$85,
453
$53,
150 $7
2,96
8
$0
$20,000
$40,000
$60,000
$80,000
$100,000
$120,000
Non-Veteran, STEM Veteran, STEM Non-Veteran, Non-STEM
Veteran, Non-STEM
Aver
age
Annu
al T
otal
Per
sona
l Inc
ome
Caucasian African American
Hispanic Asian
American Indian Chinese or Japanese
Other Ethnicity or Combination

143 | P a g e
Table 47 provides the average annual total personal income by ethnicity and STEM/Non-STEM occupations for veteran/non-veteran workers (over the 2012 to 2016 time period), who have less than a college degree. STEM workers, veteran or non-veteran, exhibit higher average total personal incomes than their Non-STEM counterparts. In addition, veterans, STEM and Non-STEM, exhibit higher average total personal incomes than their non-veteran counterparts.
Table 47. Average Annual Total Personal Income by Ethnicity and STEM/Non-STEM Occupations for Non-Veteran and Veteran Workers with Less Than a College Degree for the
2012 to 2016 Time Period
Average Annual Total Personal Income for Veterans and Non-Veterans with Less Than a College degree
STEM Non-STEM
Ethnicity Non-
Veteran Veteran Non-
Veteran Veteran Caucasian $64,562 $78,621 $38,892 $54,331 African American $52,929 $70,920 $28,257 $44,336 Hispanic $55,520 $70,992 $28,988 $49,752 Asian $57,879 $78,043 $32,029 $51,820 American Indian $53,200 $69,707 $29,866 $46,905 Chinese or Japanese $54,429 $79,905 $32,584 $52,165 Other Ethnicity or Combination $51,902 $72,048 $27,473 $46,209
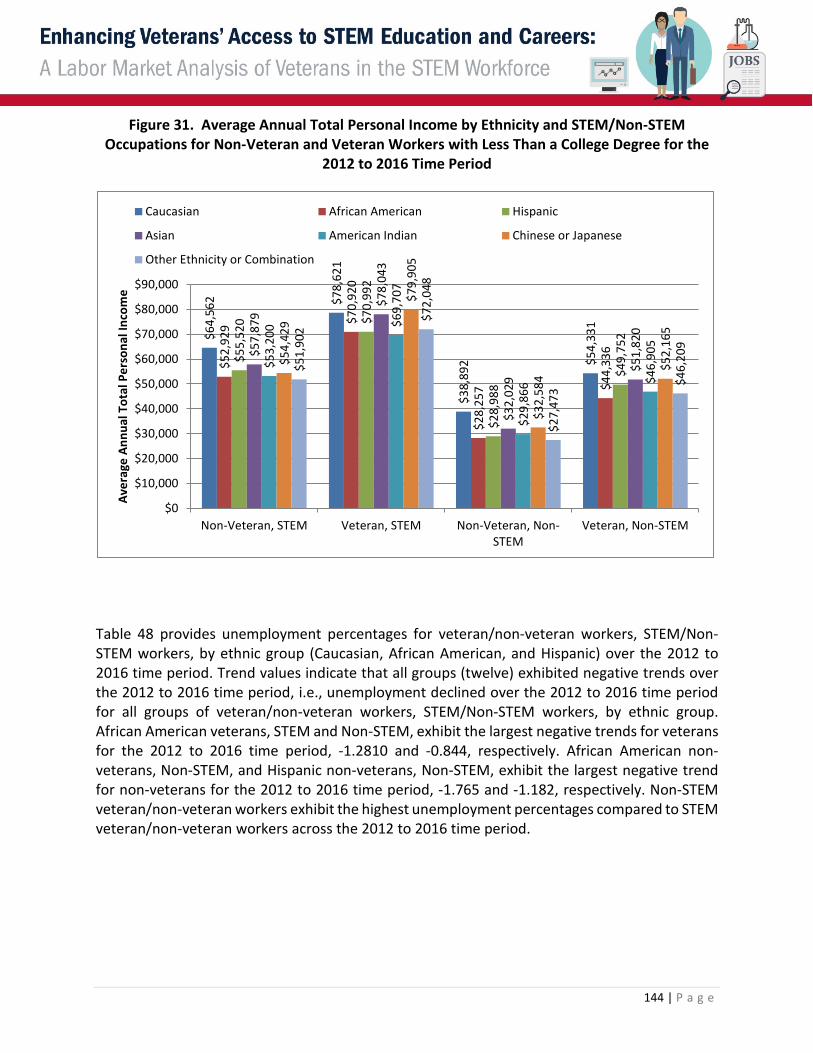
144 | P a g e
Figure 31. Average Annual Total Personal Income by Ethnicity and STEM/Non-STEM Occupations for Non-Veteran and Veteran Workers with Less Than a College Degree for the
2012 to 2016 Time Period
$64,
562 $7
8,62
1
$38,
892 $5
4,33
1
$52,
929 $7
0,92
0
$28,
257 $4
4,33
6
$55,
520 $7
0,99
2
$28,
988
$49,
752
$57,
879
$78,
043
$32,
029
$51,
820
$53,
200 $6
9,70
7
$29,
866 $4
6,90
5
$54,
429
$79,
905
$32,
584
$52,
165
$51,
902
$72,
048
$27,
473
$46,
209
$0
$10,000
$20,000
$30,000
$40,000
$50,000
$60,000
$70,000
$80,000
$90,000
Non-Veteran, STEM Veteran, STEM Non-Veteran, Non-STEM
Veteran, Non-STEM
Aver
age
Annu
al T
otal
Per
sona
l Inc
ome
Caucasian African American Hispanic
Asian American Indian Chinese or Japanese
Other Ethnicity or Combination
Table 48 provides unemployment percentages for veteran/non-veteran workers, STEM/Non-STEM workers, by ethnic group (Caucasian, African American, and Hispanic) over the 2012 to 2016 time period. Trend values indicate that all groups (twelve) exhibited negative trends over the 2012 to 2016 time period, i.e., unemployment declined over the 2012 to 2016 time period for all groups of veteran/non-veteran workers, STEM/Non-STEM workers, by ethnic group. African American veterans, STEM and Non-STEM, exhibit the largest negative trends for veterans for the 2012 to 2016 time period, -1.2810 and -0.844, respectively. African American non-veterans, Non-STEM, and Hispanic non-veterans, Non-STEM, exhibit the largest negative trend for non-veterans for the 2012 to 2016 time period, -1.765 and -1.182, respectively. Non-STEM veteran/non-veteran workers exhibit the highest unemployment percentages compared to STEM veteran/non-veteran workers across the 2012 to 2016 time period.

145 | P a g e
Table 48. Unemployed Percentages by Ethnicity of STEM/Non-STEM, Non-Veteran and Veteran, Workers for the 2012 to 2016 Time Period
Veteran African American Hispanic Caucasian
Year Non-STEM STEM
Non-STEM STEM Non-STEM STEM
2012 11.75 7.22 8.36 6.56 7.30 4.96 2013 10.80 5.21 7.86 2.85 6.54 4.03 2014 9.29 5.71 6.66 2.96 5.16 3.94 2015 7.87 4.11 5.43 3.17 4.59 3.29 2016 6.81 3.55 5.49 3.97 4.17 2.37
Trend -1.2810 -0.8440 -0.8170 -0.4860 -0.8210 -0.5920
Non-Veteran African American Hispanic Caucasian
Year Non-STEM STEM
Non-STEM STEM Non-STEM STEM
2012 16.90 7.16 10.88 4.68 7.17 3.42 2013 15.04 6.11 9.56 4.09 6.39 3.14 2014 13.06 5.22 8.03 3.67 5.44 2.76 2015 11.27 4.76 6.94 3.25 4.71 2.37 2016 9.96 4.36 6.28 3.18 4.29 2.39
Trend -1.7650 -0.6950 -1.1820 -0.3840 -0.7440 -0.2830
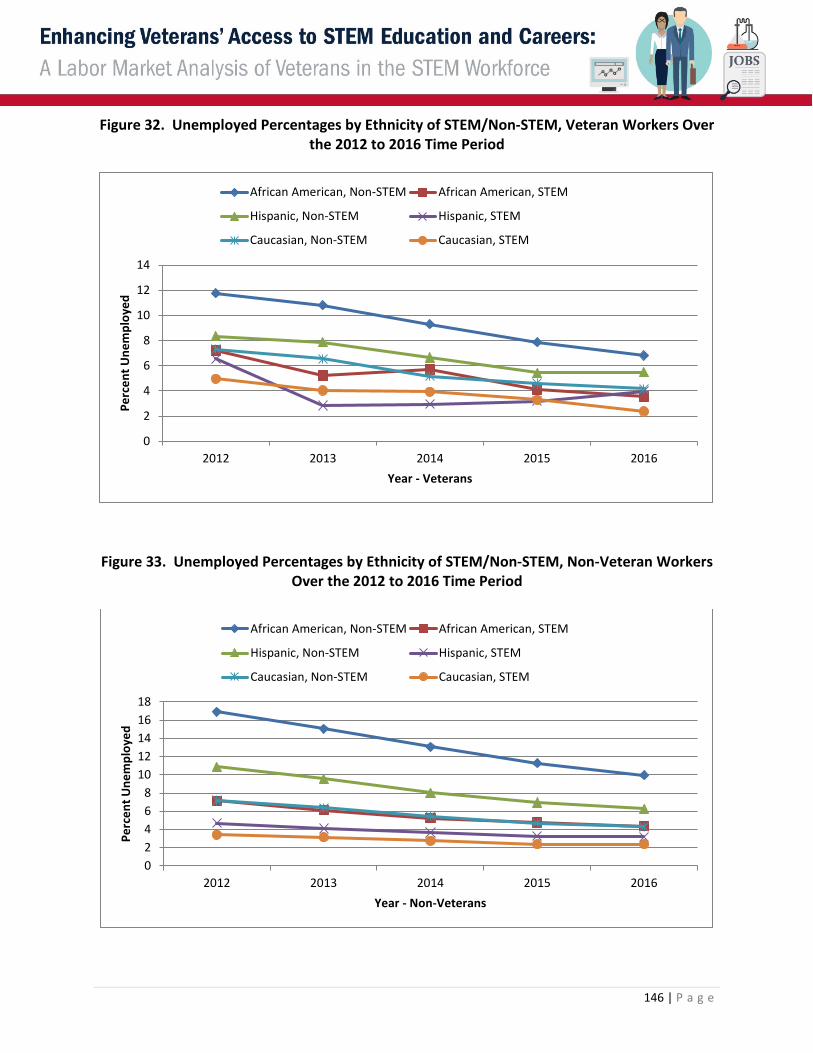
146 | P a g e
Figure 32. Unemployed Percentages by Ethnicity of STEM/Non-STEM, Veteran Workers Over the 2012 to 2016 Time Period
0
2
4
6
8
10
12
14
2012 2013 2014 2015 2016
Perc
ent U
nem
ploy
ed
Year - Veterans
African American, Non-STEM African American, STEM
Hispanic, Non-STEM Hispanic, STEM
Caucasian, Non-STEM Caucasian, STEM
Figure 33. Unemployed Percentages by Ethnicity of STEM/Non-STEM, Non-Veteran Workers Over the 2012 to 2016 Time Period
02468
1012141618
2012 2013 2014 2015 2016
Perc
ent U
nem
ploy
ed
Year - Non-Veterans
African American, Non-STEM African American, STEM
Hispanic, Non-STEM Hispanic, STEM
Caucasian, Non-STEM Caucasian, STEM

147 | P a g e
Table 49 provides unemployment percentages for veteran/non-veteran, STEM/Non-STEM workers, by ethnic group (Caucasian, African American, and Hispanic), age 18 to 35, over the 2012 to 2016 time period. Trend values indicate that all twelve groups exhibit a negative trend (decline) in unemployment over the 2012 to 2016 time period. African American veterans, STEM and Non-STEM, exhibit the largest negative trend values for veterans for the 2012 to 2016 time period, -3.056 and -1.725, respectively. African American and Hispanic, non-veterans, Non-STEM, exhibit the largest negative trend values for non-veterans for the 2012 to 2016 time period, -2.469 and -1.454, respectively. Non-STEM veteran/non-veteran workers exhibit the highest unemployment percentages compared to STEM veteran/non-veteran workers across the 2012 to 2016 time period.
Table 49. Unemployed Percentages by Ethnicity of STEM/Non-STEM, Non-Veteran and Veteran Workers of Ages Greater Than and Equal to 18 and Less Than and Equal to 35 for the
2012 to 2016 Time Period
Veteran African American Hispanic Caucasian
Year STEM Non-STEM STEM
Non-STEM STEM Non-STEM
2012 15.60 17.29 7.14 12.42 4.82 10.88 2013 6.59 15.48 1.69 10.38 3.73 10.17 2014 7.29 13.96 1.16 9.31 4.40 8.67 2015 2.35 11.09 2.60 7.54 4.48 6.83 2016 2.44 10.86 2.25 8.47 1.42 6.20
Trend -3.056 -1.725 -0.887 -1.074 -0.605 -1.270
Non-Veteran African American Hispanic Caucasian
Year STEM Non-STEM STEM
Non-STEM STEM Non-STEM
2012 7.63 24.00 4.84 14.08 3.03 10.08 2013 7.19 21.46 3.93 12.21 2.76 9.19 2014 6.33 18.78 3.61 10.42 2.75 7.99 2015 4.85 16.25 3.27 9.13 2.32 7.02 2016 5.60 14.26 3.80 8.35 2.32 6.32
Trend -0.640 -2.469 -0.274 -1.454 -0.186 -0.969

148 | P a g e
Figure 34. Unemployed Percentages by Ethnicity of STEM/Non-STEM, Veteran Workers of Ages Greater Than and Equal to 18 and Less Than and Equal to 35 Over the 2012 to 2016 Time
Period
02468
101214161820
2012 2013 2014 2015 2016
Perc
ent U
nem
ploy
ed
Year - Veterans
African American, Non-STEM African American, STEM
Hispanic, Non-STEM Hispanic, STEM
Caucasian, Non-STEM Caucasian, STEM
Figure 35. Unemployed Percentages by Ethnicity of STEM/Non-STEM, Non-Veteran Workers of Ages Greater Than and Equal to 18 and Less Than and Equal to 35 Over the 2012 to 2016
Time Period

149 | P a g e
0
5
10
15
20
25
30
2012 2013 2014 2015 2016
Perc
ent U
nem
ploy
ed
Year - Non-Veterans
African American, Non-STEM African American, STEM
Hispanic, Non-STEM Hispanic, STEM
Caucasian, Non-STEM Caucasian, STEM

150 | P a g e
Veteran STEM – Employment Characteristics by States
Table 50 provides rankings by state based on the percent of the national STEM workforce for the veteran workforce and the non-veteran workforce, over the 2012 to 2016 time period. In addition, average total annual personal income is provided by state for STEM and Non-STEM veterans (and sorted by highest to lowest average personal income by state). California and Texas rank one (1) and two (2) for veterans’ and non-veterans’ percentage of the STEM workforce. Virginia and District of Columbia rank one (1) and two (2) for veterans’ average total personal income, STEM and Non-STEM. District of Columbia, Virginia, Maryland, New Jersey, Massachusetts, and California rank in the top ten states with respect to average total personal income for STEM and Non-STEM occupations.
Table 50. Rankings by Percent of Workforce of STEM, Non-Veteran and Veteran, Workers by State and Across States for the 2012 to 2016 Time Period
U.S. STEM Workforce over the States Average Total Annual Personal Income
Veterans Percent Non-Veterans Percent Veterans STEM Veterans Non- STEM
California 9.63 California 14.76 Virginia $120,263 District Of Columbia $107,107
Texas 9.25 Texas 8.08 District Of Columbia $119,456 Virginia $86,534
Virginia 8.30 New York 5.53 Maryland $118,393 Connecticut $86,239 Florida 6.54 Florida 4.45 New Jersey $107,487 Maryland $86,077 Maryland 4.23 Illinois 4.16 Connecticut $105,000 New Jersey $82,874
North Carolina 3.52 Virginia 3.84 New Hampshire $103,794 Massachusetts $77,603
Georgia 3.47 New Jersey 3.83 New Mexico $101,702 California $77,401 Washington 3.27 Pennsylvania 3.79 Massachusetts $100,615 Rhode Island $74,043 Colorado 3.25 Massachusetts 3.73 Colorado $99,517 Hawaii $72,659 Pennsylvania 3.20 Ohio 3.34 California $99,338 Alaska $72,268 Ohio 3.14 Maryland 3.24 Alabama $95,266 Washington $70,870 New York 3.03 Washington 3.16 Texas $95,172 Texas $70,384 Illinois 2.78 Michigan 3.08 Washington $94,206 New York $70,258 Arizona 2.75 North Carolina 2.93 Hawaii $92,897 Colorado $69,153 Michigan 2.26 Georgia 2.82 Arizona $91,011 Utah $68,557
Tennessee 1.93 Colorado 2.49 New York $90,251 New Hampshire $68,529
Massachusetts 1.83 Arizona 1.97 West Virginia $89,294 Florida $66,825 Alabama 1.82 Minnesota 1.79 Alaska $88,609 Delaware $66,791 New Jersey 1.75 Wisconsin 1.64 Kentucky $88,478 Nevada $66,429

151 | P a g e
South Carolina 1.75 Indiana 1.61 Georgia $88,342 Alabama $65,587 Oregon 1.61 Missouri 1.55 Delaware $88,146 Georgia $65,549 Missouri 1.59 Connecticut 1.51 Illinois $88,139 North Dakota $65,357 Indiana 1.45 Tennessee 1.49 North Carolina $87,743 Illinois $65,307 Minnesota 1.40 Oregon 1.45 Oklahoma $87,555 Louisiana $65,218 Wisconsin 1.33 South Carolina 1.10 Louisiana $86,945 Tennessee $64,394 Connecticut 1.11 Utah 1.10 Florida $86,781 Arizona $63,932 Oklahoma 1.00 Alabama 1.07 Rhode Island $86,452 South Carolina $62,311 Louisiana 0.99 Louisiana 0.95 Nebraska $86,302 North Carolina $62,064 Kentucky 0.98 Kentucky 0.93 Tennessee $86,119 Pennsylvania $61,398 Nevada 0.96 Kansas 0.77 Pennsylvania $85,566 New Mexico $61,302 Utah 0.82 Iowa 0.76 South Carolina $84,614 Minnesota $61,230 Kansas 0.81 Oklahoma 0.64 Oregon $84,553 Wyoming $61,224 New Mexico 0.80 New Hampshire 0.61 Missouri $83,895 Oklahoma $60,535 New Hampshire 0.78 New Mexico 0.53 Mississippi $83,886 Nebraska $60,517 Nebraska 0.70 Nevada 0.51 Nevada $82,459 Kentucky $60,321 Hawaii 0.66 Arkansas 0.49 Utah $82,040 Oregon $60,259 Iowa 0.63 Nebraska 0.45 Minnesota $81,512 Kansas $59,950
Mississippi 0.62 District Of Columbia 0.42 Idaho $81,107 Montana $58,605
Arkansas 0.57 Mississippi 0.41 Kansas $80,879 Ohio $58,599 Idaho 0.54 Idaho 0.39 Michigan $80,694 Idaho $58,435 West Virginia 0.49 Hawaii 0.34 North Dakota $80,517 Mississippi $58,165 Maine 0.36 Rhode Island 0.34 Ohio $80,099 Vermont $57,988 Rhode Island 0.36 Delaware 0.33 Vermont $78,920 West Virginia $57,530 Delaware 0.31 West Virginia 0.33 Maine $78,096 Michigan $56,862 Montana 0.26 Maine 0.30 Wyoming $76,460 Wisconsin $56,705 District Of Columbia 0.25 Montana 0.23 Iowa $74,926 Indiana $56,120 Alaska 0.24 Vermont 0.21 Indiana $73,394 Missouri $56,065 Wyoming 0.18 South Dakota 0.16 Montana $73,371 Iowa $55,950 Vermont 0.17 Alaska 0.15 South Dakota $72,707 Arkansas $55,066 South Dakota 0.16 North Dakota 0.15 Wisconsin $72,636 South Dakota $54,717 North Dakota 0.15 Wyoming 0.12 Arkansas $71,183 Maine $54,452
Table 51 provides the percent of the total veteran STEM workforce by state by year, ranked from highest to lowest “Total” percentage (the total percentage of the veteran workforce by state for the total 2012 to 2016 time period). A trend value is calculated for each state indicating whether the percent of the total veteran STEM workforce for the state increased or decreased over the

152 | P a g e
2012 to 2016 time period. For example, California exhibited a trend value of -0.229, the percent of the total STEM workforce in the state of California decreased by 0.229 percentage points each year over the 2012 to 2016 time period.
California also exhibited the highest total percent of the U.S. veteran STEM workforce for the 2012 to 2016 time period, 9.63 percent of the U.S. veteran STEM workforce. California was followed by Texas (9.25 percent), Virginia (8.30 percent), and Florida (6.54 percent). In fact, the top four states in the U.S. in terms of their percentage of the U.S. veteran STEM workforce were each more than 54 percent higher than the fifth highest state (Maryland), a significantly sizable decline.
It should be noted that the states with some of the largest percentages of the U.S. veteran STEM workforce were not always the states that reflected a positive growth over the 2012 to 2016 time period. For example, California exhibits the highest percentage of the U.S. veteran STEM workforce (Total) but also reflects a negative growth rate for the 2012 to 2016 time period, declining 0.229 percentage points per year. In comparison, the state of Texas not only exhibits a high percentage of the U.S. veteran STEM workforce, 9.25 percent (Total), but also reflects a positive growth rate for the 2012 to 2016 time period, increasing 0.245 percentage points per year.
Table 51. Percent of the Veteran STEM Workforce, by State, by Year, over the 2012 to 2016 Time Period
Percent of Total Veteran STEM Workforce – Sorted by Total
Percentage for the 2012 to 2016 Time Period Year
Veterans 2012 2013 2014 2015 2016 Total Trend California 10.09 9.81 9.62 9.44 9.13 9.63 -0.229 Texas 8.67 9.06 9.32 9.67 9.59 9.25 0.245 Virginia 8.67 7.85 8.26 8.82 7.93 8.30 -0.051 Florida 6.11 6.31 6.61 6.73 6.99 6.54 0.218 Maryland 4.55 4.50 3.84 3.72 4.51 4.23 -0.086 North Carolina 3.76 3.47 3.51 3.59 3.26 3.52 -0.088 Georgia 3.23 3.76 3.60 3.53 3.23 3.47 -0.023 Washington 3.04 3.08 3.46 3.59 3.21 3.27 0.085 Colorado 3.24 3.22 3.22 3.04 3.49 3.25 0.032 Pennsylvania 3.24 3.39 3.22 3.05 3.07 3.20 -0.068 Ohio 2.97 3.26 3.14 3.21 3.10 3.14 0.021 New York 3.01 3.12 3.10 2.88 3.04 3.03 -0.018 Illinois 2.88 2.99 2.79 2.59 2.63 2.78 -0.090 Arizona 2.70 2.96 2.66 2.99 2.45 2.75 -0.047 Michigan 2.54 2.26 2.31 2.01 2.16 2.26 -0.101 Tennessee 1.65 1.80 1.91 2.26 2.08 1.93 0.132

153 | P a g e
Massachusetts 1.66 2.15 1.83 1.74 1.79 1.83 -0.015 Alabama 1.91 1.97 1.63 1.69 1.91 1.82 -0.028 New Jersey 1.92 1.63 1.88 1.53 1.77 1.75 -0.040 South Carolina 1.89 1.55 1.56 1.86 1.87 1.75 0.027 Oregon 1.70 1.48 1.54 1.50 1.83 1.61 0.028 Missouri 1.60 1.52 1.72 1.41 1.73 1.59 0.015 Indiana 1.56 1.48 1.26 1.53 1.43 1.45 -0.021 Minnesota 1.41 1.44 1.20 1.49 1.45 1.40 0.013 Wisconsin 1.43 1.22 1.42 1.31 1.28 1.33 -0.021 Connecticut 1.13 1.08 1.24 1.05 1.05 1.11 -0.019 Oklahoma 0.92 0.97 0.99 1.04 1.11 1.00 0.045 Louisiana 0.90 0.93 0.97 1.02 1.11 0.99 0.051 Kentucky 1.09 0.98 0.92 0.92 0.97 0.98 -0.030 Nevada 0.75 0.93 1.08 0.97 1.09 0.96 0.072 Utah 0.79 0.79 0.85 0.89 0.80 0.82 0.012 Kansas 0.98 0.66 0.79 0.97 0.63 0.81 -0.039 New Mexico 0.74 0.96 0.83 0.80 0.71 0.80 -0.022 New Hampshire 0.71 0.70 0.95 0.76 0.81 0.78 0.026 Nebraska 0.73 0.65 0.83 0.57 0.72 0.70 -0.010 Hawaii 0.57 0.73 0.70 0.69 0.60 0.66 0.002 Iowa 0.63 0.70 0.71 0.54 0.59 0.63 -0.024 Mississippi 0.60 0.66 0.55 0.54 0.76 0.62 0.020 Arkansas 0.63 0.52 0.54 0.57 0.60 0.57 -0.001 Idaho 0.45 0.54 0.47 0.58 0.65 0.54 0.044 West Virginia 0.48 0.42 0.53 0.56 0.48 0.49 0.014 Maine 0.34 0.41 0.35 0.31 0.41 0.36 0.004 Rhode Island 0.41 0.43 0.33 0.24 0.37 0.36 -0.027 Delaware 0.28 0.31 0.35 0.41 0.20 0.31 -0.006 Montana 0.25 0.24 0.32 0.23 0.29 0.26 0.007 District Of Columbia 0.25 0.27 0.25 0.19 0.31 0.25 0.004 Alaska 0.36 0.17 0.24 0.24 0.18 0.24 -0.029 Wyoming 0.17 0.19 0.11 0.23 0.18 0.18 0.006 Vermont 0.21 0.15 0.17 0.20 0.13 0.17 -0.011 South Dakota 0.12 0.18 0.17 0.19 0.16 0.16 0.009 North Dakota 0.10 0.17 0.17 0.16 0.18 0.15 0.015
Table 52 provides the percent of the total non-veteran STEM workforce by state by year, ranked from highest to lowest “Total” percentage (the total percentage of the veteran workforce by

154 | P a g e
state for the total 2012 to 2016 time period). A trend value is calculated for each state indicating whether the percent of the total non-veteran STEM workforce for the state increased or decreased over the 2012 to 2016 time period. For example, California exhibited a trend value of 0.060, the percent of the total STEM workforce in the state of California increased by 0.060 percentage points each year over the 2012 to 2016 time period. California also exhibited the highest total percent of the U.S. non-veteran STEM workforce for the 2012 to 2016 time period, 14.76 percent of the U.S. non-veteran STEM workforce. California was followed by Texas (8.08 percent), New York (5.53 percent), and Florida (4.45 percent).
Table 52. Percent of the Non-Veteran STEM Workforce, by State, by Year, over the 2012 to 2016 Time Period
Percent of Total Non-Veteran STEM Workforce – Sorted by
Total Percentage for the 2012 to 2016 Time Period Year
Non-Veterans 2012 2013 2014 2015 2016 Total Trend California 14.81 14.54 14.68 14.76 15.00 14.76 0.060 Texas 7.61 8.09 8.10 8.37 8.17 8.08 0.140 New York 5.63 5.55 5.48 5.49 5.52 5.53 -0.028 Florida 4.37 4.36 4.57 4.50 4.44 4.45 0.028 Illinois 4.18 4.17 4.19 4.19 4.05 4.16 -0.024 Virginia 3.94 3.83 3.98 3.77 3.71 3.84 -0.052 New Jersey 3.90 3.87 3.82 3.80 3.75 3.83 -0.037 Pennsylvania 3.94 3.87 3.79 3.71 3.68 3.79 -0.068 Massachusetts 3.64 3.76 3.78 3.67 3.76 3.73 0.015 Ohio 3.20 3.35 3.40 3.34 3.40 3.34 0.039 Maryland 3.50 3.18 3.19 3.20 3.14 3.24 -0.070 Washington 3.28 3.13 3.00 3.20 3.21 3.16 -0.007 Michigan 3.09 3.07 3.01 3.07 3.14 3.08 0.010 North Carolina 2.91 2.93 2.94 3.03 2.83 2.93 -0.006 Georgia 2.72 2.77 2.81 2.91 2.84 2.82 0.038 Colorado 2.45 2.48 2.41 2.54 2.55 2.49 0.026 Arizona 2.00 2.10 1.96 1.87 1.94 1.97 -0.035 Minnesota 1.76 1.84 1.79 1.72 1.83 1.79 0.002 Wisconsin 1.70 1.60 1.64 1.61 1.69 1.64 -0.001 Indiana 1.58 1.67 1.69 1.55 1.55 1.61 -0.018 Missouri 1.55 1.51 1.48 1.63 1.56 1.55 0.014 Connecticut 1.61 1.55 1.47 1.43 1.49 1.51 -0.036 Tennessee 1.47 1.48 1.45 1.53 1.51 1.49 0.013 Oregon 1.43 1.45 1.43 1.43 1.50 1.45 0.012 South Carolina 1.06 1.10 1.17 1.09 1.08 1.10 0.003

155 | P a g e
Utah 1.06 1.11 1.07 1.09 1.14 1.10 0.014 Alabama 1.04 1.12 1.06 1.05 1.05 1.07 -0.005 Louisiana 0.94 0.95 0.97 0.96 0.91 0.95 -0.005 Kentucky 0.87 0.95 0.96 0.91 0.95 0.93 0.012 Kansas 0.76 0.77 0.78 0.77 0.79 0.77 0.006 Iowa 0.77 0.73 0.83 0.76 0.73 0.76 -0.005 Oklahoma 0.65 0.69 0.61 0.65 0.61 0.64 -0.012 New Hampshire 0.62 0.59 0.59 0.63 0.59 0.61 -0.002 New Mexico 0.59 0.55 0.51 0.47 0.51 0.53 -0.024 Nevada 0.49 0.54 0.49 0.50 0.54 0.51 0.006 Arkansas 0.48 0.50 0.55 0.48 0.45 0.49 -0.008 Nebraska 0.44 0.44 0.45 0.44 0.48 0.45 0.008 District Of Columbia 0.40 0.40 0.41 0.46 0.44 0.42 0.014 Mississippi 0.42 0.40 0.41 0.45 0.39 0.41 -0.001 Idaho 0.38 0.40 0.40 0.36 0.41 0.39 0.002 Hawaii 0.36 0.32 0.34 0.33 0.34 0.34 -0.003 Rhode Island 0.32 0.35 0.32 0.34 0.36 0.34 0.007 Delaware 0.33 0.32 0.33 0.34 0.31 0.33 -0.002 West Virginia 0.32 0.35 0.34 0.32 0.32 0.33 -0.003 Maine 0.31 0.27 0.30 0.29 0.32 0.30 0.004 Montana 0.24 0.23 0.22 0.24 0.21 0.23 -0.005 Vermont 0.22 0.18 0.19 0.22 0.21 0.21 0.002 South Dakota 0.19 0.14 0.16 0.15 0.16 0.16 -0.005 Alaska 0.18 0.15 0.16 0.14 0.15 0.15 -0.007 North Dakota 0.14 0.15 0.17 0.15 0.16 0.15 0.004 Wyoming 0.14 0.12 0.12 0.10 0.11 0.12 -0.008
Table 53 provides the average total annual personal income for veteran STEM workforce by state by year, sorted by the total average total annual personal income for the complete time period, 2012 to 2016 (Total column). A trend value is calculated for each state indicating whether the average total personal income for the STEM workforce in the state increased or decreased over the 2012 to 2016 time period. For example, District of Columbia exhibited a trend value of -$6,414, the average total personal income of the STEM workforce in the District of Columbia decreased by $6,414 each year over the 2012 to 2016 time period. Thirty-six (36) of the 51 states exhibited positive trend values; the average total annual personal income for veteran STEM workers within the state grew (in nominal dollars) over the 2012 to 2016 time period. The states exhibiting the highest positive trend values (positive growth in their average total annual personal income for veteran STEM workers) were North Dakota, Connecticut, Wisconsin, Maine,

156 | P a g e
West Virginia, Rhode Island, Nevada, Oklahoma, Tennessee, and South Carolina (in order of size of growth).
Table 53. Average Annual Total Personal Income of the Veteran STEM Workforce, by State, by Year, over the 2012 to 2016 Time Period
Average Annual Total Personal Income – Sorted by Total Income
for the 2012 to 2016 Time Period Veterans Year
STEM 2012 2013 2014 2015 2016 Total Trend Virginia $119,782 $122,384 $119,030 $121,945 $118,107 $120,263 -$379 District Of Columbia $135,991 $119,112 $123,209 $110,529 $108,213 $119,456 -$6,414 Maryland $121,861 $115,315 $112,921 $119,279 $121,695 $118,393 $363 New Jersey $112,265 $109,014 $91,550 $117,942 $108,273 $107,487 $94 Connecticut $89,780 $111,539 $100,400 $111,276 $114,843 $105,000 $4,986 New Hampshire $105,990 $99,598 $113,092 $98,645 $99,364 $103,794 -$1,420 New Mexico $94,820 $102,301 $95,954 $113,112 $102,319 $101,702 $2,581 Massachusetts $101,943 $100,034 $92,964 $107,455 $101,373 $100,615 $628 Colorado $96,114 $102,429 $99,213 $100,780 $99,345 $99,517 $481 California $96,808 $100,705 $98,633 $102,650 $98,165 $99,338 $466 Alabama $96,737 $98,357 $90,389 $100,780 $89,715 $95,266 -$1,162 Texas $92,867 $91,478 $95,780 $96,448 $99,105 $95,172 $1,745 Washington $94,834 $92,634 $89,351 $92,631 $102,020 $94,206 $1,437 Hawaii $84,035 $98,989 $88,661 $101,445 $89,429 $92,897 $1,324 Arizona $90,854 $88,454 $86,983 $96,569 $92,141 $91,011 $1,069 New York $91,536 $89,920 $82,355 $98,115 $89,999 $90,251 $512 West Virginia $77,709 $80,465 $100,573 $93,023 $92,955 $89,294 $4,305 Alaska $77,909 $120,420 $76,994 $95,213 $87,679 $88,609 -$567 Kentucky $87,589 $85,798 $84,038 $82,764 $101,865 $88,478 $2,552 Georgia $85,261 $88,374 $85,557 $88,840 $94,102 $88,342 $1,815 Delaware $90,502 $98,424 $84,428 $81,783 $87,934 $88,146 -$2,178 Illinois $83,533 $87,260 $87,840 $93,620 $89,506 $88,139 $1,831 North Carolina $79,964 $88,542 $90,134 $90,026 $91,301 $87,743 $2,416 Oklahoma $74,985 $94,618 $79,693 $94,049 $93,309 $87,555 $3,608 Louisiana $96,994 $90,705 $83,596 $88,935 $76,238 $86,945 -$4,328 Florida $88,247 $85,388 $84,384 $84,536 $91,081 $86,781 $482 Rhode Island $72,881 $97,907 $74,540 $99,660 $90,684 $86,452 $3,736 Nebraska $88,502 $79,878 $82,410 $97,552 $85,601 $86,302 $1,187 Tennessee $75,968 $83,553 $84,518 $96,186 $87,525 $86,119 $3,575 Pennsylvania $82,860 $88,099 $85,923 $86,539 $84,414 $85,566 $155 South Carolina $78,817 $85,096 $79,361 $85,923 $93,463 $84,614 $3,012

157 | P a g e
Oregon $81,740 $80,273 $84,739 $82,826 $92,112 $84,553 $2,330 Missouri $80,324 $89,117 $75,621 $87,737 $87,707 $83,895 $1,339 Mississippi $80,963 $80,143 $90,513 $81,551 $86,610 $83,886 $1,270 Nevada $80,901 $69,838 $85,825 $78,688 $94,819 $82,459 $3,669 Utah $80,263 $85,250 $83,012 $78,161 $83,868 $82,040 $12 Minnesota $86,657 $83,692 $74,286 $84,112 $77,353 $81,512 -$1,819 Idaho $82,690 $73,266 $81,799 $68,585 $97,060 $81,107 $2,406 Kansas $80,293 $77,574 $88,987 $79,675 $77,108 $80,879 -$427 Michigan $78,459 $80,004 $80,994 $80,081 $84,506 $80,694 $1,217 North Dakota $71,268 $78,393 $70,615 $75,834 $100,982 $80,517 $5,687 Ohio $84,671 $77,282 $78,808 $79,067 $80,786 $80,099 -$599 Vermont $70,482 $97,723 $61,094 $94,695 $70,215 $78,920 -$356 Maine $69,991 $78,661 $72,378 $67,093 $97,975 $78,096 $4,440 Wyoming $75,315 $75,825 $101,818 $68,430 $73,545 $76,460 -$1,093 Iowa $72,783 $77,407 $75,065 $75,310 $73,756 $74,926 -$15 Indiana $73,901 $71,741 $72,464 $73,137 $75,656 $73,394 $491 Montana $84,664 $77,516 $72,358 $64,368 $68,386 $73,371 -$4,570 South Dakota $76,190 $77,983 $74,946 $63,183 $72,337 $72,707 -$2,251 Wisconsin $67,489 $65,102 $70,918 $74,004 $86,548 $72,636 $4,702 Arkansas $65,623 $80,220 $65,313 $67,779 $77,705 $71,183 $1,172
Table 54 provides the average total annual personal income for the veteran Non-STEM workforce by state by year, sorted by the total average total annual personal income for the complete time period, 2012 to 2016 (Total column). A trend value is calculated for each state indicating whether the average total personal income for the veteran Non-STEM workforce in the state increased or decreased over the 2012 to 2016 time period. For example, District of Columbia exhibited a trend value of -$1,112, the average total personal income of the Non-STEM workforce in the District of Columbia decreased by $1,112 each year over the 2012 to 2016 time period. Only one (1) of the 51 states exhibited a negative trend value (District of Columbia); the average total personal income for veteran Non-STEM workers within the state declined (in nominal dollars) over the 2012 to 2016 time period. The states exhibiting the highest positive trend values (positive growth in their average total personal income for veteran Non-STEM workers) were New Hampshire, South Dakota, Delaware, Maine, Hawaii, Kentucky, Utah, South Carolina, Alaska, and North Carolina.

158 | P a g e
Table 54. Average Annual Total Personal Income of the Veteran Non-STEM Workforce, by State, by Year, over the 2012 to 2016 Time Period
Average Total Annual Personal Income – Sorted by Total
Income for the 2012 to 2016 Time Period Veteran Year
Non-STEM 2012 2013 2014 2015 2016 Total Trend District Of Columbia $95,377 $134,138 $92,640 $117,004 $98,384 $107,107 -$1,112 Virginia $85,214 $85,867 $84,677 $87,458 $89,740 $86,534 $1,064 Connecticut $83,529 $87,543 $85,150 $90,078 $85,640 $86,239 $676 Maryland $84,389 $86,924 $80,729 $89,554 $89,471 $86,077 $1,279 New Jersey $79,462 $81,019 $84,024 $86,467 $84,745 $82,874 $1,601 Massachusetts $73,285 $76,586 $80,746 $78,472 $80,172 $77,603 $1,566 California $76,312 $75,694 $76,544 $80,851 $78,025 $77,401 $858 Rhode Island $67,392 $78,817 $75,929 $70,306 $79,094 $74,043 $1,489 Hawaii $68,960 $69,727 $71,087 $79,190 $75,263 $72,659 $2,207 Alaska $68,938 $69,452 $74,704 $72,709 $76,217 $72,268 $1,781 Washington $69,140 $70,076 $70,008 $72,643 $72,757 $70,870 $980 Texas $68,028 $69,788 $70,385 $71,733 $72,329 $70,384 $1,055 New York $70,716 $67,782 $68,371 $72,290 $72,408 $70,258 $789 Colorado $69,174 $69,648 $67,881 $68,297 $70,761 $69,153 $182 Utah $61,064 $69,145 $74,735 $67,587 $71,810 $68,557 $1,993 New Hampshire $64,586 $62,870 $67,805 $73,993 $74,321 $68,529 $3,059 Florida $64,288 $66,402 $64,988 $69,295 $69,614 $66,825 $1,355 Delaware $66,460 $62,143 $63,842 $65,956 $77,753 $66,791 $2,640 Nevada $65,114 $66,865 $66,322 $66,372 $67,742 $66,429 $476 Alabama $63,678 $63,527 $64,456 $69,391 $67,771 $65,587 $1,405 Georgia $65,495 $65,380 $63,783 $64,205 $68,884 $65,549 $560 North Dakota $64,287 $64,434 $67,880 $64,975 $65,619 $65,357 $321 Illinois $62,407 $64,929 $65,472 $67,078 $67,582 $65,307 $1,250 Louisiana $63,618 $63,754 $64,985 $65,237 $69,093 $65,218 $1,243 Tennessee $62,040 $64,269 $63,815 $64,895 $67,371 $64,394 $1,129 Arizona $63,611 $62,009 $64,767 $63,568 $65,864 $63,932 $607 South Carolina $59,158 $60,848 $61,068 $64,129 $66,810 $62,311 $1,858 North Carolina $59,445 $59,422 $62,532 $63,667 $65,910 $62,064 $1,717 Pennsylvania $60,972 $58,570 $60,972 $62,832 $64,147 $61,398 $1,061 New Mexico $60,645 $63,166 $60,041 $58,534 $64,179 $61,302 $244 Minnesota $60,907 $59,654 $60,182 $62,321 $63,452 $61,230 $776 Wyoming $59,656 $61,852 $61,291 $65,089 $58,219 $61,224 $36 Oklahoma $57,289 $60,724 $60,853 $64,413 $59,888 $60,535 $889

159 | P a g e
Nebraska $55,408 $62,734 $60,947 $62,961 $61,539 $60,517 $1,249 Kentucky $58,186 $59,322 $57,317 $59,804 $68,168 $60,321 $2,045 Oregon $57,017 $61,066 $60,503 $60,497 $62,838 $60,259 $1,107 Kansas $57,579 $58,830 $61,368 $59,983 $62,730 $59,950 $1,146 Montana $54,546 $59,541 $59,156 $58,104 $62,874 $58,605 $1,522 Ohio $55,916 $57,661 $57,881 $60,835 $61,167 $58,599 $1,367 Idaho $58,682 $58,208 $56,613 $59,019 $59,568 $58,435 $258 Mississippi $56,091 $57,036 $60,269 $58,391 $59,401 $58,165 $798 Vermont $54,878 $61,393 $56,578 $60,505 $57,059 $57,988 $347 West Virginia $54,896 $58,058 $57,112 $57,554 $60,511 $57,530 $1,073 Michigan $54,781 $54,871 $56,385 $58,940 $59,933 $56,862 $1,437 Wisconsin $54,564 $58,403 $56,091 $56,475 $58,354 $56,705 $565 Indiana $53,672 $54,740 $54,701 $58,293 $59,907 $56,120 $1,602 Missouri $53,102 $55,977 $56,368 $57,040 $58,562 $56,065 $1,198 Iowa $54,158 $55,229 $53,745 $57,623 $59,549 $55,950 $1,318 Arkansas $53,217 $56,434 $53,955 $54,836 $57,112 $55,066 $619 South Dakota $48,742 $53,697 $53,289 $59,627 $59,548 $54,717 $2,754 Maine $49,580 $53,974 $53,964 $57,633 $59,403 $54,452 $2,331
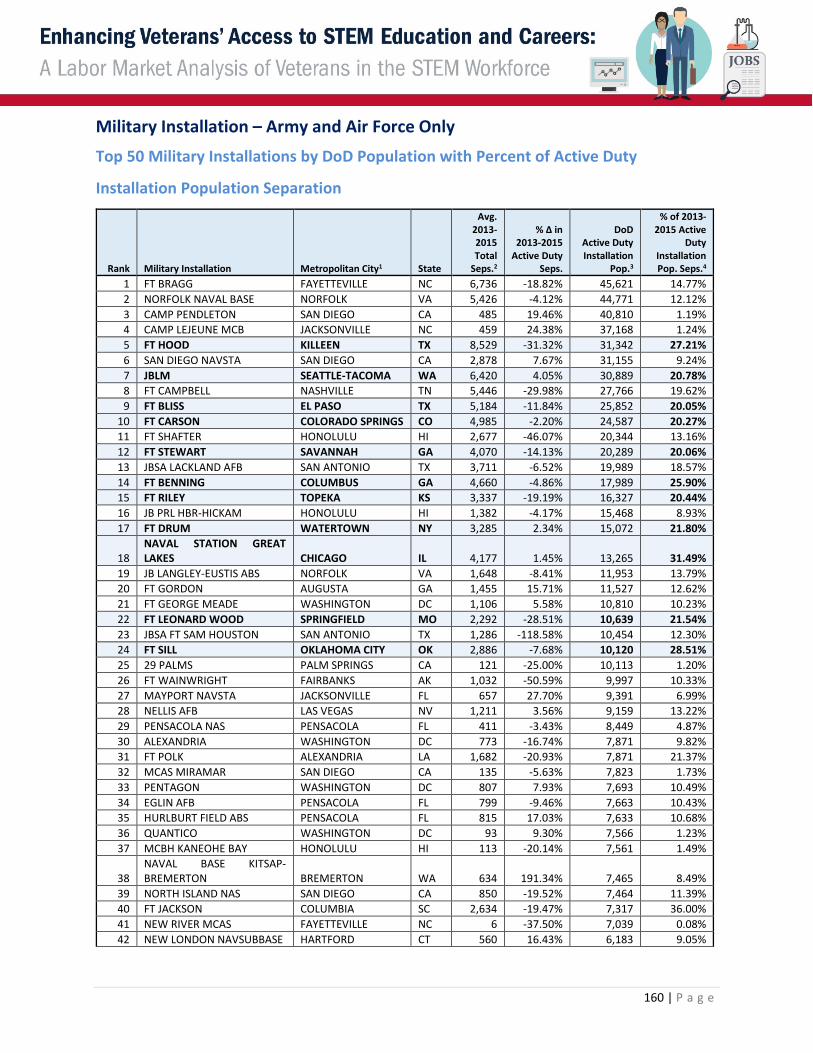
160 | P a g e
Military Installation – Army and Air Force Only Top 50 Military Installations by DoD Population with Percent of Active Duty
Installation Population Separation
Rank Military Installation Metropolitan City1 State
Avg. 2013-2015 Total
Seps.2
% ∆ in 2013-2015
Active Duty Seps.
DoD Active Duty Installation
Pop.3
% of 2013-2015 Active
Duty Installation Pop. Seps.4
1 FT BRAGG FAYETTEVILLE NC 6,736 -18.82% 45,621 14.77% 2 NORFOLK NAVAL BASE NORFOLK VA 5,426 -4.12% 44,771 12.12% 3 CAMP PENDLETON SAN DIEGO CA 485 19.46% 40,810 1.19% 4 CAMP LEJEUNE MCB JACKSONVILLE NC 459 24.38% 37,168 1.24% 5 FT HOOD KILLEEN TX 8,529 -31.32% 31,342 27.21% 6 SAN DIEGO NAVSTA SAN DIEGO CA 2,878 7.67% 31,155 9.24% 7 JBLM SEATTLE-TACOMA WA 6,420 4.05% 30,889 20.78% 8 FT CAMPBELL NASHVILLE TN 5,446 -29.98% 27,766 19.62% 9 FT BLISS EL PASO TX 5,184 -11.84% 25,852 20.05%
10 FT CARSON COLORADO SPRINGS CO 4,985 -2.20% 24,587 20.27% 11 FT SHAFTER HONOLULU HI 2,677 -46.07% 20,344 13.16% 12 FT STEWART SAVANNAH GA 4,070 -14.13% 20,289 20.06% 13 JBSA LACKLAND AFB SAN ANTONIO TX 3,711 -6.52% 19,989 18.57% 14 FT BENNING COLUMBUS GA 4,660 -4.86% 17,989 25.90% 15 FT RILEY TOPEKA KS 3,337 -19.19% 16,327 20.44% 16 JB PRL HBR-HICKAM HONOLULU HI 1,382 -4.17% 15,468 8.93% 17 FT DRUM WATERTOWN NY 3,285 2.34% 15,072 21.80%
18 NAVAL STATION GREAT LAKES CHICAGO IL 4,177 1.45% 13,265 31.49%
19 JB LANGLEY-EUSTIS ABS NORFOLK VA 1,648 -8.41% 11,953 13.79% 20 FT GORDON AUGUSTA GA 1,455 15.71% 11,527 12.62% 21 FT GEORGE MEADE WASHINGTON DC 1,106 5.58% 10,810 10.23% 22 FT LEONARD WOOD SPRINGFIELD MO 2,292 -28.51% 10,639 21.54% 23 JBSA FT SAM HOUSTON SAN ANTONIO TX 1,286 -118.58% 10,454 12.30% 24 FT SILL OKLAHOMA CITY OK 2,886 -7.68% 10,120 28.51% 25 29 PALMS PALM SPRINGS CA 121 -25.00% 10,113 1.20% 26 FT WAINWRIGHT FAIRBANKS AK 1,032 -50.59% 9,997 10.33% 27 MAYPORT NAVSTA JACKSONVILLE FL 657 27.70% 9,391 6.99% 28 NELLIS AFB LAS VEGAS NV 1,211 3.56% 9,159 13.22% 29 PENSACOLA NAS PENSACOLA FL 411 -3.43% 8,449 4.87% 30 ALEXANDRIA WASHINGTON DC 773 -16.74% 7,871 9.82% 31 FT POLK ALEXANDRIA LA 1,682 -20.93% 7,871 21.37% 32 MCAS MIRAMAR SAN DIEGO CA 135 -5.63% 7,823 1.73% 33 PENTAGON WASHINGTON DC 807 7.93% 7,693 10.49% 34 EGLIN AFB PENSACOLA FL 799 -9.46% 7,663 10.43% 35 HURLBURT FIELD ABS PENSACOLA FL 815 17.03% 7,633 10.68% 36 QUANTICO WASHINGTON DC 93 9.30% 7,566 1.23% 37 MCBH KANEOHE BAY HONOLULU HI 113 -20.14% 7,561 1.49%
38 NAVAL BASE KITSAP-BREMERTON BREMERTON WA 634 191.34% 7,465 8.49%
39 NORTH ISLAND NAS SAN DIEGO CA 850 -19.52% 7,464 11.39% 40 FT JACKSON COLUMBIA SC 2,634 -19.47% 7,317 36.00% 41 NEW RIVER MCAS FAYETTEVILLE NC 6 -37.50% 7,039 0.08% 42 NEW LONDON NAVSUBBASE HARTFORD CT 560 16.43% 6,183 9.05%

161 | P a g e
Rank Military Installation Metropolitan City1 State
Avg. 2013-2015 Total
Seps.2
% ∆ in 2013-2015
Active Duty Seps.
DoD Active Duty Installation
Pop.3
% of 2013-2015 Active
Duty Installation Pop. Seps.4
43 TRAVIS AFB SAN FRANCISCO CA 780 3.57% 6,152 12.67% 44 OFFUTT AFB OMAHA NE 651 -2.63% 6,041 10.78% 45 JACKSONVILLE NAS JACKSONVILLE FL 929 -9.02% 6,030 15.41%
46 NV WEAPONS STATION CHARLESTON CHARLESTON SC 402 10.32% 5,946 6.77%
47 TINKER AFB OKLAHOMA CITY OK 782 -24.13% 5,706 13.70% 48 DAVIS-MONTHAN AFB TUCSON AZ 753 -16.60% 5,659 13.31%
49 NAVAL BASE KITSAP-BANGOR BREMERTON WA 2,150 -14.90% 5,602 38.39%
50 MACDILL AFB TAMPA FL 610 9.68% 5,596 10.91%
1 The IVMF team identified the closest metropolitan city to each military installation. 2 The Avg. (Average) 2013-2015 Active Duty Total Seps. (Separations) was computed using data retrieved from the Active Duty Separations by Installation, Service, Rank, and Fiscal Year for FY 2013 through FY 2015. The Marine Corps separation data in 2015 shows 99% unknowns, Navy separation data shows 11% unknown, Army separation data shows 7% unknown, and Air Force separation data shows 3% unknown. This DMDC report was provided by IVMF, and initially produced by DMDC on January 28, 2016. Increases and decreases in base separations may or may not continue, and should be further evaluated on an individual basis. 3 The DoD Active Duty Base Pop. (Population) uses the number of Sponsors from the Active Duty Family Sponsors & Eligible Dependents Report by Base (2012-Present). Although the report covers a 4-year span, we believe this is an average of the four years. Due to the lack of DMDC reports available containing DoD sponsors by base and year and the inability to collect such data for all services from other sources, we believe this is the best source to approximate the number of DoD personnel by base/metropolitan city given the limited time constraints of this project. Our group retrieved this report directly from the DMDC website, and is current as of April 2016. (Defense Manpower Data Center, 2016) 4 The % of 2013-2015 Active Duty Base Population Seps. (Separations) was calculated by dividing the Avg. 2013-2015 Total Active Duty Seps. by the Active Duty Base Population. This table is sorted in descending order by the DoD Active Duty Base Pop. (Population) column. 5 Highlighted rows indicate those military installations with a DoD Active Duty population greater than 10,000 and the % of 2013-2015 Active Duty Installation Population Separations greater than or equal to 20 percent.

162 | P a g e
Percent of Active Duty Base Population Separations by Metropolitan Area
Rank Metropolitan Area State Number of
Installations
Avg. 2013-2015 Total
Active Duty Seps.
% ∆ in 2013-2015
Active Duty Seps.
DOD Active Duty Installation Population
% of Active
Duty Seps.
1 SAN DIEGO CA 10 5,839 -0.90% 102,946 5.67% 2 NORFOLK VA 13 9,351 -3.83% 79,010 11.84% 3 WASHINGTON DC 14 5,794 0.66% 58,721 9.87% 4 FAYETTEVILLE NC 3 6,928 -18.19% 54,291 12.76% 5 HONOLULU HI 6 4,523 -21.81% 47,105 9.60% 6 JACKSONVILLE NC 1 459 24.38% 37,168 1.24% 7 SAN ANTONIO TX 3 5,326 -9.86% 32,869 16.20% 8 COLORADO SPRINGS CO 4 6,003 -2.49% 32,067 18.72% 9 KILLEEN TX 1 8,529 -31.32% 31,342 27.21% 10 SEATTLE-TACOMA WA 2 6,420 -9.44% 30,889 20.78% 11 PENSACOLA FL 6 2,322 7.40% 28,575 8.13% 12 SAVANNAH GA 4 4,161 -13.53% 28,561 14.57% 13 NASHVILLE TN 1 5,446 -29.98% 27,766 19.62% 14 EL PASO TX 2 5,326 -12.41% 26,198 20.33% 15 JACKSONVILLE FL 4 1,869 0.10% 18,299 10.22% 16 OKLAHOMA CITY OK 4 3,952 -11.01% 18,294 21.60% 17 COLUMBUS GA 1 4,660 -4.86% 17,989 25.90% 18 TOPEKA KS 1 3,337 -19.19% 16,327 20.44% 19 WATERTOWN NY 1 3,285 2.34% 15,072 21.80% 20 BREMERTON WA 3 2,909 10.25% 13,807 21.07% 21 CHICAGO IL 1 4,177 1.45% 13,265 31.49% 22 FAIRBANKS AK 2 1,200 -45.67% 11,815 10.15% 23 AUGUSTA GA 1 1,455 15.71% 11,527 12.62% 24 SPRINGFIELD MO 1 2,292 -28.51% 10,639 21.54% 25 PALM SPRINGS CA 1 121 -25.00% 10,113 1.20% 26 TUCSON AZ 2 1,399 -16.01% 9,652 14.49% 27 CHARLESTON SC 3 811 8.28% 9,385 8.64% 28 LAS VEGAS NV 1 1,211 3.56% 9,159 13.22% 29 ALEXANDRIA LA 1 1,682 -20.93% 7,871 21.37% 30 KANSAS CITY MO 2 970 16.11% 7,442 13.04% 31 COLUMBIA SC 1 2,634 -19.47% 7,317 36.00% 32 ANCHORAGE AK 3 1,529 -32.32% 7,139 21.41% 33 HARTFORD CT 1 560 16.43% 6,183 9.05% 34 SAN FRANCISCO CA 1 780 3.57% 6,152 12.67% 35 OMAHA NE 1 651 -2.63% 6,041 10.78% 36 TAMPA FL 1 610 9.68% 5,596 10.91% 37 MINOT ND 1 788 -12.36% 5,472 14.39% 38 LOS ANGELES CA 4 648 5.14% 5,409 11.99% 39 YUMA AZ 2 33 0.00% 5,307 0.62% 40 WICHITA FALLS TX 1 390 -30.32% 5,269 7.40% 41 TRENTON NJ 3 653 1.54% 5,230 12.49% 42 WHIDBEY ISLAND WA 1 618 -16.12% 5,178 11.93% 43 DAYTON OH 1 610 7.00% 5,175 11.79% 44 SUMTER SC 1 667 -7.19% 5,146 12.96% 45 SHREVEPORT LA 1 595 9.25% 5,061 11.76% 46 BILOXI MS 1 430 -45.36% 4,763 9.03% 47 ST. LOUIS MO 3 631 -1.42% 4,762 13.26% 48 CLOVIS NM 1 590 13.16% 4,708 12.54% 49 MONTEREY CA 2 268 -4.58% 4,660 5.74%

163 | P a g e
Rank Metropolitan Area State Number of
Installations
Avg. 2013-2015 Total
Active Duty Seps.
% ∆ in 2013-2015
Active Duty Seps.
DOD Active Duty Installation Population
% of Active
Duty Seps.
50 VALDOSTA GA 1 556 -7.36% 4,251 13.07% 51 SACRAMENTO CA 2 579 11.45% 4,245 13.63% 52 ABILENE TX 1 610 -5.88% 4,152 14.70% 53 RALEIGH NC 1 550 -8.83% 4,090 13.46% 54 SAN BERNARDINO CA 1 856 -18.66% 4,062 21.07% 55 LITTLE ROCK AR 1 577 -8.91% 4,047 14.27% 56 FRESNO CA 1 437 -13.43% 3,877 11.27% 57 PANAMA CITY FL 2 356 22.70% 3,849 9.25% 58 OGDEN UT 1 463 -0.25% 3,746 12.37% 59 LAS CRUCES NM 1 474 -0.24% 3,654 12.96% 60 LOUISVILLE KY 1 1,313 -61.51% 3,636 36.10% 61 DOTHAN AL 1 392 1.28% 3,582 10.95% 62 MACON GA 1 422 -6.34% 3,358 12.57% 63 PHOENIX AZ 1 429 13.52% 3,327 12.90% 64 DOVER DE 1 400 -4.18% 3,267 12.24% 65 SAN ANGELO TX 1 279 -7.30% 3,260 8.56% 66 ALBUQUERQUE NM 1 445 -2.68% 3,210 13.85% 67 GREAT FALLS MT 1 436 -0.25% 3,202 13.61% 68 BOISE ID 1 462 -8.56% 3,181 14.51% 69 RAPID CITY SD 1 431 -2.62% 3,119 13.81% 70 CHEYENNE WY 1 439 -10.33% 3,053 14.37% 71 WICHITA KS 1 335 -8.54% 2,900 11.56% 72 NEWPORT RI 1 608 -66.99% 2,863 21.25% 73 SPOKANE WA 1 343 2.14% 2,780 12.33% 74 MONTGOMERY AL 1 278 -1.17% 2,749 10.11% 75 SANTA BARBARA CA 1 272 0.83% 2,467 11.03% 76 NEW YORK NY 4 232 5.02% 2,275 10.21% 77 DENVER CO 1 284 2.76% 2,231 12.74% 78 SCHENECTADY NY 1 105 -16.96% 1,803 5.81% 79 NEW ORLEANS LA 2 241 12.24% 1,773 13.59% 80 CORPUS CHRISTI TX 1 157 -3.57% 1,680 9.37% 81 GRAND FORKS ND 1 199 6.25% 1,540 12.94% 82 MIAMI FL 3 153 -15.79% 1,452 10.54% 83 ORLANDO FL 1 146 2.31% 1,445 10.08% 84 PORTSMOUTH NH 2 78 54.69% 1,322 5.93% 85 COLUMBUS MS 1 113 -4.59% 1,314 8.63% 86 DEL RIO TX 1 95 8.97% 1,245 7.63% 87 EVERETT WA 1 218 -2.86% 1,156 18.86% 88 HARRISBURG PA 3 87 5.88% 954 9.12% 89 MERIDIAN MS 1 47 -36.67% 941 5.03% 90 BOSTON MA 2 117 -1.90% 938 12.44% 91 OXNARD CA 1 120 3.31% 884 13.61% 92 DALLAS TX 1 62 36.96% 877 7.03% 93 RENO NV 1 82 -23.71% 844 9.68% 94 FREDERICKSBURG VA 1 52 36.17% 741 7.06% 95 HUNTSVILLE AL 1 113 -17.97% 631 17.91% 96 MOBILE AL 2 57 -41.89% 555 10.33% 97 MEMPHIS TN 1 112 -13.27% 523 21.35% 98 DAVENPORT IA 1 54 11.32% 403 13.40% 99 MOREHEAD CITY NC 1 55 46.81% 388 14.18% 100 HATTIESBURG MS 1 51 -48.61% 377 13.44%

164 | P a g e
Rank Metropolitan Area State Number of
Installations
Avg. 2013-2015 Total
Active Duty Seps.
% ∆ in 2013-2015
Active Duty Seps.
DOD Active Duty Installation Population
% of Active
Duty Seps.
101 PHILADELPHIA PA 1 24 -29.03% 342 7.12% 102 ALBANY GA 1 4 -77.78% 333 1.30% 103 PITTSBURGH PA 1 25 -51.43% 289 8.54% 104 MINNEAPOLIS MN 1 10 128.57% 276 3.74% 105 RICHMOND VA 1 23 -61.76% 254 9.06% 106 LA CROSSE WI 1 17 -34.78% 240 6.94% 107 COLUMBUS OH 1 13 - 227 5.73% 108 EL CENTRO CA 1 25 -8.00% 210 12.06% 109 DETROIT MI 2 28 0.00% 205 13.66% 110 LONG BEACH CA 1 16 -11.76% 178 9.18% 111 PORTLAND OR 1 12 18.18% 140 8.81% 112 INDIANAPOLIS IN 1 3 -40.00% 127 2.36% 113 PARSIPPANY-TROY HILL NJ 1 6 125.00% 127 4.99% 114 BURLINGTON VT 1 5 0.00% 75 6.67% 115 MILWAUKEE WI 1 1 0.00% 25 5.33% 116 NEW HAVEN CT 1 0 - 13 0.00% 117 CHEASAPEAKE VA 1 0 -100.00% 5 6.67% 118 PETALUMA CA 1 0 - 2 0.00% 119 PORTLAND ME 1 0 - 1 0.00%
Military Installations, Installation Population and Percent of Separations by Selected
Metropolitan Area
Metropolitan Area & Military Installations
DoD Active Duty Installation Population
% of Active
Duty Seps. WASHINGTON, DC 55,254 9.87%
FT GEORGE MEADE 10,810 10.23% ALEXANDRIA 7,871 9.82% PENTAGON 7,693 10.49% QUANTICO 7,566 1.23% FT BELVOIR 4,488 13.05% JB ANDREWS AFB 4,285 13.80% NNMC BETHESDA 3,871 11.27% PATUXENT RIVER NAS 2,378 11.27% FT MYER 2,236 16.62% ABERDEEN PROVING GROUND 1,114 13.52% FT DETRICK 1,056 11.65% ANNAPOLIS NS (INCL USNA) 1,052 11.19% INDIAN HEAD NAV ORD STA 681 4.21% HQTRS MARCORPS 153 0.65%
SEATTLE-TACOMA, WA 30,889 20.78% JBLM 30,889 20.78%

165 | P a g e
Top 20% of Army and Air Force Positions at Selected Installations
Metropolitan Area Military Installation
AFSC/ MOS Service Occupation Title
% of Metro Active Duty Population1
Washington, DC
FT GEORGE MEADE 1N3X1 Cryptologic Language Analyst 1.68% QUANTICO 7S0X1 Special Investigations 1.62% FT MYER 11B Infantryman 1.59% JB ANDREWS AFB 3P0X1 Security Forces 1.40% FT GEORGE MEADE 35N Signals Intelligence Analyst 1.21% ABERDEEN PROVING GROUND 68R Veterinary Food Inspection Specialist 1.06% FT GEORGE MEADE 1N4X1 Fusion Analyst 0.88% FT GEORGE MEADE 1N2X1 Signals Intelligence Analyst 0.68% FT GEORGE MEADE 17C Cyber Operations Specialist 0.67% FT GEORGE MEADE 35S Signals Collector/Analyst 0.66% PENTAGON 63AX Acquisition Manager 0.64% PENTAGON 01A Officer Generalist 0.62% ABERDEEN PROVING GROUND 68T Animal Care Specialist 0.54% FT MYER 42S Special Band Musician 0.54% FT GEORGE MEADE 35P Cryptologic Linguist 0.53% QUANTICO 71SX Special Investigations 0.46% FT BELVOIR 27A Judge Advocate General 0.45% FT BELVOIR 51A Systems Development 0.44% FT BELVOIR 51Z Acquisition 0.43% FT BELVOIR 12P Prime Power Production Specialist 0.40% JB ANACOSTIA-BOLLING 8G0X0 United States Air Force Honor Guard 0.40% PENTAGON 62EX Developmental Engineer 0.38% PENTAGON 02A Combat Arms Generalist 0.37% FT GEORGE MEADE 35L Counter Intelligence Agent 0.33% PENTAGON 13SX Space Operations 0.33% JB ANDREWS AFB 4N0X1 Aerospace Medical Service 0.30% PENTAGON 3D1X2 Cyber Transport Systems 0.30% PENTAGON 3A1X1 Administration 0.30% FT GEORGE MEADE 35Q Cryptologic Network Warfare Specialist 0.29% JB ANACOSTIA-BOLLING 92SX Student Officer Authorization 0.29% PENTAGON 16RX Planning and Programming 0.28%
Seattle-Tacoma, WA
JBLM 11B Infantryman 11.31% JBLM 68W Health Care Specialist 3.36% JBLM 91B Wheeled Vehicle Repairer 2.92% JBLM 88M Motor Transport Operator 2.62%
1 The % of Metro Active Duty Population was computed by taking the number of Army and Air Force personnel (source: AFPC and FMSWeb) by the number of Active Duty Sponsors (source: DMDC) identified at each base within each metropolitan areas. 2 The Basic Enlisted Airman is approximately 22% of the San Antonio installation population and was excluded from this report.