enhancing target variance in personality impressions ...dpaulhus/research/person... · kenny (1990)...
TRANSCRIPT
Journal of Personality and Social Psychology1995, Vol. 69, No. 6, 1233-1242
Copyright 1995 by the American Psychological Association, Inc.0O22-3514/95/S3.0O
Enhancing Target Variance in Personality Impressions:Highlighting the Person in Person Perception
Delroy L. Paulhus and Shawn ReynoldsUniversity of British Columbia
D. A. Kenny (1994) estimated the components of personality rating variance to be 15,20, and 20%for target, rater, and relationship, respectively. To enhance trait variance and minimize rater vari-ance, we designed a series of studies of personality perception in discussion groups (2V = 79, 58, and59). After completing a Big Five questionnaire, participants met 7 times in small groups. AfterMeetings 1 and 7, group members rated each other. By applying the Social Relations Model (D. A.Kenny and L. La Voie, 1984) to each Big Five dimension at each point in time, we were able toevaluate 6 rating effects as well as rating validity. Among the findings were that (a) target variancewas the largest component (almost 30%), whereas rater variance was small (less than 11%); (b)rating validity improved significantly with acquaintance, although target variance did not; and (c)no reciprocity was found, but projection was significant for Agreeableness.
The study of person perception plays a pivotal role in linkingpersonality to social psychology. After all, the rating process de-pends partly on the strength of the signal, that is, the truedifferences in personality to be detected, and partly on the socialcognition of the perceiver. Both groups have contributed to therecent surge in publications on the issue (e.g., Funder & West,1993; Trope & Higgins, 1993).
Arguably, the most important of these publications is Ken-ny's (1994) book Interpersonal Perception, which represents 15years of work on partitioning the components of person ratings.In reviewing more than 40 such studies, Kenny came to a num-ber of provocative conclusions. For example, he concluded thattarget variance, that is, observer agreement on others' personal-ity, was modest, at best. Nor was this target variance improvedby increased levels of acquaintance with the target. More im-portant than target variance, according to Kenny, are the per-sonal biases of the raters and the relationship between the raterand the target individual.
To us, these conclusions seemed at odds with the solid evi-dence for observer agreement in ratings of the Big Five person-ality dimensions (e.g., McCrae & Costa, 1987; Piedmont,1994). In examining his review of the literature, we concludedthat Kenny's (1994) norms may have underestimated potentialtarget variance because they combined studies of (a) both dy-adic and group ratings, (b) varying breadth of acquaintance,and (c) varying rating instructions. In the present article, we
Delroy L. Paulhus and Shawn Reynolds, Department of Psychology,University of British Columbia, Vancouver, British Columbia, Canada.
This research was supported by a grant from the Social Sciences andHumanities Research Council of Canada. We wish to thank NadineBruce and Oliver John for assistance in the data collection and DavidKenny, Dan Perlman, Paul Trapnell, Jerry Wiggins, and Michelle Yikfor comments on an earlier draft.
Correspondence concerning this article should be addressed to Del-roy L. Paulhus, Department of Psychology, University of British Co-lumbia, Vancouver, British Columbia, Canada V6T 1Z4.
designed studies to demonstrate that higher levels of target vari-ance could be achieved. By sharpening both measurement toolsand target discriminability, we should also enhance our abilityto demonstrate rating validity and the effects of acquaintance.
The Group Rating Paradigm
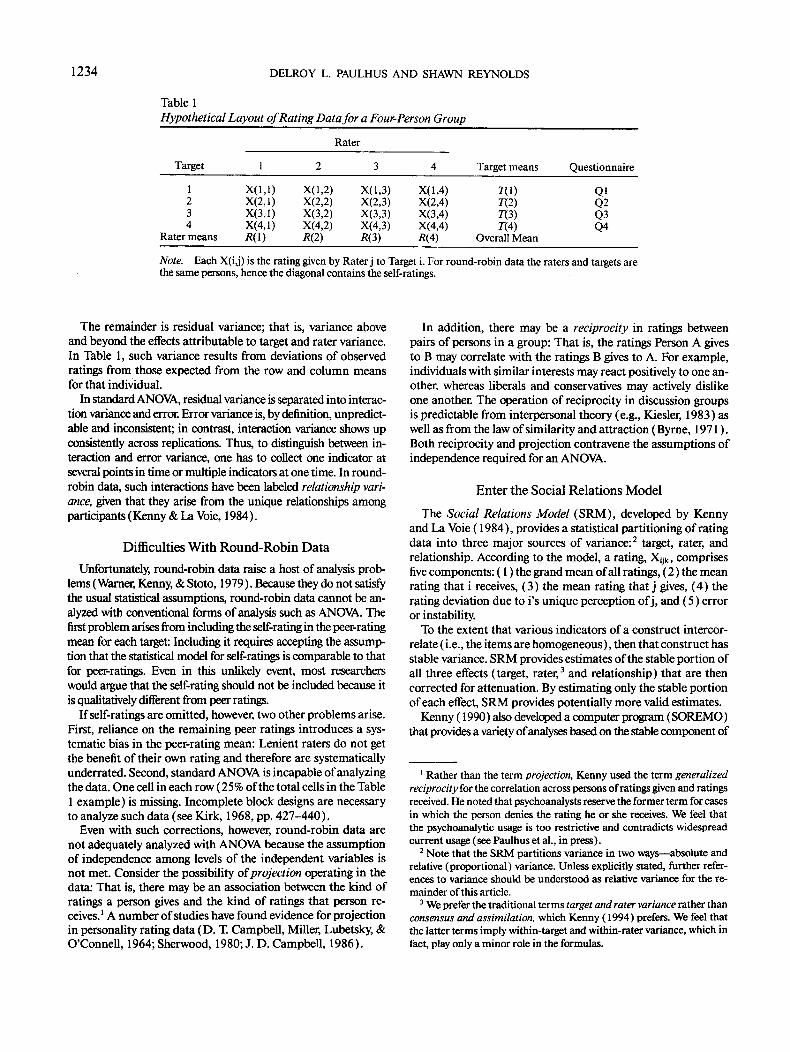
To this end, we collected three types of data on participantsin small groups. As in most of the studies referred to in thisreport, the paradigm for collecting peer-rating data is the"round-robin" pattern: That is, each person is both a target anda rater of all other members. Because the validity of rating datamust be indexed by their correlation with other measures of thesame construct, we also included two forms of self-assessment:(a) self-ratings on global items (Burisch, 1984) and (b) a stan-dardized personality test, hereafter referred to as the question-naire. The layout of the three assessment modes in our studiesis illustrated in Table 1.
Correlational approaches to such data focus on the relationbetween various target measures: for example, the rating meansand questionnaire scores. In contrast, an analysis of variance(ANOV\) approach to such data would focus on the relativecontributions of target and rater to the rating variance. Oncepartitioned, the proportion of variance explained by eachsource can be used as an index of its importance, and statisticaltests can be applied to test hypotheses about these sources.Target variance is the variance across the mean ratings receivedby group members: In Table 1, it is manifested in differencesacross values in the Target means column. Higher values areprimarily a function of target discriminability (i.e., the targetsare perceived as distinctive).
Rater variance is variance across the mean ratings given bythe group members. Some raters may place every target near thehigh end of a scale, others may prefer the low end, and still oth-ers, the middle range. In Table 1, rater variance is manifested indifferences among means on the Rater means row. On evalua-tive dimensions, higher rater variance is primarily a function ofdifferences in rater leniency.
1233
1234 DELROY L. PAULHUS AND SHAWN REYNOLDS
Table 1Hypothetical Layout of Rating Data for a Four-Person Group
Target
1234
Rater means
1
R(l)
2
X&2)X(3,2)X(4,2)R(2)
Rater
3
X(23)X(3,3)X(4,3)R(3)
4
X(l,4)X(2,4)X(3,4)X(4,4)*(4)
Target means
7ID71(2)71(3)71(4)
Overall Mean
Questionnaire
QlQ2Q3Q4
Note. Each X(i j) is the rating given by Rater j to Target i. For round-robin data the raters and targets arethe same persons, hence the diagonal contains the self-ratings.
The remainder is residual variance; that is, variance aboveand beyond the effects attributable to target and rater variance.In Table 1, such variance results from deviations of observedratings from those expected from the row and column meansfor that individual.
In standard ANOVA, residual variance is separated into interac-tion variance and error. Error variance is, by definition, unpredict-able and inconsistent; in contrast, interaction variance shows upconsistently across replications. Thus, to distinguish between in-teraction and error variance, one has to collect one indicator atseveral points in time or multiple indicators at one time. In round-robin data, such interactions have been labeled relationship vari-ance, given that they arise from the unique relationships amongparticipants (Kenny & La Voie, 1984).
Difficulties With Round-Robin Data
Unfortunately, round-robin data raise a host of analysis prob-lems (Warner, Kenny, & Stoto, 1979). Because they do not satisfythe usual statistical assumptions, round-robin data cannot be an-alyzed with conventional forms of analysis such as ANGVA. Thefirst problem arises from including the self-rating in the peer-ratingmean for each target: Including it requires accepting the assump-tion that the statistical model for self-ratings is comparable to thatfor peer-ratings. Even in this unlikely event, most researcherswould argue that the self-rating should not be included because itis qualitatively different from peer ratings.
If self-ratings are omitted, however, two other problems arise.First, reliance on the remaining peer ratings introduces a sys-tematic bias in the peer-rating mean: Lenient raters do not getthe benefit of their own rating and therefore are systematicallyunderrated. Second, standard ANOVA is incapable of analyzingthe data. One cell in each row (25% of the total cells in the Table1 example) is missing. Incomplete block designs are necessaryto analyze such data (see Kirk, 1968, pp. 427-440).
Even with such corrections, however, round-robin data arenot adequately analyzed with ANOVA because the assumptionof independence among levels of the independent variables isnot met. Consider the possibility of projection operating in thedata: That is, there may be an association between the kind ofratings a person gives and the kind of ratings that person re-ceives.1 A number of studies have found evidence for projectionin personality rating data (D. T. Campbell, Miller, Lubetsky, &O'Connell, 1964;Sherwood, 1980; J. D.Campbell, 1986).
In addition, there may be a reciprocity in ratings betweenpairs of persons in a group: That is, the ratings Person A givesto B may correlate with the ratings B gives to A. For example,individuals with similar interests may react positively to one an-other, whereas liberals and conservatives may actively dislikeone another. The operation of reciprocity in discussion groupsis predictable from interpersonal theory (e.g., Kiesler, 1983) aswell as from the law of similarity and attraction (Byrne, 1971).Both reciprocity and projection contravene the assumptions ofindependence required for an ANOVA.
Enter the Social Relations Model
The Social Relations Model (SRM), developed by Kennyand La Voie (1984), provides a statistical partitioning of ratingdata into three major sources of variance:2 target, rater, andrelationship. According to the model, a rating, Xyk, comprisesfive components: (1) the grand mean of all ratings, (2) the meanrating that i receives, (3) the mean rating that j gives, (4) therating deviation due to i's unique perception of j , and (5) erroror instability.
To the extent that various indicators of a construct intercor-relate (i.e., the items are homogeneous), then that construct hasstable variance. SRM provides estimates of the stable portion ofall three effects (target, rater,3 and relationship) that are thencorrected for attenuation. By estimating only the stable portionof each effect, SRM provides potentially more valid estimates.
Kenny (1990) also developed a computer program (SOREMO)that provides a variety of analyses based on the stable component of
1 Rather than the term projection, Kenny used the term generalizedreciprocity for the correlation across persons of ratings given and ratingsreceived. He noted that psychoanalysts reserve the former term for casesin which the person denies the rating he or she receives. We feel thatthe psychoanalytic usage is too restrictive and contradicts widespreadcurrent usage (see Paulhus et al., in press).
2 Note that the SRM partitions variance in two ways—absolute andrelative (proportional) variance. Unless explicitly stated, further refer-ences to variance should be understood as relative variance for the re-mainder of this article.
3 We prefer the traditional terms target and rater variance rather thanconsensus and assimilation, which Kenny (1994) prefers. We feel thatthe latter terms imply within-target and within-rater variance, which infact, play only a minor role in the formulas.
HIGHLIGHTING THE PERSON IN PERSON PERCEPTION 1235
each effect. If the user includes additional measures on each partic-ipant (e.g., questionnaire scores), the program provides all the in-tercorrelations with these external measures. In short, the programcombines ANOV\ and correlational approaches.
Among many applications, SRM provides an appropriateanalysis for the round-robin data described above. Of particularadvantage is its facility for correcting the interdependenciesfound in round-robin rating data. Hence the well-establishedphenomena of projection and reciprocity do not distort the cal-culations of rater and target effects.
In fact, SRM goes further to provide indexes of projectionand reciprocity. Instead of viewing these two phenomena as sta-tistical annoyances, SRM estimates their importance andmakes them available for correlations with other measures.These correlations are disattenuated according to the degree ofunreliability of the peer ratings.
Another important feature of SRM is its provision for the self-rating problem discussed earlier. Recall that a systematic bias isintroduced by excluding the self-rating from a target's mean peerrating, but including it requires the assumption that self-ratingsand peer ratings are essentially equivalent. SRM omits the self-rating but estimates the missing cell by using the column and rowmeans for that rating (Warner et al., 1979, p. 1747).
Choosing a Domain: The Big Five
In choosing which dimensions to measure, we noted the bur-geoning evidence that the so-called "Big Five" factors circum-scribe the fundamental dimensions of personality (e.g., Costa& McCrae, 1989; John, 1990; Wiggins & Trapnell, in press).Following common usage, we refer to the five factors as Extra-version, Agreeableness, Conscientiousness, Stability,4 andOpenness to Experience. Because of the robustness of the five-factor solution and their extensive construct validation, the BigFive are now used widely in personality research.
The SRM has already been applied to the Big Five in a num-ber of studies: Thirty-two were listed in a recent review byKenny, Albright, Malloy, and Kashy (1994). When averagedacross the Big Five, target variance was higher in the studiesinvolving long-term (28%) than short-term acquaintance(14%), presumably because long-term acquaintance gave ratersmore information with which to differentiate the targets.Within the Big Five, the review cites the highest amounts oftarget variance for Extraversion, with Conscientiousness thenext highest (Kenny et al., 1994). Most important for the pres-ent study, the review concluded that target variance was thesmallest of the four SRM components, estimated at roughly15% (Kenny, 1994, p. 84) even for group studies such as thepresent ones (p. 59).
Overview of the Present Studies
We suspected that the figure of 15% was an underestimateof raters' ability to reach consensus on personality differences.Higher figures would require a well-controlled longitudinalstudy of group perceptions designed to maximize target vari-ance. We could find only three published SRM studies that evenapproximated this ideal. Malloy and Albright's (1990) study issimilar but is not longitudinal. Montgomery's (1984) study is
longitudinal but does not include the entire Big Five. Kenny,Homer, Kashy, and Chu, (1992, Study 3) also is similar, but thefirst wave is zero-acquaintance. None of these studies took stepsto control the amount of interaction among group members.In short, none of these studies had all the requisite features tomaximize target variance. Therefore, we designed, conducted,and replicated such a study.
We collected three similar data sets of round-robin Big Fiveratings of group members. As well as peer ratings, each dataset included two other modes of assessment—questionnaire andself-rating. Questionnaires were completed before the partici-pants were randomly assigned to discussion groups of 4-6members. After Meetings 1 and 7 (hereafter called Waves 1 and2), participants rated all their group members (includingthemselves) on Big-Five-related adjectives.
Several design features are worth noting. We chose group overdyadic interactions because target variance is higher in groupinteractions (Kenny, 1994, p. 59). Seven group meetings of 20min each approximates the 2-3 h acquaintance of the in-depthlongitudinal studies reviewed by Kenny (1994, p. 62). Thosestudies yielded target variance that matched that of long-termacquaintance studies only for Extraversion. To maximize targetvariance on the other Big Five dimensions, we installed severalother features: (a) we provided a wide variety of group tasks tobring out different personality facets, (b) the tasks were de-signed so that all group members had to participate, (c) ourraters were encouraged to give refined ratings by disallowingties, and (d) homogeneity of the items for each rating dimensionwas maximized by selecting correlated items from McCrae andCosta (1987).
To ensure that the consensus levels were not just stereotypesdevoid of accuracy, we took further steps to address the validityof the rating data. We administered a well-validated Big Fivepersonality inventory and collected self-ratings at each point intime. These measures are used as criteria for examining differ-ences in rating validity across time and Big Five dimension.
Finally, we built in a number of controls. To ensure that ac-cumulating information was common to all group members,members of each group were initially strangers, and participantswere discouraged from interacting with their group membersoutside of the meetings. Also, to encourage raters to base theirjudgments on targets' behavior rather than targets' self-descrip-tions, none of the exercises involved direct self-descriptions ofpersonality.
Apart from our goal of maximizing target variance, we alsosought to measure a variety of other rating effects. Use of theSOREMO computer program, based on the SRM, provided es-timates of rater and relationship, as well as target variance. Inaddition, SOREMO provides estimates of interdependencyeffects (i.e., projection, reciprocity) whose existence would con-firm the necessity of using SRM instead of standard analysistechniques. As far as we know, there are no published SRMgroup studies reporting projection estimates. We examined allof these effects separately for each of the Big Five dimensions.Finally, we conducted two replications of the original study totest the stability of such effects.
4 To ensure that all factors were pointed in the positive direction, wereversed the scoring on Neuroticism and relabeled it Stability.
1236 DELROY L. PAULHUS AND SHAWN REYNOLDS
Hypotheses
We anchored our hypotheses in the reviews of person percep-tion studies provided in Kenny et al. (1994) and Kenny (1994).We used the norms from those reviews and the specifics of ourmethodology to develop five basic hypotheses. For each hypoth-esis, we also formulated a corollary hypothesis regardingchanges in the effects over time.
Hypothesis 1: Rating Components
On the basis of his reviews, Kenny (1994) proposed a set ofgeneral "rules," that is, expected values of variance accountedfor by rating components. These values were 15, 20, 20, and45% of rating variance accounted for by target, rater, relation-ship, and error, respectively (Kenny, 1994, p. 84).
a. Target variance. In addition to the 15% overall figure,Kenny's (1994) review of target variance studies yielded meansof 32,10,16,10, and 14% for Big Five Factors I-V, respectively.Because our methodology aimed at maximizing target variance,we expected to exceed those values for all factors but Extraver-sion. Given its high observability (John & Robins, 1993; Ken-rick & Stringfield, 1980), Extraversion should yield the highesttarget effects at both waves. On the basis of our earlier research(Paulhus & Bruce, 1992), we did not expect to find an increasein target variance over time.
b. Rater variance. Kenny's (1994) review reported ratervariances ranging from .06 to .37, with a mean of .20. We ex-pected values at the low end of this range because we did notallow raters to give ties (see Method section), thereby prevent-ing raters from clustering their responses at a preferred level.Also, rater variance should be smaller in Study 1, in which 10-point ratings were collected, than in Studies 2 and 3, in which15-point ratings were collected. With narrower scales, ratershave less opportunity to show level preferences.
c. Relationship variance. Kenny's (1994, p. 84) review re-ported a mean relationship variance of .20. We had no reasonto predict otherwise. Kenny also noted that ratings related to"liking" showed twice the relationship variance of other ratings.Given that, of the Big Five, Agreeableness is most related toliking (Graziano & Eisenberg, in press), we predicted the high-est relationship variance for Agreeableness.
Recall that multiple indicators are necessary to make the dis-tinction between error variance and relationship variance. Be-cause Study 1 did not include multiple indicators, relationshipvariance is indeterminate; hence this hypothesis is relevant onlyfor Studies 2 and 3.
Hypothesis 2: Reciprocity
Any relation between A's rating of B and B's rating of A rep-resents a dyadic reciprocity effect. As Kenny (1990, p. 23)noted, SRM calculates this reciprocity as the correlation of allsuch rating pairs with the target and rater effects partialed out.Kenny's (1994) review found evidence for dyadic reciprocityon affect-laden judgments (e.g., liking) but not on traitjudgments.
Because our participants were initially unacquainted andwere randomly assigned to groups, we expected that reciprocity
at Wave 1 would certainly be minimal. Even after seven meet-ings, reciprocity would be unlikely to develop among our par-ticipants. After all, in group meetings, no two members canhave a private interaction. Admittedly, we could not completelyprevent students from interacting outside of the meetings, butwe discouraged it. In short, our best hypothesis is that no reci-procity would be observed on any of the Big Five factors.
Hypothesis 3: Projection
Projection is the tendency for high scorers to give high scores toothers (see footnote 1). SRM calculates it as the correlation be-tween the target mean and the rater mean across participants. Giventhat we have three measures of target variance (questionnaire score,self-rating, and mean peer rating), then we have three possible in-dexes of projection: Each index is calculated by correlating (acrosspersons) the target score with the mean rating given.
Earlier trait rating studies provide mixed support for the pre-diction of projection. D. T. Campbell et al. (1964) found noevidence for similarity projection but did find evidence for acontrast effect, presumably due to anchoring and adjustment.More recently, J. D. Campbell (1986) found similarity and con-trast projection on certain ability traits, but only under limitedconditions. Conclusions from recent reviews have also indicatedmixed evidence for projection (Paulhus, Fridhandler, & Hayes,in press; Sherwood, 1980).
The only evidence from an SRM group study is Kenny's(1994) reanalysis of Park and Judd's (1989) data. Only Agree-ableness showed a consistent positive correlation of rater andtarget means (Kenny, 1994, p. 109). Given this limited evi-dence, we hesitated to predict projection on any dimension ex-cept Agreeableness.
Hypothesis 4: Convergent Validity
Correlational studies typically index the validity of personal-ity ratings by their correlation with other assessment modes. Wehave both questionnaire and self-ratings modes. In short-termacquaintance studies, rating validities with such criteria tend tobe in the .20-.40 range (e.g., Funder & Colvin, 1988; Paulhus& Bruce, 1992). In fact, significant validities have been foundwith raters who have minimal information about the targets(e.g., Berry, 1990;Borkenau&Liebler, 1992).
In such studies, however, all variance other than the system-atic relation between target measures is unaccounted for and isthus seen as error. On the peer-rating mode, for example, raterand relationship variance simply add noise to the target vari-ance, thereby reducing correlations with other measures oftarget variance. As noted earlier, the SRM stabilizes the targetvariance by isolating it from other variance sources. Corre-lations are also disattenuated according to the degree of unreli-ability of the peer-rating measures.
For these reasons, we hypothesized that, by Wave 2, our ratingvalidities would exceed those found in non-SRM studies: Oursshould be in the .40-.60 range for all Big Five dimensions. Fi-nally, on the basis of the only longitudinal Big Five validity study(Paulhus & Bruce, 1992), we hypothesized an increase in va-lidity with acquaintance.

HIGHLIGHTING THE PERSON IN PERSON PERCEPTION 1237
Method
Participants
Three similar data sets (N = 79, 58, and 59 participants in 16, 11,and 12 groups, respectively) were collected.' In each study, the partici-pants were third-year undergraduates in a personality course at a largeCanadian university. Overall, 38% were male, and 36% had East Asianancestry.
As a class exercise, they participated in discussion groups orientedaround course topics. The participants later used their ratings as thebasis of a term paper concerning how their impressions of their discus-sion group members changed over time. After the course, participantswere asked if their ratings could be used as part of a personality study.None refused.
Materials
Questionnaire. In all three studies, Costa and McCrae's (1989) FiveFactor Inventory (FFI) was used as the questionnaire measure of theBig Five factors. It comprises 60 items (12 items for each of the BigFive) and requires less than 10 min to complete.
Peer ratings. These are the adjective scales on which participantsrated their group members on the basis of behavior observed in the dis-cussions. The same set of scales were completed at home after Meetings1 and 7.
Participants were asked to write the initials of each group memberover a number on the scale itself. It was explained clearly that tie ratingswere not allowed: That is, they could write only one initial over anynumber on the scale. This requirement was designed to counteract theusual tendency for participants to rate other participants as highly pos-itive and therefore highly similar; raters would be forced to put moreeffort into making distinctions across targets.
In Study 1, there was a total of five scales—one indicator for each BigFive factor. Each was a unipolar scale ranging from not at all(\) to verymuch (10). To help clarify the construct, all (but one) adjective labelswere followed by two related adjectives. The exact labels were: assertive(vocal, dominant), prosocial (cooperative, likable), work oriented(deliberate, organized), insecure, and intellectual (original, clever).
In Studies 2 and 3, participants rated 15 bipolar adjective scales, thatis, 3 indicators per Big Five factor (e.g., outgoing, peppy, and sociablefor Extraversion). The indicators were selected from the set validatedby McCrae and Costa (1987). Again, ties were not allowed.
Self-ratings. Participants were asked to include themselves whenrating group members on the above scales. This requirement yieldedself-rating scores on the same scales as for peer ratings at Waves 1 and 2of the study.
Procedure
After the first class, participants were asked to complete the FFI ques-tionnaire at home and return it at the next class meeting. The discussiongroup assignments were then completed randomly. As each group as-sembled, the instructor verified that all were unacquainted; if two stu-dents were acquainted, one was replaced with an unacquainted studentfrom the remaining pool of students. This assignment yielded groups of4-6 previously unacquainted students. These groups met once a weekduring class for 7 weeks. In each meeting, they spent 20 min.discussinga course topic assigned to them.
After Meetings 1 and 7, participants were provided with a rating formto complete at home and return to the instructor at the next class meet-ing. They were told to seal the completed form in the envelope providedto ensure confidentiality. They did not know in advance what traits theywould be rating. As noted above, the rating form involved rating them-selves as well as other group members on a list of traits.
The ratings were returned confidentially to the raters near the end ofthe course to be used as the basis for their term paper. They were toldnot to share their ratings with other group members.
AnalysesWe performed the bulk of the analyses using Kenny's (1990)
SOREMO program. Each data set submitted to SOREMO consisted ofseveral groups of round-robin ratings on one construct. SOREMO be-gins by partitioning variance in a 2 X 3 analysis, breaking it into stableand unstable components across target, rater, and relationship. There-fore, for each study, this analysis had to be performed a total of 10times—once for each of the Big Five factors at each of the two waves.
Unfortunately, SOREMO computes significance values only for individ-ual indicators (e.g., outgoing), not for the constructs (e.g., Extraversion).Therefore, to test the constructs, the summed indicators for each constructhad to be manually tested for significance.6 Most of the tests below arebased on group-level analyses. In Study 1, for example, the df= 15 formost tests because there are 16 groups of raters (see SOREMO manual,Kenny, 1990, p. 12). Minimal sex differences were found; hence the datafor men and women were pooled.
Results
Hypothesis 1: Rating Components
Table 2 contains three panels corresponding to our threestudies. Each panel shows the percentage of variance7 attribut-able to various sources: that is, target, rater, relationship, anderror. The panels are further broken down by Big Five factorand wave (separated by slashes).
Each entry was tested for significance by a one-tailed t testcomparing the amounts of variance to 0.8 Although this table isbroken down by Big Five and wave, the hypotheses below focuson the mean results, which may be found in the rightmostcolumn.
Hypothesis la: Target variance. In all three of our studies,target variance was substantial. At Wave 2, Studies 1, 2, and 3yielded 29, 28, and 28%, respectively. Given that these figuresare almost twice as high as the Kenny "rule" of 15% target vari-
5 Part of the data from Study 1 were previously analyzed with purelycorrelational methods and reported in Paulhus and Bruce (1992). Thepresent analyses with the SRM provide a much richer and more com-prehensive picture of the data.
6 One would think that these tests could be performed in SOREMOby first summing across the indicators and then determining signifi-cance values. Unfortunately, relationship variance can only be sepa-rated from error variance with multiple indicators, which would be lostif one were to sum across the indicators.
7 Variance attributable to each source is calculated by determiningthe absolute variance within each group and pooling across all groups.SOREMO then converts these values into relative variances.
8 Notice the apparent inconsistency in some significance values: Forinstance, on Conscientiousness in Study 1, the .24 for rater at Wave 2 isnot significant, whereas the .07 for target at Wave 1 is. The reason forthe inconsistency is that significance is determined across groups; thegroup is the unit of measure. Hence, a large value may not be significantif there is a great deal of variation across groups. A test of varianceagainst 0 seems counterintuitive; however, it is appropriate withinSOREMO because the values being tested are not the actual variancesbut a transformation that has an expected value of 0 under the nullhypothesis.
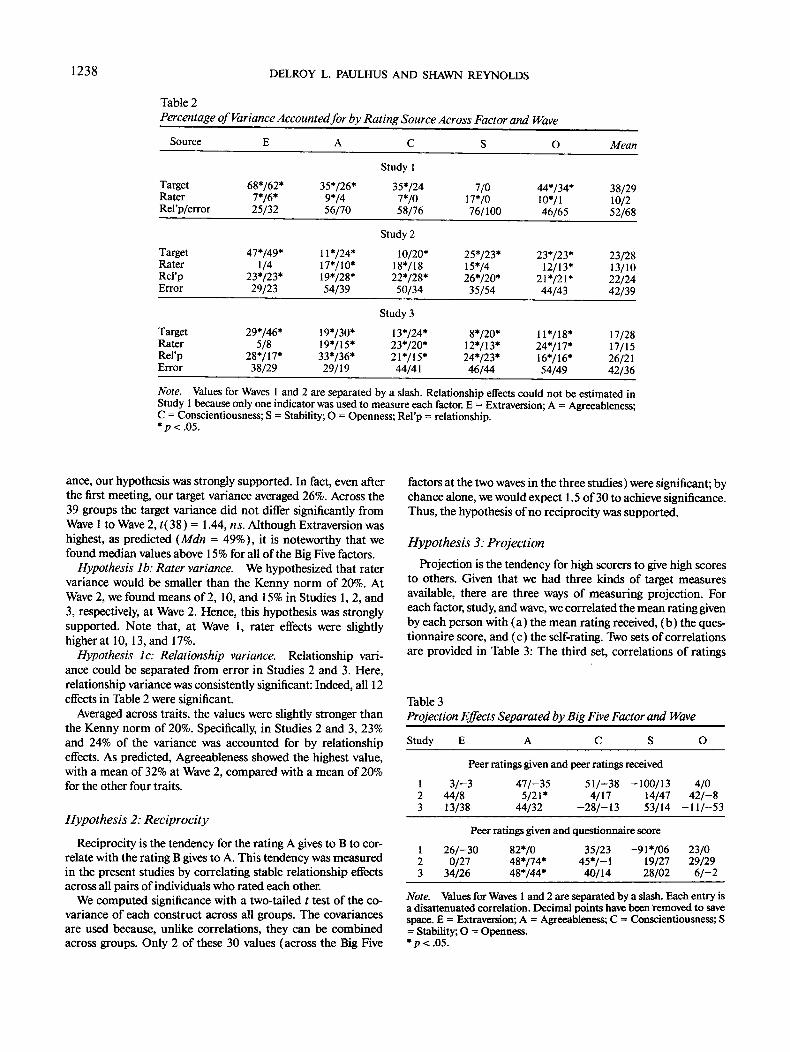
1238 DELROY L. PAULHUS AND SHAWN REYNOLDS
Table 2Percentage of Variance Accounted for by Rating Source Across Factor and Wave
Source
TargetRaterRel'p/error
TargetRaterRel'pError
TargetRaterRel'pError
E
68*/62*7*/6*25/32
47*/49*1/4
23*/23*29/23
29*/46*5/8
28*/17*38/29
A
35*/26*9*/456/70
ll*/24*17*/10*19*/28*54/39
19*/30*19*/15*33*/36*29/19
C
Study 1
35*/247*/058/76
Study 2
10/20*18*/1822*/28*50/34
Study 3
13*/24*23*/20*21*/15*44/41
S
7/017*/076/100
25*/23*15*/426*/20*35/54
8*/20*12*/13*24*/23*46/44
O
44*/34*10*/146/65
23*/23*12/13*
21*/21*44/43
11718*24*/17*16*/16*54/49
Mean
38/2910/252/68
23/2813/1022/2442/39
17/2817/1526/2142/36
Note. Values for Waves 1 and 2 are separated by a slash. Relationship effects could not be estimated inStudy 1 because only one indicator was used to measure each factor. E = Extraversion; A = Agreeableness;C = Conscientiousness; S = Stability; O = Openness; Rel'p = relationship.*p<.05.
ance, our hypothesis was strongly supported. In fact, even afterthe first meeting, our target variance averaged 26%. Across the39 groups the target variance did not differ significantly fromWave 1 to Wave 2, f(38) = 1.44, ns. Although Extraversion washighest, as predicted (Mdn = 49%), it is noteworthy that wefound median values above 15% for all of the Big Five factors.
Hypothesis 1b: Rater variance. We hypothesized that ratervariance would be smaller than the Kenny norm of 20%. AtWave 2, we found means of 2, 10, and 15% in Studies 1, 2, and3, respectively, at Wave 2. Hence, this hypothesis was stronglysupported. Note that, at Wave 1, rater effects were slightlyhigher at 10,13, and 17%.
Hypothesis lc: Relationship variance. Relationship vari-ance could be separated from error in Studies 2 and 3. Here,relationship variance was consistently significant: Indeed, all 12effects in Table 2 were significant.
Averaged across traits, the values were slightly stronger thanthe Kenny norm of 20%. Specifically, in Studies 2 and 3, 23%and 24% of the variance was accounted for by relationshipeffects. As predicted, Agreeableness showed the highest value,with a mean of 32% at Wave 2, compared with a mean of 20%for the other four traits.
Hypothesis 2: Reciprocity
Reciprocity is the tendency for the rating A gives to B to cor-relate with the rating B gives to A. This tendency was measuredin the present studies by correlating stable relationship effectsacross all pairs of individuals who rated each other.
We computed significance with a two-tailed t test of the co-variance of each construct across all groups. The covariancesare used because, unlike correlations, they can be combinedacross groups. Only 2 of these 30 values (across the Big Five
factors at the two waves in the three studies) were significant; bychance alone, we would expect 1.5 of 30 to achieve significance.Thus, the hypothesis of no reciprocity was supported.
Hypothesis 3: Projection
Projection is the tendency for high scorers to give high scoresto others. Given that we had three kinds of target measuresavailable, there are three ways of measuring projection. Foreach factor, study, and wave, we correlated the mean rating givenby each person with (a) the mean rating received, (b) the ques-tionnaire score, and (c) the self-rating. Two sets of correlationsare provided in Table 3: The third set, correlations of ratings
Table 3Projection Effects Separated by Big Five Factor and Wave
Study
123
123
E A C S
Peer ratings given and peer ratings received
3/-344/813/38
47/-355/21*
44/32
51/-384/17
-28/-13
-100/1314/4753/14
Peer ratings given and questionnaire score
26/-300/27
34/26
82*/048*/74*48744*
35/2345*/-l40/14
-9170619/2728/02
O
4/042/-8
— 11/—53
23/029/296/-2
Note. Values for Waves 1 and 2 are separated by a slash. Each entry isa disattenuated correlation. Decimal points have been removed to savespace. E = Extraversion; A = Agreeableness; C = Conscientiousness; S= Stability; O = Openness.•p<.05 .
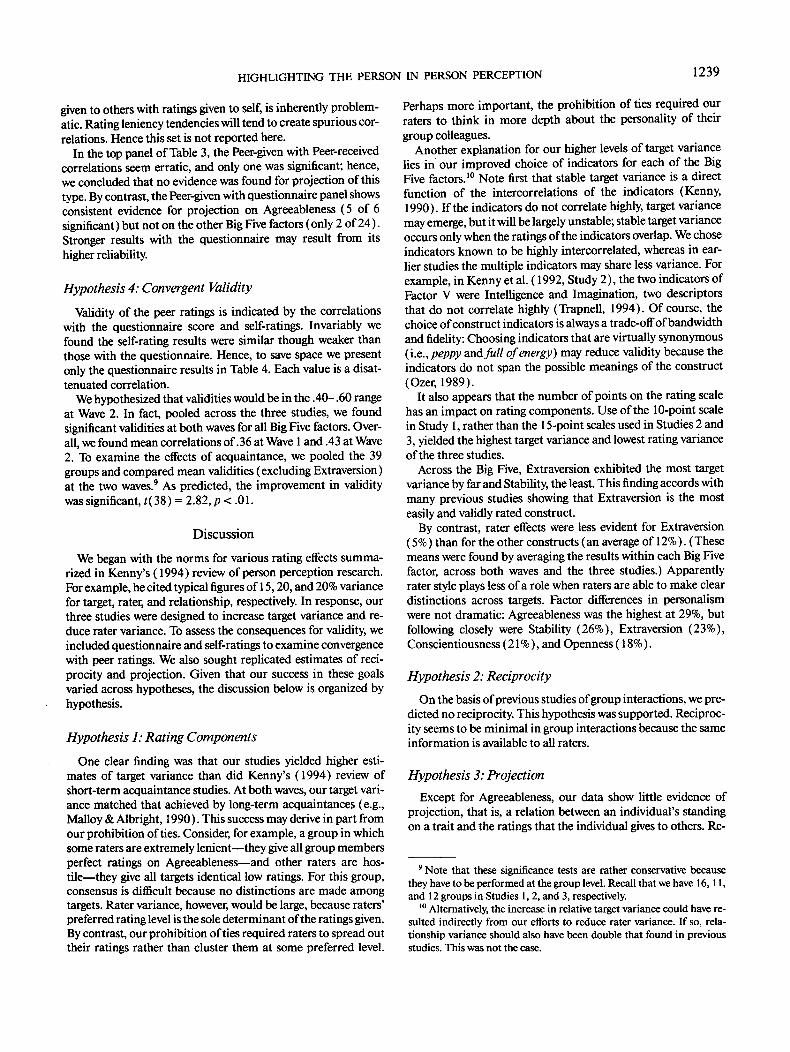
HIGHLIGHTING THE PERSON IN PERSON PERCEPTION 1239
given to others with ratings given to self, is inherently problem-atic. Rating leniency tendencies will tend to create spurious cor-relations. Hence this set is not reported here.
In the top panel of Table 3, the Peer-given with Peer-receivedcorrelations seem erratic, and only one was significant; hence,we concluded that no evidence was found for projection of thistype. By contrast, the Peer-given with questionnaire panel showsconsistent evidence for projection on Agreeableness (5 of 6significant) but not on the other Big Five factors (only 2 of 24).Stronger results with the questionnaire may result from itshigher reliability.
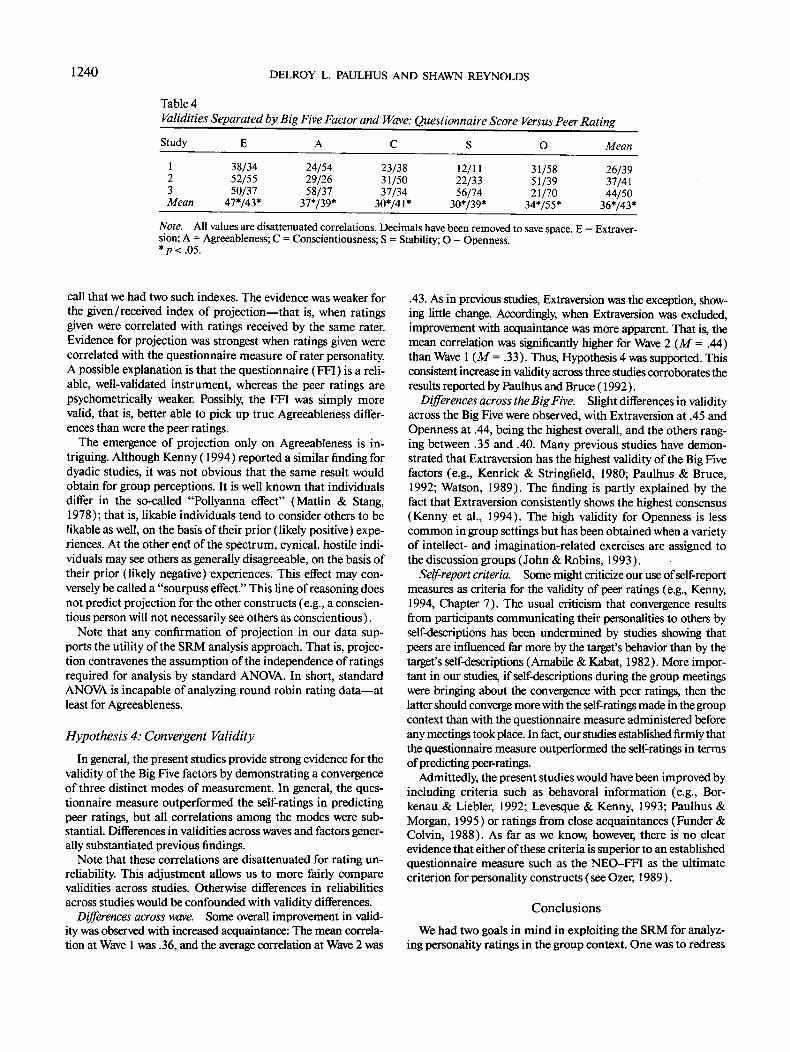
Hypothesis 4: Convergent Validity
Validity of the peer ratings is indicated by the correlationswith the questionnaire score and self-ratings. Invariably wefound the self-rating results were similar though weaker thanthose with the questionnaire. Hence, to save space we presentonly the questionnaire results in Table 4. Each value is a disat-tenuated correlation.
We hypothesized that validities would be in the .40- .60 rangeat Wave 2. In fact, pooled across the three studies, we foundsignificant validities at both waves for all Big Five factors. Over-all, we found mean correlations of .36 at Wave 1 and .43 at Wave2. To examine the effects of acquaintance, we pooled the 39groups and compared mean validities (excluding Extraversion)at the two waves.9 As predicted, the improvement in validitywas significant, t(38) = 2.82, p < .01.
Discussion
We began with the norms for various rating effects summa-rized in Kenny's (1994) review of person perception research.For example, he cited typical figures of 15,20, and 20% variancefor target, rater, and relationship, respectively. In response, ourthree studies were designed to increase target variance and re-duce rater variance. To assess the consequences for validity, weincluded questionnaire and self-ratings to examine convergencewith peer ratings. We also sought replicated estimates of reci-procity and projection. Given that our success in these goalsvaried across hypotheses, the discussion below is organized byhypothesis.
Hypothesis 1: Rating Components
One clear finding was that our studies yielded higher esti-mates of target variance than did Kenny's (1994) review ofshort-term acquaintance studies. At both waves, our target vari-ance matched that achieved by long-term acquaintances (e.g.,Malloy & Albright, 1990). This success may derive in part fromour prohibition of ties. Consider, for example, a group in whichsome raters are extremely lenient—they give all group membersperfect ratings on Agreeableness—and other raters are hos-tile—they give all targets identical low ratings. For this group,consensus is difficult because no distinctions are made amongtargets. Rater variance, however, would be large, because raters'preferred rating level is the sole determinant of the ratings given.By contrast, our prohibition of ties required raters to spread outtheir ratings rather than cluster them at some preferred level.
Perhaps more important, the prohibition of ties required ourraters to think in more depth about the personality of theirgroup colleagues.
Another explanation for our higher levels of target variancelies in our improved choice of indicators for each of the BigFive factors.10 Note first that stable target variance is a directfunction of the intercorrelations of the indicators (Kenny,1990). If the indicators do not correlate highly, target variancemay emerge, but it will be largely unstable; stable target varianceoccurs only when the ratings of the indicators overlap. We choseindicators known to be highly intercorrelated, whereas in ear-lier studies the multiple indicators may share less variance. Forexample, in Kenny et al. (1992, Study 2), the two indicators ofFactor V were Intelligence and Imagination, two descriptorsthat do not correlate highly (Trapnell, 1994). Of course, thechoice of construct indicators is always a trade-offof bandwidthand fidelity: Choosing indicators that are virtually synonymous(i.e., peppy and full of energy) may reduce validity because theindicators do not span the possible meanings of the construct(Ozer, 1989).
It also appears that the number of points on the rating scalehas an impact on rating components. Use of the 10-point scalein Study 1, rather than the 15-point scales used in Studies 2 and3, yielded the highest target variance and lowest rating varianceof the three studies.
Across the Big Five, Extraversion exhibited the most targetvariance by far and Stability, the least. This finding accords withmany previous studies showing that Extraversion is the mosteasily and validly rated construct.
By contrast, rater effects were less evident for Extraversion(5%) than for the other constructs (an average of 12%). (Thesemeans were found by averaging the results within each Big Fivefactor, across both waves and the three studies.) Apparentlyrater style plays less of a role when raters are able to make cleardistinctions across targets. Factor differences in personalismwere not dramatic: Agreeableness was the highest at 29%, butfollowing closely were Stability (26%), Extraversion (23%),Conscientiousness (21%), and Openness (18%).
Hypothesis 2: Reciprocity
On the basis of previous studies of group interactions, we pre-dicted no reciprocity. This hypothesis was supported. Reciproc-ity seems to be minimal in group interactions because the sameinformation is available to all raters.
Hypothesis 3: Projection
Except for Agreeableness, our data show little evidence ofprojection, that is, a relation between an individual's standingon a trait and the ratings that the individual gives to others. Re-
9 Note that these significance tests are rather conservative becausethey have to be performed at the group level. Recall that we have 16,11,and 12 groups in Studies 1,2, and 3, respectively.
10 Alternatively, the increase in relative target variance could have re-sulted indirectly from our efforts to reduce rater variance. If so, rela-tionship variance should also have been double that found in previousstudies. This was not the case.
1240 DELROY L. PAULHUS AND SHAWN REYNOLDS
Table 4Validities Separated by Big Five Factor and Wave: Questionnaire Score Versus Peer Rating
Study E A C S O Mean
123Mean
38/3452/5550/37
47*/43*
24/5429/2658/37
37*/39*
23/3831/5037/34
30*/41*
12/1122/3356/74
30*/39*
31/5851/3921/70
34*/55*
26/3937/4144/50
36*/43*
Note. All values are disattenuated correlations. Decimals have been removed to save space. E = Extraver-sion; A = Agreeableness; C = Conscientiousness; S = Stability; O = Openness*p<.05.
call that we had two such indexes. The evidence was weaker forthe given/received index of projection—that is, when ratingsgiven were correlated with ratings received by the same rater.Evidence for projection was strongest when ratings given werecorrelated with the questionnaire measure of rater personality.A possible explanation is that the questionnaire (FFI) is a reli-able, well-validated instrument, whereas the peer ratings arepsychometrically weaker. Possibly, the FFI was simply morevalid, that is, better able to pick up true Agreeableness differ-ences than were the peer ratings.
The emergence of projection only on Agreeableness is in-triguing. Although Kenny (1994) reported a similar finding fordyadic studies, it was not obvious that the same result wouldobtain for group perceptions. It is well known that individualsdiffer in the so-called "Pollyanna effect" (Matlin & Stang,1978); that is, likable individuals tend to consider others to belikable as well, on the basis of their prior (likely positive) expe-riences. At the other end of the spectrum, cynical, hostile indi-viduals may see others as generally disagreeable, on the basis oftheir prior (likely negative) experiences. This effect may con-versely be called a "sourpuss effect." This line of reasoning doesnot predict projection for the other constructs (e.g., a conscien-tious person will not necessarily see others as conscientious).
Note that any confirmation of projection in our data sup-ports the utility of the SRM analysis approach. That is, projec-tion contravenes the assumption of the independence of ratingsrequired for analysis by standard ANOVA. In short, standardANO\A is incapable of analyzing round robin rating data—atleast for Agreeableness.
Hypothesis 4: Convergent Validity
In general, the present studies provide strong evidence for thevalidity of the Big Five factors by demonstrating a convergenceof three distinct modes of measurement. In general, the ques-tionnaire measure outperformed the self-ratings in predictingpeer ratings, but all correlations among the modes were sub-stantial. Differences in validities across waves and factors gener-ally substantiated previous findings.
Note that these correlations are disattenuated for rating un-reliability. This adjustment allows us to more fairly comparevalidities across studies. Otherwise differences in reliabilitiesacross studies would be confounded with validity differences.
Differences across wave. Some overall improvement in valid-ity was observed with increased acquaintance: The mean correla-tion at Wave 1 was .36, and the average correlation at Wave 2 was
.43. As in previous studies, Extroversion was the exception, show-ing little change. Accordingly, when Extraversion was excluded,improvement with acquaintance was more apparent. That is, themean correlation was significantly higher for Wave 2 (M = .44)than Wave 1 {M = .33). Thus, Hypothesis 4 was supported. Thisconsistent increase in validity across three studies corroborates theresults reported by Paulhus and Bruce (1992).
Differences across the Big Five. Slight differences in validityacross the Big Five were observed, with Extraversion at .45 andOpenness at .44, being the highest overall, and the others rang-ing between .35 and .40. Many previous studies have demon-strated that Extraversion has the highest validity of the Big Fivefactors (e.g., Kenrick & Stringfield, 1980; Paulhus & Bruce,1992; Watson, 1989). The finding is partly explained by thefact that Extraversion consistently shows the highest consensus(Kenny et al., 1994). The high validity for Openness is lesscommon in group settings but has been obtained when a varietyof intellect- and imagination-related exercises are assigned tothe discussion groups (John & Robins, 1993).
Self-report criteria. Some might criticize our use of self-reportmeasures as criteria for the validity of peer ratings (e.g., Kenny,1994, Chapter 7). The usual criticism that convergence resultsfrom participants communicating their personalities to others byself-descriptions has been undermined by studies showing thatpeers are influenced far more by the target's behavior than by thetarget's self-descriptions (Amabile & Kabat, 1982). More impor-tant in our studies, if self-descriptions during the group meetingswere bringing about the convergence with peer ratings, then thelatter should converge more with the self-ratings made in the groupcontext than with the questionnaire measure administered beforeany meetings took place. In fact, our studies established firmly thatthe questionnaire measure outperformed the self-ratings in termsof predicting peer-ratings.
Admittedly, the present studies would have been improved byincluding criteria such as behavoral information (e.g., Bor-kenau & Liebler, 1992; Levesque & Kenny, 1993; Paulhus &Morgan, 1995) or ratings from close acquaintances (Funder &Colvin, 1988). As far as we know, however, there is no clearevidence that either of these criteria is superior to an establishedquestionnaire measure such as the NEO-FFI as the ultimatecriterion for personality constructs (see Ozer, 1989).
Conclusions
We had two goals in mind in exploiting the SRM for analyz-ing personality ratings in the group context. One was to redress
HIGHLIGHTING THE PERSON IN PERSON PERCEPTION 1241
the impression from Kenny's (1994) review that the person isrelatively unimportant in person perception. We showed that,even for short-term acquaintance, target variance could beboosted well beyond the 15% "rule" and that rater variancecould be reduced well below the 20% rule: Thus, our first goalwas clearly attained. In short, our person-perception methodol-ogy put more emphasis on the person and less on the perception.This study bridges the gap between the short-term and long-term acquaintance studies reviewed by Kenny et al. (1994).That is, we achieved target variance as high as that of long-termacquaintance studies within a short-term acquaintance para-digm. Higher target variance, in turn, allowed us to achieve sub-stantial validities for all of the Big Five factors.
The inquiring reader might retort that Kenny's 15% rule is stilla more typical figure for group rating studies. Rather than debatingwhat a typical study is, we would simply warn that researchersshould not expect high target variance and validity on personalityfactors that participants are not given an opportunity to manifest.Inclusion of appropriate exercise and requiring participation willrectify this. Undebatable is the conclusion that tighter methodol-ogy (disallowing ties, etc.) will yield higher target variance. As onereviewer pointed out: Although participant judges do not usuallylike to make fine distinctions, this doesn't mean they are unable todo so. In sum, future researchers should always be able to exceedthe 15% rule on target variance.
Our second goal was to evaluate a number of rating effects thathad not been emphasized in earlier SRM studies. This goal alsowas accomplished. Reciprocity was confirmed to be minimal inthe group context. On the other hand, projection was found, butonly on the Agreeableness factor. In estimating all the above effects,we tried to be as comprehensive and thorough as possible: We em-ployed three modes of measurement across all the Big Five factors,and we replicated our procedure three times.
Perhaps most striking among our results is clear evidence fora consensus-accuracy paradox—that is, acquaintance in-creases accuracy without a corresponding increase in consen-sus. Pooled ratings do not converge, yet they become more ac-curate. This phenomenon was predicted earlier by Kenny's(1991) Weighted-Average Model of person perception. Kennyexplained that high overlap of information available to raters,as in our discussion groups, yields a high initial target consensusthat is unlikely to increase with acquaintance. After the firstmeeting, raters may all agree on stereotypic inferences to bedrawn from that impoverished information. For example, ini-tial stereotypes may be based on sex or race. With further ac-quaintance, the consensus shared by raters becomes graduallymore aligned with the target's character. Stereotypes can be asconsensual as informed impressions, but they are not asaccurate.
References
Amabile, T. M., & Kabat, L. G. (1982). When self-description contra-dicts behavior: Actions do speak louder than words. Social Cognition,7,311-325.
Berry, D. S. (1990). Taking people at face value: Evidence for the kernelof truth hypothesis. Social Cognition, 8, 343-361.
Borkenau, P., & Liebler, A. (1992). Trait inferences: Sources of validityat zero acquaintance. Journal of Personality and Social Psychology,62, 645-657.
Burisch, M. (1984). Approaches to personality inventory construction:A comparison of merits. American Psychologist, 39, 214-227.
Byrne, D. (1971). The attraction paradigm. New York: Academic Press.Campbell, D. T, Miller, N., Lubetsky, J., & O'Connell, E. J. (1964).
Varieties of projection in factor attribution. Psychological Mono-graphs, 78, 1-33.
Campbell, J. D. (1986). Similarity and uniqueness: The effects of attri-bute type, relevance, and individual differences in self-esteem anddepression. Journal of Personality and Social Psychology, 52, 281-294.
Costa, P. X, Jr., & McCrae, R. R. (1989). NEO PI/FFI manual supple-ment. Odessa, FL: Psychological Assessment Resources.
Funder, D. C, & Colvin, C. R. (1988). Friends and strangers: Acquain-tanceship, agreement, and the accuracy of personality judgment.Journal of Personality and Social Psychology, 55, 149-158.
Funder, D. C, & West, S. G. (1993). Consensus, self-other agreement,and accuracy in personality judgment: An introduction. Journal ofPersonality, 61, 457-476.
Graziano, W. G., & Eisenberg, N. H. (in press). Agreeableness: A di-mension of personality. In R. Hogan, J. Johnson, & S. R. Briggs(Eds.), Handbook of personality psychology. San Diego, CA: Aca-demic Press.
John, O. P. (1990). The "Big Five" factor taxonomy: Dimensions ofpersonality in the natural language and in questionnaires. InL. A. Pervin (Ed.), Handbook of personality: Theory and research(pp. 66-100). New York: Guilford Press.
John, O. P., & Robins, R. W. (1993). Determinants of interjudgeagreement on personality traits: The Big Five domains, observability,evaluativeness, and the unique perspective of the self. Journal of Per-sonality, 61, 521-551.
Kenny, D. A. (1990). SOREMO: Version V. Unpublished manual, Uni-versity of Connecticut.
Kenny, D. A. (1991). A general model of consensus and accuracy ininterpersonal perception. Psychological Review, 98, 155-163.
Kenny, D. A. (1994). Interpersonal perception: A social relations anal-ysis. New York: Guilford Press.
Kenny, D. A., Albright, L., Malloy, T. E., & Kashy, D. A. (1994). Con-sensus in interpersonal perception: Acquaintance and the Big Five.Psychological Bulletin, 116, 245-258.
Kenny, D. A., Homer, C, Kashy, D. A., & Chu, L. (1992). Consensusat zero acquaintance: Replication, behavioral cues, and stability.Journal of Personality and Social Psychology, 62, 88-97.
Kenny, D. A., & La Voie, L. (1984). The social relations model. InL. Berkowitz (Ed.), Advances in experimental social psychology (Vol.19, pp. 141-182). New York: Academic Press.
Kenrick, D. T., & Stringfield, D. O. (1980). Personality traits and theeye of the beholder: Crossing some traditional philosophical bound-aries in the search for consistency in all of the people. PsychologicalReview, 87, 88-104.
Kiesler, D. J. (1983). The 1982 interpersonal circle: A taxonomy forcomplementarity in human transactions. Psychological Review, 90,185-214.
Kirk, R. E. (1968). Experimental design: Procedures for the behavioralsciences. Belmont, CA: Wadsworth.
Levesque, M. J., & Kenny, D. A. (1993). Accuracy of behavioral pre-dictions at zero acquaintance: A social relations analysis. Journal ofPersonality and Social Psychology, 65, 1178-1189.
Malloy, T. E., & Albright, L. (1990). Interpersonal perception in a so-cial context. Journal of Personality and Social Psychology, 58, 419-428.
Matlin, M. W., & Stang, D. J. (1978). The Polyanna Principle: Selectiv-ity in language, memory, and thought. Cambridge, MA: Schenkman.
McCrae, R. R., & Costa, P. T. (1987). Validation of the five-factor
1242 DELROY L. PAULHUS AND SHAWN REYNOLDS
model of personality across instruments and observers. Journal ofPersonality and Social Psychology, 52, 81-90.
Montgomery, B. (1984). Individual differences and relational interde-pendences in social interaction. Human Communication Research,11, 33-60.
Ozer, D. J. (1989). Construct validity in personality assessment. InD. M. Buss&N. Cantor (E&s.), Personality psychology: Recent trendsand emerging directions (pp. 224-234). New York: Springer-Verlag.
Park, B., & Judd, C. M. (1989). Agreement on initial impressions:Differences due to perceivers, trait dimensions, and target behaviors.Journal of Personality and Social Psychology, 56,493-505.
Paulhus, D. L., & Bruce, M. N. (1992). The effect of acquaintanceshipon the validity of personality impressions: A longitudinal study.Journal of Personality and Social Psychology, 56, 493-505.
Paulhus, D. L., Fridhandler, B., & Hayes, S. (in press). Psychologicaldefense: Contemporary theory and research. In R. Hogan, J. John-son, & S. R. Briggs (Eds.), Handbook of personality psychology. SanDiego: Academic Press.
Paulhus, D. L., & Morgan, K. L. (1995). Determinants of perceivedintelligence in leaderless groups I: Shyness and acquaintance. Manu-script submitted for publication.
Piedmont, R. L. (1994). Validation of the NEO PI-R observer form for
college students: Toward a paradigm for studying personality devel-opment. Assessment, 1, 259-268.
Sherwood, G. G. (1980). Self-serving biases in person perception: A re-examination of projection as a mechanism of defense. PsychologicalBulletin, 90, 445-459.
Trapnell, P. D. (1994). Openness versus intellect: A lexical left-turn.European Journal of Personality, 8, 273-290.
Trope, Y, & Higgins, E. T. (1993). Inferring personal dispositions frombehavior. Personality and Social Psychology Bulletin, 18, (Special is-sue, Whole No. 5).
Warner, R. M., Kenny, D. A., & Stoto, M. (1979). A new round robinanalysis of variance for social interaction data. Journal of Personalityand Social Psychology, 37, 1742-1757.
Watson, D. (1989). Strangers' ratings of the five robust personality fac-tors: Evidence of a surprising convergence with self-report. Journalof Personality and Social Psychology, 57, 120-128.
Wiggins, J. S., & Trapnell, P. D. (in press). Personality structure: Thereturn of the Big Five. In R. Hogan, J. Johnson, & S. R. Briggs (Eds.),Handbook of personality psychology. San Diego: Academic Press.
Received September 7, 1994Revision received April 12, 1995
Accepted April 13, 1995 •