enhancing regional and remote connectivity · enhancing regional and remote connectivity ... repair...
TRANSCRIPT
Enhancing Regional and Remote Connectivity
Aero Expo India-2016Civil Aviation Convention & Exhibition
“Enabling Air Connectivity”
Presented to:Shri P. Ashok Gajapathi Raju
Hon'ble Minister of Civil Aviation Shri Jayant SinhaMoS Civil Aviation
2
TITLE Enhancing Regional & Remote Air Connectivity
YEAR 2016
AUTHOR AUCTUS ADVISORS
COPYRIGHT No part of this publication may be reproduced in any form by photo, photo print, microfilm or any
other means without the written permission of AUCTUS ADVISORS Pvt. Ltd.
DISCLAIMER
This report is the publication of AUCTUS ADVISORS Private Limited (“AUCTUS ADVISORS”) and so
AUCTUS ADVISORS has editorial control over the content, including opinions, advice, statements,
services, offers etc. that is represented in this report. However, AUCTUS ADVISORS will not be liable
for any loss or damage caused by the reader’s reliance on information obtained through this report.
This report may contain third-party contents and third-party resources. AUCTUS ADVISORS takes no
responsibility for third part content, advertisements or third-party applications that are printed on or
through this report, nor does it take any responsibility for the goods or services provided by its
advertisers or for any error, omission, deletion, defect, theft or destruction or unauthorized access to,
or alteration of, any user communication. Further, AUCTUS ADVISORS does not assume any
responsibility or liability for any loss or damage, including personal injury or death, resulting from use
of this report or from any content for communications or materials available on this report. The
contents are provided for your reference only.
The reader/ buyer understands that except for the information, products and services clearly identified
as being supplied by AUCTUS ADVISORS, it does not operate, control or endorse any information,
products, or services appearing in the report in any way. All other information, products and services
offered through the report are offered by third parties, which are not affiliated in any manner to
AUCTUS ADVISORS.
The reader/ buyer hereby disclaims and waives any right and/ or claim, they may have against
AUCTUS ADVISORS with respect to third-party products and services.
All materials provided in the report is provided on “As is” basis and AUCTUS ADVISORS makes no
representation or warranty, express or implied, including, but not limited to, warranties of
merchantability, fitness for a particular purpose, title or non – infringement. As to documents, contents,
graphics published in the report, AUCTUS ADVISORS makes no representation or warranty that the
contents of such documents, articles are free from error or suitable for any purpose; not that the
implementation of such contents will not infringe any third-party patents, copyrights trademarks or
other rights.
In no event shall AUCTUS ADVISORS or its content providers be liable for any damages whatsoever,
whether direct, indirect, special, consequential and/ or incidental, including without limitation, damages
arising from loss of data or information, loss of profits, business interruption, or arising from the access
and/ or use of content and/ or any service available in this report, even if AUCTUS ADVISORS is
advised of the possibility of this loss.
CONTACTS
AUCTUS ADVISORS Pvt. Ltd.
Manish Chheda
Managing Director
Abhilash Singh
Director
+91 9999 024 157
PHD Chamber of Commerce & Industry
Yogesh Srivastav
Director
+91 9971 998 934


Milan HovorkaAmbassador
New Delhi, 8 November 2016
I am glad to note that PHD Chamber of Commerce and Industry is organizing a timely Aviation Exposition -AERO EXPO INDIA -Civil Aviation Convention & Exhibition with a focus on Enabling Air Connectivity on November 18-19, 2016, at New Delhi, IGI Airport (near the new Air Traffic Control Tower).
The Indian government has taken bold decisions for reforms in the aviation sector, thus opening doors for furthering mutual international business collaborations.
The Czech Republic as a country with a long-standing aviation tradition is keen to be a reliable partner of India in transforming its visions and ambitions into reality. It has made a strong presence in the aerospace sector due to its outstanding quality, reliability and innovation in the industry. From basic production to final aircraft assembly and cutting-edge research and development programmes, the local aerospace industry has progressed significantly with most Czech companies and institutions working with top international industry players.
The Czech aerospace industry has advanced to the level of global competitiveness in terms of quality and innovation while maintaining some advantages of an emerging market for investors. We are convinced that both the Czech Republic and India can gain a lot it they join efforts in implementing a new Civil Aviation Policy of India.
It is our pleasure to be a part of AERO EXPO INDIA and look forward to expanding our businesses in the aviation sector with India.
I wish PHD Chamber all the success for AERO EXPO INDIA.
Embassy of the Czech Republicin New Delhi
50-M, Niti Marg, Chanakyapuri, New Delhitel.: +91-11-2415 5200, fax: +91-11-2415 [email protected]/newdelhiwww.facebook.com/czech.embassy.newdelhi


14
CONTENTS
1. INTRODUCTION ............................................................................................................................ 16
2. OVERVIEW OF AVIATION INDUSTRY ............................................................................................. 18
2.1 Global Aviation Industry Overview ............................................................................................. 18
2.2 Domestic Macro-Economic Indicators ........................................................................................ 22
2.3 Indian Aviation Industry .............................................................................................................. 24
3. SALIENT FEATURES OF NCAP 2016 ............................................................................................... 31
3.1 Regional Connectivity Scheme: ................................................................................................... 31
3.2 Route Dispersion Guidelines (RDG) ............................................................................................ 31
3.3 Change in 5/20 Rule .................................................................................................................... 31
3.4 Air Cargo ...................................................................................................................................... 32
3.5 Ground Handling Policy............................................................................................................... 32
3.6 Airport Development through PPP/AAI ...................................................................................... 32
3.7 Bilateral Traffic Rights ................................................................................................................. 32
3.8 Helicopters and Charters ............................................................................................................ 33
3.9 Maintenance, Repair and Overhaul (MRO) ................................................................................ 33
3.10 Skill Development ..................................................................................................................... 33
4. REGIONAL CONNECTIVITY SCHEME .............................................................................................. 34
4.1 Objective of RCS .......................................................................................................................... 34
4.2 Announcement of RCS ................................................................................................................ 34
4.3 Key Constructs of the Scheme .................................................................................................... 35
4.4 Implications of the Scheme on Stakeholders .............................................................................. 36
4.5 Existing Availability of Aircrafts in India for RCS ......................................................................... 37
4.6 Key Imperatives for the Launch of a RCS Flight .......................................................................... 37
4.7 Key Decisions for Airline Operators ............................................................................................ 41
5. OPERATIONALIZATION OF RCS ..................................................................................................... 44
5.1 Air Navigation Services ............................................................................................................... 44
5.2 Airline Staff Availability ............................................................................................................... 45
5.3 Infrastructure Creation & Management ..................................................................................... 46
5.4 Provision of Airport Security ....................................................................................................... 49
15
List of Figures Figure 1: August 2016 load factors for major markets ......................................................................... 18
Figure 2: YoY August 2016 growth ........................................................................................................ 19
Figure 3: Domestic air traffic growth (2014-2034) ............................................................................... 19
Figure 4: Total Freight market load factor % of AFTKs ......................................................................... 20
Figure 5: Growth in FTKs by carrier region (Month-on-Month growth for August 2016) .................... 20
Figure 6: Growth in GDP (%) ................................................................................................................. 22
Figure 7: 2015 Annual PAX traffic for key aviation markets (million) ................................................... 24
Figure 8: YTD 2016 (Till Sep) Domestic traffic Market share (%) .......................................................... 25
Figure 9: Growth in Passenger Traffic in India ...................................................................................... 26
Figure 10: Domestic Passenger Market Comparison of August 2016 vs. August 2015 ........................ 26
Figure 11: Illustration on VGF changes based on aircraft load factors ................................................. 43
List of Tables
Table 1: India vs China comparison on key aviation metrics ................................................................ 24
Table 2: Key players in Indian aviation industry (Non-exhaustive)1 ..................................................... 25
Table 3: Global benchmark of Dwell time vis-a –vis Indian airports .................................................... 27
Table 4: Contribution of Top 10 cities to National Domestic Traffic .................................................... 30
Table 5: List of aircrafts with less than 80 seats ................................................................................... 37
Table 6: Manpower requirement of airline per new RCS airport ......................................................... 45
Table 7: Operational facilities for various types of Aircraft .................................................................. 47
Table 8: Terminal Design Considerations.............................................................................................. 48
16
1. INTRODUCTION
Civil Aviation is strongly correlated with
economic growth and development of a
country. As per an ICAO study - “Economic
benefits of civil aviation: ripples of prosperity”,
aviation has a multiplier effect on the output
and employment in the country - every 100
Rupees spent on air transport generates 325
Rupees worth of benefits, and every 100 direct
jobs in air transport result in 610 jobs in the
economy as a whole. As per the study, civil
transport accounts for ~4.5% of global GDP.
The last decade has witnessed significant
expansion across passenger and freight traffic,
number of operational airports and aircrafts,
and investments in the sector. The first half of
the last decade saw the Indian Aviation
Industry being bogged down by a period of
high fuel prices, effects of a global financial
crisis and limited pricing power which
contributed to industry wide over-capacity.
However, during the later part of the decade,
supported by the strong macro-economic
indicators the sector has emerged stronger.
This part also saw the industry environment
becoming more conducive, with low ATF prices
and rationalization in seat capacity owing to
restructuring in the airline industry.
Overall, during the last decade domestic
passenger traffic in India has more than
trebled. Today, India is the 10th largest and
fastest growing aviation market in the world.
The first 8 months of 2016 have seen the
monthly domestic traffic growing at 20%+
(compared to similar period last year), and as
per IATA, India is expected to become the third
largest aviation market by 2026.
Even with the high growth rate in the last
decade, India’s air travel penetration is just
0.08 air trips per capita per annum, much
lower than developed countries like the U.S.
and Australia (22-35x India’s air travel
penetration) and even developing countries
like China and Brazil (4-7x India’s air travel
penetration). Over the next decade, rising
disposable incomes are expected to
significantly enhance the penetration of air
travel in India.
Supported by the growing demand and large
untapped potential, in recent years we are
seeing renewed interest by many domestic and
international players in the aviation sector.
This interest is across airlines as well as the
airports business. According to data released
by the Department of Industrial Policy and
Promotion (DIPP), FDI inflows in air transport
(including air freight) between April 2000 and
March 2016 stood at USD 931 Mn. With the
change in FDI rules for both airlines and airport
development, FDI in the sector is expected to
increase further.
With the positive outlook of macro-economic
factors, low ATF prices and industry-friendly
government policies, India is well placed to
become the third largest aviation market by
2026. Currently, India’s aviation industry caters
to nearly 168 million domestic and 53 million
international passengers. Over the next
decade, the market is expected to reach 337
million domestic and 84 million international
passengers.
In line with the increasing passenger traffic in
India, Boeing projects India's demand for
aircraft to touch 1,850, valued at USD 265 Bn,
over the next 20 years. This would account for
4.6% of global volumes of aircraft over the
same period.
Following are the main demand side drivers
supporting traffic growth:
Increase in demand due to growing middle
class and improvement in the overall
business sentiment leading to increase in
economic activities
17
Rise in PPP adjusted GDP per capita reaching
USD 5,700 – leaving greater disposable
income with the population (at a gross of USD
1.7 Tn per year)
Growth in travel and tourism industry –
forecast to reach USD 271 Bn by 2023
Declining travel cost due to increased
efficiency
On the supply side, the following drivers can
aid in the growth of Indian aviation
Private sector participation in infrastructure
development through PPP model,
(development of Greenfield airport such as
Mopa Goa and Navi Mumbai)
Growth of new carriers like Vistara and Air
Asia. Additionally, many regional airlines are
also entering the market to capture the
regional & remote demand
With increasing importance of India for
global airlines, many global carriers have
shown interest in investing in new regional
carriers, e.g. Pegasus
While the Indian Aviation Sector has a strong
base for growth, it has been constrained by
issues including lack of adequate
infrastructure, limited connectivity in remote
and regional areas, restrictive policies,
distorted airline cost structure on account of
high ATF taxes and high crude prices
(historically).
Part of this is reflective in the fact that most of
the historical air traffic growth has come from
the major airport cities in India, which offer
adequate infrastructure, high load factors and
profitable yields for airlines. Over the last
decade, the share of top 10 airports has
increased from 67% to 75%.
Initiatives for long term growth
In the recent years, GoI has also taken multiple
initiatives to help this sector achieve its full
potential. This includes numerous forward-
looking policies like the Open Skies Policy,
allowance for FDI in aviation sector (100%
foreign equity in airport development), and
allowance of direct ATF imports by airlines etc.
In October 2016, GoI came up with a new civil
aviation policy (NCAP) focusing on making
flying affordable and convenient for the
masses. The NCAP 2016 focuses on addressing
key challenges faced by the aviation industry
including lack of remote connectivity, high
ticket prices and lack of incentives for the
airlines to expand to cities beyond the state
capitals. The policy also encourages
investment and participation of private sector
and states in the sector. This report outlines
the New Civil Aviation Policy 2016 with special
focus on the Regional Connectivity Scheme.
18
2. OVERVIEW OF AVIATION INDUSTRY
2.1 Global Aviation Industry Overview
Supported by low fuel prices, consolidation in
major markets (such as US) and high load
factors due to rebound in global economy, the
global airline industry is growing profitably.
Altogether, more than 3.5 billion passenger
segments were flown in 2015, an increase of
240 million compared to 2014. As per The
International Air Transport Association (IATA),
global air transport industry is expected to
have profits upwards of USD 39.4 Bn in 2016
with an aggregate net profit margin of 5.6%.
2016 is expected to be the fifth consecutive
year of improving aggregate industry profits.
Globally, airlines added capacity cautiously in
2015 despite strong passenger demand.
Available seat kilometres flown increased 6.7%
compared with 2014, and the industry-wide
passenger load factor increased 0.6
percentage points over 2014 to an all-time high
of 80%.
If we look deeper, there are stark differences
in performance across regions. Over half of the
industry profits are generated in North
America while African carriers are expected to
continue generating an overall loss. The US
dominates the world aviation market and the
top 3 airlines in the world by RPK are US based.
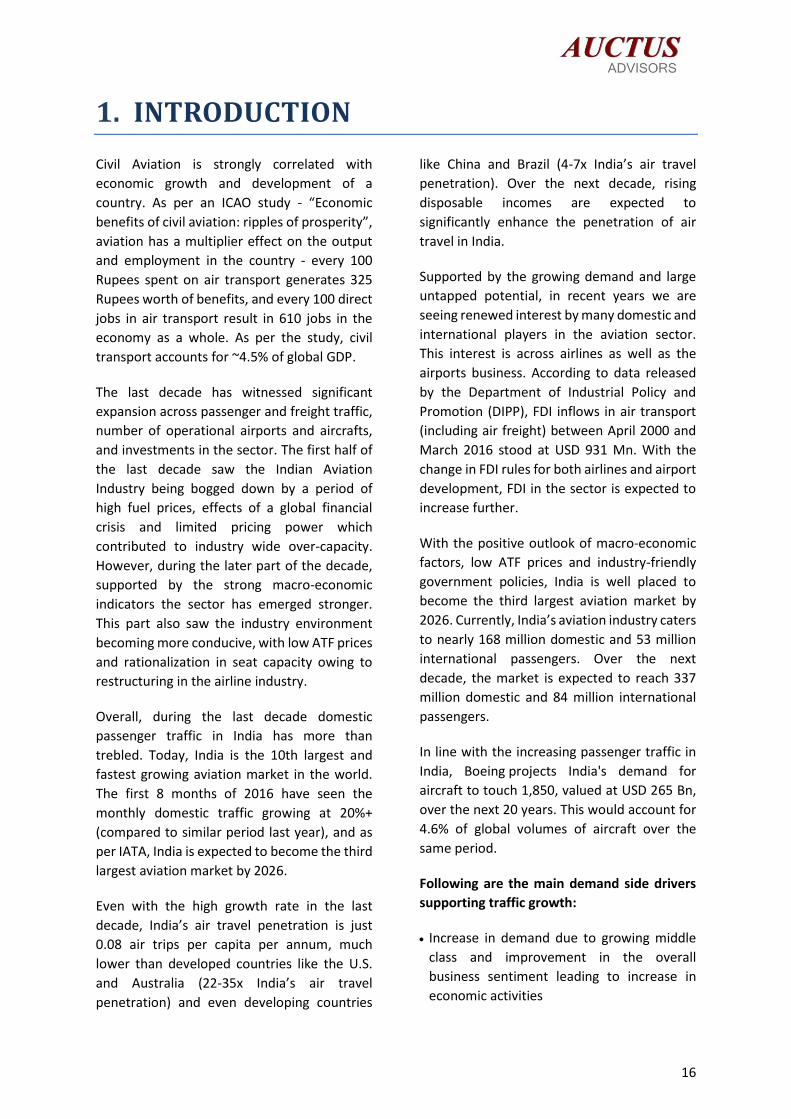
Figure 1: August 2016 load factors for major markets
Source: CAPA
However, the period of US and European
dominance in global aviation market is
gradually changing, with the rapid growth of
air travel in developing markets, such as Latin
America and especially Asia. This dominance is
especially challenged by the strong passenger
traffic growth in China / India as well as by the
emerging dominance of Middle East carriers
such as Emirates, Etihad and Qatar Airways
which are stealing a larger share of long-haul
Asia-Europe and Asia-US routes.
76.9% 77.9%
85.1%82.8%
73.1%
86.5%84.9%
Australia Brazil China India Japan Russia US
19
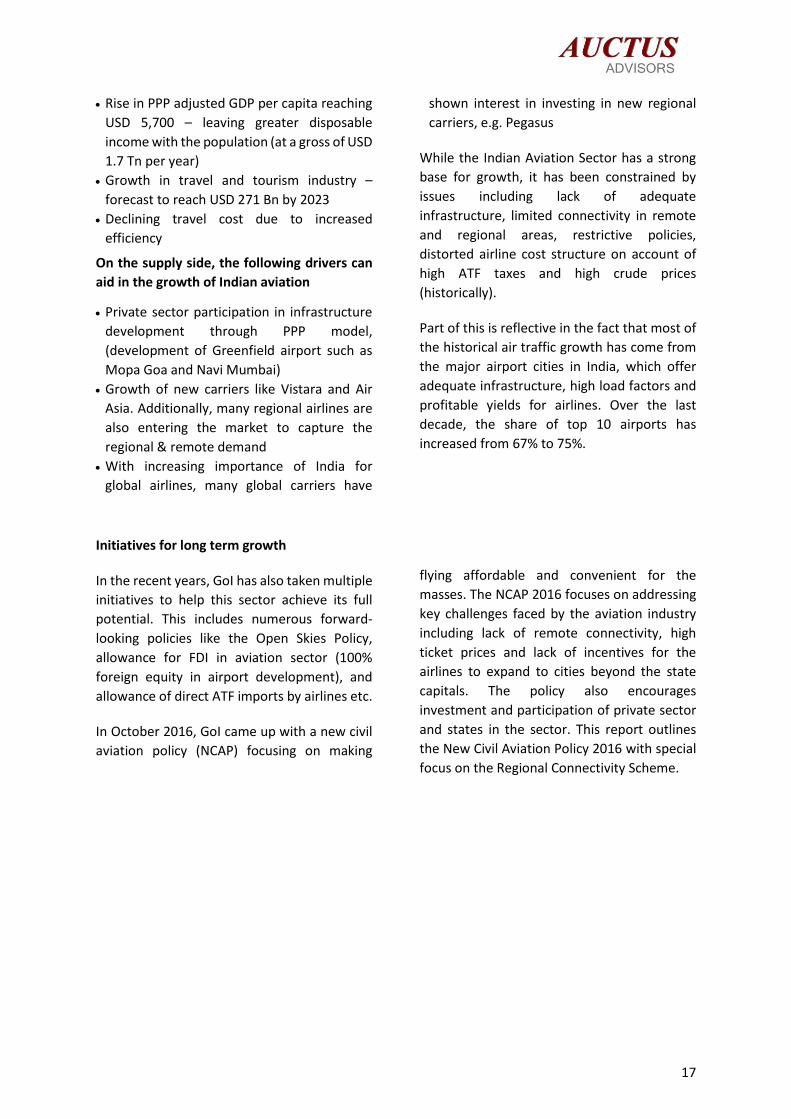
Figure 2: YoY August 2016 growth
Source: CAPA
As per August 2016 traffic data, the Middle
Eastern region was the fastest growing region
with 10.3% traffic increase followed by Asia
Pacific. Growth in Asia Pacific was largely
driven by India (23.2% YoY) and China (12.0%
YoY). LCCs continue to experience above-
average growth rates, particularly in emerging
economies with many first-time fliers.
Main growth drivers for passenger traffic
Oil Prices: Compared to the last decade, oil
prices are expected to remain low over the
longer term period.
Rising disposable income in emerging nations:
Emerging nations have very low air trip density
as compared to developed nations. With rising
prosperity, many first-time passengers from
these countries will join the list of fliers.
Declining Travel cost: In the coming two
decades, the real cost of air travel is expected
to show a downward trend, at a rate of around
1 – 1.5% per year driven by larger and more
fuel efficient aircrafts.
Improved air connectivity: Additionally air
connectivity is also expected to increase with
the addition of new longer-range mid-size
aircraft.
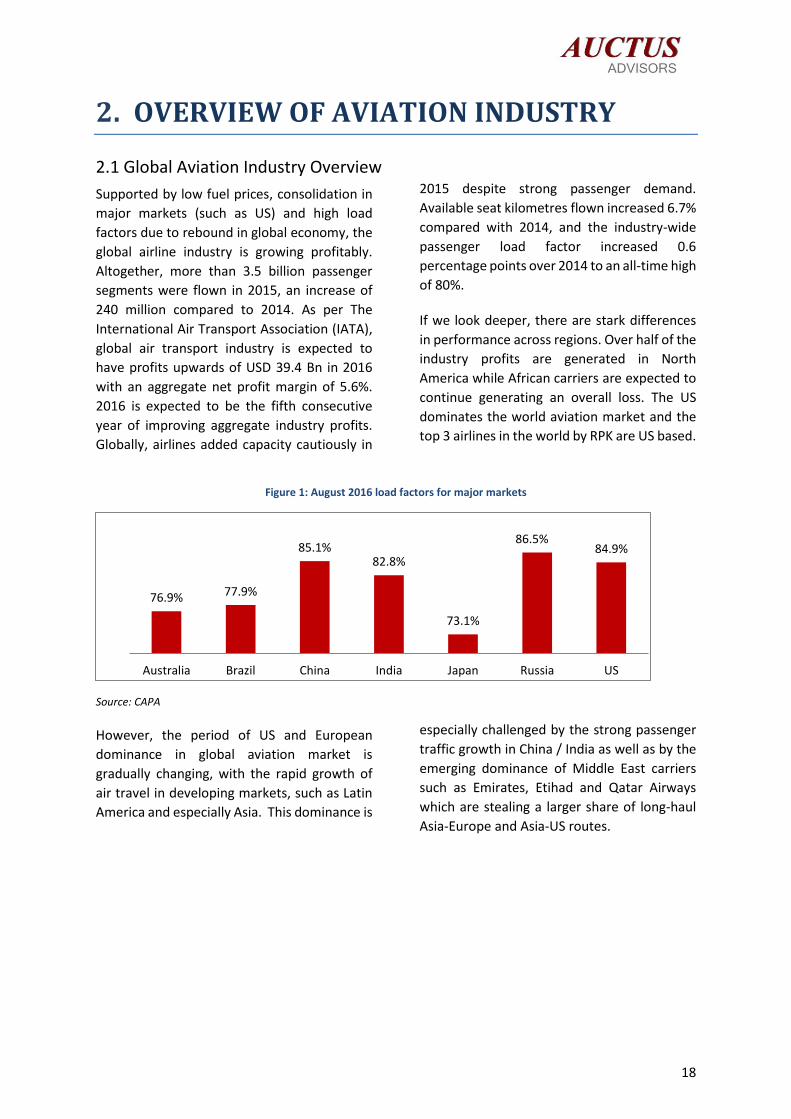
Figure 3: Domestic air traffic growth (2014-2034)
Source: Airbus
0.0%
4.0%
8.0%
12.0%
16.0%
Africa Asia Pacific Europe Latin America Middle East North America
RPK ASK
0%
2%
4%
6%
8%
10%
Japan US IntraWesternEurope
Russia Brazil Turkey China India
The global aviation industry saw profitable growth in 2016 largely supported by low fuel prices,
economic recovery and industry rationalization. This growth, however, varied across regions
significantly - with Middle East and Asia Pacific regions being the leaders.

20
Air Cargo market
Air cargo is essential for the supply chain of
many time sensitive products: including
perishables, pharmaceuticals and e-
commerce. Given its premium value
proposition, air cargo accounts for more than
35% of global trade by value but only 1% of
world trade by volume.
The global air cargo market is dominated by
carriers operating from hub airports which use
large aircrafts to pool international traffic at
their hub airports. Given the high belly capacity
and large route network, these carriers offer a
strong value proposition for movement of
cargo by air.
Figure 4: Total Freight market load factor % of AFTKs
Source: IATA
Figure 5: Growth in FTKs by carrier region (Month-on-Month growth for August 2016)
Source: IATA
In contrast to the passenger market, the air
cargo industry has experienced notable
weakness over the last few years, with decline
in load factors owing to increased belly
capacity. In 2015, most of the regions saw de-
growth to moderate growth in Air cargo. In
contrast, hub carriers in the Middle East,
registered 11.3% growth in 2015. Airlines in
this region have benefited from network
expansion into emerging markets like Africa
and solid growth in the local economy.
However, data from 2016 shows that the
decline in global cargo market has bottomed
out and there has been some modest
improvement, consistent with the
36.1%
59.1%51.3%
45.5% 47.3%38.4%
35.1%
56.2%48.5%
41.3% 44.1%35.9%
Africa Asia Pacific Europe LATAM Middle East N.America
2014 2015
3.50% 3.80%2.70%
5.70%
-4.10%
1.80%
4.60%
-6%
-4%
-2%
0%
2%
4%
6%
8%
Industry Africa Asia Pacific Europe LATAM Middle East N.America
21
developments in world trade. During August
2016, YoY growth in global air freight tonne
kilometres (FTKs) was 3.9%. August witnessed
an improvement in the air cargo market of
Europe, with European airlines posting the
fastest annual growth of all regions, in keeping
with a pronounced rise in the new export
orders component of the German PMI.
In contrast, Middle Eastern traffic growth has
slowed, and Latin American carriers saw
freight volumes contract in annual terms for
the sixth consecutive month. In the future,
acceleration in urbanization, liberalization in
world trade and growth of e-commerce will
drive the growth in air cargo across the world.
It is expected that while established European & North American markets will continue to exhibit
moderate growth, Asia-Pacific region will drive the growth over the next 20 years with India being
the fastest growing major country and China becoming the biggest aviation market.

22
2.2 Domestic Macro-Economic Indicators Growth in GDP and Trade:
In an era of subdued global economic growth,
India has emerged as the fastest growing large
economy with a promising outlook on the back
of controlled inflation, rise in domestic
demand, decline in oil prices and a strong
reform focus. According to Fitch Ratings
Agency, India's Gross Domestic Product (GDP)
will likely grow by 7.7 per cent in FY 2016-17
and slowly accelerate to 8 per cent by FY 2018-
19, driven by the gradual implementation of
structural reforms, higher disposable income
and improvement in economic activity.
Another indicator of positive business
sentiment is that India’s total merchandise
trade increased from USD 467 Bn in FY 2010 to
USD 642 Bn in FY 2016. The Foreign Trade
Policy 2015-2020 aims at increasing India’s
merchandise and services exports to USD 900
Bn by FY 2020.
Population and Demography:
India is the second most populous nation in the
world with an overall population of 1.4 billion.
As per global workplace solutions provider
Steelcase, India's middleclass population is
expected to grow to 475 million by 2030,
contributing significantly to the country's
population. Over the next 25 to 30 years,
India's working population may equal the total
population of the United States.
Figure 6: Growth in GDP (%)
Source: IMF, World Bank
Govt. Initiatives to Boost Economic Growth
The Government reform agenda focused on
improving ease of business is gaining traction
and will help keep up the economic
momentum in the long term. Apart from
reformatory policies, the Government is also
working on repairing the balance sheets of
Indian banks to support infrastructure growth
by restarting the investment & lending cycle.
The Government’s all round infrastructure
development focuses on multiple ambitious
programs including USD 7 Bn investment to
develop ~ 100 Smart Cities, building 20 million
homes for urban poor by 2022 at an
investment of USD 181 Bn and 24x7 power for
all citizens. As per the Smart Cities Mission, the
government’s vision is to develop 100+ smart
cities of the future.
Another government initiative “Make in India”
focuses on developing India as a
manufacturing hub and increasing the
contribution of manufacturing to 25% in GDP
of India. As part of this, the government
9.39.8
3.9
8.5
10.3
6.65.6
6.6
7.27.3
-
2
4
6
8
10
12
0
1000
2000
3000
4000
5000
6000
7000
2006 2007 2008 2009 2010 2011 2012 2013 2014 2015
Per capita GDP (PPP adjusted) Real GDP growth rate(%)
23
replaced multiple legacy processes with
transparent and user-friendly systems to drive
investment, foster innovation, develop skills
and protect IP. The most striking indicator of
change is the unprecedented opening up of
key sectors - including Railways, Defence,
Aviation, Insurance and Medical Devices, to
dramatically higher levels of Foreign Direct
Investment. The “Make in India” initiative is
showing early signs of success, highlighted by
the all-time high FDI in early 2016. The major
foreign commitments under the Make in India
campaign are:
Japan would set up a USD 12 Bn fund
for Make in India-related projects,
called the “Japan-India Make-in-India
Special Finance Facility”
Contract-manufacturing giant
Foxconn plans to spend USD 5 Bn on
factories and research and
development in India
USD 1 Bn investment commitment by
General Motors
Ministry of Railways signed formal
agreements with Alstom and GE
Transport worth Rs 40,000 crore (USD
5.9 Bn) to set up locomotive
manufacturing factories in
Madhepura and Marhaura, Bihar
France-based LH Aviation signed an
MoU with OIS Advanced Technologies
to set up a drone manufacturing plant
in India
Lockheed Martin has also shown
interest in “Make in India” with a
public offer to shift its entire F-16
manufacturing line to India
Manufacturing being labour intensive, the
success of this initiative would lead to
significant job creation opportunities in India.
To ensure human capital is also built to support
these goals, the Skill India campaign has been
launched which prepares graduates and
workers for the skills needed by the industry.
The goal of the program is to train 400 million
people by 2022 through the National Skill
Development Corporation which would
eventually lead to labour reforms and
organization of informal sector.
As part of the Make in India and Skill India
programs, the Government is also focusing on
developing skills related to the Aircraft
Maintenance Repair and Overhaul (MRO)
industry in India as well as develop the industry
to become the MRO hub for Asia. To support
this, the Government has exempted customs
duty for MRO related imports and expedited
VISA process for MRO experts. The
Government is also encouraging global OEMs
for establishment of aircraft assembly in India.
To ensure smoother delivery and transparency
in progressive programs, several governance
reforms have also been undertaken. Under the
E-biz project, a Government to Business (G2B)
portal is being set up to serve as a one stop
shop for delivery of services to the investors
and address needs of the business and industry
from inception across the entire business life
cycle. The states are also focusing on ease of
doing business by cutting down on paperwork
and clearances required to set-up a business.
In summary, India’s aviation sector is in a sweet
spot in terms of macro and socioeconomic
factors for long term sustainable growth in air
traffic. The growth of aviation in turn will drive
other direct and indirect economic benefits
associated with the aviation sector

24
2.3 Indian Aviation Industry Overview
Over the last decade, the Indian aviation sector
has seen double digit traffic growth on account
of falling ticket costs and increase in disposable
income. Moreover, the number of operational
airports in India has increased from 50 in 2000
to 95 in 2016.
With this growth, India has become among the
top 10 aviation markets in the world.
However, even with this level of growth, trips
per capita in India remains far behind,
compared to not only the developed
economies but also compared to some of the
emerging economies such as Brazil and China.
Upon comparison of India and China aviation
markets – the differences become
significantly stark. For instance, China has 6
times the number of passenger aircrafts
available in India and more than twice the
number of airports, with greater than one
million traffic, compared to India.
Figure 7: 2015 Annual PAX traffic for key aviation markets (million)
Source: Auctus research and Airbus report
Table 1: India vs China comparison on key aviation metrics
Parameter China India
Passenger Aircrafts 2,650 465
Registered scheduler operator 48 14
# Certified airports 210 95
Airports with >1 million yearly traffic 70 30
Source: DGCA and Civil Aviation Authority of China
896
436
275 255 224
217
149 104 92
1.78
0.34
1.12
1.67
0.08
1.03
2.88
0.5 0.45
0
0.5
1
1.5
2
2.5
3
3.5
-
200.00
400.00
600.00
800.00
1,000.00
US China Japan UK India Germany Australia Brazil Russia
PAX Trips per capita
While the Indian aviation industry has shown double digit growth in the last decade – the market
has exhibited limited penetration as compared to other similar markets such as China, with air trips
per capita remaining one of the lowest across the world.
25
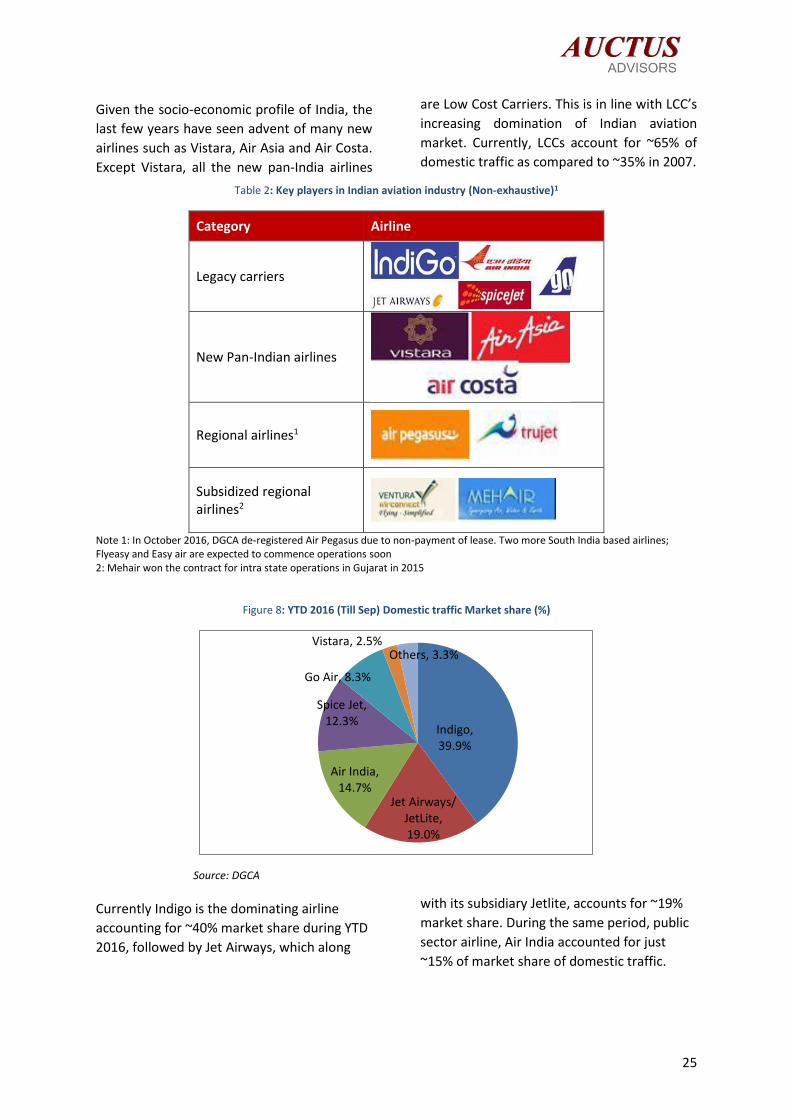
Given the socio-economic profile of India, the
last few years have seen advent of many new
airlines such as Vistara, Air Asia and Air Costa.
Except Vistara, all the new pan-India airlines
are Low Cost Carriers. This is in line with LCC’s
increasing domination of Indian aviation
market. Currently, LCCs account for ~65% of
domestic traffic as compared to ~35% in 2007.
Table 2: Key players in Indian aviation industry (Non-exhaustive)1
Category Airline
Legacy carriers
New Pan-Indian airlines
Regional airlines1
Subsidized regional airlines2
Note 1: In October 2016, DGCA de-registered Air Pegasus due to non-payment of lease. Two more South India based airlines; Flyeasy and Easy air are expected to commence operations soon 2: Mehair won the contract for intra state operations in Gujarat in 2015
Figure 8: YTD 2016 (Till Sep) Domestic traffic Market share (%)
Source: DGCA
Currently Indigo is the dominating airline
accounting for ~40% market share during YTD
2016, followed by Jet Airways, which along
with its subsidiary Jetlite, accounts for ~19%
market share. During the same period, public
sector airline, Air India accounted for just
~15% of market share of domestic traffic.
Indigo, 39.9%
Jet Airways/JetLite, 19.0%
Air India, 14.7%
Spice Jet, 12.3%
Go Air, 8.3%
Vistara, 2.5%Others, 3.3%
26
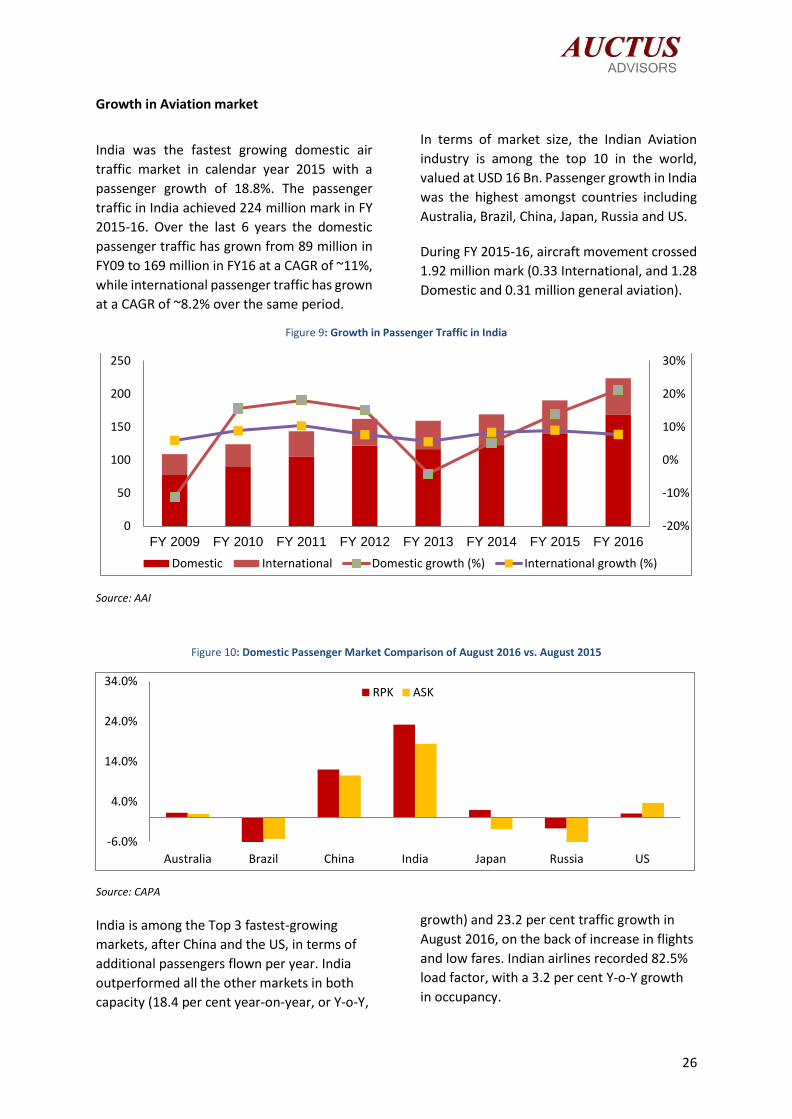
Growth in Aviation market
India was the fastest growing domestic air
traffic market in calendar year 2015 with a
passenger growth of 18.8%. The passenger
traffic in India achieved 224 million mark in FY
2015-16. Over the last 6 years the domestic
passenger traffic has grown from 89 million in
FY09 to 169 million in FY16 at a CAGR of ~11%,
while international passenger traffic has grown
at a CAGR of ~8.2% over the same period.
In terms of market size, the Indian Aviation
industry is among the top 10 in the world,
valued at USD 16 Bn. Passenger growth in India
was the highest amongst countries including
Australia, Brazil, China, Japan, Russia and US.
During FY 2015-16, aircraft movement crossed
1.92 million mark (0.33 International, and 1.28
Domestic and 0.31 million general aviation).
Figure 9: Growth in Passenger Traffic in India
Source: AAI
Figure 10: Domestic Passenger Market Comparison of August 2016 vs. August 2015
Source: CAPA
India is among the Top 3 fastest-growing
markets, after China and the US, in terms of
additional passengers flown per year. India
outperformed all the other markets in both
capacity (18.4 per cent year-on-year, or Y-o-Y,
growth) and 23.2 per cent traffic growth in
August 2016, on the back of increase in flights
and low fares. Indian airlines recorded 82.5%
load factor, with a 3.2 per cent Y-o-Y growth
in occupancy.
-20%
-10%
0%
10%
20%
30%
0
50
100
150
200
250
FY 2009 FY 2010 FY 2011 FY 2012 FY 2013 FY 2014 FY 2015 FY 2016
Domestic International Domestic growth (%) International growth (%)
-6.0%
4.0%
14.0%
24.0%
34.0%
Australia Brazil China India Japan Russia US
RPK ASK
27
Air Cargo industry
In a subdued global market, India is emerging
as one of the fastest growing air cargo markets
across the globe. During 2006-2016,
international cargo volumes have increased by
a CAGR of 6.1% and domestic cargo volumes
have increased by ~8.0% reaching ~1.7 million
tons and 1.0 million tons respectively.
Supported by rapid growth of international
trade, India’s huge manufacturing engine and
a growing population, industry analysts expect
that India will be among the ten largest
international freight markets by 2018.
However, the current air cargo volume in India
is very low and is dominated by belly cargo. The
proportion of belly cargo to the total cargo
carried has been declining from a level of
88.7% in 2000-2001 to current levels of ~80%.
Additionally, air cargo industry in India is
concentrated at the major airports with top 5
airports by cargo volume accounting for 88% of
international cargo volume and 76% of
domestic cargo.
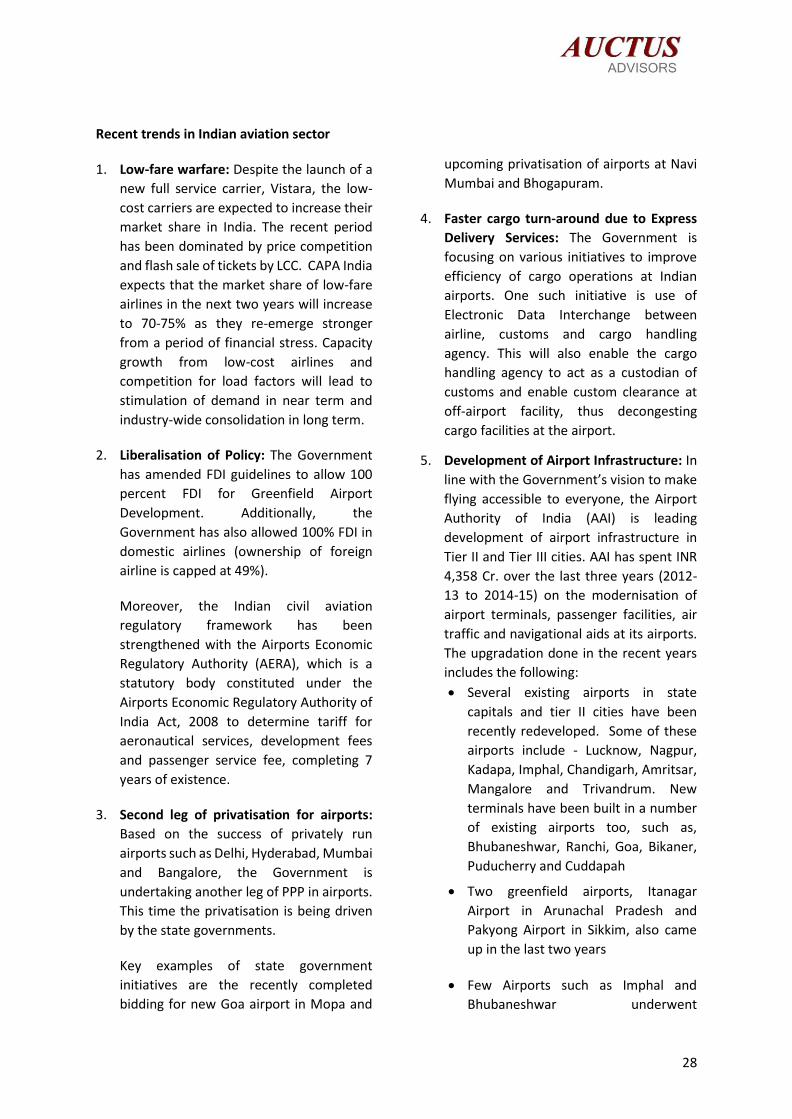
Table 3: Global benchmark of Dwell time vis-a –vis Indian airports
Airport Dwell time hours
(Exports) Dwell time hours
(Imports)
Sharjah 4 4-8
Singapore 6 3-6
Frankfurt 6 NA
Incheon 2-3 2-7.5
Dubai 2-3 2-6
Hong Kong 3-6 4-8
Delhi 36 119
Mumbai 48 96
Chennai 48 72
Hyderabad 12 36
Kolkata 48 72
Bengaluru 36 48
Source: Air Cargo Logistics Working Group report by MoCA
The air cargo industry in India is suffering from
high dwell time at international airports. One
of the major reasons for this is airport
congestion due to custom inspection of
inbound and outbound cargo. To reduce this
congestion, the Government has taken
multiple initiatives to develop Air Freight
Stations (AFS). An AFS is an extension of the
airport or an off-terminal facility where all
import formalities for cargo can be completed.
AFS facilitates greater throughput efficiency,
reduce dwell time, and maximizes the
utilization of installed capacity.
The future outlook for air cargo in India is
positive and as per International Air Transport
Association (IATA), India will be the second
fastest-growing market with respect to freight
volumes, with a CAGR of 6.8% for the next five
years. In the future, air cargo in India will be
driven by expanding GDP in India, increasing
need of just-in-time manufacturing, growth of
e-commerce sector and increased air access to
regional areas.
28
Recent trends in Indian aviation sector
1. Low-fare warfare: Despite the launch of a
new full service carrier, Vistara, the low-
cost carriers are expected to increase their
market share in India. The recent period
has been dominated by price competition
and flash sale of tickets by LCC. CAPA India
expects that the market share of low-fare
airlines in the next two years will increase
to 70-75% as they re-emerge stronger
from a period of financial stress. Capacity
growth from low-cost airlines and
competition for load factors will lead to
stimulation of demand in near term and
industry-wide consolidation in long term.
2. Liberalisation of Policy: The Government
has amended FDI guidelines to allow 100
percent FDI for Greenfield Airport
Development. Additionally, the
Government has also allowed 100% FDI in
domestic airlines (ownership of foreign
airline is capped at 49%).
Moreover, the Indian civil aviation
regulatory framework has been
strengthened with the Airports Economic
Regulatory Authority (AERA), which is a
statutory body constituted under the
Airports Economic Regulatory Authority of
India Act, 2008 to determine tariff for
aeronautical services, development fees
and passenger service fee, completing 7
years of existence.
3. Second leg of privatisation for airports:
Based on the success of privately run
airports such as Delhi, Hyderabad, Mumbai
and Bangalore, the Government is
undertaking another leg of PPP in airports.
This time the privatisation is being driven
by the state governments.
Key examples of state government
initiatives are the recently completed
bidding for new Goa airport in Mopa and
upcoming privatisation of airports at Navi
Mumbai and Bhogapuram.
4. Faster cargo turn-around due to Express
Delivery Services: The Government is
focusing on various initiatives to improve
efficiency of cargo operations at Indian
airports. One such initiative is use of
Electronic Data Interchange between
airline, customs and cargo handling
agency. This will also enable the cargo
handling agency to act as a custodian of
customs and enable custom clearance at
off-airport facility, thus decongesting
cargo facilities at the airport.
5. Development of Airport Infrastructure: In
line with the Government’s vision to make
flying accessible to everyone, the Airport
Authority of India (AAI) is leading
development of airport infrastructure in
Tier II and Tier III cities. AAI has spent INR
4,358 Cr. over the last three years (2012-
13 to 2014-15) on the modernisation of
airport terminals, passenger facilities, air
traffic and navigational aids at its airports.
The upgradation done in the recent years
includes the following:
Several existing airports in state
capitals and tier II cities have been
recently redeveloped. Some of these
airports include - Lucknow, Nagpur,
Kadapa, Imphal, Chandigarh, Amritsar,
Mangalore and Trivandrum. New
terminals have been built in a number
of existing airports too, such as,
Bhubaneshwar, Ranchi, Goa, Bikaner,
Puducherry and Cuddapah
Two greenfield airports, Itanagar
Airport in Arunachal Pradesh and
Pakyong Airport in Sikkim, also came
up in the last two years
Few Airports such as Imphal and
Bhubaneshwar underwent

29
upgradation to operate international
flights and have been declared as
International Airports
Going forward as well, AAI would continue to
invest Rs 17,500 crore in upgrading airport
infrastructure over the next 4 years (till 2019-
20), to upgrade airport terminals and expand
runways at many existing airports as well as
build 50 no-frills airport.
The Government’s near term focus has shifted
to Tier III cities with the Ministry of Civil
Aviation developing five small airports at tier II
and tier III cities across the country. Hubli and
Belgaum in Karnataka, Kishangarh in
Rajasthan, Jharsuguda in Odisha and Tezu in
Arunachal Pradesh have been identified as
locations for new airports. The above locations
were identified based on the areas’
population, availability of land and potential
for tourism and industry.
Growth Potential of Indian Aviation
The current trips per capita for India at just
0.08 per annum is low compared to developed
countries like the U.S. and Australia (22-35x
India’s air travel penetration) and even
developing countries like China and Brazil (4-7x
India’s air travel penetration). However, on
account of improving living standards, suitable
demographics and reducing travel costs, India
has the potential to be the third largest
aviation market by 2026.
In the past, commercial aviation in the country
has expanded due to factors like proliferation
of low-cost carriers, modernization of airports,
foreign direct investment in domestic airlines,
and cutting-edge information technology.
However, airport infrastructure and
connectivity continues to be an important
hurdle for the growth of civil aviation.
While, the Indian aviation industry’s growth till
now was largely led by development of metro-
to-metro connectivity; the sector is now
shifting its focus to hub development. India
right now is in the early stages of developing
hub-feeder routes. This model is expected to
connect smaller cities with the hubs and
promote regional and remote connectivity. At
the same time, this is expected to promote
uniform growth, with inclusion of the northern
and north eastern states along with the
southern and western states that house many
of the country's economic centres.
If we look at the growth pattern at China as an
example, most of the recent growth is coming
from outside the traditional markets of the
Golden Triangle (Beijing, Shanghai, and
Guangzhou). Over the last 5 years, markets
that don’t touch the major hubs have grown at
a CAGR of ~15%. Similarly, the next generation
of aviation growth in India will be triggered by
regional and remote airports. The first leg of
this growth is expected to be triggered by
connectivity of regional airports with hub
airports and then point to point connectivity
between regional airports.
While, most of the traffic growth in last decade has come from large cities, it is expected that with
government support on airport infrastructure development, policy liberalization and improving
living standards, the next leg of traffic growth will come from regional economic and tourist centres.

30
Table 4: Contribution of Top 10 cities to National Domestic Traffic
Metros Domestic Passenger Air Traffic
2015-16 (Lakhs)
2009-10 (Lakhs)
2000-01 (Lakhs)
Delhi 343 178 48
Mumbai 300 174 65
Bangalore 156 80 23
Chennai 103 67 20
Kolkata 102 68 20
Hyderabad 92 48 17
Cochin 31 16 8
Ahmedabad 49 27 7
Goa 47 22 8
Pune 51 22 4
Total Domestic Traffic 1689 891 329
Metro Traffic as % of Total Domestic Traffic 75% 79% 67%
Source: DGCA, AAI
The regional and remote connectivity will
have a multiplier effect on economic growth,
tourism and employment, especially at Tier II
/ Tier III towns where it is most required. The
civil aviation ministry’s current focus is to
promote regional airports and incentivise
airlines to improve regional connectivity. With
this focus, the Government recently
announced the National Civil Aviation Policy
2016 which focuses on developing regional
connectivity in India.

31
3. SALIENT FEATURES OF NCAP 2016
The NCAP 2016, is the first integrated civil
aviation policy, covering 22 areas of the civil
aviation sector, which has been developed
after extensive consultation with the industry.
The Government released a draft policy
document and after substantial deliberation
came up with a comprehensive final National
Civil Aviation Policy in October 2016.
During FY 2016, the Indian aviation industry
catered to 16.9 crore domestic fliers and 5.4
crore international fliers. In light of the current
state of Indian aviation, the vision of NCAP
2016 is to enable 30 crore domestic ticketing
by 2022 and 50 crore by 2027, and
international ticketing to increase to 20 crore
by 2027. Similarly, the NCAP’s vision is to
increase cargo volumes from 2.7 million tons in
2016 to 10 million tons by 2027.
The NCAP focuses on making flying affordable
and accessible to masses. The salient features
of NCAP 2016 are as follows:
3.1 Regional Connectivity Scheme:
Given the Government’s focus on developing
regional connectivity, this scheme aims to
address key challenges associated with
regional connectivity:
a) Infrastructure: GoI plans to revive
airstrips/airports as No-Frills Airports at an
indicative cost of Rs.50 crore to Rs.100
crore. The state government will provide
police and fire services free of cost.
Additionally, power, water and other
utilities will be provided at substantially
concessional rates.
b) Affordability: Airfare capped at Rs 2500/-
(indexed to inflation) per passenger for a
significant part of the seat capacity for a
flying distance of 500 to 600 Kms.
c) Commercial sustainability for airlines: No
airport charges for operations under RCS.
Additionally, the Government will subsidise
airline operations by providing “Viability
Gap Funding” (VGF). VGF will be shared
between the state government and GoI
(20:80 and 10:90 for north east states)
The policy will be implemented through
demand driven selection of airports / airstrips
for revival, in consultation with state
governments and airlines. Detailed discussion
on Regional Connectivity Scheme and bidding
process for VGF is covered in the next section.
3.2 Route Dispersion Guidelines
(RDG)
RDG was introduced in 1994 to provide air
connectivity to remote areas and Tier II and
Tier III cities by way of internal cross-subsidy by
airlines using their revenues on the Trunk
Routes. In light of RCS, the Government
reduced the percentage of dedicated seats for
CAT III routes as percentage of CAT I traffic to
35%. Review of routes under each category will
be done every 5 years.
For the purpose of meeting RDG criteria,
scheduled airlines will be permitted to trade
Available Seat Kilometres (ASKM) of
helicopters and other small aircraft (maximum
AUW not exceeding 40 tons) operating under
the Regional Connectivity Scheme to extend
the last mile connectivity seamlessly to under-
served or un-served areas.
3.3 Change in 5/20 Rule
Change in minimum criteria for international
operations from 5 years and 20 aircrafts to only
20 aircrafts. All airlines can now commence
international operations provided that they
deploy 20 aircraft or 20% of total capacity (in
term of average number of seats on all
departures put together), whichever is higher,
for domestic operations. However, it requires
strong financial backing from investors to
increase fleet size to 20 within 5 years of
operations.
32
3.4 Air Cargo
Currently air cargo volumes in India are very
low as compared to other leading countries
due to high charges and high turnaround time.
The following framework is expected to ensure
growth of the air cargo business:
a) Cargo facilities co-located at an airport are
covered under the ‘Harmonised List of
Infrastructure” and will get the benefit of
incentives provided to infrastructure sector
b) The Air Cargo Logistics Promotion Board
(ACLPB) has been constituted to promote
growth in air cargo by way of cost
reduction, efficiency improvement and
better inter-ministerial coordination
3.5 Ground Handling Policy
The airport operator will ensure that there will
be three Ground Handling Agencies (GHA)
including Air India's subsidiary / JV at all major
airports, as defined in the AERA Act. At non-
major airports, the airport operator will decide
on the number of ground handling agencies,
based on the traffic output, airside and
terminal building capacity.
All domestic scheduled airline operators
including helicopter operators will be free to
carry out self-handling at all airports through
their regular employees. Additionally,
government is offering fiscal support for
ground handling facilities co-located at the
airport by bringing them under “Harmonised
List of Infrastructure”. Hence, development of
ground handling facility will attract the fiscal
benefits associated with infrastructure sector.
3.6 Airport Development through
PPP/AAI
The MoCA will encourage the development of
airports by AAI, State Governments, Private
Sector participants or in PPP mode. Future
tariffs at all airports will be calculated on a
'hybrid till' basis, unless specified otherwise in
the concession document. Unless otherwise
mentioned, 30% of non-aeronautical revenue
will be used to cross-subsidise aeronautical
charges.
3.7 Bilateral Traffic Rights
GoI will enter into 'Open Sky' air service
agreement on a reciprocal basis with SAARC
countries and countries located beyond 5000
km from Delhi. An Open Sky policy allows
unlimited flights above the existing bilateral
agreement.
For countries within 5000 km radius, where the
Indian carriers have not utilised 80% of their
capacity entitlements but foreign carriers
/countries have utilised their bilateral rights, a
method will be recommended by a Committee
headed by Cabinet Secretary for the allotment
of additional capacity entitlements.
Whenever designated carriers of India have
utilised 80% of their capacity entitlements, the
same will be renegotiated in the usual manner.
Presently, Indian cargo airlines with 74% FDI
cannot undertake scheduled international
operations due to effective control clause in
ASA. NCAP 2016 suggests that ASA will be
suitably amended based on the concept of
“principal place of business” and “effective
regulatory control” of the host country.
33
3.8 Helicopters and Charters
India currently has just 300 civil use
helicopters, which is very low as compared to
other developing nations. NCAP will promote
helicopter usage in the following manner:
a) Facilitate development of at least 4 heli-
hubs initially, across the country to
promote regional connectivity.
b) MoCA will coordinate with MoF, MHA,
NHAI, Indian Railways, insurance
companies, hospitals, Pawan Hans and
other helicopter operators to facilitate
Helicopter Emergency Medical Services
EMS).
c) No landing charges and RNFC will be levied
for HEMS operations.
d) Helicopters will be free to fly from point to
point without prior ATC clearance in
airspace below 5000 feet.
The Government is also working on guidelines
for liberalising charter operations. The
guidelines are expected to include: marketing
rules, geographical and route identification,
capacity control etc.
3.9 Maintenance, Repair and
Overhaul (MRO)
NCAP 2016 also focuses on development of
MRO business in line with the broader Make in
India initiative. Currently, the MRO business of
Indian carriers is around Rs 5000 crore and ~
90% of this is spent outside India. The
Government is keen on developing India as an
MRO hub in Asia, and attract business from
foreign airlines. As part of this, the
Government is focusing on following things:
a) Tool-kits for MRO and parts required to be
used in aircrafts has been exempted from
custom.
b) Additionally, to enable economies of scale,
government has increased the restriction of
using duty free parts from 1 year to 3 year.
c) Enabled advanced imports of unserviceable
parts by changing concerned notification.
d) Foreign aircraft brought to India for MRO
work will be allowed to stay for the entire
period of maintenance or up to 6 months.
Such foreign aircraft would also be
permitted to carry passengers in the flights
at the start and end of its period of stay in
India.
e) Airport royalty and additional charges will
not be levied on MRO service providers for
a period of five years from the date of
approval of the policy.
f) Additionally, the Government is also
focusing on prompt VISA for MRO experts
and pilots operating aircraft to and fro from
Indian MRO.
3.10 Skill Development
The Government has also considered
development of skills required to support
growth of aviation sector. MoCA will provide
full support to the Aviation Sector Skill Council
and other similar organisations / agencies for
imparting skills for the growing aviation
industry. MoCA will develop a scheme with
budgetary support for Type- rating of Pilots.
The detailed scheme for Skill development is
not part of the NCAP 2016 and will be worked
out separately.
With a National Civil Aviation Policy in place, we expect flying across the country to become more
affordable and convenient for the masses. The policy lays the foundation stone for an integrated
eco-system leading to significant growth in tourism, employment and balanced regional growth.
34
4. REGIONAL CONNECTIVITY SCHEME
4.1 Objective of RCS
The next level of growth in air connectivity will
involve unlocking the potential of Tier II and
Tier III cities. The Government recognizes the
need to generate demand at these regions as
well as a lack of proper airport infrastructure
and supply from the airlines. To support this
growth, few states, like MP and Gujarat, had
already entered into contract with airlines to
offer subsidised intra-state flights connecting
unserved / underserved airports at an
affordable fare. Under the new Civil Aviation
Policy, and with the introduction of RCS, these
arrangements may be subsumed under the
RCS scheme. This will further enhance support
from the central government in addition to the
support available from the state governments.
Currently, airlines prefer to capitalize major
traffic centres, and fly on more profitable
routes. Lack of visible demand from smaller
cities and lack of adequate infrastructure
results in low to non-existent traction in these
regions. Furthermore, it is important to keep
air fares affordable to incentivise consumer
switch from other means of transport to air
travel. Hence, the government came up with
the Regional Connectivity Scheme (RCS), to
provide need-based financial support to the
airlines in the initial period to incentivise
participation in regional & rural connectivity.
RCS also aims to make fares more affordable
for the consumers by introducing an airfare
cap, which is based on the route distance for
aircrafts and flight time for helicopters.
The objective of RCS is to promote tourism,
provide employment and promote balanced
regional growth by making flying affordable for
the masses. The policy intends to improve
regional connectivity via measures such as
incentives for airlines, airfare caps on limited
number of seats for consumers, and revival of
existing airstrips and airports.
4.2 Announcement of RCS
The government released the draft Regional
Connectivity Scheme (RCS) for consultations
with stakeholders’, including state
governments, airlines and airport operators.
The stakeholders were given time to submit
their suggestions on the draft scheme.
Following review of the suggestions received,
MoCA (Ministry of Civil Aviation) released the
final RCS document in October 2016.
Following the draft release, Maharashtra
became the first state to sign up for the
scheme on August 23, 2016, followed by
Jharkhand which also signed the MoU in
August. Subsequently, Gujarat, Chhattisgarh,
Puducherry joined the scheme in September
while Andhra Pradesh and Manipur joined in
October and November respectively, leading
to a total of 7 states who are RCS signatories.
This becomes especially relevant given a
mandatory requirement in the RCS which says
that the scheme will be operational only in
those states which demonstrate their support

35
and commitment towards the scheme.
While 7 states have currently signed the RCS,
successful implementation of this scheme
would require support from a lot more states.
It is also possible that many other states would
join after seeing the success of first RCS route
/ flight. There are 476 airports / airstrips in the
country, of which as many as 350 are non-
operational, and around 30 are not being used.
The scheme has capped airfare for seats under
RCS based on route distance for aircrafts and
flight time for helicopters. It provides a
complete table specifying the applicable
airfare cap against flight distance in the case of
aircrafts and against flight time in the case of
helicopters. For example, it caps the fare for
approximately 500 km distance flight on a
fixed-wing aircraft, or that for a 30-minute
helicopter ride at INR 2,500. Under the
scheme, the government will provide Viability
Gap Funding (VGF) to the airlines to make their
operations viable and this VGF will be financed
through Regional Connectivity Fund (RCF). As
part of this government has announced levy
per flight landing, of:
7,500 for flights upto 1000 km.
8,000 for flights between 1000-1500 km.
8,500 for flights beyond 1500 km.
Collection from this levy shall be used to cross-
subsidize the regional flights under RCS
scheme. The government expects to collect
around 500 crores per year from this levy.
4.3 Key Constructs of the Scheme
Implementing Agency: AAI (Airport Authority
of India) has been designated as Implementing
Agency for RCS. AAI will be responsible for
undertaking tasks and activities for
implementation of the Scheme.
Provision of Financial Support: Under this
Scheme, support shall be provided to Selected
Airline Operator(s) in the form of VGF, and
concessions / support from the Central
Government, State Governments and airport
operators.
The financial support from the Central
Government includes Excise duty of 2% on ATF
for 3 years from scheme announcement, and
service tax to be levied on only 10% of taxable
value of seats tickets on RCS flight for 1 year
from scheme announcement.
The state government is expected to provide
the VGF support of 20% (or 10% in case of UTs
and North-Eastern states) and ensure VAT of
1% or less on ATF; along-with coordinating
with oil marketing companies to provide
fuelling infrastructure. States also need to
provide essential land free of cost; electricity,
water and other necessary utility facilities at
concessional rates as well as provide airports
with roads and other multi-modal connectivity.
Further the Airport operator must waive off
the landing & parking charges, PSF, UDF or any
While only 7 states have signed MoUs with the Centre for RCS implementation currently, we believe
more states will need to come forward over the next few months to ensure the success of RCS.

36
other similar charge, and allow the selected
RCS operating airline to undertake ground
handling for their RCS flights. AAI shall not levy
any Terminal Navigation Landing charges
(TNLC), and the Route Navigation & Facilitation
charge (RNFC) will be provided at a discounted
rate of 42.5% by AAI on RCS flights.
Tenure of the Scheme: In line with NCAP 2016,
the Scheme will be applicable, subject to
periodic review, for a period of 10 years from
the date of its notification by the MoCA.
Tenure of VGF Support: The policy aims to
encourage sustainability and independence of
airport operations. Therefore, VGF will be
provided for maximum of 3 years from
operations start date.
Airfare Caps: The RCS stipulates caps on
airfares per flight distance (or flight time for
helicopters). For example, aircrafts flying
around 500 km or helicopters with flight
duration of 30 min. have airfare capped at INR
2,500. In case funds are needed to make the
operation viable, VGF will be provided.
RCF Allocation: For providing VGF, a Regional
Connectivity Fund (RCF) will be created
through levy on domestic departures, except
on Category II/IIA routes under RDG, RCS
routes and aircrafts with less than 80 seats.
Furthermore, there is a cap on the number of
RCS seats, and frequency of flights to limit the
subsidy requirements.
Exclusivity of operations: The selected airline
operator will be granted exclusivity for 3 years
to ensure sustainability of operations. During
this period, no other airline operator will be
allowed to operate flights on the Route.
The government expects the first flight under
RCS, a key component of NCAP, to be operated
by January 2017.
4.4 Implications of the Scheme on Stakeholders
Airlines:
The airlines will get services at subsidized
rates, VGF to fund operations if airlines foresee
viability gap and tax abatement. While
exclusive rights will incentivise airlines to
participate, VGF caps and competitive bidding
may limit their interest as well. The
attractiveness and feasibility of operations for
a new airline planning to operate only RCS
flights needs to be seen, however we believe
that the scheme would initially be more suited
for established players planning to ply on RCS
routes.
It is also believed that RCS would have some
spin-off benefits within the sector in terms of
passengers taking other flights which are not
under RCS and using airports / airport services
that are not at concessional rates under RCS.
Passengers:
Connectivity at capped prices will promote
flying in safe and affordable manner amongst
the masses, a key objective of this scheme.
Passengers stand to benefit the most from this
scheme. The scheme will enhance connectivity
with the introduction of newer routes.
Government:
The successful implementation of the scheme
will promote tourism, employment,
connectivity, and thus the local economy as
well.

37
4.5 Existing Availability of Aircrafts in India for RCS
As per Directorate General of Civil Aviation
(DGCA) statistics, 472 aircrafts are registered
with DGCA of which 7 specialize in cargo.
Passenger aircrafts incorporate wide body, and
narrow body aircrafts.
The Regional Connectivity Scheme will
encourage operators to operate to
underserved and unserved airports. Routes to
such airports, which are expected to be short
and where demand will be small in the initial
stage, will prudently need to be opened by
right-sized regional aircraft. Of the 472
aircrafts, 52 aircrafts are narrow body aircrafts
with less than 80 seats which are best suited
for such routes.
Table 5: List of aircrafts with less than 80 seats
Operator Aircraft (AC) Type Number of
aircrafts
Air Carnival Pvt. Ltd. ATR 72 - 212A 1
Airline Allied Services (Air India subsidiary)
ATR 42 -320 4
CRJ 700 3
ATR 72- 212A 8
Jet Airways (India) ATR 72- 212-A 18
SpiceJet Ltd. DHC- 8-402 15
Turbo Megha Airways (TruJet) ATR- 72-500 3
Total 52 Source: DGCA
4.6 Key Imperatives for the Launch of a RCS Flight
PRE-BIDDING
Appointment of the management agency
AAI, the designated implementing agency, is
responsible for undertaking tasks and activities
for implementation of the Scheme:
• Receive proposals submitted by the airlines,
and take necessary administrative actions
for identifying and selecting airline
operators pursuant to the scheme
• Act for and on behalf of MoCA for collection
and disbursement of funds, and manage
accounts / statements with respect to RCF
collections
Setting up the Regional Connectivity Fund
The Regional Connectivity Fund (RCF), which
will be used to fund RCS via a levy on other
flights. The Government has announced a levy
of 7,500-8,500 per flight to support RCF.
Payment of VGF will be made to the Selected
Airline Operator from the RCF and the State
Governments’ will be asked to reimburse the
applicable share. States will contribute 20 per
cent of the VGF required (10% in case of UTs
and North-Eastern States). AAI will manage
accounts / statements with respect to RCF
collections, payments to Selected Airline
Operators and reimbursements from State
Governments. To ensure balanced regional
growth, the allocations would be equitably
spread across the 5 geographical regions of the
country viz North, West, South, East and
North-east.
The Government’s proposed levy on major
routes (routes connecting metros and big
cities) to fund the RCS shall increase the fares

38
since all the airlines will likely pass on the
burden of new levy on to the passengers.
Considering Delhi-Mumbai route of 1200km,
the additional levy would be INR 8000 per
flight. Even assuming a modest 60% load factor
on a standard narrow-body aircraft with say
180 seats, it would result in an increase of ~Rs.
75 per flying passenger. Flights with higher
load factors shall exhibit an even lower
increase. Thus the additional fare burden on an
individual passenger appears to be minimal.
BIDDING
The key buckets under which the bidder must
provide information are:
Applicant Information: Registered name of the
applicant, Name of the airline, Date of
incorporation, Certificate of incorporation,
AOP (Airline Operator Permit), MoA and AoA,
Shareholders and Board of Directors.
Parameters involving technical and financial
proposals are detailed below in simplified
manner. Also, exclusive route allocation will be
provided to the selected airline operator under
RCS scheme through bidding process. Airline
operators need to assess demand on
underserved/un-served routes; submit
proposals for operating / providing
connectivity on such route(s); seek Viability
Gap Funding (VGF), if any, while committing to
certain minimum operating conditions.
The bidding process is complex as it involves
multiple parameters for the stakeholders:
Aircraft type: Bidders must specify the type of
aircraft or helicopter they wish to introduce
under the scheme.
The scheme mandates 50% of the seats in the
flight to be allotted to RCS, and caps the seats
under RCS to 40 (if 50% of the flight capacity
exceeds 40); with minimum of 9 seats
mandated under RCS. This inherently means
that 18 to 80 seater aircrafts are most
beneficial.
Amongst Pan India airline operators, only Air
India, Jet Airways and SpiceJet, have smaller
aircrafts in their fleet currently. Airline Allied
Services, subsidiary of Air India, connects cities
with small aircrafts. Additionally, availability of
pilot training centre and MRO for smaller
aircrafts is limited. Also, the speed and ease of
getting smaller aircrafts would depend on their
availability and costs. Additionally, any
difference in operating efficiencies would also
need to be funded through VGF. Evaluation of
the current incentives in the scheme against
required support from airline operations
perspective will determine airlines interest in
the scheme. In light of the increasing need of
ATRs, the Flight Simulation and Training
Center, Gurgaon (FSTC) has recently acquired
India’s first ATR 72-500 full flight simulator.
Route: Bidders need to mention the RCS route
they propose to serve. At least one of the origin
or destination points should be an RCS airport
or helipad for the route to qualify as a RCS
route. And the RCS route should be from states
who have signed MoU with MoCA showing
commitment and support towards RCS.
Currently as of November-start, seven states
have signed MoU with MoCA for RCS:
Maharashtra, Gujarat, Chhattisgarh,
Bid Proposal
Applicant Informatio
n
Financial Proposal
Technical Proposal

39
Jharkhand, Andhra Pradesh, Puducherry and
Manipur.
Stage length: The stage length for the
operation should be at least 150 Kms.
RCS seats: The bidder should propose to sell
50% of flight capacity as RCS seats, where 50%
should lie between 9 and 40 for aircrafts, and 5
and 13 for helicopters. The airline operator will
first sell RCS seats, and only once they are all
filled, can they start selling non-RCS seats.
VGF Requirement: The government has
proposed to provide optional financial support
for the bidders to mobilize operations under
RCS, in the form of VGF. The airlines must
submit their proposals for operating on any
regional route they wish to fly, along with the
proposed viability gap funding they would seek
from the government. RCS document
mentions VGF cap per RCS seat based on the
stage length.
EVALUATION
A bidder can propose for either an individual
route (“Individual Route Proposal”) or a set of
connected routes (“Network Proposal”). In
case of simultaneous proposals preference will
be given to network proposals over individual
route proposals. Hence, there are incentives in
bidding in a certain manner and the bidder
should understand these to maximize chances
of success. The following steps describe
evaluation of the financial proposal across
various combinations:
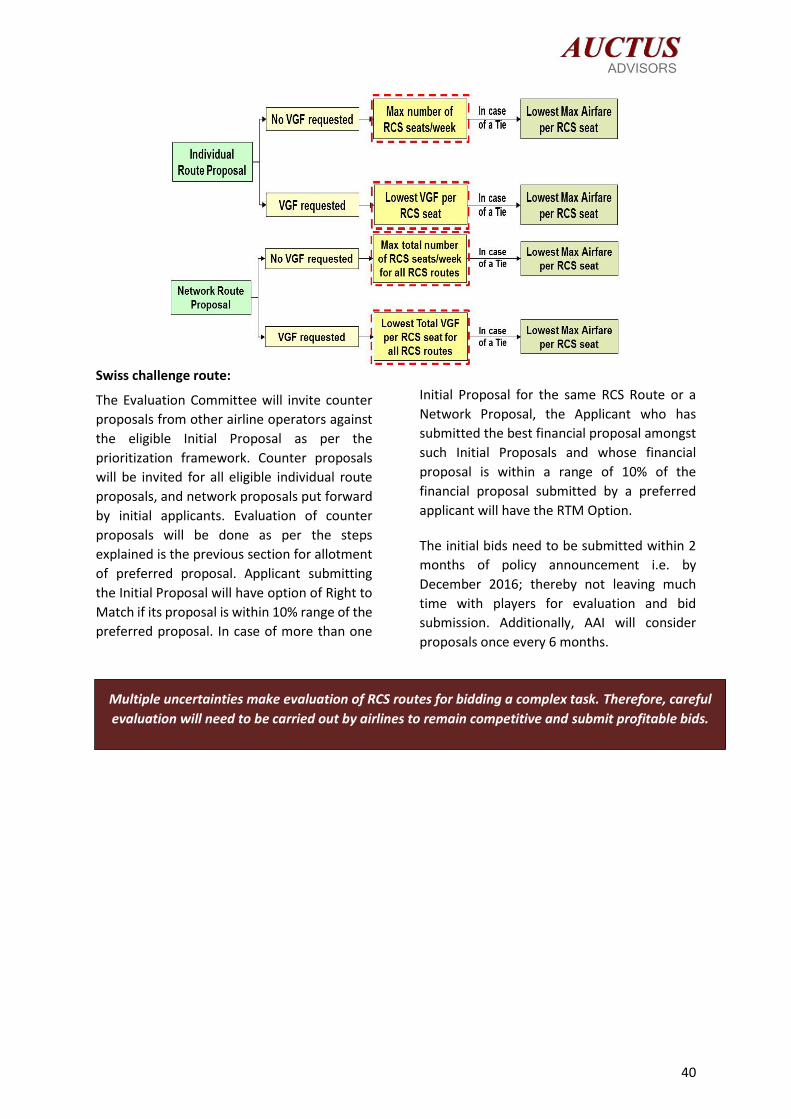
Individual Route Proposal with No VGF
requested: Evaluation will be done based on
maximum number of RCS seats / week quoted
by the applicants. In case of tie, evaluation will
be based on lowest maximum airfare per RCS
seat.
Individual Route Proposal with VGF
requested: Evaluation will be done based on
lowest VGF per RCS seat quoted by the
applicants. In case of tie, evaluation will be
based on lowest maximum airfare per RCS
seat.
Network Route Proposal with No VGF
requested: Evaluation will be done based on
maximum total number of RCS seats / week for
all RCS routes quoted by the applicants. In case
of tie, evaluation will be based on lowest
maximum airfare per RCS seat.
Network Route Proposal with VGF requested:
Evaluation will be done based on lowest total
VGF per RCS seat for all RCS routes quoted by
the applicants. In case of tie, evaluation will be
based on lowest maximum airfare per RCS
seat.
In the event two or more applicants have
quoted the same Maximum Airfare, the
Implementing Agency will specify a separate
procedure for breaking the tie.
Under RCS, airlines could bid either for an individual route or a network of routes but the current
rules give preference to proposals for network of routes during the evaluation process.
40
Swiss challenge route:
The Evaluation Committee will invite counter
proposals from other airline operators against
the eligible Initial Proposal as per the
prioritization framework. Counter proposals
will be invited for all eligible individual route
proposals, and network proposals put forward
by initial applicants. Evaluation of counter
proposals will be done as per the steps
explained is the previous section for allotment
of preferred proposal. Applicant submitting
the Initial Proposal will have option of Right to
Match if its proposal is within 10% range of the
preferred proposal. In case of more than one
Initial Proposal for the same RCS Route or a
Network Proposal, the Applicant who has
submitted the best financial proposal amongst
such Initial Proposals and whose financial
proposal is within a range of 10% of the
financial proposal submitted by a preferred
applicant will have the RTM Option.
The initial bids need to be submitted within 2
months of policy announcement i.e. by
December 2016; thereby not leaving much
time with players for evaluation and bid
submission. Additionally, AAI will consider
proposals once every 6 months.
Multiple uncertainties make evaluation of RCS routes for bidding a complex task. Therefore, careful
evaluation will need to be carried out by airlines to remain competitive and submit profitable bids.
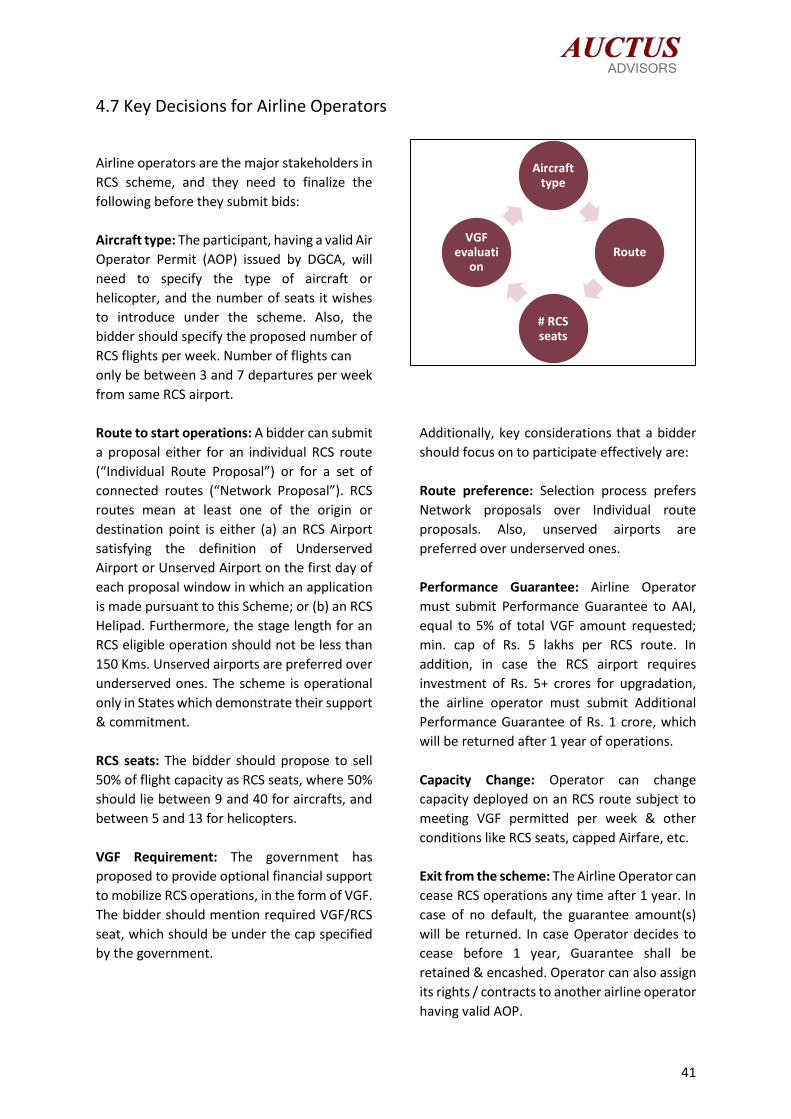
41
4.7 Key Decisions for Airline Operators
Airline operators are the major stakeholders in
RCS scheme, and they need to finalize the
following before they submit bids:
Aircraft type: The participant, having a valid Air
Operator Permit (AOP) issued by DGCA, will
need to specify the type of aircraft or
helicopter, and the number of seats it wishes
to introduce under the scheme. Also, the
bidder should specify the proposed number of
RCS flights per week. Number of flights can
only be between 3 and 7 departures per week
from same RCS airport.
Route to start operations: A bidder can submit
a proposal either for an individual RCS route
(“Individual Route Proposal”) or for a set of
connected routes (“Network Proposal”). RCS
routes mean at least one of the origin or
destination point is either (a) an RCS Airport
satisfying the definition of Underserved
Airport or Unserved Airport on the first day of
each proposal window in which an application
is made pursuant to this Scheme; or (b) an RCS
Helipad. Furthermore, the stage length for an
RCS eligible operation should not be less than
150 Kms. Unserved airports are preferred over
underserved ones. The scheme is operational
only in States which demonstrate their support
& commitment.
RCS seats: The bidder should propose to sell
50% of flight capacity as RCS seats, where 50%
should lie between 9 and 40 for aircrafts, and
between 5 and 13 for helicopters.
VGF Requirement: The government has
proposed to provide optional financial support
to mobilize RCS operations, in the form of VGF.
The bidder should mention required VGF/RCS
seat, which should be under the cap specified
by the government.
Additionally, key considerations that a bidder
should focus on to participate effectively are:
Route preference: Selection process prefers
Network proposals over Individual route
proposals. Also, unserved airports are
preferred over underserved ones.
Performance Guarantee: Airline Operator
must submit Performance Guarantee to AAI,
equal to 5% of total VGF amount requested;
min. cap of Rs. 5 lakhs per RCS route. In
addition, in case the RCS airport requires
investment of Rs. 5+ crores for upgradation,
the airline operator must submit Additional
Performance Guarantee of Rs. 1 crore, which
will be returned after 1 year of operations.
Capacity Change: Operator can change
capacity deployed on an RCS route subject to
meeting VGF permitted per week & other
conditions like RCS seats, capped Airfare, etc.
Exit from the scheme: The Airline Operator can
cease RCS operations any time after 1 year. In
case of no default, the guarantee amount(s)
will be returned. In case Operator decides to
cease before 1 year, Guarantee shall be
retained & encashed. Operator can also assign
its rights / contracts to another airline operator
having valid AOP.
Aircraft type
Route
# RCS seats
VGF evaluati
on

42
Other conditions: Airline Operator shall sell
RCS seats first before selling non-RCS seats.
Also, VGF shall be disbursed to the Airline
Operator for all committed RCS seats,
irrespective of the occupancy, for every RCS
flight on the RCS route. In case any RCS seat
doesn’t get sold due to cancellation of prior
ticket, it shall be considered as sold in case
Operator can provide sufficient proof.
Connecting to Major airports in the country:
Most of the key airports like Mumbai, Delhi,
Kolkata, Hyderabad, etc. are experiencing
severe slot crunch and may face constraints in
allocating additional time slots. In the initial
years of RCS scheme, we expect there to be
limited point to point connectivity between
regional airports and in most cases, regional
airports will be connected to one of the major
airports. In case an airline operator is planning
to connect a RCS airport to one of these larger
airports, they may face challenges in getting a
slot or slots will be available in non-peak hours.
Also, parking restrictions may require quick
turnaround of the aircraft. While these are
significant challenges, there are ways to
circumvent these by using other RCS airstrip /
airport in the same city, e.g. Mumbai has Juhu
airstrip under RCS scheme, which can be used
instead of using MIA, which is congested.
Better Route Planning with RCS: Airlines will
need to efficiently plan their aircraft
deployment while considering RCS. Also,
airlines may have to buy / lease smaller
aircrafts for running on RCS routes, which will
add to the operations cost since an aircraft
may be sub-optimally utilized if used only for
single RCS route. Probably flying network
routes in RCS would be more beneficial in
terms of higher utilization of fleet and crew.
Self-sustenance: The Government wants RCS
to become self-sustaining over the years and
hence has limited VGF to maximum 3 years.
Airlines must carefully plan their operations
and stimulate demand in the region to get
higher occupancy. Pricing would become a
very critical factor here, especially for the non-
RCS seats, and their comparison with alternate
modes of transport available for the selected
route. Additionally, private travel agents and
tour operators will also play an important role
in publicizing and promoting air travel in the
catchment of regional airports.
Given the complexity of decisions involved for RCS bidding, airlines will avoid external uncertainties
involving development of new routes. Therefore, the first phase of RCS bids can be expected to focus
on routes involving the 30 operational airports.
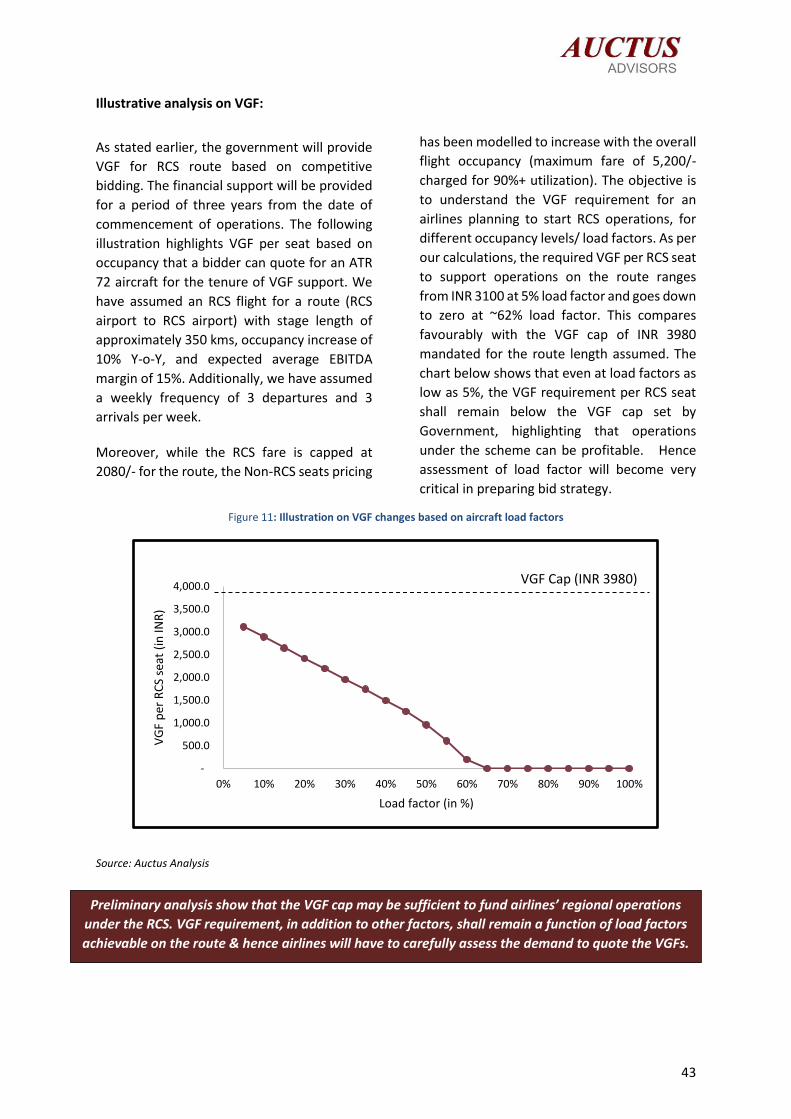
43
Illustrative analysis on VGF:
As stated earlier, the government will provide
VGF for RCS route based on competitive
bidding. The financial support will be provided
for a period of three years from the date of
commencement of operations. The following
illustration highlights VGF per seat based on
occupancy that a bidder can quote for an ATR
72 aircraft for the tenure of VGF support. We
have assumed an RCS flight for a route (RCS
airport to RCS airport) with stage length of
approximately 350 kms, occupancy increase of
10% Y-o-Y, and expected average EBITDA
margin of 15%. Additionally, we have assumed
a weekly frequency of 3 departures and 3
arrivals per week.
Moreover, while the RCS fare is capped at
2080/- for the route, the Non-RCS seats pricing
has been modelled to increase with the overall
flight occupancy (maximum fare of 5,200/-
charged for 90%+ utilization). The objective is
to understand the VGF requirement for an
airlines planning to start RCS operations, for
different occupancy levels/ load factors. As per
our calculations, the required VGF per RCS seat
to support operations on the route ranges
from INR 3100 at 5% load factor and goes down
to zero at ~62% load factor. This compares
favourably with the VGF cap of INR 3980
mandated for the route length assumed. The
chart below shows that even at load factors as
low as 5%, the VGF requirement per RCS seat
shall remain below the VGF cap set by
Government, highlighting that operations
under the scheme can be profitable. Hence
assessment of load factor will become very
critical in preparing bid strategy.
Figure 11: Illustration on VGF changes based on aircraft load factors
Source: Auctus Analysis
Preliminary analysis show that the VGF cap may be sufficient to fund airlines’ regional operations
under the RCS. VGF requirement, in addition to other factors, shall remain a function of load factors
achievable on the route & hence airlines will have to carefully assess the demand to quote the VGFs.
Aircraft type, RCS seats, Route, Stage length, VGF requirement
Various parameters need to be evaluated to submit these proposals:
-
500.0
1,000.0
1,500.0
2,000.0
2,500.0
3,000.0
3,500.0
4,000.0
0% 10% 20% 30% 40% 50% 60% 70% 80% 90% 100%
VG
F p
er R
CS
seat
(in
INR
)
Load factor (in %)
VGF Cap (INR 3980)
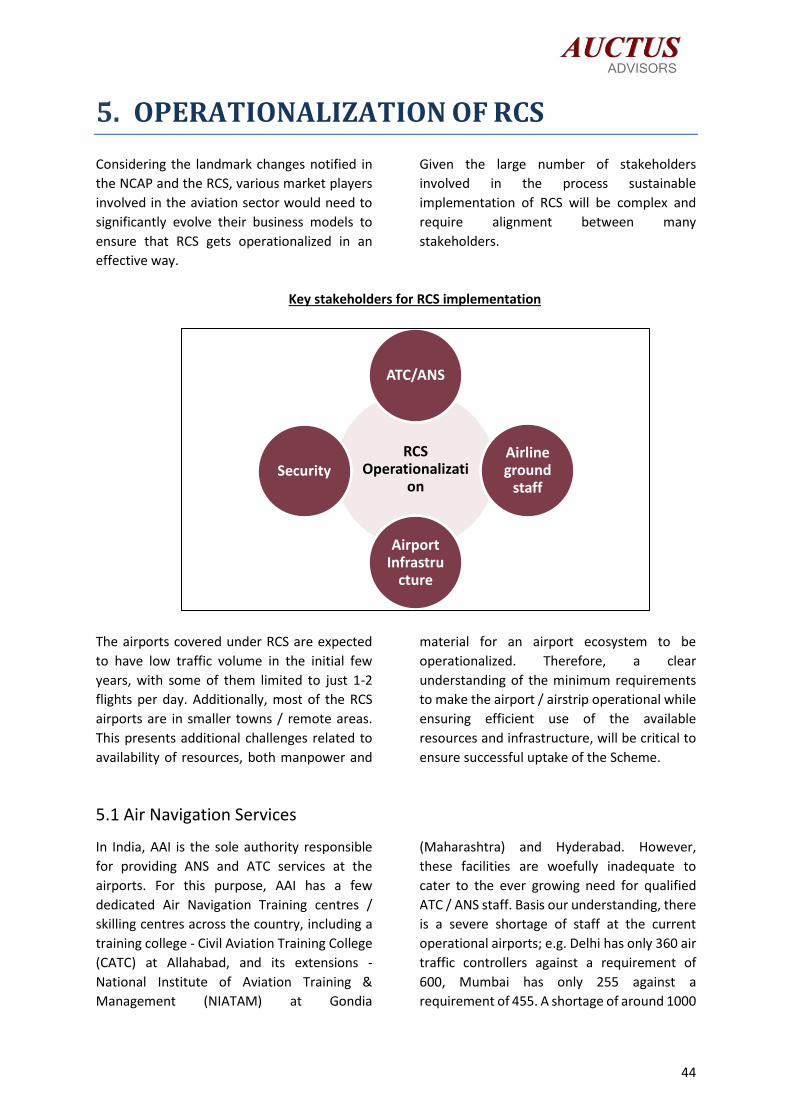
44
5. OPERATIONALIZATION OF RCS
Considering the landmark changes notified in
the NCAP and the RCS, various market players
involved in the aviation sector would need to
significantly evolve their business models to
ensure that RCS gets operationalized in an
effective way.
Given the large number of stakeholders
involved in the process sustainable
implementation of RCS will be complex and
require alignment between many
stakeholders.
Key stakeholders for RCS implementation
The airports covered under RCS are expected
to have low traffic volume in the initial few
years, with some of them limited to just 1-2
flights per day. Additionally, most of the RCS
airports are in smaller towns / remote areas.
This presents additional challenges related to
availability of resources, both manpower and
material for an airport ecosystem to be
operationalized. Therefore, a clear
understanding of the minimum requirements
to make the airport / airstrip operational while
ensuring efficient use of the available
resources and infrastructure, will be critical to
ensure successful uptake of the Scheme.
5.1 Air Navigation Services
In India, AAI is the sole authority responsible
for providing ANS and ATC services at the
airports. For this purpose, AAI has a few
dedicated Air Navigation Training centres /
skilling centres across the country, including a
training college - Civil Aviation Training College
(CATC) at Allahabad, and its extensions -
National Institute of Aviation Training &
Management (NIATAM) at Gondia
(Maharashtra) and Hyderabad. However,
these facilities are woefully inadequate to
cater to the ever growing need for qualified
ATC / ANS staff. Basis our understanding, there
is a severe shortage of staff at the current
operational airports; e.g. Delhi has only 360 air
traffic controllers against a requirement of
600, Mumbai has only 255 against a
requirement of 455. A shortage of around 1000
RCS Operationalizati
on
ATC/ANS
Airline ground
staff
Airport Infrastru
cture
Security

45
air traffic controllers was revealed by 2014
audit by International Civil Aviation
Organisation, which roughly translates into
one-third of the country’s total ATC positions
being vacant. Moreover, Bloomberg projects
requirement of 40,000 additional air traffic
controllers over the next 14 years. With the
limited training facilities available currently, it
is bound to result in a shortfall of 1000
controllers every year.
Additionally, the operationalization of RCS
airports will further increase the requirement
of ATC staff. Also, since RCS airports will have
limited connectivity in the initial years, the
efficiency of building dedicated ATC
infrastructure and putting staff at each airport
will have to be evaluated by AAI. From AAI’s
perspective, the challenge would be in training
the staff and locating them in these remote
areas.
One of the possible solutions to this problem
can involve AAI providing remote ATC facilities
at smaller airports, manned by controllers
stationed at nearby major airports. Sweden is
successfully using remote navigation at one of
the remote airports named Ornskoldsvik,
where the control tower has multiple cameras
which are watched by controllers sitting at a
distant airport to guide the planes accordingly.
The technology has been purported to be
cheaper and better than the traditional towers
requiring dedicated ATC staff and expensive
navigation equipment. It also helps multiple
small airports pool navigation services leading
to cost and manpower optimization for ATC /
ANS services. Similar solutions have already
been tested in US, Norway and Australia.
However, while such technology exists and
have been successfully tested overseas, its
deployment in Indian circumstances could be a
little more difficult considering the remoteness
of RCS airports, connectivity issues, absence of
stable power connection, etc. These, while not
insurmountable, will require a strong will and
flexibility to consider alternative solutions.
Additionally, AAI can also evaluate the
possibility of inviting private sector to train
ATC/ANS staff, either through sub-contracting
mode or independent training academies, and
making them ready to manage the smaller RCS
airports. This will also require further
streamlining, including some degree of
placement certainty (given the special & non-
transferable nature of the skill), definition of
relevant training standards / protocols,
identification of approving / certifying
authority, etc. before inviting private sector
participation.
5.2 Airline Staff Availability
The RCS policy allows airlines to manage their
own ground handling at the RCS airports to
optimize costs.
Basis our estimate, in order to support one
flight at an unserved airport, apart from staff
requirement for the ATS/ANS, security & other
terminal operations, the airlines would require
a minimum of 9-11 people per return flight:
Table 6: Manpower requirement of airline per new RCS airport
Staff Number of employees
Pilot 2
Flight crew 2
Check-in counters & boarding procedures
2 - 3
Ground handling (passenger, baggage & cargo handling)
3 - 4
Total 9 – 11
As highlighted earlier, the initial years may
witness low traffic some RCS airports.
Moreover, considering the exclusivity of
operating routes for 3 years, many of the RCS
airports may see only one airlines operating at
the airport. This will make it very challenging
for any airline to manage the ground handling
for a daily capacity of 100-150 passengers.
Airlines may find it un-economical to pay for

46
under-utilized staff at RCS airports, which only
see 1-2 flight movements in a day. In such
cases, airlines can work with the airport
operator to cross-train some of the staff who
could support both the airport and the airlines
in the ground-handling functions.
In case, multiple airlines are operating at a
single airport, scale related challenge can be
partially overcome by encouraging all airlines
operating at the airport to share the
infrastructure facilities. This can also trigger
sharing of manpower resources amongst
airlines to ensure efficient utilization of the
staff and derive quality service from them.
However, it will be interesting to see how
airlines manage the coordination amongst
them to develop /use such common talent
pool, since this concept is a big deviation from
the current operating model of most airlines.
5.3 Infrastructure Creation & Management
The list of airports which qualify for RCS
involves several unserved and underserved
airports. Some of these airports lack even the
most basic infrastructure such as a terminal
building in operating condition. Hence, the
Government may have to incur significant
investment to make the terminal building and
other airside infrastructure ready for
scheduled commercial flight operations.
Additionally, the airport development will
typically take place after a route to that airport
gets bid-out and there is traffic certainty.
However, planning for any additional
infrastructure will need to be done carefully,
especially given that some of the regional
airports could be very close to each other, e.g.
Barrackpore and Behala airports in West
Bengal are less than 50 kms apart. Making
significant investments at both airports may
lead to duplication of efforts when both
airports would likely be competing for the
same / similar passenger catchment area.
As notified in the RCS, AAI is the authority
designated to carry out upgradation of
regional airports. However, there is ambiguity
on the time that AAI will take to upgrade the
airport as well as cost implications for this
upgrade. Each regional airport that is bid-out
for the new RCS route will first need to
undergo a technical scan to understand the
infrastructure gaps that it may have in order to
handle the scheduled commercial flights.
Appropriately, required funds would need to
be estimated & duly sought through the State
Government and deployed swiftly to ensure
that airport is ready for operation without
impacting timelines for the winning bidder
airline(s) to start their route(s). In fact,
considering the challenges associated with
existing infrastructure, regional airlines may be
more inclined to bid for those unserved/
underserved airports which are already
operation-ready. Hence, AAI and State
Government would need to pro-actively
publicise their commitment towards
developing the unserved / underserved
airports.
In addition to the provision of airside
infrastructure and terminal space, some
investment shall also be required in installing
basic airport systems – baggage handling
systems, check-in counters, screening
machines, etc. While the rehabilitation &
upgradation of infrastructure will be
undertaken by AAI, ownership of the airport
shall continue to be with the existing owner of
the airport (State Government / private
operator / AAI, etc.). As such there will be a
need to arrange a smooth transfer of the new
infrastructure post its operationalization to the
owner of the airport who shall maintain the
facilities going forward.
Moreover, the airport operator will also need
to ensure availability of skilled manpower for
operating the airport terminal - additional

47
janitorial and cleaning staff, manpower for
repairs and maintenance purposes and so on.
The small scale of operations and locational
remoteness may lead to challenge in getting
adequately trained and qualified personnel.
Owing to low traffic, the airport operator
would also need to efficiently plan the shifts of
manpower to reduce the burden of overheads.
Basis our discussion with senior executives
across various airport developers, we believe
that the following could be an indication of the
minimum infrastructure that would be
required for the typical aircrafts expected to
ply on RCS routes.
Table 7: Operational facilities for various types of Aircraft
Description
Type-I Type-II Type-III
General Aviation
20-Seater
ATR-42
40 to 45-seater
CRJ-700/Q-400/ATR-
72
70-80 seater
Land required 200 – 600 acres
Runway length &
width
1100M X 30M 1400M X 45M 1800M X 45M
Basic strip along
runway
75m on both sides of
runway
75m on both sides of
runway
150m on both sides
of runway
Daylight non-
instrument
operations (VFR)
Daylight non-
instrument
operations (VFR)
Daylight non-
instrument
operations (VFR)
Terminal Building ~350 Sqm
No air-conditioning
~960 Sqm
SHA: air-conditioning
~1985 Sqm
SHA: air-conditioning
Apron 2 Nos.
20 Seater Aircrafts
2 Nos.
ATR-42 type
2 Nos.
ATR-72/ Q-400
The new RCS airports are expected to cater to very low traffic volumes initially, with just 1-2 flights
per day. Therefore, airlines might be more incentivized to bid for airports which are operationally
ready as of today.
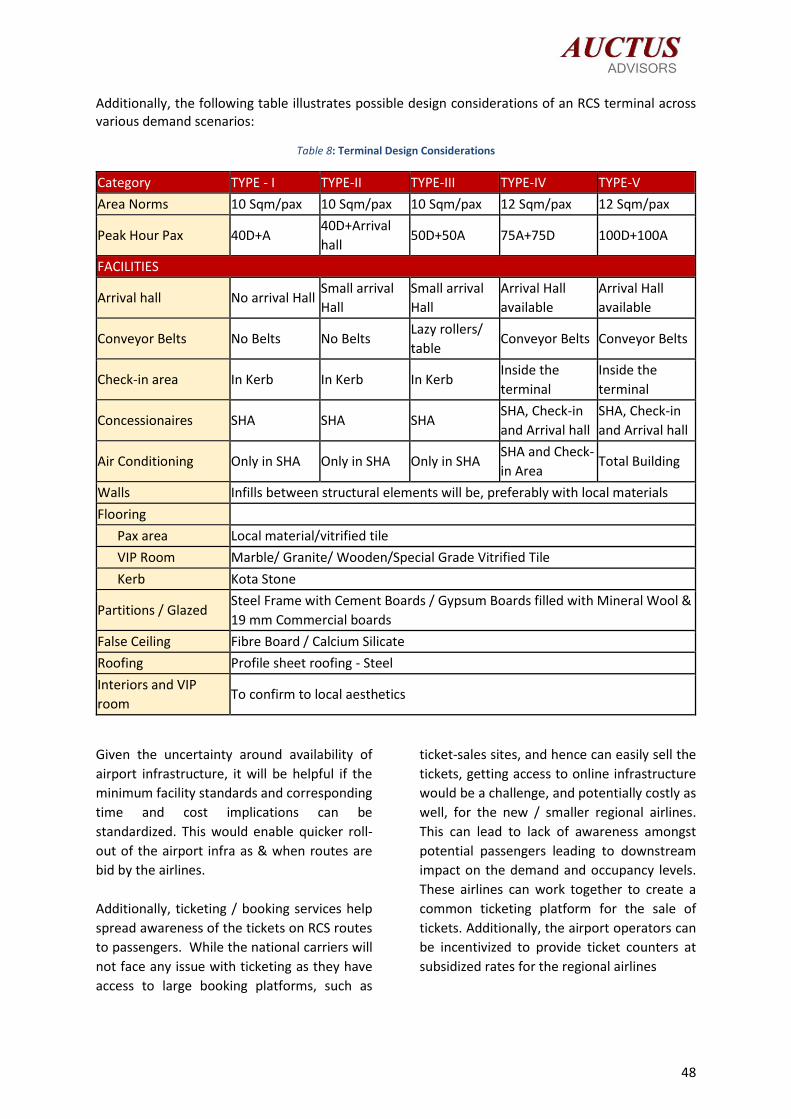
48
Additionally, the following table illustrates possible design considerations of an RCS terminal across various demand scenarios:
Table 8: Terminal Design Considerations
Category TYPE - I TYPE-II TYPE-III TYPE-IV TYPE-V
Area Norms 10 Sqm/pax 10 Sqm/pax 10 Sqm/pax 12 Sqm/pax 12 Sqm/pax
Peak Hour Pax 40D+A 40D+Arrival
hall 50D+50A 75A+75D 100D+100A
FACILITIES
Arrival hall No arrival Hall Small arrival
Hall
Small arrival
Hall
Arrival Hall
available
Arrival Hall
available
Conveyor Belts No Belts No Belts Lazy rollers/
table Conveyor Belts Conveyor Belts
Check-in area In Kerb In Kerb In Kerb Inside the
terminal
Inside the
terminal
Concessionaires SHA SHA SHA SHA, Check-in
and Arrival hall
SHA, Check-in
and Arrival hall
Air Conditioning Only in SHA Only in SHA Only in SHA SHA and Check-
in Area Total Building
Walls Infills between structural elements will be, preferably with local materials
Flooring
Pax area Local material/vitrified tile
VIP Room Marble/ Granite/ Wooden/Special Grade Vitrified Tile
Kerb Kota Stone
Partitions / Glazed Steel Frame with Cement Boards / Gypsum Boards filled with Mineral Wool &
19 mm Commercial boards
False Ceiling Fibre Board / Calcium Silicate
Roofing Profile sheet roofing - Steel
Interiors and VIP
room To confirm to local aesthetics
Given the uncertainty around availability of
airport infrastructure, it will be helpful if the
minimum facility standards and corresponding
time and cost implications can be
standardized. This would enable quicker roll-
out of the airport infra as & when routes are
bid by the airlines.
Additionally, ticketing / booking services help
spread awareness of the tickets on RCS routes
to passengers. While the national carriers will
not face any issue with ticketing as they have
access to large booking platforms, such as
ticket-sales sites, and hence can easily sell the
tickets, getting access to online infrastructure
would be a challenge, and potentially costly as
well, for the new / smaller regional airlines.
This can lead to lack of awareness amongst
potential passengers leading to downstream
impact on the demand and occupancy levels.
These airlines can work together to create a
common ticketing platform for the sale of
tickets. Additionally, the airport operators can
be incentivized to provide ticket counters at
subsidized rates for the regional airlines
49
5.4 Provision of Airport Security
Security is an area which cannot be overlooked
even at the regional airports. Deep planning
would be required to ensure adequate security
arrangements are made both on the landside
and as well as airside at RCS airports.
Numerous challenges exist in maintaining
airside security including properly fencing the
airport & airside boundary, availability of
security personnel in case of emergency, patrol
vehicles, etc. Some of the smaller airports in
the country have already witnessed few
incidents compromising airside security, e.g.
when a flight skidded-off while landing when a
herd of wild boars came on the runway in
December 2015; in November 2014, a flight
severely damaged its engine when it hit a
buffalo which had accidentally strayed on the
runway. Apart from the risk of immediate loss
of life and property, these incidences also risk
far greater repercussions on the overall sense
of security at the regional airports. Given the
remote location of the RCS airports and, in
some cases, basic airport infrastructure,
avoiding these stray incidents will become
critical.
On the landside as well, ensuring availability of
adequate security staff to man all open points
will be critical. Basis terminal infrastructure,
with legacy building structures which present
multiple access points can present additional
risks. Given these risks, stricter security
measures would need to be undertaken –
increased security of the terminal and other
landside areas. An additional complication is
that while the operating hours of the RCS
airport may be limited, the security apparatus,
especially peripheral landside and airside
security will still be required on a 24x7 basis.
Additionally, electronic intrusion detection and
prevention systems can be evaluated, but their
costs are typically prohibitive. The
Government can think of shrinking security
force during non-working hours of the airport
to bare minimum numbers to keep landside
and airside safe and secure from trouble
mongers. Prevention mechanisms can involve
BCAS conducting a comprehensive review of
the security for each individual RCS airport.
Additionally, availability of trained security
manpower for all RCS airports will need to be
planned. This may pose additional challenges
for the CISF, which is mandated with
protecting assets of national importance, and
is the agency of choice for protecting airport
assets in the country. Supporting each no frill
airport will require at least 15-20 security
personnel to cover both landside and airside.
Ensuring availability of adequate CISF
personnel at remote locations, with basic
infrastructure availability, will be a challenge.
The Government can also plan to involve
private participation by scrutinising and
shortlisting private security agencies,
approved & accredited by BCAS, and allow
them to provide non-core security functions at
airports. While private security agencies are
involved largely in access control roles
currently, this will involve significant up-skilling
and training to ensure preparedness for
handling security and safety related aspects.
The Regional Connectivity Scheme is a much needed positive initiative towards making flying
accessible and affordable to large parts of the country which are not connected today. With due
support from states and timely airport infrastructure development the new RCS scheme will improve
air connectivity in India and drive the next leg of aviation growth in India.