enhanced plug-in hybrid electric vehicles · enhanced plug-in hybrid electric vehicles alan...
TRANSCRIPT
Enhanced Plug-in Hybrid Electric Vehicles
Alan Millner, Nicholas Judson, Bobby Ren, Ellen Johnson, William Ross Massachusetts Institute of Technology Lincoln Laboratory. 244 Wood St. Lexington, MA 02420
{amillner, judson, bobby.ren, ejohnson, bross}@ll.mit.edu
Abstract—Plug-in hybrid electric vehicles (PHEVs) have the potential to reduce fossil fuel use, decrease pollution, and allow renewable energy sources for transportation, but their lithium ion battery subsystems are presently too expensive. Three enhancements to PHEVs are proposed here that can improve the economics. First, the incorporation of location information into the car’s energy management algorithm allows predictive control to reduce fuel consumption through prior knowledge of the upcoming route and energy required. Second, the use of the vehicle battery while parked, offsetting the short peaks in commercial-scale facility electrical demand to reduce demand charges, can provide additional revenue to pay for the battery. Third, the battery cycle life must be maximized to avoid high replacement costs; a model of battery wear out for lithium ion batteries is presented and is used to confirm that the above strategies are compatible with long battery life.
1. BACKGROUND: A VISION FOR PHEVS
The US energy economy suffers from the use of too much petroleum. This is a problem because the world’s oil reserves are in places far from our national borders and often governed by countries with different political agendas; 60% of the reserves are in the Mideast [1]. It is also a problem because the long term supply of petroleum is limited, with discoveries declining since 1964 [2]. And, it is a problem because our burning of this non-renewable resource produces too much greenhouse gas, with 25% of CO2 production coming from the US, and 33% of US CO2 coming from oil. Transportation represents 28% of US energy use and 70% of petroleum use [1]. Power obtained from gasoline burned in automobile engines is extremely inefficient, with an average final efficiency of only 15%, with the rest wasted in heat and drive train losses [3]. By comparison, central electric power plants operate at an efficiency of 35% [1]. ___ This work was sponsored by the United States Government under Air Force contract FA8721-05-C-0002. Opinions, interpretations, conclusions, and recommendations are those of the authors and not necessarily endorsed by the United States Government.
By shifting our least efficient energy conversion step from inefficient small engines to central power plants, the total well to wheel efficiency of our transportation sector can be greatly improved. Also, use of electric power transmission and distribution allows the source of transport energy to be renewable sources, nuclear, or natural gas, with far greater long term supplies and lower carbon footprint. If half the passenger vehicle fleet of the US were replaced by 100 mile per gallon (mpg) plug-in hybrids, the petroleum use of the US would be reduced by approximately the amount now imported from the Mideast. Our CO2 emissions would be reduced by 0.5 billion tons per year, or 8%. Use of plug-in hybrid electric vehicles (PHEVs) allows the limited use of liquid fuels to extend range when that is needed for convenience, taking advantage of their very high energy density, while addressing the need for fuel conservation during the typical shorter commuting trips that dominate usage. PHEVs are becoming available. Conversions such as the A123 Systems, Inc. Hymotion L5 converted Toyota Prius hybrid have been sold in quantities of hundreds for several years now. The General Motors Chevrolet Volt is due late this year, and the Toyota Prius PHEV is scheduled for release in 2011. Other sources are under development, including some suitable for trucks and military vehicles. The problem holding back this technology now is the high cost of the battery subsystem. Lithium ion batteries, the technology of choice today, are expensive and will probably remain so for some years to come. For example, the aforementioned Toyota Prius conversion by A123 Systems in 2008 cost about $32,000: $22,000 for the hybrid car, and $10,000 for the retrofit module with a 5 kWh battery pack. Vehicles at this cost level can be leased for approximately $400 per month. The larger the battery capacity, the more expensive the PHEV becomes. The solution envisioned here is to first make use of an efficient vehicle with the battery sized to address common commuting distances electrically. Then, make best use of intelligent controls to minimize fuel consumption by making predictive use of knowledge of the route to be traveled. Third, use the battery to provide grid regulation services through peak power shaving while parked at work, a version of vehicle to grid (V2G) power transfer that makes use of the economic relationship between a commuter and employer and that we call vehicle to building (V2B), generating revenue to offset the battery cost. And finally, make use of good battery life models to minimize
degradation of the battery while it is used for both transportation and regulation. By enhancing the PHEV in these ways, the high initial cost of battery subsystems can be addressed and moderated. By allowing economies of scale to be reached through the manufacture of the large production quantities of PHEVs, this may bootstrap the technology into a viable production range. 2. PREDICTIVE CONTROL OF VEHICLE ENERGY
The concept of improving fuel economy by foreknowledge of the route to be traveled, using global positioning satellite (GPS) and other available sources of information, has been considered for some years now [4, 5]. The creation of simple control algorithms making use of specific information for a parallel or series-parallel hybrid vehicle has not been clear. Presented here is an approach that makes use of at least the distance to be traveled, and potentially the elevation changes to be encountered, speed changes including expected traffic congestion, road surfaces, and other factors affecting dynamic vehicle power demand, to predict the requirements on the vehicle power plant over its trip, and schedule the use of electrical or liquid fuel energy to optimize engine efficiency and minimize fuel use. The present state of the art is to operate a PHEV with as much energy as possible coming from the battery until it reaches a low state of charge [6]. Then energy is obtained from the liquid fuel engine to sustain this minimum battery charge for the rest of the trip. The problem with this strategy is that over that last part of the trip, the engine is often required to operate at a power level that is not its optimum operating point. If more battery energy is saved until later in the trip, however, this optimization can be extended and fuel saved. To test this concept, a model was needed of the vehicle, the vehicle energy control system, and the driving cycle or route including speed vs. time. This allows evaluation of predictive control strategies and comparison with conventional strategies, to determine quantitative benefits in terms of improved fuel consumption.
Generator
GasEngine
Trans-mission RoadGas
Tank
V2GCharger
ChargerInverter
ElectricMotor
Battery
Utility
V2B
FrictionAcceleration
ElevationWind
Shaft
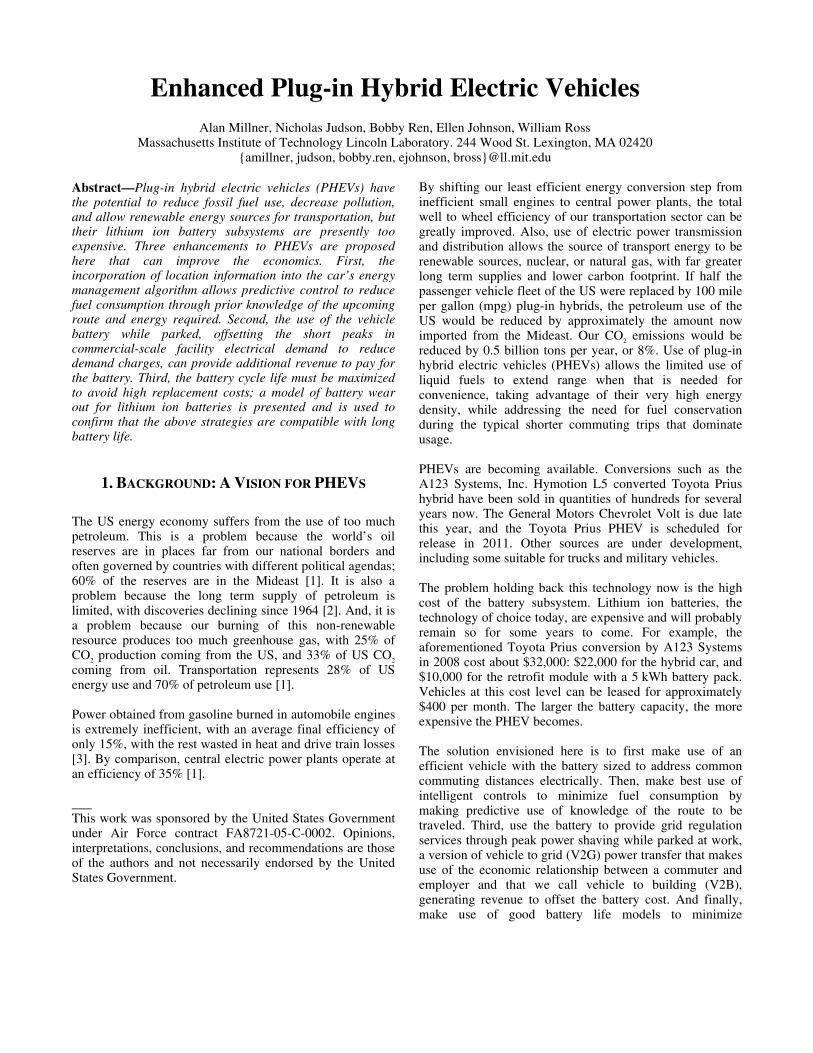
Figure 1. Vehicle energy model; each boxed element has an efficiency dependent on energy flow through that element. Energy flow directions are indicated by arrows and external sources of energy and driving conditions that affect energy expenditure are indicated. A simple power flow model of a PHEV vehicle was created using MATLAB [7] with vehicle weight, rolling resistance, and aerodynamic parameters modeled on the 2010 Toyota Prius. This included a model of each major component (Figure 1), with energy efficiency as a function of power level through that component. A state diagram control strategy was implemented for this vehicle diagram (Figure 2), in which the state variables are the power required of the system at that time and the state of charge (SOC) of the battery.
Mech-anical
BrakingVariable Electric
Only
Full
Max
Min
Target
Empty
Max B
raking
Zero P
ower
Gas O
ptimum
Max E
lectric
Max E
lectric
+ Gas
Opti
mum
Max E
lectric
+ Max
Gas
Power Demand by Car
Batte
ry S
OC
Max D
eman
d
Maximum Electric+ Variable Gas
MaxElectric
+ MaxGas
Maximum Gas Only
Variable Gas OnlyCharging
RegenCharging
Variable Electric+ Optimum Gas
OptimumGas
Charging
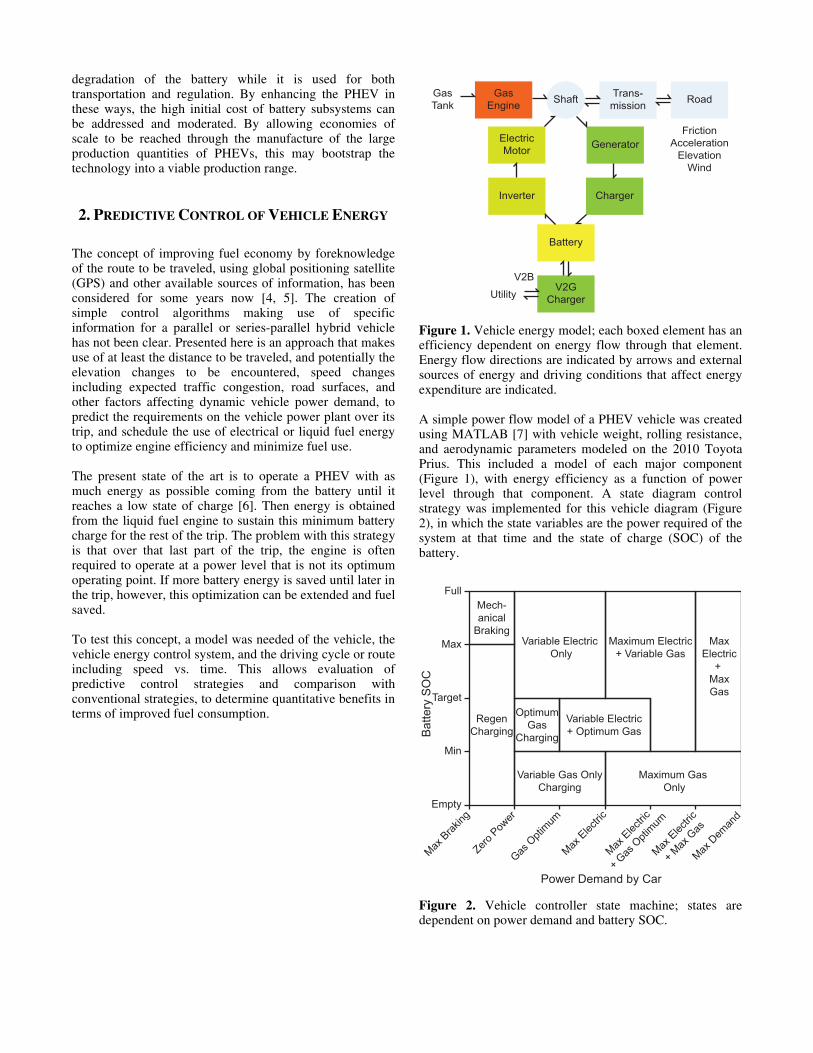
Figure 2. Vehicle controller state machine; states are dependent on power demand and battery SOC.

As part of this control strategy, there is a parameter representing the target SOC of the battery. If this is taken to be the minimum SOC, then this strategy reduces to the conventional one of charge depletion followed by charge sustaining mode [6]. However, if this parameter is allowed to vary over the trip, gradually reducing and reaching the minimum only at the end of the trip, then a more flexible strategy emerges. A comparison of control strategies was done for the modeled vehicle with a 5 kWh battery capacity (the same as the A123 Systems, Inc. Hymotion L5 PHEV conversion) over a route made up of three US06 driving cycles [8], to make a 24 mile trip typical of the length of daily commute of US drivers. The US06 driving cycle is one of the published test cycles by the US Environmental Protection Agency and is the most aggressive available standard test cycle, although it does not capture the full range of driving styles of all US drivers [9]. The conventional control strategy resulted in a trip averaging 66 mpg, whereas the same vehicle parameters simulated using a gradual depletion resulted in a trip of 71 mpg (Figure 3). For trips of this length and similar parameters, the fuel savings using this simple control improvement, knowing the length of the trip, was between 7 and 10%.
0 600 1200 18000.1
0.4
0.7
1
Time (seconds)
SOC
Gradual Depletion
Conventional Control
Figure 3. Vehicle control strategies with and without knowledge of trip length: battery SOC vs. time. Use of more information about the trip in advance, available at the vehicle via GPS, the web, real-time traffic updates, or vehicle to vehicle communication, might include elevation changes, speed variation over the trip, traffic patterns, road surfaces and conditions, weather, air temperature, and individual driver driving habits. It remains to be seen which of these are worthwhile to include in the energy management algorithms.
3. VEHICLE TO BUILDING
Electric power customers with high power demand service, such as large commercial and institutional ones, in addition to charges per kWh as residential customers are accustomed to, also pay demand charges for the maximum number of kilowatts drawn during the billing period. These demand charges generally start for customers exceeding 100-500 kW of peak power demand, depending on the utility provider. Often these charges are then the largest portion of the bill. For MIT Lincoln Laboratory in the Boston area, the demand charge is most of the electric bill. If electric vehicles are used in V2G mode, they can level the peaks in demand and reduce these charges. As commuters will be at work during peak demand hours, and since employees have a ready means of exchanging money with their employer, this is a compelling model for realizing the specific mode of V2G that we refer to as V2B. This is also a way of aggregating the potentially many small utility interfaces of PHEV’s. Looking at the electrical usage of MIT Lincoln Laboratory in 15 minute power demand increments during the month of July 2008 (the time scale over which demand charges are calculated in this case) there were three narrow peaks well above the power drawn for the rest of the days (Figure 4). Baseline night load in July was about 8 MW.
Time of Day
Pow
er D
eman
d (M
W)
12
12AM1012AM
11
6AM 6PM12PM
$15 - $20 / kW /month
Figure 4. Electric power demand at MIT Lincoln Laboratory for days in July 2008. Each day is shown as a different series of 15 minute power consumption points (the graph is truncated below demands of 10 MW). The difference in power demand for three peaks that could be shaved with a V2B approach is shown. These peaks are due to heating, ventilation, and air conditioning system transients, and are typical for many months of the year. Their duration of fewer than 30 minutes is a good match to the capabilities of PHEV batteries. As
demand charges in the summer and winter are on the order of $20 and $14 per kW respectively, reduction in these peaks offers significant savings. Initial calculations showed that if a V2B system could identify and reduce these peaks in real-time, the resulting savings were over $100 per month per car. This could go far to offset the high cost of the battery subsystem in the vehicle. Subsequent analyses varying the number of vehicles available for V2B, the power capability of their bi-directional chargers, and the size of their batteries led to the emergence of several patterns (Figure 5).
Car Number
Mon
thly
Sav
ings
($)
600
200
0
200
5 1510
400
13.3kWh battery, 3C discharge rate (40kW charger)5kWh battery, 4C rate (20kW charger)
5kWh battery, 3C (15kW charger)13.3kWh battery, 1.13C (15kW charger)
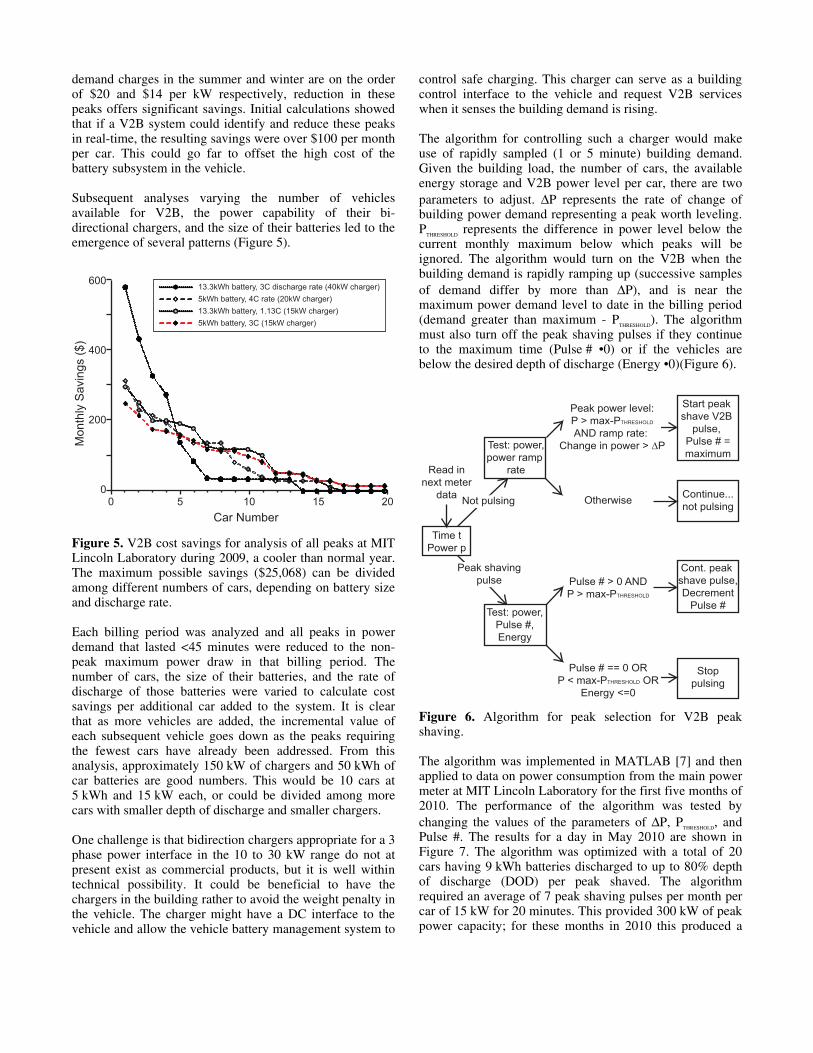
Figure 5. V2B cost savings for analysis of all peaks at MIT Lincoln Laboratory during 2009, a cooler than normal year. The maximum possible savings ($25,068) can be divided among different numbers of cars, depending on battery size and discharge rate. Each billing period was analyzed and all peaks in power demand that lasted <45 minutes were reduced to the non-peak maximum power draw in that billing period. The number of cars, the size of their batteries, and the rate of discharge of those batteries were varied to calculate cost savings per additional car added to the system. It is clear that as more vehicles are added, the incremental value of each subsequent vehicle goes down as the peaks requiring the fewest cars have already been addressed. From this analysis, approximately 150 kW of chargers and 50 kWh of car batteries are good numbers. This would be 10 cars at 5 kWh and 15 kW each, or could be divided among more cars with smaller depth of discharge and smaller chargers. One challenge is that bidirection chargers appropriate for a 3 phase power interface in the 10 to 30 kW range do not at present exist as commercial products, but it is well within technical possibility. It could be beneficial to have the chargers in the building rather to avoid the weight penalty in the vehicle. The charger might have a DC interface to the vehicle and allow the vehicle battery management system to
control safe charging. This charger can serve as a building control interface to the vehicle and request V2B services when it senses the building demand is rising. The algorithm for controlling such a charger would make use of rapidly sampled (1 or 5 minute) building demand. Given the building load, the number of cars, the available energy storage and V2B power level per car, there are two parameters to adjust. ΔP represents the rate of change of building power demand representing a peak worth leveling. P
THRESHOLD represents the difference in power level below the
current monthly maximum below which peaks will be ignored. The algorithm would turn on the V2B when the building demand is rapidly ramping up (successive samples of demand differ by more than ΔP), and is near the maximum power demand level to date in the billing period (demand greater than maximum - P
THRESHOLD). The algorithm
must also turn off the peak shaving pulses if they continue to the maximum time (Pulse # •0) or if the vehicles are below the desired depth of discharge (Energy •0)(Figure 6).
Time tPower p
Stoppulsing
Test: power,Pulse #,Energy
Cont. peak shave pulse,Decrement
Pulse #
Test: power,power ramp
rate
Start peak shave V2B
pulse, Pulse # =maximum
Otherwise Continue...not pulsing
Pulse # > 0 ANDP > max-PTHRESHOLD
Read innext meter
data Not pulsing
Peak shavingpulse
Pulse # == 0 ORP < max-PTHRESHOLD OR
Energy <=0
Peak power level:P > max-PTHRESHOLD
AND ramp rate: Change in power > ΔP
Figure 6. Algorithm for peak selection for V2B peak shaving. The algorithm was implemented in MATLAB [7] and then applied to data on power consumption from the main power meter at MIT Lincoln Laboratory for the first five months of 2010. The performance of the algorithm was tested by changing the values of the parameters of ΔP, P
THRESHOLD, and
Pulse #. The results for a day in May 2010 are shown in Figure 7. The algorithm was optimized with a total of 20 cars having 9 kWh batteries discharged to up to 80% depth of discharge (DOD) per peak shaved. The algorithm required an average of 7 peak shaving pulses per month per car of 15 kW for 20 minutes. This provided 300 kW of peak power capacity; for these months in 2010 this produced a
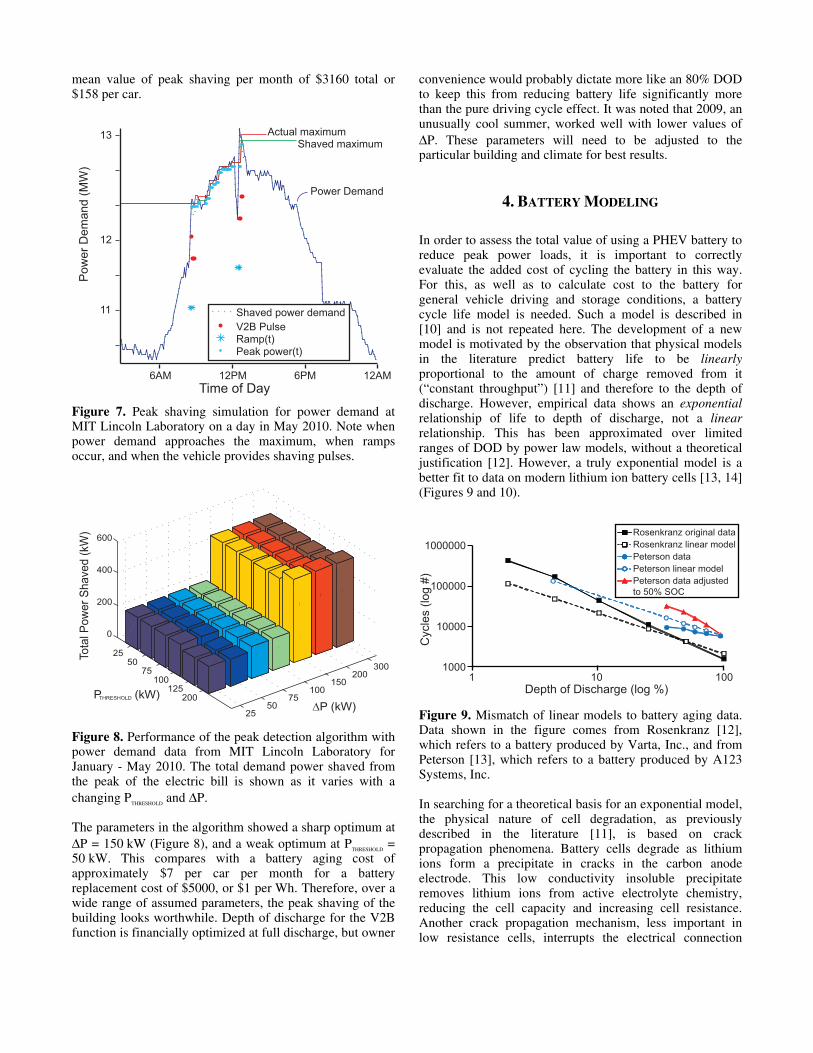
mean value of peak shaving per month of $3160 total or $158 per car.
11
12
13
Pow
er D
eman
d (M
W)
Power Demand
6AMTime of Day
12PM 6PM 12AM
Shaved maximumActual maximum
Shaved power demandV2B PulseRamp(t)Peak power(t)
Figure 7. Peak shaving simulation for power demand at MIT Lincoln Laboratory on a day in May 2010. Note when power demand approaches the maximum, when ramps occur, and when the vehicle provides shaving pulses.
25 50
75 100
150200
30025
50 75
100125
200
0
200
400
600
ΔP (kW)
Tota
l Pow
er S
have
d (k
W)
P (kW)THRESHOLD
Figure 8. Performance of the peak detection algorithm with power demand data from MIT Lincoln Laboratory for January - May 2010. The total demand power shaved from the peak of the electric bill is shown as it varies with a changing P
THRESHOLD and ΔP.
The parameters in the algorithm showed a sharp optimum at ΔP = 150 kW (Figure 8), and a weak optimum at P
THRESHOLD =
50 kW. This compares with a battery aging cost of approximately $7 per car per month for a battery replacement cost of $5000, or $1 per Wh. Therefore, over a wide range of assumed parameters, the peak shaving of the building looks worthwhile. Depth of discharge for the V2B function is financially optimized at full discharge, but owner
convenience would probably dictate more like an 80% DOD to keep this from reducing battery life significantly more than the pure driving cycle effect. It was noted that 2009, an unusually cool summer, worked well with lower values of ΔP. These parameters will need to be adjusted to the particular building and climate for best results.
4. BATTERY MODELING
In order to assess the total value of using a PHEV battery to reduce peak power loads, it is important to correctly evaluate the added cost of cycling the battery in this way. For this, as well as to calculate cost to the battery for general vehicle driving and storage conditions, a battery cycle life model is needed. Such a model is described in [10] and is not repeated here. The development of a new model is motivated by the observation that physical models in the literature predict battery life to be linearly proportional to the amount of charge removed from it (“constant throughput”) [11] and therefore to the depth of discharge. However, empirical data shows an exponential relationship of life to depth of discharge, not a linear relationship. This has been approximated over limited ranges of DOD by power law models, without a theoretical justification [12]. However, a truly exponential model is a better fit to data on modern lithium ion battery cells [13, 14] (Figures 9 and 10).
1000000
10001 100
10000
10Depth of Discharge (log %)
Cyc
les
(log
#) 100000
Rosenkranz original data
Peterson dataPeterson linear model
Rosenkranz linear model
Peterson data adjusted to 50% SOC
Figure 9. Mismatch of linear models to battery aging data. Data shown in the figure comes from Rosenkranz [12], which refers to a battery produced by Varta, Inc., and from Peterson [13], which refers to a battery produced by A123 Systems, Inc. In searching for a theoretical basis for an exponential model, the physical nature of cell degradation, as previously described in the literature [11], is based on crack propagation phenomena. Battery cells degrade as lithium ions form a precipitate in cracks in the carbon anode electrode. This low conductivity insoluble precipitate removes lithium ions from active electrolyte chemistry, reducing the cell capacity and increasing cell resistance. Another crack propagation mechanism, less important in low resistance cells, interrupts the electrical connection
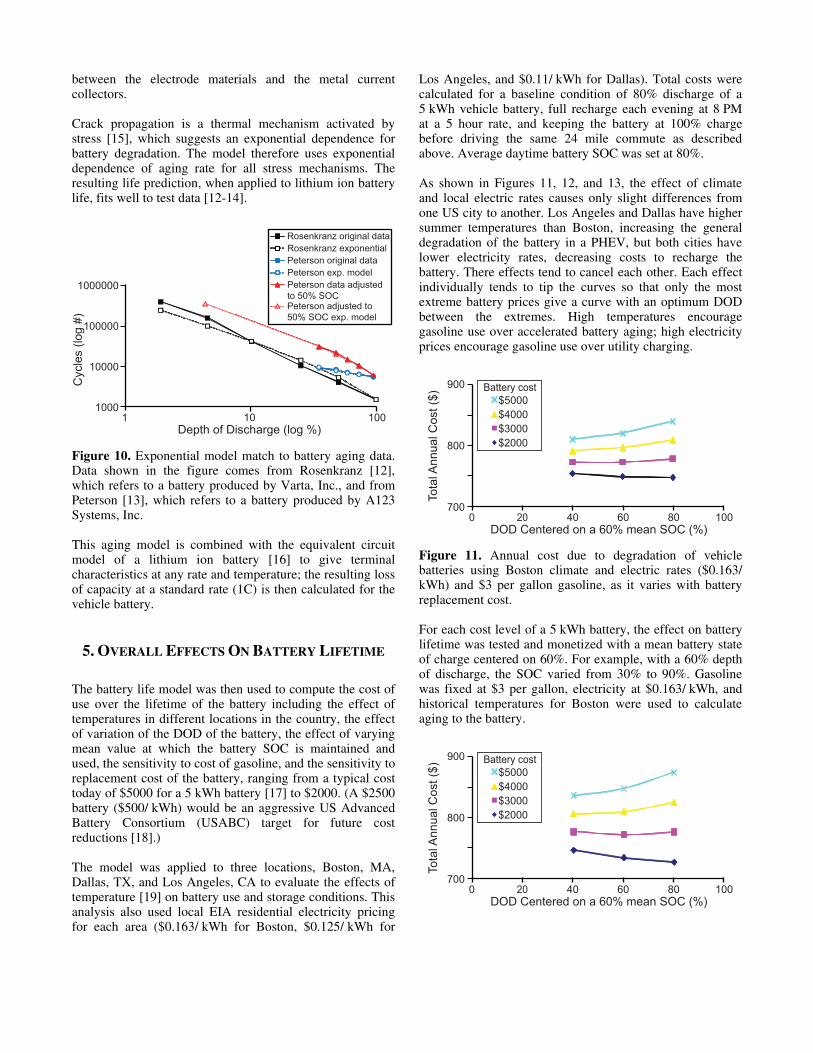
between the electrode materials and the metal current collectors. Crack propagation is a thermal mechanism activated by stress [15], which suggests an exponential dependence for battery degradation. The model therefore uses exponential dependence of aging rate for all stress mechanisms. The resulting life prediction, when applied to lithium ion battery life, fits well to test data [12-14].
1000000
10001 100
10000
10Depth of Discharge (log %)
Cyc
les
(log
#) 100000
Rosenkranz original data
Peterson original dataPeterson exp. model
Rosenkranz exponential
Peterson adjusted to 50% SOC exp. model
Peterson data adjusted to 50% SOC
Figure 10. Exponential model match to battery aging data. Data shown in the figure comes from Rosenkranz [12], which refers to a battery produced by Varta, Inc., and from Peterson [13], which refers to a battery produced by A123 Systems, Inc. This aging model is combined with the equivalent circuit model of a lithium ion battery [16] to give terminal characteristics at any rate and temperature; the resulting loss of capacity at a standard rate (1C) is then calculated for the vehicle battery.
5. OVERALL EFFECTS ON BATTERY LIFETIME
The battery life model was then used to compute the cost of use over the lifetime of the battery including the effect of temperatures in different locations in the country, the effect of variation of the DOD of the battery, the effect of varying mean value at which the battery SOC is maintained and used, the sensitivity to cost of gasoline, and the sensitivity to replacement cost of the battery, ranging from a typical cost today of $5000 for a 5 kWh battery [17] to $2000. (A $2500 battery ($500/ kWh) would be an aggressive US Advanced Battery Consortium (USABC) target for future cost reductions [18].) The model was applied to three locations, Boston, MA, Dallas, TX, and Los Angeles, CA to evaluate the effects of temperature [19] on battery use and storage conditions. This analysis also used local EIA residential electricity pricing for each area ($0.163/ kWh for Boston, $0.125/ kWh for
Los Angeles, and $0.11/ kWh for Dallas). Total costs were calculated for a baseline condition of 80% discharge of a 5 kWh vehicle battery, full recharge each evening at 8 PM at a 5 hour rate, and keeping the battery at 100% charge before driving the same 24 mile commute as described above. Average daytime battery SOC was set at 80%. As shown in Figures 11, 12, and 13, the effect of climate and local electric rates causes only slight differences from one US city to another. Los Angeles and Dallas have higher summer temperatures than Boston, increasing the general degradation of the battery in a PHEV, but both cities have lower electricity rates, decreasing costs to recharge the battery. There effects tend to cancel each other. Each effect individually tends to tip the curves so that only the most extreme battery prices give a curve with an optimum DOD between the extremes. High temperatures encourage gasoline use over accelerated battery aging; high electricity prices encourage gasoline use over utility charging.
900
7000 60 80 100
800
4020DOD Centered on a 60% mean SOC (%)
Tota
l Ann
ual C
ost (
$) $5000
$3000$2000
$4000
Battery cost
Figure 11. Annual cost due to degradation of vehicle batteries using Boston climate and electric rates ($0.163/ kWh) and $3 per gallon gasoline, as it varies with battery replacement cost. For each cost level of a 5 kWh battery, the effect on battery lifetime was tested and monetized with a mean battery state of charge centered on 60%. For example, with a 60% depth of discharge, the SOC varied from 30% to 90%. Gasoline was fixed at $3 per gallon, electricity at $0.163/ kWh, and historical temperatures for Boston were used to calculate aging to the battery.
900
7000 60 80 100
800
4020DOD Centered on a 60% mean SOC (%)
Tota
l Ann
ual C
ost (
$) $5000
$3000$2000
$4000
Battery cost
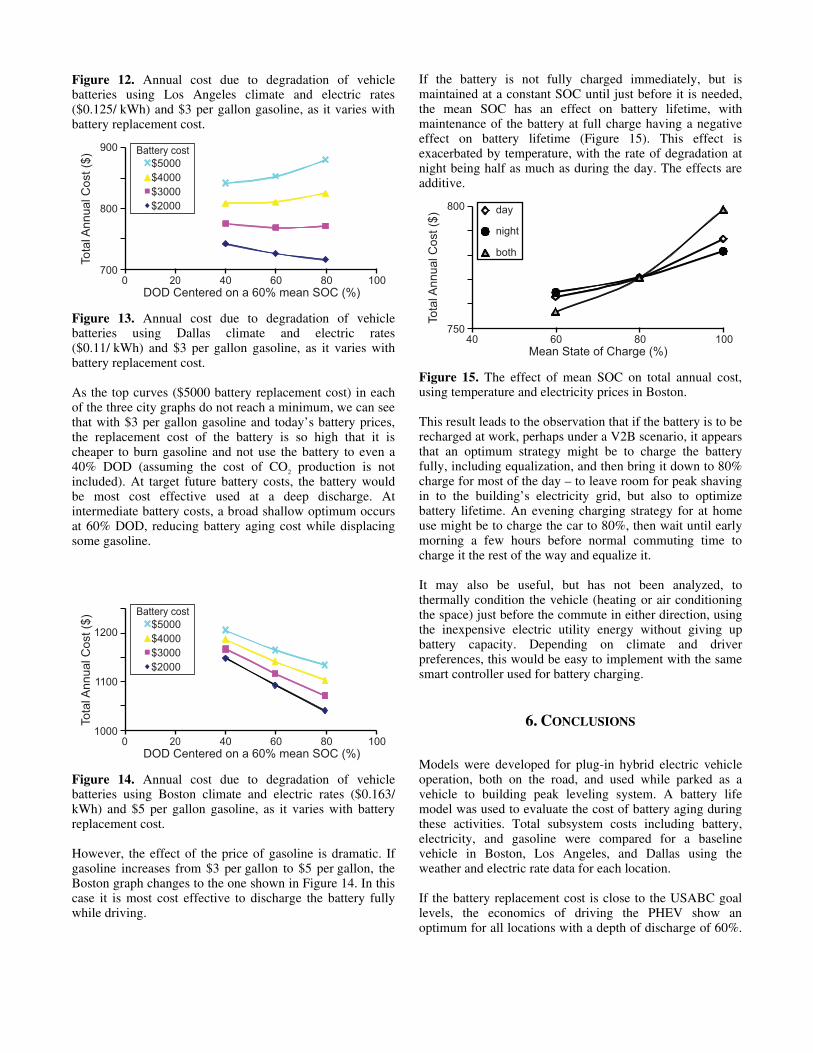
Figure 12. Annual cost due to degradation of vehicle batteries using Los Angeles climate and electric rates ($0.125/ kWh) and $3 per gallon gasoline, as it varies with battery replacement cost.
900
7000 60 80 100
800
4020DOD Centered on a 60% mean SOC (%)
Tota
l Ann
ual C
ost (
$) $5000
$3000$2000
$4000
Battery cost
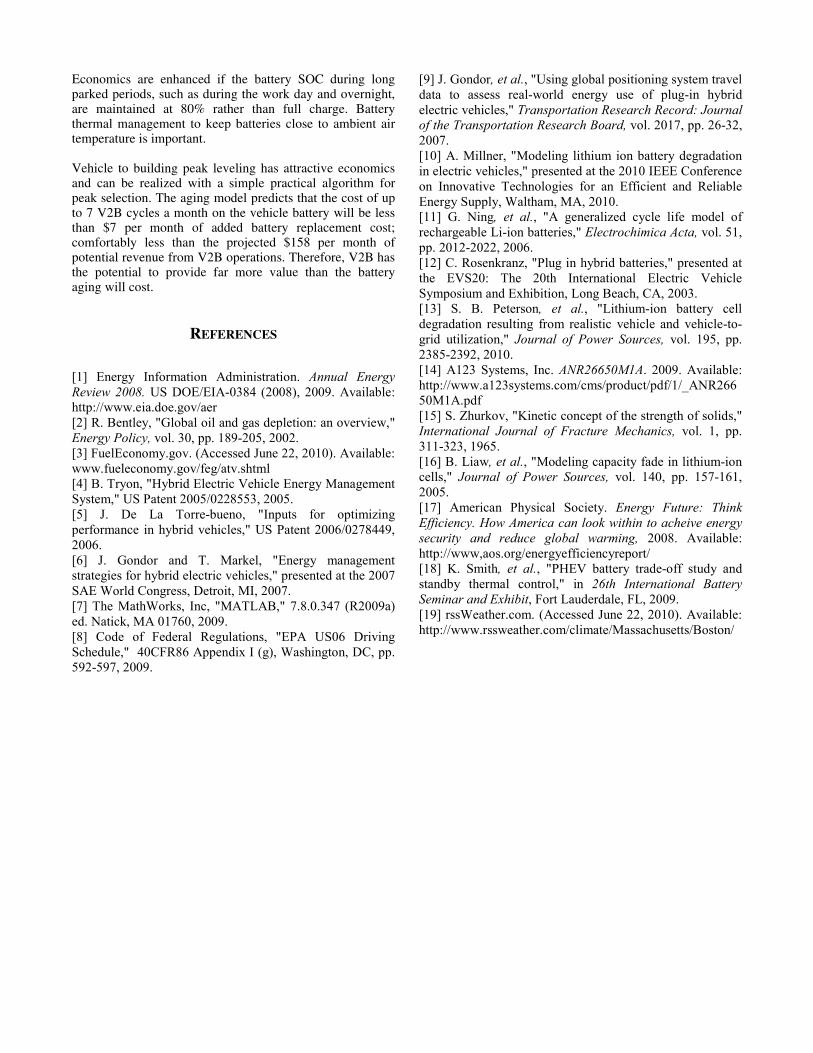
Figure 13. Annual cost due to degradation of vehicle batteries using Dallas climate and electric rates ($0.11/ kWh) and $3 per gallon gasoline, as it varies with battery replacement cost. As the top curves ($5000 battery replacement cost) in each of the three city graphs do not reach a minimum, we can see that with $3 per gallon gasoline and today’s battery prices, the replacement cost of the battery is so high that it is cheaper to burn gasoline and not use the battery to even a 40% DOD (assuming the cost of CO2 production is not included). At target future battery costs, the battery would be most cost effective used at a deep discharge. At intermediate battery costs, a broad shallow optimum occurs at 60% DOD, reducing battery aging cost while displacing some gasoline.
1200
10000 60 80 100
1100
4020DOD Centered on a 60% mean SOC (%)
Tota
l Ann
ual C
ost (
$) $5000
$3000$2000
$4000
Battery cost
Figure 14. Annual cost due to degradation of vehicle batteries using Boston climate and electric rates ($0.163/ kWh) and $5 per gallon gasoline, as it varies with battery replacement cost. However, the effect of the price of gasoline is dramatic. If gasoline increases from $3 per gallon to $5 per gallon, the Boston graph changes to the one shown in Figure 14. In this case it is most cost effective to discharge the battery fully while driving.
If the battery is not fully charged immediately, but is maintained at a constant SOC until just before it is needed, the mean SOC has an effect on battery lifetime, with maintenance of the battery at full charge having a negative effect on battery lifetime (Figure 15). This effect is exacerbated by temperature, with the rate of degradation at night being half as much as during the day. The effects are additive.
800
75040 60 80 100
day
night
both
Mean State of Charge (%)
Tota
l Ann
ual C
ost (
$)
Figure 15. The effect of mean SOC on total annual cost, using temperature and electricity prices in Boston. This result leads to the observation that if the battery is to be recharged at work, perhaps under a V2B scenario, it appears that an optimum strategy might be to charge the battery fully, including equalization, and then bring it down to 80% charge for most of the day – to leave room for peak shaving in to the building’s electricity grid, but also to optimize battery lifetime. An evening charging strategy for at home use might be to charge the car to 80%, then wait until early morning a few hours before normal commuting time to charge it the rest of the way and equalize it. It may also be useful, but has not been analyzed, to thermally condition the vehicle (heating or air conditioning the space) just before the commute in either direction, using the inexpensive electric utility energy without giving up battery capacity. Depending on climate and driver preferences, this would be easy to implement with the same smart controller used for battery charging.
6. CONCLUSIONS
Models were developed for plug-in hybrid electric vehicle operation, both on the road, and used while parked as a vehicle to building peak leveling system. A battery life model was used to evaluate the cost of battery aging during these activities. Total subsystem costs including battery, electricity, and gasoline were compared for a baseline vehicle in Boston, Los Angeles, and Dallas using the weather and electric rate data for each location. If the battery replacement cost is close to the USABC goal levels, the economics of driving the PHEV show an optimum for all locations with a depth of discharge of 60%.
Economics are enhanced if the battery SOC during long parked periods, such as during the work day and overnight, are maintained at 80% rather than full charge. Battery thermal management to keep batteries close to ambient air temperature is important. Vehicle to building peak leveling has attractive economics and can be realized with a simple practical algorithm for peak selection. The aging model predicts that the cost of up to 7 V2B cycles a month on the vehicle battery will be less than $7 per month of added battery replacement cost; comfortably less than the projected $158 per month of potential revenue from V2B operations. Therefore, V2B has the potential to provide far more value than the battery aging will cost.
REFERENCES
[1] Energy Information Administration. Annual Energy Review 2008. US DOE/EIA-0384 (2008), 2009. Available: http://www.eia.doe.gov/aer [2] R. Bentley, "Global oil and gas depletion: an overview," Energy Policy, vol. 30, pp. 189-205, 2002. [3] FuelEconomy.gov. (Accessed June 22, 2010). Available: www.fueleconomy.gov/feg/atv.shtml [4] B. Tryon, "Hybrid Electric Vehicle Energy Management System," US Patent 2005/0228553, 2005. [5] J. De La Torre-bueno, "Inputs for optimizing performance in hybrid vehicles," US Patent 2006/0278449, 2006. [6] J. Gondor and T. Markel, "Energy management strategies for hybrid electric vehicles," presented at the 2007 SAE World Congress, Detroit, MI, 2007. [7] The MathWorks, Inc, "MATLAB," 7.8.0.347 (R2009a) ed. Natick, MA 01760, 2009. [8] Code of Federal Regulations, "EPA US06 Driving Schedule," 40CFR86 Appendix I (g), Washington, DC, pp. 592-597, 2009.
[9] J. Gondor, et al., "Using global positioning system travel data to assess real-world energy use of plug-in hybrid electric vehicles," Transportation Research Record: Journal of the Transportation Research Board, vol. 2017, pp. 26-32, 2007. [10] A. Millner, "Modeling lithium ion battery degradation in electric vehicles," presented at the 2010 IEEE Conference on Innovative Technologies for an Efficient and Reliable Energy Supply, Waltham, MA, 2010. [11] G. Ning, et al., "A generalized cycle life model of rechargeable Li-ion batteries," Electrochimica Acta, vol. 51, pp. 2012-2022, 2006. [12] C. Rosenkranz, "Plug in hybrid batteries," presented at the EVS20: The 20th International Electric Vehicle Symposium and Exhibition, Long Beach, CA, 2003. [13] S. B. Peterson, et al., "Lithium-ion battery cell degradation resulting from realistic vehicle and vehicle-to-grid utilization," Journal of Power Sources, vol. 195, pp. 2385-2392, 2010. [14] A123 Systems, Inc. ANR26650M1A. 2009. Available: http://www.a123systems.com/cms/product/pdf/1/_ANR26650M1A.pdf [15] S. Zhurkov, "Kinetic concept of the strength of solids," International Journal of Fracture Mechanics, vol. 1, pp. 311-323, 1965. [16] B. Liaw, et al., "Modeling capacity fade in lithium-ion cells," Journal of Power Sources, vol. 140, pp. 157-161, 2005. [17] American Physical Society. Energy Future: Think Efficiency. How America can look within to acheive energy security and reduce global warming, 2008. Available: http://www,aos.org/energyefficiencyreport/ [18] K. Smith, et al., "PHEV battery trade-off study and standby thermal control," in 26th International Battery Seminar and Exhibit, Fort Lauderdale, FL, 2009. [19] rssWeather.com. (Accessed June 22, 2010). Available: http://www.rssweather.com/climate/Massachusetts/Boston/