enhance ionic conductivity & stability of la2/3-x 1/3 ... ionic conductivity & stability of...
TRANSCRIPT
Enhance Ionic Conductivity & Stability of
La2/3-x□1/3-2xLi3xTiO3 (LLTO) Solid-Electrolyte
by Grain Boundary Glass Doping
Yue Zhou, Meng Yao, Greg Collins, Xingbo Liu
Department of Mechanical and Aerospace Engineering
West Virginia University
Morgantown, WV 26506 – 6106
Acknowledgement
• Dr. Imre Gyuk
• Dr. Vince Sprenkle / PNNL
• My Team members in WVU – Mr. Yue Zhou,
Mr. Meng Yao, Dr. Greg Collins
• Dr. Bin Liu / Shanghai University
Background
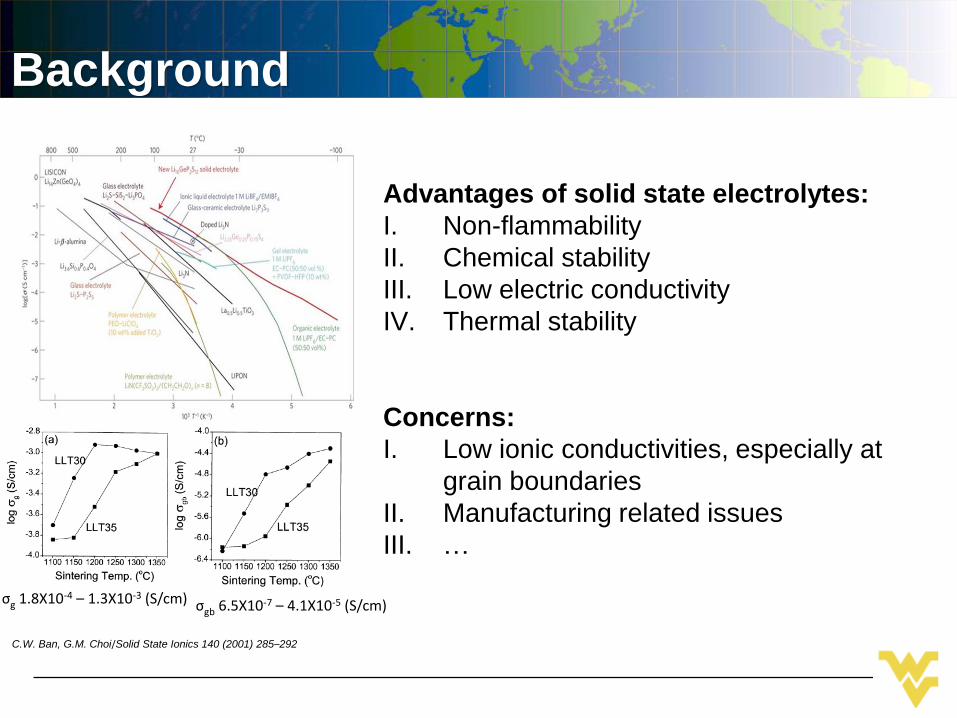
Advantages of solid state electrolytes:
I. Non-flammability
II. Chemical stability
III. Low electric conductivity
IV. Thermal stability
Concerns:
I. Low ionic conductivities, especially at
grain boundaries
II. Manufacturing related issues
III. …
σgb 6.5X10⁻⁷ – 4.1X10⁻⁵ (S/cm)σg 1.8X10⁻⁴ – 1.3X10⁻³ (S/cm)
C.W. Ban, G.M. Choi/Solid State Ionics 140 (2001) 285–292
Overall Scientific Approach
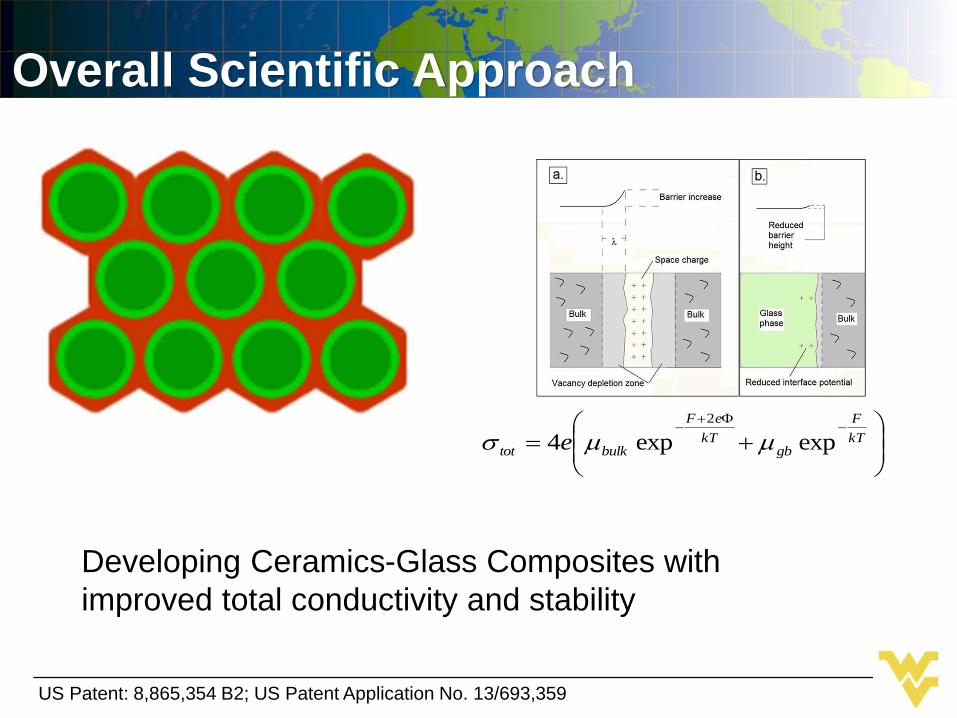
kT
F
gbkT
eF
bulktot e expexp4
2
Developing Ceramics-Glass Composites with
improved total conductivity and stability
US Patent: 8,865,354 B2; US Patent Application No. 13/693,359
5
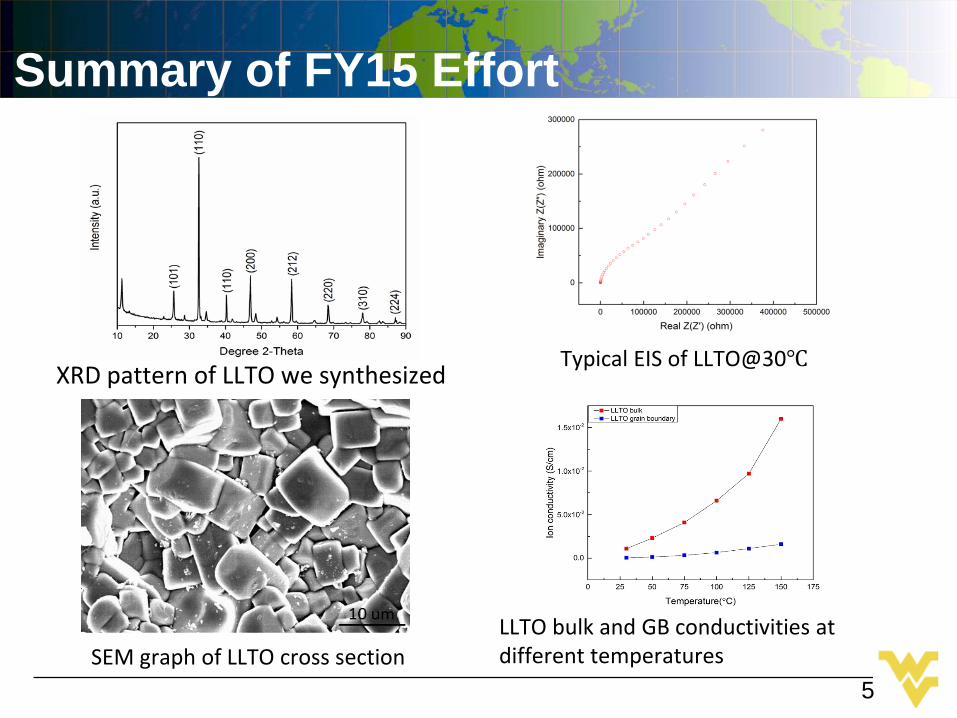
Summary of FY15 Effort
XRD pattern of LLTO we synthesized
LLTO bulk and GB conductivities at different temperaturesSEM graph of LLTO cross section
Typical EIS of LLTO@30℃
6
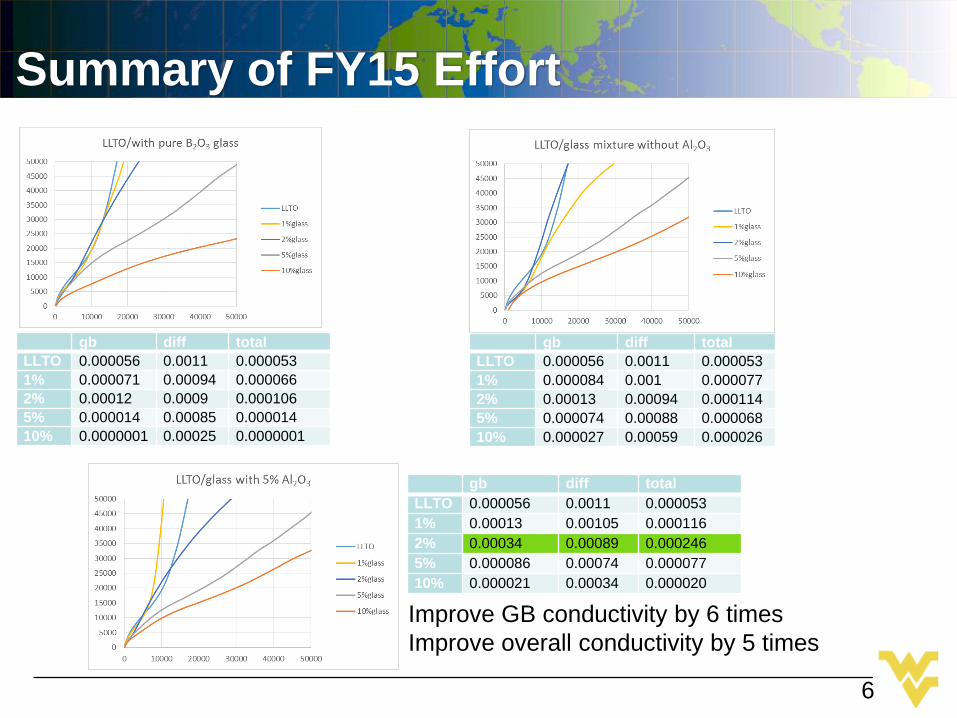
Summary of FY15 Effort
gb diff total
LLTO 0.000056 0.0011 0.000053
1% 0.000071 0.00094 0.000066
2% 0.00012 0.0009 0.000106
5% 0.000014 0.00085 0.000014
10% 0.0000001 0.00025 0.0000001
gb diff total
LLTO 0.000056 0.0011 0.000053
1% 0.000084 0.001 0.000077
2% 0.00013 0.00094 0.000114
5% 0.000074 0.00088 0.000068
10% 0.000027 0.00059 0.000026
gb diff total
LLTO 0.000056 0.0011 0.000053
1% 0.00013 0.00105 0.000116
2% 0.00034 0.00089 0.000246
5% 0.000086 0.00074 0.000077
10% 0.000021 0.00034 0.000020
Improve GB conductivity by 6 times
Improve overall conductivity by 5 times
7
Outline
Fundamental understanding of ionic conduction
in LLTO and LLTO/Glass systems
– Ab initio calculations
– Experimental characterization in LLTO/Al2O3 system
Improving microstructures and conductivities by
optimizing manufacturing process
Full-cell assembly & characterization
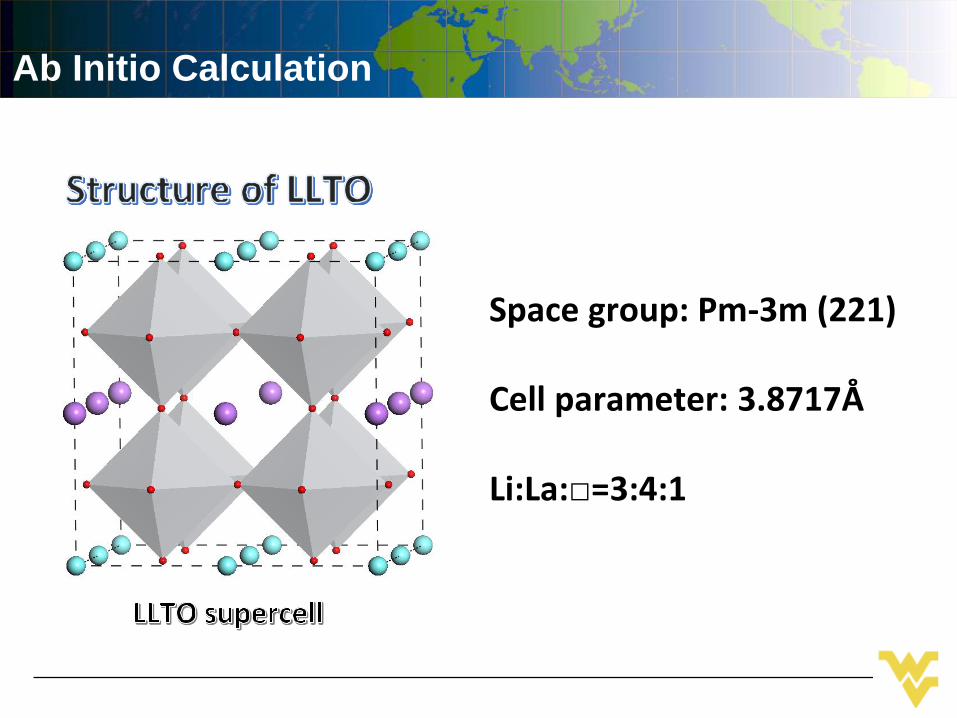
Ab Initio Calculation
Space group: Pm-3m (221)
Cell parameter: 3.8717Å
Li:La:□=3:4:1
9
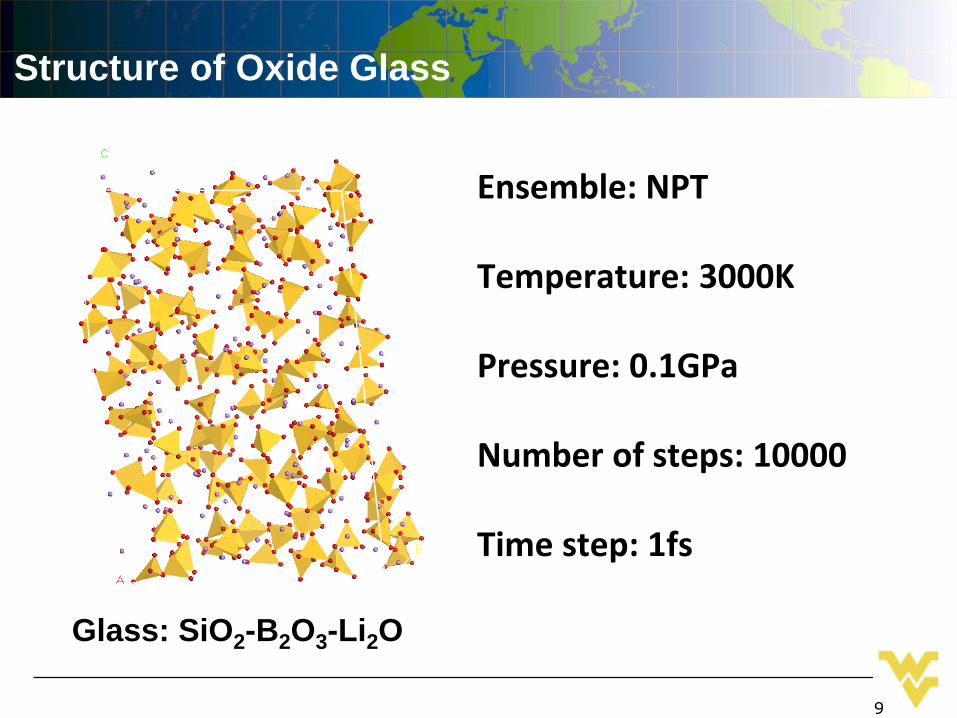
Structure of Oxide Glass
Ensemble: NPT
Temperature: 3000K
Pressure: 0.1GPa
Number of steps: 10000
Time step: 1fs
Glass: SiO2-B2O3-Li2O
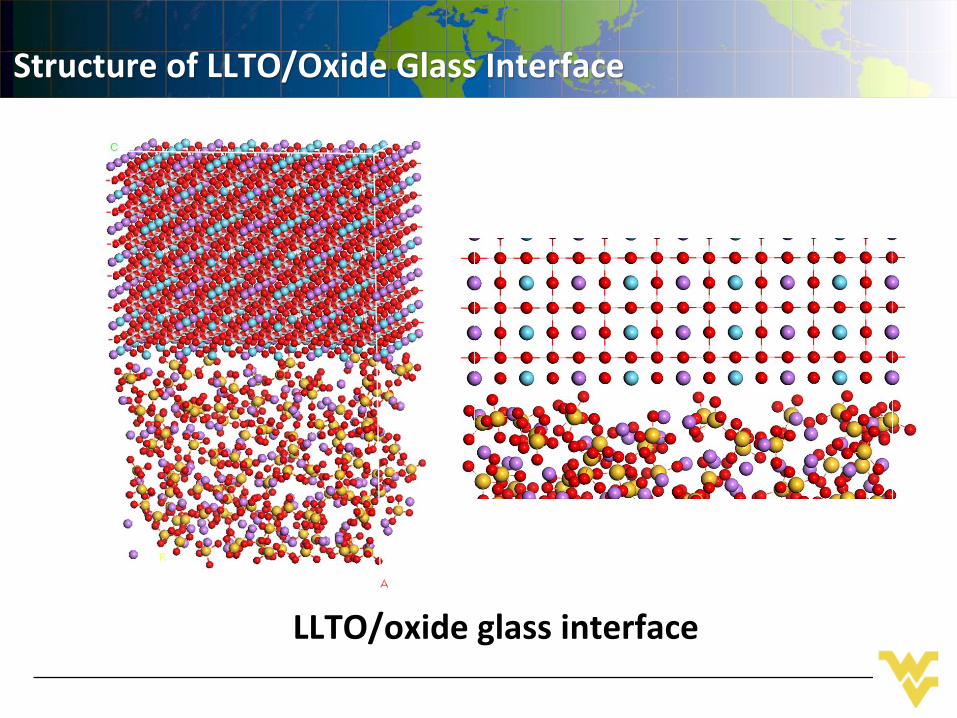
Structure of LLTO/Oxide Glass Interface
LLTO/oxide glass interface
11
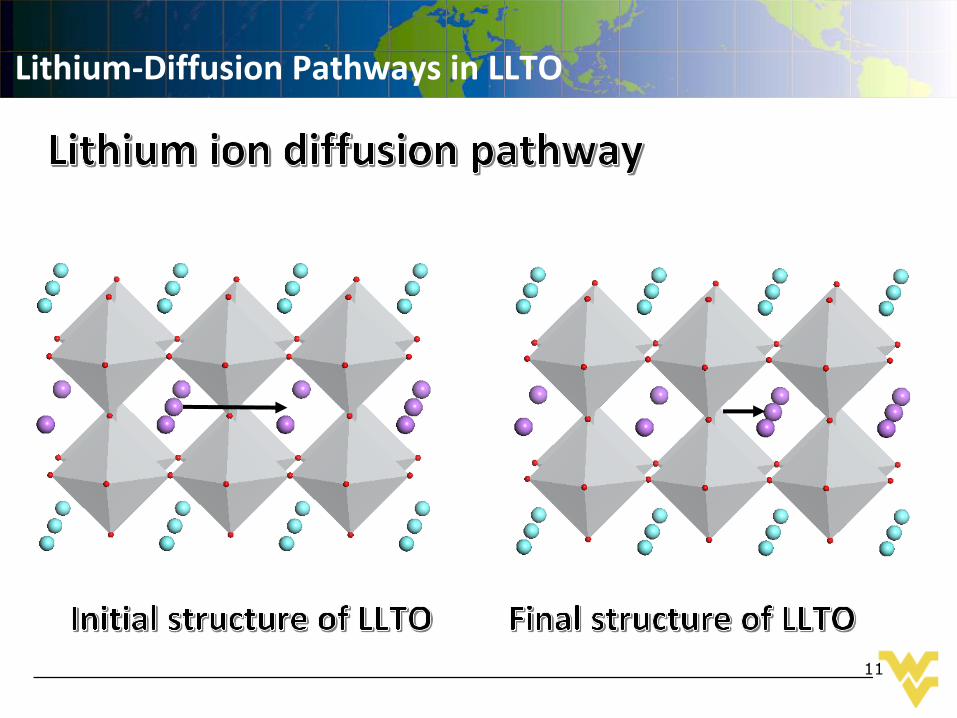
Lithium-Diffusion Pathways in LLTO
12
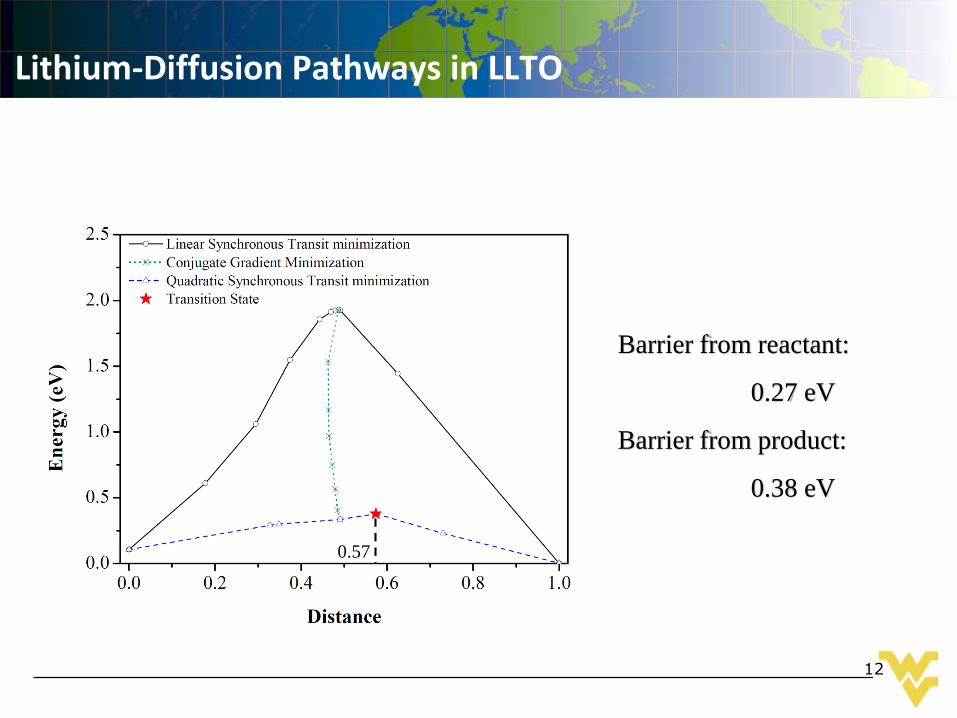
Lithium-Diffusion Pathways in LLTO
Barrier from reactant:
0.27 eV
Barrier from product:
0.38 eV
0.57
13
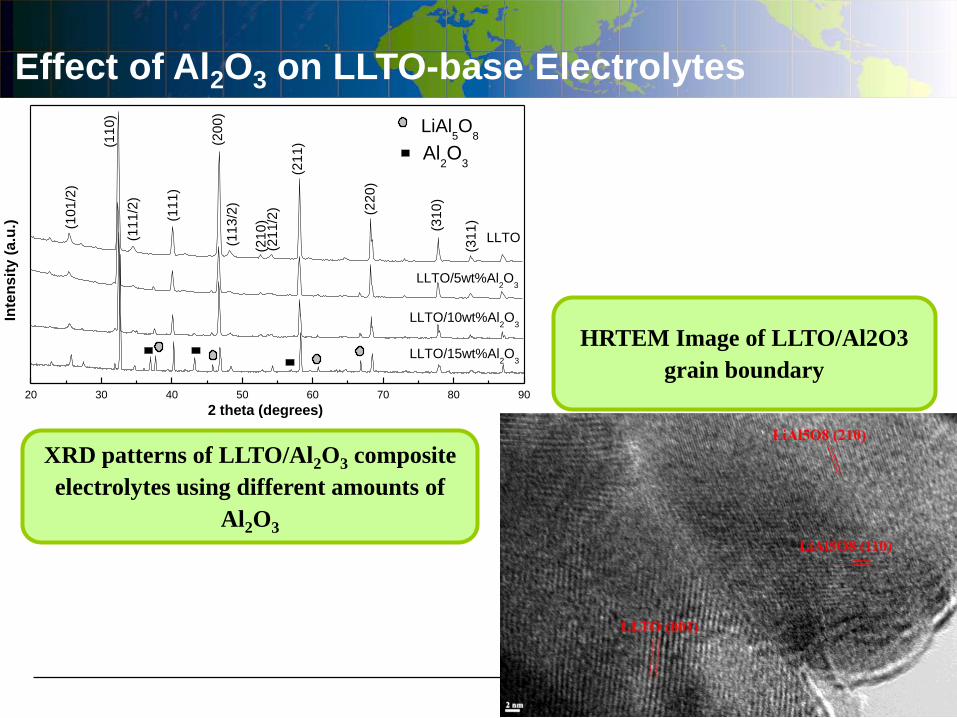
Effect of Al2O3 on LLTO-base Electrolytes
XRD patterns of LLTO/Al2O3 composite
electrolytes using different amounts of
Al2O3
20 30 40 50 60 70 80 90
2 theta (degrees)
LLTO/5wt%Al2O
3
LLTO/10wt%Al2O
3
LLTO
LLTO/15wt%Al2O
3
(10
1/2
)
(11
0)
(11
1/2
)
(11
1)
(20
0)
(11
3/2
)
(21
0)
(21
1/2
)
(21
1)
(22
0)
(31
0)
(31
1)
LiAl5O
8
Inte
ns
ity
(a
.u.)
Al2O
3
HRTEM Image of LLTO/Al2O3
grain boundary
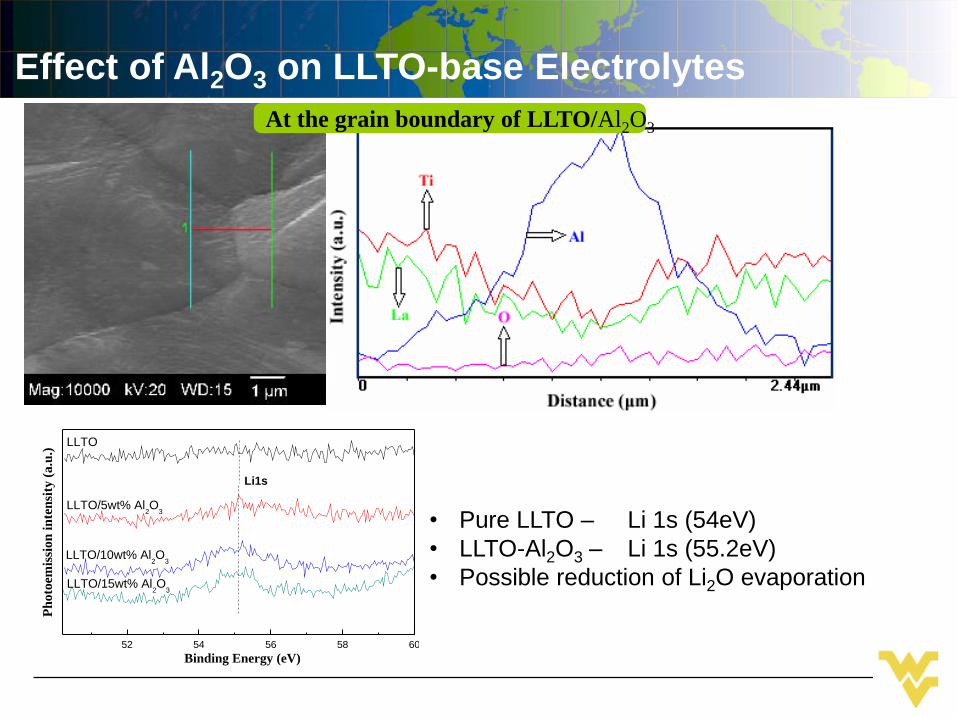
At the grain boundary of LLTO/Al2O3
Effect of Al2O3 on LLTO-base Electrolytes
• Pure LLTO – Li 1s (54eV)
• LLTO-Al2O3 – Li 1s (55.2eV)
• Possible reduction of Li2O evaporation
52 54 56 58 60
LLTO/15wt% Al2O
3
LLTO/10wt% Al2O
3
Ph
oto
emis
sio
n i
nte
nsi
ty (
a.u
.)
Binding Energy (eV)
LLTO
LLTO/5wt% Al2O
3
Li1s
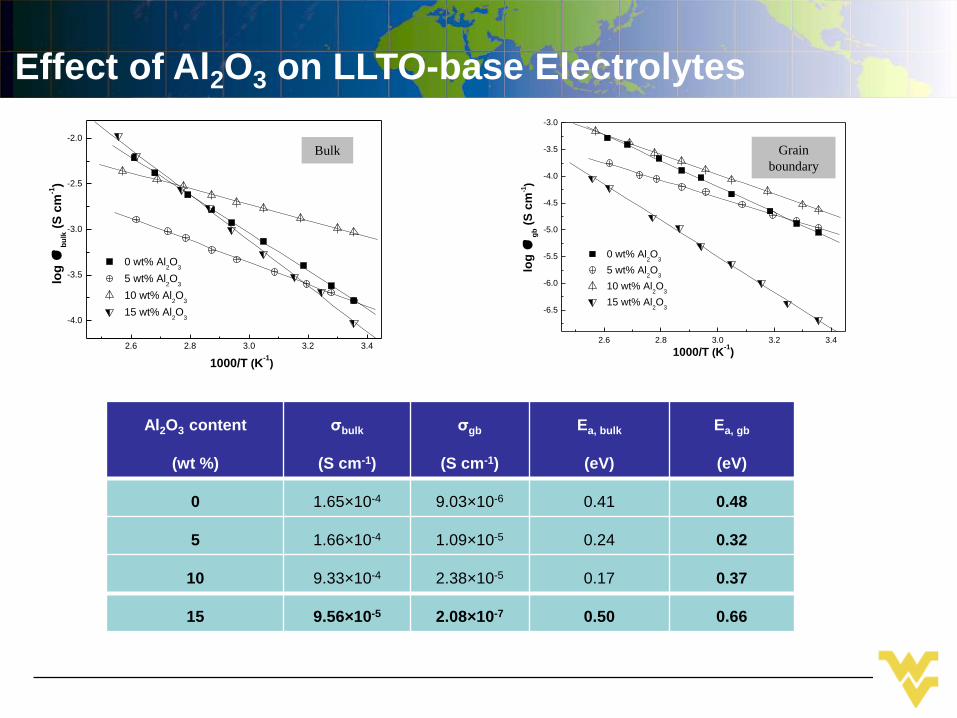
Effect of Al2O3 on LLTO-base Electrolytes
2.6 2.8 3.0 3.2 3.4
-4.0
-3.5
-3.0
-2.5
-2.0
1000/T (K-1
)
log
σb
ulk (
S c
m-1)
0 wt% Al2O
3
5 wt% Al2O
3
10 wt% Al2O
3
15 wt% Al2O
3
2.6 2.8 3.0 3.2 3.4
-6.5
-6.0
-5.5
-5.0
-4.5
-4.0
-3.5
-3.0
0 wt% Al2O
3
5 wt% Al2O
3
10 wt% Al2O
3
15 wt% Al2O
3
log
σg
b (
S c
m-1)
1000/T (K-1)
Bulk Grain
boundary
Al2O3 content
(wt %)
σbulk
(S cm-1)
σgb
(S cm-1)
Ea, bulk
(eV)
Ea, gb
(eV)
0 1.65×10⁻⁴ 9.03×10⁻⁶ 0.41 0.48
5 1.66×10⁻⁴ 1.09×10⁻⁵ 0.24 0.32
10 9.33×10⁻⁴ 2.38×10⁻⁵ 0.17 0.37
15 9.56×10⁻⁵ 2.08×10⁻⁷ 0.50 0.66
16
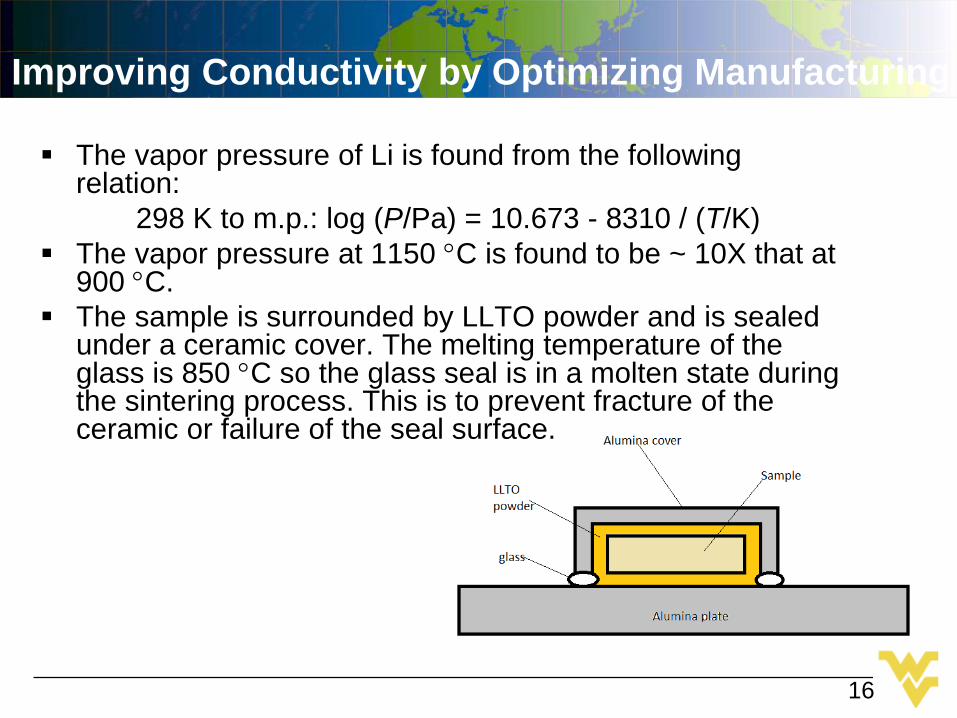
Improving Conductivity by Optimizing Manufacturing
The vapor pressure of Li is found from the following relation:
298 K to m.p.: log (P/Pa) = 10.673 - 8310 / (T/K)
The vapor pressure at 1150 C is found to be ~ 10X that at 900 C.
The sample is surrounded by LLTO powder and is sealed under a ceramic cover. The melting temperature of the glass is 850 C so the glass seal is in a molten state during the sintering process. This is to prevent fracture of the ceramic or failure of the seal surface.
17
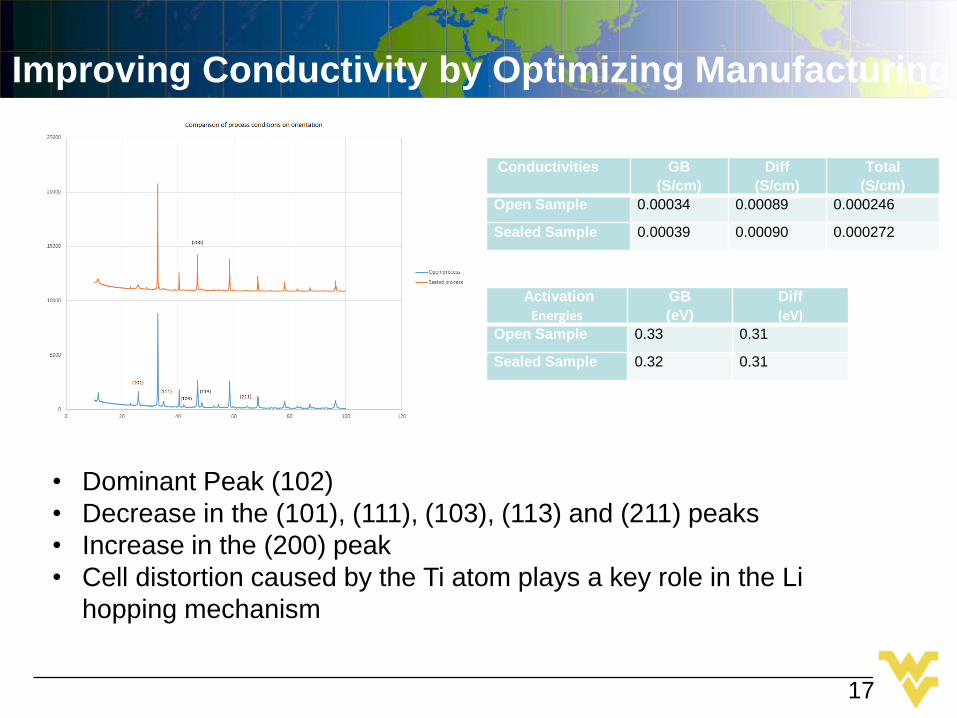
Improving Conductivity by Optimizing Manufacturing
Conductivities GB
(S/cm)
Diff
(S/cm)
Total
(S/cm)
Open Sample 0.00034 0.00089 0.000246
Sealed Sample 0.00039 0.00090 0.000272
Activation
Energies
GB
(eV)
Diff
(eV)
Open Sample 0.33 0.31
Sealed Sample 0.32 0.31
• Dominant Peak (102)
• Decrease in the (101), (111), (103), (113) and (211) peaks
• Increase in the (200) peak
• Cell distortion caused by the Ti atom plays a key role in the Li
hopping mechanism
18
Future Work
• Fundamental Understanding of Li-diffusion in the
LLTO and Composite Electrolyte
• Investigation of the Li Conduction at
Electrolyte/Electrodes Interface
• Explore Other Solid-Electrolytes
• Develop Realistic Battery Manufacturing &
Assembling Processes

19