engaging indian it employees ? a compensation & benefits...
TRANSCRIPT
Engaging Indian IT Employees � A Compensation &Benefits Case Study of a Finnish Multinational ITCompany
Organization and Management
Master's thesis
Mikael Ahlfors
2011
Department of Management and International BusinessAalto UniversitySchool of Economics
AALTO UNIVERSITY SCHOOL OF ECONOMICS ABSTRACT Organization and Management June 28, 2011 Master‘s Thesis Mikael Ahlfors
ENGAGING INDIAN IT EMPLOYEES – A COMPENSATION & BENEFITS CASE STUDY OF A FINNISH
MULTINATIONAL IT COMPANY
Research Objectives
The main objectives for this empirical study were to enquire about the type of commitment
employees in India generate with the case company, how they perceive their compensation
system, and to find a possible connection between total rewarding and employee engagement.
Methodology
The type of research conducted for the empirical part of this thesis is of quantitative nature. The
data generated through questionnaire were statistically analyzed. The questionnaire was sent out
to over 1,300 Indian IT employees located in Pune. These employees belonged to professional or
managerial career paths in the case company. The data gathered was analyzed against literature
from previous research reviewed for this study.
Findings
The main findings of this study were to that even though Indian IT employees change their
employers easily, monetary compensation was not the primary factor in their work lives. They
valued intrinsic motivational factors above extrinsic and those factors were often tightly
connected with the work itself. The employer should not try to engage professional and
managerial employees through salaries, rather their work tasks should be made interesting and
challenging. Through interesting jobs employees are more engaged and motivated toward the job
they do and committed to the employer who provides that job.
Keywords
Engagement, compensation, benefits, motivation, IT, retention
AALTO YLIOPISTON KAUPPAKORKEAKOULU TIIVISTELMÄ Organisaatiot ja johtaminen 28.6.2011 Pro gradu -tutkielma Mikael Ahlfors
INTIALAISTEN IT TYÖNTEKIJÖIDEN SITOUTTAMINEN – PALKKAUS- JA PALKITSEMISTUTKIMUS
SUOMALAISESTA MONIKANSALLISESTA IT YRITYKSESTÄ
Tutkimuksen tavoitteet
Tämän empiirisen tutkimuksen tärkeimmät tavoitteet oli löytää millaisen sitoutumisen Intialaiset
IT työntekijät tekevät kohdeyritykseen, miten he kokevat palkkausjärjestelmän toimivuuden ja
onko mahdollisuutta löytää yhteys kokonaispalkitsemisen ja työntekijän sitouttamisen välille.
Metodologia
Tehty empiirinen tutkimus oli laadultaan määrällinen. Tutkimukseen saatu tieto kerättiin
kyselytutkimuksella joka myöhemmin tilastollisesti analysoitiin. Kysely lähetettiin kohdeyrityksessä
yli 1 300 Intialaiselle IT työntekijälle Punen kaupungissa. Nämä työntekijät kuuluivat asiantuntija ja
esimies urapolkusiin henkilöihin. Tutkimuksessa saatu tieto analysoitiin hyväksikäyttäen
aikaisempia tutkimuksia.
Tutkimuksen tulokset
Tutkimuksen päälöydökset nostivat esille sen, että vaikka Intialaiset IT työntekijät vaihtavat
helposti työpaikkaansa paremman palkan perässä, se ei ole tärkein muuttuja heidän
työelämässään. He arvostavat sisäisiä motivaatiollisia tekijöitä ulkoisten eli palkan edellä. Nämä
sisäiset tekijät ovat yleensä hyvin pitkälti sidoksissa työhön jota tehdään. Työntekijöitä ei pidä
lähteä yrittämään sitouttaa rahallisin keinoin, sillä se vain tuo hetkellistä motivaatiota vaan heidän
työstä pitää tehdä haastavaa ja mielenkiintoista. Tätä kautta heitä pystytään paremmin
sitouttamaan ja motivoimaan tekemäänsä työhön.
Avainsanat
Sitouttaminen, palkkaus, palkitseminen, motivaatio, IT
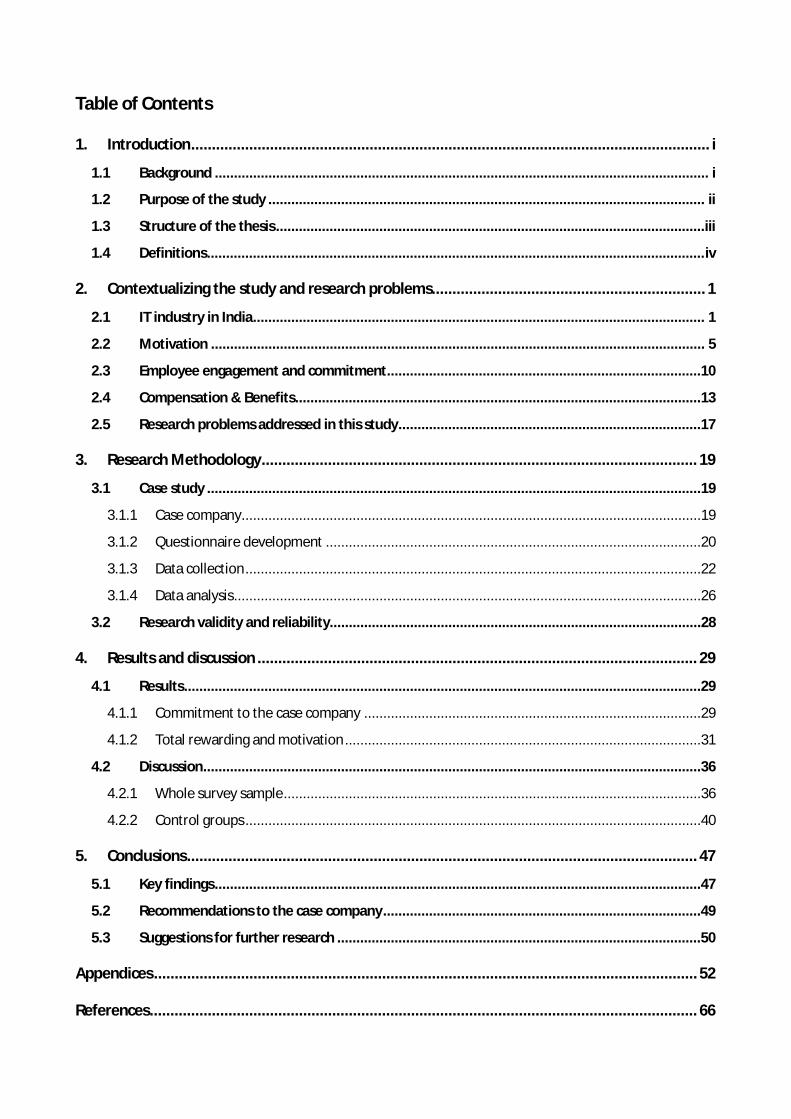
Table of Contents
1. Introduction ............................................................................................................................. i
1.1 Background ................................................................................................................................. i
1.2 Purpose of the study .................................................................................................................. ii
1.3 Structure of the thesis ................................................................................................................iii
1.4 Definitions .................................................................................................................................. iv
2. Contextualizing the study and research problems .................................................................. 1
2.1 IT industry in India ...................................................................................................................... 1
2.2 Motivation ................................................................................................................................. 5
2.3 Employee engagement and commitment ..................................................................................10
2.4 Compensation & Benefits ..........................................................................................................13
2.5 Research problems addressed in this study ...............................................................................17
3. Research Methodology ......................................................................................................... 19
3.1 Case study .................................................................................................................................19
3.1.1 Case company ........................................................................................................................19
3.1.2 Questionnaire development ..................................................................................................20
3.1.3 Data collection .......................................................................................................................22
3.1.4 Data analysis ..........................................................................................................................26
3.2 Research validity and reliability.................................................................................................28
4. Results and discussion .......................................................................................................... 29
4.1 Results .......................................................................................................................................29
4.1.1 Commitment to the case company ........................................................................................29
4.1.2 Total rewarding and motivation .............................................................................................31
4.2 Discussion ..................................................................................................................................36
4.2.1 Whole survey sample .............................................................................................................36
4.2.2 Control groups .......................................................................................................................40
5. Conclusions ........................................................................................................................... 47
5.1 Key findings ...............................................................................................................................47
5.2 Recommendations to the case company ...................................................................................49
5.3 Suggestions for further research ...............................................................................................50
Appendices ................................................................................................................................... 52
References .................................................................................................................................... 66
Appendices
Appendix A. Survey questions and results ………………………………………………………………………………….. 52
Appendix B. Email invitation to participate survey ……………………………………………………………………… 61
Appendix C. Reminder invitation to participate survey ………………………………………………………………. 62
Appendix D. ……………………………………………………………………………………………………………………………….. 63
Appendix E. ………………………………………………………………………………………………………………………………… 64
List of Figures
Figure 1: Maslow's Hierarchy of Needs (1954)................................................................................. 5
Figure 2: Two Factor Theory (Herzberg, 1987) ................................................................................. 8
Figure 3: Framework of concepts and relationships (Van Herpen, Van Praag & Cools, 2005) ........... 9
Figure 4 Total Rewards Model (WorldatWork, 2006)..................................................................... 14
List of Tables
Table 1 – Sample descriptives ....................................................................................................... 27
Table 2 – Commitment sample ...................................................................................................... 29
Table 3 – Commitment – Descriptive statistics for control variables .............................................. 30
Table 4 – Compensation system and motivation ........................................................................... 32
Table 5 - Overall satisfaction of an employee ................................................................................ 33
Table 6 - Case company Total Rewarding structure ....................................................................... 34
Table 7 – Total Rewarding in “case company” – Descriptive data .................................................. 35
Table 8 - Affective commitment - Question data ........................................................................... 54
Table 9 - Continuance commitment - Question data ..................................................................... 55
Table 10 - Normative commitment - Question data ...................................................................... 56
Table 11 - Compensation system and motivation - Question data ................................................. 57
Table 12 - Overall satisfaction - Grade data ................................................................................... 58
Table 13 - Total rewarding in "case company" - Question data ...................................................... 59
Table 14 - Value working for "case company" - Question data ...................................................... 60
Table 15 - Compensation system and motivation - Descriptive data .............................................. 63
Table 16 - Five most important factors that an employee value working for “case company” ....... 64
i
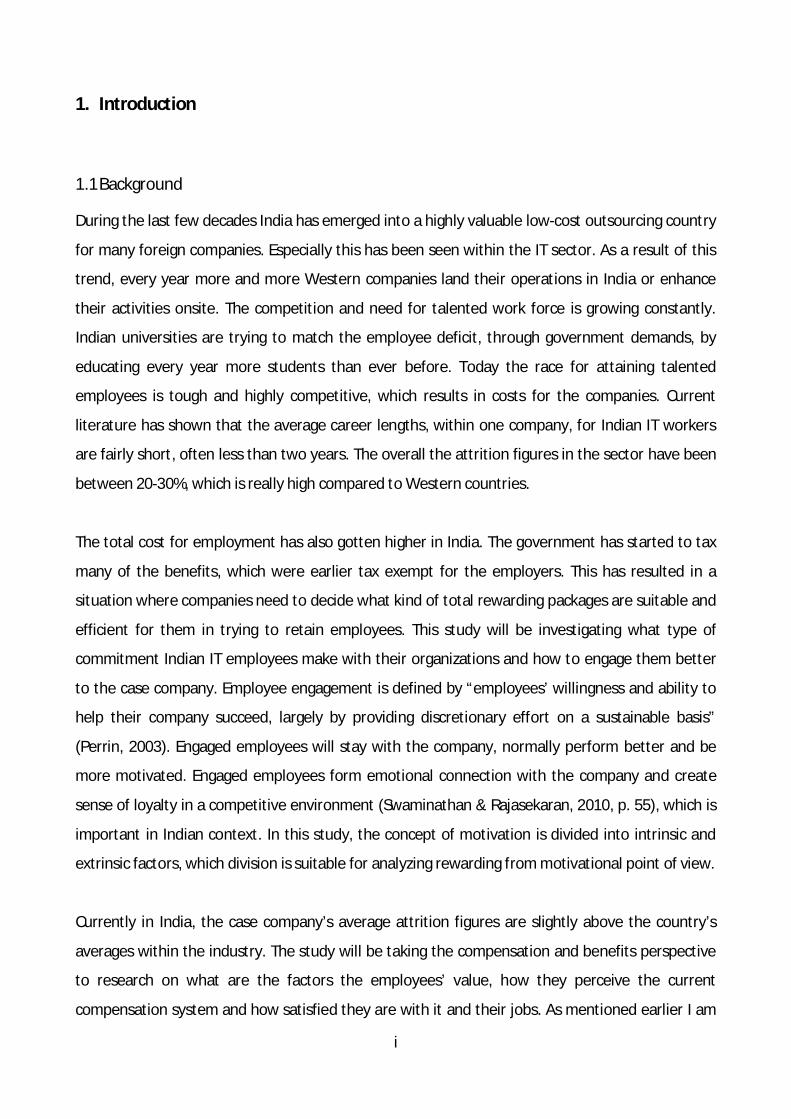
1. Introduction
1.1 Background
During the last few decades India has emerged into a highly valuable low-cost outsourcing country
for many foreign companies. Especially this has been seen within the IT sector. As a result of this
trend, every year more and more Western companies land their operations in India or enhance
their activities onsite. The competition and need for talented work force is growing constantly.
Indian universities are trying to match the employee deficit, through government demands, by
educating every year more students than ever before. Today the race for attaining talented
employees is tough and highly competitive, which results in costs for the companies. Current
literature has shown that the average career lengths, within one company, for Indian IT workers
are fairly short, often less than two years. The overall the attrition figures in the sector have been
between 20-30%, which is really high compared to Western countries.
The total cost for employment has also gotten higher in India. The government has started to tax
many of the benefits, which were earlier tax exempt for the employers. This has resulted in a
situation where companies need to decide what kind of total rewarding packages are suitable and
efficient for them in trying to retain employees. This study will be investigating what type of
commitment Indian IT employees make with their organizations and how to engage them better
to the case company. Employee engagement is defined by “employees’ willingness and ability to
help their company succeed, largely by providing discretionary effort on a sustainable basis”
(Perrin, 2003). Engaged employees will stay with the company, normally perform better and be
more motivated. Engaged employees form emotional connection with the company and create
sense of loyalty in a competitive environment (Swaminathan & Rajasekaran, 2010, p. 55), which is
important in Indian context. In this study, the concept of motivation is divided into intrinsic and
extrinsic factors, which division is suitable for analyzing rewarding from motivational point of view.
Currently in India, the case company’s average attrition figures are slightly above the country’s
averages within the industry. The study will be taking the compensation and benefits perspective
to research on what are the factors the employees’ value, how they perceive the current
compensation system and how satisfied they are with it and their jobs. As mentioned earlier I am
ii
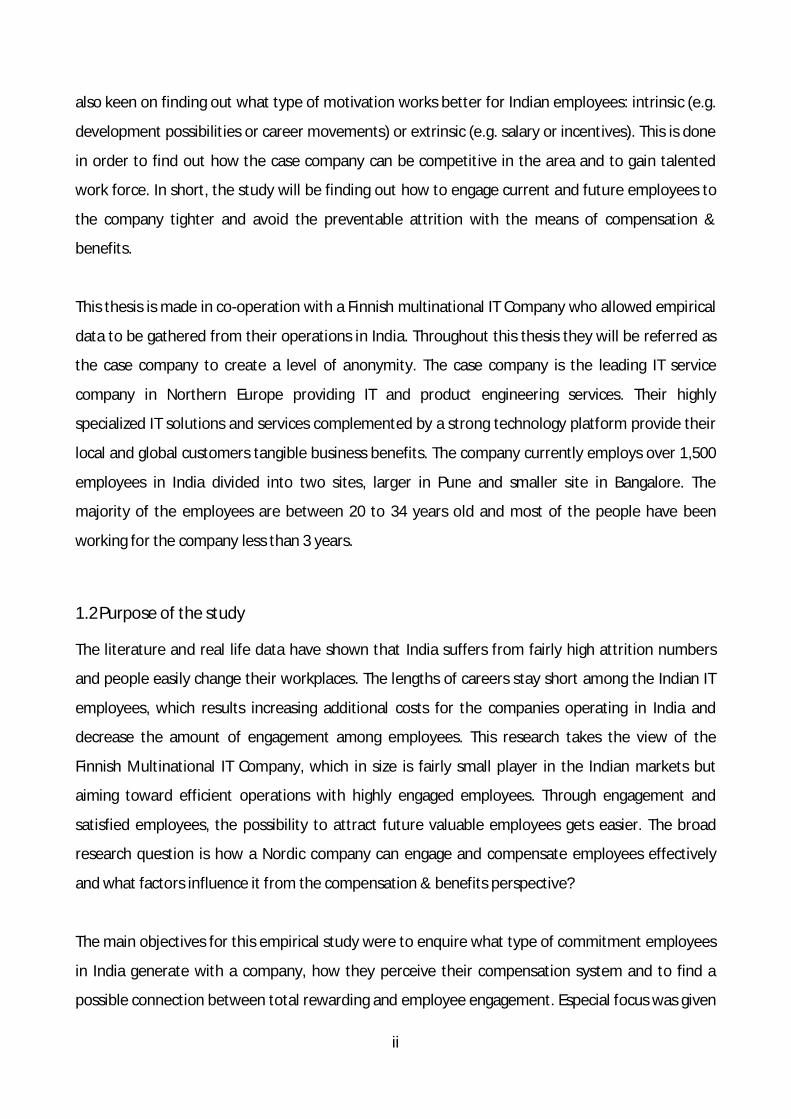
also keen on finding out what type of motivation works better for Indian employees: intrinsic (e.g.
development possibilities or career movements) or extrinsic (e.g. salary or incentives). This is done
in order to find out how the case company can be competitive in the area and to gain talented
work force. In short, the study will be finding out how to engage current and future employees to
the company tighter and avoid the preventable attrition with the means of compensation &
benefits.
This thesis is made in co-operation with a Finnish multinational IT Company who allowed empirical
data to be gathered from their operations in India. Throughout this thesis they will be referred as
the case company to create a level of anonymity. The case company is the leading IT service
company in Northern Europe providing IT and product engineering services. Their highly
specialized IT solutions and services complemented by a strong technology platform provide their
local and global customers tangible business benefits. The company currently employs over 1,500
employees in India divided into two sites, larger in Pune and smaller site in Bangalore. The
majority of the employees are between 20 to 34 years old and most of the people have been
working for the company less than 3 years.
1.2 Purpose of the study
The literature and real life data have shown that India suffers from fairly high attrition numbers
and people easily change their workplaces. The lengths of careers stay short among the Indian IT
employees, which results increasing additional costs for the companies operating in India and
decrease the amount of engagement among employees. This research takes the view of the
Finnish Multinational IT Company, which in size is fairly small player in the Indian markets but
aiming toward efficient operations with highly engaged employees. Through engagement and
satisfied employees, the possibility to attract future valuable employees gets easier. The broad
research question is how a Nordic company can engage and compensate employees effectively
and what factors influence it from the compensation & benefits perspective?
The main objectives for this empirical study were to enquire what type of commitment employees
in India generate with a company, how they perceive their compensation system and to find a
possible connection between total rewarding and employee engagement. Especial focus was given
iii
to the type of employee’s motivation. In modern world the real value of the company is shifted
from tangible to intellectual assets making employees valuable resource for a company. Highly
engaged employees make a considerable contribution to the organization and at the same time
disengaged employees can be a serious liability (Swaminathan & Rajasekaran, 2010).
The case study was quantitative in nature, meaning that the results were statistically analyzed
from the research data gained through questionnaire executed locally in Pune, India. From this
research data, analysis and conclusions were made linking findings to literature. From analysis
recommendations were made to the case company on what type of issues to take into account
while rewarding employees in India. This research has two complementary significant values to
the case company. Firstly, through this research I can gather up information on the type of
commitment that Indian IT professionals generate with the case company and what attitudes they
have concerning total rewarding (e.g. how they perceive the salary and incentives given and what
motivate them). By understanding what motivates the employees in India I can draw notions on
where the case company should pay special attention in total rewarding.
The main research question in this thesis is the following:
How to engage Indian IT professionals in the case company?
The secondary question is:
How should Indian IT professionals be rewarded to ensure engagement and motivation?
1.3 Structure of the thesis
In the following chapter, the literature of previous researches will be contextualized. Topics
presented to provide context around research questions and objectives are IT industry in India,
motivation, employee engagement and commitment and compensation & benefits. The
framework built around this chapter through the light of earlier research will be later used in the
discussion section to provide validity and comparison for the analysis made.
The third chapter is dedicated to the research methodology used in this study. This chapter will lay
out the reasons for choosing single quantitative case study methodology. Also the roadmap on
how questionnaire were developed and data collected will be discussed. This chapter will also be
iv
covering the basis on how data will be analyzed in the following chapters. The study’s validity and
reliability will be also discussed in this chapter allowing me to be self-critical toward the study and
the results gained from it.
The empirical results and discussion will be introduced in the fourth chapter. First the result data is
laid out for the reader’s review and later analyzed in the light of current literature. The results
section is divided into two sub chapters: Commitment first, and then total rewarding and
motivation as the second group, since the two factors tightly connect to one another. In the
analysis section the analyses will be first discussed as the whole sample to make a holistic view of
the Indian employees in the organization. Then the sample will be divided into control groups such
as gender or tenure length allowing internal comparison.
The final chapter presents the conclusions of the research based on the analysis made in the light
of previous literature. Recommendations to the case company will be provided on the most
important observations. This chapter also provides suggestions for further research in case
someone is looking for ideas to research India, engagement or motivation.
1.4 Definitions
For the purposes of clarity from the outset, the following definitions are used in this study.
Engagement
“Employees’ willingness and ability to help their company succeed, largely by providing
discretionary effort on a sustainable basis.”1
Retention
“An organizations ability to keep employees who are valued contributors to organizational success
for as long as is mutually beneficial. Desired talent can be kept on-staff by using a dynamic blend of
elements from the total rewards package as employees move through their career lifecycles.
1 Perrin, Global Workforce Study, 2003
v
However, not all retention is desirable, which is why a formal retention strategy with appropriate
steps is essential” 2
Compensation
“Pay provided by an employer to an employee for services rendered (i.e. time, effort, skill). Includes
both fixed and variable pay tied to levels of performance.”3
Benefits
“Programs an employer uses to supplement the cash compensation that employees receive. These
health, income protection, savings and retirement programs provide security for employees and
their families.” 4
Motivation
“The ability to cause employees to behave in a way that achieves the highest performance levels.”
Motivation is comprised of two types: Intrinsic motivation, which is linked to employee’s sense of
achievement, respect for the whole person, trust, or appropriate advancement opportunities and
extrinsic motivation most frequently associated with tangible rewards such as pay. 5
2 WorldAtWork, 2006 3 WorldAtWork, 2006 4 WorldAtWork, 2006 5 WorldAtWork, 2006
1
2. Contextualizing the study and research problems
In this chapter I review the literature relevant to my study. I consider what other authors have
already published about employee engagement and commitment, motivation, compensation and
benefits and the IT industry in India. These provide the context and justification for the research
problems addressed in my case study.
2.1 IT industry in India
Globalization arises from the fact that products, services, techniques’, funding and knowledge
moves around the world (Riski, 2005, p. 34). From the company’s perspective it is important to
choose where it is beneficial to produce products and services. The fact is that company’s main
markets often may be outside its home country, driving the production to be in place closer to
main markets (Riski, 2005, p. 34). Western companies search for cheaper places to produce their
products and India has been on the top of that list for decades.
The Indian IT industry is a key player around the world when it comes to global outsourcing. The
pool of large, English speaking, technically qualified manpower, competitive billing, high
productivity gains and scalability has helped India to emerge as a key destination to outsource IT
services (NASSCOM). The IT sector can be characterized as the key factor in taking India forward
and is a major driver for the economy. The total number of IT and IT enabled service professionals
in India has been growing steadily from 56,000 in 1990 to over 1 million in 2005 and is still in
constant growth. Most new recruits in the industry are fresh graduates directly from universities
(NASSCOM).
India has 1.19 billion inhabitants with a population growth rate of 1.344% (Central Intelligence
Agency, 2011). Vast part of Indian population is between 15-64 years of age. An estimate of 478
million people are participating work life with 10.8% unemployment rate. Out of the whole work
force, 60% are in the unorganized agricultural sector (Corporate Executive Board, n.d.). Religions
play a part in Indian’s everyday life. 80% of Indian inhabitants share Hinduism as their religion.
Second biggest religion in India is Islam (13%) (Central Intelligence Agency, 2011).
2
As the supply of labor is one of India’s greatest advantages it is also a huge challenge (Corporate
Executive Board). India has a low median age, rapid population growth and a geographic
concentration of one sixth of the world’s population. The figures from the year 2008 show that
India had a pool of 22 million college graduates. Every year nearly 2.5 million college graduates
enter the labor market. The race for talented and motivated work force among companies is fierce
and recently this has also been a driver for higher wages and better incentives.
Among all the players in India there is easy equation to find out “employers of choice” argues
Hewitt Associates (2005, p. 10). Organizations are run by leaders and managers with their people
in mind and the managers believe people to be vital to the organization’s success. The Best
employers are also strong and effective in making business decisions and they approach
challenges contrasting them with the work force they have. These companies have employees
who contribute and feel strongly engaged to their organization through their work. The employees
understand the direction their company’s business is going and also behave in a way that suits the
organization’s business goals.
The Indian work culture at the organizations are often more structured and hierarchical than in a
Western organizations due to the long-standing tradition of the caste system (Corporate Executive
Board). Seniority is highly valued and desirable not only for the job title but for the level of
decision-making and authority. Most often the final decision making authority rests with the most
senior member of the group. It has been a trend for global organizations to create smaller grade
steps within their global job grading structure to allow flexibility for job titling in India. This
accommodates the social desire to recognize ones seniority. (Corporate Executive Board)
Traditionally India has been seen as a culture that emphasizes personal relationships (Singh, 2000).
Therefore it would be too easy to just assume that in India there is value placed on commitment
to the organization one is part of (Kwantes, 2009). Sinha (2000, p. 36) states that recent changes in
India and to its labor market haves resulted in a situation where both “the employee’s obligation
to remain loyal to the organization and the employer’s responsibility to guarantee them lifetime
employment are viewed as outdated values.” As more and more foreign corporations move their
operations to India, the better employment opportunities locals have (Kwantes, 2009, p. 196).
Companies make mistakes by presuming that adopting gendered practices operational elsewhere
3
will be a road to success in India. Often this has lead into poor results overall (2009, p. 197). There
are several reasons for this including cultural differences, work values, reactions to empowerment,
work motivation and job satisfaction.
Indians place a high value on group orientation and overall affiliate with others who share their
state, city, family, religion, caste, or even career path. This creates a need for greater communal
trust in the workplace and leads to conflict avoidance. Conflict avoidance is particularly seen in the
fact that Indians do not like to give negative feedback and responses. The culture embodies a
strong desire to accommodate others and avoid insults to clients or guests. The need to avoid
conflicts and maintain collective work environment has affected pay practices so that there is less
differentiation among job level. (Corporate Executive Board)
“For many organizations, offering competitive compensation in India is an increasingly complex
challenge” states report by Corporate Executive Board (n.d., p. 3). The fierce competition over
limited pool of skilled workers, consumer price inflation and need to keep up with rising cost of
living, salaries in India have had the highest increases in Asia for the last 5 years. Indian
compensation plan design differs from Western mixes through tax allowances given to companies
prior 2005 to attract Western companies in India. Despite the rising cost of labor, India still
manages to draw investments from abroad since the cost of outsourcing specific jobs to India
remains 30-50% below the cost of outsourcing to China.
The typical compensation package in India is 40% base pay, 35% covers all flexible benefits and the
rest 25% is for retirement and performance-based pay (Corporate Executive Board). As the
everyday living expenses rises, the salaries are expected to follow this trend. Traditionally
allowances, such as housing, food and transportation, have been taking a huge portion of Indian
employees’ total compensation. In 2005 India passed a Fringe Benefits Tax bill that has made
companies reconsider allowances role as a significant component in total compensation
(Corporate Executive Board). Approximately 35% of an Indian employee’s pay goes into a Flexible
Benefit Plan that includes allowances for various common expenses. In most companies they can
choose how to allocate these funds toward rent, transportation or perhaps medical services.
4
Primary form of social security in India is called Provident Fund (Corporate Executive Board).
Organizations employing more than 20 employees are required to contribute 12% of an
employee’s certain type of cost to the fund. This cost includes basic wage, dearness allowance,
cash value of food concessions and retaining allowance. In addition to the contribution, employers
are also required to pay additional 1.61% of employee wages for administrative expenses for the
fund. Employees can freely contribute more than 12% to the fund.
As the salaries for skilled labor have increased over the last decade, so has the cost of living and
especially real estate prices (Corporate Executive Board, p. 7). In areas with highly skilled and
solvent people, the real estate prices have doubled or tripled, as employed persons have invested
large proportions of their income into their place of residence. In order for the employees not to
feel that their purchasing power has declined year-by-year, companies have been forced to follow
the market and pay a competitive housing allowance, which increases the total compensation to
the employee.
The minimum wage in India has been set down by state and central governments. The national
minimum has been set to 66 rupees (approx. $1.65 US) per day and addition to this the state
governments can set their minimums that overrun the national minimums based on the cost of
living, type of job and skill level of the worker (Corporate Executive Board). In a case that
employee makes less than 3,500 rupees (approx. $87.57 US) per month and has worked for the
organization more than 30 days in a calendar year, Indian Payment Bonus Act requires the
company to pay a bonus to the employee. After the 2005 Fringe Benefit Tax Law, employers are
required to pay a tax up to 30% on the benefits that were previously exempt from taxes. If an
employee works more than 48 hours a week (9 hours a day) he or she is legally entitled to
overtime pay, which is the double normal wages. This doesn’t apply to manager level employees in
an organization.
A part from employee retention in India among IT employees it is important to find out what
motivates employees. The next section 2.2 will be drawing a basis for motivational theories
suitable to this study.
5
2.2 Motivation
Motivation has a central role in our work lives (Salmela-Aro & Nurmi, 2005, p. 132). Depending on
the type of work, the tasks employees complete may require different types of motivation. In a
specific job, two people can be motivated through different factors, such as where an employee
might value monetary incentives the employee’s colleague may value recognition over ones work.
When it comes to compensation problems in a company there aren’t simple readymade solutions
available that a company could just implement. Every situation involves many stakeholders with
different agendas. It has been suggested that extrinsic motivation reduces employees’ intrinsic
interest in the task on hand. (Salmela-Aro & Nurmi, 2005)
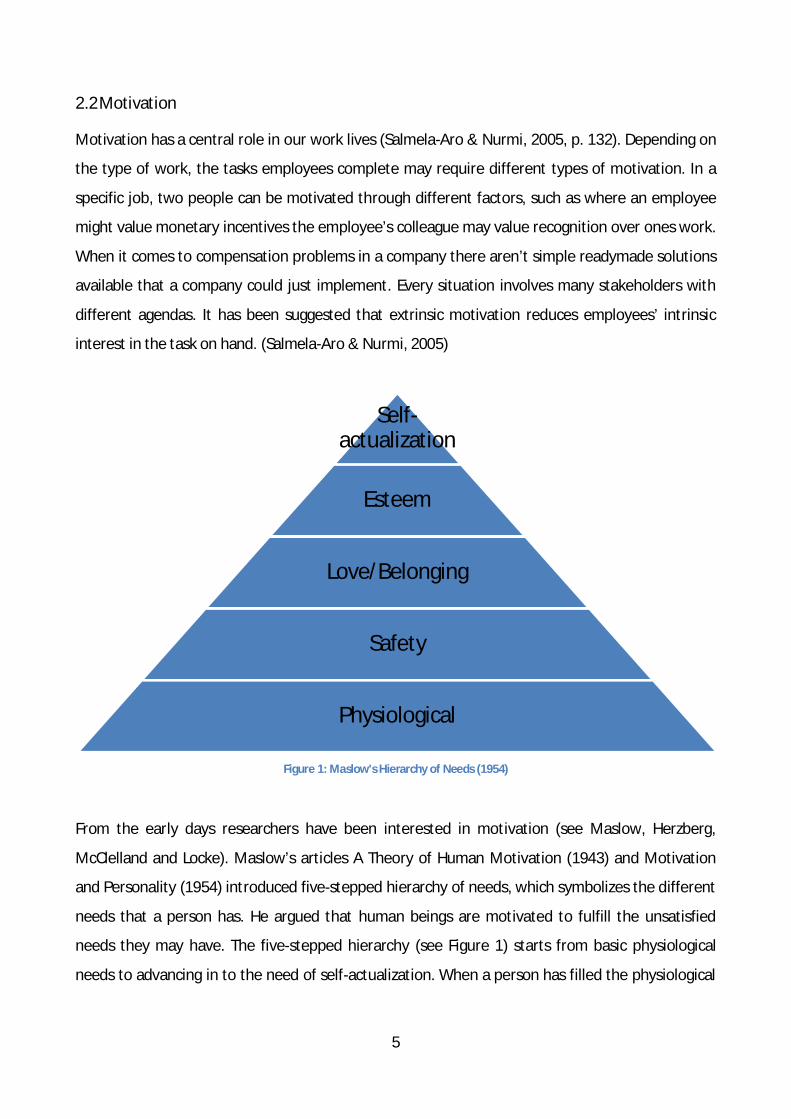
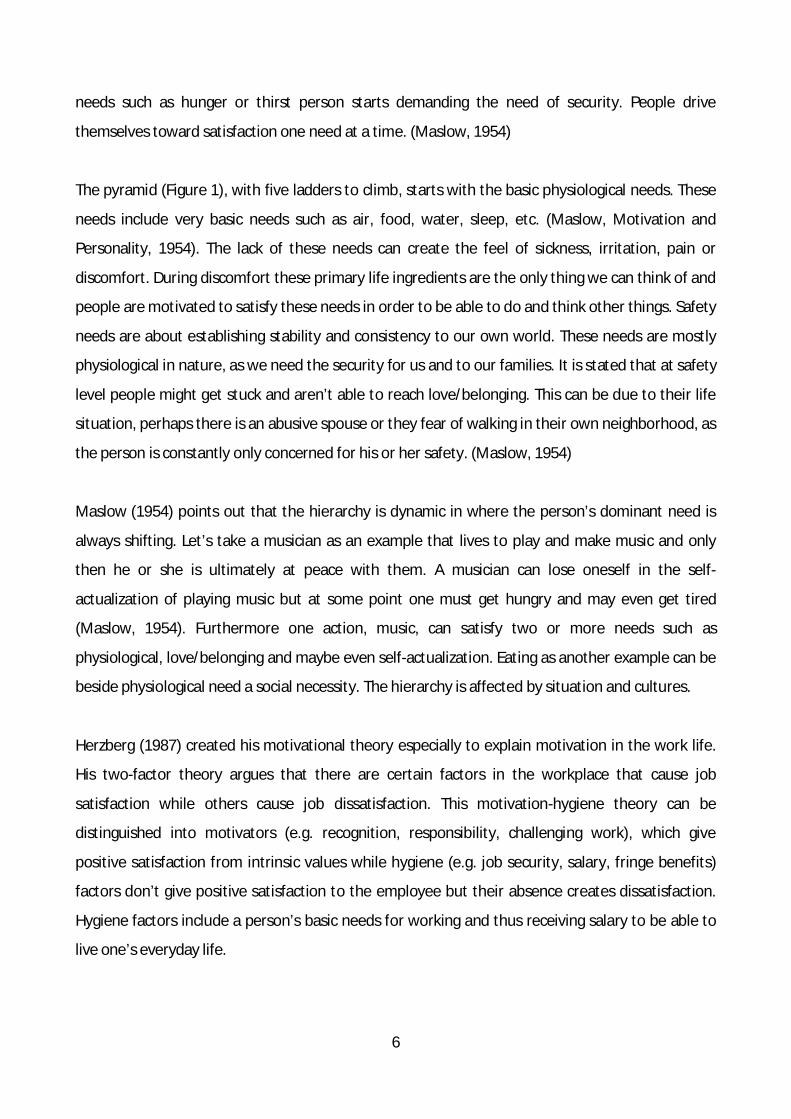
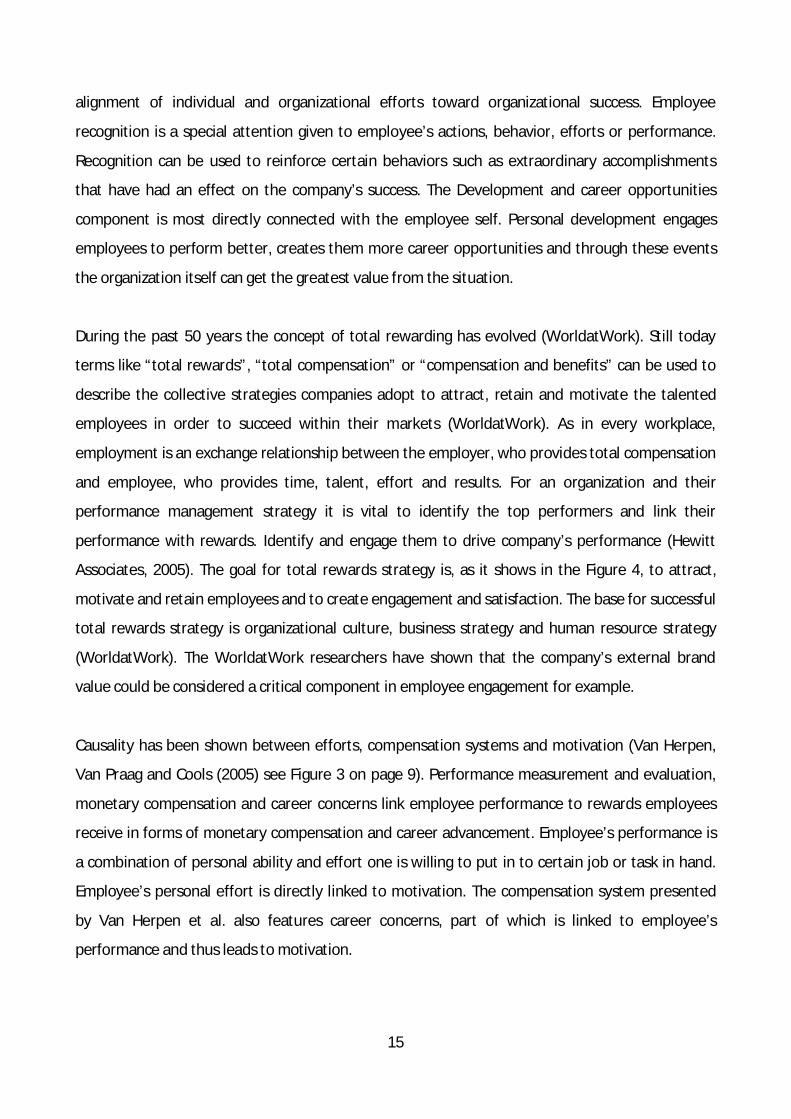
Figure 1: Maslow's Hierarchy of Needs (1954)
From the early days researchers have been interested in motivation (see Maslow, Herzberg,
McClelland and Locke). Maslow’s articles A Theory of Human Motivation (1943) and Motivation
and Personality (1954) introduced five-stepped hierarchy of needs, which symbolizes the different
needs that a person has. He argued that human beings are motivated to fulfill the unsatisfied
needs they may have. The five-stepped hierarchy (see Figure 1) starts from basic physiological
needs to advancing in to the need of self-actualization. When a person has filled the physiological
Self-actualization
Esteem
Love/Belonging
Safety
Physiological
6
needs such as hunger or thirst person starts demanding the need of security. People drive
themselves toward satisfaction one need at a time. (Maslow, 1954)
The pyramid (Figure 1), with five ladders to climb, starts with the basic physiological needs. These
needs include very basic needs such as air, food, water, sleep, etc. (Maslow, Motivation and
Personality, 1954). The lack of these needs can create the feel of sickness, irritation, pain or
discomfort. During discomfort these primary life ingredients are the only thing we can think of and
people are motivated to satisfy these needs in order to be able to do and think other things. Safety
needs are about establishing stability and consistency to our own world. These needs are mostly
physiological in nature, as we need the security for us and to our families. It is stated that at safety
level people might get stuck and aren’t able to reach love/belonging. This can be due to their life
situation, perhaps there is an abusive spouse or they fear of walking in their own neighborhood, as
the person is constantly only concerned for his or her safety. (Maslow, 1954)
Maslow (1954) points out that the hierarchy is dynamic in where the person’s dominant need is
always shifting. Let’s take a musician as an example that lives to play and make music and only
then he or she is ultimately at peace with them. A musician can lose oneself in the self-
actualization of playing music but at some point one must get hungry and may even get tired
(Maslow, 1954). Furthermore one action, music, can satisfy two or more needs such as
physiological, love/belonging and maybe even self-actualization. Eating as another example can be
beside physiological need a social necessity. The hierarchy is affected by situation and cultures.
Herzberg (1987) created his motivational theory especially to explain motivation in the work life.
His two-factor theory argues that there are certain factors in the workplace that cause job
satisfaction while others cause job dissatisfaction. This motivation-hygiene theory can be
distinguished into motivators (e.g. recognition, responsibility, challenging work), which give
positive satisfaction from intrinsic values while hygiene (e.g. job security, salary, fringe benefits)
factors don’t give positive satisfaction to the employee but their absence creates dissatisfaction.
Hygiene factors include a person’s basic needs for working and thus receiving salary to be able to
live one’s everyday life.
7
“The things that make people motivated and satisfied on the job are different from the
things that make them dissatisfied. One should forget praise, forget punishment, and forget
cash. You need to make their jobs more interesting.” (Herzberg, 1987)
The optimal situation at the workplace would be that managers rather than trying to motivate
employees with rewards, the work itself would be motivational enough for them (Herzberg, 1987).
The research question in Herzberg’s (1987, p. 6) study was keen on answering was who is the one
being motivated at work place? The Employee’s manager is motivated to make the employee work
toward completion of the task while the employee, on the other hand, knows there will be a
reward for getting tasks done. Herzberg’s ideology proposed that the only way a person is truly
motivated is when there is no need for outside stimulation such as a cash reward. In order to instill
motivation, positive employee push practices have been introduced including reduced time spent
at work, spiraling wages, fringe benefits, human relationship training, sensitivity training, two-way
communication, job participation and employee counseling.
Herzberg’s (1987, p. 9) research has shown that factors involved in producing job satisfaction (and
also motivation) are separate and distinct from factors that lead to job dissatisfaction. It is
important to notice that job satisfaction is not the opposite of job dissatisfaction. The opposite of
job satisfaction can be better characterized by no job satisfaction. The opposite of job
dissatisfaction is then no job dissatisfaction. Herzberg characterizes two different human needs.
The basic biological needs to eat, drink and sleep. People need money to eat and drink and a place
to stay. As the previous example shows, to some extent Herzberg’s (1987) theory has ingredients
and ideas from Maslow’s (1954) hierarchy of needs. After basic necessities, by Herzberg (1987)
framework, come needs related to human characteristics such as ability to achieve and to
experience inner growth. The intrinsic motivator factors are achievement, recognition, work itself,
responsibility, advancement and growth. Hygiene or dissatisfaction-avoidance factors are
company policy and administration, supervision, relationship with supervisor, work conditions,
salary, relationship with peers and subordinates, personal life, status and security. Of all the
factors contributing to job satisfaction 81% were motivators. 69% of factors contributing to
employee dissatisfaction about their jobs involved hygiene elements (Herzberg, 1987, p. 9). In
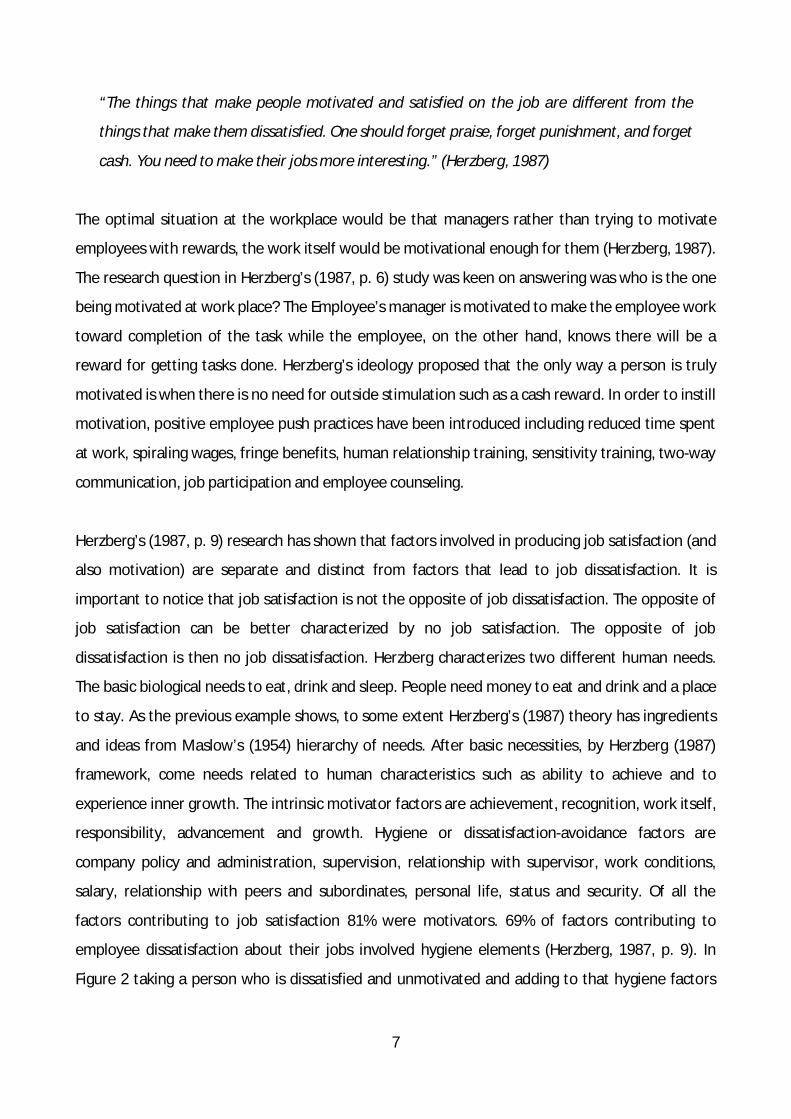
Figure 2 taking a person who is dissatisfied and unmotivated and adding to that hygiene factors
8
we get an employee who is not dissatisfied but still unmotivated. Adding motivation factors the
employee gets satisfied and motivated.
Figure 2: Two Factor Theory (Herzberg, 1987)
McClelland, in his research Motivational Trends in Society (1971) cited by Salmela-Aro & Nurmi
(2005), argues that his Learned Needs Theory emphasizes three distinct needs: Achievement,
Affiliation and Power. People want to succeed and overcome themselves and hence they just
essentially want to achieve. They are motivated by doing challenging work and thus the
motivation arises not from compensation or fringe benefits but rather completion of a task and
feel of achievement. People with high need for affiliation drive themselves toward harmonious
relationships with other people. They need to feel accepted by other people and require
significant personal interaction in their work. Power seekers emphasize the need to have social
power and status over others.
Locke’s (1968) Goal Setting Theory cited by Salmela-Aro & Nurmi (2005) emphasizes how
objectives effect motivation. Employees aim to achieve their objectives in their work lives.
Subsequent research based on Locke’s theory has suggested that demanding and punctual goals
motivate better than general objectives. The employee is also more involved to their work if he or
she can affect the objectives of it.
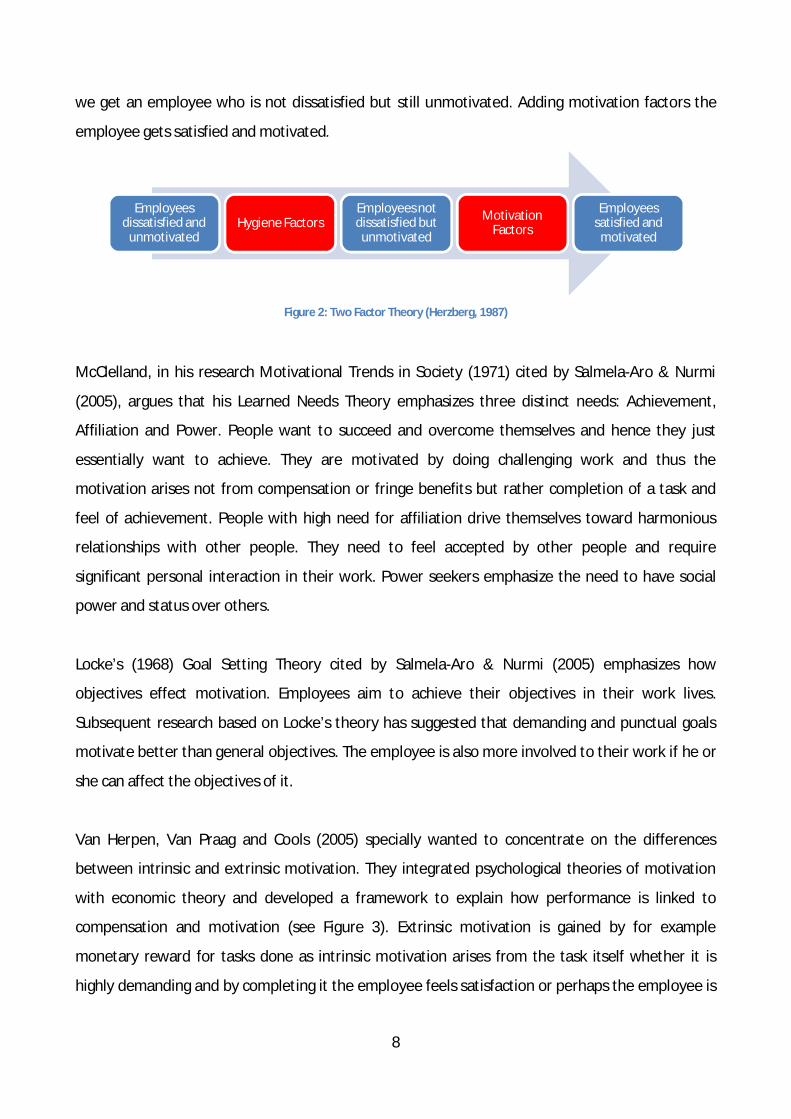
Van Herpen, Van Praag and Cools (2005) specially wanted to concentrate on the differences
between intrinsic and extrinsic motivation. They integrated psychological theories of motivation
with economic theory and developed a framework to explain how performance is linked to
compensation and motivation (see Figure 3). Extrinsic motivation is gained by for example
monetary reward for tasks done as intrinsic motivation arises from the task itself whether it is
highly demanding and by completing it the employee feels satisfaction or perhaps the employee is
Employees dissatisfied and
unmotivatedHygiene Factors
Employees not dissatisfied but unmotivated
Motivation Factors
Employees satisfied and
motivated
9
given more responsibilities at work. As some tasks are performed without monetary payments,
which contradicts the standard economic assumptions. Their research concluded that extrinsic
motivation has a significant relationship with perceived fairness of the monetary and career
concerns of the compensation system.
Figure 3: Framework of concepts and relationships (Van Herpen, Van Praag & Cools, 2005)
The Figure 3 adds work satisfaction, turnover intent and sick leave as three other indicators of
motivation (Van Herpen, Van Praag, & Cools, 2005). Work satisfaction should be related to the
perceived quality of the compensation system, turnover intent is a factor to evaluate the intention
to leave a company and which is negatively correlated to the perceived quality of compensation
system. Also sick leave or absenteeism is likely to be negatively correlated to the quality of the
compensation system.
Motivation is a vital part in ensuring employee effort. The next chapter will cover in more depth
on why and how employee engages oneself to an organization and work toward common goals.
The chapter also points out three types of commitments that an employee makes with the
organization.
10
2.3 Employee engagement and commitment
There is no single and generally accepted definition for the term employee engagement (Markos
and Sridevi (2010, p. 90). Perrin’s (2003) Global Workforce study uses the definition “employees’
willingness and ability to help their company succeed, largely by providing discretionary effort on a
sustainable basis.” According to Perrin, engagement is affected by many emotional and rational
factors related to day-to-day work. Employee Engagement is the combination of job satisfaction,
motivation and effectiveness and it occurs when the three factors intersect argues Swaminathan
and Rajasekaran (2010). “The value of the organization is transferred from physical asset to
effective work force” they continue. Robinson et al. (2004) on the other hand defines employee
engagement as a positive attitude held by the employee towards the organization. An engaged
employee is familiar with the organization’s business context and works with colleagues to
enhance job performance for the benefit of the organization. This two way relationship must be
nurtured by both employer and employee Robinson et al. (2004) continues.
Nowadays employers have realized the advantages of focusing more on employee engagement to
create more efficient and productive workers (Markos & Sridevi, 2010). Employee engagement is
not the same as employee satisfaction the authors continue (2010, p. 90). This is due to fact that
managers can’t purely rely on the employee satisfaction being the key factor on keeping the
brightest and best employees within the company. The authors continue arguing that employee
engagement is more superficial and transactional relationship between organization and
employee. Engagement is about commitment and passion to invest oneself to be a part of
employer’s success, which is argued to be beyond simple satisfaction (Markos & Sridevi, 2010).
This view opposes Swaminathan and Rajasekaran’s (2010) argument satisfaction being the
fundamental part of employee engagement. The concept of engagement seeks to make clear that
it is not enough for the employee to bring his or her input to the work place but it is very
important that he or she brings his or her heart and mind as well. Some other advantages of
engaged personnel are identified as follows (Swaminathan & Rajasekaran, 2010, p. 55): engaged
employees will stay with the company, in general perform better and are more motivated;
engaged employees form emotional connection with the company and create sense of loyalty in a
competitive environment.
11
Employee attrition or more commonly referred employee turnover makes organizations lose
money due to the high cost of recruiting and training new employees (Bairi, Manohar, & Goutam,
2011). While a new employee is being evaluated, selected, recruited and trained the division
lacking a headcount in the organization runs with too few employees. Others need to take care of
the duties of the person who resigned or got laid off resulting in overtime compensation for the
remaining workers or the company faces the cost of loss production. The cost of turnover for one
employee in IT industry has been calculated to be approximately three times the annual salary of
an IT employee (2011, p. 2). The authors divide employee attrition into two categories: functional
and preventable attrition. Bairi et al. (2011) argue that functional attrition is caused by
circumstances out of the organizations control (external reasons). There are numerous external
motives why people quit and change companies. These reasons include retirement, spouse’s job
transfer, leaving due to health problems, employee moving to a new town or taking up higher
studies just to name few. Preventable attrition on the other hand can be controlled and should be
avoided if possible. These types of attrition are, to name few, work pressure, conflict with
manager or poor job satisfaction. Bairi & et al. (2011) mentions the first step in managing attrition
is to understand why employees leave the company. Through understanding companies they can
try to prevent, manage and engage employees even further into the organization.
The three components in the conceptualization of organizational commitment suggested by Allen
and Meyer (1990) and later revised by Meyer and Allen (1991) are labeled affective, continuance
and normative (desire, need & obligation) commitment. Affective commitment takes place when
the employee has a desire to be the part of the organization and this desire is based on emotional
attachment. Degree of this commitment is the degree of which employee feels belonging to the
group and is satisfied with the involvement. Continuance commitment, the second component, is
based on an exchange between individual and organization commitment and the strength of it
arises from employees personal views on how favorable the commitment toward them is. The
rewards and benefits must outweigh the cost of leaving or changing the organization. The third
component, normative commitment, is based on a belief that the employee has a responsibility
toward organization and people inside it. It reflects an individual’s perception of the behaviors
acceptable in the organization. (Allen & Meyer 1990, Meyer & Allen 1991 & Kwantes 2009)
12
A checklist of ten points for organizations to take into account, in order to have and be able to
maintain engaged employees, has been written by Markos and Sridevi (2010, pp. 93-94). It
includes
1. Start on day one: Many organizations have clear new talent acquisition strategies but lack
employee retention strategies. Effective recruitment and orientation for newcomers are
the foundation in employment. Managers should ensure correct role-talent fit for
employee to retain that talent in the organization.
2. Start from the top: Employee engagement requires leadership commitment through
establishing and communicating clear mission, vision and values. Managers also need to
believe in what they are selling and pass it down in the organization.
3. Enhance employee engagement through two-way communication: Overall managers need
to promote two way communications at the workplace. Employees need to have an
opportunity to talk and participate in enhancing the work environment, relationships with
managers and overall engaging themselves more into the organization.
4. Give satisfactory opportunities for development and advancement: Managers should
encourage employees to think independently though giving more job autonomy. As long as
the employee is producing the expected result they are free to choose the best way of
doing it. This is more result rather than process management.
5. Ensure that employees have everything they need to do their jobs: Managers need to
make sure that employees have all the resources needed to do their jobs like physical or
material, financial and informational resources.
6. Give employee’s appropriate training: One should help employees to enhance their
knowledge and skills through giving them appropriate trainings. Through training their
knowledge increases, their confident rises and they are able to work without much
supervision from their managers, which in turn builds their self-efficacy and commitment.
7. Have a strong feedback system: Companies should develop a performance management
system, which holds managers and employees accountable for the level of engagement
they have shown. Regular surveys of employee engagement have shown to help make out
the factors to which employees engage into.
8. Incentives play a part: Managers are responsible for working out both financial and non-
financial benefits for employees who show them to be more engaged to their work.
13
9. Build a distinctive corporate culture: Companies should endorse a culture where goals and
values are aligned across all work sections. A company builds culture of mutual respect by
keeping success stories alive to engage current and future employees.
10. Focus on top-performing employees: High-performing companies attract top-performing
employees.
The ten point list takes a holistic view on employee engagement (Markos & Sridevi, 2010). The
employee engagement is a process that should start at the first day the employee comes to work.
The initiative and actions for engagement should be set and introduced from the top
management. Communication, development opportunities as well as giving employees’ feedback
and incentives will generate more committed and engaged work force for the organization.
Companies compensate employees based on their performance and for the exchange of capital
and free time of an employee. Compensation and benefits, or as nowadays referred total
compensation, is also used to engage people toward the organization and the job in hand. The
next chapter covers different types of compensation and the latest trends around this area.
2.4 Compensation & Benefits
Compensation is a pay provided by an employer for the exchange of time, effort and skills from
employees part (Christofferson & King, 2006). Compensation comprises four core elements: Fixed
or base pay, variable pay, short-term incentive pay and long-term incentive pay. WorldatWork, a
not-for-profit organization, defines fixed pay as a fundamental part of employee compensation,
which does not vary according to performance and is usually determined by company’s pay
structure. Variable pay, or also known as “pay at risk”, has direct relationship to the level of
performance or results achieved, which for every performance cycle must be re-earned. Short-
term incentive pay (STI), a type of variable pay, is designed to focus and reward performance over
a period of time (usually year or less). Long-term incentive pay (LTI) focuses on performance
recognition longer than year and its typical forms include stock options (WorldatWork).
Benefits programs are used by employers to supplement the base compensation employees
receive (Christofferson & King, 2006). In basic form benefits programs protect the employee and
their families from financial risks (WorldatWork). They include mandated and obligatory matters
14
such as unemployment, social security or disability insurance, vacation allowance, sick leave,
retirement plans, or medical benefit.
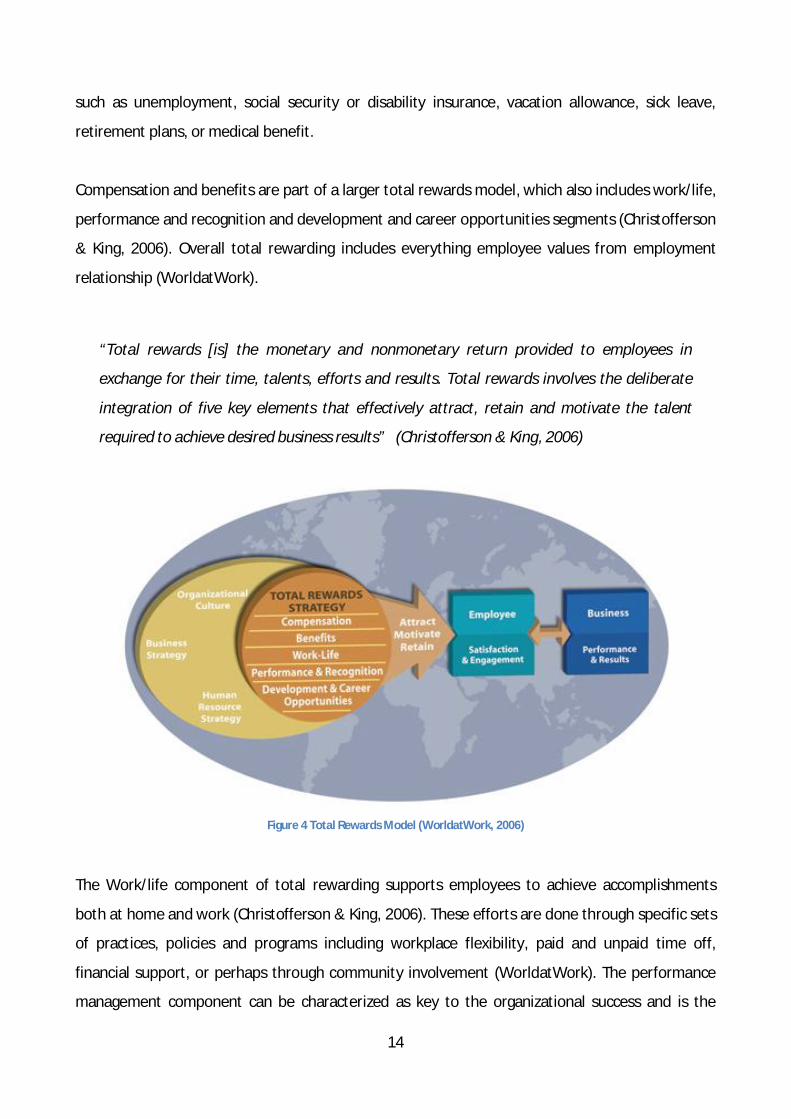
Compensation and benefits are part of a larger total rewards model, which also includes work/life,
performance and recognition and development and career opportunities segments (Christofferson
& King, 2006). Overall total rewarding includes everything employee values from employment
relationship (WorldatWork).
“Total rewards [is] the monetary and nonmonetary return provided to employees in
exchange for their time, talents, efforts and results. Total rewards involves the deliberate
integration of five key elements that effectively attract, retain and motivate the talent
required to achieve desired business results” (Christofferson & King, 2006)
Figure 4 Total Rewards Model (WorldatWork, 2006)
The Work/life component of total rewarding supports employees to achieve accomplishments
both at home and work (Christofferson & King, 2006). These efforts are done through specific sets
of practices, policies and programs including workplace flexibility, paid and unpaid time off,
financial support, or perhaps through community involvement (WorldatWork). The performance
management component can be characterized as key to the organizational success and is the
15
alignment of individual and organizational efforts toward organizational success. Employee
recognition is a special attention given to employee’s actions, behavior, efforts or performance.
Recognition can be used to reinforce certain behaviors such as extraordinary accomplishments
that have had an effect on the company’s success. The Development and career opportunities
component is most directly connected with the employee self. Personal development engages
employees to perform better, creates them more career opportunities and through these events
the organization itself can get the greatest value from the situation.
During the past 50 years the concept of total rewarding has evolved (WorldatWork). Still today
terms like “total rewards”, “total compensation” or “compensation and benefits” can be used to
describe the collective strategies companies adopt to attract, retain and motivate the talented
employees in order to succeed within their markets (WorldatWork). As in every workplace,
employment is an exchange relationship between the employer, who provides total compensation
and employee, who provides time, talent, effort and results. For an organization and their
performance management strategy it is vital to identify the top performers and link their
performance with rewards. Identify and engage them to drive company’s performance (Hewitt
Associates, 2005). The goal for total rewards strategy is, as it shows in the Figure 4, to attract,
motivate and retain employees and to create engagement and satisfaction. The base for successful
total rewards strategy is organizational culture, business strategy and human resource strategy
(WorldatWork). The WorldatWork researchers have shown that the company’s external brand
value could be considered a critical component in employee engagement for example.
Causality has been shown between efforts, compensation systems and motivation (Van Herpen,
Van Praag and Cools (2005) see Figure 3 on page 9). Performance measurement and evaluation,
monetary compensation and career concerns link employee performance to rewards employees
receive in forms of monetary compensation and career advancement. Employee’s performance is
a combination of personal ability and effort one is willing to put in to certain job or task in hand.
Employee’s personal effort is directly linked to motivation. The compensation system presented
by Van Herpen et al. also features career concerns, part of which is linked to employee’s
performance and thus leads to motivation.

16
In effectiveness evaluation of compensation systems Van Herpen et al. (2005) used three distinct
measurements: transparency, fairness and controllability. The transparency of a compensation
system is evaluated based on the complexity of the system and how well it has been
communicated to the employees. A transparent system should inform the employees on rules of
the compensation system but also the objectives of the firm. Clear communication will enhance
understanding of what is expected of employees. Also open and clear communication enhances
the support for a certain compensation system. Fairness is based on honesty and trust between
employee and the organization. Motivation is expected to decrease if an employee feels that he or
she is being treated unequally compared to others. Controllability, the third characteristic, is used
to evaluate the perceived relationship between performance and compensation. Controllability is
the extent to which the employee is able to control or influence the outcome of one’s work.
Bairi, Manohar and Goutam (2011) argue that to be able to retain people the employer should
offer reasonable salaries. Younger generations of talented employees in the IT sector are more
eager to make more money at an early age of their careers than in other sectors. In order to have
and retain employees in the company the first and most important matter to have is adequate
salaries. Stock options and bonuses may be useful in engaging and retaining employees. Having an
ownership to the company through stock, the employee feels more committed to the company
and its performance. Within the IT sector in India, company stocks are a fairly unknown incentive
but merit bonuses, cash awards and skill development allowances are very commonly used.
The creation and implementation of excellent benefit plan has been one of the most important
ways of retaining employees (Bairi, Manohar, & Goutam, 2011). The higher amount of benefits,
the more likely employee will stay with the company. Benefits from child care, fitness club
memberships, or educational programs to flexible working hours, career development,
transparency and recognition are factors employees value and expect from the organizations. A
strong way to engage employees is to develop a career path with them. They’ll have some kind of
roadmap for personal development and career building within an organization.
Incentives are called ‘extrinsic motivators’ by psychologists (Kohn, 1993, p. 55). They do not alter
the attitudes that underlie our behavior and thus secure only temporary compliance. Studies have
revealed that people who expect to receive a reward for completing a task or for doing that task
17
successfully do not perform as well as those who expect nothing in reward (1993, p. 55). Higher
pay does not produce better performance as return. Kohn (1993, p. 56) states that only few
researchers have taken the time to examine the connection between incentive programs and
problems with workplace productivity and morale. Rewards buy temporary compliance, making it
look like the problems are solved. Spotting the harm incentives cause over the long term is harder.
The true cost of incentive systems can be examined through following a six-point framework
presented by Kohn (1993, pp. 58-62).
1. “Pay is not a motivator” – Studies have shown that when asked “what do you care about”,
money ranks to be fifth or sixth.
2. Rewards punish – Rewards have a punitive effect because they are manipulative. Also not
receiving an expected reward is punishment.
3. Rewards rupture relationships – Employees compete for rewards, which can rupture
relationships and cooperation.
4. Rewards ignore reasons – Rewards directed to boost productivity do nothing to address
possible underlying problems in the organization.
5. Rewards discourage risk-taking – People tend to do what they are asked to do if the reward
is significant. Excellence pulls employees one direction whereas rewards pull in another.
6. Rewards undermine interest – No artificial incentive can match the power of intrinsic
motivation. People who are exceptional do not work just to get the paycheck but they are
glad to be paid well.
Kohn (1993, p. 63) continues by arguing that “Managers who insist that the job won’t get done
right without rewards have failed to offer a convincing argument for behavioral manipulation.
Promising a reward to someone who appears unmotivated is a bit like offering salt water to
someone who is thirsty. Bribes in the workplace simply can’t work.”
2.5 Research problems addressed in this study
This research addresses the common problem Western companies face while having operations in
India: employee attrition. The overall problem is to find out how better to engage Indian IT
professionals in the case company. First we need to know from what standpoint the employee
18
feels connected to the company. Through this study I will enquire what type of commitment
employees in India generate with a company based on Meyer & Allen (1991) framework of three
scales of commitments.
After gaining the insights of whether it is the employee’s desire, need or obligation to work for the
case company, the study starts addressing how the employees perceive their compensation
system and whether there is a connection between total rewarding and employee engagement.
Alongside engagement comes employee motivation. As the secondary research question is about
rewarding to ensure engagement and motivation it is vital to research what kind of motivation
works for the local employees.
The next chapter starts addressing the research methodology used in this study.
19
3. Research Methodology
The type of research conducted for the empirical part of this thesis is of quantitative nature. The
data generated through questionnaire were quantitative and statistically analyzed. This chapter
addresses the research methods used for this thesis, the justification for the choice of
methodological instrument, the way data was analyzed and the validity of the study. Section 3.1
explains the research methods employed and the data gathered, and section 3.2 assesses the
trustworthiness of the study.
3.1 Case study
The case study is the most flexible of all research designs, allowing the researcher to retain the
holistic characteristics of real-life events while investigating empirical events. The case study
method is used to investigate a contemporary phenomenon within its real-life context where the
boundaries between the phenomenon and context are not clearly evident (Yin, 2009). A single
case study was chosen due to the nature of research conducted in India for the case company.
This also allows investigating one case on a deeper level with more focused research questions.
When studying only one organization, all major organizational context factors are same for all the
people that are included in the research.
3.1.1 Case company
With more than 17,0006 experts world-wide, the case company is the leading IT service provider in
Northern Europe7. They provide IT, R&D and consulting services for global clients. Their main
customer segments include telecom & media and financial services with over 75% of their net
sales coming from Northern Europe. This publicly listed company had net sales of over 1,700
million8 euro in year 2010 with operating profit around 70 million euro.
Beside telecom & media and financial service segments, the company also serves customers in
automotive, energy, healthcare and welfare, manufacturing, logistics, public and retail sectors. 6 Case company internal data end of year 2010 7 Case company Annual Report 2009 8 Case company investor information 2010
20
Currently the case company operates in over 25 countries with presence in all continents
excluding South and Central Americas. Their main focus is serving large and medium-sized
organizations and they co-operate with many of the world’s leading companies9.
The case company’s operating environment is truly challenging. The IT industry is fast growing and
fast developing where new players and big players enter the markets daily. The future position of
the case company is hard to predict. Their traditional position as contract supplier is being
jeopardized. The case company, like its competitors, has started expanding their off-site
operations to low-cost countries such as China and India with hopes to gain competitive edge by
producing quality products cheaper than before.
Among the case company’s international operating sites, India was selected as a target country
due to its unique culture status as highly suitable outsourcing location for Western companies. In
India, the case company has a growing presence in two sites located in Pune and Bangalore with
nearly 1,500 employees. New governmental legislation and rising inflation, the cost of living and
organizational operating has been increasing for the past decade. The question that is being asked
is how to keep producing products and services with good operating profit while still maintaining
professional workforce?
3.1.2 Questionnaire development
The data was gathered through questionnaire had six distinct sections, which will be described
here. The detailed list of questions can be found from appendix A.
As a basis and a starting point for questionnaire development, literature was gathered for the
framework of this study. Two studies were used as a basis for the development of the questions
used in the survey. These were researches by Van Herpen, Van Praag and Cools (The effects of
performance measurement and compensation on motivation: An empirical study, 2005) and by
Kwantes (Culture, job satisfaction and organizational commitment in India and the United States,
2009). In addition, the case company’s total rewarding structure was used as a base structure for
certain question sets.
9 Case company Annual report 2009

21
The first part of the questionnaire included basic questions concerning the respondent’s gender,
age group, career path, career length and the number of companies a respondent has worked for.
Most of these answers can be evaluated against average values of original recipients of the survey
invitation. This common information can be used to see if there is difference in people groups who
have answered the survey and can also be taken as filtering values for future analysis. It is also
interesting to see whether a conclusion can be drawn between people who have changed their
occupation often compared to newcomers in the company.
The second part of the questionnaire enquired from what psychological state an employee makes
the strongest commitment with the company. In 2009 Catherine Kwantes studied India and United
States from an organizational commitment viewpoint. She evaluated these two countries using
Meyer and Allen’s (1991) framework of organizational commitment against job satisfaction,
collectivism and individualism. Meyer and Allen’s (1991) commitment framework has three
separable components reflecting a desire (affective component), a need (continuance
commitment) and an obligation (normative commitment) to maintain employment in an
organization. Kwantes, in her study, concluded that Meyer & Allen scale can be used in the Indian
context. For the purpose of this study Meyer and Allen’s set of eight-structured questions were
used evaluate the psychological state of employee commitment in India. Using Meyer and Allen’s
question set on commitment, a conclusion can be drawn on what type of commitment is strongest
among the employees.
The third part of the questionnaire used Van Herpen, Van Praag and Cools (2005) questionnaire as
a basis. This part evaluates different perceptions that an employee has toward monetary
compensation and career concerns. It evaluates the total rewarding from transparencies’,
fairness’, controllability’s, extrinsic motivation’s, intrinsic motivation’s, work satisfaction’s and
turnover intent’s viewpoint. This set had 16 questions with likert-type scaling with range of 5 and
one question asking overall satisfaction toward their jobs that had a scale from 1 to 10. This set
also clearly points out, from a monetary and non-monetary point of view, how satisfied the
respondents are with the current rewarding model.
22
The fourth part of the questionnaire has a direct linkage to the previous section as it tries to find
how satisfied a respondent is to the case company’s total rewarding and do they feel they can
affect it by their own actions. Through these questions in the fourth part, the case company can
get direct information concerning their rewarding structure and how the Indian employees feel
they are mastering the area of compensation and benefits. The ten questions are divided into five
categories: monetary compensation, benefits, work/life balance, performance & recognition and
personal development and career opportunities.
The fifth part was an open-ended question allowing the recipients to choose up to five factors that
they value for working for the case company in India. These compensational and benefits factors
were chosen from a pool of incentives, benefits and compensation they receive, some of them
mandatory and most optional. This part only aims to find what an Indian employee values today
about working for the company. The last part of a questionnaire included a question from the local
management team, who wanted to take this opportunity to reach out to their employees and
listen to what they think about rewarding. The answers from this question weren’t used in analysis
of this study.
During the design of the questionnaire and preparation to implement the survey online, I
consulted multiple people from the case company to make sure they agreed with the questions
and that there was no inconsistency with the corporate policies. Few examples include the change
of wording from salary to monetary compensation or the phrase career advancements into career
movements as nowadays people make both horizontal and vertical movements with their careers.
These changes were made to change the wording to be in line with the grammar used when
talking about total rewarding in the case company. The Local HR manager had some changes to
the fifth section of questionnaire as there were few options that in India are considered as a part
of base salary or more commonly referred as cost to company. These options include meal
allowance, housing allowance and few others.
3.1.3 Data collection
The main data collection method used in this thesis was a structured online survey. In addition to
the survey, some internal documents were provided by the case company and were used mainly
23
as background material for research objective and question setting. These corporate materials
included basic information about the company and their presence in India.
In this study, to determine the level of employee engagement in contrast with the case company’s
total rewarding, a structured questionnaire (Appendix A) with Likert-type scale was used to collect
primary data. Closed-ended questions were used to allow recipients to choose, from their
perspective, the most important factors they value in their organization’s total rewarding.
Additionally, there were to basic questions about gender, age range, career length and number of
IT employers during career; plus an open-ended question, which the case company requested to
be implemented at the end of the survey as voluntary question. This open-ended question allowed
recipients to share their opinions anonymously on total rewarding in India directly to the local
management team. This last item was discarded from analysis in this research.
The survey was distributed as an online survey through the case company’s email system to 1,343
recipients in Pune, India. The recipients represented a group of employees on professional and
managerial career paths ages ranging from 20 to 54 with career lengths varying from new hires to
employees with 6 year of career at the company. Around 76% of recipients were between the ages
of 25-34 and approximately 75% of the survey recipients were men. The questionnaire, found
from Appendix A, was in English language, as English is the lingua franca in India. The case
company also uses English as the primary language in Indian offices. The target percentage of
respondents was set at 20%.
The research survey sample was made as large as possible to get a holistic view of professional
and managerial career path employees. The reason for including both career paths was to see how
structures and hierarchies in India affect on the responses. As the case company suffers from high
attrition rates, the employee sample was drawn at the last moment, a day before launch of the
survey. This data set included information on the people only working at Pune site in India with
the above mentioned career paths. The data set gotten from case company’s systems included the
email addresses needed to send the invitation but also employees’ gender, career level (P1-P6,
M1-M4), age groups used in the case company and years of service. As respondents were sent a
generic link to answer the survey there is no way to directly link person and their responses.
24
Control information asked in the beginning of the questionnaire allows comparison to be made in
analysis.
Survey was hosted on Webropol10, online survey and analysis software, for which the case
company had a license. This way the data gathered from the survey would not leave the case
company’s possession but allowed analysis to be made. All of the recipients received a generic
secured Internet address (URL), through which they could answer the survey online and the
system would handle the data collection and storage. The system itself made sure, everyone only
had one opportunity to answer the survey. As a general, there was a way to bypass this security
measurement and that people would be able to fill more than one response. They are IT
professionals, but it would be hard to find a reason why someone would like to tamper the data
collected. There is no way of determining this for sure and no sign of repeated answers could be
seen from the data. All questions except the last were positioned as mandatory questions and the
system wouldn’t allow respondents to move forward until all questions on a page had been
answered. In spite of these requirements set up to the system, the responses received to the
system included some uncompleted data sets, which was then discarded. Webropol online system
stores the answers in their system from where the data may be analyzed online through their own
system or retrieved in Excel or CSV format for further analysis in Excel or SPSS11.
Participants were invited to take the survey through an invitation email (see Appendix B) sent
through case company’s email system with a request and a secured link to take the questionnaire.
In the invitation mail, my main highlight was on personal discretion and anonymity of the
respondent. I also highlighted the reasons and objectives what I was trying to find through the
research. Initially it was planned that a local HR manager would introduce my study in beforehand
to give it more credibility but due to scheduling problems this never happened and few difficulties
did arise because of it.
The Survey was launched on Tuesday April 5th giving the respondents two weeks time for
answering. The first reminder email was sent out on the April 12th and the latter on April 18th just a
day before the answering period ended. At 8 p.m., local Indian time on April 19th the questionnaire
10 www.webropol.com 11 Analytical software by IBM
25
was set to private and taken away from public reach and thus no more answers were received.
During this two-week period, 557 of 1343 recipients answered the survey, which gives a response
rate of approximately 42%. From the start people started answering the survey fairly well and
quickly after launch during the first half of hour of making the survey public, over 80 answers were
received, which indicated fairly strong start with good and rapid responses to the invitation.
After an hour of launching the survey some problems arise. An email was received stating that all
case company’s employees in India have been sent out a notification not to respond to the survey.
The local communications manager was not aware of the study being conducted and thus sent out
a message that the survey I was making was not official in any way. After having a discussion with
this person, everything was sorted out and new emails were sent out to the employees stating the
legitimacy of the study and that local management team supports this study. I was then to re-
introduce my study to the employees. It is hard to evaluate the harms these unexpected delays
caused to the response rate. The first day overall was a huge success. The amounts of respondents
rose close to 300, which again indicated really strong start.
A reminder email was sent out on the April 12th and within the next hour, over hundred new
people submitted their answers. Unluckily few hours after this reminder email, Webropol systems
went down and the questionnaire form was unreachable from the Internet. The browser gave an
error note when trying to reach the survey’s web address. No reasons from Webropol’s side were
shown to the end users. Overall the system was down for approximately an hour. Again one can
only wonder if this had an effect on the answer rate. Perhaps people would just give up answering
the survey when they felt the web address wasn’t working. After few days, on Thursday 14th there
was an update in the Webropol systems, which lead to system giving a message: “The Webropol
survey application is temporarily out of use due to updating. Logging in to the application or
answering surveys is not possible during the update.” At least this time the respondents could
know why they couldn’t answer the survey and knew that they could come back later. The
survey’s system update didn’t go as planned. After getting back online the survey took really long
time to load from start and again on Sunday 17th the survey was unreachable for 4 hours due to
additional unexpected updates.
26
On Monday 18th, the last reminder was sent out with a notion of last possibility to answer the
survey. A spike in the amount of answers received could be clearly seen every time an email was
sent out. Within a day of the initial launch the amount of recipients raised up to 300 respondents.
Then almost a week went by with just few new responses a day. During the last day, the number
of responses rose to over 500. This must be taken as a good result considering all the difficulties
the survey had faced during these two weeks.
3.1.4 Data analysis
The survey system, closed after two weeks from launch, recorded 557 responses (See Table 1).
From this sample, 37 needed to be rejected either because the data was incomplete or there was
too many answers given in the fifth part of the questionnaire. The amount of rejected answers
calculates to 7% of the total sample, but after going through the situation it was seen better to
reject them and to only use completed answer sets. This rejection of answers set the response
rate to be at 39%, which was more than originally targeted by the researcher and case company.
Table 1 compares the characteristics of the respondents with the population of the entire group
invited to take the questionnaire. A comparison between sample averages and the population
proves the sample to be fairly representative of all the employees in this site. Unfortunately there
was no comparable data available for tenure lengths or a number of other employers for the total
population.
Table 1 show that the percentage of male employees in the firm is quite large, 76%. The majority
of the employees, 76%, are between ages of 25-34 with 94% in the professional career path. The
profile of the sample shows consistent patterns. The case company’s internal statistics shows the
average tenure length is 1.14 years 12, which is consistent with the sample where 68% of
employees have been working less than 2 years. The sample data also tells us that most of the
employees, 86%, have been working for other organizations before joining the case company thus
giving them contrast point of other companies when evaluating their current employer. As the age
groups of 40-44 and 45- consists only 9 respondents it will not be taken into account for control
group evaluations. The sample is too small and another reason for leaving them out was that out
12 Information retrieved from Case company’s internal data banks for Pune, India. 2011

27
of 37 rejected responses, 18 would have been in these groups. Accepted answers are counted in
the whole sample analysis, but not in the control group evaluations.
Table 1 – Sample descriptives
Total population Sample
Absolute Percentage Absolute Percentage
Gender Female 317 24 % 126 24 %
Male 1026 76 % 394 76 %
Age group 20-24 144 11 % 50 10 %
25-29 345 48 % 240 46 %
30-34 378 28 % 168 32 %
35-39 138 10 % 53 10 %
40-44 and 45- 38 3 % 9 2 %
Career path Professional 1259 94 % 447 86 %
Managerial 84 6 % 73 14 %
Tenure (years) Less than 1 217 42 %
1-2 134 26 %
2-3 84 16 %
4 or more 85 16 %
Other None 58 11 %
Employers 1-2 322 62 %
(companies) 3-5 124 24 %
6 or more 16 3 %
Total 1343 520
Rejected answers (not counted above) 37
The sample data was analyzed using Excel with the basic formulas included in the software such as
means, medians, modes and standard deviations. From time to time SPSS, a high caliber data
analysis tool, was used to calculate for example Cronbach’s Alpha13 value to test the internal
consistency of certain questions. Pivot table14 method was used to calculate difference in values
when one control variable was changed. The data originally retrieved from Webropol system was
13 Cronbach’s alpha estimates the proportion of the variance that is systematic. The alpha varies on a scale between 0 and 1 with a score of 0.70 or above is by convention an acceptable score that points toward internal consistency. 14 Data summarization tool found in major of spreadsheet tools.
28
in format of rows representing the answers one respondent had given and columns representing a
question. Questions were then coded, as seen in appendix A, with index numbers from Q1 to Q16.
These question numbers mostly represent the main themes in the survey and as an example Q6
had 8 questions inside of it. Some questions, reverse in nature were flipped around in order to be
able to calculate factors correctly. These questions are marked with R for reverse in the appendix
A.
3.2 Research validity and reliability
In general, research quality and trustworthiness are determined by the reliability and validity of
the research. Reliability consists of three parts: stability, internal reliability and inter-observer
reliability (Bryman & Bell, 2003). Stability refers to whether a measure is stable over time, internal
reliability refers to whether each respondent’s answers may be correlated and inter-observer
reliability refers to whether there is inconsistency of decision when more observers are present.
This study is not affected by inter-observer reliability as the research data was gathered through
internet survey system without an observer taking part in this event.
External validity can be achieved by using a theory base in research design (Yin, 2009). In this
study, the survey questions were composed partly based on themes used in recent research
(Kwantes, 2009; Van Herpen, Van Praag & Cools, 2005). Some theories and studies were used on
an ‘as is’ basis allowing comparison and ability to contrast against previously conducted studies
whereas others were modified to some extent using corporate culture as a filter. To allow data
triangulation in order for this research to address potential problems of constructs validity (Yin,
2009); multiple measures of the same phenomena were conducted.
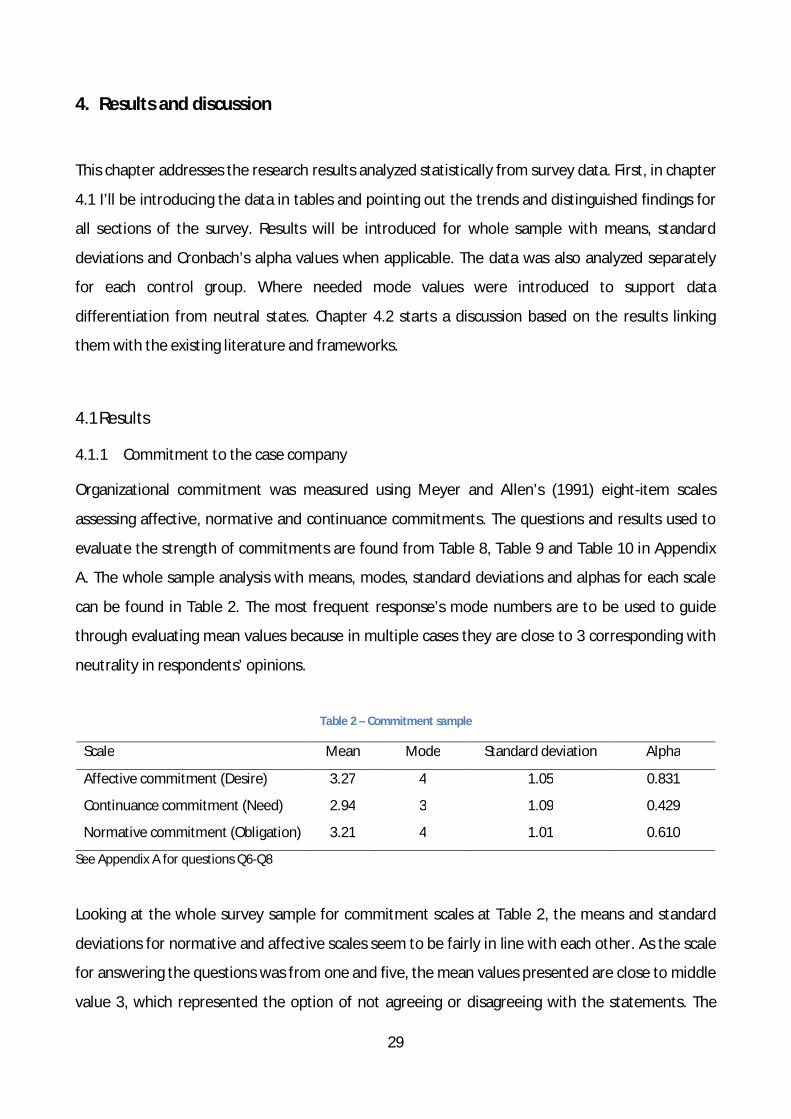
29
4. Results and discussion
This chapter addresses the research results analyzed statistically from survey data. First, in chapter
4.1 I’ll be introducing the data in tables and pointing out the trends and distinguished findings for
all sections of the survey. Results will be introduced for whole sample with means, standard
deviations and Cronbach’s alpha values when applicable. The data was also analyzed separately
for each control group. Where needed mode values were introduced to support data
differentiation from neutral states. Chapter 4.2 starts a discussion based on the results linking
them with the existing literature and frameworks.
4.1 Results
4.1.1 Commitment to the case company
Organizational commitment was measured using Meyer and Allen’s (1991) eight-item scales
assessing affective, normative and continuance commitments. The questions and results used to
evaluate the strength of commitments are found from Table 8, Table 9 and Table 10 in Appendix
A. The whole sample analysis with means, modes, standard deviations and alphas for each scale
can be found in Table 2. The most frequent response’s mode numbers are to be used to guide
through evaluating mean values because in multiple cases they are close to 3 corresponding with
neutrality in respondents’ opinions.
Table 2 – Commitment sample
Scale Mean Mode Standard deviation Alpha
Affective commitment (Desire) 3.27 4 1.05 0.831
Continuance commitment (Need) 2.94 3 1.09 0.429
Normative commitment (Obligation) 3.21 4 1.01 0.610
See Appendix A for questions Q6-Q8
Looking at the whole survey sample for commitment scales at Table 2, the means and standard
deviations for normative and affective scales seem to be fairly in line with each other. As the scale
for answering the questions was from one and five, the mean values presented are close to middle
value 3, which represented the option of not agreeing or disagreeing with the statements. The
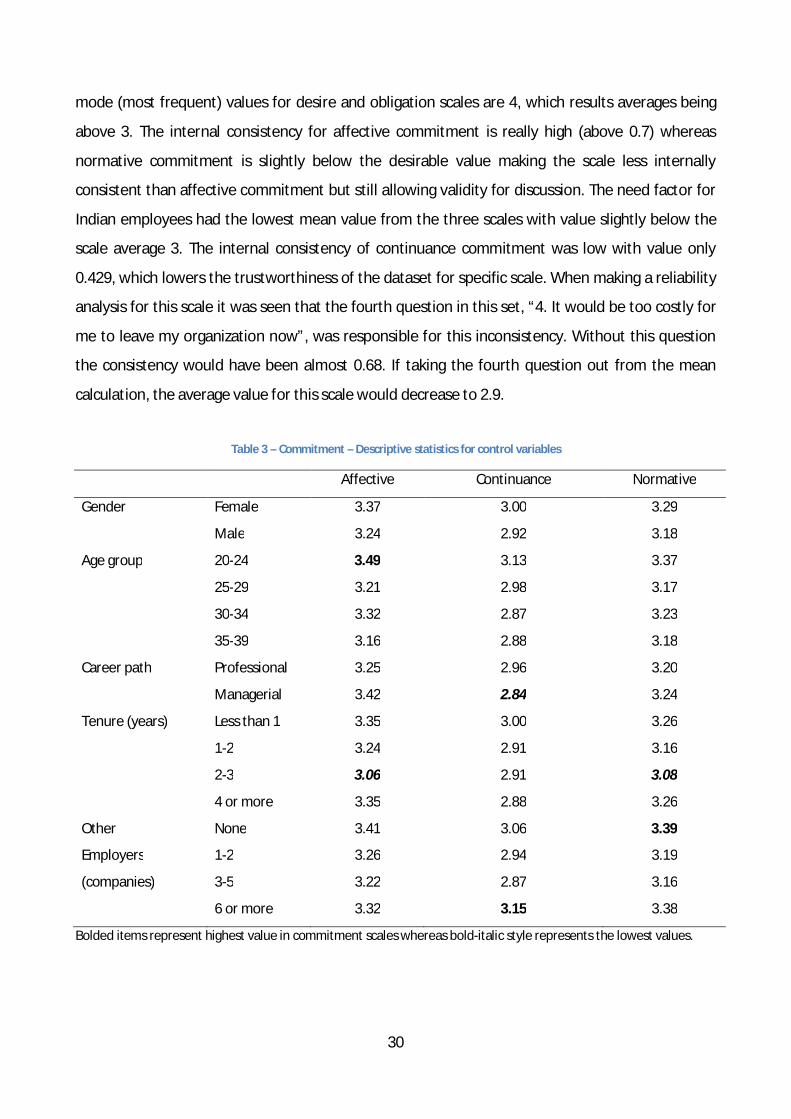
30
mode (most frequent) values for desire and obligation scales are 4, which results averages being
above 3. The internal consistency for affective commitment is really high (above 0.7) whereas
normative commitment is slightly below the desirable value making the scale less internally
consistent than affective commitment but still allowing validity for discussion. The need factor for
Indian employees had the lowest mean value from the three scales with value slightly below the
scale average 3. The internal consistency of continuance commitment was low with value only
0.429, which lowers the trustworthiness of the dataset for specific scale. When making a reliability
analysis for this scale it was seen that the fourth question in this set, “4. It would be too costly for
me to leave my organization now”, was responsible for this inconsistency. Without this question
the consistency would have been almost 0.68. If taking the fourth question out from the mean
calculation, the average value for this scale would decrease to 2.9.
Table 3 – Commitment – Descriptive statistics for control variables
Affective Continuance Normative
Gender Female 3.37 3.00 3.29
Male 3.24 2.92 3.18
Age group 20-24 3.49 3.13 3.37
25-29 3.21 2.98 3.17
30-34 3.32 2.87 3.23
35-39 3.16 2.88 3.18
Career path Professional 3.25 2.96 3.20
Managerial 3.42 2.84 3.24
Tenure (years) Less than 1 3.35 3.00 3.26
1-2 3.24 2.91 3.16
2-3 3.06 2.91 3.08
4 or more 3.35 2.88 3.26
Other None 3.41 3.06 3.39
Employers 1-2 3.26 2.94 3.19
(companies) 3-5 3.22 2.87 3.16
6 or more 3.32 3.15 3.38
Bolded items represent highest value in commitment scales whereas bold-italic style represents the lowest values.
31
The Table 3 shows the descriptive statistics divided into control variables, which can be compared
to Table 2 against mean values for the three scales. When taking a look at the values in Table 3
and other tables with control groups, it should be always remembered that the control groups are
different in sizes and should be evaluated against sample statistics data and in this case to Table 1.
For example the male group represents 76% of the whole sample and thus differs less from
average means than the female group because their weight for the overall mean is larger. Let’s
take the example of affective commitment where the mean for whole sample is 3.27 and mean
value for female respondents is 3.37. As the female group differs heavily from the mean for whole
sample it indicates that they have very different opinion on the scale in question. Other dominant
groups are professional career path recipients, people who have been working for the case
company less than a year and people who have had 1-2 other employees before joining the case
company.
Female respondents rated all three scales above the mean for the whole sample. As the
respondent’s age group and tenure length got larger, the amount of continuance commitment
decreased. The data shows that affective commitment is strongest among employees between
ages 20-24 whereas employees who have been working for the case company 2-3 years recorded
lowest results. People on the managerial paths rated high commitments with desire and obligation
scales but when it came to the scale of need, the value was lowest among all the control groups.
The highest continuance commitment can be found from the group representing people who have
worked for 6 or more companies within IT sector. Managers had the lowest need commitment to
the case company. People who have been working for the case company for 2-3 years had the
lowest value for normative commitment and, on the other hand, people who have just started
their career at the case company felt that they obligated toward organization as seen from Table
3.
4.1.2 Total rewarding and motivation
Table 4 represents the results from evaluating the current compensation system and motivation
(Q9 in Table 11, Appendix A). This section in the questionnaire was used to measure the
perceptions of the compensation system in the case company. These perceptions include
transparency, fairness, controllability, extrinsic and intrinsic motivation, work satisfaction,
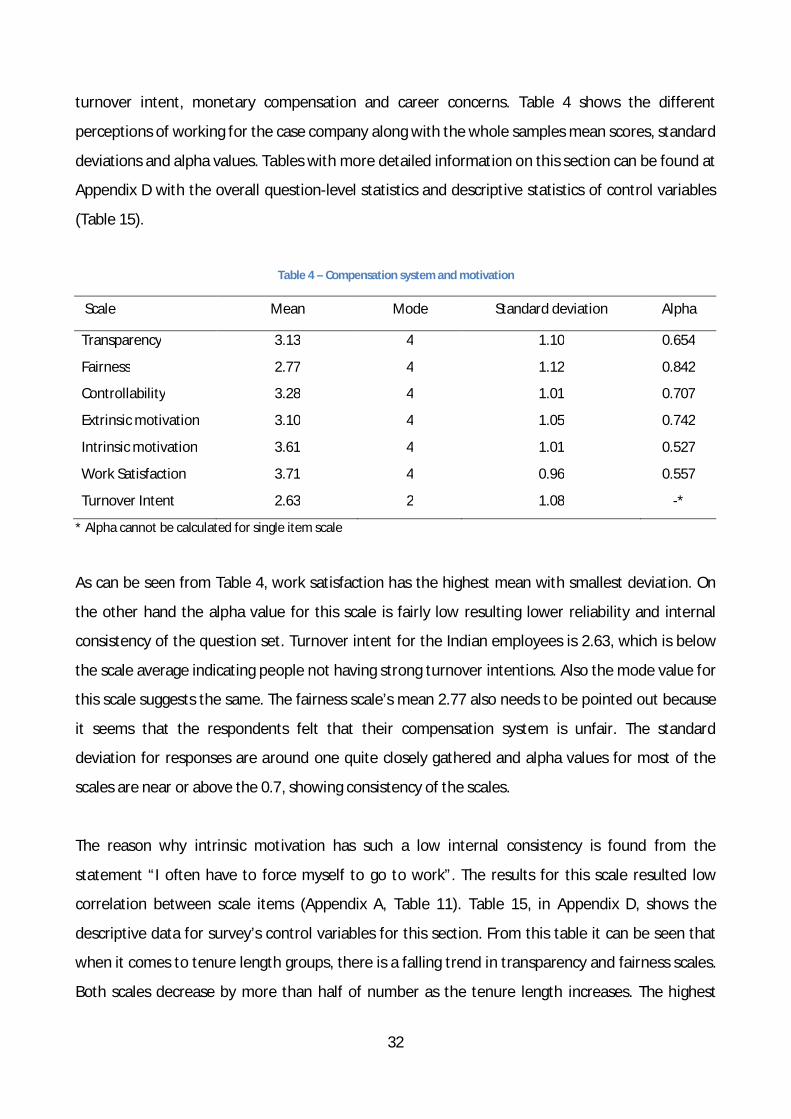
32
turnover intent, monetary compensation and career concerns. Table 4 shows the different
perceptions of working for the case company along with the whole samples mean scores, standard
deviations and alpha values. Tables with more detailed information on this section can be found at
Appendix D with the overall question-level statistics and descriptive statistics of control variables
(Table 15).
Table 4 – Compensation system and motivation
Scale Mean Mode Standard deviation Alpha
Transparency 3.13 4 1.10 0.654
Fairness 2.77 4 1.12 0.842
Controllability 3.28 4 1.01 0.707
Extrinsic motivation 3.10 4 1.05 0.742
Intrinsic motivation 3.61 4 1.01 0.527
Work Satisfaction 3.71 4 0.96 0.557
Turnover Intent 2.63 2 1.08 -*
* Alpha cannot be calculated for single item scale
As can be seen from Table 4, work satisfaction has the highest mean with smallest deviation. On
the other hand the alpha value for this scale is fairly low resulting lower reliability and internal
consistency of the question set. Turnover intent for the Indian employees is 2.63, which is below
the scale average indicating people not having strong turnover intentions. Also the mode value for
this scale suggests the same. The fairness scale’s mean 2.77 also needs to be pointed out because
it seems that the respondents felt that their compensation system is unfair. The standard
deviation for responses are around one quite closely gathered and alpha values for most of the
scales are near or above the 0.7, showing consistency of the scales.
The reason why intrinsic motivation has such a low internal consistency is found from the
statement “I often have to force myself to go to work”. The results for this scale resulted low
correlation between scale items (Appendix A, Table 11). Table 15, in Appendix D, shows the
descriptive data for survey’s control variables for this section. From this table it can be seen that
when it comes to tenure length groups, there is a falling trend in transparency and fairness scales.
Both scales decrease by more than half of number as the tenure length increases. The highest
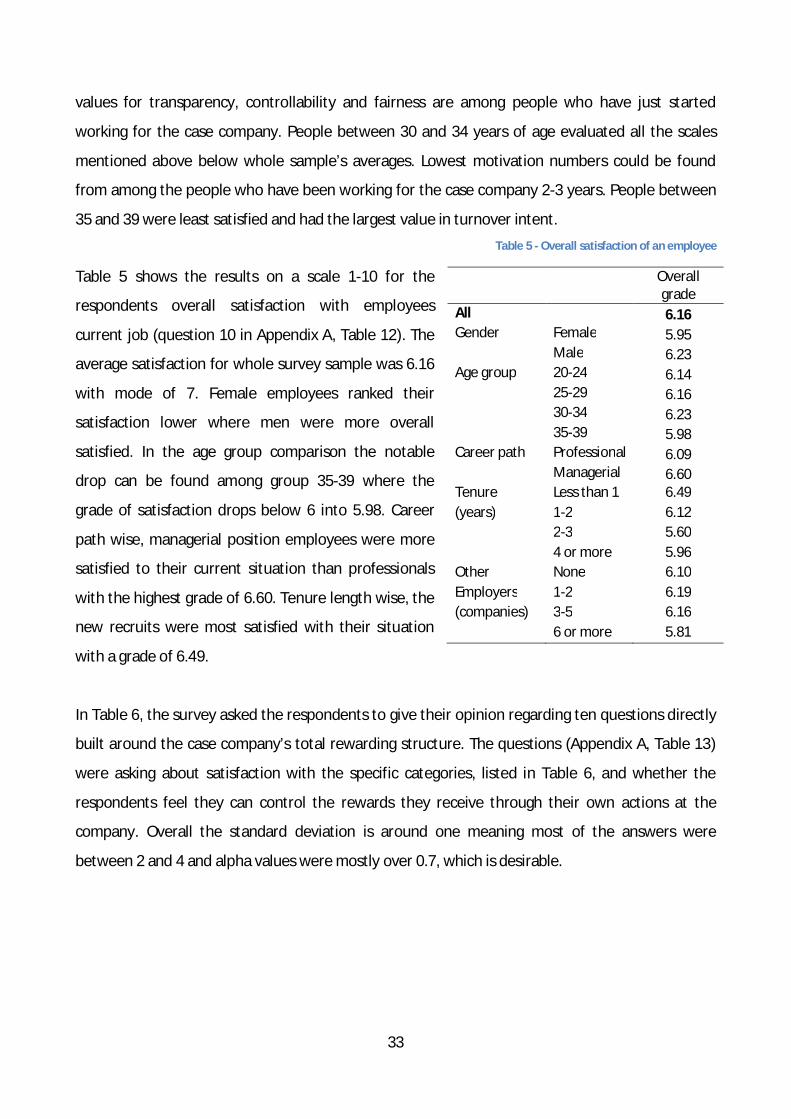
33
values for transparency, controllability and fairness are among people who have just started
working for the case company. People between 30 and 34 years of age evaluated all the scales
mentioned above below whole sample’s averages. Lowest motivation numbers could be found
from among the people who have been working for the case company 2-3 years. People between
35 and 39 were least satisfied and had the largest value in turnover intent. Table 5 - Overall satisfaction of an employee
Table 5 shows the results on a scale 1-10 for the
respondents overall satisfaction with employees
current job (question 10 in Appendix A, Table 12). The
average satisfaction for whole survey sample was 6.16
with mode of 7. Female employees ranked their
satisfaction lower where men were more overall
satisfied. In the age group comparison the notable
drop can be found among group 35-39 where the
grade of satisfaction drops below 6 into 5.98. Career
path wise, managerial position employees were more
satisfied to their current situation than professionals
with the highest grade of 6.60. Tenure length wise, the
new recruits were most satisfied with their situation
with a grade of 6.49.
In Table 6, the survey asked the respondents to give their opinion regarding ten questions directly
built around the case company’s total rewarding structure. The questions (Appendix A, Table 13)
were asking about satisfaction with the specific categories, listed in Table 6, and whether the
respondents feel they can control the rewards they receive through their own actions at the
company. Overall the standard deviation is around one meaning most of the answers were
between 2 and 4 and alpha values were mostly over 0.7, which is desirable.
Overall grade
All 6.16 Gender Female 5.95 Male 6.23 Age group 20-24 6.14 25-29 6.16 30-34 6.23 35-39 5.98 Career path Professional 6.09 Managerial 6.60 Tenure Less than 1 6.49 (years) 1-2 6.12 2-3 5.60 4 or more 5.96 Other None 6.10 Employers 1-2 6.19 (companies) 3-5 6.16 6 or more 5.81
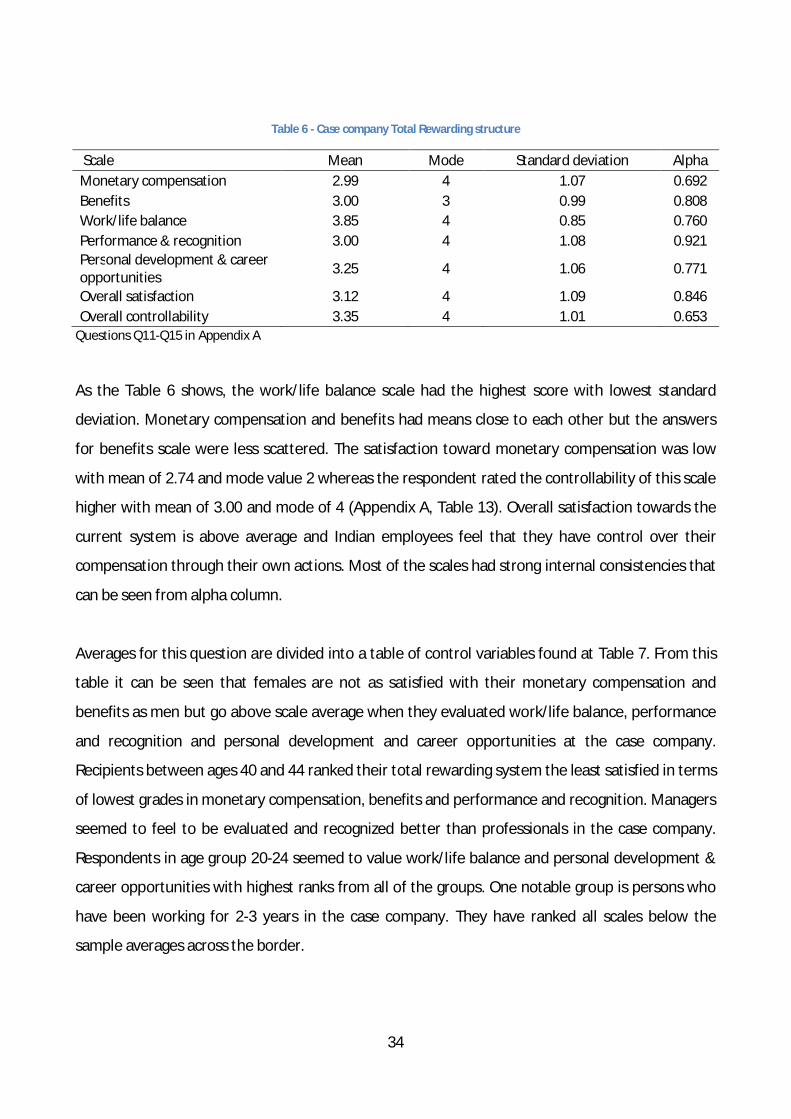
34
Table 6 - Case company Total Rewarding structure
Scale Mean Mode Standard deviation Alpha Monetary compensation 2.99 4 1.07 0.692 Benefits 3.00 3 0.99 0.808 Work/life balance 3.85 4 0.85 0.760 Performance & recognition 3.00 4 1.08 0.921 Personal development & career opportunities 3.25 4 1.06 0.771
Overall satisfaction 3.12 4 1.09 0.846 Overall controllability 3.35 4 1.01 0.653
Questions Q11-Q15 in Appendix A
As the Table 6 shows, the work/life balance scale had the highest score with lowest standard
deviation. Monetary compensation and benefits had means close to each other but the answers
for benefits scale were less scattered. The satisfaction toward monetary compensation was low
with mean of 2.74 and mode value 2 whereas the respondent rated the controllability of this scale
higher with mean of 3.00 and mode of 4 (Appendix A, Table 13). Overall satisfaction towards the
current system is above average and Indian employees feel that they have control over their
compensation through their own actions. Most of the scales had strong internal consistencies that
can be seen from alpha column.
Averages for this question are divided into a table of control variables found at Table 7. From this
table it can be seen that females are not as satisfied with their monetary compensation and
benefits as men but go above scale average when they evaluated work/life balance, performance
and recognition and personal development and career opportunities at the case company.
Recipients between ages 40 and 44 ranked their total rewarding system the least satisfied in terms
of lowest grades in monetary compensation, benefits and performance and recognition. Managers
seemed to feel to be evaluated and recognized better than professionals in the case company.
Respondents in age group 20-24 seemed to value work/life balance and personal development &
career opportunities with highest ranks from all of the groups. One notable group is persons who
have been working for 2-3 years in the case company. They have ranked all scales below the
sample averages across the border.
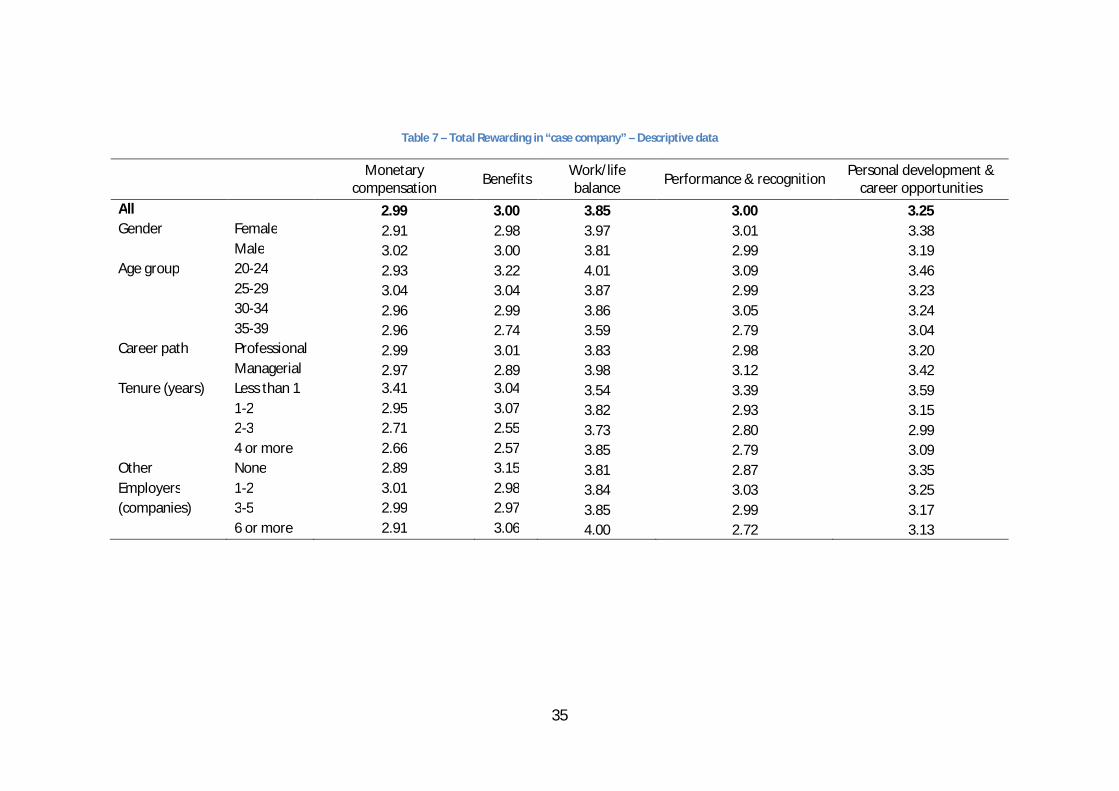
35
Table 7 – Total Rewarding in “case company” – Descriptive data
Monetary compensation Benefits Work/life
balance Performance & recognition Personal development & career opportunities
All 2.99 3.00 3.85 3.00 3.25 Gender Female 2.91 2.98 3.97 3.01 3.38 Male 3.02 3.00 3.81 2.99 3.19 Age group 20-24 2.93 3.22 4.01 3.09 3.46 25-29 3.04 3.04 3.87 2.99 3.23 30-34 2.96 2.99 3.86 3.05 3.24 35-39 2.96 2.74 3.59 2.79 3.04 Career path Professional 2.99 3.01 3.83 2.98 3.20 Managerial 2.97 2.89 3.98 3.12 3.42 Tenure (years) Less than 1 3.41 3.04 3.54 3.39 3.59 1-2 2.95 3.07 3.82 2.93 3.15 2-3 2.71 2.55 3.73 2.80 2.99 4 or more 2.66 2.57 3.85 2.79 3.09 Other None 2.89 3.15 3.81 2.87 3.35 Employers 1-2 3.01 2.98 3.84 3.03 3.25 (companies) 3-5 2.99 2.97 3.85 2.99 3.17 6 or more 2.91 3.06 4.00 2.72 3.13
36
The last section of survey asked the respondents to evaluate what factors they value most working
for the case company, found at Table 16 (Appendix E). The top four factors includes work/life
balance, with 84% of all respondents choosing this option, personal development, clear goals and
responsibilities and good managers. The table also reveals that work/life balance is not as valued
by young newcomers as it’s to employees with 2-3 years of tenure behind them. Right after good
manager’s factor come equal opportunities for the whole sample. Salary is ranked to be sixth
valued of the factors in the list. There is no large difference between the genders except male
employees rank the salary factor higher than female employees. Equal opportunities and good
managers were most valued among young employees as where salary was not as highly valued by
the young respondents as when the respondent age was 25 or higher.
4.2 Discussion
In this section I’ll discuss the findings based on the results from section 4.1. As some of the
findings overlap they are discussed side-by-side, first as a whole sample and then in control
groups. This division is made to create overall image of the employees’ views and attitudes toward
engagement, motivation and compensation system and how the control groups differ from each
other and the whole sample.
4.2.1 Whole survey sample
It seemed, that overall the respondents avoided using extreme values from the five possibilities
they were usually offered. I infer that this was based on cultural phenomena or perhaps conflict
avoidance by an employee not wanting to be too strongly against the organization as the literature
suggests can occur. The reason for not getting the strongest grades from questions is probably a
result of employees not being totally happy with their employment, as they often aren’t. This
created a minor difficulty when data was analyzed to estimate the degree of agreement toward
factors between two or more groups. Another reason for this avoidance of extreme values might
be found from the fact that the respondents felt filling the survey to be a compulsory action. The
survey completion was done after it was initiated from management. This sense of obligation
could have resulted people filling in neutral answers just to get it done. A fairly large portion of
responses, 28%, given to questions Q6-Q9 and Q11-Q15 were ‘neither agree nor disagree’. I can
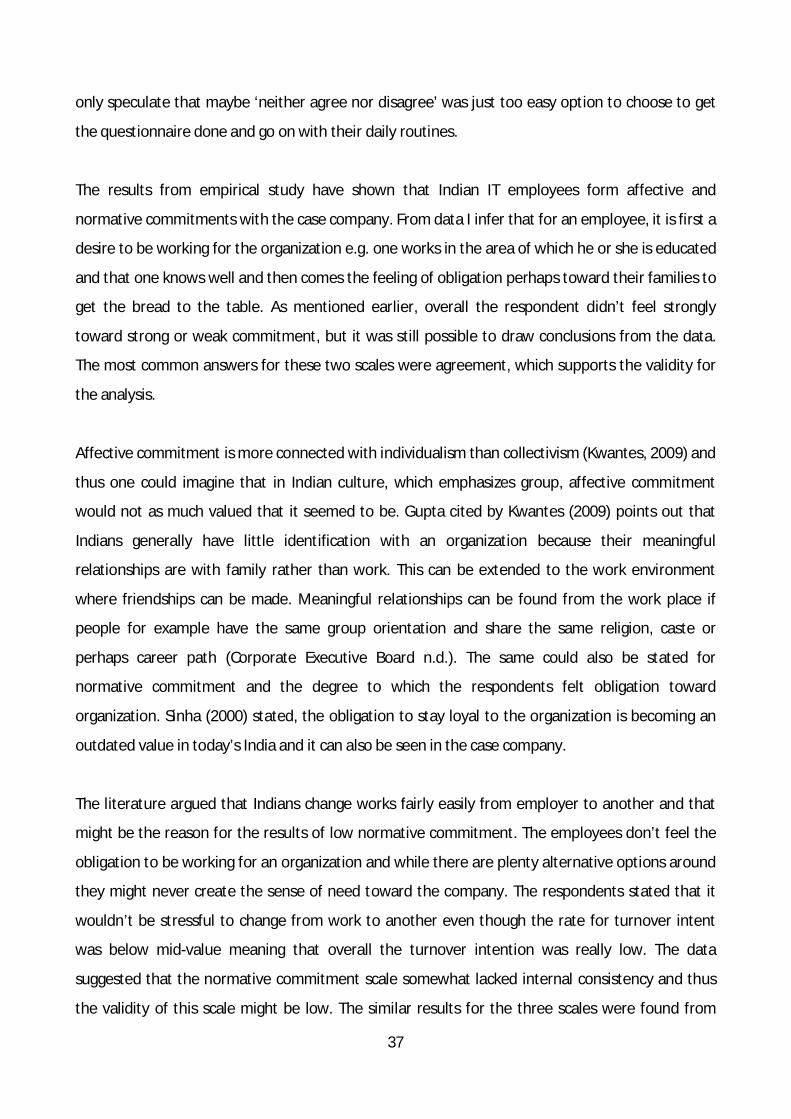
37
only speculate that maybe ‘neither agree nor disagree’ was just too easy option to choose to get
the questionnaire done and go on with their daily routines.
The results from empirical study have shown that Indian IT employees form affective and
normative commitments with the case company. From data I infer that for an employee, it is first a
desire to be working for the organization e.g. one works in the area of which he or she is educated
and that one knows well and then comes the feeling of obligation perhaps toward their families to
get the bread to the table. As mentioned earlier, overall the respondent didn’t feel strongly
toward strong or weak commitment, but it was still possible to draw conclusions from the data.
The most common answers for these two scales were agreement, which supports the validity for
the analysis.
Affective commitment is more connected with individualism than collectivism (Kwantes, 2009) and
thus one could imagine that in Indian culture, which emphasizes group, affective commitment
would not as much valued that it seemed to be. Gupta cited by Kwantes (2009) points out that
Indians generally have little identification with an organization because their meaningful
relationships are with family rather than work. This can be extended to the work environment
where friendships can be made. Meaningful relationships can be found from the work place if
people for example have the same group orientation and share the same religion, caste or
perhaps career path (Corporate Executive Board n.d.). The same could also be stated for
normative commitment and the degree to which the respondents felt obligation toward
organization. Sinha (2000) stated, the obligation to stay loyal to the organization is becoming an
outdated value in today’s India and it can also be seen in the case company.
The literature argued that Indians change works fairly easily from employer to another and that
might be the reason for the results of low normative commitment. The employees don’t feel the
obligation to be working for an organization and while there are plenty alternative options around
they might never create the sense of need toward the company. The respondents stated that it
wouldn’t be stressful to change from work to another even though the rate for turnover intent
was below mid-value meaning that overall the turnover intention was really low. The data
suggested that the normative commitment scale somewhat lacked internal consistency and thus
the validity of this scale might be low. The similar results for the three scales were found from
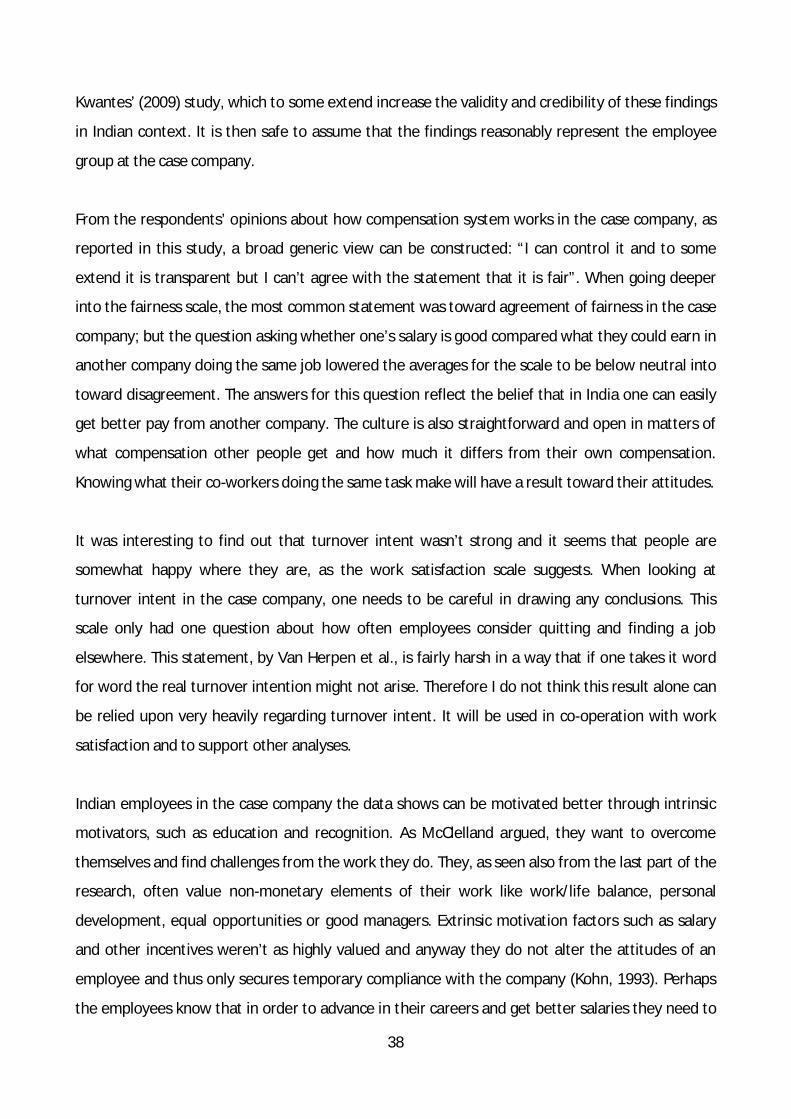
38
Kwantes’ (2009) study, which to some extend increase the validity and credibility of these findings
in Indian context. It is then safe to assume that the findings reasonably represent the employee
group at the case company.
From the respondents’ opinions about how compensation system works in the case company, as
reported in this study, a broad generic view can be constructed: “I can control it and to some
extend it is transparent but I can’t agree with the statement that it is fair”. When going deeper
into the fairness scale, the most common statement was toward agreement of fairness in the case
company; but the question asking whether one’s salary is good compared what they could earn in
another company doing the same job lowered the averages for the scale to be below neutral into
toward disagreement. The answers for this question reflect the belief that in India one can easily
get better pay from another company. The culture is also straightforward and open in matters of
what compensation other people get and how much it differs from their own compensation.
Knowing what their co-workers doing the same task make will have a result toward their attitudes.
It was interesting to find out that turnover intent wasn’t strong and it seems that people are
somewhat happy where they are, as the work satisfaction scale suggests. When looking at
turnover intent in the case company, one needs to be careful in drawing any conclusions. This
scale only had one question about how often employees consider quitting and finding a job
elsewhere. This statement, by Van Herpen et al., is fairly harsh in a way that if one takes it word
for word the real turnover intention might not arise. Therefore I do not think this result alone can
be relied upon very heavily regarding turnover intent. It will be used in co-operation with work
satisfaction and to support other analyses.
Indian employees in the case company the data shows can be motivated better through intrinsic
motivators, such as education and recognition. As McClelland argued, they want to overcome
themselves and find challenges from the work they do. They, as seen also from the last part of the
research, often value non-monetary elements of their work like work/life balance, personal
development, equal opportunities or good managers. Extrinsic motivation factors such as salary
and other incentives weren’t as highly valued and anyway they do not alter the attitudes of an
employee and thus only secures temporary compliance with the company (Kohn, 1993). Perhaps
the employees know that in order to advance in their careers and get better salaries they need to
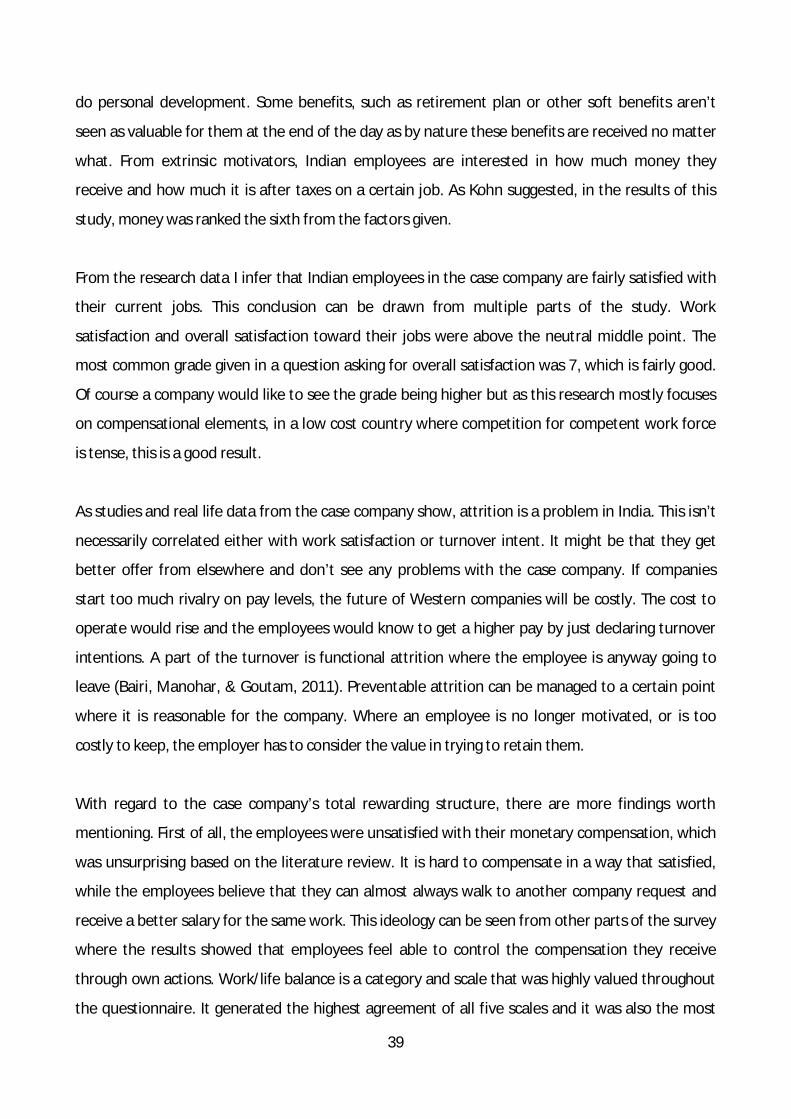
39
do personal development. Some benefits, such as retirement plan or other soft benefits aren’t
seen as valuable for them at the end of the day as by nature these benefits are received no matter
what. From extrinsic motivators, Indian employees are interested in how much money they
receive and how much it is after taxes on a certain job. As Kohn suggested, in the results of this
study, money was ranked the sixth from the factors given.
From the research data I infer that Indian employees in the case company are fairly satisfied with
their current jobs. This conclusion can be drawn from multiple parts of the study. Work
satisfaction and overall satisfaction toward their jobs were above the neutral middle point. The
most common grade given in a question asking for overall satisfaction was 7, which is fairly good.
Of course a company would like to see the grade being higher but as this research mostly focuses
on compensational elements, in a low cost country where competition for competent work force
is tense, this is a good result.
As studies and real life data from the case company show, attrition is a problem in India. This isn’t
necessarily correlated either with work satisfaction or turnover intent. It might be that they get
better offer from elsewhere and don’t see any problems with the case company. If companies
start too much rivalry on pay levels, the future of Western companies will be costly. The cost to
operate would rise and the employees would know to get a higher pay by just declaring turnover
intentions. A part of the turnover is functional attrition where the employee is anyway going to
leave (Bairi, Manohar, & Goutam, 2011). Preventable attrition can be managed to a certain point
where it is reasonable for the company. Where an employee is no longer motivated, or is too
costly to keep, the employer has to consider the value in trying to retain them.
With regard to the case company’s total rewarding structure, there are more findings worth
mentioning. First of all, the employees were unsatisfied with their monetary compensation, which
was unsurprising based on the literature review. It is hard to compensate in a way that satisfied,
while the employees believe that they can almost always walk to another company request and
receive a better salary for the same work. This ideology can be seen from other parts of the survey
where the results showed that employees feel able to control the compensation they receive
through own actions. Work/life balance is a category and scale that was highly valued throughout
the questionnaire. It generated the highest agreement of all five scales and it was also the most
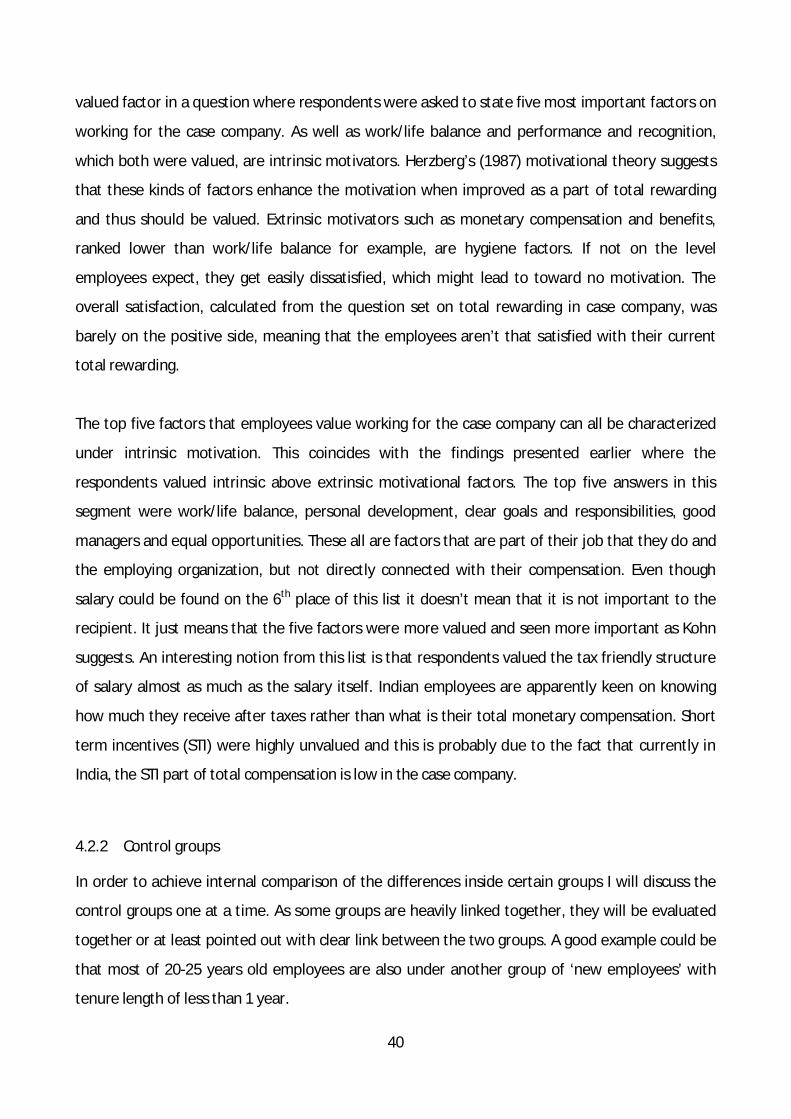
40
valued factor in a question where respondents were asked to state five most important factors on
working for the case company. As well as work/life balance and performance and recognition,
which both were valued, are intrinsic motivators. Herzberg’s (1987) motivational theory suggests
that these kinds of factors enhance the motivation when improved as a part of total rewarding
and thus should be valued. Extrinsic motivators such as monetary compensation and benefits,
ranked lower than work/life balance for example, are hygiene factors. If not on the level
employees expect, they get easily dissatisfied, which might lead to toward no motivation. The
overall satisfaction, calculated from the question set on total rewarding in case company, was
barely on the positive side, meaning that the employees aren’t that satisfied with their current
total rewarding.
The top five factors that employees value working for the case company can all be characterized
under intrinsic motivation. This coincides with the findings presented earlier where the
respondents valued intrinsic above extrinsic motivational factors. The top five answers in this
segment were work/life balance, personal development, clear goals and responsibilities, good
managers and equal opportunities. These all are factors that are part of their job that they do and
the employing organization, but not directly connected with their compensation. Even though
salary could be found on the 6th place of this list it doesn’t mean that it is not important to the
recipient. It just means that the five factors were more valued and seen more important as Kohn
suggests. An interesting notion from this list is that respondents valued the tax friendly structure
of salary almost as much as the salary itself. Indian employees are apparently keen on knowing
how much they receive after taxes rather than what is their total monetary compensation. Short
term incentives (STI) were highly unvalued and this is probably due to the fact that currently in
India, the STI part of total compensation is low in the case company.
4.2.2 Control groups
In order to achieve internal comparison of the differences inside certain groups I will discuss the
control groups one at a time. As some groups are heavily linked together, they will be evaluated
together or at least pointed out with clear link between the two groups. A good example could be
that most of 20-25 years old employees are also under another group of ‘new employees’ with
tenure length of less than 1 year.
41
Men vs. female
Women seemed to generate stronger commitments with the company than men for all three
scales. As the sample of female employees is considerably smaller in number, the difference
contrasted strongly from the results. In India, the societal differences are big when it comes to
class hierarchy but also to gender. As India has implemented fairly strong gender equality laws
(which I am not going to cover in this research) the reason for this difference isn’t necessarily in
the inequality in the work place. One factor that could explain this is found from how the Indian
culture works. The family decides what is good for you or can a women work at all: should one be
home taking care of the children, elderly parents perhaps and house for example. Another reason
for high commitment levels could be due to the fact that 70% of women have been working for
the case company less than two years. The data suggested that employees with shorter career
lengths are more committed toward the organization than others who have been in the same
company for longer period of time.
Even though the commitment scales were stronger among female employees and the turnover
intent was lower compared to men, the overall satisfaction toward their job was considerably
weaker. Overall men felt more in control with their compensation than women. I infer that this
also links to culture in few ways. Men, as it is expected for males, want to argue to be in charge of
their own performance and compensation. Women might be more modest in demanding
assignments or educational opportunities than men. Female employees also rated their monetary
compensation and benefits factors to be in a worse situation than their men co-workers, which
indicates either they are more poorly compensated than men or they expect bigger salaries and
benefits for the work they do. Men respondents as a group felt that their performance and
recognition and personal development and career opportunities are worse than what women
rated these scales. Men also argued that the salary and the tax friendly structure of salaries in the
case company are valued well, whereas the women tended to state that personal development,
internal job rotation and good managers are the valued factors for them in working for the case
company.
42
Age groups
Near 75% of employees are between the ages of 20 to 24 and have been working for the case
company less than a year. From this same age segment, 64% have never had another job before
joining the organization. They do not have that strong experience and contrast point from
elsewhere. Also the next age group 25-29 consists of almost 80% of employees who have been
working less than two years for the case company and over 80% have been working for 2 or less
companies before joining them. These two groups cover over 50% of respondents. In plain words
this means that these two groups are the majority of respondents and their responses have weight
on other control groups.
From the data I infer that at the early age of their careers people feel good about their
employment and are committed to their organization. They are enthusiastic about their first jobs,
are receiving adequate salary and being able to interact with other professionals in the case
company. From all control groups the youngest group of employees between “20-24” had the
highest affective commitment. Also the need and obligation factors are strong and this is probably
due to some kind of emotional attachment they generated with the organization. This coincides
with Maslow’s theory. The young and new employees are going to work to fulfill their basic
physiological and safety needs in order to have a house and food on the table. As overall the cost
of living and housing is high in India, young employees feel the need to be working to cover the
expenses. The organization also gives them the feel of belonging to a group outside a family,
which is nowadays a bit more valued than before. As India is fairly poor country and the societal
differences are big, the work gives a young employee feel of self-esteem that they have made
something out of themselves. It was also eminent that they are highly motivated toward their
work and both extrinsic and intrinsic motivations were strong.
Bairi et al. (2011) argue that in today’s world, young employees are keener on getting big money
on the early ages of their careers. It was seen that young employees were more unsatisfied with
their monetary compensation but had a feeling that benefits they received were good. When they
were to choose factors they value working for the case company, non-monetary factors were
chosen over salary indicating that they currently feel that there are possibilities to grow in the
company but salary they receive seemed not to be valued.
43
As the age got higher the need toward organization decreased. Also as the employee got older,
the lengths of tenures are starting to be longer and the employees are aware of their own value in
the work markets and organization they work for. Overall the lowest commitments from the age
groups could be found from respondents between ages “35-39”. They also recorded lowest work
satisfaction and highest turnover intent. Their motivational aspects were also record low, which in
my opinion means that they do not feel the need to belong to the organization because they are
perhaps compensated in a way that doesn’t necessarily motivate them. It might be that there
aren’t any more career advancement possibilities for them and thus the salary only increases
annually by certain amount. Corporate Executive Board (year) stated that in India seniority is
valued and thus they might have fairly strong position inside the company. From Maslow’s
perspective it might be that the job fulfills the basic needs but does not rise to the level of self-
actualization anymore.
The youngest employee group rated personal development and career opportunities and work/life
balance to be in good shape at the case company. Contrary to what one would expect, the
work/life balance wasn’t seen as important to them as it was to other groups when asking what
factors they valued in working for the case company. The group of oldest employees rated all of
the case company’s total rewarding areas below averages and work/life balance was rated as the
weakest of them all. Perhaps at a later age an employee starts feeling that things aren’t that good
and work/life balance, as a concept is not overall valued. Here I have talked about some of the
contrasts between youngest and oldest employee groups but there is one more factor strongly
connected with the age that is important to discuss. That is the value for clear goals and
responsibilities lowers, as the employee gets older. I infer that this is due to the less need of
supervision and guidance in the beginning of career. As one matures their knowledge enhances
and they also enjoy working on their own between given boundaries from supervisors. Also some
of the older employees are in the managerial position where they are the ones to set goals and
responsibilities to others and their work is less controlled by their superiors.
To conclude this control group I would still like to point out one anomaly found from the data. The
group of people between “30-34” gave the highest grade of the overall satisfaction toward their
job and they valued company paid medical insurance above other groups. Perhaps in that age,
they have started to pay more attention to their health or they have might have young children

44
and they want to be there to take care of them when sick. Somehow it seemed that people
changed to be more cynical in a way as they got older. They have seen more employers and know
what their value is. It is harder for the company to match these needs while trying to keep costs
low.
Managers versus professionals
Professionals seem to have stronger need commitment with the organization than managers. The
apparent uncertainly among professionals seems to dissolve when one changes to a managerial
position. Managerial position probably gives an employee more salary, higher rank and more
possibilities at the job markets. Comparing these two groups, professional career path employees
are keener on extrinsic motivators, thus money and other monetary benefits, whereas managerial
employees had high turnover intent and low work satisfaction toward the compensation system.
Perhaps managerial position employees feel that they are so much valuable toward the company
that wouldn’t get fired and could easily get a new job in another company. Managers overall
satisfaction toward the job they do was higher than any other group within other control groups.
Overall they are highly satisfied but when it comes to compensation system the satisfaction
declines. Beside satisfaction the managers felt that the compensation system is transparent and
they can control it. Probably due to the fact that they are experts in understanding how the
compensation system works, as they should be the ones to explain it in the organization to their
subordinates.
When it came to total rewarding structure at the case company, managers rated higher than
professionals’ work/life balance, performance and recognition and personal development and
career opportunities. I infer that the managers get better opportunities to advance with their
career and develop themselves even further. The factors managers valued can be characterized
under intrinsic motivation. Salary and the flexibility of salary options were items rated lower by
managers than by professional employee group. Professional respondents rated higher clear goals
and responsibilities, which are clearly connected with their work and how to get it done.
Overall the comparison between manager and professional career path employees is hard since
professionals cover 86% of the responses received. Their effect toward the whole sample averages
is very large. Professional career path employees are more concerned about issues related to their
45
work but have a fairly strong side to extrinsic factors such as salary. Managers seem to be more
confident about their employment and enjoy the intrinsic opportunities gotten through personal
development and career advancements.
Tenure length
To some extent this control group follows the progress and changes that aging had for the scales
investigated earlier. When taking a broad perspective, people with less than a year of tenure in
the case company are more committed and satisfied with the organization, just like young
employees. We can imagine that for these people “everything is new” and they are hyped about
our new job situation. This group also saw the compensation system to be highly fair, transparent
and something they can control though their own actions. A sudden change in view was when
tenure length increased from one to two years. The level of commitment decreased same as the
perceived factors of compensation system.
The grade for overall satisfaction toward their jobs is in decline when tenures got longer. This
satisfaction decreased to all the way up till to the group of people working 4 or more years.
Suddenly the satisfaction started to rise back up. I infer that when an employee starts their
employment with the case company they are put to a job where they are satisfied with the
situation. From one to 3 years they believe they should be put to other jobs that would enhance
their professional development and thus they could advance in their careers. Perhaps the daily
reality wasn’t what they expected. The people who have been working more than 4 years are
again in a situation where they have flexibility when it comes to their own work, which was
indicated by this group ranking higher the factors which measured what employees’ value in the
case company.
Previous companies within the industry
As mentioned earlier, the group consisting of employees with no previous experience from the IT
industry is mostly of people with age of 20-29 and their tenure length is less than a year. Their
commitment to the company is stronger than with people who have had multiple previous
employers. They are less likely to change their companies and feel that they can control their
compensation. People with no other companies before joining the case company, feel that the
monetary compensation they receive is low, which is odd since they don’t really have anything

46
with which to compare. Perhaps they feel that they should be getting lot more from the start,
which would then go along with Bairi et al. (2011) statement of young and new talent wants
money and fast. They grade their job satisfaction lower than people with 1-2 other previous
employers. This can be due to the fact that after gaining experience from other employers, the
employee knows where one wants to move when the time to change a company comes. This way
they can have some influence on the job where they are specially recruited.
People with 3-5 previous companies felt that their intrinsic and extrinsic motivation is low. They
felt the job in hand wasn’t motivating them but an interesting fact could be found from the group
of 6 or more previous companies who felt that their motivation was high, above average. This
same group also felt that the work/life balance in the case company works well but their
performance was badly evaluated and recognized and they weren’t developed, as they would see
fit.
Now I have discussed the results first as whole survey sample, setting a start point for analysis, and
then splitting it into smaller control groups and linking with literature. There have been many
interesting indications that have arisen from the research data. During the next section I’ll make
conclusions on what has been studied and recommendations to the case company and lay out
some suggestions for further research.
47
5. Conclusions
In this final chapter, the main conclusions of this study are presented. The second part will be
highlighting my recommendations for the case company based on findings that I feel are
important for the case company in rewarding employees in India. In the last part I’ll have a short
discussion on what type of future research could be made.
5.1 Key findings
This study researched Indian employees of Finnish multinational IT Company and their perceptions
toward compensation systems, motivation and the type of commitment they have toward the
organization. The findings were evaluated against previous studies when applicable. The sample of
520 responses gave a good insight to the employee attitudes and feelings in the case company
India. The responses were also divided into control groups for further analysis. The analysis
highlighted the current situation in the case company and from that analysis the
recommendations to the case company are drawn.
The base for this research was to find the type of motivation that motivates an employee and how
they can be engaged better to their organization. To achieve this goal a survey was sent out to get
an insight on the type of commitment people create with the case company, how they see their
compensation system working from multiple different angles, type of motivation present, how
satisfied employees are with their work and what factors they value working for the case
company.
The Indian IT employees feel the desire to be part of the organization and thus can be seen to
value more intrinsic motivational factors. It was evident in the research that Indian employees
were overall unhappy with their monetary compensation, but as monetary compensation only
generates temporary compliance the engagement is and should be created through intrinsic
motivational factors. Among others, these non-monetary benefits include work/life balance and
personal development and career opportunities. It still doesn’t mean that salary compensation
wouldn’t be important for them. Since the markets highly favor employees, they are aware that
fairly easily they could leave the company to another and perhaps get better pay. A company
needs to pay employees adequate salaries so that salary won’t become a too strong push force
48
away from the company. The employees have a feel of control over their compensation and
believe that they can affect it through their own actions, which should be taken into account when
developing a suitable total rewarding model in India.
From a gender perspective, female employees were more contexts oriented in their work lives.
They were committed but not satisfied. They felt that monetary compensation wasn’t what they
expected from their job and currently in their work they valued more personal development
possibilities. Male employees on the other hand were keener on having better personal
development and career advancement possibilities. This being said and the fact that male
employees were less committed to the organization, there is a feeling that they want to enhance
their knowledge and employee value at the work place and perhaps then being eligible to pursue
new career opportunities within or outside the organization.
Young people valued non-monetary benefits in the case company. They felt that the
compensation wasn’t at the level where it should have been, which suggests the fact that they aim
for fast advancement in their careers toward bigger salaries. From non-monetary ingredients work
related factors, such as equal opportunities, good managers and personal development, were
highly appreciated. I infer that as they give their best effort to the company they also want more
back from the company. The work satisfaction decreased as age or tenure length got bigger. This is
an indication of that as the employees get older and has been longer in the organization they
would expect something more from it. The degree of need toward the organization also decreased
while age and tenure got bigger indicating that they are more independent from the case
company than young people. They can choose where to work and the work is not something one
is dependent on.
The group of people between ages 35-39 seemed to be most unhappy with their situation at the
case company. First of all, they had really low desire, need and obligation commitments to the
organization and they were most unsatisfied with their jobs and had largest turnover intentions.
Both intrinsic and extrinsic motivation was low and they thought the compensation system wasn’t
really doing it for them as it should be. They were unhappy, unmotivated and unengaged
employee group.
49
Managers were sure about their jobs and their position in the case company. They felt to be in
control of their careers and felt that they had possibilities within it. Still they recorded low work
satisfaction and high turnover intent factors. They don’t worry about their jobs, but are more likely
to quit and change to another organization in the future. They have usually been working for the
case company longer than others since they have advanced into a managerial level. Professionals
felt that their advancement and development possibilities were limited and were concerned with
issues related to the work itself.
To conclude, it is right to say that the case company operates and tackles the same kind of issues
as other Western companies in India described by Riski (2005). The employees are engaged to
their jobs similarly and are interested in similar issues that Kwantes (2009) suggests. The salary
isn’t something that a company should use to compete for employees, rather they should offer
interesting jobs and emphasize the benefits in total rewarding. The study created a good window
to see what different employee groups think about the current situation. In the next section I’ll be
making recommendations to the case company based on these conclusions.
5.2 Recommendations to the case company
Based on the findings from the empirical study and earlier research, recommendations to the case
company are presented here. More precisely I’ll be making recommendations on how to
compensate employees to create more motivated and engaged work force in the case company.
As Indian IT employees have a tendency to change jobs fairly easily based on larger salaries, I
won’t suggest for the case company to competing with salaries. Monetary compensation and
salaries especially create only temporary compliance and engagement. The salaries should be at
adequate levels based on the job an employee does and aligned with the country average from
salary vendors. It must be remembered that Herzberg (1987) observed that salary increases don’t
have a reciprocal relationship to motivation and thus do not lead to motivation. Instead, Herzberg
(ibid) observed poor salaries tend to increase dissatisfaction.
The case company should focus their total rewarding specially to non-monetary, work and
personally related benefits. These benefits include for example work/life balance, personal

50
development, career possibilities, clear goals and responsibilities, equal opportunities and good
managers. From the listed factors, work/life balance seemed to be working very well in the case
company, but others should be developed even further to match the needs of the employees. This
should be done in emphasis of the desire commitment that an employee generates with the
organization.
Female employees, as a group compared to men, felt that the pay they received wasn’t
satisfactory. This should be checked against the salary data since female employees were a lot less
satisfied with their employment than men. As the tenure or age increased, for both males and
females the unhappiness with salary got bigger among case company employees. Perhaps this
should be checked against salary and benefits data whether the case company lacks the
appropriate levels of these two factors or is this more related to the work itself.
5.3 Suggestions for further research
This study could be easily implemented as a study of multiple case companies. This study only
represented one Western IT company and the perceptions their employees had toward total
rewarding, motivation and what type of commitment they create with the organization. By taking
more case companies, the research could be able to create more holistic view on the topics and
see how wide generalizations can be made of “Indian IT Employees”.
This study came to the same conclusion as Kwantes’ (2009) on her study of the type of
commitment Indian IT employees make with the organization. It can be safely confirmed that the
framework by Meyer and Allen (1991) can be used in Indian context to measure the three
commitment factors. It would be interesting to research whether the corporate culture creates a
difference in employee commitment. This could mean making a study on multiple companies both
Indian and Western in the IT sector. One could study their commitments alongside with overall
engagement to the company in hand. Another factor in this would be having multiple samples
from different cities around India.
Another standpoint could be taken to study motivation on a larger scale and researching it from
an employee’s viewpoint of the factors related to the work itself. Some of the factors could be for

51
example organization, management, job classification and demands or total rewarding. This way
the research could create a framework of employee motivation from what one could calculate the
weighted averages for how much a certain factor covers from total motivation.
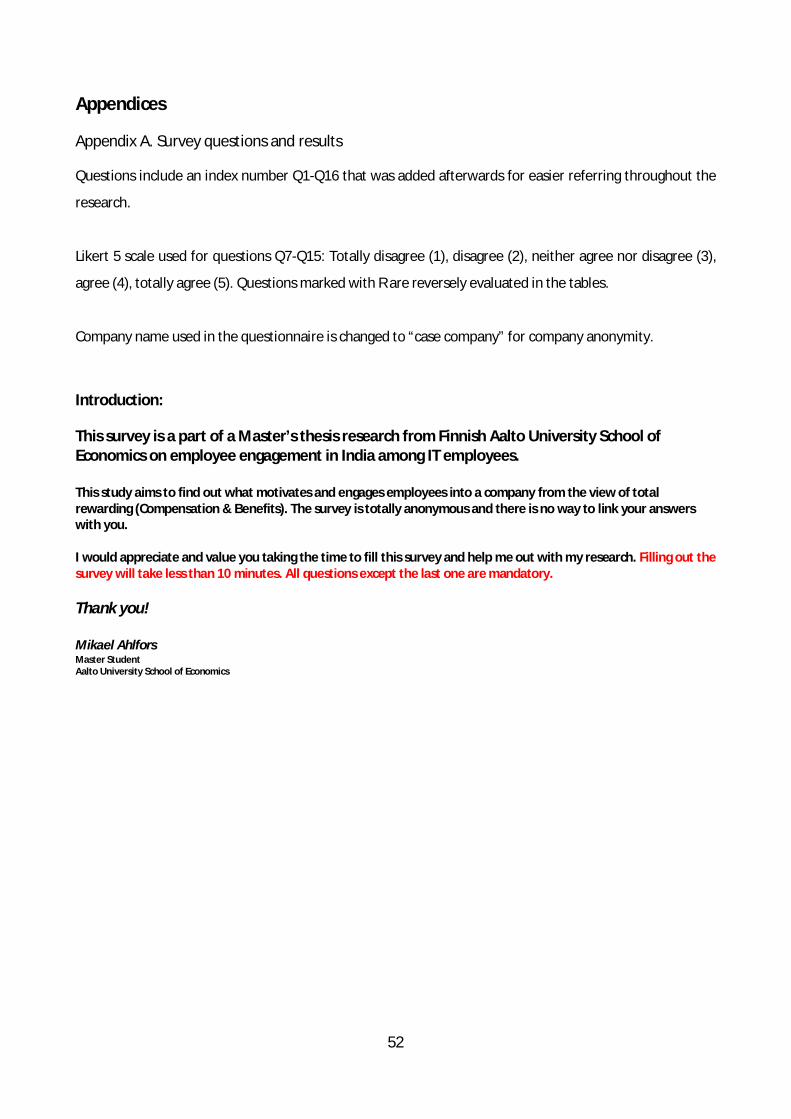
52
Appendices
Appendix A. Survey questions and results
Questions include an index number Q1-Q16 that was added afterwards for easier referring throughout the
research.
Likert 5 scale used for questions Q7-Q15: Totally disagree (1), disagree (2), neither agree nor disagree (3),
agree (4), totally agree (5). Questions marked with R are reversely evaluated in the tables.
Company name used in the questionnaire is changed to “case company” for company anonymity.
Introduction:
This survey is a part of a Master’s thesis research from Finnish Aalto University School of Economics on employee engagement in India among IT employees. This study aims to find out what motivates and engages employees into a company from the view of total rewarding (Compensation & Benefits). The survey is totally anonymous and there is no way to link your answers with you. I would appreciate and value you taking the time to fill this survey and help me out with my research. Filling out the survey will take less than 10 minutes. All questions except the last one are mandatory. Thank you! Mikael Ahlfors Master Student Aalto University School of Economics
53
Page 1: [Select] Q1 Please select your gender Male Female [Select] Q2 Please select your age group 20-24 25-29 30-34 35-39 40-44 45- [Select] Q3 Please select your career path Professional Manager [Select] Q4 I have worked for “case company” Less than 1 year 1-2 years 2-3 years 4 years or more [Select] Q5 Beside “case company”, how many employers you have had within IT sector None 1-2 companies 3-5 companies 6 or more companies Data collected from the control questions can be found from Table 1 on page 27.
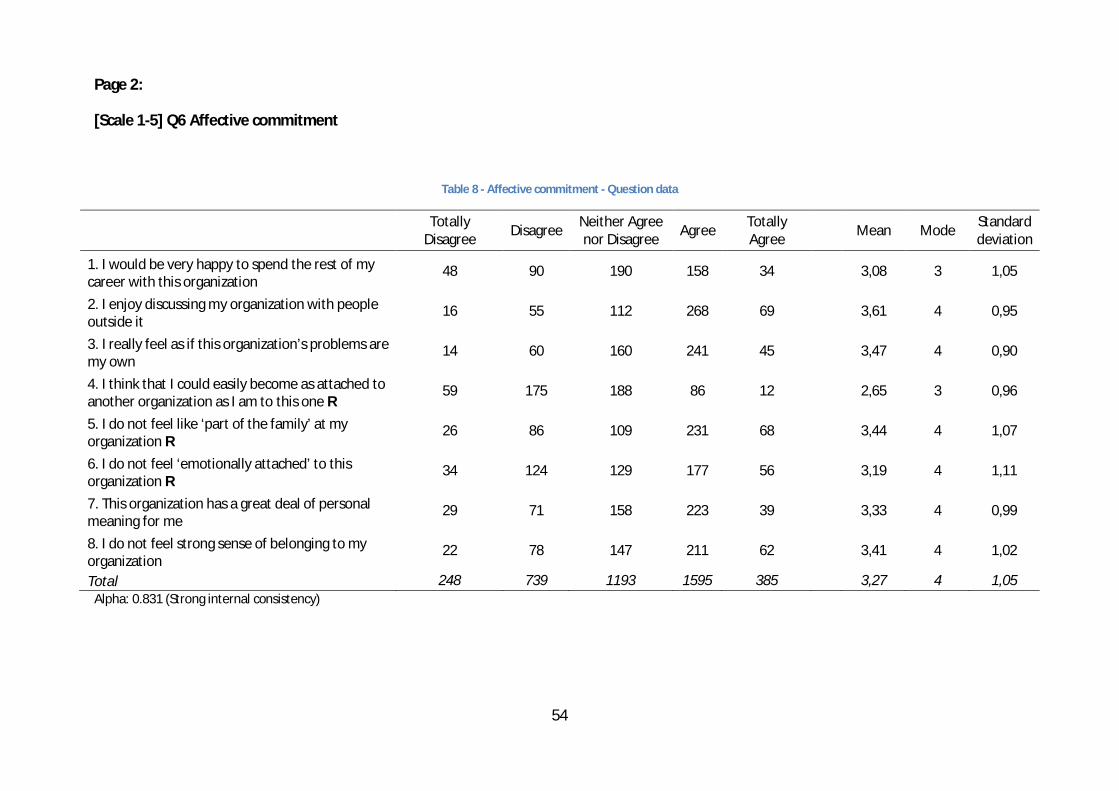
54
Page 2:
[Scale 1-5] Q6 Affective commitment
Table 8 - Affective commitment - Question data
Totally
Disagree Disagree Neither Agree nor Disagree Agree Totally
Agree Mean Mode Standard deviation
1. I would be very happy to spend the rest of my career with this organization
48 90 190 158 34
3,08 3 1,05
2. I enjoy discussing my organization with people outside it
16 55 112 268 69
3,61 4 0,95
3. I really feel as if this organization’s problems are my own
14 60 160 241 45
3,47 4 0,90
4. I think that I could easily become as attached to another organization as I am to this one R
59 175 188 86 12
2,65 3 0,96
5. I do not feel like ‘part of the family’ at my organization R
26 86 109 231 68
3,44 4 1,07
6. I do not feel ‘emotionally attached’ to this organization R
34 124 129 177 56
3,19 4 1,11
7. This organization has a great deal of personal meaning for me
29 71 158 223 39
3,33 4 0,99
8. I do not feel strong sense of belonging to my organization
22 78 147 211 62
3,41 4 1,02
Total 248 739 1193 1595 385 3,27 4 1,05 Alpha: 0.831 (Strong internal consistency)
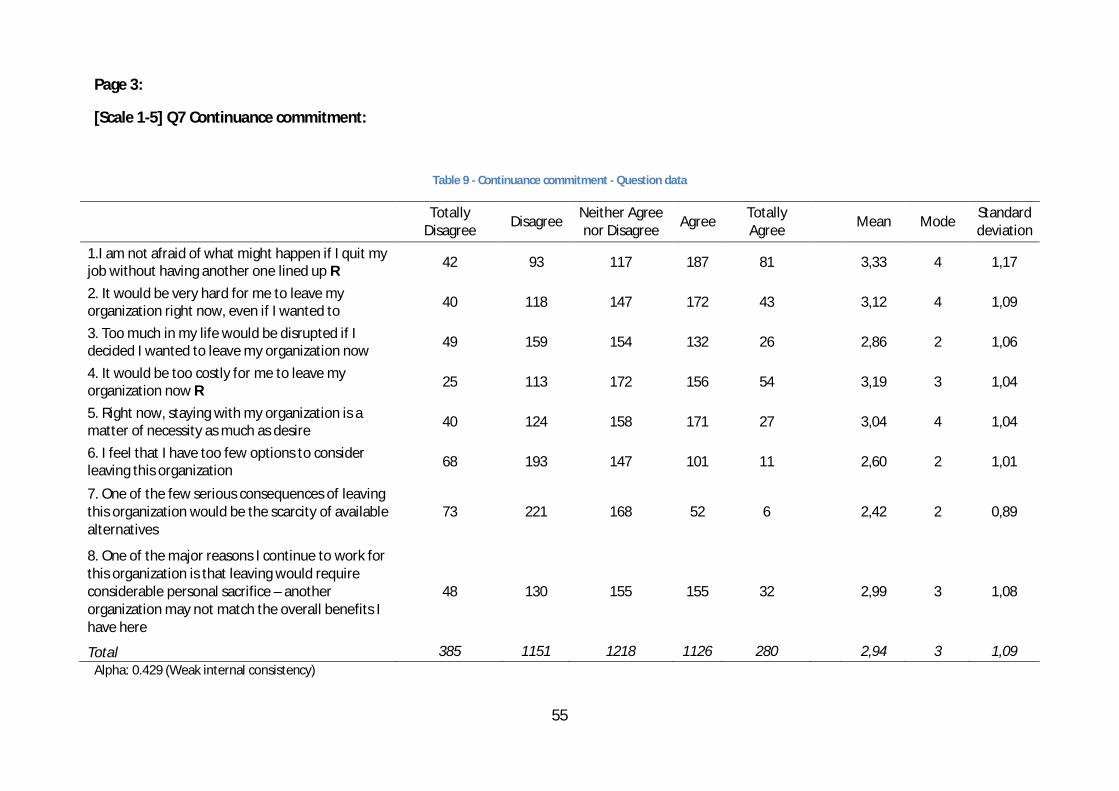
55
Page 3:
[Scale 1-5] Q7 Continuance commitment:
Table 9 - Continuance commitment - Question data
Totally
Disagree Disagree Neither Agree nor Disagree Agree Totally
Agree Mean Mode Standard deviation
1.I am not afraid of what might happen if I quit my job without having another one lined up R 42 93 117 187 81
3,33 4 1,17
2. It would be very hard for me to leave my organization right now, even if I wanted to 40 118 147 172 43
3,12 4 1,09
3. Too much in my life would be disrupted if I decided I wanted to leave my organization now 49 159 154 132 26
2,86 2 1,06
4. It would be too costly for me to leave my organization now R 25 113 172 156 54
3,19 3 1,04
5. Right now, staying with my organization is a matter of necessity as much as desire 40 124 158 171 27
3,04 4 1,04
6. I feel that I have too few options to consider leaving this organization 68 193 147 101 11
2,60 2 1,01
7. One of the few serious consequences of leaving this organization would be the scarcity of available alternatives
73 221 168 52 6
2,42 2 0,89
8. One of the major reasons I continue to work for this organization is that leaving would require considerable personal sacrifice – another organization may not match the overall benefits I have here
48 130 155 155 32
2,99 3 1,08
Total 385 1151 1218 1126 280 2,94 3 1,09 Alpha: 0.429 (Weak internal consistency)
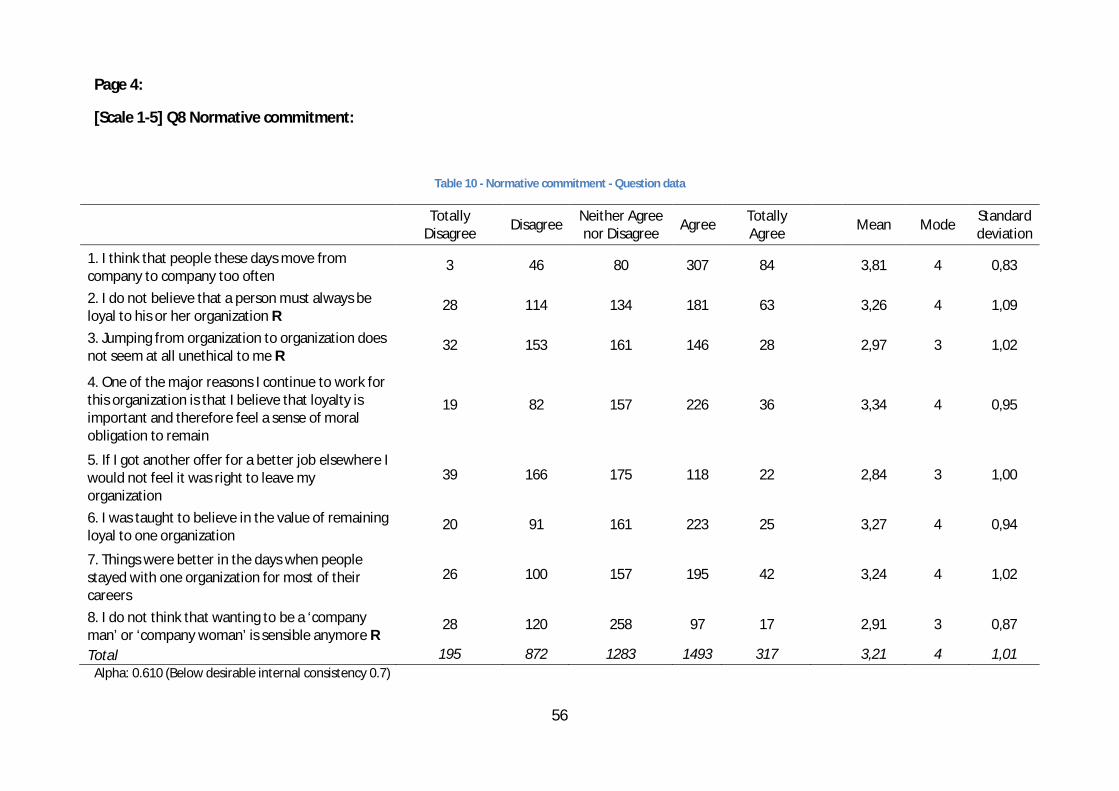
56
Page 4:
[Scale 1-5] Q8 Normative commitment:
Table 10 - Normative commitment - Question data
Totally
Disagree Disagree Neither Agree nor Disagree Agree Totally
Agree Mean Mode Standard deviation
1. I think that people these days move from company to company too often
3 46 80 307 84
3,81 4 0,83
2. I do not believe that a person must always be loyal to his or her organization R
28 114 134 181 63
3,26 4 1,09
3. Jumping from organization to organization does not seem at all unethical to me R
32 153 161 146 28
2,97 3 1,02
4. One of the major reasons I continue to work for this organization is that I believe that loyalty is important and therefore feel a sense of moral obligation to remain
19 82 157 226 36
3,34 4 0,95
5. If I got another offer for a better job elsewhere I would not feel it was right to leave my organization
39 166 175 118 22
2,84 3 1,00
6. I was taught to believe in the value of remaining loyal to one organization
20 91 161 223 25
3,27 4 0,94
7. Things were better in the days when people stayed with one organization for most of their careers
26 100 157 195 42
3,24 4 1,02
8. I do not think that wanting to be a ‘company man’ or ‘company woman’ is sensible anymore R
28 120 258 97 17
2,91 3 0,87
Total 195 872 1283 1493 317 3,21 4 1,01 Alpha: 0.610 (Below desirable internal consistency 0.7)
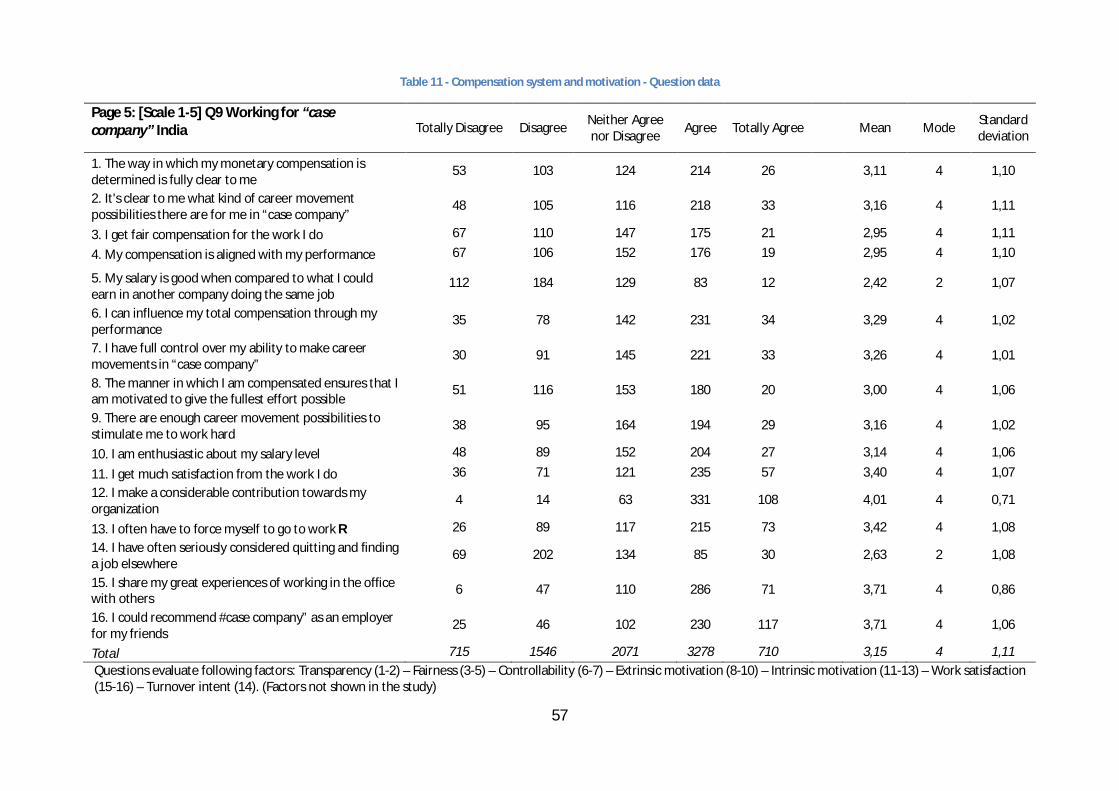
57
Table 11 - Compensation system and motivation - Question data
Page 5: [Scale 1-5] Q9 Working for “case company” India Totally Disagree Disagree Neither Agree
nor Disagree Agree Totally Agree Mean Mode Standard deviation
1. The way in which my monetary compensation is determined is fully clear to me
53 103 124 214 26 3,11 4 1,10
2. It's clear to me what kind of career movement possibilities there are for me in “case company”
48 105 116 218 33 3,16 4 1,11
3. I get fair compensation for the work I do 67 110 147 175 21 2,95 4 1,11
4. My compensation is aligned with my performance 67 106 152 176 19 2,95 4 1,10
5. My salary is good when compared to what I could earn in another company doing the same job
112 184 129 83 12 2,42 2 1,07
6. I can influence my total compensation through my performance
35 78 142 231 34 3,29 4 1,02
7. I have full control over my ability to make career movements in “case company”
30 91 145 221 33 3,26 4 1,01
8. The manner in which I am compensated ensures that I am motivated to give the fullest effort possible
51 116 153 180 20 3,00 4 1,06
9. There are enough career movement possibilities to stimulate me to work hard
38 95 164 194 29 3,16 4 1,02
10. I am enthusiastic about my salary level 48 89 152 204 27
3,14 4 1,06
11. I get much satisfaction from the work I do 36 71 121 235 57
3,40 4 1,07 12. I make a considerable contribution towards my organization
4 14 63 331 108
4,01 4 0,71
13. I often have to force myself to go to work R 26 89 117 215 73
3,42 4 1,08 14. I have often seriously considered quitting and finding a job elsewhere
69 202 134 85 30
2,63 2 1,08
15. I share my great experiences of working in the office with others
6 47 110 286 71
3,71 4 0,86
16. I could recommend #case company” as an employer for my friends
25 46 102 230 117
3,71 4 1,06
Total 715 1546 2071 3278 710 3,15 4 1,11 Questions evaluate following factors: Transparency (1-2) – Fairness (3-5) – Controllability (6-7) – Extrinsic motivation (8-10) – Intrinsic motivation (11-13) – Work satisfaction (15-16) – Turnover intent (14). (Factors not shown in the study)
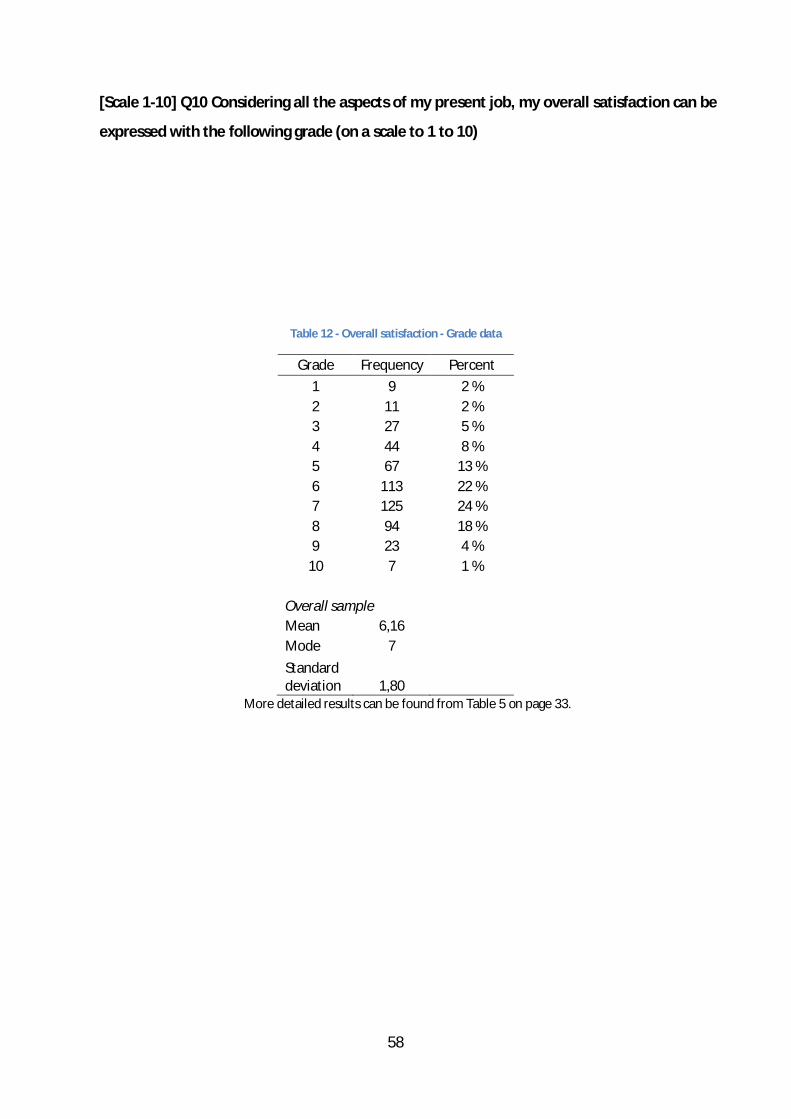
58
[Scale 1-10] Q10 Considering all the aspects of my present job, my overall satisfaction can be
expressed with the following grade (on a scale to 1 to 10)
Table 12 - Overall satisfaction - Grade data
Grade Frequency Percent 1 9 2 % 2 11 2 % 3 27 5 % 4 44 8 % 5 67 13 % 6 113 22 % 7 125 24 % 8 94 18 % 9 23 4 %
10 7 1 %
Overall sample Mean 6,16 Mode 7 Standard deviation 1,80
More detailed results can be found from Table 5 on page 33.
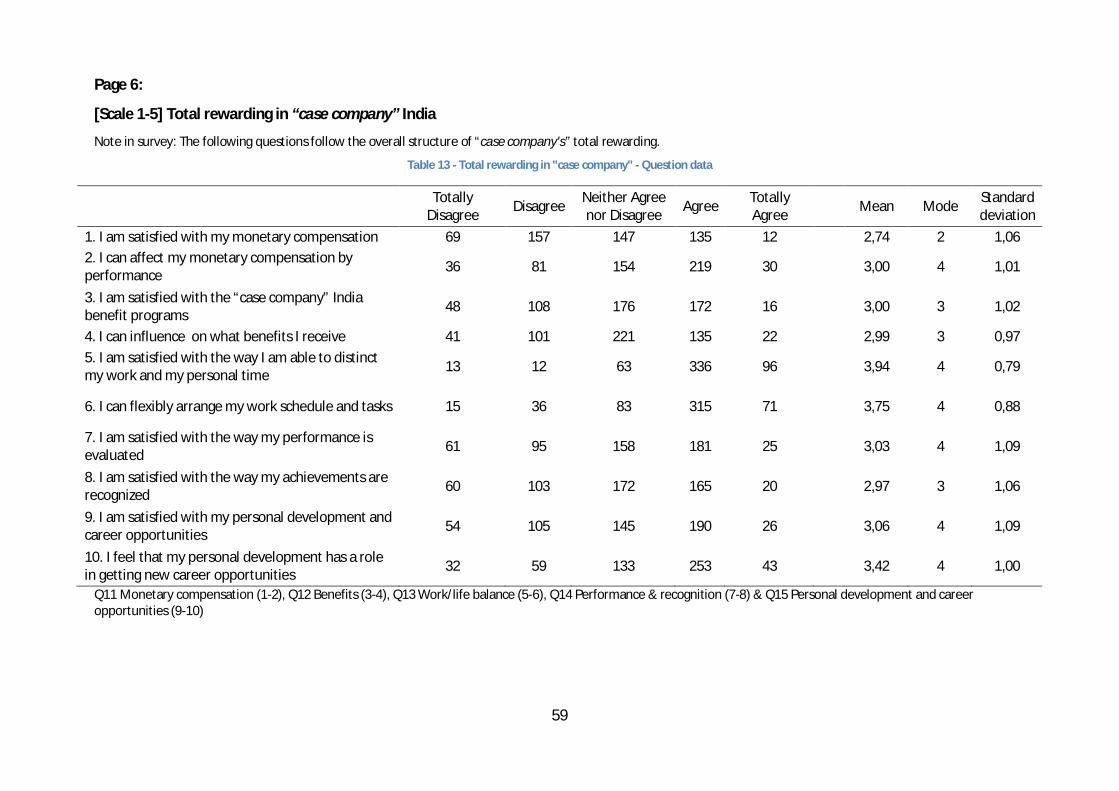
59
Page 6:
[Scale 1-5] Total rewarding in “case company” India
Note in survey: The following questions follow the overall structure of “case company's” total rewarding.
Table 13 - Total rewarding in "case company" - Question data
Totally
Disagree Disagree Neither Agree nor Disagree Agree Totally
Agree Mean Mode Standard deviation
1. I am satisfied with my monetary compensation 69 157 147 135 12
2,74 2 1,06 2. I can affect my monetary compensation by performance 36 81 154 219 30
3,00 4 1,01
3. I am satisfied with the “case company” India benefit programs 48 108 176 172 16
3,00 3 1,02
4. I can influence on what benefits I receive 41 101 221 135 22
2,99 3 0,97 5. I am satisfied with the way I am able to distinct my work and my personal time 13 12 63 336 96
3,94 4 0,79
6. I can flexibly arrange my work schedule and tasks 15 36 83 315 71
3,75 4 0,88
7. I am satisfied with the way my performance is evaluated 61 95 158 181 25
3,03 4 1,09
8. I am satisfied with the way my achievements are recognized 60 103 172 165 20
2,97 3 1,06
9. I am satisfied with my personal development and career opportunities 54 105 145 190 26
3,06 4 1,09
10. I feel that my personal development has a role in getting new career opportunities 32 59 133 253 43
3,42 4 1,00
Q11 Monetary compensation (1-2), Q12 Benefits (3-4), Q13 Work/life balance (5-6), Q14 Performance & recognition (7-8) & Q15 Personal development and career opportunities (9-10)

60
Page 7:
[Multi-select question] Q16 Choose five most important factors that you value in working for
“case company” India (Select max 5 items)
Table 14 - Value working for "case company" - Question data
Frequency Percentage of respondents Clear goals and responsibilities 222 43 % Equal opportunities 203 39 % Good managers 210 40 % Internal job rotation 146 28 % Medical insurance 99 19 % Other soft benefits 17 3 % Personal development 246 47 % Possible to influence on one's own work 92 18 % Retirement plan 5 1 % Salary (Overall CTC) 154 30 % Salary flexibility 84 16 % Short term incentives 40 8 % Tax friendly structure of salary 144 28 % Telephone/Broadband allowance 35 7 % Vacation benefit 89 17 % Work/life balance 437 84 %
Percentages are calculated against sample of 520 respondents. For example 84% of all respondents choose work/life balance as important factor.
Page 8:
[Open question] Any comments, recommendations or ideas that you have concerning Total
rewarding at “Case company” India can be expressed here. (Voluntary questions)
This open question was added to the survey by the request of country manager and is not part of
the study.
Page 9:
Thank you very much for taking the time and answering the survey. As soon as the survey data has been analyzed, I'll send a link where you can take a closer look at my findings. Sincerely Mikael Ahlfors

61
Appendix B. Email invitation to participate survey
SENT: April 5th, 2011 to 1343 case company employees in Pune, India TOPIC: [SURVEY] Employee Engagement in India: A Master’s Thesis Research BODY:Hi! My name is Mikael Ahlfors and I am doing my Master’s Thesis from Finnish Aalto University School of Economics on Employee Engagement in India among IT Employees. “Case company” has agreed to be part of my research by allowing me to collect material by executing a questionnaire to employees at “the case company” India. That is why you have received this invitation email. This study aims to find out what motivates and engages employees in India into a company from the view of total rewarding (Compensation & Benefits). I am also interested on what you, as an employee of Case company India, feel about your total rewarding. This email invitation has been sent to employees in Pune belonging to Professional and Managerial career paths. I would appreciate and value you taking the time to fill this survey and help me out with my research. The survey is totally anonymous and there is no way to link you with your answers. Filling out the survey will take less than 10 minutes. The deadline for answers is Tuesday April 19th.
CLICK HERE TO ANSWER THE SURVEY Or copy paste the link below to your browser https://www.webropol.com/P.aspx?id=533222&cid=125889423 After the data has been analyzed I will be making a summary of the findings available to you. In case of any questions feel free to contact me via information listed below or through Communicator. Thank you for participating! Sincerely Mikael Ahlfors Master Student Aalto University School of Economics [email protected] / [email protected] Mobile: +358 40 350 7808
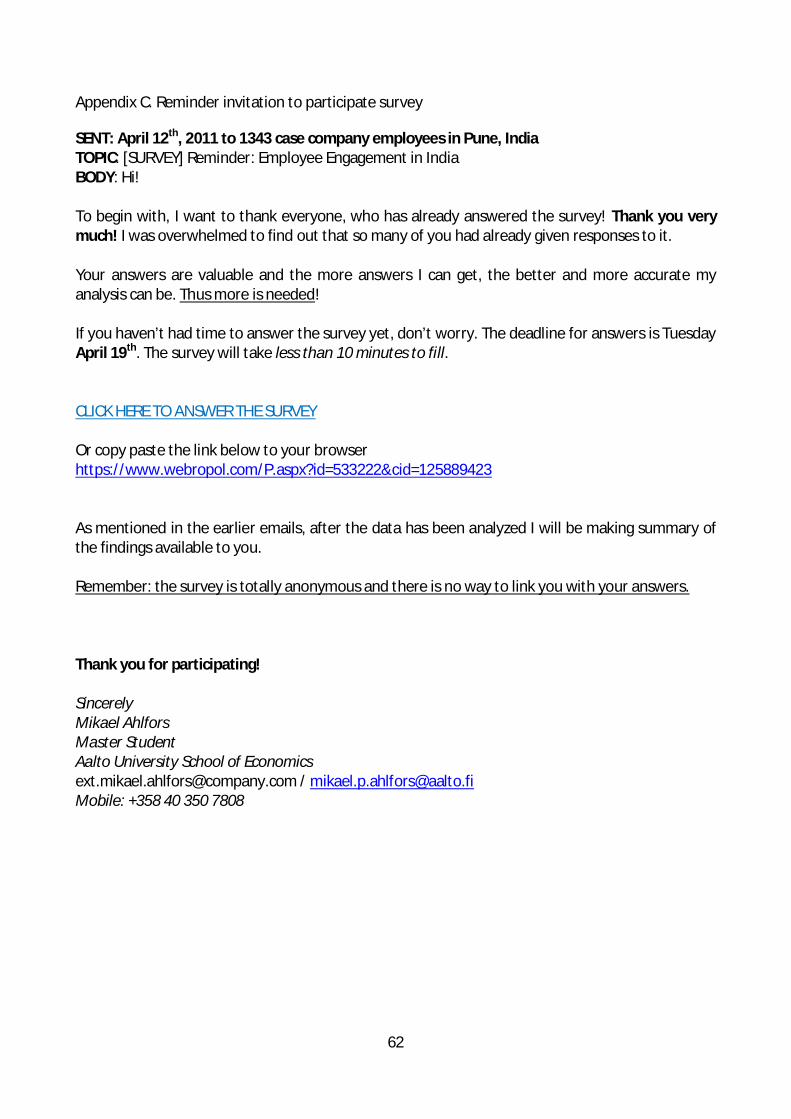
62
Appendix C. Reminder invitation to participate survey
SENT: April 12th, 2011 to 1343 case company employees in Pune, India TOPIC: [SURVEY] Reminder: Employee Engagement in India BODY: Hi! To begin with, I want to thank everyone, who has already answered the survey! Thank you very much! I was overwhelmed to find out that so many of you had already given responses to it. Your answers are valuable and the more answers I can get, the better and more accurate my analysis can be. Thus more is needed! If you haven’t had time to answer the survey yet, don’t worry. The deadline for answers is Tuesday April 19th. The survey will take less than 10 minutes to fill. CLICK HERE TO ANSWER THE SURVEY Or copy paste the link below to your browser https://www.webropol.com/P.aspx?id=533222&cid=125889423 As mentioned in the earlier emails, after the data has been analyzed I will be making summary of the findings available to you. Remember: the survey is totally anonymous and there is no way to link you with your answers. Thank you for participating! Sincerely Mikael Ahlfors Master Student Aalto University School of Economics [email protected] / [email protected] Mobile: +358 40 350 7808
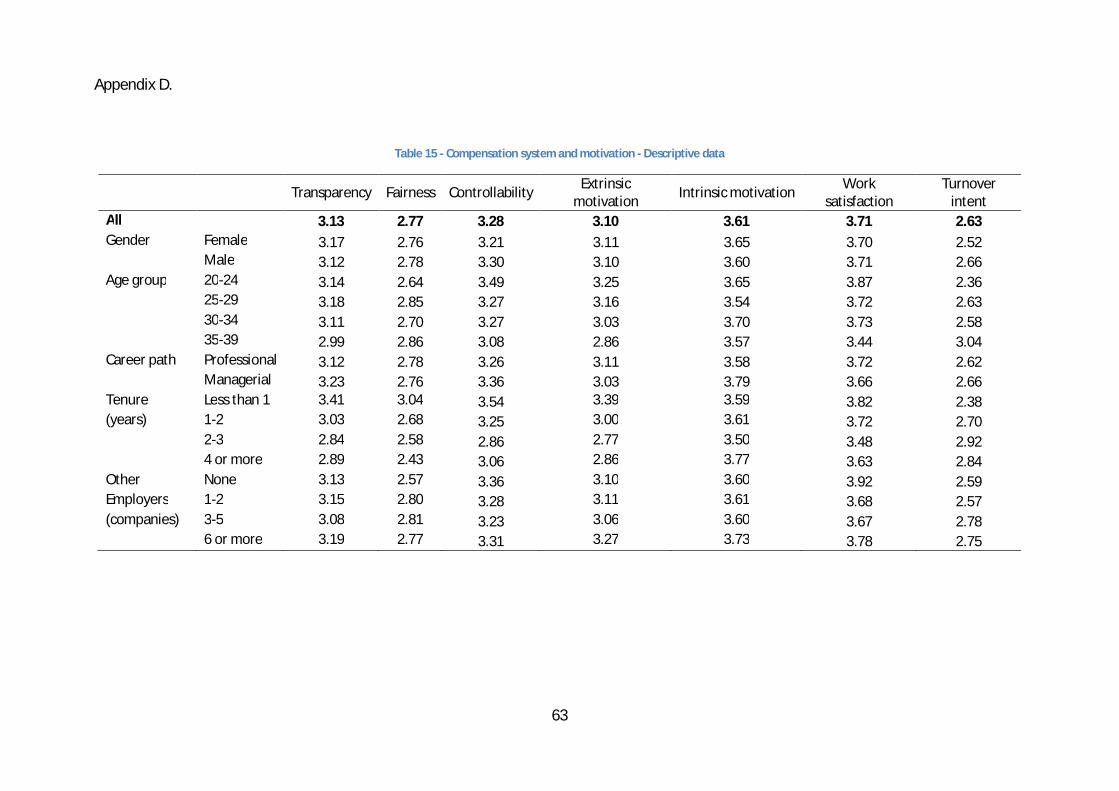
63
Appendix D.
Table 15 - Compensation system and motivation - Descriptive data
Transparency Fairness Controllability Extrinsic motivation Intrinsic motivation Work
satisfaction Turnover
intent All 3.13 2.77 3.28 3.10 3.61 3.71 2.63 Gender Female 3.17 2.76 3.21 3.11 3.65 3.70 2.52 Male 3.12 2.78 3.30 3.10 3.60 3.71 2.66 Age group 20-24 3.14 2.64 3.49 3.25 3.65 3.87 2.36 25-29 3.18 2.85 3.27 3.16 3.54 3.72 2.63 30-34 3.11 2.70 3.27 3.03 3.70 3.73 2.58 35-39 2.99 2.86 3.08 2.86 3.57 3.44 3.04 Career path Professional 3.12 2.78 3.26 3.11 3.58 3.72 2.62 Managerial 3.23 2.76 3.36 3.03 3.79 3.66 2.66 Tenure Less than 1 3.41 3.04 3.54 3.39 3.59 3.82 2.38 (years) 1-2 3.03 2.68 3.25 3.00 3.61 3.72 2.70 2-3 2.84 2.58 2.86 2.77 3.50 3.48 2.92 4 or more 2.89 2.43 3.06 2.86 3.77 3.63 2.84 Other None 3.13 2.57 3.36 3.10 3.60 3.92 2.59 Employers 1-2 3.15 2.80 3.28 3.11 3.61 3.68 2.57 (companies) 3-5 3.08 2.81 3.23 3.06 3.60 3.67 2.78 6 or more 3.19 2.77 3.31 3.27 3.73 3.78 2.75
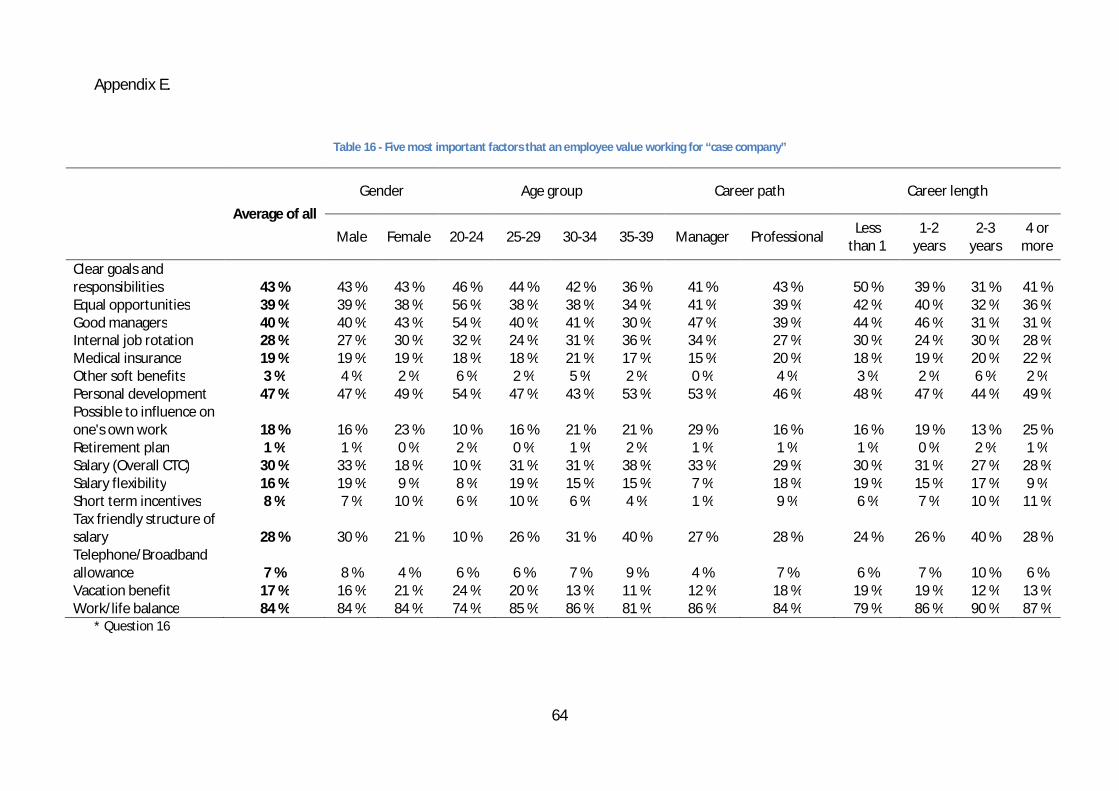
64
Appendix E.
Table 16 - Five most important factors that an employee value working for “case company”
Average of all
Gender Age group Career path Career length
Male Female 20-24 25-29 30-34 35-39 Manager Professional Less
than 1 1-2
years 2-3
years 4 or
more Clear goals and responsibilities 43 % 43 % 43 % 46 % 44 % 42 % 36 % 41 % 43 % 50 % 39 % 31 % 41 % Equal opportunities 39 % 39 % 38 % 56 % 38 % 38 % 34 % 41 % 39 % 42 % 40 % 32 % 36 % Good managers 40 % 40 % 43 % 54 % 40 % 41 % 30 % 47 % 39 % 44 % 46 % 31 % 31 % Internal job rotation 28 % 27 % 30 % 32 % 24 % 31 % 36 % 34 % 27 % 30 % 24 % 30 % 28 % Medical insurance 19 % 19 % 19 % 18 % 18 % 21 % 17 % 15 % 20 % 18 % 19 % 20 % 22 % Other soft benefits 3 % 4 % 2 % 6 % 2 % 5 % 2 % 0 % 4 % 3 % 2 % 6 % 2 % Personal development 47 % 47 % 49 % 54 % 47 % 43 % 53 % 53 % 46 % 48 % 47 % 44 % 49 % Possible to influence on one's own work 18 % 16 % 23 % 10 % 16 % 21 % 21 % 29 % 16 % 16 % 19 % 13 % 25 % Retirement plan 1 % 1 % 0 % 2 % 0 % 1 % 2 % 1 % 1 % 1 % 0 % 2 % 1 % Salary (Overall CTC) 30 % 33 % 18 % 10 % 31 % 31 % 38 % 33 % 29 % 30 % 31 % 27 % 28 % Salary flexibility 16 % 19 % 9 % 8 % 19 % 15 % 15 % 7 % 18 % 19 % 15 % 17 % 9 % Short term incentives 8 % 7 % 10 % 6 % 10 % 6 % 4 % 1 % 9 % 6 % 7 % 10 % 11 % Tax friendly structure of salary 28 % 30 % 21 % 10 % 26 % 31 % 40 % 27 % 28 % 24 % 26 % 40 % 28 % Telephone/Broadband allowance 7 % 8 % 4 % 6 % 6 % 7 % 9 % 4 % 7 % 6 % 7 % 10 % 6 % Vacation benefit 17 % 16 % 21 % 24 % 20 % 13 % 11 % 12 % 18 % 19 % 19 % 12 % 13 % Work/life balance 84 % 84 % 84 % 74 % 85 % 86 % 81 % 86 % 84 % 79 % 86 % 90 % 87 %
* Question 16
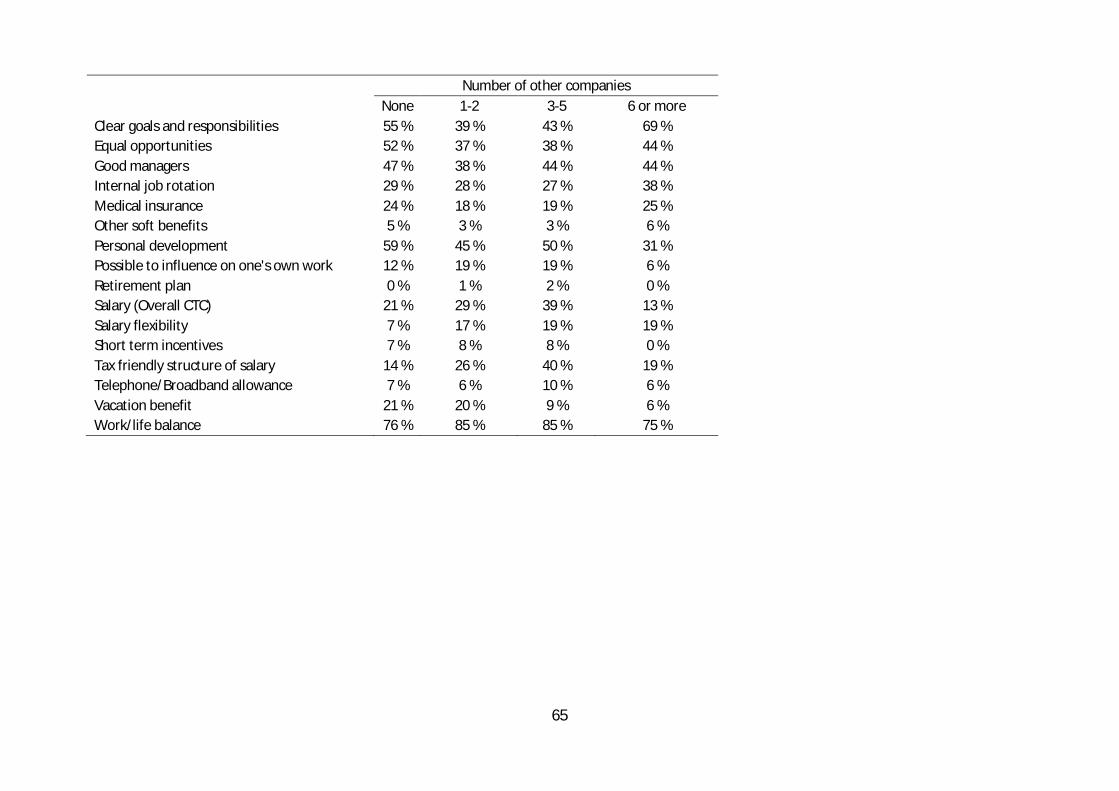
65
Number of other companies None 1-2 3-5 6 or more
Clear goals and responsibilities 55 % 39 % 43 % 69 % Equal opportunities 52 % 37 % 38 % 44 % Good managers 47 % 38 % 44 % 44 % Internal job rotation 29 % 28 % 27 % 38 % Medical insurance 24 % 18 % 19 % 25 % Other soft benefits 5 % 3 % 3 % 6 % Personal development 59 % 45 % 50 % 31 % Possible to influence on one's own work 12 % 19 % 19 % 6 % Retirement plan 0 % 1 % 2 % 0 % Salary (Overall CTC) 21 % 29 % 39 % 13 % Salary flexibility 7 % 17 % 19 % 19 % Short term incentives 7 % 8 % 8 % 0 % Tax friendly structure of salary 14 % 26 % 40 % 19 % Telephone/Broadband allowance 7 % 6 % 10 % 6 % Vacation benefit 21 % 20 % 9 % 6 % Work/life balance 76 % 85 % 85 % 75 %
66
References
WorldatWork. (n.d.). Retrieved April 11, 2011, from WorldAtWork The Total Rewards Association:
http://www.worldatwork.org/
Yin, R. K. (2009). Case Study Research, Design and Methods (4th Edition ed.). California: SAGE
Publications.
Van Herpen, M., Van Praag, M., & Cools, K. (2005). The effects of performance measurement and
compensation on motivation: An empirical study. De Economist , 303-329.
Allen, N. J., & Meyer, J. P. (1990). The measurement and antecedements of affective, continuance
and normative commitment to the organization. Journal of Occupational Psychology , 63 (1), 1-18.
Bairi, J., Manohar, M., & Goutam, K. (2011). Knowledge retention in the IT service industry. Journal
of Systems and Information Technology .
Bryman, A., & Bell, E. (2003). Business Research Methods. Oxford University Press.
Central Intelligence Agency. (2011, 03 08). South Asia :: India. Retrieved 03 16, 2011, from CIA -
The World Factbook: https://www.cia.gov/library/publications/the-world-
factbook/geos/countrytemplate_in.html
Christofferson, J., & King, B. (2006). The "IT" Factor - A New Total Rewards Model Leads the Way.
Workspan , 1-8.
Corporate Executive Board. (n.d.). Managing Compensation in India: A Reference Guide.
Hewitt Associates. (2005). Talent Challenges in India - A Performance & Rewards Perspective.
Herzberg, F. (1987). One More Time: How Do You Motivate Employees. Harvard Business Review ,
September-October, 6-16.
Kwantes, C. T. (2009). Culture, job satisfaction and organizational commitment in India and the
United States. Journal of Indian Business Research , 1 (4), 196-212.
Kohn, A. (1993). Why Incentive Plans Cannot Work. Harvard business review , 71 (5), 54-63.
NASSCOM. (n.d.). Knowledge Professionals in India.
Maslow, A. H. (1943). A Theory of human motivation. Psychological Review , 370-396.
Maslow, A. H. (1954). Motivation and Personality. New York: Harper & Row.
Markos, S., & Sridevi, S. (2010). Employee Engagement: The Key to Improving Performance.
International Journal of Business and Management , 5 (12), 89-96.
67
Meyer, J., & Allen, N. (1991). A three-component conceptualization of organizational commitment.
Human Resource Management Review , 1 (1), 61-89.
Perrin, T. (2003). Working Today: Understanding What Drives Employee Engagement. The 2003
Towers Perrin Talent Report. Retrieved March 3, 2011, from
http://www.towersperrin.com/tp/getwebcachedoc?webc=hrs/usa/2003/200309/talent_2003.pdf
Swaminathan, J., & Rajasekaran, D. (2010). Essential Components of Employee Engagement - A
Study with Reference to TNSTC, Kumbakonam. Advances in Management , 3 (12), 55-59.
Salmela-Aro, K., & Nurmi, J.-E. (2005). Mikä meitä motivoi? In M. Vartiainen, & J. Kauhanen,
Palkitseminen Globaalissa Suomessa (pp. 132-148). Helsinki: WSOY.
Singh, J. P. (2000). Managerial culture and work-related values in India. Organizational Studies , 11
(1), 75-101.
Sinha, J. P. (2000). Patterns of Work Culture: Cases and Strategies for Culture Building. New Delhi:
Sage.
Riski, S. (2005). Työnantaja globaaleilla markkinoilla - Palkkauksen ja palkitsemisen haasteet
Suomessa. In J. Kauhanen, & M. Vartiainen, Palkitseminen Globaalissa Suomessa (pp. 34-46).
Helsinki: WSOY.
Robinson, D., Perryman, S., & Hayday, S. (2004). The Drivers of Employee Engagement. UK:
Institute for Employment Studies.